Genedata Expressionist · Peptide Mapping Genedata Expressionist automates peptide mapping,...
4
Genedata Expressionist ® Experience another dimension in characterization of biotherapeutics Genedata Expressionist ® is a powerful software platform that revolutionizes the data processing, analysis, management, and reporting of biotherapeutics characterization studies based on mass spectrometry. Genedata Expressionist accelerates state-of-the-art characterization process- es from research to production, from high-throughput plate-based screening to deep characterization studies and quality control of production lots. Offering complete automation across instruments and labs, the software streamlines complex processes such as peptide mapping and intact protein mass, released glycan, and host cell protein analyses. With intuitive visualization, flexible reporting, and data and method management, Genedata Expressionist ensures reproducible high-quality results with significant time and cost savings.
Transcript of Genedata Expressionist · Peptide Mapping Genedata Expressionist automates peptide mapping,...
Genedata Expressionist®
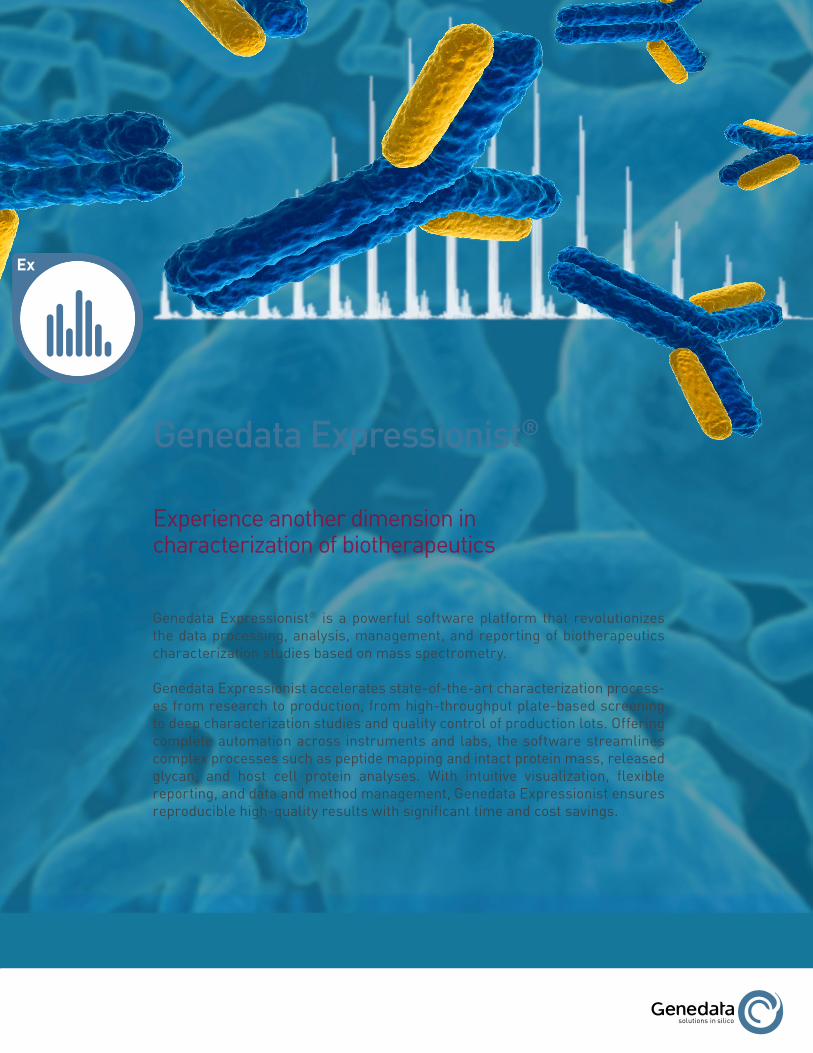
Experience another dimension in characterization of biotherapeutics
Genedata Expressionist® is a powerful software platform that revolutionizes the data processing, analysis, management, and reporting of biotherapeutics characterization studies based on mass spectrometry.
Genedata Expressionist accelerates state-of-the-art characterization process-es from research to production, from high-throughput plate-based screening to deep characterization studies and quality control of production lots. Offering complete automation across instruments and labs, the software streamlines complex processes such as peptide mapping and intact protein mass, released glycan, and host cell protein analyses. With intuitive visualization, flexible reporting, and data and method management, Genedata Expressionist ensures reproducible high-quality results with significant time and cost savings.
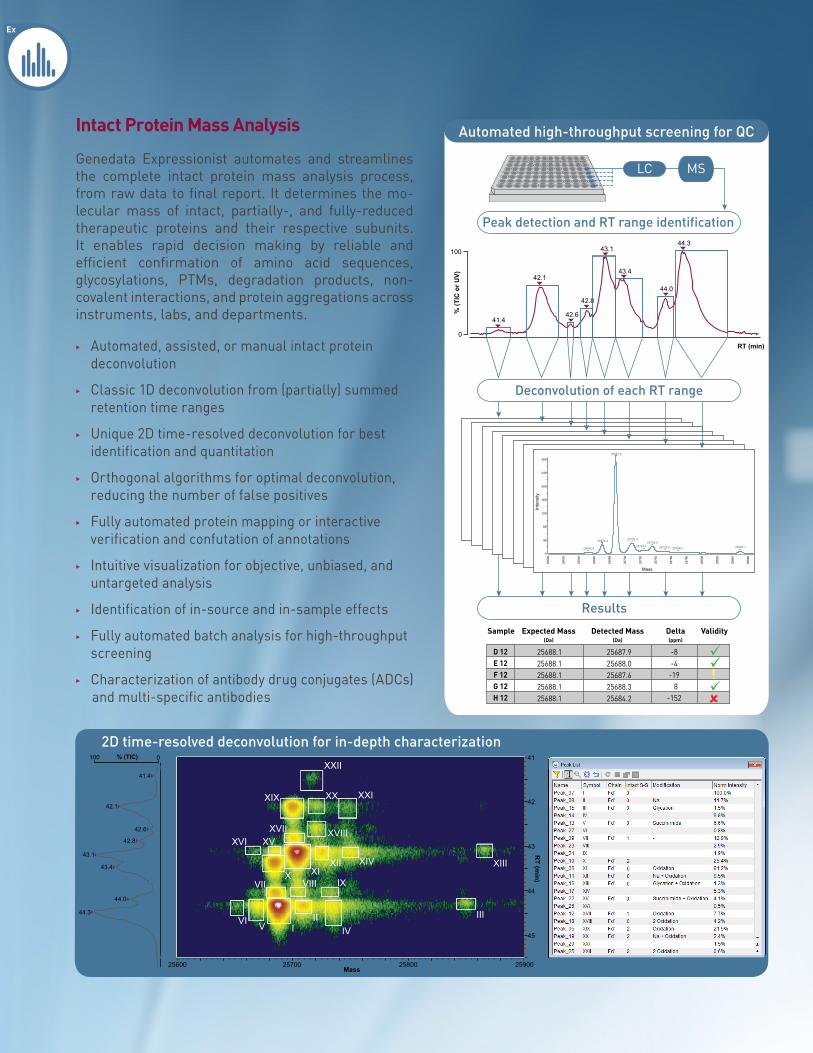
Intact Protein Mass Analysis
Genedata Expressionist automates and streamlines the complete intact protein mass analysis process, from raw data to final report. It determines the mo-lecular mass of intact, partially-, and fully-reduced therapeutic proteins and their respective subunits. It enables rapid decision making by reliable and efficient confirmation of amino acid sequences, glycosylations, PTMs, degradation products, non- covalent interactions, and protein aggregations across instruments, labs, and departments.
33 Automated, assisted, or manual intact protein deconvolution
33 Classic 1D deconvolution from (partially) summed retention time ranges
33 Unique 2D time-resolved deconvolution for best identification and quantitation
33 Orthogonal algorithms for optimal deconvolution, reducing the number of false positives
33 Fully automated protein mapping or interactive verification and confutation of annotations
33 Intuitive visualization for objective, unbiased, and untargeted analysis
33 Identification of in-source and in-sample effects
33 Fully automated batch analysis for high-throughput screening
33 Characterization of antibody drug conjugates (ADCs) and multi-specific antibodies
0
40
80
120
160
200
240
280
25687.9
25709.025670.4 25735.425724.7 25850.125752.625652.4 25768.2
2560
0
2562
0
2564
0
2566
0
2568
0
2570
0
2572
0
2574
0
2576
0
2578
0
2580
0
2582
0
2584
0
2586
0
2588
0
Mass
Inte
nsity
41.442.6
44.3
44.0
43.4
43.1
42.1
0
100
% (T
IC o
r UV)
RT (min)
Peak detection and RT range identification
!
Sample Expected Mass Detected Mass Delta Validity(Da) (ppm)(Da)
D 12E 12F 12G 12H 12
25688.1 25687.9
25688.125688.125688.125688.1
25684.225688.325687.625688.0
-8
-1528
-19-4
Results
42.8
Deconvolution of each RT range
LC MS
Automated high-throughput screening for QC
2D time-resolved deconvolution for in-depth characterization
42
45
44
43
25620 25660 25700 25740 25780 25820 25860 25900Mass
III III
IVVVI
VII VIII IXX XI
XII XIIIXIV
XVXVIXVII XVIII
XXIXXXIX
XXII
42
45
44
43
41
25700 25900Mass
2580025600
RT (m
in)
41.4
42.1
42.6
42.8
43.4
44.3
0100 % (TIC)
44.0
43.1
Biopharmaceutical Characterization
per Peptide
Load from File
Data Cleaning
RT Alignment
IsotopeClustering
Peak Detection
PeptideMapping
ExportPDF
ExportRTF
ExportExcel
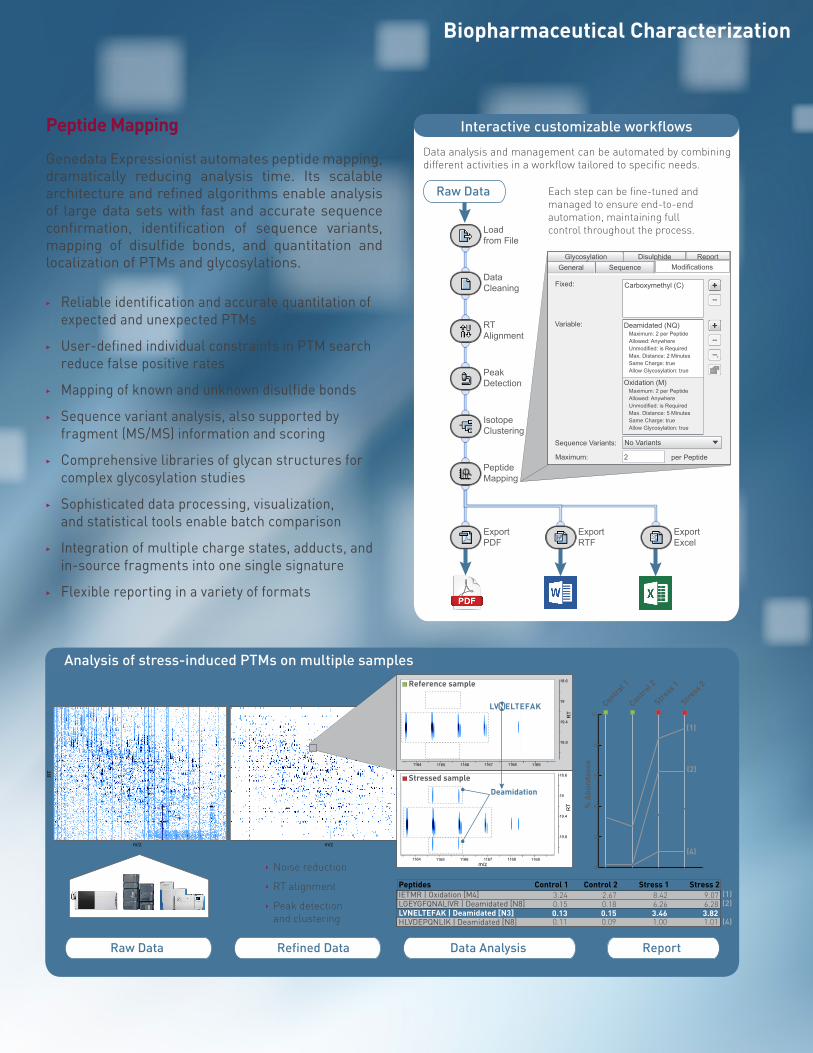
Data analysis and management can be automated by combining different activities in a workflow tailored to specific needs.
Raw Data Each step can be fine-tuned and managed to ensure end-to-end automation, maintaining full control throughout the process.
Carboxymethyl (C)
Maximum: 2 per PeptideAllowed: AnywhereUnmodified: is RequiredMax. Distance: 2 MinutesSame Charge: trueAllow Glycosylation: true
Deamidated (NQ)
Maximum: 2 per PeptideAllowed: AnywhereUnmodified: is RequiredMax. Distance: 5 MinutesSame Charge: trueAllow Glycosylation: true
Oxidation (M)
Variable:
Fixed:
Sequence Variants:
Maximum: 2
No Variants
SequenceGeneralDisulphide ReportGlycosylation
Modifications
Peptide Mapping
Genedata Expressionist automates peptide mapping, dramatically reducing analysis time. Its scalable architecture and refined algorithms enable analysis of large data sets with fast and accurate sequence confirmation, identification of sequence variants, mapping of disulfide bonds, and quantitation and localization of PTMs and glycosylations.
33 Reliable identification and accurate quantitation of expected and unexpected PTMs
33 User-defined individual constraints in PTM search reduce false positive rates
33 Mapping of known and unknown disulfide bonds
33 Sequence variant analysis, also supported by fragment (MS/MS) information and scoring
33 Comprehensive libraries of glycan structures for complex glycosylation studies
33 Sophisticated data processing, visualization, and statistical tools enable batch comparison
33 Integration of multiple charge states, adducts, and in-source fragments into one single signature
33 Flexible reporting in a variety of formats
Interactive customizable workflows
Analysis of stress-induced PTMs on multiple samples
(1)
(3)(2)
(4)
IETMR | Oxidation [M4]LGEYGFQNALIVR | Deamidated [N8]LVNELTEFAK | Deamidated [N3]HLVDEPQNLIK | Deamidated [N8]
3.24 2.67 8.42 9.07
0.11 0.09 1.00 1.010.13 0.15 3.46 3.820.15 0.18 6.26 6.28
Peptides Control 1 Control 2 Stress 1 Stress 2
Genedata Expressionist Refiner MS
Created by 'Dominik Mertens (dmertens)' on Aug 12, 2015 10:52:56 AM from workflow 'HCP example' using Genedata Expressionist Refiner MS, 9.1.
6
7
8
9
10
11
12
13
14
15
16
17
18
19
20
21
22
23
24
25
26
27
28
29
30
31
32
RT
200
250
300
350
400
450
500
550
600
650
700
750
800
850
900
950
1000
1050
1100
1150
1200
m/z1
2
5
10
20
50
100
200
500
103
2·103
5·103
104
2·104
5·104
105
2·105
5·105
106
2·106
5·106
107
2·107
5·107
108
Refined Data Data Analysis Report
Peak detectionand clustering
Noise reduction
RT alignment
m/z
Genedata Expressionist Refiner MS
Created by 'Andrea Amantonico (aamanton)' on 04-Aug-2015 15:58:02 from workflow 'Quantification of Protein Modifications' using Genedata Expressionist Refiner MS, 9.1.
BSA-S2_4hdig_110210_2
BSA-S2_4hdig_110210_1
BSA-S1_4hdig_110210_2
BSA-S1_4hdig_110210_1
BSA-R_4hdig_110210_2
BSA-R_4hdig_110210_1
Deamidation
LVNELTEFAK
18.6
19
19.8
19.4
18.6
19
19.8
19.4
1164 1168116711661165 1169m/z
RT
RT
1164 1168116711661165 1169
Control 1
% A
bund
ance
0
2
4
6
8
10
LVNELTEFAK Deamidated [N3]
Stress 1
Stress 2
Control 2Genedata Expressionist Refiner MS
Created by 'Dominik Mertens (dmertens)' on Aug 12, 2015 10:52:26 AM from workflow 'HCP example' using Genedata Expressionist Refiner MS, 9.1.
6
7
8
9
10
11
12
13
14
15
16
17
18
19
20
21
22
23
24
25
26
27
28
29
30
31
32
RT
200
250
300
350
400
450
500
550
600
650
700
750
800
850
900
950
1000
1050
1100
1150
1200
m/z1
2
5
10
20
50
100
200
500
103
2·103
5·103
104
2·104
5·104
105
2·105
5·105
106
2·106
5·106
107
2·107
5·107
108
RT
m/z
Raw Data
(1)
(2)
(4)
(3)
Reference sample
Stressed sample
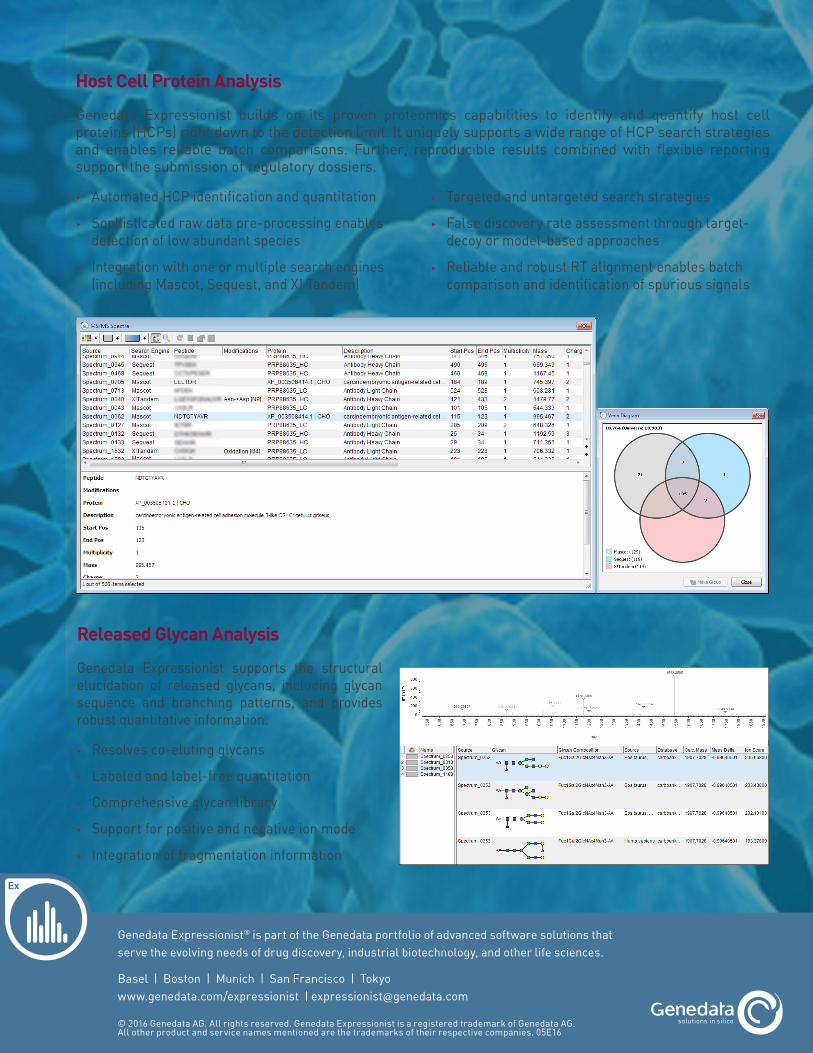
Host Cell Protein Analysis
Genedata Expressionist builds on its proven proteomics capabilities to identify and quantify host cell proteins (HCPs) right down to the detection limit. It uniquely supports a wide range of HCP search strategies and enables reliable batch comparisons. Further, reproducible results combined with flexible reporting support the submission of regulatory dossiers.
Released Glycan Analysis
Genedata Expressionist supports the structural elucidation of released glycans, including glycan sequence and branching patterns, and provides robust quantitative information.
33 Resolves co-eluting glycans
33 Labeled and label-free quantitation
33 Comprehensive glycan library
33 Support for positive and negative ion mode
33 Integration of fragmentation information
33 Targeted and untargeted search strategies
33 False discovery rate assessment through target-decoy or model-based approaches
33 Reliable and robust RT alignment enables batch comparison and identification of spurious signals
33 Automated HCP identification and quantitation
33 Sophisticated raw data pre-processing enables detection of low abundant species
33 Integration with one or multiple search engines (including Mascot, Sequest, and X! Tandem)
Genedata Expressionist® is part of the Genedata portfolio of advanced software solutions that serve the evolving needs of drug discovery, industrial biotechnology, and other life sciences.
Basel | Boston | Munich | San Francisco | Tokyowww.genedata.com/expressionist | [email protected]
© 2016 Genedata AG. All rights reserved. Genedata Expressionist is a registered trademark of Genedata AG. All other product and service names mentioned are the trademarks of their respective companies. 05E16