Gene function prediction based on genomic context clustering and discriminative learning: an...
9
BioMed Central Page 1 of 9 (page number not for citation purposes) BMC Bioinformatics Open Access Proceedings Gene function prediction based on genomic context clustering and discriminative learning: an application to bacteriophages Jason Li 1 , Saman K Halgamuge 1 , Christopher I Kells 1 and Sen-Lin Tang* 2 Address: 1 Dynamic Systems & Control Group, DoMME, University of Melbourne, Melbourne, Australia and 2 Research Center for Biodiversity, Academia Sinica, Taipei, Taiwan Email: Jason Li - [email protected]; Saman K Halgamuge - [email protected]; Christopher I Kells - [email protected]; Sen- Lin Tang* - [email protected] * Corresponding author Abstract Background: Existing methods for whole-genome comparisons require prior knowledge of related species and provide little automation in the function prediction process. Bacteriophage genomes are an example that cannot be easily analyzed by these methods. This work addresses these shortcomings and aims to provide an automated prediction system of gene function. Results: We have developed a novel system called SynFPS to perform gene function prediction over completed genomes. The prediction system is initialized by clustering a large collection of weakly related genomes into groups based on their resemblance in gene distribution. From each individual group, data are then extracted and used to train a Support Vector Machine that makes gene function predictions. Experiments were conducted with 9 different gene functions over 296 bacteriophage genomes. Cross validation results gave an average prediction accuracy of ~80%, which is comparable to other genomic-context based prediction methods. Functional predictions are also made on 3 uncharacterized genes and 12 genes that cannot be identified by sequence alignment. The software is publicly available at http://www.synteny.net/ . Conclusion: The proposed system employs genomic context to predict gene function and detect gene correspondence in whole-genome comparisons. Although our experimental focus is on bacteriophages, the method may be extended to other microbial genomes as they share a number of similar characteristics with phage genomes such as gene order conservation. Background The increasing number of completely sequenced genomes has enabled gene function predictions by means of whole genome comparison. Existing methods such as Syn- Browse [1], Vista [2], LAGAN [3], PipMaker [4] and Ensembl SyntenyView [5] provide visualization of con- served regions between two or more genome sequences for comparative analysis. Such visualization facilitates the prediction of gene function based on comparison of from The Second Automated Function Prediction Meeting La Jolla, CA, USA. 30 August – 1 September 2006 Published: 22 May 2007 BMC Bioinformatics 2007, 8(Suppl 4):S6 doi:10.1186/1471-2105-8-S4-S6 <supplement> <title> <p>The Second Automated Function Prediction Meeting</p> </title> <editor>Ana PC Rodrigues, Barry J Grant, Adam Godzik and Iddo Friedberg</editor> <note>Proceedings</note> <url>http://www.biomedcentral.com/content/pdf/1471-2105-8-S4-info.pdf</url> </supplement> This article is available from: http://www.biomedcentral.com/1471-2105/8/S4/S6 © 2007 Li et al; licensee BioMed Central Ltd. This is an open access article distributed under the terms of the Creative Commons Attribution License (http://creativecommons.org/licenses/by/2.0 ), which permits unrestricted use, distribution, and reproduction in any medium, provided the original work is properly cited.
Transcript of Gene function prediction based on genomic context clustering and discriminative learning: an...

BioMed CentralBMC Bioinformatics
ss
Open AcceProceedingsGene function prediction based on genomic context clustering and discriminative learning: an application to bacteriophagesJason Li1, Saman K Halgamuge1, Christopher I Kells1 and Sen-Lin Tang*2Address: 1Dynamic Systems & Control Group, DoMME, University of Melbourne, Melbourne, Australia and 2Research Center for Biodiversity, Academia Sinica, Taipei, Taiwan
Email: Jason Li - [email protected]; Saman K Halgamuge - [email protected]; Christopher I Kells - [email protected]; Sen-Lin Tang* - [email protected]
* Corresponding author
AbstractBackground: Existing methods for whole-genome comparisons require prior knowledge ofrelated species and provide little automation in the function prediction process. Bacteriophagegenomes are an example that cannot be easily analyzed by these methods. This work addressesthese shortcomings and aims to provide an automated prediction system of gene function.
Results: We have developed a novel system called SynFPS to perform gene function predictionover completed genomes. The prediction system is initialized by clustering a large collection ofweakly related genomes into groups based on their resemblance in gene distribution. From eachindividual group, data are then extracted and used to train a Support Vector Machine that makesgene function predictions. Experiments were conducted with 9 different gene functions over 296bacteriophage genomes. Cross validation results gave an average prediction accuracy of ~80%,which is comparable to other genomic-context based prediction methods. Functional predictionsare also made on 3 uncharacterized genes and 12 genes that cannot be identified by sequencealignment. The software is publicly available at http://www.synteny.net/.
Conclusion: The proposed system employs genomic context to predict gene function and detectgene correspondence in whole-genome comparisons. Although our experimental focus is onbacteriophages, the method may be extended to other microbial genomes as they share a numberof similar characteristics with phage genomes such as gene order conservation.
BackgroundThe increasing number of completely sequenced genomeshas enabled gene function predictions by means of wholegenome comparison. Existing methods such as Syn-Browse [1], Vista [2], LAGAN [3], PipMaker [4] and
Ensembl SyntenyView [5] provide visualization of con-served regions between two or more genome sequencesfor comparative analysis. Such visualization facilitates theprediction of gene function based on comparison of
from The Second Automated Function Prediction MeetingLa Jolla, CA, USA. 30 August – 1 September 2006
Published: 22 May 2007
BMC Bioinformatics 2007, 8(Suppl 4):S6 doi:10.1186/1471-2105-8-S4-S6
<supplement> <title> <p>The Second Automated Function Prediction Meeting</p> </title> <editor>Ana PC Rodrigues, Barry J Grant, Adam Godzik and Iddo Friedberg</editor> <note>Proceedings</note> <url>http://www.biomedcentral.com/content/pdf/1471-2105-8-S4-info.pdf</url> </supplement>
This article is available from: http://www.biomedcentral.com/1471-2105/8/S4/S6
© 2007 Li et al; licensee BioMed Central Ltd. This is an open access article distributed under the terms of the Creative Commons Attribution License (http://creativecommons.org/licenses/by/2.0), which permits unrestricted use, distribution, and reproduction in any medium, provided the original work is properly cited.
Page 1 of 9(page number not for citation purposes)

BMC Bioinformatics 2007, 8(Suppl 4):S6 http://www.biomedcentral.com/1471-2105/8/S4/S6
genomic context information such as co-occurrence ofgenes [6,7] and conservation of gene order [8,9].
However, these methods have two major limitations.First, they rely on sequence alignment to identify corre-sponding genes or regions between genomes [1-5,10-12].Consequently, they cannot automatically detect homolo-gous or functionally similar genes that share no sequencesimilarity, resulting in a need for manual prediction forthose genes. Second, these methods require the genomesbeing compared to be closely related. This hinders thepossibility of automatically analyzing a large collection ofweakly related genomes and makes it impossible toinspect a genome to which related species have not beenidentified.
Bacteriophage genomes are one example that suffers fromthe above limitations. Firstly, sequence alignment basedmethods are not fully reliable in detecting functionallysimilar genes within phages. This is because homologousphage genes have often diverged beyond the recognitionof sequence similarity [13-15]. A key argument to explainsuch divergence was that the genes have a very distantcommon ancestry [15]. Secondly, requiring to compareonly a few related phages and to ignore the remainder canhinder the genomic analysis of the target phage. The rea-son is that the global phage relationships are not clearlydefined phylogenetically due to an extensive amount ofhorizontal gene transfers (HGT) [14,16], implying thatrelatedness between phages often cannot be established.Consequently, it is desirable to have an objective measureto automatically identify closely related genomes basedon the genetic data, as opposed to depending on the userto define a set of "related species".
This work addresses the shortcomings of the existingmethods and aims to provide a highly automated genefunction prediction system based on whole-genome com-parison. The system, named SynFPS, contains two auto-mated learning units with distinct roles: a clusteringtechnique that utilizes gene-to-gene distances to identifyclosely related genomes and a Support Vector Machine(SVM) for discriminative classification on gene functions.The algorithm of SynFPS and the results of function pre-diction on phage genes will be presented in the remainderof this paper.
Results and discussionEvaluation of prediction results by leave-one-out cross validationWe have attempted to perform predictions over nine com-mon phage genes using SynFPS. These are major head,major tail, tape measure, prohead protease, integrase, ter-minase, portal, holin and lysin genes. They were selectedon the basis of regular existence – they encode necessary
functions not provided by their hosts, including structuraland assembly genes, as well as lysis genes [16]. Thesegenes were searched against the annotation databaseusing regular expression patterns defined in Table 1. Man-ual modifications of the search results have been con-ducted to remove ambiguous entries.
Table 2 indicates the amount of genes that can be detectedif sequence alignment (BLAST) alone was used. The K-Means clustering result based on these genes can be foundin Supplementary Material (see Additional file 1).
We perform leave-one-out (LOO) cross validation to eval-uate the prediction performances for these genes. For eachgene function, we run the cross validation in each clusterindividually over a discrete range of values of the kernelparameter – σ for Gaussian RBF kernel [17]. The σ valuethat gives the best accuracy is chosen and is used for allfuture predictions for that function. The prediction accu-racies shown in Table 3 are the averages of cross validationresults across all the clusters.
K-fold cross validation may also be used to evaluate theprediction performances and it is expected that accuraciesare lower with a smaller K value. For instance, the predic-tion accuracy for Terminase is 79.8% for K = 4 and 62.3%for K = 2. However, LOO is more suited to our overall pur-pose – one primary objective of the cross validation is tofind out the near optimal σ value for the gene class to per-form future predictions. Since most clusters contain onlya very small portion of genomes that require genuine pre-diction, they are best simulated by LOO, where only onegenome is taken out for prediction testing at a time.
The prediction accuracies are averaged at ~80%. The100% prediction accuracy of lysin can be explained by thestrong context relationship between lysin and holin. Sincethe presence of a lysin is always accompanied by the pres-ence of a holin immediately beside it [18], SynFPS caneasily identify the lysin gene if it already knows the posi-tion of the holin. However, the converse is not true: theidentification of holin genes may not depend upon thepresence of lysin. Consequently, the prediction accuracyfor holin is not as high.
These prediction accuracies reflect the sensitivity of thesystem (true positives/(true positives + false negatives)).The specificity of the system (true negatives/(true nega-tives + false positives)) on the other hand is always largerthe sensitivity because of two system features. Firstly, weallow only a single positive prediction for each genome(see Methods). Thus, the number of false negatives isalways the same as the number of false positives, implyingthat the specificities always scale together with the sensi-tivities. Secondly, the number of negative training data
Page 2 of 9(page number not for citation purposes)

BMC Bioinformatics 2007, 8(Suppl 4):S6 http://www.biomedcentral.com/1471-2105/8/S4/S6
(hence true negatives) is always larger than the number ofpositive training data (hence true positives), and conse-quently Specificity > Sensitivity. One reason for usingLOO cross validation accuracies to evaluate the system isthe lack of benchmark for our problem. However, it maybe noteworthy that other genomic-context based methodsfor the prediction of functional elements have similarreported accuracies ranging from 72% to 80% [6].
Trade-off between prediction coverage and prediction accuracyWe have examined the effect of the K-Means adaptivethreshold t on the prediction accuracies. The value of t ∈(0,1] implicitly specifies the maximum tolerable distancebetween any two genomes within a cluster. As a result, ast → 0, there are as many clusters as the number ofgenomes, and as t → 1, there is only one cluster. Both ofthese cases do not provide useful information for predic-tion. Since there is no analytical method to find out agood value for t, we have run SynFPS over a range of val-ues from t = 0.05 to t = 0.3. Values outside this range gen-erate either too many or too few clusters (average numberof genomes per cluster < 2 or number of clusters < 3respectively). Using different t values lead to a differentamount of genomes that are covered by the automated
prediction (a.k.a. prediction coverage). Genomes withinthe "coverage" are those for which SynFPS has made aclassification decision; the remaining genomes are dis-carded or ignored by SynFPS. Here are examples ofgenomes not in coverage:
• genomes not containing the gene being predicted (dis-carded during cross validation only)
• genomes that is in a cluster on their own
• within a cluster, if there are fewer than two genomes thatcontain the gene being predicted, then all the genomes arediscarded
• genomes with genomic context different to the consen-sus of the group may be discarded
Figure 3 shows the plot of prediction accuracies versusprediction coverage. The highest coverage values for allgene functions are about 20–25%, achieved by using a tvalue ~0.1. The results indicate that we can obtain a higheraccuracy by lowering the coverage. However, the ultimatepurpose of the system is to make genuine predictions overthe genomes that lack identification of the genes being
Table 2: Percentage of genes detected using sequence alignment.
Reference Genome Terminase Portal Head Tail Tape measure Prohead protease Lysin Holin Integrase
E-value cutoff 0.01 0.1 0.01 0.1 0.01 0.1 0.01 0.1 0.01 0.1 0.01 0.1 0.01 0.1 0.01 0.1 0.01 0.1
Bacteriophage bIL285 31 37 33 50 - - 4 19 - - 46 49 16 18 11 23 57 64Lactococcus phage TP901-1 8 22 13 19 12 27 7 22 96 98 - - 30 48 13 13 3 15Enterobacteria phage HK97 29 40 35 43 4 26 12 19 83 96 54 64 0 4 5 24 54 73Bacteriophage phi LC3 19 42 9 25 14 24 4 25 63 83 - - 36 48 13 14 58 65Staphylococcus aureus phage phi 13 12 25 40 56 9 19 - - 77 94 36 38 - - 13 26 62 71
The percentages are calculated by dividing the number of significantly similar sequences by the total number of sequences found by using regular expression. Sequence similarity is determined by BLAST (bl2seq) [33] using BLOSUM45 with indicated E-value cutoffs. Each sequence is "blasted" against its corresponding gene in the reference genome. The best cases are highlighted in bold.
Table 1: Regular expression patterns used for the nine selected genes.
Gene Search pattern
Major head (?<!minor)\b(head|capsid)\bMajor tail (?<!minor)\btail\bTerminase (large subunit) terminase|\bterL\bHolin \bholin\bLysin \blysin\bTape measure \btape\b|minor tailIntegrase integrasePortal protein \bportal\bProhead protease prohead AND protease†
† Not a direct regular expression; "Prohead" and "protease" were searched separately and the results were combined using the AND operation provided by SynFPS.
These patterns were matched against the CDS annotations of the phages retrieved from GenBank. Note that the search results were then refined via manual inspection. \w – alphanumeric character; \b – word boundary; | – 'or'; * – zero or more of the preceding character.
Page 3 of 9(page number not for citation purposes)
BMC Bioinformatics 2007, 8(Suppl 4):S6 http://www.biomedcentral.com/1471-2105/8/S4/S6
predicted. Lowering the coverage can lead to ignorance ofmany of these genomes. Consequently, one must find abalance between the accuracy and the coverage accordingto the intended task.
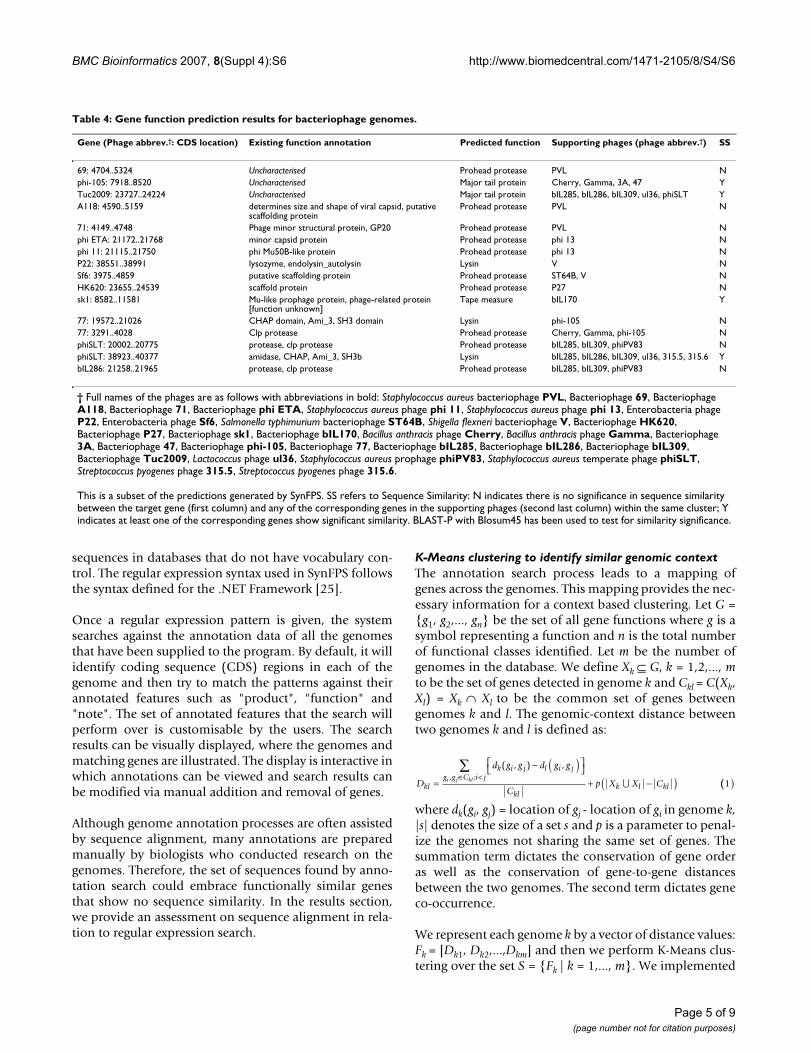
Functions predicted to 3 uncharacterised genes and 12 sequence dissimilar genesUsing the maximum coverage and the σ values optimizedby LOO cross validation, we have generated predictionsover genomes within which certain gene functions werenot already detected. The outcome of SynFPS is to identifywhich genes within those genomes correspond to thefunctions of our interest. The prediction outcomes arelisted in Table 4.
Three genes that we have predicted functions for have noexisting functional annotation in the database (markeduncharacterised in Table 4). Seven genes in Table 4 exhibitsequence similarity to their reference genes, suggestingthat their predicted functions are supported by bothsequence similarity and the genomic context informationembedded in our system, such as gene order conservationand positional coupling. For other genes that show nosequence similarity (a total of 12 of them in Table 4), thepredicted functions are only evident by the genomic con-text. It is noteworthy that sequence alignment basedmethods would have failed in finding correspondences tothese genes. Other prediction results have complementedexisting annotations in the database in cases where theydo exist, and therefore support the validity of ourapproach.
ConclusionWe presented a novel genomic-context based methodcapable of predicting gene functions from a large collec-tion of genomes. An adaptive K-Means clustering is usedto distinguish groups of related genomes based on theconservation of gene order and the conservation of gene-to-gene distances. The clustering results serve as a plat-form for the SVM to extract training data to perform clas-sification based predictions. Nine common genefunctions of bacteriophages were tested and the LOOcross-validated prediction results are averaged at 80%.Functional predictions are also made on 3 uncharacter-
ized genes and 12 genes that cannot be identified bysequence alignment.
Although our experimental focus is on bacteriophages,the method may be extended to other microbial genomes.For example, bacterial genomes have been observed withconserved gene order [8,19,20] and conserved gene-to-gene distances (positional coupling) [21,22]. These prop-erties satisfy the underlying assumptions of our approachand suggest potential application of the method.
MethodsStrategy overview – SynFPSWe present a novel method called Synteny-based Func-tion Prediction System (SynFPS) capable of predictinggene functions among completed genomes based on theconservation of gene order (synteny) and the conserva-tion of gene-to-gene distance. An overview of SynFPS isshown in Figure 1. The genome annotation database asshown in the figure defines the scope of analysis for thesystem. In our work, it consists of 296 phage genomesretrieved from GenBank (see Additional file 1).
SynFPS runs on Windows and is publicly available. It wasdeveloped in C# and requires the free Microsoft .NETFramework 2.0 to run. Bioperl 1.4 [23] is needed for dataretrieval from public databases. Workstations with a sin-gle CPU of ~3.0 GHz and 1 GB of RAM are sufficient forreasonable performance over a collection of ~300 phages.
Identification of functionally similar genes using regular expressionThe system begins by identifying in the database a collec-tion of genes that correspond to a set of user-specifiedgene functions. Instead of using sequence similarity as inmany other methods [1,2,4,5,12], SynFPS identifies func-tionally similar genes using regular expressions [24]. Forexample, to search for genes that encode the major headproteins of phages, one possible regular expression pat-tern is "(?<!minor)\b(head|capsid) protein". With thispattern, we are including genes that have been annotatedwith "head protein" or "capsid protein" except those withthe prefix term "minor". The use of regular expression isaimed at tackling annotation discrepancies among coding
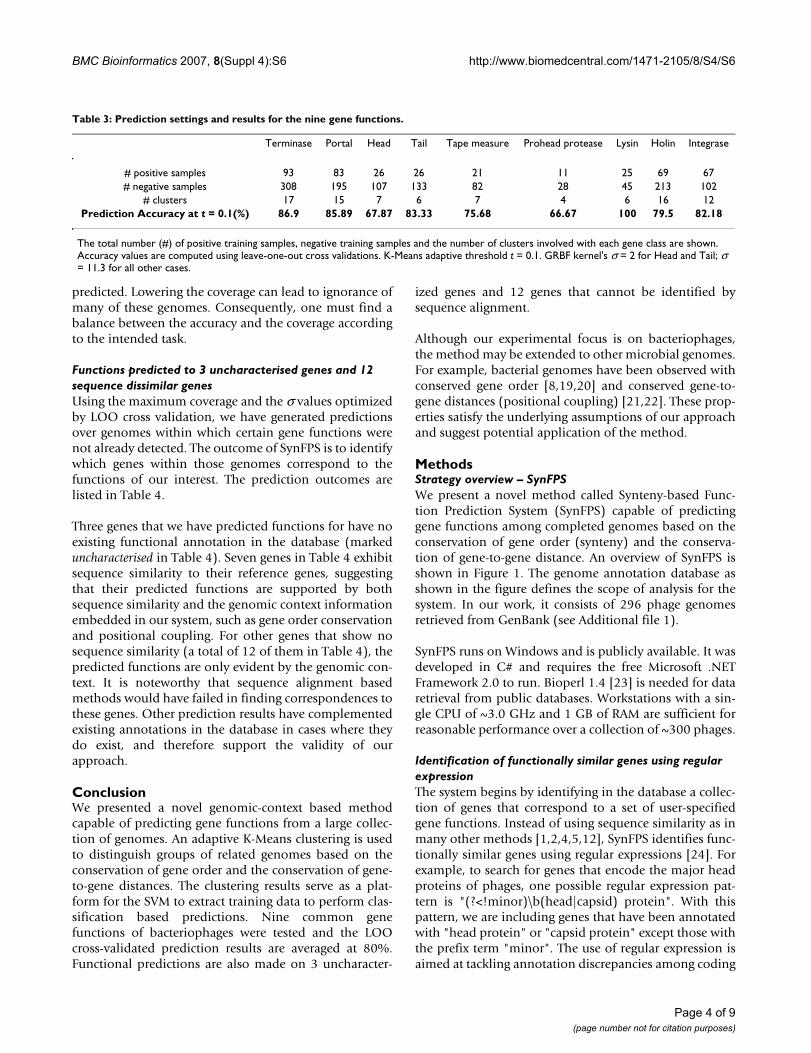
Table 3: Prediction settings and results for the nine gene functions.
Terminase Portal Head Tail Tape measure Prohead protease Lysin Holin Integrase
# positive samples 93 83 26 26 21 11 25 69 67# negative samples 308 195 107 133 82 28 45 213 102
# clusters 17 15 7 6 7 4 6 16 12Prediction Accuracy at t = 0.1(%) 86.9 85.89 67.87 83.33 75.68 66.67 100 79.5 82.18
The total number (#) of positive training samples, negative training samples and the number of clusters involved with each gene class are shown. Accuracy values are computed using leave-one-out cross validations. K-Means adaptive threshold t = 0.1. GRBF kernel's σ = 2 for Head and Tail; σ = 11.3 for all other cases.
Page 4 of 9(page number not for citation purposes)
BMC Bioinformatics 2007, 8(Suppl 4):S6 http://www.biomedcentral.com/1471-2105/8/S4/S6
sequences in databases that do not have vocabulary con-trol. The regular expression syntax used in SynFPS followsthe syntax defined for the .NET Framework [25].
Once a regular expression pattern is given, the systemsearches against the annotation data of all the genomesthat have been supplied to the program. By default, it willidentify coding sequence (CDS) regions in each of thegenome and then try to match the patterns against theirannotated features such as "product", "function" and"note". The set of annotated features that the search willperform over is customisable by the users. The searchresults can be visually displayed, where the genomes andmatching genes are illustrated. The display is interactive inwhich annotations can be viewed and search results canbe modified via manual addition and removal of genes.
Although genome annotation processes are often assistedby sequence alignment, many annotations are preparedmanually by biologists who conducted research on thegenomes. Therefore, the set of sequences found by anno-tation search could embrace functionally similar genesthat show no sequence similarity. In the results section,we provide an assessment on sequence alignment in rela-tion to regular expression search.
K-Means clustering to identify similar genomic contextThe annotation search process leads to a mapping ofgenes across the genomes. This mapping provides the nec-essary information for a context based clustering. Let G ={g1, g2,..., gn} be the set of all gene functions where g is asymbol representing a function and n is the total numberof functional classes identified. Let m be the number ofgenomes in the database. We define Xk ⊆ G, k = 1,2,..., mto be the set of genes detected in genome k and Ckl = C(Xk,Xl) = Xk ∩ Xl to be the common set of genes betweengenomes k and l. The genomic-context distance betweentwo genomes k and l is defined as:
where dk(gi, gj) = location of gj - location of gi in genome k,|s| denotes the size of a set s and p is a parameter to penal-ize the genomes not sharing the same set of genes. Thesummation term dictates the conservation of gene orderas well as the conservation of gene-to-gene distancesbetween the two genomes. The second term dictates geneco-occurrence.
We represent each genome k by a vector of distance values:Fk = [Dk1, Dk2,...,Dkm] and then we perform K-Means clus-tering over the set S = {Fk | k = 1,..., m}. We implemented
D
d g g d g g
Cp X X Ckl
k i j l i jg g C i j
klk l kl
i j kl=
− ( )⎡⎣
⎤⎦
+ −( )∈ <∑ ( , ) ,
, ;∪ 1(( )
Table 4: Gene function prediction results for bacteriophage genomes.
Gene (Phage abbrev.†: CDS location) Existing function annotation Predicted function Supporting phages (phage abbrev.†) SS
69: 4704..5324 Uncharacterised Prohead protease PVL Nphi-105: 7918..8520 Uncharacterised Major tail protein Cherry, Gamma, 3A, 47 YTuc2009: 23727..24224 Uncharacterised Major tail protein bIL285, bIL286, bIL309, ul36, phiSLT YA118: 4590..5159 determines size and shape of viral capsid, putative
scaffolding proteinProhead protease PVL N
71: 4149..4748 Phage minor structural protein, GP20 Prohead protease PVL Nphi ETA: 21172..21768 minor capsid protein Prohead protease phi 13 Nphi 11: 21115..21750 phi Mu50B-like protein Prohead protease phi 13 NP22: 38551..38991 lysozyme, endolysin_autolysin Lysin V NSf6: 3975..4859 putative scaffolding protein Prohead protease ST64B, V NHK620: 23655..24539 scaffold protein Prohead protease P27 Nsk1: 8582..11581 Mu-like prophage protein, phage-related protein
[function unknown]Tape measure bIL170 Y
77: 19572..21026 CHAP domain, Ami_3, SH3 domain Lysin phi-105 N77: 3291..4028 Clp protease Prohead protease Cherry, Gamma, phi-105 NphiSLT: 20002..20775 protease, clp protease Prohead protease bIL285, bIL309, phiPV83 NphiSLT: 38923..40377 amidase, CHAP, Ami_3, SH3b Lysin bIL285, bIL286, bIL309, ul36, 315.5, 315.6 YbIL286: 21258..21965 protease, clp protease Prohead protease bIL285, bIL309, phiPV83 N
† Full names of the phages are as follows with abbreviations in bold: Staphylococcus aureus bacteriophage PVL, Bacteriophage 69, Bacteriophage A118, Bacteriophage 71, Bacteriophage phi ETA, Staphylococcus aureus phage phi 11, Staphylococcus aureus phage phi 13, Enterobacteria phage P22, Enterobacteria phage Sf6, Salmonella typhimurium bacteriophage ST64B, Shigella flexneri bacteriophage V, Bacteriophage HK620, Bacteriophage P27, Bacteriophage sk1, Bacteriophage bIL170, Bacillus anthracis phage Cherry, Bacillus anthracis phage Gamma, Bacteriophage 3A, Bacteriophage 47, Bacteriophage phi-105, Bacteriophage 77, Bacteriophage bIL285, Bacteriophage bIL286, Bacteriophage bIL309, Bacteriophage Tuc2009, Lactococcus phage ul36, Staphylococcus aureus prophage phiPV83, Staphylococcus aureus temperate phage phiSLT, Streptococcus pyogenes phage 315.5, Streptococcus pyogenes phage 315.6.
This is a subset of the predictions generated by SynFPS. SS refers to Sequence Similarity: N indicates there is no significance in sequence similarity between the target gene (first column) and any of the corresponding genes in the supporting phages (second last column) within the same cluster; Y indicates at least one of the corresponding genes show significant similarity. BLAST-P with Blosum45 has been used to test for similarity significance.
Page 5 of 9(page number not for citation purposes)
BMC Bioinformatics 2007, 8(Suppl 4):S6 http://www.biomedcentral.com/1471-2105/8/S4/S6
an adaptive technique such that the number of clustersgrows incrementally until the size of the largest cluster issmaller than a specified threshold. The threshold t ∈ (0,1]
describes the fractional size of the Euclidean spacespanned by S. Each resulting cluster contains genomeswith high resemblance in gene distribution. Alternative
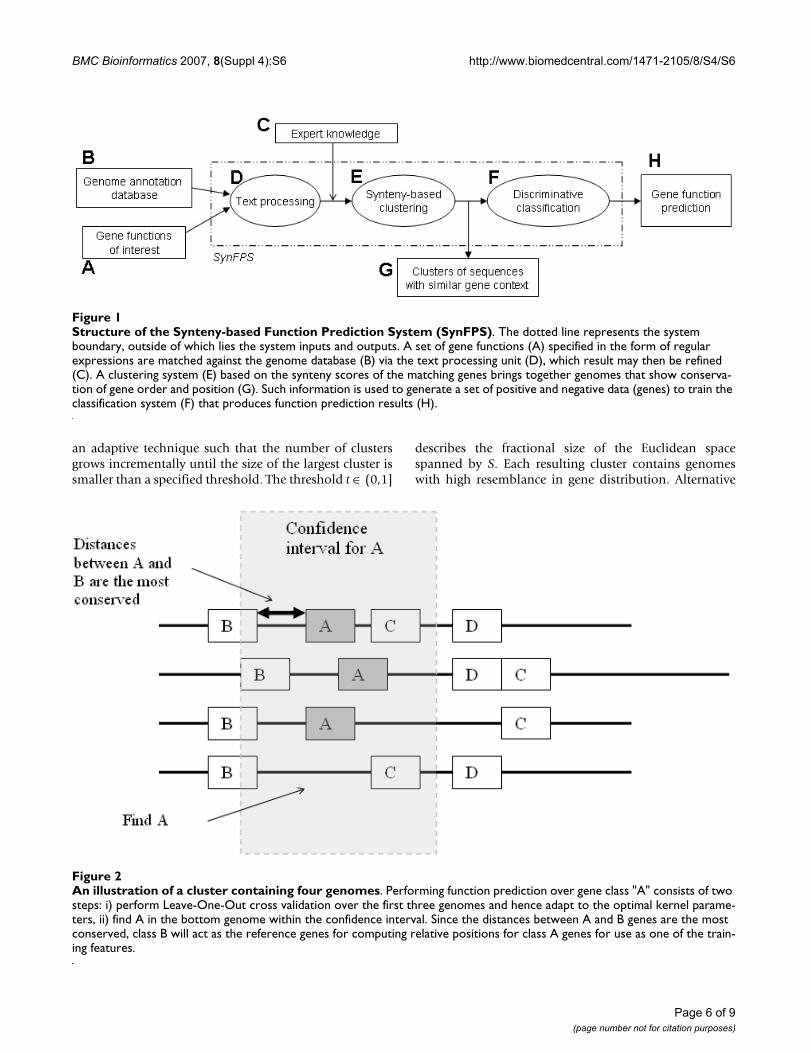
An illustration of a cluster containing four genomesFigure 2An illustration of a cluster containing four genomes. Performing function prediction over gene class "A" consists of two steps: i) perform Leave-One-Out cross validation over the first three genomes and hence adapt to the optimal kernel parame-ters, ii) find A in the bottom genome within the confidence interval. Since the distances between A and B genes are the most conserved, class B will act as the reference genes for computing relative positions for class A genes for use as one of the train-ing features.
Structure of the Synteny-based Function Prediction System (SynFPS)Figure 1Structure of the Synteny-based Function Prediction System (SynFPS). The dotted line represents the system boundary, outside of which lies the system inputs and outputs. A set of gene functions (A) specified in the form of regular expressions are matched against the genome database (B) via the text processing unit (D), which result may then be refined (C). A clustering system (E) based on the synteny scores of the matching genes brings together genomes that show conserva-tion of gene order and position (G). Such information is used to generate a set of positive and negative data (genes) to train the classification system (F) that produces function prediction results (H).
Page 6 of 9(page number not for citation purposes)

BMC Bioinformatics 2007, 8(Suppl 4):S6 http://www.biomedcentral.com/1471-2105/8/S4/S6
adaptive clustering methods include dynamic self-organ-izing maps [26,27].
Support Vector Machines for function predictionThe clusters of genomes are analysed separately and indi-vidually in the last stage of the system. For each cluster, weuse the information of the previously identified genes topredict the functions of other genes that exhibit similarcontext. This is achieved by extracting a set of genes fromthe cluster and converting them into positive and negativetraining data for a discriminative classification. Positivedata are formed by the group of genes previously identi-fied by the system during the match of regular expressionplus any manually added genes, with each gene functionrepresenting one class. Negative data comprise the genesthat are neighbours to the positive genes. The size ofneighbourhood is determined by the statistics of the genelocations in that particular cluster. We use 99% confi-dence interval on the gene locations of each class to deter-
mine the range in which neighbour genes are to beincluded. This interval also determines the set of candi-date genes on which function predictions are performed(see Figure 2). The discriminative classification is carriedout by a Support Vector Machine (SVM) [28], which hasbeen reported with superior results in a variety of biolog-ical applications [29-31]. For each gene function, the SVMproduces a binary result on each candidate gene indicat-ing whether or not the gene belongs to that function class.Since the number of gene functions is specified by the userand is not likely to cover every possible function, only asubset of the candidate genes – those with positive results– will eventually be assigned with predicted functions.
To enhance prediction accuracy, we force a unique posi-tive prediction in every genome within a cluster. This isbased on an assumption that all pairs of genomes withina cluster would have a one-to-one mapping of genes (genecorrespondence). The decision values generated by SVM
A plot of cross-validated prediction accuracy versus prediction coverage of the genomes in the database (296)Figure 3A plot of cross-validated prediction accuracy versus prediction coverage of the genomes in the database (296). Prediction coverage indicates the percentage amount of genomes that have been included to perform the leave-one-out cross validations using SynFPS. The maximum coverage of each gene function is limited by the number of its existences detected in the database. The coverage is varied using different adaptive threshold for the K-Means clustering.
Page 7 of 9(page number not for citation purposes)

BMC Bioinformatics 2007, 8(Suppl 4):S6 http://www.biomedcentral.com/1471-2105/8/S4/S6
depict the relative positiveness of each candidate gene.Consequently, the gene with the strongest decision valuewill be chosen as the positive prediction.
In order to apply SVM, each gene is converted into anumeric vector capturing the following features: composi-tion, normalized van der Waals volume, hydrophobicity,polarity [30,32], pairwise similarity scores against othergenes in the database [29], relative position and gene size.To compute the "relative position", the system first findsthe gene class which has the most conserved distance tothe gene under current prediction. For example, as dem-onstrated in Figure 2, if we are making predictions overclass A, then class B will be chosen as the reference forcomputing the relative positions because the distancesbetween class B genes and class A genes are the most con-served. The relative position of a gene in class A is thencomputed as the distance between itself and the class Bgene in the corresponding genome.
The pairwise similarity scores have been observed toimprove classification accuracies. These scores representthe distance between a gene and every other gene in thedatabase [29]. However, it should be emphasized thatwhile these sequence similarity scores enhance thestrength of the feature vectors, the system does not relyupon similarity significances to detect gene correspond-ence.
Availability and requirementsProject name: SynFPS
Project website: http://www.synteny.net/
Operating system: Microsoft Windows family
Other requirements: Microsoft .NET Framework 2.0(free), Bioperl 1.4 (optional)
Any restrictions to use by non-academics: None
AbbreviationsCDS Coding Sequence; HGT Horizontal gene transfers;LOO Leave-one-out; SVM Support Vector Machines; Syn-FPS Synteny-based Function Prediction System
Competing interestsThe authors declare that they have no competing interests.
Authors' contributionsJL conceived of the study, designed the software anddrafted the manuscript. SKH supervised the work and par-ticipated in results evaluation. ST conceived of the cluster-ing design and gave expertise in bacteriophage analysis.CIK participated in the SVM predictions. All authors have
participated in preparing the manuscript, have read andapproved the final manuscript.
Additional material
AcknowledgementsWe thank Bill Chang and Arthur Hsu for their advice on this work and Zhi Feng Zhu for his assistance in software implementation.
This article has been published as part of BMC Bioinformatics Volume 8, Sup-plement 4, 2007: The Second Automated Function Prediction Meeting. The full contents of the supplement are available online at http://www.biomed central.com/1471-2105/8?issue=S4.
References1. Pan X, Stein L, Brendel V: SynBrowse: a synteny browser for
comparative sequence analysis. Bioinformatics 2005,21(17):3461-3468.
2. Frazer KA, Pachter L, Poliakov A, Rubin EM, Dubchak I: VISTA:computational tools for comparative genomics. Nucleic AcidsRes 2004:W273-279.
3. Brudno M, Do CB, Cooper GM, Kim MF, Davydov E, Program NCS,Green ED, Sidow A, Batzoglou S: LAGAN and Multi-LAGAN:Efficient Tools for Large-Scale Multiple Alignment ofGenomic DNA. Genome Res 2003, 13(4):721-731.
4. Schwartz S, Zhang Z, Frazer KA, Smit A, Riemer C, Bouck J, Gibbs R,Hardison R, Miller W: PipMaker – a web server for aligning twogenomic DNA sequences. Genome Res 2000, 10(4):577-586.
5. Clamp M, Andrews D, Barker D, Bevan P, Cameron G, Chen Y, ClarkL, Cox T, Cuff J, Curwen V, et al.: Ensembl 2002: accommodatingcomparative genomics. Nucleic Acids Res 2003, 31(1):38-42.
6. Huynen MA, Snel B, von Mering C, Bork P: Function predictionand protein networks. Curr Opin Cell Biol 2003, 15(2):191-198.
7. von Mering C, Jensen LJ, Snel B, Hooper SD, Krupp M, Foglierini M,Jouffre N, Huynen MA, Bork P: STRING: known and predictedprotein-protein associations, integrated and transferredacross organisms. Nucleic Acids Res 2005, 33(Databaseissue):D433-D437.
8. Tamames J: Evolution of gene order conservation in prokary-otes. Genome Biol 2001, 2(6):RESEARCH0020.
9. Yanai I, Mellor JC, DeLisi C: Identifying functional links betweengenes using conserved chromosomal proximity. Trends inGenetics 2002, 18(4):176-179.
10. Bray N, Dubchak I, Pachter L: AVID: A Global Alignment Pro-gram. Genome Res 2003, 13:97-102.
11. Brudno M, Malde S, Poliakov A, Do CB, Couronne O, Dubchak I, Bat-zoglou S: Glocal alignment: finding rearrangements duringalignment. Bioinformatics 2003, 19(suppl_1):i54-62.
12. Korbel JO, Snel B, Huynen MA, Bork P: SHOT: a web server forthe construction of genome phylogenies. Trends Genet 2002,18(3):158-162.
13. Brussow H, Hendrix RW: Phage Genomics: Small Is Beautiful.Cell 2002, 108:13-16.
14. Hendrix RW: Bacteriophage genomics. Curr Opin Microbiol 2003,6(5):506-511.
15. Jiang W, Li Z, Zhang Z, Baker ML, Prevelige PE Jr, Chiu W: Coat pro-tein fold and maturation transition of bacteriophage P22seen at subnanometer resolutions. Nat Struct Biol 2003,10(2):131-135.
16. Hatfull GF, Pedulla ML, Jacobs-Sera D, Cichon PM, Foley A, Ford ME,Gonda RM, Houtz JM, Hryckowian AJ, Kelchner VA, et al.: Exploring
Additional file 1Supplementary material – the list of all phages and clustering resultClick here for file[http://www.biomedcentral.com/content/supplementary/1471-2105-8-S4-S6-S1.doc]
Page 8 of 9(page number not for citation purposes)

BMC Bioinformatics 2007, 8(Suppl 4):S6 http://www.biomedcentral.com/1471-2105/8/S4/S6
Publish with BioMed Central and every scientist can read your work free of charge
"BioMed Central will be the most significant development for disseminating the results of biomedical research in our lifetime."
Sir Paul Nurse, Cancer Research UK
Your research papers will be:
available free of charge to the entire biomedical community
peer reviewed and published immediately upon acceptance
cited in PubMed and archived on PubMed Central
yours — you keep the copyright
Submit your manuscript here:http://www.biomedcentral.com/info/publishing_adv.asp
BioMedcentral
the mycobacteriophage metaproteome: phage genomics asan educational platform. PLoS Genet 2006, 2(6):e92.
17. Cristianini N, Shawe-Taylor J: An introduction to support vectormachines: And other kernel-based learning methods. Cam-bridge, England: Cambridge Press; 2000.
18. Wang IN, Smith DL, Young R: Holins: the protein clocks of bac-teriophage infections. Annu Rev Microbiol 2000, 54:799-825.
19. Tamames J, Gonzalez-Moreno M, Mingorance J, Valencia A, VicenteM: Bringing gene order into bacterial shape. Trends in Genetics2001, 17(3):124-126.
20. Wolf YI, Rogozin IB, Kondrashov AS, Koonin EV: Genome align-ment, evolution of prokaryotic genome organization, andprediction of gene function using genomic context. GenomeRes 2001, 11(3):356-372.
21. Fujibuchi W, Ogata H, Matsuda H, Kanehisa M: Automatic detec-tion of conserved gene clusters in multiple genomes bygraph comparison and P-quasi grouping. Nucleic Acids Res 2000,28(20):4029-4036.
22. Kanehisa M, Goto S, Kawashima S, Nakaya A: The KEGG data-bases at GenomeNet. Nucl Acids Res 2002, 30(1):42-46.
23. Stajich JE, Block D, Boulez K, Brenner SE, Chervitz SA, Dagdigian C,Fuellen G, Gilbert JG, Korf I, Lapp H, et al.: The Bioperl toolkit:Perl modules for the life sciences. Genome Res 2002,12(10):1611-1618.
24. Sipser M: Chapter 1: Regular languages. In Introduction to the the-ory of computation 2nd edition. Boston: Thomson Course Technology;2006:31-90.
25. Microsoft: Regular Expression Language Elements MSDN Library: .NETFramework General Reference, Microsoft Corporation; 2006.
26. Hsu AL, Halgamuge SK: Enhancement of topology preservationand hierarchical dynamic self-organising maps for data visu-alisation. International Journal of Approximate Reasoning 2003, 32(2–3):259-279.
27. Hsu AL, Tang SL, Halgamuge SK: An unsupervised hierarchicaldynamic self-organizing approach to cancer class discoveryand marker gene identification in microarray data. Bioinfor-matics 2003, 19(16):2131-2140.
28. Keerthi SS, Shevade SK, Bhattacharyya C, Murthy KRK: Improve-ments to Platt's SMO Algorithm for SVM Classifier Design.Neural Comp 2001, 13(3):637-649.
29. Liao L, Noble WS: Combining pairwise sequence similarity andsupport vector machines for detecting remote protein evo-lutionary and structural relationships. J Comput Biol 2003,10(6):857-868.
30. Cai CZ, Han LY, Ji ZL, Chen YZ: Enzyme family classification bysupport vector machines. Proteins 2004, 55(1):66-76.
31. Baten A, Chang BCH, Halgamuge SK, Li J: Splice site identificationusing probabilistic parameters and SVM classification. BMCBioinformatics 2006, 7(Suppl 5):S15.
32. Dubchak I, Muchnik I, Holbrook SR, Kim SH: Prediction of proteinfolding class using global description of amino acid sequence.Proc Natl Acad Sci USA 1995, 92(19):8700-8704.
33. Tatusova TA, Madden TL: BLAST 2 Sequences, a new tool forcomparing protein and nucleotide sequences. FEMS MicrobiolLett 1999, 174(2):247-250.
Page 9 of 9(page number not for citation purposes)
http://www.ncbi.nlm.nih.gov/entrez/query.fcgi?cmd=Retrieve&db=PubMed&dopt=Abstract&list_uids=7568000