Gene expression profiling reveals the heterogeneous ...gtimp/images/GeneExpressionProfiling.pdfGene...
12
Gene expression profiling reveals the heterogeneous transcriptional activity of Oct3/4 and its possible interaction with Gli2 in mouse embryonic stem cells Yanzhen Li a,b , Jenny Drnevich c , Tatiana Akraiko c , Mark Band c , Dong Li b,d , Fei Wang b,d , Ryo Matoba e , Tetsuya S. Tanaka a,b,f,g, ⁎ a Department of Animal Sciences, University of Illinois at Urbana–Champaign, Urbana, IL 61801, USA b Institute for Genomic Biology, University of Illinois at Urbana–Champaign, Urbana, IL 61801, USA c The W.M. Keck Center for Comparative and Functional Genomics, University of Illinois at Urbana–Champaign, Urbana, IL 61801, USA d Department of Cell and Developmental Biology, University of Illinois at Urbana–Champaign, Urbana, IL 61801, USA e DNA Chip Research Inc., Yokohama, Kanagawa 230-0045, Japan f Department of Biological Sciences, University of Notre Dame, Notre Dame, IN 46556, USA g Department of Chemical and Biomolecular Engineering, University of Notre Dame, Notre Dame, IN 46556, USA abstract article info Article history: Received 3 April 2013 Accepted 30 September 2013 Available online xxxx Keywords: Embryonic stem cell Gli Microarray Mouse Oct3/4 Transcriptional heterogeneity We examined the transcriptional activity of Oct3/4 (Pou5f1) in mouse embryonic stem cells (mESCs) maintained under standard culture conditions to gain a better understanding of self-renewal in mESCs. First, we built an ex- pression vector in which the Oct3/4 promoter drives the monocistronic transcription of Venus and a puromycin- resistant gene via the foot-and-mouth disease virus self-cleaving peptide T2A. Then, a genetically-engineered mESC line with the stable integration of this vector was isolated and cultured in the presence or absence of pu- romycin. The cultures were subsequently subjected to Illumina expression microarray analysis. We identified ap- proximately 4600 probes with statistically significant differential expression. The genes involved in nucleic acid synthesis were overrepresented in the probe set associated with mESCs maintained in the presence of puromy- cin. In contrast, the genes involved in cell differentiation were overrepresented in the probe set associated with mESCs maintained in the absence of puromycin. Therefore, it is suggested with these data that the transcriptional activity of Oct3/4 fluctuates in mESCs and that Oct3/4 plays an essential role in sustaining the basal transcriptional activities required for cell duplication in populations with equal differentiation potential. Heterogeneity in the transcriptional activity of Oct3/4 was dynamic. Interestingly, we found that genes involved in the hedgehog sig- naling pathway showed unique expression profiles in mESCs and validated this observation by RT-PCR analysis. The expression of Gli2, Ptch1 and Smo was consistently detected in other types of pluripotent stem cells examined in this study. Furthermore, the Gli2 protein was heterogeneously detected in mESC nuclei by immunofluores- cence microscopy and this result correlated with the detection of the Oct3/4 protein. Finally, forced activation of Gli2 in mESCs increased their proliferation rate. Collectively, it is suggested with these results that Gli2 may play a novel role in the self-renewal of pluripotent stem cells. © 2013 Elsevier Inc. All rights reserved. 1. Introduction Embryonic stem cells (ESCs) are derived from preimplantation em- bryos and are capable of both long-term proliferation (self-renewal) and differentiation into cell types of all three germ layers (pluripotency). The self-renewal and pluripotency of ESCs are sustained by a combina- tion of essential transcription factors [1] and the extracellular signals that drive the expression of these transcription factors [2]. Recent studies have observed that undifferentiated mouse ESC (mESC) cultures contain multiple cell populations showing fluctuating expression levels of genes associated with cellular pluripotency and cell differentiation [3–18]. Cellular pluripotency and cell differentiation genes are downreg- ulated or expressed in approximately one-tenth of cells in steady state culture (for a review, see [19–22]). For example, when mESCs were sorted into Zscan4-positive and Zscan4-negative subpopulations based on expression levels, the subpopulations were able to regain Zscan4- negative and Zscan4-positive cells, respectively, when they were replated and cultured separately [11]. Interestingly, the constitutive knockdown of Zscan4 significantly decreased telomere length, whereas its constitutive expression increased the levels of telomeric sister chro- matid exchange (T-SCE; [11]). Both telomere shortening and increased T-SCE rates lead to acceleration of the replicative senescence [23,24]. Genomics xxx (2013) xxx–xxx Abbreviations: Hh, hedgehog; mESCs, mouse embryonic stem cells; sqRT-PCR, semi- quantitative reverse transcriptase polymerase chain reaction. ⁎ Corresponding author at: 49 Galvin Life Sciences, Notre Dame, IN 46556, USA. E-mail address: [email protected] (T.S. Tanaka). YGENO-08562; No. of pages: 12; 4C: 5, 7, 9, 10 0888-7543/$ – see front matter © 2013 Elsevier Inc. All rights reserved. http://dx.doi.org/10.1016/j.ygeno.2013.09.004 Contents lists available at ScienceDirect Genomics journal homepage: www.elsevier.com/locate/ygeno Please cite this article as: Y. Li, et al., Gene expression profiling reveals the heterogeneous transcriptional activity of Oct3/4 and its possible inter- action with Gli2 in mouse embryonic stem cells, Genomics (2013), http://dx.doi.org/10.1016/j.ygeno.2013.09.004
Transcript of Gene expression profiling reveals the heterogeneous ...gtimp/images/GeneExpressionProfiling.pdfGene...

Genomics xxx (2013) xxx–xxx
YGENO-08562; No. of pages: 12; 4C: 5, 7, 9, 10
Contents lists available at ScienceDirect
Genomics
j ourna l homepage: www.e lsev ie r .com/ locate /ygeno
Gene expression profiling reveals the heterogeneous transcriptionalactivity of Oct3/4 and its possible interaction with Gli2 in mouseembryonic stem cells
Yanzhen Li a,b, Jenny Drnevich c, Tatiana Akraiko c, Mark Band c, Dong Li b,d, Fei Wang b,d,Ryo Matoba e, Tetsuya S. Tanaka a,b,f,g,⁎a Department of Animal Sciences, University of Illinois at Urbana–Champaign, Urbana, IL 61801, USAb Institute for Genomic Biology, University of Illinois at Urbana–Champaign, Urbana, IL 61801, USAc The W.M. Keck Center for Comparative and Functional Genomics, University of Illinois at Urbana–Champaign, Urbana, IL 61801, USAd Department of Cell and Developmental Biology, University of Illinois at Urbana–Champaign, Urbana, IL 61801, USAe DNA Chip Research Inc., Yokohama, Kanagawa 230-0045, Japanf Department of Biological Sciences, University of Notre Dame, Notre Dame, IN 46556, USAg Department of Chemical and Biomolecular Engineering, University of Notre Dame, Notre Dame, IN 46556, USA
Abbreviations: Hh, hedgehog; mESCs, mouse embryoquantitative reverse transcriptase polymerase chain react⁎ Corresponding author at: 49 Galvin Life Sciences, Not
E-mail address: [email protected] (T.S. Tanaka
0888-7543/$ – see front matter © 2013 Elsevier Inc. All rihttp://dx.doi.org/10.1016/j.ygeno.2013.09.004
Please cite this article as: Y. Li, et al., Gene exaction with Gli2 in mouse embryonic stem c
a b s t r a c t
a r t i c l e i n f oArticle history:Received 3 April 2013Accepted 30 September 2013Available online xxxx
Keywords:Embryonic stem cellGliMicroarrayMouseOct3/4Transcriptional heterogeneity
We examined the transcriptional activity of Oct3/4 (Pou5f1) inmouse embryonic stem cells (mESCs) maintainedunder standard culture conditions to gain a better understanding of self-renewal in mESCs. First, we built an ex-pression vector in which the Oct3/4 promoter drives themonocistronic transcription of Venus and a puromycin-resistant gene via the foot-and-mouth disease virus self-cleaving peptide T2A. Then, a genetically-engineeredmESC line with the stable integration of this vector was isolated and cultured in the presence or absence of pu-romycin. The cultureswere subsequently subjected to Illumina expressionmicroarray analysis.We identified ap-proximately 4600 probes with statistically significant differential expression. The genes involved in nucleic acidsynthesis were overrepresented in the probe set associated with mESCs maintained in the presence of puromy-cin. In contrast, the genes involved in cell differentiation were overrepresented in the probe set associated withmESCsmaintained in the absence of puromycin. Therefore, it is suggestedwith these data that the transcriptionalactivity ofOct3/4 fluctuates inmESCs and thatOct3/4plays an essential role in sustaining the basal transcriptionalactivities required for cell duplication in populations with equal differentiation potential. Heterogeneity in thetranscriptional activity of Oct3/4was dynamic. Interestingly, we found that genes involved in the hedgehog sig-naling pathway showed unique expression profiles in mESCs and validated this observation by RT-PCR analysis.The expression ofGli2, Ptch1 and Smowas consistently detected in other types of pluripotent stem cells examinedin this study. Furthermore, the Gli2 protein was heterogeneously detected in mESC nuclei by immunofluores-cence microscopy and this result correlated with the detection of the Oct3/4 protein. Finally, forced activationof Gli2 in mESCs increased their proliferation rate. Collectively, it is suggested with these results that Gli2 mayplay a novel role in the self-renewal of pluripotent stem cells.
© 2013 Elsevier Inc. All rights reserved.
1. Introduction
Embryonic stem cells (ESCs) are derived from preimplantation em-bryos and are capable of both long-term proliferation (self-renewal)anddifferentiation into cell types of all three germ layers (pluripotency).The self-renewal and pluripotency of ESCs are sustained by a combina-tion of essential transcription factors [1] and the extracellular signalsthat drive the expression of these transcription factors [2]. Recent
nic stem cells; sqRT-PCR, semi-ion.re Dame, IN 46556, USA.).
ghts reserved.
pression profiling reveals theells, Genomics (2013), http://
studies have observed that undifferentiatedmouse ESC (mESC) culturescontain multiple cell populations showing fluctuating expression levelsof genes associated with cellular pluripotency and cell differentiation[3–18]. Cellular pluripotency and cell differentiation genes are downreg-ulated or expressed in approximately one-tenth of cells in steady stateculture (for a review, see [19–22]). For example, when mESCs weresorted into Zscan4-positive and Zscan4-negative subpopulations basedon expression levels, the subpopulations were able to regain Zscan4-negative and Zscan4-positive cells, respectively, when they werereplated and cultured separately [11]. Interestingly, the constitutiveknockdown of Zscan4 significantly decreased telomere length, whereasits constitutive expression increased the levels of telomeric sister chro-matid exchange (T-SCE; [11]). Both telomere shortening and increasedT-SCE rates lead to acceleration of the replicative senescence [23,24].
heterogeneous transcriptional activity of Oct3/4 and its possible inter-dx.doi.org/10.1016/j.ygeno.2013.09.004
2 Y. Li et al. / Genomics xxx (2013) xxx–xxx
Therefore, the heterogeneous expression of Zscan4 is necessary formESCs to self-renew indefinitely.
In studies with other genes [3,5,12–16,18], each subpopulation hasexhibited unique differentiation potential. For example, Nanog-highmESCs are resistant to differentiation, whereas Nanog-low mESCs areprone to differentiation [3]. Consequently, the presence of subpopula-tions in mESC cultures typifies the plasticity of early embryoniccells and dynamically sustains their self-renewal and pluripotency.The autorepressive feedback of Nanog [25], extrinsic TGFβ signal-ing pathways, such as Nodal and BMP [26], and activity of the basic-helix–loop–helix transcription factor Tcf15 [16] are responsible formaintaining heterogeneousNanog expression inmESC cultures. In addi-tion, the stiffness of the culture dishes [27] and/or the uneven partitionof the cytoplasm during cell division [28,29] may contribute to thevariable expression of these genes in mESC cultures. However, the un-derlying molecular mechanism that is responsible for transcriptionalheterogeneity in mESCs remains elusive.
In this study, we generated a genetically-engineered mESC line toexamine its self-renewal. ThemESC line contains an expression cassettewith anOct3/4 (Pou5f1) promoter that drives themonocistronic expres-sion of Venus and a puromycin-resistant gene product. The mESCswere cultured under standard conditions with or without puromycin(puromycin-positive and puromycin-negative cultures, respectively)and subjected to Illumina expressionmicroarray analysis. It is suggestedwith these data that mESCs exhibit fluctuations in Oct3/4 expressionlevels and thatOct3/4 plays an essential role in sustaining the basal tran-scriptional activities required for duplication of cells with equal differ-entiation potential. Surprisingly, we found that the genes involved inthe hedgehog signaling pathway, i.e., Gli2 and Ptch1, showed unique ex-pression profiles inmESCs. It is suggested with our results that Gli2mayplay a novel role in the self-renewal of pluripotent stem cells.
2. Materials and methods
2.1. Vector construction
Standardmolecular cloning techniqueswere used to build pOctV2APinwhich theOct3/4 promoter drives the expression of Venus [17,30] andpCAG_Gli2ERP from which the protein coding sequence of Gli2 isexpressed as a fusion protein with the human estrogen receptor ERT2[31,32]. A stepwise description of the vector construction is providedin the Supplementary Materials and methods.
2.2. Cell culture
Mouse embryonic stem cells (mESCs; OGR1 andW4) were culturedunder standard conditions, as described previously [27,33,34]. Briefly,mESCs were plated on 0.1% gelatin-coated tissue culture dishes andcultured in Dulbecco's modified Eagle's medium (high glucose; LifeTechnologies, Carlsbad, CA) supplemented with 15% fetal bovineserum (FBS; Life Technologies, and Gemini Bio-Products, West Sacra-mento, CA), 0.1 mM non-essential amino acids (Life Technologies),2 mM GlutaMax I (Life Technologies), 1 mM sodium pyruvate (LifeTechnologies), 100U/ml penicillin and 0.1mg/ml streptomycin (Sigma-Aldrich, St. Louis, MO), 0.1 mM 2-mercaptoethanol (Sigma-Aldrich)and 1000U/ml Leukemia inhibitory factor (LIF; EMD Millipore, Billerica,MA). To determine the best serum lot for mESC culture, several differentserum lots from a few different companies were tested by platingmESCsat a low density under 15 or 30% serum conditions. Although threeserum lots contributed to the results presented in this manuscript dueto the duration of the study, heterogeneity in the expression of theOct3/4 reporterwas consistently observed. To expandmESCs at 80% con-fluence, TrypLE Express (Life Technologies) and the same volume of thestandard culture medium were sequentially added to the culture and asingle cell suspension was prepared. The plating density was 1:5.Under these conditions, it took two days for mESCs to reach 80%
Please cite this article as: Y. Li, et al., Gene expression profiling reveals theaction with Gli2 in mouse embryonic stem cells, Genomics (2013), http://
confluence after plating. More than 80% of the mESCs exhibited an ap-pearance of undifferentiated cells under these conditions. Mouse terato-carcinoma cell lines (F9 and P19 [35,36]), whichwere kindly provided byDr.Minoru S. H. Ko, National Institute onAging/NIH,were culturedunderstandard conditions for mESCs without LIF.
pOctV2AP (see Supplementary Materials and methods) was linear-ized with BspHI and delivered by electroporation into feeder-free W4ESCs at passage 15 (10 μg DNA/1.0 × 107 cells/cuvette, 0.8 kV/cm, 12pulses of 99 μs/pulse, BTX ECM200). After selection with 2 μg/ml puro-mycin (InvivoGen, San Diego, CA) for 11 days, the drug-resistant colo-nies, designated OVW4, were collected (passage 1) and expanded. TheOVW4 cells were maintained under standard conditions and sorted atpassage 18 based on fluorescence at 575 nm, as described previously[27].
Linear pCAG_Gli2ERP digested with ScaI (0.5, 3 and 4 μg) wasnucleofected into OGR1mESCs (at passages 21, 25 and 12, respectively)according to themanufacturer's instruction (Lonza, Basel, Switzerland).Stable lines (referred to as Gli2ER hereafter) were isolated 10–14 daysafter selection with 2 μg/ml puromycin supplemented in the standardculture medium. Gli2ER clones were maintained and assayed inthe presence of puromycin within 10 passages after isolation. Aftertrypsinization, the same volume of a single cell suspension was platedinto two sets of gelatin-coated wells of 24-well plates in the standardculture medium. Roughly 100–3000 cells were plated in this manner.One day after plating, one set of the wells were fed with the standardmedium supplemented with 20nM 4-hydroxytamoxifen (4OHT; T176,Sigma-Aldrich). We determined that 20 nM 4OHT was optimum:when a higher dose was applied to culture, OGR1 mESCs decreasedthe proliferation rate (data not shown). Four days after the 4OHT treat-ment, a single cell suspension was prepared using an electronic pipet(Biohit, Bohemia, NY) to reduce pipetting errors, although the final vol-ume of the single cell suspension was measured using a pipetman(Eppendorf, Hauppauge, NY). The number of cells (larger than 8.4 μmand smaller than 33.6 μm in diameter) was counted using ScepterTM
(Millipore). Results were statistically analyzed using one-tail Student'st-test.
The dynamic of Oct3/4 reporter expression was examined usingmESCs that express EGFP under the Oct3/4 promoter, namely OGR1[27,33,34,37]. After a single cell suspensionwas dilutedwith the standardculture medium, EGFP expression levels in each OGR1mESC were deter-mined under an inverted microscope (Leica DMI4000B) equipped withan epifluorescent lamp. Single OGR1 mESCs were individually platedin each well of a gelatin-coated 96-well plate (Sarstedt AG & Co.,Nümbrecht, Germany) filled with the standard culture medium by thesingle cell manipulation method [38,39]. Five to seven days after plating,the plating efficiency and the morphology and EGFP expression of colo-nies developed from single OGR1 mESCs were measured. Images wereprocessed using ImageJ and enhanced in the sameway. For this set of ex-periments, OGR1 mESCs were used at passages 6–19.
2.3. Microarray hybridization and analysis
One day after a subclone of OVW4, namely A02 (at passage 5), wasplated at 100 cells/cm2, it was maintained under the presence or ab-sence of puromycin (2 μg/ml; Invivogen) for 4 days. Total RNA wasextracted from 3 separate dishes per condition and subjected to micro-array analysis (MouseWG-6 v1.1 Expression BeadChips; Illumina Inc.,San Diego, CA). More detailed descriptions of themicroarray hybridiza-tion and data analysis are provided in the Supplementary Materials andmethods.
After background correction and quantile normalization, the log2-transformed data were assessed for differential expression. We arbi-trarily considered genes with a false discovery rate [40] less than 0.05and a fold-change of 1.2 or greater differentially expressed. Then, a listof differentially expressed genes with an expression level of 200 orgreater in the puromycin-positive OVW4 culture was generated. A
heterogeneous transcriptional activity of Oct3/4 and its possible inter-dx.doi.org/10.1016/j.ygeno.2013.09.004

3Y. Li et al. / Genomics xxx (2013) xxx–xxx
scatter plot and a heat map were constructed using Microsoft Exceland MultiExperiment Viewer [41,42], respectively. ConPath Navigator(http://conpath.dna-chip.co.jp/; DNA Chip Research Inc., Yokohama,Kanagawa, Japan) was used to compare this gene list with publisheddata [42,43], and GOToolBox (http://genome.crg.es/GOToolBox/; [44])was used to investigate its associated gene annotations.
2.4. Semi-quantitative (sq) and quantitative (q) RT-PCR
The 1.6μg of total RNA extracted from stem cells in each culture con-dition was used to synthesize the first cDNA strand, as described previ-ously [27,45,46]. For gene expression analysis of undifferentiated anddifferentiatedmESCs, OGR1was plated at 100cells/cm2 andmaintainedin the presence or absence of LIF for 4 days under standard conditionswith animal serum. PCR mixtures were prepared using Phusion DNApolymerase (New England Biolab, Ipswich, MA), according to themanufacturer's instructions. The PCR conditions were as follows: initialdenaturing at 98°C for 1min followed by 25cycles of denaturing at 98°Cfor 10s, annealing at 65°C for 30s, extension at 72°C for 30s and a finalextension at 72 °C for 7.5min. The primer sets used for this study weredescribed previously [5,27,33,34,45,47,48] or are listed in Supplementa-ry Table 1. To quantify relative gene expression, images of ethidiumbromide-stained PCR products in agarose gels were analyzed usingImageJ. An identical rectangular selection was used to measure themean fluorescence intensity of each PCR product as well as a local back-ground level near the product per image. After background subtraction,values were divided by the one of Smo as a reference to obtain relativegene expression levels.
Quantitative (q) RT-PCRwas carried out essentially as described pre-viously [34], except that the One-Step qRT-PCR kit (Life Technologies)was used.
2.5. Immunofluorescence microscopy
After fixation with 4% paraformaldehyde (Sigma-Aldrich) in PBS atroom temperature for 15min, mESCs cultured on glass-bottom dishes(MatTek corporation, Ashland, MA) coated with 0.15 mg/ml type IAcollagen (Nitta Gelatin Co., Osaka, Japan) were washed with PBSand blocked with 0.1% Triton X-100 at room temperature for 10 min.After PBS washes, these mESCs were incubated with 10% Image-iT FXsignal enhancer (Life Technologies) at room temperature for 30 min,followed by incubation with a mouse anti-human Oct4 monoclonal an-tibody (sc-5279, Santa Cruz Biotechnology, Santa Cruz, CA) and a rabbitanti-human Gli2 polyclonal antibody (ab26056, Abcam, Cambridge,MA) diluted with 10% Image-iT FX signal enhancer at a 1:200 ratio at4 °C overnight. After PBS washes, the samples were incubated withgoat Alexa Fluor 488 anti-mouse IgG and goat Alexa Fluor 568 anti-rabbit IgG polyclonal antibodies (Life Technologies) diluted in 10%Image-iT in PBS at room temperature for 1h. Cellular nuclei were stainedwith Hoechst 33258 (0.2mg/ml; Sigma) after PBS washes. The immuno-stained mESCs were treated with ProLong Gold antifade reagent (LifeTechnologies) overnight. A confocal microscope LSM 700 was used.Image analysiswas carried out using ImageJ.Meanfluorescence intensityvalues that are greater than 40 and 20 are considered positive for the ex-pression of Oct3/4 and Gli2, respectively (see Supplementary Fig. 1).
Detection of the SSEA1 antigen [49] was carried out using the FITC-conjugated anti-SSEA1 antibody (sc-21702, Santa Cruz Biotechnology)under the standard fluorescencemicroscopy (Observer.Z1, Zeiss) essen-tially as described previously [34,27].
3. Results and discussion
3.1. Mouse embryonic stem cells showed fluctuating expression of Oct3/4
To examine the transcriptional activity of Oct3/4 in mESCs culturedunder standard conditions with animal serum (referred to as standard
Please cite this article as: Y. Li, et al., Gene expression profiling reveals theaction with Gli2 in mouse embryonic stem cells, Genomics (2013), http://
conditions hereafter), the Oct3/4 promoter [50] was cloned and usedto build a fluorescent reporter construct, namely pOctV2AP (Fig. 1A;see Supplementary Materials and methods). In this construct, theOct3/4promoter drives the expression of Venus, a variant of yellowfluo-rescent protein [30], which is co-expressed with a puromycin-resistantgene product via the self-cleaving peptide T2A [51]. After pOctV2APwaslinearized and delivered tomESCs by electroporation, mESC clones thatexhibited puromycin resistance were isolated. As a proof of principle,these mESC clones, referred to as OVW4, expressed Venus under stan-dard culture conditions (Fig. 1B). Interestingly, Venus expression wasnot detected in all of the OVW4 mESCs under standard culture condi-tions (Fig. 1B), i.e., Venus exhibited a variable expression pattern acrossOVW4 mESCs. In contrast, Venus fluorescence was relatively uniformwhen OVW4 cells were cultured in the presence of puromycin(Fig. 1C). Thus, these results indicate that the transcriptional activity ofOct3/4 fluctuates inmESCs under standard culture conditions. Heteroge-neity in the transcriptional activity ofOct3/4 is not under the influence ofanimal serum because we observed similar heterogeneous expression ofthe Oct3/4 reporter in mESCs maintained under chemically-definedserum-free conditions [33,52] (Supplementary Fig. 2). Flow cytometricanalysis revealed that approximately one-fifth of the OVW4 cells main-tained under standard conditions lacked Venus expression (data notshown). When OVW4 cells were introduced into host blastocysts,Venus was fluorescently detected in the testes of developing fetuses atembryonic day 17.5 (Fig. 1D), thus validating the promoter activity ofthe transgene.
Next, the expression of genes associated with cellular pluripotency(Oct3/4, Esg1(Dppa5a), Fgf4, Nanog, Rex1 and Sox2) and cell differentia-tion (Rhox6, Rhox9 and Tcf15) were examined in Venus-positive andVenus-negative OVW4 cells by semi-quantitative reverse transcriptasepolymerase chain reaction (sqRT-PCR; Fig. 1E). Nanog, Rex1, Rhox6/9and Tcf15 are known to be heterogeneously expressed in mESCs[3–6,16,45]. Notably, Venus-negative OVW4 cells exhibited a markeddownregulation of Fgf4, Rex1, Sox2, Rhox9 and Tcf15, whereas Esg1,Nanog and Rhox6 expression levels were roughly maintained in Venus-negative OVW4 cells (Fig. 1E). Therefore, multiple subpopulations ofmESCs existed in the culture, as suggested previously [4].
We investigated whether or not the observed heterogeneity in thetranscriptional activity of Oct3/4 is dynamic. Initially, single OVW4mESCs were plated, but their recovery was poor due to W4's high de-pendency on LIF [53]. Therefore, R1 mESCs that express EGFP underthe Oct3/4 promoter (OGR1 [27,33,34,37]) were used. Single EGFP-high or low OGR1 mESCs were plated into each well of 96-well platesand maintained under standard conditions (Figs. 2A–C). Five to sevendays after plating, 42.8% of EGFP-high and 36.6% of EGFP-low singleOGR1 mESCs grew into individual colonies (p N 0.05). The appearanceof each colony was arbitrarily categorized into the following three: adome-like shapewith bright EGFPfluorescence indicative of pluripotentmESCs, a flattened shapewithmoderate EGFPfluorescence indicative ofreduced differentiation potential and a committed cell shape with re-duced EGFP fluorescence indicative of cell differentiation (Figs. 2D–I).EGFP-low mESCs produced slightly more colonies with an appearanceof committed cells (38.1%) than EGFP-high mESCs (34.3%) at the ex-pense of dome-like colonies (28.6% in EGFP-low mESCs vs. 33.1% inEGFP-high mESCs; Fig. 2J). However, this result shows no statistical sig-nificance and both EGFP-high and EGFP-low mESCs formed colonieswith heterogeneous EGFP expression. Thus, we conclude that heteroge-neity in the transcriptional activity of Oct3/4 is dynamic.
3.2. Microarray analysis revealed global transcriptional heterogeneity inmouse embryonic stem cells
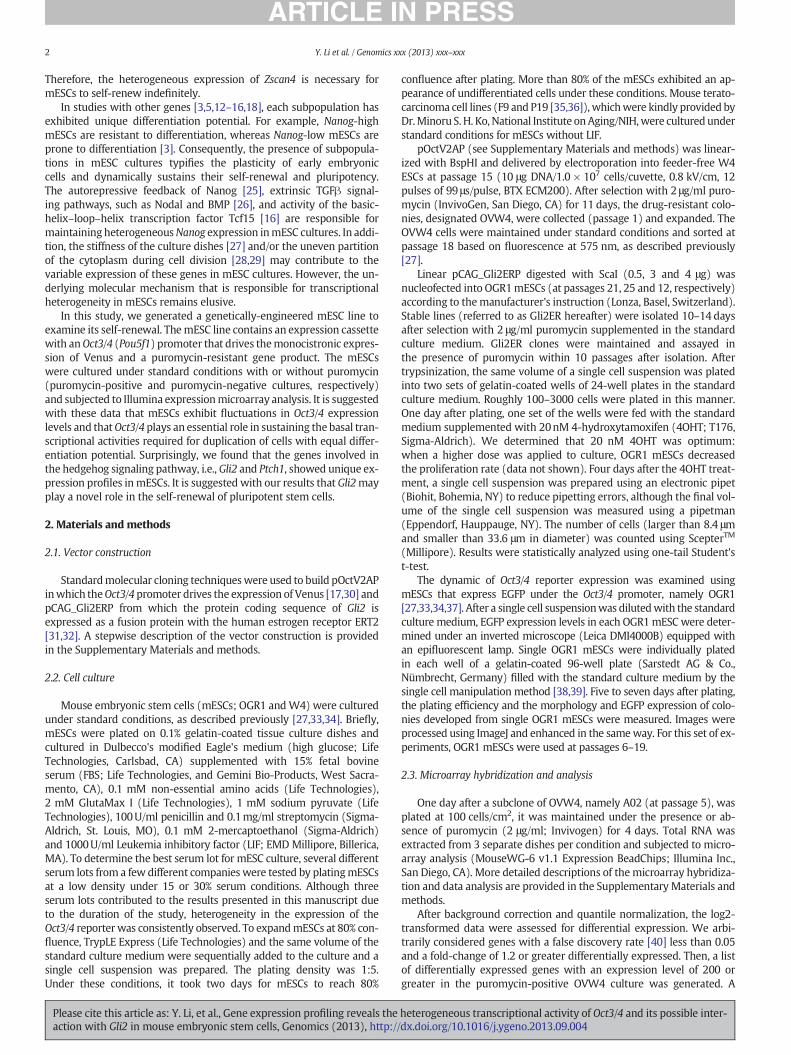
To evaluate the transcriptional heterogeneity in mESCs at a genomicscale, OVW4 cells were maintained under standard conditions in thepresence or absence of puromycin, and subjected to expression micro-array analysis (Fig. 3A). Hybridization experiments were carried out in
heterogeneous transcriptional activity of Oct3/4 and its possible inter-dx.doi.org/10.1016/j.ygeno.2013.09.004

Fig. 1. Characterization of OVW4 mouse embryonic stem cells (mESCs). (A) A schematic representation of the expression cassette used to generate OVW4 mESCs. The Oct3/4 promoterdrives the monocistronic transcription of the Venus fluorescent protein and a puromycin-resistant gene product (puromycin-N-acetyltransferase; Puror) via T2A (2A). pA, the bovinegrowth hormone polyadenylation signal. The bar denotes a length of 1 kb. (B–D) Bright (left) and dark (right) field images are shown. Bars, 50 μm in B and C and 100 μm in D. (B) AmESC line that harbors the Venus_T2A_Puror cassette driven by the Oct3/4 promoter (Oct3/4::Venus) was designated OVW4 and maintained under standard conditions (left). Venusshowed fluctuating expression (right). (C) OVW4 was maintained under standard conditions supplemented with puromycin (left). Venus showed relatively homogeneous expression(right). (D) Fetal testeswere isolated from a chimera at embryonic day 17.5, whichwas derived from injection of OVW4 into a host blastocyst (left). The expression of Venuswas detectedin seminiferous tubules (right). (E) Undifferentiated OVW4 was sorted according to Venus expression levels at 575 nm and subjected to first strand cDNA synthesis. The cDNA obtainedfrom Venus-positive (+) or negative (−) OVW4 was used as a template for the subsequent polymerase chain reaction (PCR) with each gene-specific primer pair indicated on the right.Ef1a is a positive control, and RT− is a negative control.
Fig. 2.Heterogeneous expression of the Oct3/4 reporter is dynamic. (A–I) Phase contrast (left) and fluorescence (right) images ofmouse embryonic stem cells (mESCs) that express EGFPunder the Oct3/4 promoter, namely OGR1, are shown. The EGFP fluorescence indicates the transcriptional activity of Oct3/4. Bars, 50 μm. (A & B) Single EGFP-high (A) and EGFP-low(B) OGR1 mESCs are shown. (C) An EGFP-high mESC (arrowhead) was plated in a well of a 96-well plate. No other cell exists in the same well. (D–I) Colonies with a dome-like shape(D & E), a flattened shape (F & G) and a committed cell shape (H & I) were formed from single EGFP-high (D, F & H) or EGFP-low (E, G & I) OGR1 mESCs. Note that colonies shown inE and G were formed on the plastic plate showing “grooves” on the opposite side of the bottom due to the manufacturing-associated issue. (J) The frequency of the appearance of adome-like, flattened or committed cell shape was measured 5–7 days after plating single EGFP-high and EGFP-low mESCs. The total numbers of single cells plated are 181 for EGFP-high and 21 for EGFP-low mESCs from five replications. The Chi-square test showed no statistical significance.
4 Y. Li et al. / Genomics xxx (2013) xxx–xxx
Please cite this article as: Y. Li, et al., Gene expression profiling reveals the heterogeneous transcriptional activity of Oct3/4 and its possible inter-action with Gli2 in mouse embryonic stem cells, Genomics (2013), http://dx.doi.org/10.1016/j.ygeno.2013.09.004
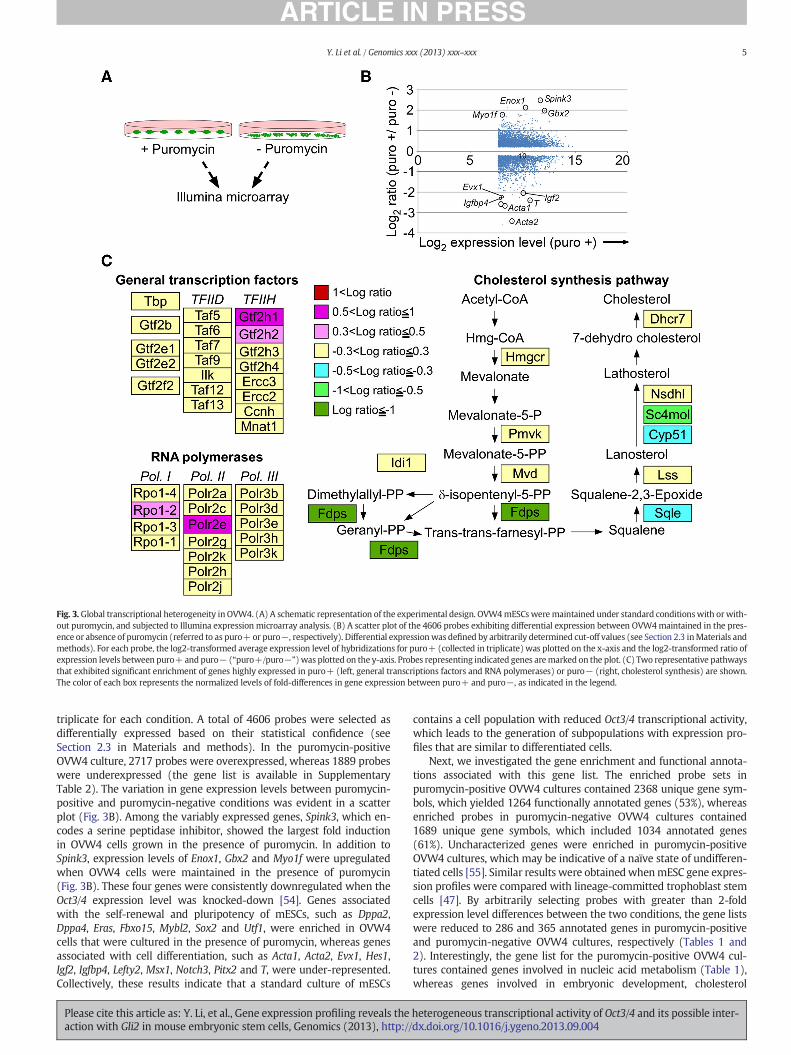
Fig. 3. Global transcriptional heterogeneity in OVW4. (A) A schematic representation of the experimental design. OVW4mESCs weremaintained under standard conditionswith orwith-out puromycin, and subjected to Illumina expression microarray analysis. (B) A scatter plot of the 4606 probes exhibiting differential expression between OVW4maintained in the pres-ence or absence of puromycin (referred to as puro+ or puro−, respectively). Differential expressionwas defined by arbitrarily determined cut-off values (see Section 2.3 inMaterials andmethods). For each probe, the log2-transformed average expression level of hybridizations for puro+ (collected in triplicate) was plotted on the x-axis and the log2-transformed ratio ofexpression levels between puro+ and puro− (“puro+/puro−”) was plotted on the y-axis. Probes representing indicated genes aremarked on the plot. (C) Two representative pathwaysthat exhibited significant enrichment of genes highly expressed in puro+ (left, general transcriptions factors and RNA polymerases) or puro− (right, cholesterol synthesis) are shown.The color of each box represents the normalized levels of fold-differences in gene expression between puro+ and puro−, as indicated in the legend.
5Y. Li et al. / Genomics xxx (2013) xxx–xxx
triplicate for each condition. A total of 4606 probes were selected asdifferentially expressed based on their statistical confidence (seeSection 2.3 in Materials and methods). In the puromycin-positiveOVW4 culture, 2717 probes were overexpressed, whereas 1889 probeswere underexpressed (the gene list is available in SupplementaryTable 2). The variation in gene expression levels between puromycin-positive and puromycin-negative conditions was evident in a scatterplot (Fig. 3B). Among the variably expressed genes, Spink3, which en-codes a serine peptidase inhibitor, showed the largest fold inductionin OVW4 cells grown in the presence of puromycin. In addition toSpink3, expression levels of Enox1, Gbx2 and Myo1f were upregulatedwhen OVW4 cells were maintained in the presence of puromycin(Fig. 3B). These four genes were consistently downregulated when theOct3/4 expression level was knocked-down [54]. Genes associatedwith the self-renewal and pluripotency of mESCs, such as Dppa2,Dppa4, Eras, Fbxo15, Mybl2, Sox2 and Utf1, were enriched in OVW4cells that were cultured in the presence of puromycin, whereas genesassociated with cell differentiation, such as Acta1, Acta2, Evx1, Hes1,Igf2, Igfbp4, Lefty2, Msx1, Notch3, Pitx2 and T, were under-represented.Collectively, these results indicate that a standard culture of mESCs
Please cite this article as: Y. Li, et al., Gene expression profiling reveals theaction with Gli2 in mouse embryonic stem cells, Genomics (2013), http://
contains a cell population with reduced Oct3/4 transcriptional activity,which leads to the generation of subpopulations with expression pro-files that are similar to differentiated cells.
Next, we investigated the gene enrichment and functional annota-tions associated with this gene list. The enriched probe sets inpuromycin-positive OVW4 cultures contained 2368 unique gene sym-bols, which yielded 1264 functionally annotated genes (53%), whereasenriched probes in puromycin-negative OVW4 cultures contained1689 unique gene symbols, which included 1034 annotated genes(61%). Uncharacterized genes were enriched in puromycin-positiveOVW4 cultures, which may be indicative of a naïve state of undifferen-tiated cells [55]. Similar results were obtainedwhenmESC gene expres-sion profiles were compared with lineage-committed trophoblast stemcells [47]. By arbitrarily selecting probes with greater than 2-foldexpression level differences between the two conditions, the gene listswere reduced to 286 and 365 annotated genes in puromycin-positiveand puromycin-negative OVW4 cultures, respectively (Tables 1 and2). Interestingly, the gene list for the puromycin-positive OVW4 cul-tures contained genes involved in nucleic acid metabolism (Table 1),whereas genes involved in embryonic development, cholesterol
heterogeneous transcriptional activity of Oct3/4 and its possible inter-dx.doi.org/10.1016/j.ygeno.2013.09.004

Table 1The functional annotations of genes overrepresented in puromycin-positive OVW4 cultures.
Levela Gene Ontology ID Term # in thereferenceb
Frequency inthe reference
# in thegene listc
Frequency inthe gene list
p-Valued
2 0008152 Metabolic process 7146 0.4875 187 0.6538 0.0000064814343 0043170 Macromolecule metabolic process 5310 0.3622 147 0.514 0.000069516575 0034960 Cellular biopolymer metabolic process 4682 0.3194 141 0.493 0.00000049103015, 6 0010468 Regulation of gene expression 2019 0.1377 69 0.2413 0.0012982
a The terms at levels 3, 5, and 6 are derived from the parental term at level 2. A total of 24 terms showed statistical significance (see “d” below), although they belong to the same pa-rental term. Only the representative daughter terms are shown.
b Gene symbols in Mouse Genome Informatics were used as a reference.c A total of 706 genes exhibiting a 2-fold increase in their expression levels at FDR b 0.05 contain 640 non-redundant gene symbols, of which 286 symbols are functionally annotated.d p-Values were calculated using the hypergeometric test (default setting) and the Bonferroni correction. GO annotations that have p-values less than 0.01 are considered statistically
significant.
6 Y. Li et al. / Genomics xxx (2013) xxx–xxx
metabolism, and cytoskeletons were noted on the puromycin-negativegene list (Table 2). Similar results were independently obtained usingConPath Navigator (Fig. 3C; http://conpath.dna-chip.co.jp/). ConPathNavigator is a search tool for genes relative to biological signaling path-ways built by GenMAPP [56]. Taken together, it is suggested with thesedata that Oct3/4 plays an essential role in maintaining basal cellulartranscriptional activities while suppressing the expression of genes in-volved in cell differentiation. This function of Oct3/4 is indicative of agene that is responsible for regulating the duplication of cells withequal differentiation potential, i.e., self-renewal.
Our expressionmicroarray analysis identified about 2300 annotatedgenes that potentially exhibit heterogeneous expression under the in-fluence of Oct3/4 in mESCs. This analysis was done using OVW4 cul-tured in the presence or absence of puromycin under conditions withLIF and animal serum without feeder layers. These conditions mighthave enriched a population of cells that express Oct3/4 at a very highlevel (e.g., [57]) and contributed tomagnifying the gene list. Interesting-ly, single-cell gene expression analysis showed that nine genes associat-ed with cellular pluripotency including Nanog and Oct3/4 exhibitedvariable expression similar to Gapdh [58]. In this analysis, mESCs weremaintained under conditions with LIF, animal serum and feeder layers.Under these conditions, fluctuating expression of the nine genes mighthave been less pronounced than in conditions without feeder layers.However, these two studies clearly demonstrated that gene expressionin mESCs is quite variable, so that bulk analysis of gene expression isnot suited for understanding the mechanism of cellular pluripotency.
3.3. Undifferentiated pluripotent stem cells expressed genes involved in thehedgehog signaling pathway
Our expression microarray data clearly demonstrate that standardcultures of mESCs consist of heterogeneous populations. Next, weused ConPath Navigator to perform a cross-platform comparison ofour current data with published datasets that reported gene expression
Table 2The functional annotations of genes overrepresented in puromycin-negative OVW4 cultures.
Levela Gene Ontology ID Term # inrefe
2 0032502 Developmental process 2913 0007275 Multicellular organismal development 2474, 5 0009792 Embryonic development ending in
birth or egg hatching42
2 0010926 Anatomical structure formation 774, 5, 6 0034728 Nucleosome organization 95, 6, 7 0016125 Sterol metabolic process 73, 4, 5 0016192 Vesicle-mediated transport 41
a Terms belonging to the same parental term (level 2) are grouped. A total of 15 terms showeddifferent parental terms (level 2) are expected, although 2 of them did not show statistical sig
b Gene symbols in Mouse Genome Informatics were used as a reference.c A total of 613 genes exhibiting a 2-fold increase in their expression levels at FDR b 0.05 cond p-Values were calculated using the hypergeometric test (default setting) and the Bonferro
significant.
Please cite this article as: Y. Li, et al., Gene expression profiling reveals theaction with Gli2 in mouse embryonic stem cells, Genomics (2013), http://
profiles of mESCs in the course of Oct3/4 downregulation [42,43]. Thesepublished datasets were generated using bulk preparations of mESCsmaintained under standard conditions. On the other hand, our datasettook into account the heterogeneous transcriptional activity of Oct3/4in mESCs maintained under similar conditions. Therefore, we aimed atinvestigatingwhether our dataset is consistentwith or offers alternativeinterpretations of the published datasets. Because not all of the probestested in our dataset were necessarily examined in the publisheddatasets, we used two datasets for comparison. Interestingly, wefound unique expression patterns in genes that are involved in thehedgehog (Hh) signaling pathway. For example, the transcription factorGli2 and the transmembrane receptor Ptch1 were consistently highlyexpressed in mESCs that displayed high transcriptional activity ofOct3/4 (i.e., OVW4 cells that were cultured in the presence of puromy-cin, “puro+”; Table 3), whereas the transcription repressor Gli3 washighly expressed in OVW4 cells that were cultured in the absence of pu-romycin (“puro”; Table 3). The expression levels of Gli2, Gli3 and Ptch1were comparable to that of Sox2, a co-factor of Oct3/4 (Table 3). Theforced downregulation of Oct3/4 transcription [43] induced down-regulation and up-regulation of Gli2 and Gli3, respectively (Fig. 4A).Thus, the positive correlation between Gli2 and Oct3/4 expression, andthe negative correlation between Gli3 and Oct3/4 expressionwere inde-pendently validated. The Ptch1 expression pattern observed in the cur-rent dataset was unexpected because, according to Walker et al. [42],Ptch1 expressionmarkedly increased a fewdays after cell differentiationwas induced (by the withdrawal of LIF from the culture or the additionof retinoic acid to the culture), but returned back to its basal level within5days [42]. Another study independently reported a similar expressionprofile of Ptch1 [59]. However, Ptch1 expression became further down-regulated when mESCs were differentiated in the absence of LIF but thepresence of retinoic acid for 20 days [60]. Ptch1 may be influenced byboth LIF and differentiation-inducing signals.
These results were unexpected because the Hh signaling pathwaygoverns cell type specification and embryonic patterning [61]. In
therenceb
Frequency inthe reference
# in thegene listc
Frequency inthe gene list
p-Valued
5 0.1989 112 0.3068 0.00040476 0.1689 96 0.263 0.00259061 0.0287 28 0.0767 0.0030938
5 0.0529 43 0.1178 0.00079946 0.0065 12 0.0329 0.00728778 0.0053 12 0.0329 0.00078789 0.0286 28 0.0767 0.0028278
statistical significance (see “d” below). Only the representative terms are shown. At least 4nificance.
tain 559 non-redundant gene symbols, of which 365 symbols are functionally annotated.ni correction. GO annotations that have p-values less than 0.01 are considered statistically
heterogeneous transcriptional activity of Oct3/4 and its possible inter-dx.doi.org/10.1016/j.ygeno.2013.09.004
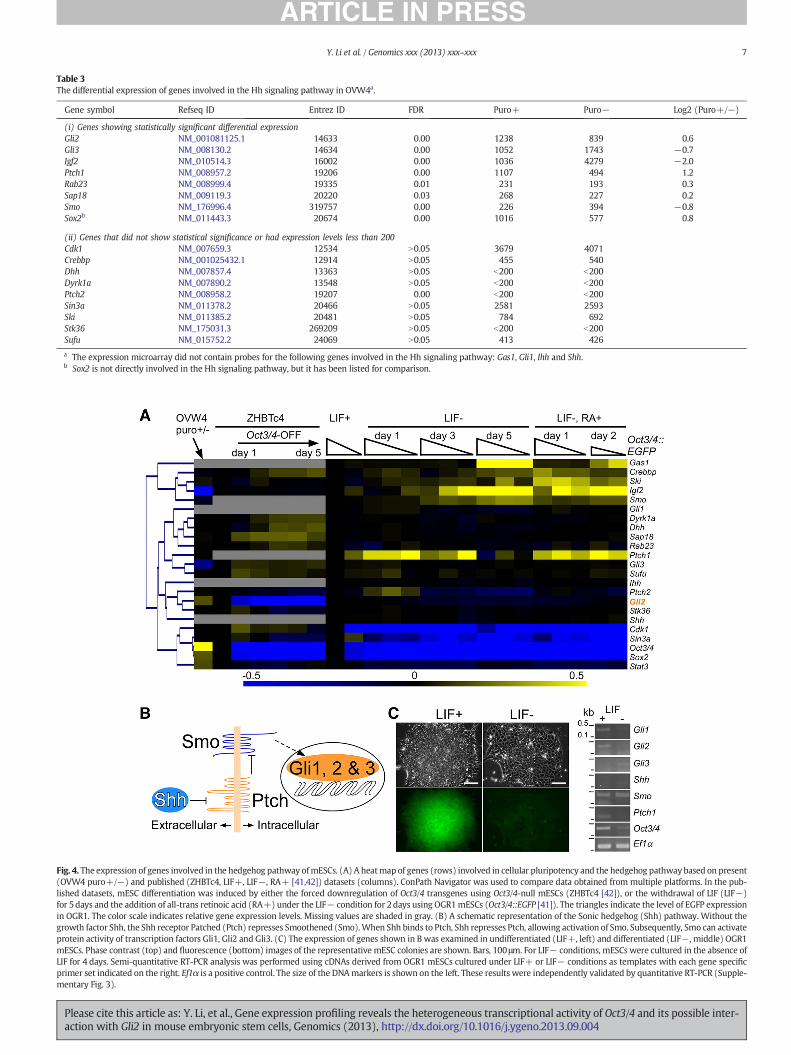
Table 3The differential expression of genes involved in the Hh signaling pathway in OVW4a.
Gene symbol Refseq ID Entrez ID FDR Puro+ Puro− Log2 (Puro+/−)
(i) Genes showing statistically significant differential expressionGli2 NM_001081125.1 14633 0.00 1238 839 0.6Gli3 NM_008130.2 14634 0.00 1052 1743 −0.7Igf2 NM_010514.3 16002 0.00 1036 4279 −2.0Ptch1 NM_008957.2 19206 0.00 1107 494 1.2Rab23 NM_008999.4 19335 0.01 231 193 0.3Sap18 NM_009119.3 20220 0.03 268 227 0.2Smo NM_176996.4 319757 0.00 226 394 −0.8Sox2b NM_011443.3 20674 0.00 1016 577 0.8
(ii) Genes that did not show statistical significance or had expression levels less than 200Cdk1 NM_007659.3 12534 N0.05 3679 4071Crebbp NM_001025432.1 12914 N0.05 455 540Dhh NM_007857.4 13363 N0.05 b200 b200Dyrk1a NM_007890.2 13548 N0.05 b200 b200Ptch2 NM_008958.2 19207 0.00 b200 b200Sin3a NM_011378.2 20466 N0.05 2581 2593Ski NM_011385.2 20481 N0.05 784 692Stk36 NM_175031.3 269209 N0.05 b200 b200Sufu NM_015752.2 24069 N0.05 413 426
a The expression microarray did not contain probes for the following genes involved in the Hh signaling pathway: Gas1, Gli1, Ihh and Shh.b Sox2 is not directly involved in the Hh signaling pathway, but it has been listed for comparison.
Fig. 4. The expression of genes involved in the hedgehog pathway ofmESCs. (A) A heatmap of genes (rows) involved in cellular pluripotency and the hedgehog pathway based on present(OVW4 puro+/−) and published (ZHBTc4, LIF+, LIF−, RA+ [41,42]) datasets (columns). ConPath Navigator was used to compare data obtained from multiple platforms. In the pub-lished datasets, mESC differentiation was induced by either the forced downregulation of Oct3/4 transgenes using Oct3/4-null mESCs (ZHBTc4 [42]), or the withdrawal of LIF (LIF−)for 5days and the addition of all-trans retinoic acid (RA+) under the LIF− condition for 2days using OGR1mESCs (Oct3/4::EGFP [41]). The triangles indicate the level of EGFP expressionin OGR1. The color scale indicates relative gene expression levels. Missing values are shaded in gray. (B) A schematic representation of the Sonic hedgehog (Shh) pathway. Without thegrowth factor Shh, the Shh receptor Patched (Ptch) represses Smoothened (Smo).When Shh binds to Ptch, Shh represses Ptch, allowing activation of Smo. Subsequently, Smo can activateprotein activity of transcription factors Gli1, Gli2 and Gli3. (C) The expression of genes shown in B was examined in undifferentiated (LIF+, left) and differentiated (LIF−, middle) OGR1mESCs. Phase contrast (top) and fluorescence (bottom) images of the representative mESC colonies are shown. Bars, 100 μm. For LIF− conditions, mESCs were cultured in the absence ofLIF for 4 days. Semi-quantitative RT-PCR analysis was performed using cDNAs derived from OGR1 mESCs cultured under LIF+ or LIF− conditions as templates with each gene specificprimer set indicated on the right. Ef1α is a positive control. The size of the DNAmarkers is shown on the left. These results were independently validated by quantitative RT-PCR (Supple-mentary Fig. 3).
7Y. Li et al. / Genomics xxx (2013) xxx–xxx
Please cite this article as: Y. Li, et al., Gene expression profiling reveals the heterogeneous transcriptional activity of Oct3/4 and its possible inter-action with Gli2 in mouse embryonic stem cells, Genomics (2013), http://dx.doi.org/10.1016/j.ygeno.2013.09.004

8 Y. Li et al. / Genomics xxx (2013) xxx–xxx
vertebrates, three orthologs ofDrosophila Hh, i.e.,Desert hedgehog (Dhh),Indian hedgehog (Ihh) and Sonic hedgehog (Shh), have unique roles inembryonic development [62–67]. Shh is the most broadly expressedortholog and is involved in embryogenesis, organogenesis and themaintenance of adult stem cells [68]. Without the Shh ligand, the Shhreceptor, Patched (Ptch), represses anothermembrane-bound receptor,Smoothened (Smo). In mammals, two Ptch isoforms, Ptch1 and 2, exist,although Ptch1 is mainly involved in the Hh signaling pathway [69].When Shh binds to Ptch, Shh represses Ptch, allowing the activation ofSmo. Subsequently, Smo can activate the protein activity of transcrip-tion factors Gli1, Gli2 andGli3. Gli2 is themainmodulator of the Shh sig-nal [70–72]. Gli3 mostly acts as a transcriptional repressor [73].
In accordancewith this knowledge, genes involved in the Hh signal-ing pathway, except forGli2 and Ptch1, (Cdk1, Crebbp,Dhh,Dyrk1a,Gas1,Gli1, Gli3, Igf2, Ihh, Ptch2, Rab23, Sap18, Shh, Sin3a, Ski, Smo, Stk36 andSufu, according to ConPath Navigator) were either constitutivelyexpressed or downregulated in puromycin-positive OVW4 cultures(“puro+”). Furthermore, many of these genes were upregulated whena forced downregulation of Oct3/4 was induced (Crebbp, Dyrk1a, Dhh,Sap18, Rab23, Gli3, Sufu and Cdk1; Fig. 4A) or when LIF was withdrawnfrom the culture (Gas1, Ski, Igf2, Smo, Ptch1 and Ptch2; Fig. 4A). In con-trast to these results, our expression microarray analysis showed thatGli2 and Ptch1 were consistently highly expressed in mESCs with hightranscriptional activity of Oct3/4.
To further validate our expression microarray analysis, we exam-ined the expression of selected genes in the Hh signaling pathway(Fig. 4B) in undifferentiated and differentiated mESCs by sqRT-PCR(Fig. 4C). For this analysis, we used a bulk preparation of OGR1mESCs [27,33,34,37,42] (see Fig. 2) that were maintained under cultureconditions with animal serum in the presence or absence of LIF for4 days. Although significant downregulation of EGFP fluorescence wasobserved in OGR1 maintained without LIF for 4 days (Fig. 4C “LIF+”
on the left vs. “LIF−” on themiddle), EGFP fluorescence did not becomefully undetectable under these conditions.
We found that undifferentiated mESCs expressed Gli1, Gli2, Smo andPtch1 (Fig. 4C right). However, the endogenous expression of Shh wasnot detected,which is consistentwith the fact thatGli2 can be expressedin the absence of a Shh signal [71,72]. The expression of Gli1, Gli2 andPtch1was downregulated 4days after differentiation of mESCs were in-duced, whereas the expression of Gli3 and Smo was upregulated(Fig. 4C, see Supplementary Fig. 3 for quantitative results). Becausethe increased transcription of Gli1 and Ptch1 serves as an indicator ofHh pathway activity [69,74,75], it is suggested with these results thatShh signaling was stimulated in undifferentiated mESCs, but not inmESCs cultured in the absence of LIF for 4 days. Interestingly, whenmESCs were maintained under chemically-defined serum-free (CDSF)conditions [33,52], we observed downregulation of Gli1, Gli2 and Ptch1(data not shown) in thesemESCs. Therefore, animal serummay providea stimulus to activate theHh-mediated signal. However, when recombi-nant Shh was supplemented in a CDSF medium, it failed to provide anysignificant impact on the growth of mESCs (data not shown). Similarly,endogenous activation of the Hh signalwas detected in undifferentiatedhuman ESCs, although exogenously supplied SHH played no significantrole in their self-renewal and pluripotency [76]. The self-renewal ofhuman ESCs is dependent on the TGFβ and bFGF signals [77,78],which are known to interact with the Shh signal [79,80]. Therefore, itis suggested with these observations that the Hh-mediated signalingmay originate from TGFβ and/or bFGF-like activity in animal serum.
Next, we investigated whether the genes involved in the Hh path-way were expressed in other mouse pluripotent stem cells. The mouseteratocarcinoma cell lines F9 (derived from the testis [35]) and P19(derived from postimplantation embryos [36]) consistently expressedGli2, Smo and Ptch1, although the expression level of Gli2 was lower inP19 than in F9 and Gli1 expression was undetectable in P19 (Fig. 5).We could not detect endogenous expression of Shh in F9 or P19(Fig. 5). Because Gli encodes a transcription factor and, interestingly,
Please cite this article as: Y. Li, et al., Gene expression profiling reveals theaction with Gli2 in mouse embryonic stem cells, Genomics (2013), http://
the expression of Gli2was consistently detected in all of the pluripotentstem cells examined, it is suggestedwith these results thatGli2mayplaya novel role in the self-renewal of pluripotent stem cells.
3.4. Gli2 exhibited heterogeneous expression in undifferentiatedmouse em-bryonic stem cells
It is suggested with our expression microarray data that Gli2-positive and Gli2-negative cells may both exist in mESCs maintainedunder standard conditions. Confocal microscopy confirmed that theGli2 protein was localized in the nuclei and exhibited a patchy stainingpattern (Fig. 6A), and that 89% of Gli2-positive mESCs were undifferen-tiated and Oct3/4-positive (Fig. 6B). In addition, 50% of mESCs withreduced expression levels of the Oct3/4 protein also exhibited low ex-pression levels of the Gli2 protein (arrowheads in Fig. 6A). Therefore,Gli2 expression patterns are highly correlated with Oct3/4 expressionpatterns in undifferentiated mESCs. Collectively, we suggest that Gli2may be involved in the network of transcription factors that sustainmESCs self-renewal and pluripotency. However, Gli2 is expected toplay a modulatory role instead of an essential role in mESCs becauseGli2-deficient embryos exhibited defects in body plans but not in celldifferentiation per se [81].
3.5. Forced activation of Gli2 significantly enhanced the proliferation rate ofmouse embryonic stem cells
To gain an insight into the role that Gli2 plays in mESCs, the protein-coding sequence of the Gli2 cDNA was subcloned into a novel expres-sion vector (Fig. 7A) and stably expressed in OGR1 mESCs maintainedunder standard conditions. This vector allows Gli2 to be expressed asa fusion protein with the human estrogen receptor ERT2 [31,32].When 4-hydroxytamoxifen (4OHT) is supplemented in the culture,Gli2 fused with ERT2 will be activated and localized to nuclei. In addi-tion, this vector assures us a strong expression level of the transgeneby the CAG promoter [82] combined with a translational enhancer[45,83] and a transcriptional enhancer [84]. Furthermore, DsRedT3[85,86] is linked with the immediate downstream of the transgene bythe self-cleaving peptide T2A [51] in this vector (Fig. 7A). Therefore,DsRedT3 fluorescence helps us monitor expression levels of Gli2 inreal-time (Fig. 7B).
Nine clones that express Gli2 fused with ERT2 (referred to as Gli2ERhereafter) were used for assays. They exhibited varying levels ofDsRedT3 fluorescence, whereas quantitative (q) RT-PCR indicated thaton average the expression level of Gli2 increased 244 (±48.24 s.e.m.,n = 7) folds in these Gli2ER clones. Parental OGR1 mESCs were usedas a control.When 4OHTwas added to standard cultures in thepresenceof LIF and animal serum for 4days, Gli2ER clones did not exhibit any ap-pearance of cell differentiation (Fig. 7B) and expressed the SSEA1 anti-gen [49] (Fig. 7C). In addition, heterogeneity in the transcriptionalactivity of Oct3/4 was observed in Gli2ER clones treated with 4OHT(Fig. 7B). This was not due to the forced activation of Gli2ER becausemost of the Gli2ER cells maintained the expression of both EGFP andDsRedT3 (Fig. 7B). This result indicates that Gli2 does not regulate het-erogeneous transcriptional activity of Oct3/4. However, Gli2ER clonessignificantly increased their proliferation rate when maintained in thepresence of 4OHT for 4 days (1.59 ± 0.230 s.e.m.-fold increase in thenine Gli2ER clones vs. 1.08 ± 0.0601 s.e.m.-fold increase in OGR1,p b 0.025, Fig. 7D). When five Gli2ER clones that exhibited brightDsRedT3 fluorescence (260 ± 71.03 s.e.m.-fold increase in the Gli2level on average) were selected and independently assayed twice orthree times, we consistently observed a similar increase in their prolif-eration rate (1.47±0.157 s.e.m.-fold increase, n=11, pb0.025). Finally,using five randomly selected Gli2ER clones that were maintained in thepresence or absence of 4OHT for 4 days, expression levels of Oct3/4,Eras and Gsk3β were examined by qRT-PCR (the reason why thesegenes were chosen is described below). As expected from the results
heterogeneous transcriptional activity of Oct3/4 and its possible inter-dx.doi.org/10.1016/j.ygeno.2013.09.004

Fig. 5. The expression of genes involved in the Hh pathway in pluripotent stem cells. Semi-quantitative RT-PCR analysis was performed using cDNAs derived from pluripotent stem cellsindicated on the rightwith each gene specific primer set indicated along the top. Ef1α is a positive control andRT− is the negative control. The size of theDNAmarkers is shownon the left.(A) Mouse ESCs (OGR1) and teratocarcinoma cell lines (F9 and P19) were cultured in a standardmediumwith animal serum. (B) Relative expression levels of genes indicated on the bot-tom were examined by quantifying mean fluorescence intensities of the PCR products shown in A using ImageJ. Smo was used as a reference.
9Y. Li et al. / Genomics xxx (2013) xxx–xxx
presented in Figs. 7B and C, the expression of Oct3/4 was stable underthese conditions (Fig. 7E). However, the expression level of Eras inGli2ER clones under 4OHT+ conditions decreased to about 40% of the
Fig. 6. Oct3/4 and Gli2 are heterogeneously expressed in undifferentiated mESCs. (A) Confocsecond image), nuclei (blue; first row, second image) and Gli2 proteins (red; first row, thir0.4μmon the z-axis. Twenty-one sectionswere stacked and projected for all images. ArrowheadthemESC nuclei that express Oct3/4, but display reduced expression of Gli2. An asterisk indicatecontrol, only secondary antibodieswere used (“2° only”, second row, second and third images). Tis not visible because these nuclei are out of focus. Bars, 10μm. (B) The bar chart indicates the frexpression.
Please cite this article as: Y. Li, et al., Gene expression profiling reveals theaction with Gli2 in mouse embryonic stem cells, Genomics (2013), http://
Eras level in Gli2ER clones under 4OHT-conditions (Fig. 7E). On theother hand, Gsk3β showed a dramatic increase in Gli2ER clones under4OHT+ conditions (Fig. 7E). Perhaps a positive feedback loop exists
al microscopy was used to examine the localization of Oct3/4 proteins (green; first row,d image) in undifferentiated mESCs (first row, first image). Sections were taken everys indicate themESC nuclei with reducedOct3/4 andGli2 expression levels. Arrows indicates themESC nuclei with reduced expression of Oct3/4, but expression of Gli2. As a negativehenuclear staining of three cells in the bottom left corner of the second row, second imageequency (%) of mESC nuclei that show the presence (+) or absence (−) of Oct3/4 and Gli2
heterogeneous transcriptional activity of Oct3/4 and its possible inter-dx.doi.org/10.1016/j.ygeno.2013.09.004

Fig. 7. Forced activation ofGli2 increased themESC proliferation rate. (A) A schematic representation of a novel expression vector is shown. Boxes indicate each functional component andare scaled, except for the box of the Gli2 cDNA [Gli2 (4.6 kb)]. The bar represents a length of 1 kbp. S/MAR, the synthetic scaffold/matrix associated region motifs [81]; CAG, the CMV en-hancer and the chickenβ-actin promoter [79]; Gtx, the Gtxmotifs [17,80]; ERT2, thehuman estrogen receptor [30,31]; 2A, the foot-and-mouth disease virus self-cleaving peptide T2A [50];DsRedT3, the DsRedT3 cDNA [82,83]; Puror, the puromycin N-acetyltransferase gene; pA, the bovine growth hormone polyadenylation signal. (B) Phase contrast (the top row)and fluorescence (the second, third and bottom rows) images representing mESC clones that have the expression vector shown in A stably integrated in the genome and weremaintained in the presence (4OHT+) or absence (4OHT−) of 4-hydroxytamoxifen (4OHT) are shown. Fluorescence images shown on the second row indicate transcriptional activityofOct3/4 (Oct3/4::EGFP), whereas images on the third row indicate transcriptional activity of the transgenes shown in A (CAG::GEDP). These green and red fluorescence images aremergedon the bottom row. Bars, 20 μm. (C) Phase contrast (the top and third rows) and fluorescence (the second and bottom rows) images of one of themESC clones maintainedwith (the thirdand bottom rows) or without (the top and the second rows) 4OHT are shown. Fluorescence images indicate localization of the SSEA1 antigen (SSEA1, green) and cellular nuclei (DNA,blue). Bars, 20 μm. (D) Mouse ESCs indicated on the bottom were plated in duplicate. Cell numbers in cultures supplemented with 4OHT for 4 days were divided by those without4OHT. OGR1 was used to generate nine mESC clones (Gli2ER) that have the expression vector shown in A stably integrated. Four Gli2ER clones were plated without 4OHT in duplicateand cell numbers were counted to estimate the plating error (Gli2ER w/o 4OHT). Error bars represent standard errors of the mean. (E) Five Gli2ER clones were randomly chosen toexamine relative expression levels of genes indicated on the bottom under conditions with (+, yellow) or without (−, blue) 4OHT. The averaged expression level of each gene under4OHT− conditions was normalized to 1. Ef1α was used as a reference for the 2−ΔΔCt method. Error bars represent standard errors of the mean.
10 Y. Li et al. / Genomics xxx (2013) xxx–xxx
betweenGsk3β andGli2 becauseGli2 is one of theGsk3β substrates andtargeted on proteasome-mediated processing [87].
3.6. The possible role that Gli2 plays in mouse embryonic stem cells
Gli1 was initially identified due to its amplification in human glio-blastomas [88]. Two homologues of Gli1, Gli2 and Gli3, were alsoexpressed in human glioblastomas [89]. The overexpression of Gli2 inthe skin of transgenic mice induced the development of basal cell carci-nomas, which are the most common skin tumors in Caucasians [90]. Inaddition, the overexpression of GLI2 in a human prostate epithelial cellline resulted in growth acceleration and cell cycle progression [91].Therefore, it is possible to speculate that Gli2 may be involved in thetumor-like growth of ESCs.
The tumor-like growth of mESCs is dependent on the activity of Erasvia the activation of Akt1 [92]. Because Akt1 inactivates Gsk3β [93–95]and Gsk3β inhibits c-Myc (Myc) [93,96], Eras may indirectly activate c-Myc, which subsequently drives the self-renewal ofmESCs [97]. Howev-er, human ERAS is not expressed in human ESCs [98,99]. Therefore, wehypothesize that other genetic factors drive the tumor-like growth ofboth mouse and human ESCs. Interestingly, our data showed thatGli2ER clones significantly increased their proliferation rate (Fig. 7D)while they decreased the expression level of Eras (Fig. 7E) under4OHT+ conditions. Although it needs to be addressed whether the in-teraction between Gli2 and Eras is direct and whether a feedback loopexist between Eras and Gsk3β or not, we suggest with our data thatGli2may be involved in the tumor-like growth of ESCs.
Please cite this article as: Y. Li, et al., Gene expression profiling reveals theaction with Gli2 in mouse embryonic stem cells, Genomics (2013), http://
We recently demonstrated that mESCs cultured under chemicallydefined serum-free conditions downregulated Eras and c-Myc andfailed to grow into teratomas [33]. Interestingly, mESCs maintainedunder serum-free conditions restored their tumor-like growth with-out the upregulation of Eras and c-Mycwhen the culture was supple-mented with a Gsk3β inhibitor [33]. Therefore, this result stronglysupports our hypothesis that other genetic factors are involved inpromoting the tumor-like growth of ESCs. Because the serum-freeculture provides a unique platform to screen genetic factors respon-sible for teratoma development in mESCs, further study using thisculture systemmay identify the role of Gli2 in the tumor-like growthof mESCs.
4. Conclusions
A standard culture of mESCs contains a cell population with re-duced Oct3/4 transcriptional activity, which leads to the generationof subpopulations with expression profiles that are similar to differ-entiated cells. Heterogeneity in the transcriptional activity of Oct3/4was dynamic. Oct3/4 plays an essential role in maintaining basal cel-lular transcriptional activities while suppressing the expression ofgenes involved in cell differentiation. The expression of Gli2, Ptch1and Smo was consistently detected in pluripotent stem cells exam-ined in this study. Gli2 expression patterns are highly correlatedwith Oct3/4 expression patterns in undifferentiated mESCs. Forcedactivation ofGli2 in mESCs increased their proliferation rate. It is sug-gested with our results that Gli2 may play a novel role in the self-renewal of pluripotent stem cells.
heterogeneous transcriptional activity of Oct3/4 and its possible inter-dx.doi.org/10.1016/j.ygeno.2013.09.004
11Y. Li et al. / Genomics xxx (2013) xxx–xxx
Description of additional data files
“Li_etal_SupInfo.docx” provides a list of primer sets used in thisstudy (Supplementary Table 1), supplementary figures 1, 2 and 3, andsupplementary materials and methods.
“Li_et_al_SupTable2.pdf” provides a list of 4,606 differentially 501expressed genes (Supplementary Table 2). Supplementary data relatedto this article can be found online at: http://dx.doi.org/10.1016/j.ygeno.2013.09.004.
Competing interests
All authors declare no competing interest.
Authors' contributions
Conception and design: YL, TST. Data collection: YL, TA, TST. Dataanalysis: YL, JD, RM, TST. Contribution to reagents/materials/analysistools: DL, MB, FW, RM, TST. Manuscript preparation: YL, MB, RM, TST.
Acknowledgments
The authors would like to thank Paichi Tsai, Betty Ujhelyi, MayandiSivaguru, and Fuming Pan for their technical assistance, and MinoruS. H. Ko, William L. Stanford, Matthew B. Wheeler, and GregoryL. Timp for kindly providing reagents. This work was supported bythe American Cancer Society Illinois Division (207962), the Universityof Illinois at Urbana–Champaign, the USDA National Institute of Foodand Agriculture Hatch Project #ILLU-538-323, the Illinois RegenerativeMedicine Institute and the National Science Foundation (DBI-1256052).YL is a recipient of the AYRE International Research and Learning Fellow-ship from the College of Agricultural, Consumer and Environmental Sci-ences, UIUC.
References
[1] H. Niwa, K. Ogawa, D. Shimosato, K. Adachi, A parallel circuit of LIF signalling path-ways maintains pluripotency of mouse ES cells, Nature 460 (2009) 118–122.
[2] Q.L. Ying, J. Wray, J. Nichols, L. Batlle-Morera, B. Doble, J. Woodgett, P. Cohen, A.Smith, The ground state of embryonic stem cell self-renewal, Nature 453 (2008)519–523.
[3] I. Chambers, J. Silva, D. Colby, J. Nichols, B. Nijmeijer, M. Robertson, J. Vrana, K. Jones,L. Grotewold, A. Smith, Nanog safeguards pluripotency and mediates germline de-velopment, Nature 450 (2007) 1230–1234.
[4] A.M. Singh, T. Hamazaki, K.E. Hankowski, N. Terada, A heterogeneous expressionpattern for Nanog in embryonic stem cells, Stem Cells 25 (2007) 2534–2542.
[5] Y. Toyooka, D. Shimosato, K. Murakami, K. Takahashi, H. Niwa, Identification andcharacterization of subpopulations in undifferentiated ES cell culture, Development135 (2008) 909–918.
[6] M.G. Carter, C.A. Stagg, G. Falco, T. Yoshikawa, U.C. Bassey, K. Aiba, L.V. Sharova, N.Shaik, M.S. Ko, An in situ hybridization-based screen for heterogeneously expressedgenes in mouse ES cells, Gene Expr. Patterns 8 (2008) 181–198.
[7] B. Payer, S.M. Chuva de Sousa Lopes, S.C. Barton, C. Lee, M. Saitou, M.A. Surani, Gen-eration of stella-GFP transgenic mice: a novel tool to study germ cell development,Genesis 44 (2006) 75–83.
[8] T. Furusawa, M. Ikeda, F. Inoue, K. Ohkoshi, T. Hamano, T. Tokunaga, Geneexpression profiling of mouse embryonic stem cell subpopulations, Biol. Reprod.75 (2006) 555–561.
[9] T. Furusawa, K. Ohkoshi, C. Honda, S. Takahashi, T. Tokunaga, Embryonic stem cellsexpressing both platelet endothelial cell adhesion molecule-1 and stage-specificembryonic antigen-1 differentiate predominantly into epiblast cells in a chimericembryo, Biol. Reprod. 70 (2004) 1452–1457.
[10] G. Falco, S.-L. Lee, I. Stanghellini, U.C. Bassey, T. Hamatani, M.S.H. Ko, Zscan4: a novelgene expressed exclusively in late 2-cell embryos and embryonic stem cells, Dev.Biol. 307 (2007) 539–550.
[11] M. Zalzman, G. Falco, L.V. Sharova, A. Nishiyama, M. Thomas, S.L. Lee, C.A. Stagg, H.G.Hoang, H.T. Yang, F.E. Indig, R.P. Wersto, M.S. Ko, Zscan4 regulates telomere elonga-tion and genomic stability in ES cells, Nature 464 (2010) 858–863.
[12] A. Suzuki, A. Raya, Y. Kawakami, M. Morita, T. Matsui, K. Nakashima, F.H. Gage, C.Rodriguez-Esteban, J.C. Belmonte, Maintenance of embryonic stem cell pluripotencyby Nanog-mediated reversal of mesoderm specification, Nat. Clin. Pract. Cardiovasc.Med. 3 (Suppl. 1) (2006) S114–S122.
[13] A. Suzuki, A. Raya, Y. Kawakami, M. Morita, T. Matsui, K. Nakashima, F.H. Gage, C.Rodriguez-Esteban, J.C. Izpisua Belmonte, Nanog binds to Smad1 and blocks bone
Please cite this article as: Y. Li, et al., Gene expression profiling reveals theaction with Gli2 in mouse embryonic stem cells, Genomics (2013), http://
morphogenetic protein-induced differentiation of embryonic stem cells, Proc. Natl.Acad. Sci. U. S. A. 103 (2006) 10294–10299.
[14] M.A. Canham, A.A. Sharov, M.S. Ko, J.M. Brickman, Functional heterogeneity of em-bryonic stem cells revealed through translational amplification of an early endoder-mal transcript, PLoS Biol. 8 (2010) e1000379.
[15] K. Hayashi, S.M. Lopes, F. Tang, M.A. Surani, Dynamic equilibrium and heterogeneityof mouse pluripotent stem cells with distinct functional and epigenetic states, CellStem Cell 3 (2008) 391–401.
[16] O.R. Davies, C.Y. Lin, A. Radzisheuskaya, X. Zhou, J. Taube, G. Blin, A. Waterhouse, A.J.Smith, S. Lowell, Tcf15 primes pluripotent cells for differentiation, Cell Rep. 3 (2013)472–484.
[17] T.S. Tanaka, R.E. Davey, Q. Lan, P.W. Zandstra, W.L. Stanford, Development of agene-trap vector with a highly sensitive fluorescent protein reporter system forexpression profiling, Genesis 46 (2008) 347–356.
[18] A. Filipczyk, K. Gkatzis, J. Fu, P.S. Hoppe, H. Lickert, K. Anastassiadis, T. Schroeder,Biallelic expression of nanog protein in mouse embryonic stem cells, Cell StemCell 13 (2013) 12–13.
[19] Y. Li, T.S. Tanaka, Self-renewal, pluripotency and tumorigenesis in pluripotent stemcells revisited, in: C. Atwood (Ed.), Embryonic Stem Cells— Recent Advances in Plu-ripotent Stem Cell-Based Regenerative Medicine, InTech, 2011, pp. 339–358.
[20] T.S. Tanaka, Transcriptional heterogeneity in mouse embryonic stem cells, Reprod.Fertil. Dev. 21 (2009) 67–75.
[21] T. Graf, M. Stadtfeld, Heterogeneity of embryonic and adult stem cells, Cell Stem Cell3 (2008) 480–483.
[22] S. Huang, Non-genetic heterogeneity of cells in development: more than just noise,Development 136 (2009) 3853–3862.
[23] A.D. Bolzan, Chromosomal aberrations involving telomeres and interstitial telomericsequences, Mutagenesis 27 (2012) 1–15.
[24] R.T. Hagelstrom, K.B. Blagoev, L.J. Niedernhofer, E.H. Goodwin, S.M. Bailey, Hypertelomere recombination accelerates replicative senescence and may promote pre-mature aging, Proc. Natl. Acad. Sci. U. S. A. 107 (2010) 15768–15773.
[25] P. Navarro, N. Festuccia, D. Colby, A. Gagliardi, N.P. Mullin, W. Zhang, V.Karwacki-Neisius, R. Osorno, D. Kelly, M. Robertson, I. Chambers, OCT4/SOX2-independent Nanog autorepression modulates heterogeneous Nanog gene expres-sion in mouse ES cells, EMBO J. 31 (2012) 4547–4562.
[26] K.E. Galvin-Burgess, E.D. Travis, K.E. Pierson, J.L. Vivian, TGF-beta-superfamily signal-ing regulates embryonic stem cell heterogeneity: self-renewal as a dynamic andregulated equilibrium, Stem Cells 31 (2013) 48–58.
[27] F. Chowdhury, Y. Li, Y.-C. Poh, T. Yokohama-Tamaki, N. Wang, T.S. Tanaka, Soft sub-strates promote homogeneous self-renewal of embryonic stem cells via downregu-lating cell-matrix tractions, PLoS ONE 5 (2010) e15655.
[28] D. Huh, J. Paulsson, Random partitioning of molecules at cell division, Proc. Natl.Acad. Sci. U. S. A. 108 (2011) 15004–15009.
[29] D. Huh, J. Paulsson, Non-genetic heterogeneity from stochastic partitioning at celldivision, Nat. Genet. 43 (2011) 95–100.
[30] T. Nagai, K. Ibata, E.S. Park, M. Kubota, K. Mikoshiba, A.Miyawaki, A variant of yellowfluorescent protein with fast and efficient maturation for cell-biological applications,Nat. Biotechnol. 20 (2002) 87–90.
[31] R. Feil, J. Brocard, B. Mascrez, M. LeMeur, D. Metzger, P. Chambon, Ligand-activatedsite-specific recombination in mice, Proc. Natl. Acad. Sci. U. S. A. 93 (1996)10887–10890.
[32] M.E. McLaughlin, G.M. Kruger, K.L. Slocum, D. Crowley, N.A. Michaud, J. Huang, M.Magendantz, T. Jacks, The Nf2 tumor suppressor regulates cell–cell adhesion duringtissue fusion, Proc. Natl. Acad. Sci. U. S. A. 104 (2007) 3261–3266.
[33] Y. Li, T. Yokohama-Tamaki, T.S. Tanaka, Short-term serum-free culture reveals thatinhibition of Gsk3beta induces the tumor-like growth of mouse embryonic stemcells, PLoS ONE 6 (2011) e21355.
[34] C. Liu, P. Tsai, A.M. Garcia, B. Logeman, T.S. Tanaka, A possible role of ReproductiveHo-meobox 6 in primordial germ cell differentiation, Int. J. Dev. Biol. 55 (2011) 909–916.
[35] E.G. Bernstine, M.L. Hooper, S. Grandchamp, B. Ephrussi, Alkaline phosphatase activ-ity in mouse teratoma, Proc. Natl. Acad. Sci. U. S. A. 70 (1973) 3899–3903.
[36] M.W. McBurney, B.J. Rogers, Isolation of male embryonal carcinoma cells and theirchromosome replication patterns, Dev. Biol. 89 (1982) 503–508.
[37] F. Chowdhury, S. Na, D. Li, Y.C. Poh, T.S. Tanaka, F. Wang, N. Wang, Material proper-ties of the cell dictate stress-induced spreading and differentiation in embryonicstem cells, Nat. Mater. 9 (2010) 82–88.
[38] T.S. Tanaka, K. Ikenishi, Possible role of the 38 kDa protein, lacking in thegastrula-arrested Xenopus mutant, in gastrulation, Dev. Growth Differ. 44 (2002)23–33.
[39] T.S. Tanaka, T. Tatsuta, K. Ikenishi, Characterization and localization of trupomyosinproteins in Xenopus embryos with specific antibodies, Dev. Growth Differ. 37 (1995)111–122.
[40] Y. Benjamini, Y. Hochberg, Controlling the false discovery rate: a practical and power-ful approach to multiple testing, J. R. Stat. Soc. Ser. B Methodol. 57 (1995) 289–300.
[41] A.I. Saeed, V. Sharov, J. White, J. Li, W. Liang, N. Bhagabati, J. Braisted, M. Klapa, T.Currier, M. Thiagarajan, A. Sturn, M. Snuffin, A. Rezantsev, D. Popov, A. Ryltsov, E.Kostukovich, I. Borisovsky, Z. Liu, A. Vinsavich, V. Trush, J. Quackenbush, TM4: a free,open-source system for microarray data management and analysis, Biotechniques34 (2003) 374–378.
[42] E. Walker, M. Ohishi, R.E. Davey, W. Zhang, P.A. Cassar, T.S. Tanaka, S.D. Der, Q.Morris, T.R. Hughes, P.W. Zandstra, W.L. Stanford, Prediction and testing of noveltranscriptional networks regulating embryonic stem cell self-renewal and commit-ment, Cell Stem Cell 1 (2007) 71–86.
[43] R. Matoba, H. Niwa, S. Masui, S. Ohtsuka, M.G. Carter, A.A. Sharov, M.S. Ko, Dissectingoct3/4-regulated gene networks in embryonic stem cells by expression profiling,PLoS ONE 1 (2006) e26.
heterogeneous transcriptional activity of Oct3/4 and its possible inter-dx.doi.org/10.1016/j.ygeno.2013.09.004
12 Y. Li et al. / Genomics xxx (2013) xxx–xxx
[44] D. Martin, C. Brun, E. Remy, P. Mouren, D. Thieffry, B. Jacq, GOToolBox: functionalanalysis of gene datasets based on Gene Ontology, Genome Biol. 5 (2004) R101.
[45] T.S. Tanaka, R.E. Davey, Q. Lan, P.W. Zandstra, W.L. Stanford, Development of a genetrap vector with a highly-sensitive fluorescent protein reporter system aiming forthe real-time single cell expression profiling, Genesis 46 (2008) 347–356.
[46] T.S. Tanaka, F. Nishiumi, T. Komiya, K. Ikenishi, Characterization of the 38 kDa pro-tein lacking in gastrula-arrested mutant Xenopus embryos, Int. J. Dev. Biol. 54(2010) 1347–1353.
[47] T.S. Tanaka, T. Kunath, W.L. Kimber, S.A. Jaradat, C.A. Stagg, M. Usuda, T. Yokota, H.Niwa, J. Rossant, M.S. Ko, Gene expression profiling of embryo-derived stem cells re-veals candidate genes associated with pluripotency and lineage specificity, GenomeRes. 12 (2002) 1921–1928.
[48] J. Nichols, B. Zevnik, K. Anastassiadis, H. Niwa, D. Klewe-Nebenius, I. Chambers, H.Scholer, A. Smith, Formation of pluripotent stem cells in themammalian embryo de-pends on the POU transcription factor Oct4, Cell 95 (1998) 379–391.
[49] D. Solter, B.B. Knowles, Monoclonal antibody defining a stage-specific mouse em-bryonic antigen (SSEA-1), Proc. Natl. Acad. Sci. U. S. A. 75 (1978) 5565–5569.
[50] Y.I. Yeom, G. Fuhrmann, C.E. Ovitt, A. Brehm, K. Ohbo, M. Gross, K. Hubner, H.R.Scholer, Germline regulatory element of Oct-4 specific for the totipotent cycle ofembryonal cells, Development 122 (1996) 881–894.
[51] A.L. Szymczak, C.J. Workman, Y. Wang, K.M. Vignali, S. Dilioglou, E.F. Vanin, D.A.A.Vignali, Correction of multi-gene deficiency in vivo using a single ‘self-cleaving’ 2Apeptide-based retroviral vector, Nat. Biotechnol. 22 (2004) 589–594.
[52] M. Furue, T. Okamoto, Y. Hayashi, H. Okochi, M. Fujimoto, Y. Myoishi, T. Abe,K. Ohnuma, G.H. Sato, M. Asashima, J.D. Sato, Leukemia inhibitory factor as ananti-apoptotic mitogen for pluripotent mouse embryonic stem cells in aserum-free medium without feeder cells, In Vitro Cell. Dev. Biol. Anim. 41(2005) 19–28.
[53] R. Raz, C.K. Lee, L.A. Cannizzaro, P. d'Eustachio, D.E. Levy, Essential role of STAT3 forembryonic stem cell pluripotency, Proc. Natl. Acad. Sci. U. S. A. 96 (1999)2846–2851.
[54] Y.H. Loh, Q. Wu, J.L. Chew, V.B. Vega, W. Zhang, X. Chen, G. Bourque, J. George, B.Leong, J. Liu, K.Y. Wong, K.W. Sung, C.W. Lee, X.D. Zhao, K.P. Chiu, L. Lipovich, V.A.Kuznetsov, P. Robson, L.W. Stanton, C.L. Wei, Y. Ruan, B. Lim, H.H. Ng, The Oct4and Nanog transcription network regulates pluripotency in mouse embryonicstem cells, Nat. Genet. 38 (2006) 431–440.
[55] J. Nichols, A. Smith, Pluripotency in the embryo and in culture, Cold Spring Harb.Perspect. Biol. 4 (2012) a008128.
[56] K.D. Dahlquist, N. Salomonis, K. Vranizan, S.C. Lawlor, B.R. Conklin, GenMAPP, a newtool for viewing and analyzing microarray data on biological pathways, Nat. Genet.31 (2002) 19–20.
[57] Y. Nakatake, S. Fujii, S. Masui, T. Sugimoto, S. Torikai-Nishikawa, K. Adachi, H. Niwa,Kinetics of drug selection systems in mouse embryonic stem cells, BMC Biotechnol.13 (2013) 64.
[58] D.A. Faddah, H. Wang, A.W. Cheng, Y. Katz, Y. Buganim, R. Jaenisch, Single-cell anal-ysis reveals that expression of nanog is biallelic and equally variable as that of otherpluripotency factors in mouse ESCs, Cell Stem Cell 13 (2013) 23–29.
[59] K. Hailesellasse Sene, C.J. Porter, G. Palidwor, C. Perez-Iratxeta, E.M. Muro, P.A.Campbell, M.A. Rudnicki, M.A. Andrade-Navarro, Gene function in early mouse em-bryonic stem cell differentiation, BMC Genomics 8 (2007) 85.
[60] S. Meyer, J. Nolte, L. Opitz, G. Salinas-Riester, W. Engel, Pluripotent embryonic stemcells and multipotent adult germline stem cells reveal similar transcriptomes in-cluding pluripotency-related genes, Mol. Hum. Reprod. 16 (2010) 846–855.
[61] P.W. Ingham, A.P. McMahon, Hedgehog signaling in animal development: para-digms and principles, Genes Dev. 15 (2001) 3059–3087.
[62] M.J. Bitgood, L. Shen, A.P. McMahon, Sertoli cell signaling by desert hedgehog regu-lates the male germline, Curr. Biol. 6 (1996) 298–304.
[63] H.H. Yao, C. Tilmann, G.Q. Zhao, B. Capel, The battle of the sexes: opposing pathwaysin sex determination, Novartis Found. Symp. 244 (2002) 187–198.discussion 198–206, 253–187.
[64] M. Wijgerde, M. Ooms, J.W. Hoogerbrugge, J.A. Grootegoed, Hedgehog signalingin mouse ovary: Indian hedgehog and desert hedgehog from granulosa cellsinduce target gene expression in developing theca cells, Endocrinology 146(2005) 3558–3566.
[65] M.A. Dyer, S.M. Farrington, D. Mohn, J.R. Munday, M.H. Baron, Indian hedgehogactivates hematopoiesis and vasculogenesis and can respecify prospectiveneurectodermal cell fate in the mouse embryo, Development 128 (2001)1717–1730.
[66] G.R. van den Brink, Hedgehog signaling in development and homeostasis of the gas-trointestinal tract, Physiol. Rev. 87 (2007) 1343–1375.
[67] A. Vortkamp, K. Lee, B. Lanske, G.V. Segre, H.M. Kronenberg, C.J. Tabin, Regulation ofrate of cartilage differentiation by Indian hedgehog and PTH-related protein, Science273 (1996) 613–622.
[68] M. Varjosalo, J. Taipale, Hedgehog: functions and mechanisms, Genes Dev. 22(2008) 2454–2472.
[69] S.W. Choy, S.H. Cheng, Hedgehog signaling, Vitam. Horm. 88 (2012) 1–23.[70] C.B. Bai, W. Auerbach, J.S. Lee, D. Stephen, A.L. Joyner, Gli2, but not Gli1, is required
for initial Shh signaling and ectopic activation of the Shh pathway, Development129 (2002) 4753–4761.
Please cite this article as: Y. Li, et al., Gene expression profiling reveals theaction with Gli2 in mouse embryonic stem cells, Genomics (2013), http://
[71] C.B. Bai, A.L. Joyner, Gli1 can rescue the in vivo function of Gli2, Development 128(2001) 5161–5172.
[72] A. Ruiz i Altaba, Combinatorial Gli gene function in floor plate and neuronal induc-tions by sonic hedgehog, Development 125 (1998) 2203–2212.
[73] A. Ruiz i Altaba, C. Mas, B. Stecca, The Gli code: an information nexus regulating cellfate, stemness and cancer, Trends Cell Biol. 17 (2007) 438–447.
[74] A. Shaw, J. Gipp, W. Bushman, The sonic hedgehog pathway stimulates prostatetumor growth by paracrine signaling and recapitulates embryonic gene expressionin tumor myofibroblasts, Oncogene 28 (2009) 4480–4490.
[75] C.J. Tabin, A.P. McMahon, Recent advances in hedgehog signalling, Trends Cell Biol. 7(1997) 442–446.
[76] S.M. Wu, A.B. Choo, M.G. Yap, K.K. Chan, Role of sonic hedgehog signaling and theexpression of its components in human embryonic stem cells, Stem Cell Res. 4(2010) 38–49.
[77] T.E. Ludwig, V. Bergendahl, M.E. Levenstein, J. Yu, M.D. Probasco, J.A. Thomson,Feeder-independent culture of human embryonic stem cells, Nat. Methods 3(2006) 637–646.
[78] T.E. Ludwig, M.E. Levenstein, J.M. Jones, W.T. Berggren, E.R. Mitchen, J.L. Frane, L.J.Crandall, C.A. Daigh, K.R. Conard, M.S. Piekarczyk, R.A. Llanas, J.A. Thomson, Deriva-tion of human embryonic stem cells in defined conditions, Nat. Biotechnol. 24(2006) 185–187.
[79] S. Dennler, J. Andre, I. Alexaki, A. Li, T. Magnaldo, P. ten Dijke, X.J. Wang, F.Verrecchia, A. Mauviel, Induction of sonic hedgehog mediators by transforminggrowth factor-beta: Smad3-dependent activation of Gli2 and Gli1 expressionin vitro and in vivo, Cancer Res. 67 (2007) 6981–6986.
[80] A. Pirskanen, J.C. Kiefer, S.D. Hauschka, IGFs, insulin, Shh, bFGF, and TGF-beta1 interactsynergistically to promote somitemyogenesis in vitro, Dev. Biol. 224 (2000) 189–203.
[81] R. Mo, A.M. Freer, D.L. Zinyk, M.A. Crackower, J. Michaud, H.H. Heng, K.W. Chik, X.M.Shi, L.C. Tsui, S.H. Cheng, A.L. Joyner, C. Hui, Specific and redundant functions of Gli2and Gli3 zinc finger genes in skeletal patterning and development, Development124 (1997) 113–123.
[82] H. Niwa, K. Yamamura, J. Miyazaki, Efficient selection for high-expressiontransfectants with a novel eukaryotic vector, Gene 108 (1991) 193–199.
[83] S.A. Chappell, G.M. Edelman, V.P. Mauro, A 9-nt segment of a cellular mRNA canfunction as an internal ribosome entry site (IRES) and when present in linked mul-tiple copies greatly enhances IRES activity, Proc. Natl. Acad. Sci. U. S. A. 97 (2000)1536–1541.
[84] J. Bode, Y. Kohwi, L. Dickinson, T. Joh, D. Klehr, C. Mielke, T. Kohwi-Shigematsu, Bio-logical significance of unwinding capability of nuclear matrix-associating DNAs, Sci-ence 255 (1992) 195–197.
[85] K. Vintersten, C. Monetti, M. Gertsenstein, P. Zhang, L. Laszlo, S. Biechele, A. Nagy,Mouse in red: red fluorescent protein expression in mouse ES cells, embryos, andadult animals, Genesis 40 (2004) 241–246.
[86] B.J. Bevis, B.S. Glick, Rapidly maturing variants of the Discosoma red fluorescent pro-tein (DsRed), Nat. Biotechnol. 20 (2002) 83–87.
[87] J. Jiang, Regulation of Hh/Gli signaling by dual ubiquitin pathways, Cell Cycle 5(2006) 2457–2463.
[88] K.W. Kinzler, J.M. Ruppert, S.H. Bigner, B. Vogelstein, The GLI gene is a member ofthe Kruppel family of zinc finger proteins, Nature 332 (1988) 371–374.
[89] V. Clement, P. Sanchez, N. de Tribolet, I. Radovanovic, A. Ruiz i Altaba, HEDGEHOG-GLI1signaling regulates human glioma growth, cancer stem cell self-renewal, and tumori-genicity, Curr. Biol. 17 (2007) 165–172.
[90] M. Grachtchouk, R. Mo, S. Yu, X. Zhang, H. Sasaki, C.C. Hui, A.A. Dlugosz, Basal cellcarcinomas in mice overexpressing Gli2 in skin, Nat. Genet. 24 (2000) 216–217.
[91] S. Thiyagarajan, N. Bhatia, S. Reagan-Shaw, D. Cozma, A. Thomas-Tikhonenko, N.Ahmad, V.S. Spiegelman, Role of GLI2 transcription factor in growth and tumorige-nicity of prostate cells, Cancer Res. 67 (2007) 10642–10646.
[92] K. Takahashi, K. Mitsui, S. Yamanaka, Role of ERas in promoting tumour-like proper-ties in mouse embryonic stem cells, Nature 423 (2003) 541–545.
[93] M. Bechard, S. Dalton, Subcellular localization of glycogen synthase kinase 3betacontrols embryonic stem cell self-renewal, Mol. Cell. Biol. 29 (2009) 2092–2104.
[94] D. Wu, W. Pan, GSK3: a multifaceted kinase in Wnt signaling, Trends Biochem. Sci.35 (2010) 161–168.
[95] D.A. Cross, D.R. Alessi, P. Cohen, M. Andjelkovich, B.A. Hemmings, Inhibition of gly-cogen synthase kinase-3 by insulin mediated by protein kinase B, Nature 378(1995) 785–789.
[96] T.C. He, A.B. Sparks, C. Rago, H. Hermeking, L. Zawel, L.T. da Costa, P.J. Morin, B.Vogelstein, K.W. Kinzler, Identification of c-MYC as a target of the APC pathway, Sci-ence 281 (1998) 1509–1512.
[97] P. Cartwright, C. McLean, A. Sheppard, D. Rivett, K. Jones, S. Dalton, LIF/STAT3 con-trols ES cell self-renewal and pluripotency by a Myc-dependent mechanism, Devel-opment 132 (2005) 885–896.
[98] T. Kameda, J.A. Thomson, Human ERas gene has an upstream prematurepolyadenylation signal that results in a truncated, noncoding transcript, Stem Cells23 (2005) 1535–1540.
[99] Y. Tanaka, T. Ikeda, Y. Kishi, S. Masuda, H. Shibata, K. Takeuchi, M. Komura, T.Iwanaka, S. Muramatsu, Y. Kondo, K. Takahashi, S. Yamanaka, Y. Hanazono, ERas isexpressed in primate embryonic stem cells but not related to tumorigenesis, CellTransplant. 18 (2009) 381–389.
heterogeneous transcriptional activity of Oct3/4 and its possible inter-dx.doi.org/10.1016/j.ygeno.2013.09.004