Gene expression…
38
Gene expression… - Pooja Gupta
-
Upload
gavin-gregory -
Category
Documents
-
view
43 -
download
1
description
Gene expression…. - Pooja Gupta. Gene is expressed by transcribing DNA into single-stranded mRNA mRNA is later translated into a protein Cells are different because of differential gene expression About 40% of human genes are expressed at one time - PowerPoint PPT Presentation
Transcript of Gene expression…

Gene expression…
- Pooja Gupta

Gene is expressed by transcribing DNA into single-stranded mRNA
mRNA is later translated into a protein
Cells are different because of differential gene expression
About 40% of human genes are expressed at one time
mRNA expression represents dynamic aspects of cell

Gene expression
Protein
mRNA
DNA
transcription
translation
CCTGAGCCAACTATTGATGAA
PEPTIDE
CCUGAGCCAACUAUUGAUGAA

mRNA Stability
The amount of translatable mRNA is aproduct of both synthesis and decay:
Synthesis DecayDNA → mRNA→ Nucleotides

Synthesis Decay →[mRNA] →
When d(mRNA)/dt = 0;Rate of synthesis = Rate of decay
∴mRNA at “Steady State”

Regulation of [mRNA] Any change from one steady-state to another may be due to a change in the rate of synthesis or the rate of decay, or both. Therefore, when mRNA levels increase, we are unable to conclude that the increase was due to increased transcription.
However, this change in [mRNA] usually leads to a change in translation (change in functional capability of cell).

Various methods for detection and quantification of mRNA are available, however they are differ by:
• Accuracy
• Sensitivity
• Throughput
Detection and quantification of RNA transcripts
Overview
Gene expression– mRNA– protein
Northern BlotsRPART-PCRSAGEMicroArray

Ultimate goal is to develop the ability to scan the mRNAexpression state of all the genes for a particular genomesimultaneously

Northern BlotsNorthern Blots
Slot Blot
Northern Blot
Cellular RNA separated by gel electrophoresis Separated mRNA pattern transferred to nylon membrane Hybridized with radioactive probe (made from cDNA clone)

RNase Protection Assay More sensitive, more precise than Northern
• Synthetic, radioactive RNA transcribedfrom cDNA clone • Probe hybridized with mRNA in solution
• RNase destroys unpaired probe
• “Protected” probe separated by hi-res gel electrophoresis

RPA (continue)
• Presence of protected band indicatespresence of mRNA
• Intensity indicates steady-state [mRNA]
• Combine several probes to several mRNAs
• Identify by characteristic size
• Very sensitive, very specific!

RT-PCR
Measures relative expression of mRNA
1. Isolate and purify mRNA2. reverse transcription3. PCR amplification4. run on gel and probe/hybridize

RT-PCR
RT-PCR
Why use RT?Can observe very low levels of expression
Requires very small amounts of mRNA
The bad…Potential expression-level skew due to non-linearity of PCR
Have to design multiple custom primers for each gene.

SAGE

SAGE

SAGE
Tags are isolated and concatermized.
Relative expression levels can be compared between cells in different states.
SAGE
--gene to tag mappinghttp://www.ncbi.nlm.nih.gov/SAGE/SAGEcid.cgi?cid=28726

Microarray- A Glass slide or silicon chip onto
which spots of many different DNA probes have been deposited. Used for simultaneous measurement of gene expression levels of many genes in the same tissue sample.

What we hope to learn Microarrays
• Understand the principles of the microarray technique.
• Appreciate the limitations of microarrays and problems associated with the technique.
• Know what types of output are generated from different microarray analysis packages and what they mean.
• Understand and be able to evaluate research papers about microarrays.
Why Learn about Microarrays ?
• Extremely useful and powerful technology – given a sample of human tissue, allows you to determine the expression level of all human genes within that tissue.
• Now extremely widely used, not only in research laboratories but also within commercial companies and diagnostically in hospitals.
• Many research articles written involving microarray data – bioinformatics is vital for understanding these data and results.
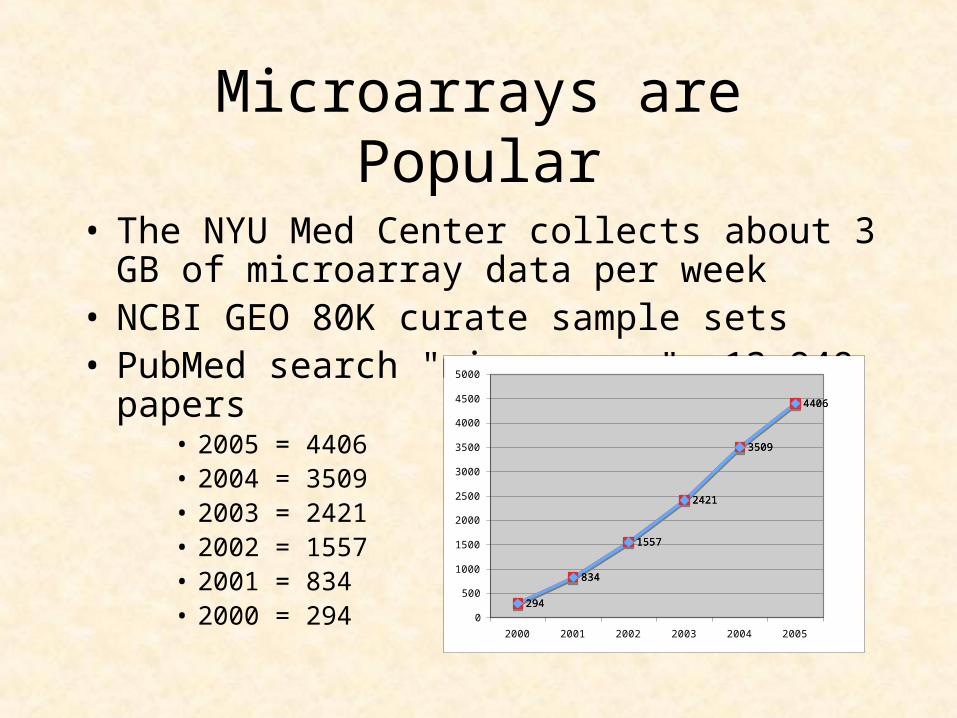
Microarrays are Popular
• The NYU Med Center collects about 3 GB of microarray data per week
• NCBI GEO 80K curate sample sets• PubMed search "microarray"= 13,948 papers
• 2005 = 4406• 2004 = 3509• 2003 = 2421• 2002 = 1557• 2001 = 834• 2000 = 294
294
834
1557
2421
3509
4406
294
834
1557
2421
3509
4406
0
500
1000
1500
2000
2500
3000
3500
4000
4500
5000
2000 2001 2002 2003 2004 2005
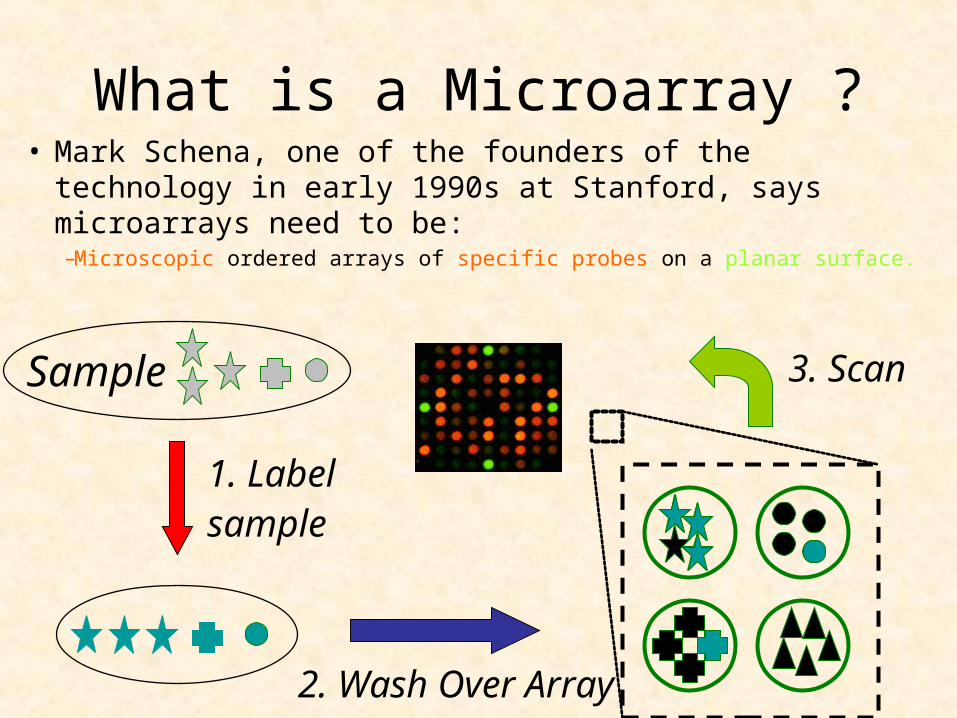
What is a Microarray ?• Mark Schena, one of the founders of the technology in early 1990s at Stanford, says microarrays need to be:–Microscopic ordered arrays of specific probes on a planar surface.
Sample
1. Label sample
3. Scan
2. Wash Over Array

For Example - Protein Microarrays
Sample
1. Label sample
3. Scan
Different Proteins Different Antibodies
2. Wash Over Array

Our Focus – Gene Expression Microarrays
Sample
1. Label sample
3. Scan
Different mRNAsComplementary DNA sequences
2. Wash Over Array
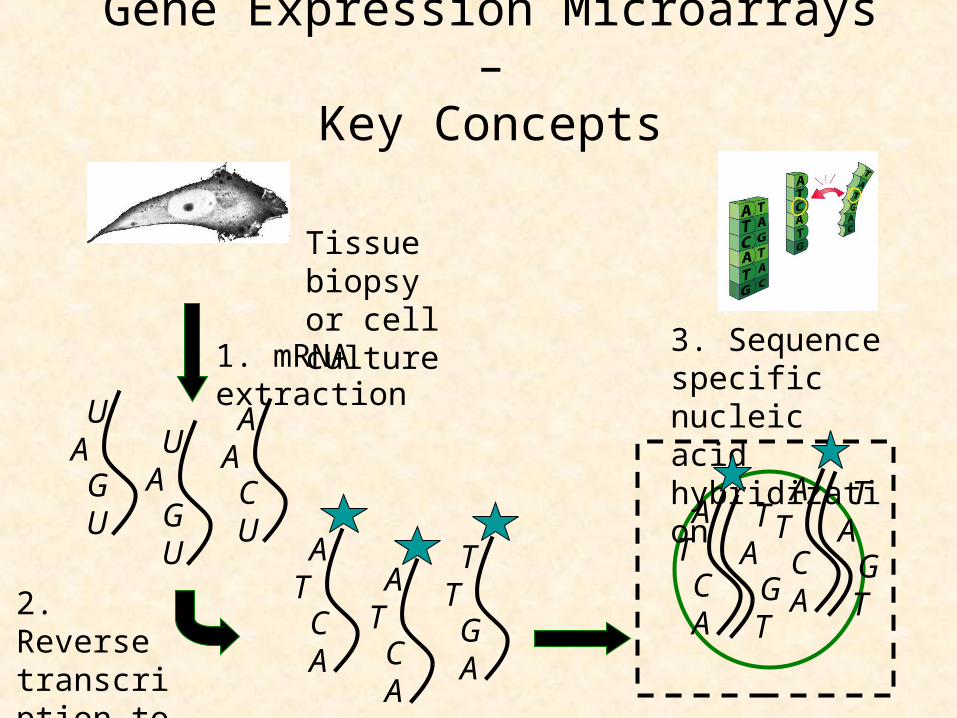
Gene Expression Microarrays –
Key Concepts
1. mRNA extraction
Tissue biopsyor cell culture
TA
GT
UAGU
AACU
UAGU
TA
GT
3. Sequence specific nucleic acid hybridization
ATCA
ATCA2. Reverse
transcription to cDNA and labelling
ATCA
TTGA
ATCA

Goals of a Microarray Experiment
1. Find the genes that change expression between experimental and control samples
2. Classify samples based on a gene expression profile
3. Find patterns: Groups of biologically related genes that change expression together across samples/treatments

Two Major Gene Expression Microarray Technologies
Spotted ArraysAffymetrixGeneChips
We will examine their manufacture and their use.

Spotted Microarrays – Manufacture
• DNA probes spotted onto the microarray can either be cDNA created by PCR or synthetic oligonucleotides.
• The probes are physically spotted onto particular positions on a glass slide using a robot and immobilized using specific surface chemistry.
Pat Brown has plans $30K

Spotted Microarrays – Manufacture
Spotted microarrays can
also be manufactured
‘by hand’.

Spotted Microarrays – Example Use
• Total mRNA was extracted from bone marrow taken from patients with ALL and AML.
• Converted to cDNA by reverse transcription (since mRNA is sensitive to degradation).
T.R. Golub et. al (1999) Molecular Classification of Cancer: Class Discovery and Class Prediction by Gene Expression Monitoring. Science, vol. 286, 531-537.
• As an example, we will look at detecting differences between acute lymphoblastic leukemia (ALL) and acute myeloid leukemia (AML) . This was one of the first successful uses of microarrays in cancer classification.

Spotted Microarrays – Two Channels
AML cDNAs
ALL cDNAs
Cy3 DyeLabel
Cy5 DyeLabel
Mix and hybridize onto slide
Spot Interpretation
Green Spot – higher expression in ALL.
Red Spot – higher expression in AML.
Yellow Spot – equal expression in both.
Black Spot – not expressed in either.

Affymetrix GeneChip –Manufacture
Oligonucleotides are synthesized one nucleotide at a time on the surface of a quartz wafer using photolithographic chemistry in clean room conditions.

Affymetrix “Gene chip” system
• Uses 25 base oligos synthesized in place on a chip (20 pairs of oligos for each gene) 20,000 genes/chip
• RNA labeled and scanned in a single “color
• Arrays get smaller every year (more genes)
• Chips are expensive• Proprietary system: “black box” software, can only use their chips

Affymetrix GeneChip – Single Channel
AML cDNAs
ALL cDNAs
Biotin Label
Hybridize Scan