Gender Profiling from a Single Snapshot of Apps Installed ... · Gender Profiling from a Single...
12
1 Gender Profiling from a Single Snapshot of Apps Installed on a Smartphone: An Empirical Study Sha Zhao, Yizhi Xu, Xiaojuan Ma, Ziwen Jiang, Zhiling Luo, Shijian Li, Laurence Tian- ruo Yang, Anind Dey, and Gang Pan Abstract—The integration of 5G networks and AI benefits to create a more holistic and better connected ecosystem for industries. User profiling has become an important issue for industries to improve company profit. In the 5G era, smartphone applications have become an indispensable part in our everyday lives. Users determine what apps to install based on their personal needs, interests, and tastes, which is likely shaped by their genders - the behavioral, cultural, or psychological traits typically associated with one sex. It is possible to profile users’ gender based simply on a single snapshot of apps installed on their smartphones. With this inference based on easy to access data, we can make smartphone systems more user-friendly, and provide better personalized products and services. In this paper, we explored such possibility through an empirical study on a large-scale dataset of installed app lists from 15,000 Android users. More specifically, we investigated the following research questions: 1) What differences between females and males can be explored from installed app lists? 2) Can user gender be reliably inferred from a snapshot of apps installed? Which snapshot feature(s) are the most predictive? What is the best combination of features for building the gender prediction model? 3) What are the limitations of a gender prediction model based solely on a snapshot of apps installed on a smartphone? We found significant gender differences in app type, function, and icon design. We then extracted the corresponding features from a snapshot of apps installed to infer the gender of each user. We assessed the gender predictive ability of individual features and combinations of different features. We achieved an accuracy of 76.62% and AUC of 84.23% with the best set of features, outperforming the existing work by around 5% and 10%, respectively. Finally, we performed an error analysis on misclassified users and discussed the implications and limitations of this work. Index Terms—Installed app lists, smartphones, gender, user studies. I. I NTRODUCTION T HE evolving of the fifth generation (5G) networks is becoming more readily available nowadays, providing new connectivity interfaces for the future IoT applications 1 . S. Zhao, Y. Xu, Z. Jiang, Z. Luo, and S. Li are with the College of Computer Science and Technology, Zhejiang University, Hangzhou, Zhejiang, 310027 China. E-mail: {szhao, yzxu, zjujzw, luozhiling, shijianli}@zju.edu.cn. X. Ma is with Hong Kong University of Science and Technology, Hongkong, China. Email: [email protected] L.T. Yang is with St. Francis Xavier University, Antigonish, NS, Canada. Email: [email protected] A. Dey is with University of Washington, Seattle, WA, USA. E-mail: [email protected] G. Pan is with the State Key Lab of CAD&CG, Zhejiang University, Hangzhou, China, and College of Computer Science and Technology, Zhejiang University, Hangzhou, China Dr. Gang Pan is the corresponding author. E-mail: [email protected] Manuscript received May 28, 2019; revised July 17, 2019. 1 https://www.i-scoop.eu/internet-of-things-guide/5g-iot/ As with the advent of 5G, a much larger amount of data is captured and stored on dependable communication networks. From the abundant data, advanced AI techniques benefit to learn valuable knowledge to serve for IoT applications. The in- tegration of 5G and AI can lead to the expanding of industrial automation, by directly contributing to revolutionizing smart business solutions. Users play an important role in improving the smart business solutions, since most services are user- centric and provided depending on users’ needs and interests. Thus, user profiling has been becoming an important issue in the era of industrial automation, which is a process of identifying users’ attributes, such as needs and preferences, from user sensing data. User profiling helps personalization of applications to im- prove company profit, such as targeted advertising. For ex- ample, in 2017, advertising accounts for the vast majority of Feacebook’s revenue, and about 98 percent of its global revenue was generated from advertising. 2 There are various kinds of user attributes, such as occupation, income and preferences. Among these user attributes, gender has shown enormous significance [1]. Gender plays a fundamental role in our daily lives, shaping identities and perception, interactional practices, and the very forms of social institutions [2]. People respond and behave differently according to gender [3]. Hence, taking gender into consideration could have great impact in improving smart applications or systems, especially most systems with an interface, in such a way as to make them more user-friendly and act more human-like [3]. The knowl- edge can be further used for improving company profit by facilitating appropriate and efficient marketing of products and services, such as personalized recommendation and person- alized searching. Appropriate services can be recommended to females or males according to their differences. Thus, automatically inferring gender is important for industries. In the 5G era, the prevalence of smartphones [4] and the rapid development of AI techniques have made it possible to automatically infer gender for industry. Applications (Abbr. apps) installed on a smartphone provide the opportunity to profile user gender in a lightweight fashion. First, users determine what apps to install based on their personal needs, interests, and tastes, which is likely shaped by their gender–the behavioral, cultural, or psychological traits typically associated with one sex [2]. The list of installed apps is a potentially 2 https://www.statista.com/statistics/271258/facebooks-advertising-revenue- worldwide/
Transcript of Gender Profiling from a Single Snapshot of Apps Installed ... · Gender Profiling from a Single...
1
Gender Profiling from a Single Snapshot of AppsInstalled on a Smartphone: An Empirical Study
Sha Zhao, Yizhi Xu, Xiaojuan Ma, Ziwen Jiang, Zhiling Luo, Shijian Li, Laurence Tian-ruo Yang, Anind Dey, and Gang Pan
Abstract—The integration of 5G networks and AI benefitsto create a more holistic and better connected ecosystem forindustries. User profiling has become an important issue forindustries to improve company profit. In the 5G era, smartphoneapplications have become an indispensable part in our everydaylives. Users determine what apps to install based on theirpersonal needs, interests, and tastes, which is likely shaped bytheir genders - the behavioral, cultural, or psychological traitstypically associated with one sex. It is possible to profile users’gender based simply on a single snapshot of apps installed ontheir smartphones. With this inference based on easy to accessdata, we can make smartphone systems more user-friendly, andprovide better personalized products and services. In this paper,we explored such possibility through an empirical study on alarge-scale dataset of installed app lists from 15,000 Androidusers. More specifically, we investigated the following researchquestions: 1) What differences between females and males canbe explored from installed app lists? 2) Can user gender bereliably inferred from a snapshot of apps installed? Which snapshotfeature(s) are the most predictive? What is the best combinationof features for building the gender prediction model? 3) What arethe limitations of a gender prediction model based solely on asnapshot of apps installed on a smartphone? We found significantgender differences in app type, function, and icon design. Wethen extracted the corresponding features from a snapshot ofapps installed to infer the gender of each user. We assessed thegender predictive ability of individual features and combinationsof different features. We achieved an accuracy of 76.62% andAUC of 84.23% with the best set of features, outperforming theexisting work by around 5% and 10%, respectively. Finally, weperformed an error analysis on misclassified users and discussedthe implications and limitations of this work.
Index Terms—Installed app lists, smartphones, gender, userstudies.
I. INTRODUCTION
THE evolving of the fifth generation (5G) networks isbecoming more readily available nowadays, providing
new connectivity interfaces for the future IoT applications 1.
S. Zhao, Y. Xu, Z. Jiang, Z. Luo, and S. Li are with the College of ComputerScience and Technology, Zhejiang University, Hangzhou, Zhejiang, 310027China. E-mail: {szhao, yzxu, zjujzw, luozhiling, shijianli}@zju.edu.cn.
X. Ma is with Hong Kong University of Science and Technology,Hongkong, China. Email: [email protected]
L.T. Yang is with St. Francis Xavier University, Antigonish, NS, Canada.Email: [email protected]
A. Dey is with University of Washington, Seattle, WA, USA. E-mail:[email protected]
G. Pan is with the State Key Lab of CAD&CG, Zhejiang University,Hangzhou, China, and College of Computer Science and Technology, ZhejiangUniversity, Hangzhou, China
Dr. Gang Pan is the corresponding author. E-mail: [email protected] received May 28, 2019; revised July 17, 2019.1https://www.i-scoop.eu/internet-of-things-guide/5g-iot/
As with the advent of 5G, a much larger amount of data iscaptured and stored on dependable communication networks.From the abundant data, advanced AI techniques benefit tolearn valuable knowledge to serve for IoT applications. The in-tegration of 5G and AI can lead to the expanding of industrialautomation, by directly contributing to revolutionizing smartbusiness solutions. Users play an important role in improvingthe smart business solutions, since most services are user-centric and provided depending on users’ needs and interests.Thus, user profiling has been becoming an important issuein the era of industrial automation, which is a process ofidentifying users’ attributes, such as needs and preferences,from user sensing data.
User profiling helps personalization of applications to im-prove company profit, such as targeted advertising. For ex-ample, in 2017, advertising accounts for the vast majorityof Feacebook’s revenue, and about 98 percent of its globalrevenue was generated from advertising. 2 There are variouskinds of user attributes, such as occupation, income andpreferences. Among these user attributes, gender has shownenormous significance [1]. Gender plays a fundamental role inour daily lives, shaping identities and perception, interactionalpractices, and the very forms of social institutions [2]. Peoplerespond and behave differently according to gender [3]. Hence,taking gender into consideration could have great impactin improving smart applications or systems, especially mostsystems with an interface, in such a way as to make themmore user-friendly and act more human-like [3]. The knowl-edge can be further used for improving company profit byfacilitating appropriate and efficient marketing of products andservices, such as personalized recommendation and person-alized searching. Appropriate services can be recommendedto females or males according to their differences. Thus,automatically inferring gender is important for industries.
In the 5G era, the prevalence of smartphones [4] and therapid development of AI techniques have made it possible toautomatically infer gender for industry. Applications (Abbr.apps) installed on a smartphone provide the opportunity toprofile user gender in a lightweight fashion. First, usersdetermine what apps to install based on their personal needs,interests, and tastes, which is likely shaped by their gender–thebehavioral, cultural, or psychological traits typically associatedwith one sex [2]. The list of installed apps is a potentially
2https://www.statista.com/statistics/271258/facebooks-advertising-revenue-worldwide/
2
good indicator of gender, since females and males may seekdifferent functions and values in smartphone apps.
Second, the list of apps installed on a smartphone isaccessible to other applications. Although the permission foran app to access personal data, such as contacts and location,must be requested from a user at the time of app installationin Android, the list of apps installed on a user’s smartphonecan be obtained without his/her permission through any appinstalled in Android [5]. Some advertisement tracking librarieshave reportedly embedded this feature to collect lists of in-stalled apps [5]. Third, the list of installed apps is lightweight,only a single snapshot of the apps installed on a smartphone.It does not need continuous tracking of users’ activities andmaintaining historical records which are expensive and time-consuming. With the help of advanced techniques, we havethe potential to quickly determine one user’s gender at themoment when accessing his/her current list of apps installedon the smartphone. It can be used in conjunction with userbehavior tracking technologies to address the cold-start issuesin tracking-based systems, especially at the beginning of datacollection for an individual. Despite the advantages, there havebeen few studies so far to systematically profile user genderfrom a single snapshot of apps installed on a smartphone.
In this paper, we present an empirical study of genderprofiling from a single snapshot of apps installed on a smart-phone. We try to answer three research questions that guidethe remainder of the this paper:
• RQ1: What differences between females and males canbe explored from the list of apps installed?
• RQ2: Can user gender be reliably inferred from a snap-shot of apps installed? Which snapshot feature(s) are themost predictive? What is the best combination of featuresfor building the gender prediction model?
• RQ3: What are the limitations of a gender predictionmodel based solely on a snapshot of apps installed on asmartphone?
In order to answer each of our research questions, we con-ducted experiments based on a large-scale dataset of installedapp lists collected from 7500 females and 7500 males. Ourkey findings are as follows.
(1) Females and males have distinctive differences in terms oftop popular apps, the key functions they seek, and trendin icon designs at both an individual app and app categorylevel.
(2) Features extracted from a snapshot of apps installed ona smartphone can be used to infer the gender of its user.We investigated the predictive ability of individual featuresand found that the discriminative apps selected by IG (In-formation Gain) are the most powerful for distinguishinggender. The combination of apps selected by IG and topicslearned from app description by LDA (Latent DirichletAllocation) leads to the best gender classification results,outperforming the existing work by around 5% in accuracy(76.62% vs. 71.5%), and about 10% in AUC (84.23% vs.74.0%). This performance is nearly on par with the state-of-the-art gender profiling results based on months of appusage data.
(3) Further investigation of misclassified users suggest prof-itable lines of future work. We conducted an error analysisabout the users we had difficulty inferring to understandour model’s limitations, and provided possible reasons forthese misclassifications.
II. RELATED WORK
Studies on gender differences have a long history. Over thepast few decades, gender differences have been studied usingtraditional methods, i.e., questionnaires. Although question-naires are cost-efficient, lack of conscientious responses canbe a serious issue, since respondents usually answer questionssubjectively. As with the increasing development of devicesand technologies, more and more personal history data of usersis recorded in cyber space, such as data about social networks,web searching, and mobile phone usage. Big data about usersin cyber space provides a great opportunity for studyinggender objectively and extensively. The captured history datadescribes users’ behaviors objectively. Additionally, this datacan be continuously recorded in detail for a long duration.Many studies have revealed the gender differences throughanalyzing users’ behaviors in cyber space, and even inferredgender. In this section, we review the related work in the twoareas, namely the studies about gender differences of behaviorsin cyber space and inferring gender from behaviors.
A. Gender differences of behaviors in cyber space
Differences in behaviors in cyber space based on genderhave been learned through the analysis of various datasets,such as social network usage, web searching and mobilephone usage. A variety of datasets have been used to analyzegender differences in social network usage [6]–[10] and websearching behaviors [11]–[13]. For example, Mazman et al.[6] learned the difference in usage purpose of social networksbetween females and males by investigating 870 Facebookusers. It was found that females use Facebook for ”maintain-ing existing relationships”, ”academic usage” and ”followingagenda” more than males do, while males only use Facebookfor ”making new relationships” more than females. Zhoureported that males were engaged in more search activitiesthan females, as seen in the large number of searches, searchqueries, and times males updated their queries [11].
There are fewer studies analyzing gender differences inmobile phone usage. Andone et al. showed females usedsmartphones for longer periods of time than males, with adaily mean of 166.78 minutes vs. 154.26 minutes [14]. Theysimply calculated the daily mean phone usage time and usageduration of app categories for females and males. As withthe rising development of mobile app market, the apps onsmartphones provide a great opportunity for analyzing genderdifferences. Compared with logs about social network usageand web searching, apps on smartphones can reflect morecomprehensive and personalized user information. Smartphoneapps can be considered as the entry point to access manylife services. The apps installed on a smartphone reveal richclues regarding one user’s identity and information, sincethe smartphone is usually associated with the same user.
3
Unfortunately, there are very few studies extensively analyzinggender differences from installed apps on smartphones.
B. Gender inferring from behaviors
Since there are gender differences of behaviors in cyberspace, many studies have sought to infer gender from thebehaviors, such as social network usage and web searching[15]–[17]. For example, Rao et al. [15] inferred 500 users’gender from Twitter language, with an accuracy of 72%. Bi etal. inferred the gender of 3.3 million users with AUC of 80%,by analyzing their Bing query logs [16].
There have been also studies inferring gender from mobilephone usage behaviors [18]–[23]. [18] and [24] used GPS, calllog, media, Bluetooth, calendar, acceleration, and applicationuse frequency to predict about 200 phone users’ gender. Malmiet al. analyzed the apps used by 3,760 Android users, andinferred gender using logistic regression with an accuracy of82.3% [22]. Wang et al. [23] inferred 25 users’ gender fromapp usage behaviors with an accuracy of 86.5%. However, allof these analyses required data from users’ phones collectedover time, which is expensive and time consuming. There havebeen very few studies using installed app lists to infer usergender.
Seneviratne et al. analyzed about 200 users’ installed applists and discovered the gender differences in installed app lists[19]. The dataset was collected through a specific Android appfrom a relatively small population. They extracted differentfeatures from the number of installed apps, categories, andapp description, then trained SVM and Naive Bayes classifiersto infer gender and obtained an accuracy of around 70%.Compared with Seneviratne’s work [19], our work has thefollowing differences. First, we explored a much bigger datasetwith 15,000 users, and our dataset is natural, not artificiallycollected as [19]. Second, we extracted new features and newfeature combinations, and inspected each feature at both intra-category and inter-category levels. Third, we compared morestate-of-the-art algorithms for gender prediction, and achievedthe state-of-the-art performance. Finally, we performed anerror analysis on misclassified users.
Based on the large-scale dataset of installed app lists from15,000 Android users, we present an empirical study ofgender profiling from a single snapshot of apps installed ona smartphone. Firstly, we explore the gender differences interms of popularity, functions, and icons of apps installed atboth individual app and app category level. Then, we extractfeatures for user representation from a snapshot of apps in-stalled on smartphones, and investigate the predictive ability ofindividual features and combinations of different features forgender. Finally, we perform an error analysis on misclassifiedusers, and discuss the implications and limitations of our study.
III. DATASET
The dataset we used to profile user gender consists of applists installed on Android smartphones, provided by a mobileInternet company in China. The users’ installed app lists werecollected through an embedded advertising SDK (SoftwareDevelopment Kit) in apps on Android smartphones. In addition
to the advertisements displayed to users, a brief questionnaireabout demographic attributes such as gender was present.Users voluntarily answered the questionnaire, and the user whoreported the demographic attribute was offered a compensationwith a 20 Yuan e-coupon. The dataset contains 16,003 uniquesmartphone users with self-reported gender information, and29,788 unique apps, in which there are 7,500 females and 8503males from multiple provinces in China. To keep the balance,we randomly selected 7,500 males and there are 15,000 uniqueusers in total used in this work. Each record consist of a:
• User ID: the unique identity of the sampled smartphone.Each user ID is anonymized for security and privacyreasons before the data was collected.
• Gender: the gender of the user.• Installed app list: the apps installed on one smartphone.
Each list consists of app package names which are usedto identify apps.
In addition to the installed app lists, we crawled the metadata of the apps in the dataset from appstore websites, includ-ing icons, description that introduces an app, and tags thatdescribe core functionality and characteristics of each app. Inorder to get a high level understanding of the apps installedby users, we categorized all the apps into 29 categories [25].
User privacy. The original data was collected for the pur-pose of improving user experience, with a strict policy of datacollection, transmission and storage. The gender informationwas collected with explicit user agreements. In this work, wetake careful steps to protect user privacy. First, the datasetwas completely anonymized before provided to the authors,especially the user ID. Second, throughout the paper, wereport only average statistics without revealing any identifiableinformation of individuals. Third, all the researchers are reg-ulated by the strict non-disclosure agreement and the datasetis located in a secure off-line server.
Basic analysis. We calculated the distribution of the numberof apps installed by users. Most users install between 20-60 apps, accounting for about 60% of our population, withjust very few users install more than 100 apps. Each user inour data set installed 34.87 apps on average (median: 30, std:22.35). The top 5 most frequently installed apps are WeChat,QQ (an IM client), Taobao (a shopping app like Amazon),SinaWeibo (a social network app like Twitter), and SogouInput method (a Chinese language input method). We foundthat the top 1,288 frequent apps (out of 29,788) account for80% of all the installations.
The 5 most popular categories are SON and IM (socialonline network and instant messaging), System tool, Me-dia and video, Lifestyle (consisting of apps that can makepeople’s lives easier, e.g. flashlight), and Shopping.
IV. THE GENDER DIFFERENCES
We explored the gender differences in terms of popularity,functions and icons of apps installed, at both the individualapp and app category level.
A. The differences in the number and popularity1) Male users install more apps than female users in
general: We firstly compared the average number of apps
4
(a) (b)
oueriodTracker
MeituSticker
(BeautySticker)
Meilishuo
(BeautyShopping)
Dayima
(PeriodTracker)
Mogujie
(BeautyShopping)
Pinlide
(PhotoCollage)
Jumeiyoupin
(BeautyShopping)
91Locker
(Theme)
MeiyanCam
(BeautyCam)
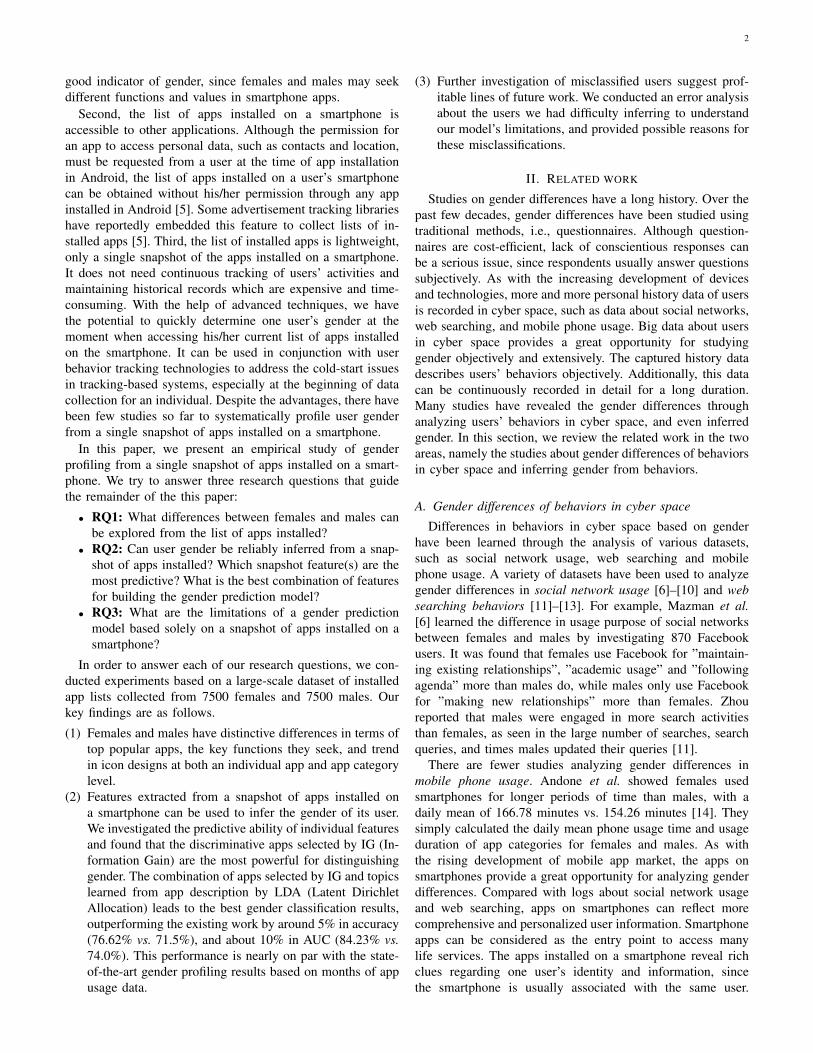
Fig. 1: The top 10 popular apps for (a) females, and (b) males.
and categories installed by females and males. Each femaleinstalled 32.32 apps on average (median: 29, std: 19.39),while males installed 37.41 (median: 32, std:24.69). Thedifference is significant under a two-detailed z-test [26] witha z − score = 14.05(p < 0.01). It can be concluded thatmales installs about 5 more apps than females on average.Similarly, male users install apps that represent more appcategories than female users: males install apps in 13.63 appcategories on average, compared to females with 12.80. Thisdifference is also significant under a two-detailed z-test [26]with z − score = 7.5386(p < 0.01).
2) Beauty-related apps attract more female users, whileusers of system tool and car apps are mostly male.: Wethen investigated the top popular apps for females and males,respectively. A top popular app for females refers to an appis popular among females but not so popular among males.It means that there is a distinct difference in the number offemales and males. We focused on the frequent apps that areinstalled by more than 500 users. To be specific, for femaleswe computed the difference of each app in the percentage ofits female and male users. Then, we ranked the apps in adescending order according to the difference. We summarizedthe top 10 popular apps for females, shown in Fig. 1 (a).Similarly, we computed those for males, shown in Fig. 1 (b).
As shown in Fig. 1 (a), beauty-related apps are moreattractive to female users. The top 10 popular apps for femalesare the ones related to photo beautifying and sharing (Mei-tuSticker,Pinlide, MeiyanCam, and Instagram), beauty shop-ping (Meilishuo, Mogujie, and Jumeiyoupin), period tracker(Dayima and Meiyou), and theme (91 Locker). The appsof MeituSticker,Pinlide, MeiyanCam, and Instagram provideservices for photography, taking pictures with smart beauti-fying functions, and sharing photos. The apps of Meilishuo,Mogujie, and Jumeiyoupin are for fashion e-commerce withclothing and cosmetics targeting females. The apps of Dayimaand Meiyou are designed for a woman to track her menstrualcycle. For these apps, the female users account for more than68%, especially for the apps of MeituSticker (beauty sticker)and Meilishuo (beauty shopping), the female users accountingfor 84.2% and 83.5%, respectively. But, only around 16%of male users install MeituSticker and Meilishuo. The greatdifference shows that females have the beauty-related appsmuch more than males.
As we can see from Fig. 1 (b), tools and car-related appsare the most attractive to males. The top 10 popular apps formales are related to downloading (Thunder), cars (AutoHome),system tools (Tencent Security, Root Explorer, and Uni-comMobile), games (ThunderFighter), news (NeteaseNews),videos (Kuaibo), and file managers (QuickPic-PhotoGalleryand ESFileExplorer). For the apps of Thunder (downloader)and AutoHome (Car), males account for 82.2% and 81.1%,respectively, while female users account for only 17.8% and18.9%. Thunder is a downloading tool, and Autohome pro-vides services about cars, technologies, and purchasing.
3) Females install more photo and shopping types ofapps, while males have more tool, game, and video appson the phones. : We also calculated the popular categoriesfor females and males, by comparing the average number ofapps in each category installed by female and male users.The categories were ranked in a descending order based onthe difference. For 23 out of 29 categories, males installmore apps than females on average. This is to be expected,since males install more apps than females in general. Thecategory with the greatest difference between females andmales is system tool, for which each male installs about4.8 apps on average while each female installs about 3.8.Males also install more apps on average than females in thecategories of game other (role playing games, action games,simulation games, and adventure games), media and video,news and reading, business, navigation, car and travel. But inthe category of photography and beauty, females install abouttwice as many apps as males on average, 2.1 apps per femaleand 1.1 apps per male. Females also have more shopping andparent and child apps than males. Females install as manyapps as males, on average, in the categories of social networkand IM, education, and weather.
B. The differences in app functions
Considering females and males may seek different functionsand values in smartphone apps because of different needs andinterests, we explored the gender differences in app functionsat both an individual app level and app category level.
1) Females are interested in apps that improve their lookand feel, while males like apps that improve their accessto the world.: In order to discover the gender differences in
5
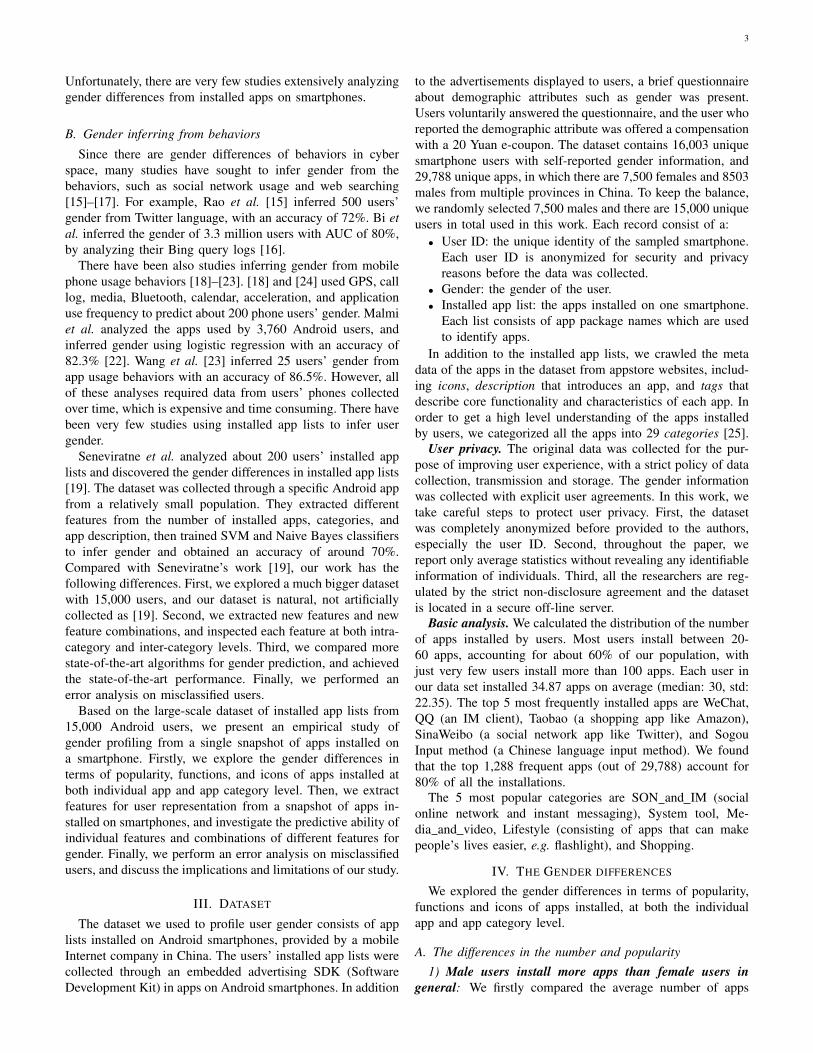
app functions at the individual app level, we extracted theapp functions through discovering the semantic topics fromthe description text of apps. Each topic indicates one kind offunction, such as playing music and taking pictures. In orderto learn latent semantic topics, each user was regarded as adocument consisting of the words appearing in the descriptionof all his/her installed apps, and all the users constituted acorpus. Each user (document) is considered to have a set oftopics that can be learned from his/her words. Here, we appliedLDA to learn the semantic topics from the app descriptionto extract the app function. More specifically, we extractedwords using Jieba, a tool for Chinese text segmentation, toselect nouns, verbs and adjectives, and used words to representeach user as a vector input to LDA. LDA assigned a usermultiple topics with a probability distribution of the topics,indicating the probability that the topic belongs to the user.Each topic consists of a probability distribution of the words,indicating the probability that the word belongs to the topic.Fig. 2 illustrates how to get topics from app description.
We obtained 300 topics and each has a probability dis-tribution of words from LDA (the choice of 300 topics isexplained in Section V-C3). In order to understand the genderdifferences in app functions, we computed the significanttopics for females and males, respectively. The significance ofthe ith topic si was computed by Equation 1, i.e., the absolutevalue of the difference between the average probability eachfemale belongs to the ith topic and the average probabilityeach male belongs to the ith topic. If the average probabilityeach female belongs to the ith topic is bigger than that ofeach male, the ith topic is one significant topic for females,otherwise it is one significant topic for males. We ranked thetopics in a descending order according to their significance tofemales and males, respectively. The first topic in the rankingis the one that females (or males) are the most interested in.
si = |∑7500
j=1 Fi,j
NF−
∑7500k=1 Mi,k
NM| (1)
where Fi,j and Mi,k refers to the probability that the ithtopic belongs to the jth female and kth male, respectively,
....
LDA
....
Topic-Word distributionsUser-App lists
App-Word distributions
User-Word distributions
Apps Words
Users WordsTopicsWords
video youtube ... music
50 47 ... 5
pregnant baby ... fitness35 23 ... 5
note meeting ... cloud
36 28 ... 3
meeting email ... chat
0.046 0.021 ... 0.003
video pregnant ... pay
0.031 0.027 ... 0.004
sports fitness ... tools
0.037 0.025 ... 0.006
fitness sports ... train0.064 0.057 ... 0.012
pregnant baby ... fitness0.087 0.065 ... 0.018
note meeting ... cloud0.087 0.065 ... 0.018
User-Topic distributions
Building Model
....
Discovering Topics
beauty camera ... video
0.033 0.025 ... 0.004
User-Word distributions User-Topic distributionsUser-App list
App descriptions
YouTube your way on thebiggest screen in the house...
Baby tree, is a powerful app to take care of your newborn orbaby...
Organize your work anddeclutter your life. With Evernote on your...
....
....
....
AppsUsers
....
Apps TopicsUsers
....
....
LDA
Word segmentation
Fig. 2: The illustration of how to get topics from appdescription.
𝑝" = 0.00765 𝑝) = 0.01629
𝑝" = 0.00263 𝑝) = 0.01126
𝑝" = 0.00614 𝑝) = 0.01454
𝑝" = 0.00542 𝑝) = 0.01071
𝑝" = 0.00159 𝑝) = 0.00653
(a) The top 5 topics for female users.
𝑝" = 0.06597 𝑝) = 0.01923
𝑝" = 0.04529 𝑝) = 0.00105
𝑝" = 0.01143 𝑝) = 0.00851
𝑝" = 0.01134 𝑝) = 0.00855
𝑝" = 0.01035 𝑝) = 0.00767
(b) The top 5 topics for male users.
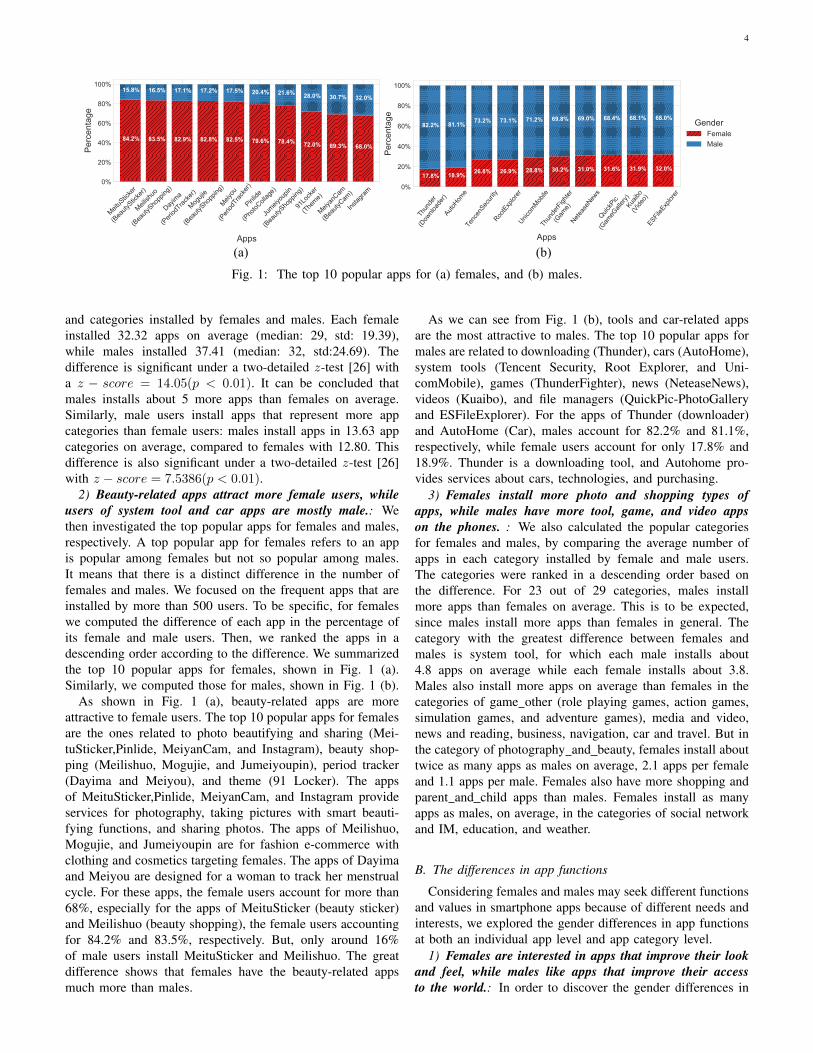
Fig. 3: The word clouds of the top 5 topics for females andmales, respectively.
and NF = 7500 and NM = 7500 are the total number offemales and males.
To give a sense of what function each topic expresses, weselected the top 30 words with the highest probability for eachtopic and generated a word cloud. We listed the word clouds ofthe top 5 topics for females and males, respectively. For eachof the listed topics, we also computed the average probabilityfor each female pF , and for each male pM , shown in Fig.3. In each word cloud, the size of one word indicates theprobability that it belongs to the topic, with higher probabilitycorresponding to bigger size.
Figure 3 (a) shows the word clouds of the 5 most significanttopics for female users, and the average probability of eachtopic for females and males. It can be seen female users aremore interested in apps that improve their look and feel. Thetop 5 functions that females are interested in are about camera,shopping, photography, collocation, and slimming. When welooked into the most attractive function, camera-related, theaverage probability for females is twice as much as for male(0.01629 vs. 0.00765). As was expected, females have higherprobability than males for shopping (0.01126 vs. 0.00263),photography (0,01454 vs. 0.00614), collocation (0.01071 vs.0.00542), and slimming (0.00653 vs. 0.00159).
As we can see from Fig. 3 (b), compared with females,males are more interested in apps with functions about cars,live broadcasting, accessing WiFi, maps, and travel that canimprove their access to the world. Males have much higherprobability to these 5 functions than females: car (0.06597vs. 0.01923), live broadcasting (0.04529 vs. 0.00105), WiFi(0.01143 vs. 0.00851), map (0.01134 vs. 0.00855), and travel(0.01035 vs. 0.00767), especially for functions related to carsfor which the probability for males is around three times biggerthan that for females. The findings for the top 5 functionscorrespond to our earlier finding that the users of tool and carrelated apps are mostly male.
2) Within the same app category, females and males havedifferent preferences to apps.: Apps in the same category canhave different core functions; for example, PictureEditor andMeitu in the category of Photography and beauty. PictureEd-itor, like photoshop, is for professionally editing pictures,while Meitu is for beautifying and customizing photos, suchas smoothing skins and enlarging eyes. We looked into thegender differences in app functions within the same category,
6
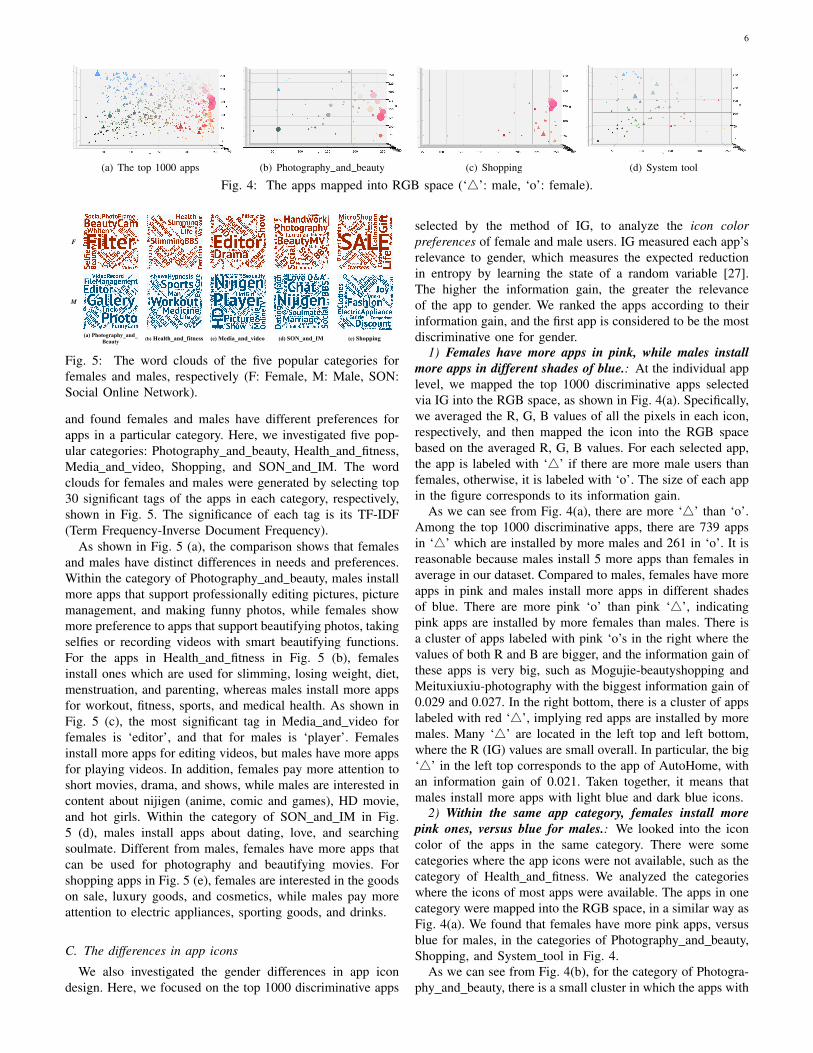
(a) The top 1000 apps (b) Photography and beauty (c) Shopping (d) System tool
Fig. 4: The apps mapped into RGB space (‘4’: male, ‘o’: female).
F
M
(a) Photography_and_
Beauty (b) Health_and_fitness (c) Media_and_video (d) SON_and_IM (e) Shopping
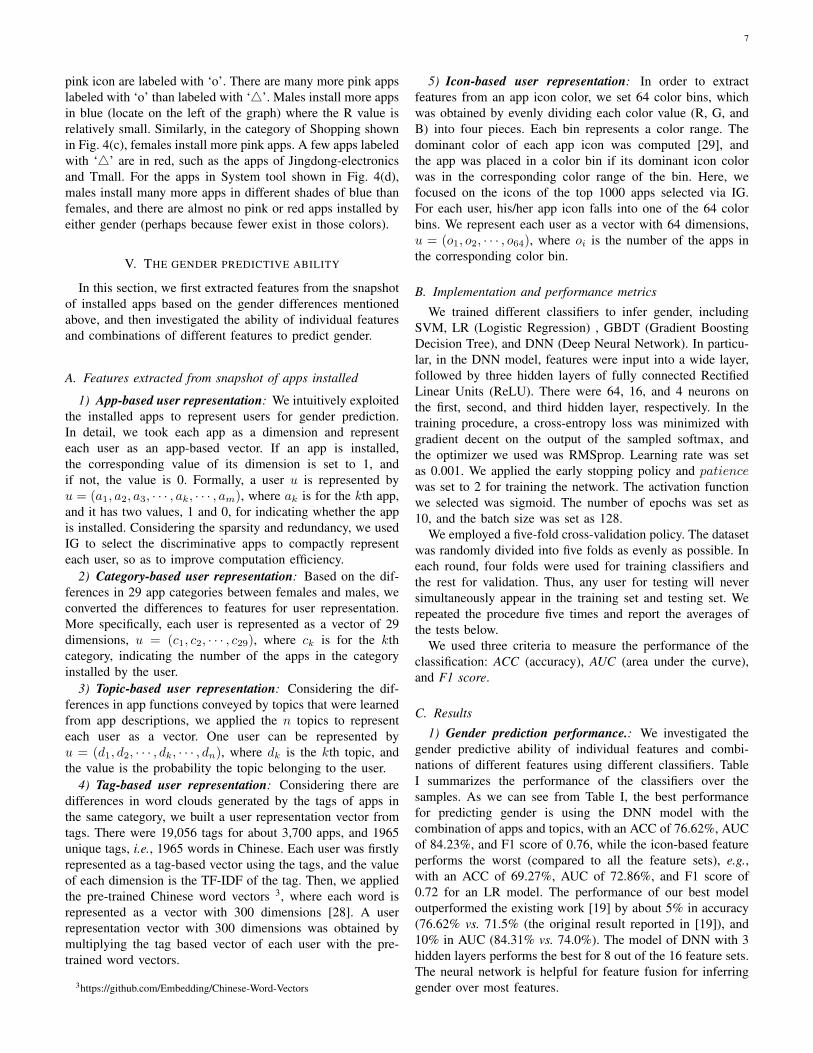
Fig. 5: The word clouds of the five popular categories forfemales and males, respectively (F: Female, M: Male, SON:Social Online Network).
and found females and males have different preferences forapps in a particular category. Here, we investigated five pop-ular categories: Photography and beauty, Health and fitness,Media and video, Shopping, and SON and IM. The wordclouds for females and males were generated by selecting top30 significant tags of the apps in each category, respectively,shown in Fig. 5. The significance of each tag is its TF-IDF(Term Frequency-Inverse Document Frequency).
As shown in Fig. 5 (a), the comparison shows that femalesand males have distinct differences in needs and preferences.Within the category of Photography and beauty, males installmore apps that support professionally editing pictures, picturemanagement, and making funny photos, while females showmore preference to apps that support beautifying photos, takingselfies or recording videos with smart beautifying functions.For the apps in Health and fitness in Fig. 5 (b), femalesinstall ones which are used for slimming, losing weight, diet,menstruation, and parenting, whereas males install more appsfor workout, fitness, sports, and medical health. As shown inFig. 5 (c), the most significant tag in Media and video forfemales is ‘editor’, and that for males is ‘player’. Femalesinstall more apps for editing videos, but males have more appsfor playing videos. In addition, females pay more attention toshort movies, drama, and shows, while males are interested incontent about nijigen (anime, comic and games), HD movie,and hot girls. Within the category of SON and IM in Fig.5 (d), males install apps about dating, love, and searchingsoulmate. Different from males, females have more apps thatcan be used for photography and beautifying movies. Forshopping apps in Fig. 5 (e), females are interested in the goodson sale, luxury goods, and cosmetics, while males pay moreattention to electric appliances, sporting goods, and drinks.
C. The differences in app icons
We also investigated the gender differences in app icondesign. Here, we focused on the top 1000 discriminative apps
selected by the method of IG, to analyze the icon colorpreferences of female and male users. IG measured each app’srelevance to gender, which measures the expected reductionin entropy by learning the state of a random variable [27].The higher the information gain, the greater the relevanceof the app to gender. We ranked the apps according to theirinformation gain, and the first app is considered to be the mostdiscriminative one for gender.
1) Females have more apps in pink, while males installmore apps in different shades of blue.: At the individual applevel, we mapped the top 1000 discriminative apps selectedvia IG into the RGB space, as shown in Fig. 4(a). Specifically,we averaged the R, G, B values of all the pixels in each icon,respectively, and then mapped the icon into the RGB spacebased on the averaged R, G, B values. For each selected app,the app is labeled with ‘4’ if there are more male users thanfemales, otherwise, it is labeled with ‘o’. The size of each appin the figure corresponds to its information gain.
As we can see from Fig. 4(a), there are more ‘4’ than ‘o’.Among the top 1000 discriminative apps, there are 739 appsin ‘4’ which are installed by more males and 261 in ‘o’. It isreasonable because males install 5 more apps than females inaverage in our dataset. Compared to males, females have moreapps in pink and males install more apps in different shadesof blue. There are more pink ‘o’ than pink ‘4’, indicatingpink apps are installed by more females than males. There isa cluster of apps labeled with pink ‘o’s in the right where thevalues of both R and B are bigger, and the information gain ofthese apps is very big, such as Mogujie-beautyshopping andMeituxiuxiu-photography with the biggest information gain of0.029 and 0.027. In the right bottom, there is a cluster of appslabeled with red ‘4’, implying red apps are installed by moremales. Many ‘4’ are located in the left top and left bottom,where the R (IG) values are small overall. In particular, the big‘4’ in the left top corresponds to the app of AutoHome, withan information gain of 0.021. Taken together, it means thatmales install more apps with light blue and dark blue icons.
2) Within the same app category, females install morepink ones, versus blue for males.: We looked into the iconcolor of the apps in the same category. There were somecategories where the app icons were not available, such as thecategory of Health and fitness. We analyzed the categorieswhere the icons of most apps were available. The apps in onecategory were mapped into the RGB space, in a similar way asFig. 4(a). We found that females have more pink apps, versusblue for males, in the categories of Photography and beauty,Shopping, and System tool in Fig. 4.
As we can see from Fig. 4(b), for the category of Photogra-phy and beauty, there is a small cluster in which the apps with
7
pink icon are labeled with ‘o’. There are many more pink appslabeled with ‘o’ than labeled with ‘4’. Males install more appsin blue (locate on the left of the graph) where the R value isrelatively small. Similarly, in the category of Shopping shownin Fig. 4(c), females install more pink apps. A few apps labeledwith ‘4’ are in red, such as the apps of Jingdong-electronicsand Tmall. For the apps in System tool shown in Fig. 4(d),males install many more apps in different shades of blue thanfemales, and there are almost no pink or red apps installed byeither gender (perhaps because fewer exist in those colors).
V. THE GENDER PREDICTIVE ABILITY
In this section, we first extracted features from the snapshotof installed apps based on the gender differences mentionedabove, and then investigated the ability of individual featuresand combinations of different features to predict gender.
A. Features extracted from snapshot of apps installed
1) App-based user representation: We intuitively exploitedthe installed apps to represent users for gender prediction.In detail, we took each app as a dimension and representeach user as an app-based vector. If an app is installed,the corresponding value of its dimension is set to 1, andif not, the value is 0. Formally, a user u is represented byu = (a1, a2, a3, · · · , ak, · · · , am), where ak is for the kth app,and it has two values, 1 and 0, for indicating whether the appis installed. Considering the sparsity and redundancy, we usedIG to select the discriminative apps to compactly representeach user, so as to improve computation efficiency.
2) Category-based user representation: Based on the dif-ferences in 29 app categories between females and males, weconverted the differences to features for user representation.More specifically, each user is represented as a vector of 29dimensions, u = (c1, c2, · · · , c29), where ck is for the kthcategory, indicating the number of the apps in the categoryinstalled by the user.
3) Topic-based user representation: Considering the dif-ferences in app functions conveyed by topics that were learnedfrom app descriptions, we applied the n topics to representeach user as a vector. One user can be represented byu = (d1, d2, · · · , dk, · · · , dn), where dk is the kth topic, andthe value is the probability the topic belonging to the user.
4) Tag-based user representation: Considering there aredifferences in word clouds generated by the tags of apps inthe same category, we built a user representation vector fromtags. There were 19,056 tags for about 3,700 apps, and 1965unique tags, i.e., 1965 words in Chinese. Each user was firstlyrepresented as a tag-based vector using the tags, and the valueof each dimension is the TF-IDF of the tag. Then, we appliedthe pre-trained Chinese word vectors 3, where each word isrepresented as a vector with 300 dimensions [28]. A userrepresentation vector with 300 dimensions was obtained bymultiplying the tag based vector of each user with the pre-trained word vectors.
3https://github.com/Embedding/Chinese-Word-Vectors
5) Icon-based user representation: In order to extractfeatures from an app icon color, we set 64 color bins, whichwas obtained by evenly dividing each color value (R, G, andB) into four pieces. Each bin represents a color range. Thedominant color of each app icon was computed [29], andthe app was placed in a color bin if its dominant icon colorwas in the corresponding color range of the bin. Here, wefocused on the icons of the top 1000 apps selected via IG.For each user, his/her app icon falls into one of the 64 colorbins. We represent each user as a vector with 64 dimensions,u = (o1, o2, · · · , o64), where oi is the number of the apps inthe corresponding color bin.
B. Implementation and performance metrics
We trained different classifiers to infer gender, includingSVM, LR (Logistic Regression) , GBDT (Gradient BoostingDecision Tree), and DNN (Deep Neural Network). In particu-lar, in the DNN model, features were input into a wide layer,followed by three hidden layers of fully connected RectifiedLinear Units (ReLU). There were 64, 16, and 4 neurons onthe first, second, and third hidden layer, respectively. In thetraining procedure, a cross-entropy loss was minimized withgradient decent on the output of the sampled softmax, andthe optimizer we used was RMSprop. Learning rate was setas 0.001. We applied the early stopping policy and patiencewas set to 2 for training the network. The activation functionwe selected was sigmoid. The number of epochs was set as10, and the batch size was set as 128.
We employed a five-fold cross-validation policy. The datasetwas randomly divided into five folds as evenly as possible. Ineach round, four folds were used for training classifiers andthe rest for validation. Thus, any user for testing will neversimultaneously appear in the training set and testing set. Werepeated the procedure five times and report the averages ofthe tests below.
We used three criteria to measure the performance of theclassification: ACC (accuracy), AUC (area under the curve),and F1 score.
C. Results
1) Gender prediction performance.: We investigated thegender predictive ability of individual features and combi-nations of different features using different classifiers. TableI summarizes the performance of the classifiers over thesamples. As we can see from Table I, the best performancefor predicting gender is using the DNN model with thecombination of apps and topics, with an ACC of 76.62%, AUCof 84.23%, and F1 score of 0.76, while the icon-based featureperforms the worst (compared to all the feature sets), e.g.,with an ACC of 69.27%, AUC of 72.86%, and F1 score of0.72 for an LR model. The performance of our best modeloutperformed the existing work [19] by about 5% in accuracy(76.62% vs. 71.5% (the original result reported in [19]), and10% in AUC (84.31% vs. 74.0%). The model of DNN with 3hidden layers performs the best for 8 out of the 16 feature sets.The neural network is helpful for feature fusion for inferringgender over most features.
8
TABLE I: Gender prediction results.
Feature Model ACC AUC F1 Feature Model ACC AUC F1
App (1000)
SVM 0.7427 0.8202 0.7364 App+Icon
(1064)
SVM 0.7419 0.8184 0.7383 LR 0.7450 0.8213 0.7427 LR 0.7457 0.8212 0.7437
GBDT 0.7470 0.8176 0.7341 GBDT 0.7421 0.8118 0.7323 DNN 0.7655 0.8424 0.7654 DNN 0.7659 0.8414 0.7726
Topic (300)
SVM 0.7355 0.7969 0.7456 Topic+ Category
(329)
SVM 0.7353 0.8039 0.7420 LR 0.7306 0.7909 0.7392 LR 0.7357 0.7984 0.7404
GBDT 0.7399 0.8034 0.7394 GBDT 0.7429 0.8072 0.7393 DNN 0.7446 0.8122 0.7445 DNN 0.7411 0.8027 0.7338
Category (29)
SVM 0.6919 0.7580 0.6910 Topic+Tag
(600)
SVM 0.7378 0.7963 0.7467 LR 0.6907 0.7545 0.6828 LR 0.7361 0.7984 0.7404
GBDT 0.6977 0.7594 0.6894 GBDT 0.7315 0.7945 0.7226 DNN 0.6987 0.7432 0.6977 DNN 0.7187 0.7890 0.6994
Tag (300)
SVM 0.7240 0.7908 0.7231 Topic+Icon
(364)
SVM 0.7378 0.7963 0.7467 LR 0.7267 0.7965 0.7269 LR 0.7347 0.7965 0.7396
GBDT 0.6881 0.7523 0.6812 GBDT 0.7443 0.8068 0.7362 DNN 0.6987 0.7432 0.6977 DNN 0.7422 0.7992 0.7399
Icon (64)
SVM 0.6885 0.7412 0.6984 Category+ Tag (329)
SVM 0.7297 0.7984 0.7289 LR 0.6927 0.7286 0.6912 LR 0.7318 0.8009 0.7305
GBDT 0.6813 0.7470 0.6748 GBDT 0.7121 0.7730 0.7036 DNN 0.6865 0.7357 0.6812 DNN 0.6901 0.7595 0.6923
App+Topic (1300)
SVM 0.7437 0.8194 0.7421 Category+ Icon (93)
SVM 0.7147 0.7762 0.7196 LR 0.7453 0.8215 0.7438 LR 0.7096 0.7680 0.7098
GBDT 0.7505 0.8181 0.7453 GBDT 0.7183 0.7820 0.7107 DNN 0.7662 0.8423 0.7661 DNN 0.7081 0.7717 0.7211
App+ Category (1029)
SVM 0.7419 0.8174 0.7393 Tag+Icon
(364)
SVM 0.7292 0.7968 0.7318 LR 0.7446 0.8215 0.7419 LR 0.7290 0.7972 0.7304
GBDT 0.7441 0.8126 0.7362 GBDT 0.7086 0.7734 0.7004 DNN 0.7642 0.8424 0.7702 DNN 0.6964 0.7645 0.7056
App+Tag (1300)
SVM 0.7444 0.8181 0.7415
All (1693)
SVM 0.7445 0.8182 0.7437 LR 0.7466 0.8217 0.7442 LR 0.7465 0.8217 0.7450
GBDT 0.7323 0.7959 0.7186 GBDT 0.7423 0.8081 0.7335 DNN 0.7630 0.8357 0.7696 DNN 0.7655 0.8431 0.7653
When we solely used one type of feature, the ACC forapps, topics, tags, categories, and icons is 76.55%, 74.46%,72.67%, 69.87%, and 69.27%, respectively. It indicates thatdiscriminative apps selected by IG and topics learned from appdescription by LDA are the two most useful features for dis-tinguishing gender, while the category-based and icon-basedfeatures are the worst. For the app-based user representationmethod, we selected the top 1000 significant apps that arethe most powerful by applying the IG method. The app-basedfeatures are with binary values and whether each of them wasinstalled or not by one user helps to identify the gender of theuser. For the topics extracted from app description, the topic-based features construct a fine-grained representation of users,where each topic reflects a specific function and the probabilityone user belongs to the topic indicates the user preferences tothe topic. Compared with topic-based features, category-basedfeatures are a relatively coarse grained representation method.There are only 29 dimensions in total, which is very smallcompared to 300 and 1000. The value of each dimension isthe number of installed apps in the corresponding category, andthere are few differences in the values among users. Thus, thecategory-based features are not so powerful to infer gender.Similarly, icon-based representation method is a relativelycoarse grained way, resulting in the difficulty in powerfullyidentifying the gender of each user.
Combining different features do not provide a significantperformance improvement. In particular, combining all fivefeatures achieves an ACC of 76.55%. However, we can achievethe same performance when only using discriminative apps.In addition, the combination of the two feature types of appsand topics (ACC: 76.62%), and the combination of apps andicons (ACC: 76.59%) outperformed the combination of all fivefeature types (by a small margin). In addition, the combinationof some features even degraded the performance. For example,solely using topics resulted in an ACC of 74.46%, but, thecombination of topics and tags resulted in an ACC of 73.78%.
TABLE II: The 10 most disciriminative apps for gender.No. Name Apps IG # Male # Female
1 Mogujie-BeautyShopping 0.01978 202 973
2 Meitu-Photography 0.01904 2002 3401
3 Meilishuo-BeautyShopping 0.01495 142 721
4 AutoHome 0.01423 783 183
5 Meiyou-PeriodTracker 0.01319 144 677
6 Meiyan-BeautyCam 0.01259 655 1477
7 360-BeautyCam 0.01162 900 1768
8 Meipai-BeautyMV 0.01102 821 1639
9 Kuaibo-Video 0.01075 1421 667
10 AdobeFlashPlayer 0.01040 2184 1277
The most powerful features are the app- and topic-based ones,while the category- and icon-based ones are the best.
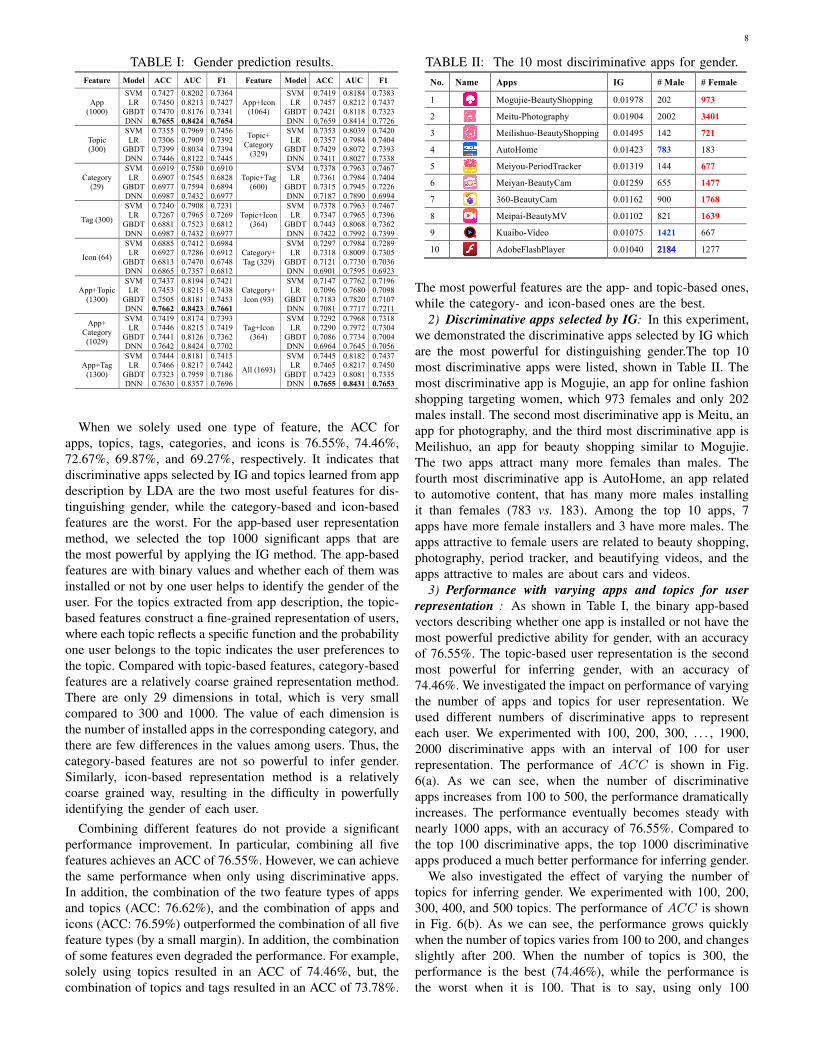
2) Discriminative apps selected by IG: In this experiment,we demonstrated the discriminative apps selected by IG whichare the most powerful for distinguishing gender.The top 10most discriminative apps were listed, shown in Table II. Themost discriminative app is Mogujie, an app for online fashionshopping targeting women, which 973 females and only 202males install. The second most discriminative app is Meitu, anapp for photography, and the third most discriminative app isMeilishuo, an app for beauty shopping similar to Mogujie.The two apps attract many more females than males. Thefourth most discriminative app is AutoHome, an app relatedto automotive content, that has many more males installingit than females (783 vs. 183). Among the top 10 apps, 7apps have more female installers and 3 have more males. Theapps attractive to female users are related to beauty shopping,photography, period tracker, and beautifying videos, and theapps attractive to males are about cars and videos.
3) Performance with varying apps and topics for userrepresentation : As shown in Table I, the binary app-basedvectors describing whether one app is installed or not have themost powerful predictive ability for gender, with an accuracyof 76.55%. The topic-based user representation is the secondmost powerful for inferring gender, with an accuracy of74.46%. We investigated the impact on performance of varyingthe number of apps and topics for user representation. Weused different numbers of discriminative apps to representeach user. We experimented with 100, 200, 300, . . . , 1900,2000 discriminative apps with an interval of 100 for userrepresentation. The performance of ACC is shown in Fig.6(a). As we can see, when the number of discriminativeapps increases from 100 to 500, the performance dramaticallyincreases. The performance eventually becomes steady withnearly 1000 apps, with an accuracy of 76.55%. Compared tothe top 100 discriminative apps, the top 1000 discriminativeapps produced a much better performance for inferring gender.
We also investigated the effect of varying the number oftopics for inferring gender. We experimented with 100, 200,300, 400, and 500 topics. The performance of ACC is shownin Fig. 6(b). As we can see, the performance grows quicklywhen the number of topics varies from 100 to 200, and changesslightly after 200. When the number of topics is 300, theperformance is the best (74.46%), while the performance isthe worst when it is 100. That is to say, using only 100
9
500 1000 1500 2000Number of discriminative apps
0.65
0.67
0.69
0.71
0.73
0.75
0.77AC
C
(a)
100 200 400 500300Number of topics
0.72
0.73
0.74
0.75
ACC
(b)
Fig. 6: Performance with varying number of (a) discriminativeapps and (b) topics.
FemaleMalePredicted label
(a)
Apps
Proportion of the users in each predicted group installing the app
Male à Female
Maleà Male
Femaleà Male
Femaleà Female
1 Mogujie- BeautyShopping 8.99% 0.50% 1.00% 16.21%
2 Meitu- Photography 37.67% 22.88% 19.42% 52.35%
3 Meilishuo- BeautyShopping 6.62% 0.25% 0.50% 12.08%
4 AutoHome- Car 1.60% 13.51% 7.21% 1.15%
5 Meiyou- PeriodTracker 5.63% 0.63% 1.25% 11.13%
6 Meiyan- BeautyCam 16.28% 6.11% 5.95% 23.41%
7 360- BeautyCam 18.04% 9.90% 9.77% 27.30%
8 Meipai- BeautyMV 16.69% 8.95% 6.83% 25.91%
9 Kuaibo- Video 5.94% 23.47% 16.10% 6.94%
10 Adobe FlashPlayer 12.45% 34.91% 21.67% 15.77%
(b)
Fig. 7: (a) Confusion matrix. (b) The proportion of the usersin each predicted group installing the significant apps selectedby IG. Apps in red (female apps) are installed by more femalesthan males in the dataset, and the apps in blue (male apps)are installed by more males than females.
interests learned by LDA is not enough for optmizing genderinferring. Using 300 topics for user representation is advisablefor inferring gender.
VI. ERROR ANALYSIS
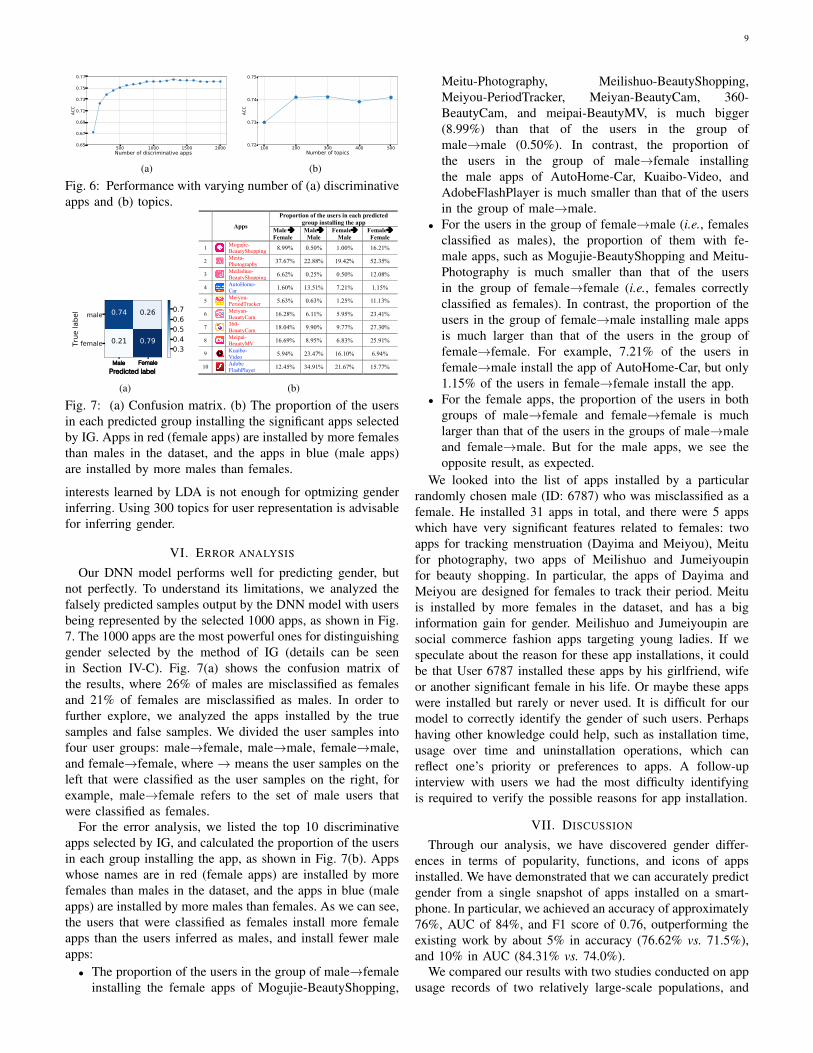
Our DNN model performs well for predicting gender, butnot perfectly. To understand its limitations, we analyzed thefalsely predicted samples output by the DNN model with usersbeing represented by the selected 1000 apps, as shown in Fig.7. The 1000 apps are the most powerful ones for distinguishinggender selected by the method of IG (details can be seenin Section IV-C). Fig. 7(a) shows the confusion matrix ofthe results, where 26% of males are misclassified as femalesand 21% of females are misclassified as males. In order tofurther explore, we analyzed the apps installed by the truesamples and false samples. We divided the user samples intofour user groups: male→female, male→male, female→male,and female→female, where → means the user samples on theleft that were classified as the user samples on the right, forexample, male→female refers to the set of male users thatwere classified as females.
For the error analysis, we listed the top 10 discriminativeapps selected by IG, and calculated the proportion of the usersin each group installing the app, as shown in Fig. 7(b). Appswhose names are in red (female apps) are installed by morefemales than males in the dataset, and the apps in blue (maleapps) are installed by more males than females. As we can see,the users that were classified as females install more femaleapps than the users inferred as males, and install fewer maleapps:
• The proportion of the users in the group of male→femaleinstalling the female apps of Mogujie-BeautyShopping,
Meitu-Photography, Meilishuo-BeautyShopping,Meiyou-PeriodTracker, Meiyan-BeautyCam, 360-BeautyCam, and meipai-BeautyMV, is much bigger(8.99%) than that of the users in the group ofmale→male (0.50%). In contrast, the proportion ofthe users in the group of male→female installingthe male apps of AutoHome-Car, Kuaibo-Video, andAdobeFlashPlayer is much smaller than that of the usersin the group of male→male.
• For the users in the group of female→male (i.e., femalesclassified as males), the proportion of them with fe-male apps, such as Mogujie-BeautyShopping and Meitu-Photography is much smaller than that of the usersin the group of female→female (i.e., females correctlyclassified as females). In contrast, the proportion of theusers in the group of female→male installing male appsis much larger than that of the users in the group offemale→female. For example, 7.21% of the users infemale→male install the app of AutoHome-Car, but only1.15% of the users in female→female install the app.
• For the female apps, the proportion of the users in bothgroups of male→female and female→female is muchlarger than that of the users in the groups of male→maleand female→male. But for the male apps, we see theopposite result, as expected.
We looked into the list of apps installed by a particularrandomly chosen male (ID: 6787) who was misclassified as afemale. He installed 31 apps in total, and there were 5 appswhich have very significant features related to females: twoapps for tracking menstruation (Dayima and Meiyou), Meitufor photography, two apps of Meilishuo and Jumeiyoupinfor beauty shopping. In particular, the apps of Dayima andMeiyou are designed for females to track their period. Meituis installed by more females in the dataset, and has a biginformation gain for gender. Meilishuo and Jumeiyoupin aresocial commerce fashion apps targeting young ladies. If wespeculate about the reason for these app installations, it couldbe that User 6787 installed these apps by his girlfriend, wifeor another significant female in his life. Or maybe these appswere installed but rarely or never used. It is difficult for ourmodel to correctly identify the gender of such users. Perhapshaving other knowledge could help, such as installation time,usage over time and uninstallation operations, which canreflect one’s priority or preferences to apps. A follow-upinterview with users we had the most difficulty identifyingis required to verify the possible reasons for app installation.
VII. DISCUSSION
Through our analysis, we have discovered gender differ-ences in terms of popularity, functions, and icons of appsinstalled. We have demonstrated that we can accurately predictgender from a single snapshot of apps installed on a smart-phone. In particular, we achieved an accuracy of approximately76%, AUC of 84%, and F1 score of 0.76, outperforming theexisting work by about 5% in accuracy (76.62% vs. 71.5%),and 10% in AUC (84.31% vs. 74.0%).
We compared our results with two studies conducted on appusage records of two relatively large-scale populations, and
10
our performance is nearly on par with their results. The twostudies used one-month and four-month long datasets, whereaswe used only a single snapshot of smartphone apps installed.Malmi et al. studied the lists of apps used at once within onemonth, and inferred 3760 Android users’ gender using logisticregression with an accuracy of 82% [22]. Qin et al. analyzedthe app usage logs over four months, and inferred about 32,000users’ gender with a F1 score of 0.80 and accuracy of 81%[21]. Compared with the two studies, our model had onlyabout a 5% drop in accuracy, and similar F1 score as Qin’sstudy. Compared to a single snapshot of apps installed on asmartphone, monitoring app usage on a smartphone can bea resource-intensive task, which is more expensive and time-consuming. Moreover, monitoring and recording historical appusage records is intrusive, while the lists of apps installedcan be obtained without requiring users’ permission. Thecomparison shows that the single snapshot of smartphoneapps installed provides comparable performance to app usagerecords that require tracking app usage over a period of time.
A. Practical implications1) Gender profiling to address cold-start problem: The
approach we described in this paper builds a gender profilefrom the snapshot of apps installed on a user’s smartphone,and its performance compares favorably to user tracking tech-niques that can be expensive, time-consuming, and intrusive.A user’s gender can instead be quickly determined by a singleaccess of his/her list of installed apps. Gender profiling withour method could potentially be used in conjunction withuser tracking technologies to address the cold-start problemin tracking-based systems. The cold-start problem can becharacterized by an inference system that has difficulty makinginferences due to a lack of a sufficient amount of data. Byusing gender to base decisions on, especially at the beginningof data collection, systems can provide a potentially better userexperience until a sufficient amount of data has been collectedover a period of time for training more sophisticated models.
2) Improving user experience of smartphone usage: Weforesee many opportunities of gender profiling for improv-ing the user experience of smartphone usage. Mobile phonedesigners, mobile carriers, and application developers canimprove services and devices based on the gender differencesin installed app lists. In particular, mobile phone designers candesign smartphones that are targeted towards improving theuser experience of females or males by providing features thatfemales (or males) may value more than males (or females).For example,females may value an improved camera sensorsince they have greater interest in taking selfie. Mobile carrierscould allow for the customization of what apps are madeavailable for females and males based on the most discrimi-native apps and the top interests. For example, mobile carrierscan pre-install apps related to automotive cars for male users.Application developers can recommend apps to females andmales according to their interests, and provide personalizedapplications. After inferring gender from the installed app lists,app developers can recommend specific apps that males orfemales are the most interested in (e.g., by using a list similarto the top discriminative apps as we discuss earlier).
B. Theoretical Implications
We believe our findings provide a support for existingtheories. For example, beauty-related apps attract more femaleusers than males. Females pay more attention to their ap-pearance in the sociocultural climate surrounding them wherehow they look like are capable of representing them [30]. Itis the association between women’s worth and their physicalappearance that explains their preferences for apps that canimprove their looks and feelings. Users of car apps are mostlymale, reflecting that men’s relationships with cars are premisedon passion and pleasure [31]. The finding that females havemore apps in pink and males installing more apps in differentshades of blue, is consistent with Cohen’s conclusion thatfemales prefer pink more than males do and males preferringblue more than females do [32]. It could also reflect, however,that app developers tend to use female-oriented colors (e.g.,pink) for the icons of apps developed primarily for females(and vice-versa for males).
C. Limitations
Although we showed the interest differences in installed applists between females and males, we must acknowledge thelimitations of the dataset used in this study. First, most users inour dataset were from China, and the conclusions we obtainedwere mainly for a Chinese population. Although females in theworld have similarities, as do males, whether our conclusionscan be generalized to user populations from other countries isstill unknown. It requires further investigation into the genderdifferences in installed app lists for other user populations.Second, we investigated gender differences from a snapshot ofinstalled app lists, without information on how frequently anapp is used. Some apps installed may rarely be used, whereasothers may be frequently used. It would be interesting toexplore gender differences through app usage behaviors as partof future work.
Another important limitation is that the labels provided forusers to select from to indicate their gender was limited tofemale and male. In some cultures, it is becoming more com-mon to provide non-binary options for individuals to indicatetheir gender. Such options would increase the complexity andchallenge of gender profiling.
Finally, while there are clearly some benefits of being ableto identify gender from smartphone data, there are also somerisks. Having a system that can identify whether a phone useris male or female could be used to target individuals. As well,while our approach works because of what may appear to bestereotypes (or adherence to normative structural gender [33])about males and females (e.g., males like cars and females likepink), it works because the stereotypes to some degree holdtrue for the individuals in our dataset. As these stereotypesbecome less representative of actual gendered differences,there is still the risk that app developers may ‘enforce’ thesestereotypes through the designs of their apps, both in the iconsand text used to describe them, and in how they are marketed.It will require further study to better understand these risks.
11
VIII. CONCLUSION AND FUTURE WORK
In this work, we have presented an empirical study of genderprofiling from a snapshot of installed smartphone apps. Weconducted our study based on a large-scale dataset of installedapp lists from 15,000 Android users. We demonstrated thegender differences in terms of popularity, functions, and iconsof apps installed. Then, we extracted features from a snapshotof apps installed on smartphones to infer the gender of eachuser. Sequentially, we investigated the gender predictive abilityof individual features and combinations of different features.The combination of apps selected by Information Gain and thetopics learned from app descriptions using LDA provides thebest gender classification results, outperforming the existingwork by about 5% in accuracy (76.62% vs. 71.5%), andabout 10% in AUC (84.23% vs. 74.0%). This performancefrom a one-time snapshot is nearly on par with the state-of-the-art gender profiling results based on months of collectedapp usage data. Finally, we performed an error analysis onour misclassified users and discussed the implications of ourfindings and the limitations of this work.
To address the limitations in correctly inferring gender froma subset of our population, we plan to conduct follow-upinterviews to understand the choice for app installations. Inaddition, our method can potentially be readily extended to aseries of other user attributes, such as age, income level, andoccupation. In our future work, we will explore the differencesamong other user attributes from a snapshot of apps installedon a smartphone. Further, we will explore the risks associatedwith identifying these types of attributes from smartphonedata.
IX. ACKNOWLEDGMENT
This work was supported by National Key R&D Programof Chin (2018YFC1504006), NSF of China (No. 61772460,61802340, and 61802342), China Postdoctoral Science Foun-dation under Grant No. 2017M620246 and 2018T110591. Dr.Gang Pan is the corresponding author.
REFERENCES
[1] F. Ahmed and M. H. Kabir, “Facial feature representation with di-rectional ternary pattern (dtp): Application to gender classification,” inIRI’12. IEEE, 2012, pp. 159–164.
[2] J. A. Howard and J. A. Hollander, Gendered situations, gendered selves:A gender lens on social psychology. Rowman & Littlefield, 1997, vol. 2.
[3] H.-C. Kim, D. Kim, Z. Ghahramani, and S. Y. Bang, “Appearance-basedgender classification with gaussian processes,” Pattern Recognition Let-ters, vol. 27, no. 6, pp. 618–626, 2006.
[4] J. Wang, Y. Wang, D. Zhang, J. Goncalves, D. Ferreira, A. Visuri,and S. Ma, “Learning-assisted optimization in mobile crowd sensing:A survey,” TII, vol. 15, no. 1, pp. 15–22, 2019.
[5] M. C. Grace, W. Zhou, X. Jiang, and A.-R. Sadeghi, “Unsafe exposureanalysis of mobile in-app advertisements,” in WISEC’12. ACM, 2012,pp. 101–112.
[6] S. G. Mazman and Y. K. Usluel, “Gender differences in using socialnetworks,” TOJET, vol. 10, no. 2, 2011.
[7] N. L. Muscanell and R. E. Guadagno, “Make new friends or keep the old:Gender and personality differences in social networking use,” Computersin Human Behavior, vol. 28, no. 1, pp. 107–112, 2012.
[8] V. Kisekka, S. Bagchi-Sen, and H. R. Rao, “Extent of private informationdisclosure on online social networks: An exploration of facebook mobilephone users,” Computers in human behavior, vol. 29, no. 6, pp. 2722–2729, 2013.
[9] X. Lu, W. Ai, X. Liu, Q. Li, N. Wang, G. Huang, and Q. Mei, “Learningfrom the ubiquitous language: an empirical analysis of emoji usage ofsmartphone users,” in UbiComp’16. ACM, 2016, pp. 770–780.
[10] M. Al-Qurishi, M. S. Hossain, M. Alrubaian, S. M. M. Rahman, andA. Alamri, “Leveraging analysis of user behavior to identify maliciousactivities in large-scale social networks,” TII, vol. 14, no. 2, pp. 799–813,2018.
[11] M. Zhou, “Gender difference in web search perceptions and behavior:Does it vary by task performance?” Computers & Education, vol. 78,pp. 174–184, 2014.
[12] M. Roy and M. T. Chi, “Gender differences in patterns of searching theweb,” Journal of Educational Computing Research, vol. 29, no. 3, pp.335–348, 2003.
[13] F. Lamberti, G. Paravati, V. Gatteschi, and A. Cannavo, “Supportingweb analytics by aggregating user interaction data from heterogeneousdevices using viewport-dom-based heat maps,” TII, vol. 13, no. 4, pp.1989–1999, 2017.
[14] I. Andone, K. Błaszkiewicz, M. Eibes, B. Trendafilov, C. Montag, andA. Markowetz, “How age and gender affect smartphone usage,” inUbiComp’16: Posters, 2016, pp. 9–12.
[15] D. Rao, D. Yarowsky, A. Shreevats, and M. Gupta, “Classifying latentuser attributes in twitter,” in SMUC’10, 2010, pp. 37–44.
[16] B. Bi, M. Shokouhi, M. Kosinski, and T. Graepel, “Inferring thedemographics of search users: Social data meets search queries,” inWWW’13, 2013, pp. 131–140.
[17] Y. Dong, Y. Yang, J. Tang, Y. Yang, and N. V. Chawla, “Inferringuser demographics and social strategies in mobile social networks,” inSIGKDD’14. ACM, 2014, pp. 15–24.
[18] S. Brdar, D. Culibrk, and V. Crnojevic, “Demographic attributes predic-tion on the real-world mobile data,” in 2012 Mobile Data Challenge byNokia Workshop, 2012.
[19] S. Seneviratne, A. Seneviratne, P. Mohapatra, and A. Mahanti, “Yourinstalled apps reveal your gender and more!” ACM SIGMOBILE MobileComputing and Communications Review, vol. 18, no. 3, pp. 55–61, 2015.
[20] S. Zhao, S. Li, J. Ramos, Z. Luo, Z. Jiang, A. K. Dey, and G. Pan,“User profiling from their use of smartphone applications: A survey,”Pervasive and Mobile Computing, p. 101052, 2019.
[21] Z. Qin, Y. Wang, H. Cheng, Y. Zhou, Z. Sheng, and V. Leung, “De-mographic information prediction: A portrait of smartphone applicationusers,” TETC, 2016.
[22] E. Malmi and I. Weber, “You are what apps you use: Demographicprediction based on user’s apps,” arXiv preprint arXiv:1603.00059,2016.
[23] Y. Wang, Y. Tang, J. Ma, and Z. Qin, “Gender prediction based on datastreams of smartphone applications,” in BIGCOM’15. Springer, 2015,pp. 115–125.
[24] K. Mo, B. Tan, E. Zhong, and Q. Yang, “Report of task 3: Your phoneunderstands you,” in 2012 Mobile Data Challenge by Nokia Workshop,2012.
[25] S. Zhao, J. Ramos, J. Tao, Z. Jiang, S. Li, Z. Wu, G. Pan, and A. K.Dey, “Discovering different kinds of smartphone users through theirapplication usage behaviors,” in UbiComp’16. ACM, 2016, pp. 498–509.
[26] R. A. Fisher, “Statistical methods for research workers,” in Break-throughs in Statistics. Springer, 1992, pp. 66–70.
[27] T. M. Mitchell et al., “Machine learning.” McGraw-Hill Boston, MA:,1997.
[28] S. Li, Z. Zhao, R. Hu, W. Li, T. Liu, and X. Du, “Analogical reasoningon chinese morphological and semantic relations,” in ACL’18 (Volume2: Short Papers). Association for Computational Linguistics, 2018, pp.138–143.
[29] A. Miniukovich and A. De Angeli, “Pick me!: Getting noticed on googleplay,” in CHI’16. ACM, 2016, pp. 4622–4633.
[30] N. A. Heflick, J. L. Goldenberg, D. P. Cooper, and E. Puvia, “Fromwomen to objects: Appearance focus, target gender, and perceptionsof warmth, morality and competence,” Journal of Experimental SocialPsychology, vol. 47, no. 3, pp. 572–581, 2011.
[31] C. Landstrom, “A gendered economy of pleasure: Representions of carsand humans in motoring magazines,” Science & Technology Studies,2006.
[32] P. N. Cohen, “Children’s gender and parents’ color preferences,”Archives of Sexual Behavior, vol. 42, no. 3, pp. 393–397, 2013.
[33] S. G. Harding, The science question in feminism. Cornell UniversityPress, 1986.
12
Sha Zhao is currently a Postdoctoral ResearchFellow of the College of Computer Science andTechnology, Zhejiang University. She received thePh.D. degree from Zhejiang University, Hangzhou,China, in 2017. Zhao visited the Human-ComputerInteraction Institute at Carnegie Mellon Universityas a visiting PhD student from September 2015to September 2016. Her research interests includepervasive computing, mobile sensing, data mining,and machine learning. She won the Best PaperAward of ACM UbiComp’16.
Yizhi Xu is currently a Master candidate of the Col-lege of Computer Science and Technology, ZhejiangUniversity, Hangzhou, China. He received his B.Sc. degree in Electrical Engineering from ZhejiangUniversity, Hangzhou, China, in 2017. His researchinterests include machine learning and data mining.
Xiaojuan Ma is an assistant professor of Human-Computer Interaction (HCI) at the Departmentof Computer Science and Engineering (CSE),Hong Kong University of Science and Technol-ogy (HKUST). She received the Ph.D. degree inComputer Science at Princeton University. She wasa post-doctoral researcher at the Human-ComputerInteraction Institute (HCII) of Carnegie Mellon Uni-versity (CMU), and before that a research fellowin the National University of Singapore (NUS) inthe Information Systems department. Before joining
HKUST, she was a researcher of Human-Computer Interaction at Noah’s ArkLab, Huawei Tech. Investment Co., Ltd. in Hong Kong. Her background isin Human-Computer Interaction. She is particularly interested in data-drivenhuman-engaged AI and Human-Robot Interaction in the domain of education,health, and design.
Ziwen Jiang received his B. Sc. degree in SoftwareEngineering from Zhejiang University, Hangzhou,China, in 2015 and Master degree in ComputerScience from Zhejiang University, Hangzhou, China,in 2018. He is a staff of Alibaba, Hangzhou, China.His research interests include machine learning anddata mining.
Zhiling Luo was an Assistant Professor in ComputerScience at Zhejiang University, China. He receivedhis B.S. and Ph.D. degree in Computer Science fromZhejiang University in 2012 and 2017, respectively.He was the visiting scholar of Georgia Instituteof Technology, US, in 2016. His research interestsinclude service computing, machine learning anddata mining.
Shijian Li is currently with the College of ComputerScience and Technology, Zhejiang University. Hereceived the Ph.D. degree from Zhejiang University,Hangzhou, China, in 2006.In 2010, he was a VisitingScholar with the Institute Telecom SudParis, Evry,France. He was published over 40 papers. His re-search interests include sensor networks, ubiquitouscomputing, and social computing. Dr. Li serves asan Editor of the International Journal of DistributedSensor Networks and as Reviewer or PC Member ofmore than ten conferences.
Laurence T. Yang received the B.E. degree inComputer Science and Technology and B.Sc degreefrom Applied Physics both from Tsinghua Uni-versity, China and the PhD degree in ComputerScience from University of Victoria, Canada. Heis a professor and W.F. James Research Chair inDepartment of Computer Science, St. Francis XavierUniversity, Canada. His research interests includeparallel and distributed computing, embedded andubiquitous/pervasive computing, and big data. Hisresearch has been supported by the National Sci-
ences and Engineering Research Council, and the Canada Foundation forInnovation.
Anind Dey is a Professor and Dean of the Infor-mation School and Adjunct Professor in the Depart-ment of Human-Centered Design and Engineering,University of Washington. Anind is renowned for hisearly work in context-aware computing. His researchis at the intersection of human-computer interaction,machine learning, and ubiquitous computing. Anindhas focused on passively collecting large amountsof data about how people interact with their phonesand the objects around them, to use for producingdetection and classification models for human be-
haviors of interest. He applies a human-centered and problem-based approachthrough a collaboration with an amazing collection of domain experts in areasof substance abuse (alcohol, marijuana, opioids), mental health, driving andtransportation needs, smart spaces, sustainability, and education. Anind wasinducted into the ACM SIGCHI Academy for his significant contributions tothe field of human-computer interaction in 2015.
Gang Pan received the B.Eng. and Ph.D. degreesfrom Zhejiang University, China, in 1998 and 2004,respectively. He is currently a professor of the De-partment of Computer Science, and deputy directorof State Key Lab of CAD&CG, Zhejiang Univer-sity, China. From 2007 to 2008, he was a visitingscholar at the University of California, Los Angeles.His current interests include artificial intelligence,pervasive computing, brain-inspired computing, andbrain-machine interfaces. He received three bestpaper awards (e.g. ACM UbiComp’16) and three
nominations from premier international conferences. He is the recipient ofIEEE TCSC Award for Excellence (Middle Career Researcher), CCF-IEEE CSYoung Computer Scientist Award, and the State Scientific and TechnologicalProgress Award. He serves as an Associate Editor of IEEE Trans. NeuralNetworks and Learning Systems, IEEE Systems Journal, Pervasive and MobileComputing, and ACM Proceedings of Interactive, Mobile, Wearable andUbiquitous Technologies (IMWUT).