GENDER INFLUENCE ON SOIL FERTILITY AND WATER …
94
GENDER INFLUENCE ON SOIL FERTILITY AND WATER MANAGEMENT TECHNOLOGIES UPTAKE AMONG SMALLHOLDER FARMERS IN THARAKA NITHI COUNTY AMOS MWENDA NDEKE A THESIS SUBMITTED IN PARTIAL FULFILMENT OF THE REQUIREMENTS FOR THE AWARD OF THE DEGREE OF MASTER OF SCIENCE IN AGRICULTURAL ECONOMICS OF THE UNIVERSITY OF EMBU SEPTEMBER, 2021
Transcript of GENDER INFLUENCE ON SOIL FERTILITY AND WATER …
GENDER INFLUENCE ON SOIL FERTILITY AND WATER
MANAGEMENT TECHNOLOGIES UPTAKE AMONG
SMALLHOLDER FARMERS IN THARAKA NITHI COUNTY
AMOS MWENDA NDEKE
A THESIS SUBMITTED IN PARTIAL FULFILMENT OF THE
REQUIREMENTS FOR THE AWARD OF THE DEGREE OF
MASTER OF SCIENCE IN AGRICULTURAL ECONOMICS OF
THE UNIVERSITY OF EMBU
SEPTEMBER, 2021
ii
DECLARATION
This thesis is my original work and has not been presented elsewhere for a degree or any
other award.
Signature……………………………… Date ……………………
Amos Mwenda Ndeke
Department of Agricultural Economics and Extension
A510/1187/2017
This thesis has been submitted for examination with our approval as University
Supervisors.
Signature……………………………… Date ……………………
Dr. Hezron Rasugu Mogaka
Department of Agricultural Economics and Extension
University of Embu
Signature……………………………… Date …………………….
Prof. Jayne Njeri Mugwe
Department of Agricultural Resource Management
Kenyatta University
Signature……………………………… Date …………………….
Prof. George Nyabuga
School of Journalism and Mass Communication
University of Nairobi

iii
DEDICATION
This work is dedicated to my parents Mr. and Mrs. Ndeke, thank you for the incessant love
and backing.

iv
ACKNOWLDEGEMENT
I thank Almighty God for the love, care and gift of good health which enabled me through
this work. I extend my profound gratitude to Prof. Daniel Mugendi Njiru for funding this
research under VLIR-OUS project, “Climate-Smart Options Allowing Agricultural
Intensification Among Smallholder Farmers in the Dry Zones of the Central Highlands of
Kenya” which is a rare chance. I also sincerely appreciate the project team for their tireless
and invaluable contributions. My special thanks goes to my supervisors, Dr Hezron
Mogaka, Prof. Jayne Mugwe and Prof. George Nyabuga for their guidance and relentless
support. Have my gratitude and appreciation. I am equally indebted to the course lecturers
for the invaluable insights, advice and constructive criticism towards development of this
work. Much gratitude to my colleagues, Nathan, Jane, Maureen, Kanana, Mercy, Collins,
Lemarpe, Kennedy, Susan, Lydia, Debra and Mwaura for sharing useful ideas during the
entire period of my study. Special thanks to the team of enumerators and farmers in Tharaka
South sub-county for their enthusiasm and teamwork during the entire period of field work.
I also recognize the untiring support given by extension workers and the local
administration in the study area: you are the partners indeed.
v
TABLE OF CONTENTS
DECLARATION ............................................................................................................... ii
DEDICATION .................................................................................................................. iii
ACKNOWLDEGEMENT ................................................................................................ iv
LIST OF TABLES .......................................................................................................... viii
LIST OF FIGURES .......................................................................................................... ix
LIST OF APPENDICES .................................................................................................... x
ABBREVIATIONS AND ACRONYMS ......................................................................... xi
ABSTRACT ..................................................................................................................... xii
CHAPTER ONE ................................................................................................................ 1
INTRODUCTION ............................................................................................................. 1
1.1 Background of the study .............................................................................................. 1
1.2 Statement of the problem ............................................................................................. 3
1.3 Research objectives ...................................................................................................... 4
1.3.1 General objective ...................................................................................................... 4
1.3.2 Specific objectives .................................................................................................... 4
1.4 Research questions ....................................................................................................... 4
1.5 Justification of the study .............................................................................................. 4
1.6 Scope and limitation of the study................................................................................. 5
CHAPTER TWO ............................................................................................................... 6
LITERATURE REVIEW .................................................................................................. 6
2.1 Overview ...................................................................................................................... 6
2.2 The concept of soil and water conservation ................................................................. 6
2.3 Soil and water conservation strategies ......................................................................... 7
2.3.1 The zai technology .................................................................................................... 7
2.3.2 Mineral fertiliser use ................................................................................................. 8
2.4 Preference, choice and use intensity of agricultural technologies ............................. 10
2.5 Determinants of choice and use intensity .................................................................. 12
2.6 Gender integration in agricultural technology uptake ............................................... 16
2.7 Gaps in literature review ............................................................................................ 17
vi
2.8 Theoretical framework ............................................................................................... 17
2.9 Conceptual framework ............................................................................................... 19
2.10 Operationalizing variables ....................................................................................... 20
2.10.1 Choice of dependent and independent variables ................................................... 20
CHAPTER THREE ......................................................................................................... 22
RESEARCH METHODOLOGY..................................................................................... 22
3.1 Description of the study area ..................................................................................... 22
3.2 Research design ......................................................................................................... 24
3.3 Target population and sample size ............................................................................. 24
3.4 Sampling strategy....................................................................................................... 24
3.5 Data collection methods and instruments and ethical considerations ........................ 25
3.6 Data processing and statistical analysis ..................................................................... 26
3.7 Model diagnostics ...................................................................................................... 27
3.8 Methods of analysis ................................................................................................... 27
3.8.1 Objective one: Gendered preference for technologies attributes ............................ 27
3.8.2 Objective two and three: Examining the determinants of choice and use intensity
of selected technologies ................................................................................................... 28
3.8.2.1The analytical framework: Heckman's two-step procedure .................................. 28
3.8.2.2 Empirical model specification ............................................................................. 30
CHAPTER FOUR ............................................................................................................ 33
RESULTS ........................................................................................................................ 33
4.1 Overview .................................................................................................................... 33
4.2 Gender differences in soil and water conservation technology use ........................... 33
4.3 Gender differences in land under technologies .......................................................... 35
4.4 Preference for zai technology and mineral fertilizer attributes by gender ................. 36
4.4.1 Preference for zai technology and mineral fertiliser ............................................... 37
4.5 Comparison of zai technology users and non-users by gender .................................. 39
4.6 Determinants of zai technology choice by gender ..................................................... 42
4.7 Determinants of zai technology use-intensity by gender ........................................... 42
4.8 Comparison of mineral fertiliser users and non-users by gender .............................. 44

vii
4.9 Determinants of mineral fertiliser choice by gender.................................................. 48
4.10 Determinants of mineral fertiliser use-intensity by gender...................................... 48
CHAPTER FIVE ............................................................................................................. 49
DISCUSSION, CONCLUSIONS, AND RECOMMENDATIONS ................................ 49
5.1 Overview .................................................................................................................... 49
5.2 Discussion .................................................................................................................. 49
5.2.1 Socioeconomic characteristics of zai technology and mineral fertiliser users ....... 49
5.2.2 Preferences for zai technology and mineral fertiliser attributes by gender ............ 50
5.2.3 Determinants of zai technology and mineral fertiliser choice and use intensity .... 53
5.3 Conclusions ................................................................................................................ 58
5.4 Recommendations ...................................................................................................... 58
5.5 Areas of further research ............................................................................................ 59
REFERENCES ................................................................................................................ 60
APPENDICES ................................................................................................................. 73
viii
LIST OF TABLES
Table 2.1: Descriptions and units of measurement of hypothesized variables ................. 21
Table 3.1: Sampled wards and their number of respondents …………………………….25
Table 4.1: Demographic characteristics of sample households ..........................................33
Table 4.2: Household level soil and water conservation technology uptake by gender ... 34
Table 4.3: Land allocation under different technologies by gender ................................. 35
Table 4.4: Farmers perceptions of zai technology and mineral fertilizers attributes ........ 36
Table 4.5: Four themes emerging from the analyses of the qualitative data .................... 38
Table 4.6: Demographic factors influencing zai technology choice and use-intensity
disaggregated by gender of the household head ............................................ 39
Table 4.7: Socioeconomic factors influencing zai technology choice and use-intensity
disaggregated by gender of the household head ............................................ 41
Table 4.8: Estimated coefficient and the marginal effects of the Heckman 2-stage model
on determinants of zai technology choice and use-intensity disaggregated by
gender of the household head......................................................................... 43
Table 4.9: Demographic factors influencing mineral fertiliser choice and use-intensity
disaggregated by gender of the household head ............................................ 44
Table 4.10: Socioeconomic factors influencing mineral fertiliser choice and use-intensity
disaggregated by gender of the household head ............................................ 45
Table 4.11: Estimated coefficient and the marginal effects of the Heckman 2-stage model
on determinants of mineral fertiliser choice and use-intensity disaggregated by
gender of the household head......................................................................... 47
ix
LIST OF FIGURES
Figure 2.1: Conceptual framework ................................................................................... 19
Figure 3.1: Map of the study area ..................................................................................... 23
Figure 4.1: Farmers level of usage of soil and water management techniques ................ 34
Figure 4.2: Trends in land allocation under different soil management techniques ......... 35

x
LIST OF APPENDICES
Appendix 1: Questionnaire .............................................................................................. 73
Appendix 2: Checklist for focus group discussion .......................................................... 79
Appendix 3: Field updates ............................................................................................... 80
xi
ABBREVIATIONS AND ACRONYMS
AEZs : Agro-Ecological Zones
ANOVA : Analysis of Variance
FFHs : Female Headed Households
FGDs : Focus Group Discussions
HH : Household Head
IL : inner/Intermediate Lowland
IMR : Inverse Mill’s Ratio
ISFM : Integrated Soil Fertility Management
IPCC : Intergovernmental Panel on Climate Change
LM : Lower Midland
MLE : Maximum Likelihood Estimation
MMHs : Male Headed Households
ODK : Open Data Kit
SPSS : Statistical Packages for Social Scientists
SSA : Sub-Saharan Africa
SWC : Soil and Water Conservation
TLU : Tropical Livestock Units
xii
ABSTRACT
Degraded landscapes and soil water stress are long-standing problems to smallholder
agriculture in the drylands. Despite the important roles of soil and water conservation in
restoring degraded landscapes and improving agricultural productivity, the technologies
are yet to be adopted to their fullest extent. This can be attributed to gender-linked
disparities in agricultural technology utilization. This study, therefore, sought to evaluate
gender-specific choice and use-intensity determinants of soil and water management
technologies and preference for technology attributes by women and men farmers. Mixed-
methods approach was employed to collect two sets of data; quantitative and qualitative
data. Quantitative data were collected in a cross-sectional survey using an interviewer-
administered questionnaire in Tharaka South sub-county. A multistage sampling technique
was employed in randomly selecting 133 female-headed households and 267 male-headed
households. Purposively, across the study sites, three Focus Group Discussions were
engaged to gather qualitative data on most preferred technology attributes. Using sex-
disaggregated data, Chi-square and t-test statistic were employed to test the statistical
significance of dummy and mean value of continuous variables, respectively. Gender
influence in preference for soil and water conservation technologies specific-attributes was
measured in a ten-point scoring scale. T-test was used to determine if there were significant
differences between the average scores of each attribute among male-headed households
and female-headed households. One-way analysis of variance was run to determine
presence of statistical evidence that associated attributes average scores were significantly
different with respect to household headship. Tukey’s Honestly Significant Difference test
was used to compare all possible pairs of means. Gender specific determinants of zai
technology choice and use-intensity were determined using the Heckman-two-step
econometric model. The results revealed that, significant gender differences existed in
preference, choice and use-intensity of zai technology and mineral fertiliser. In regard to
preference, women farmers are more sensitive to soil fertility and information availability
characteristics when considering soil and water conservation measures whereas male
farmers are more inclined towards technologies that increase yields and improve soil
fertility. Among women farmers, total cultivated land, access to animal-drawn farm
implements, and group membership had an influence on zai technology and mineral
fertiliser choice. For men, total cultivated land, group membership and access to extension
services positively influenced choice of zai technology and mineral fertiliser. With regard
to zai technology and mineral fertiliser use-intensity, total land cultivated, livestock
densities, group membership and frequency of trainings on soil and water management
were important determinants among women farmers. For men, total cultivated land and
farmers’ perceptions on soil erosion were significant drivers for zai and mineral fertiliser
use intensity. The study recommends that, gender-sensitive farm-level policies oriented
towards farmer socioeconomic profiles are important deliberations towards choice and
intense application of preferred soil and water conservation strategies such as the zai
technology and mineral fertiliser.

1
CHAPTER ONE
INTRODUCTION
1.1 Background of the study
Climate change exacerbates food insecurity as variations in agroclimatic conditions
impinge sustainable food production, especially in the dryland systems (IPCC, 2014;
Farooq & Siddique, 2017). As was noted by White et al. (2002), arid and semi-arid lands
cover about 40% of land surface globally, but most extensive in Africa (13×l06 km2).
Correspondingly, in sub-Sahara Africa (SSA), there is a high incidence of food insecurity
where rain-fed subsistence agriculture remains a predominant livelihood strategy for most
people residing in the drylands (Shahid & Al-Shankiti, 2013; Barbier & Hochard, 2018).
These regions experience erratic rainfall, recurrent dry spells, increasing temperatures, and
infertile lands characterized by; diminishing organic matter and reduced biological activity,
and this poses limitations for intensifying agricultural productivity (Bradford et al., 2017;
Bradford et al., 2019; Issahaku & Abdul-Rahaman, 2019). Upper Eastern Kenya faces
similar challenges of soil moisture stress, declining soil fertility, and reduced agricultural
yields promoting various research and development efforts on soil and water conservation
(Mucheru-Muna et al., 2010; Ngetich et al., 2014; Muriu Ng'ang'a et al., 2017; Kiboi et al.,
2019; Kimaru-Muchai et al., 2020). In response to these challenges, smallholder farmers
usually apply various soil fertility and soil water conservation strategies, but often at lower
rates (Mugwe et al., 2009; Kiboi et al., 2017; Mwaura et al., 2021). This aggravates
production volatility heightening the food crisis in the rural economies (Mganga et al.,
2015; Rojas et al., 2016; Sinyolo et al., 2020).
The growing risk of vulnerability to climate shocks is not gender-neutral (Djoudi &
Brockhau 2011; Beuchelt & Badstue et al., 2013). Women farmers face different
challenges in utilizing agricultural innovations to avert climate-related risks when
compared to their male counterparts (Diouf et al., 2019; Rola‐Rubzen et al., 2020).
Furthermore, gender inequalities and lack of attention to men and women's specific
preferences and needs is associated with low use of agricultural innovations (Huyer, 2016;
2
Kawarazuka et al., 2018; Rola-Rubzen et al., 2020). The disparities exist in form of land
tenure insecurities, to which women farmers are underprivileged in use and decision
making; gender differences in access to education and extension trainings; rationing out
of credit markets; greater difficulties in access and control to assets including, livestock
and farm implements and machinery; limited access to education and agricultural training,
and other social and cultural forms of inequalities linked to social perceptions on
differentiated roles for men and women (Njuki et al., 2011; Kassie, 2014; Quisumbing et
al., 2014; Doss et al., 2018). Moreover, patriarchal systems are oppressive to women,
perhaps not allowing women farmers to participate more effectively in decision-making
(Sultana, 2012; Colfer et al., 2015; Mukoni, 2018). Consequently, the inequalities have
implications for technology use and pose a significant drawback to the effective utilization
of agricultural innovations (Rola-Rubzen et al., 2020). In the pursuit for women's
empowerment in agriculture, aligning the design and implementation of agricultural
technologies to specific gender preferences is imperative.
Soil fertility depletion, interseasonal dry spells and degraded landscapes are the main
causes of low agricultural productivity in the dry lands (Ngetich et al., 2014; Farooq &
Siddique, 2017). The impacts of soil moisture stress and soil nutrient deficiencies are
severe when farmers have no adaptation alternatives and perhaps utilize these adaptation
strategies at lower rates than recommended (Mugwe et al., 2019; Mwaura et al., 2021).
Kiboi et al. (2017) and Partey et al. (2018) reported that regenerative agriculture strategies
such as use of organic and mineral fertilizers, zai technology, tied ridges, mulching and
legume-intercropping are possible solutions for enhancing soil water conservation and soil
nutrient replenishment. For example, the zai technology remains a dependable choice for
improving soil water conservation in the drylands (Danso-Abbeam et al., 2019; Kimaru-
Muchai et al., 2020) and the restoration and rehabilitation of completely denuded,
encrusted and degraded landscapes. The zai technology offers multiple benefits when
incorporated with organic and mineral fertilisers. Precisely, as an effort to bridge
intraseasonal dry spells, development agencies in the drylands of upper Eastern Kenya
3
introduced and incessantly promoted the use of zai technology (Kimaru-Muchai et al.,
2020). Zai technology is recommended for drier agro-ecological zones receiving 300-800
mm annual rainfall (Roose et al., 1999), hence best-fitting the region. Furthermore, water
conservation structures achieve dual purposes of increased spatial extent and duration of
plant-available moisture and controlling soil erosion by trapping and altering sediment
distribution (Nichols et al., 2021).
Recently, several studies that consider agricultural technology use have reported imperfect
information and institutions among other demographic and socioeconomic characteristics
to be constraining factors to utilization of agrarian technologies (Mango et al., 2017;
Wekesa et al., 2018; Thinda et al., 2020). On the other hand, empirical evidence has proven
that gender inequalities exist in utilization of agricultural technologies owing to inadequate
access to key productive assets, education and relevant training among other fairly obvious
and largely overlooked technical constraints (Ndiritu et al., 2011; Meinzen-Dick et al.,
2019; Rola-Rubzen et al., 2020). Integrating gender in understanding the synergies
between factors underlying preferences, choice and use-intensity of the soil fertility and
soil water management technologies is crucial in crafting, diffusion and intensification.
1.2 Statement of the problem
Despite the progressive development and promotion of soil fertility and soil water
conservation technologies in the drylands of Tharaka Nithi county, uptake of these
technologies has remained low over time. As a result, soil fertility decline and soil water
stress are the primary challenges facing smallholder farmers in this region. The low uptake
is attributable to lack of gender considerations when promoting agricultural innovations.
Additionally, there is a dearth of knowledge on the preferred soil and water conservation
technologies attributes and the drivers of technology choice and use intensity by gender.
Thus, disparities exist in opportunities for male and female farmers to participate and
equitably benefit from the technologies. Therefore, this study was geared towards reducing
4
the gender technology-use gap by determining the soil and water management technologies
preferred attributes, choice and use-intensity determinants among female and male farmers.
1.3 Research objectives
1.3.1 General objective
To evaluate the influence of gender on uptake of selected soil fertility and water
management technologies among smallholder farmers in the dry lands of Tharaka Nithi
County.
1.3.2 Specific objectives
1. To assess farmers’ preference for selected soil fertility and water management
technologies attributes among male-headed and female-headed households in the dry
lands of Tharaka Nithi County.
2. To examine socio-economic characteristics influencing choice of selected soil fertility
and water management technologies among male headed and female headed
households in the dry lands of Tharaka Nithi County.
3. To establish the determinants of selected soil fertility and water management
technologies use intensity among male-headed and female-headed households in the
dry lands of Tharaka Nithi County.
1.4 Research questions
1. What soil fertility and water management technologies attributes do male-headed and
female-headed households prefer?
2. What socio-economic characteristics influence the choice of soil fertility and water
management technologies among male-headed and female-headed households?
3. What are the determinants of soil fertility and water management technologies use
intensity among male-headed and female-headed households?
1.5 Justification of the study
The arid and semi-arid lands of Tharaka Nithi County and at large the lower Eastern Kenya
are particularly hard hit by climate related hazards putting the lives and livelihoods of
5
millions of households at risk (Muriu-Ng’ang’a et al., 2017; Kimaru-Muchai et al., 2020).
Besides, the major livelihood activity in this regions is smallholder farming majorly
dominated by women who provide over 80% of farm labour and are more vulnerable to
climate related risks with the lowest adoption of climate responsive farming technologies
(Onyalo, 2019). Therefore, the knowledge on preferred soil and water technologies, drivers
of choice and use intensity of these technologies among women and men farmers is one
step towards scaling out climate smart technologies uptake. This would advance the
country’s big four agenda by contributing towards a food secure nation.
Furthermore, the results will be shared with the community and relevant stakeholders
through convenient, accessible and cost effective channels. This will facilitate the review
of the existing evidence on gender and uptake of climate smart strategies and their
effectiveness in agricultural production. In addition, development partners and policy
makers who have taken gender analysis as an important aspect in the design,
implementation and evaluation of development projects can adopt the results to guide their
decisions for effective and efficient delivery. Finally, it’s the desire of the researcher to
contribute to the body of knowledge for future research and act as a source of reference to
all stakeholders in agricultural industry.
1.6 Scope and limitation of the study
The study was carried out in the dry parts of Tharaka Nithi county, Tharaka South sub-
county, targeting all smallholder farmers. It captured information regarding farmer’s socio-
economic profiles and the strategies farmers were using to enhance soil fertility and soil
water conservation in both male-headed households and female-headed households. The
study was limited to household and farm level analysis. Only the selected soil fertility and
soil water management technologies were considered for this study yet farmers practice a
myriad of soil and water conservation technologies.
6
CHAPTER TWO
LITERATURE REVIEW
2.1 Overview
In this section, literature of past studies on soil and water conservation, determinants of
preference, choice and use intensity of agricultural innovations and gender integration in
agricultural technology uptake were reviewed. The reviews led to identification of
knowledge gaps in existing literature which this study sought to bridge. Finally, a random
utility maximization theory on which this study was anchored was reviewed and a
conceptual framework presented.
2.2 The concept of soil and water conservation
Soil and water conservation is characterized by minimal soil exposure and disturbance,
wide-ranging crop rotations, application of regenerative agriculture practices that entail
crop residue retention and use of organic and inorganic fertilisation methods to reduce soil
degeneration while improving crop production sustainably (Farooq et al., 2017). Although
adoption of soil and water conservation strategies is increasing globally and especially in
the dry lands, in some regions its either slow or non-existent. For example, in SSA,
utilization of soil and water conservation strategies has remained low despite the
envisioned benefits (Mango et al., 2017; Nyamekye et al., 2018).
Continuous tillage among other conventional practices have significantly degraded fertile
lands (Farooq et al 2017), with a concomitant drop in crop and livestock productivity. To
reverse these conditions, soil and water conservation strategies that have the ability to
reduce and/or revert many undesirable effects of principal types of farming such as
prevalent surface runoff, soil organic matter (SOM) loss, soil water stress and soil
aggregation degradation have been recommended (Serraj & Siddique, 2012). Similarly, in
the drylands of Eastern Kenya, a number of integrated soil and water management options
have been developed and tested in the region (Mugwe et al., 2009; Mwaura et al., 2021).
For instance, tied ridging, mulching/crop residue retention, minimum tillage, legume-
7
intercropping and use of animal manure are some of the technologies that have the
prospective to boost soil fertility and soil water management for sustained crop growth.
Kiboi et al. (2017) found that, tied ridges doubled maize yields with use of manure and
minimum tillage having significant effect on maize yields. Also, zai technology is one of
most effectual strategy in harvesting runoff and at the same time enhancing crop
productivity in the dryland regions (Kimaru-Muchai et al., 2020). Moreover, efficient use
of mineral fertilisers in restoring and maintaining soil fertility as proven relevant in most
severe infertile and degraded landscapes (Lambrecht et al., 2016).
Despite the positive impacts achieved through soil fertility improvement and soil water
management, slow adoption of these technologies remains a big challenge particularly
among rural resource poor farmers (Mugwe et al., 2009; Mponela et al., 2016; Mwaura et
al., 2021). This is associated with negative economic externalities such as disruption of
livelihoods, low returns to agricultural investments and a threat to food security in the
drylands. Feder et al. (1985) found technology intensification decisions to depend on socio-
economic factors, technology characteristics, institutional factors and farmer intrinsic
attributes. Over the years, a wide-ranging body of literature has studied the factors driving
agricultural innovations use and intensification (Zeng et al., 2018; Beshir &Wagary, 2014).
On the other hand, a considerable amount of empirical studies has premeditated the gender
differences in agricultural innovations choice anwd use levels using sex of the household
head as the gender pointer (Gebre et al., 2019; Lambretch et al., 2016). Most notably, there
is a clear need to understand the economic, cultural and institutional profiles that would
fast-track intense use of soil and water conservation techniques at household or farm level
among other agrarian technologies.
2.3 Soil and water conservation strategies
2.3.1 The zai technology
In the restoration practice, the zai pits of dimensions 20-40 cm diameter and 10-15 cm deep
are implemented early before the onset of rains (Roose et al., 1999; Sawadogo et al., 2001).
8
The pit size is subject to variations; deeper pits in shallow horizons and shallow pits on the
watertight soils (Slingerland & Stork, 2000). For example, in Kenya, most farmers observe
60 cm × 60 cm × 60 cm dimensions in width, length and height when executing zai (Peter
& Itabari, 2014). On average, with a spacing of 60-80 cm apart, 8000 pits fit ha-1 (Fatondji
et al., 2006; Kimaru-Muchai et al., 2020), and are applied in alternating rows to increase
runoff collection. In most cases, on average, farmers incorporate zai pits with about 2 Mg
ha-1 of well decomposed manure or crop residues (Roose et al., 1999; Mwangi, 2020).
Moreover, some farmers incorporate mineral fertilizer in the pits (Kimaru-Muchai et al.,
2020). The addition of organic matter improves runoff water infiltration, thus creating deep
moisture pockets in the planting hole, protected from quick evaporation (Danso-Abbeam
et al., 2019).
The incorporation of manure and other organic residues also helps in maintaining soil
structure. Decomposition of organic manure by soil organisms enrich the soils and runoff
water with nutrients (Roose et al., 1999). Subject to rainfall and soil fertility conditions, on
average, well-executed zai pits can lead to about 750 kg ha-1 of grain yields and about 3
Mg ha-1 of crop residue for mulching and livestock feed (Fatondji et al., 2006). Also, zai
harvests 25% of surface runoff from 5 times its area (Malesu, 2006) and can increases soil
water holding capacity by over 500% (Danjuma & Mohammed, 2015). Furthermore, water
conservation structures achieve dual purposes of increased spatial extent and duration of
plant-available moisture and controlling soil erosion by trapping and altering sediment
distribution (Nichols et al., 2021). Conversely, the use of the technology among other soil
and water management technologies has stagnated over time in spite of its diffusion
(Mugwe et al., 2019; Kimaru-Muchai et al., 2020).
2.3.2 Mineral fertiliser use
Notably, across the globe, approximately 50 percent of the population depends on mineral
fertilisation methods for their food intake (Ogada et al., 2014; Vanlauwe et al., 2014). The
emphasis on mineral fertiliser utilisation is important in SSA and the drylands in general.
9
Apparently, mineral fertiliser use is indispensable in the long-run sustained soil health and
for ensuring sufficient food supply for the exponentially increasing populations
(Lambrecht et al., 2015). Interventions that increase preference, choice and use of mineral
fertiliser intensely among the rural poor farmers can advance food sufficiency, nutritional
security and empower them shift from poverty trap (Donkor et al., 2019). However, in
SSA, the use of mineral fertiliser is negligible with the consumption ratio being 0.03:0.97
when compared to total world mineral fertiliser consumption (Kelly, 2006; Lambrecht et
al., 2015). In such a setting of trivial mineral fertiliser application, it is expressly imperative
to empirically unravel the drivers of preference, choice and intensification decisions so as
to inform better on diffusion and adoption.
The crux is in the use of the fertilisers, not the fertilisers themselves. There exists a depth
of antagonising messages on mineral fertiliser application and its long-term implications
on soils health among rural smallholders (Vanlauwe & Giller, 2006). These myths need to
be countered for effectual role of research and science in achieving the main goal of
supporting smallholders to tackle the dire hitches of soil fertility loss especially in the
drylands. Fertiliser, preferably combined organic and inorganic when applied in the
recommended amounts and appropriate fertiliser type can have a boundless and progressive
sustained impact on crop growth and food production (Ogada et al., 2014). Contrariwise,
uniformed fertiliser application patterns may become a cause of soil degradation. Proper
fertiliser recommendation should consider three distinguished objectives namely;
maximum capacities in yield level, rate of return and crop response that is utmost yield
response per amount of fertiliser applied (Smil, 2011). In addition, for most developing
countries the fourth objective when recommending mineral fertiliser is to attain the highest
adoption level possible (Vanlauwe et al., 2014).
According to literature, there are several factors that impinge sustainable adoption and
application of mineral fertilisers in the developing countries (Kassie et al., 2013; Pircher et
al., 2013; Teklewold et al., 2013). Citing back the adopters’ theory, only 15 percent of the
10
population can be regarded as innovators and early adopters and the theory explains that
100 percent adoption will never be achieved because of different farmer realities and
intrinsic characteristics such a personality among others (Rogers et al., 2014). In addition,
an enabling environment is a prerequisite for mineral fertiliser adoption (Pircher et al.,
2013). This factor contains the tools, skills and the extent to which farmers are motivated
and supported to access the inputs and utilize them.
2.4 Preference, choice and use intensity of agricultural technologies
Agricultural technology preference has widely been examined for various aspects. For
example, farmers’ preference for various technology characteristics so as to offer better
pointing of resources in best possible adaptation strategy. Wale & Yalew, (2007), following
the empirical analysis, attributed low uptake of agricultural innovations to the incongruity
between the consumers “farmers’” felt needs and the inherent characteristics of innovations
disseminated. The findings revealed that resource poor smallholders preferred coffee seeds
malleable to their environments and varieties with steady yields attributes and marketable.
A variety of literature has adopted dissimilar methodologies in measuring stated
preferences for technologies and technology attributes. For instance, Murage et al. (2010)
employed weighted score index and ordered probit regression to sequentially rank
information dissemination pathways and determine the probabilities of farmers ranking the
pathways differently. On the other hand, Blasch et al. (2020) adopted choice experiments
to elicit farmers’ willingness to adopt precision farming technologies as well as their
preferences for specific attributes such as increased yields, reduced fertiliser input and
improved ground water quality. These studies demonstrate the importance of policy-
makers formulating context specific technology developments.
Past studies have conceptualized choice as a binary variable where a farmer either choses
to use a certain technology or not (Chianu & Tsujii, 2004; Belachew et al., 2020).
Empirically, many studies analysing the determinants of choice have employed a wide
range of econometric models in determining factors influencing choice decisions. For

11
example, Mango et al. (2017) employed the logit models to examine the factors that
influenced farmer’s knowledge and choice of land conservation strategies. The study
revealed that, age of the household head years of schooling, agricultural extension
reception and participation in farmer organizations and groups, acreage of land owned and
land-to-man ratio to be critical in raising awareness and choice decisions. Similarly,
Mugwe et al. (2009) adopted the logistic regression models in evaluating the determinants
of decision to adopt integrated soil fertility management options in the Central Highlands
of Kenya. The results revealed that farm management, hired labour, and household food
security status positively and significantly influenced adoption.
On the other hand, age of household head and total livestock units (cattle) negatively
influenced adoption. Also, the probit models have been adopted extensively in literature in
estimating choice decisions. Ndiritu et al. (2014) employed a multivariate probit to
investigate differences in adoption of sustainable agricultural intensification with regard to
gender and reported that differences in use of some technologies do exist among male and
women farmers. The model revealed that women farmers had higher likelihood of using
maize-legume intercropping, and largely unlikely to choose minimum tillage and apply
animal manure when compared to men. Further, the results indicated that choice of agrarian
innovations is dependably driven by land and household characteristics such as size,
ownership and headship, fertility status, access to extension services, availability of credit
and age of the farmer.
Technology use intensity has been measured distinctively in literature. Many studies have
conceptualized use intensity as the level of application of a given innovation. For instance,
some studies theorized use intensity as the land size under improved seeds or amount of
fertilizer applied per acre (Feder et al., 1985). Other studies define use intensity as the
degree or extent of application of a technology. Nkoya et al. (1997) measured use-intensity
as the land size under improved seeds. Mensah-Bonsu et al. (2017), defines use-intensity
as the number of technologies a farmer is using. Other researchers conceptualize use-
12
intensity as the proportion of land under improved crop varieties (Asfaw et al., 2011;
Nchinda et al., 2010). Count econometric models have been widely employed in
determining the drivers and probabilities of technology use intensity. For example, Mwaura
et al. (2021) employed the Tobit model Tobin, (1958) to estimate the effects of
socioeconomic characteristics on use-intensity of organic-based innovations among
smallholders. The model results revealed that socioeconomic characteristics were
important determinants influencing use of organic-based technologies intensely.
Lambretch et al. (2014) employed the Heckman model Heckman, (1979), to empirically
examine the determinants of mineral fertiliser intensification among smallholder farmers
in Congo. The study revealed that drivers of agrarian innovations use and use-intensity
have different impacts on the different stages in the adoption process. On the other hand,
double hurdle models Cragg, (1971), have been employed in explaining determinants of
technology intensification. For example, Gebre et al. (2019) used the double hurdle
approach to determine the gender differences in adoption of improved maize varieties in
Ethiopia. The results revealed use-intensity of improved maize varieties was lower among
women farmers when compared to male farmers. The wide application of econometric
models in measuring technology use intensity as adopted in literature can be explored with
key note on the nature of the explained variable observing that different count models
estimate the effects on the limited variable distinctively.
2.5 Determinants of choice and use intensity
Notably, a wide-ranging body of literature has reported on the drivers of agrarian
innovations and use intensity (Beshir &Wagary, 2014; Asfaw & Neka, 2017; Zeng et al.,
2018). For example, Feder et al. (1985) found socioeconomic aspects, technology attributes
and institutional factors to influence farmers’ decision to use agricultural innovations as
well as the intensification of the technology at the farm level. The farm and farmer
characteristics that can potentially influence choice and use intensity decisions include age,
education attainment, gender, household size, farming experience, farmer’s perceptions
13
towards the specific technologies attributes, soil fertility status and soil water holding
capacity, size of the farm, total cultivated land, ownership of key productive resources,
access to key institutions and services.
Age of the farmer is presumed to positively or negatively influence choice and agricultural
technology use-intensity. Many studies have reported that the probability of choosing and
using soil and water conservation practices intensely is higher among younger farmers as
compared to ageing farmers (Asfaw & Neka, 2017). Conversely, other studies have found
age to positively influence choice of soil management practices (Adesina & Forson, 1995).
This was largely attributed to older farmers being more risk averse and experienced in
farming and with better ability to access the characteristics of modern technologies than
younger farmers. Related to age, years a farmer has been involved in making key farming
decisions has been found to have mixed effects on choice and use-intensity of agricultural
innovations. More experienced farmers are reputed to have a better knowledge of
conservation agriculture hence a higher likelihood of adopting soil and water conservation
technologies (Knowler & Bradshaw, 2007). Conversely, veteran farmers may resolve to
opt out from farming for other off-farm undertakings with more returns.
Household size designates the number of people living in a household. An important factor
influencing use of labour-intensive agricultural technologies. Larger households have more
human capital in terms of labour employed in application of labour demanding soil and
water conservation technologies (Belachew et al., 2020). Predominantly, the majority of
labor for most farming activities in SSA is entirely provided by the family members and
more so females and this may constrain preference, choice and use of labour demanding
agricultural technologies intensely. Nonetheless, part of larger households may opt out
from farming activities in an attempt to diversify their income to ease the consumption
budget imposed by higher food demand in larger households (Wekesa et al., 2018).
14
Education has been found to positively and negatively influence utilization of agrarian
innovations. Many studies conceptualize education as the years of schooling or the levels
attained (Wekesa et al., 2020). Educated farmers are presumed to be more informed on soil
water conservation technologies application modalities and hence being more receptive to
new and improved technologies (Mango et al., 2017). Contrariwise, educated farmers may
opt out from farming for off-farm activities that are more rewarding (Alwang et al., 2019).
Access to extension services and contact with development agents with farmers play a great
role in creating awareness on soil and water conservation technologies (Mponela et al.,
2016). Many studies have hypothesized access to extension to positively and significantly
influence zai technology choice and use-intensity (Awotide et al., 2016; Wekesa et al.,
2020). Similarly, participating in farmer trainings increases farmers' knowledge of soil and
water conservation technologies, hence positively influencing choice and use-intensity of
soil and water conservation technologies (Okeyo et al., 2020).
Ownership of key productive assets for example livestock, land, farm implements and farm
machinery and credit facilities is assumed to increase the likelihood of taking up new
agricultural innovations. Livestock densities are an essential factor in explaining adoption
of conservation agriculture technologies at household level (Ndiritu et al., 2014). This can
be attributed to livestock providing manure that is a key input in conservation agriculture.
In addition, livestock also provide animal drawn labor and also a source of income. Land
ownership is an indicator of secure land tenure system and increases the likelihood of
farmers adopting long-term agricultural innovations (Awotide et al., 2016). In addition,
total land owned and cultivated is often correlated with farm income and wealth. Therefore,
farmers with large farm size could have the ability to pay wages while undertaking soil and
water conservation. Moreover, farmers with large farm size have the flexibility of
experimenting with new technologies (Thinda et al., 2020). Also, technology adoption
likelihood is positively driven by access to and ownership of farm implements (Melesse,
2018). Farmers with access and the ability to timely access and hire farm hands have a
15
higher probability of adopting soil water management innovations, among other
agricultural technologies that are labour demanding (Mugwe et al., 2009; Teshome et al.,
2016).
On the other hand, institutional factors are important determinants of choice and use of
agricultural technologies intensely. Farmers receiving relief in form of inputs, farm
implements or cash from the government and other development agencies act as incentives
to technology adoption. Awotide et al. (2016) found that farmers who had received relief
in the form of improved seeds largely commercialized rice production in Nigeria as
compared to those who did not receive the support. Group membership which tends to
create social capital increases the likelihood of adopting agricultural innovations (Kassie
et al., 2014). Besides, agricultural development agencies who work closely with farmers'
in disseminating the technologies to target groups have higher success rates. Access to
agricultural credit promotes the adoption of labour-intensive climate-smart innovations,
among other technologies, that require high initial investment capital (Obisesan et al.,
2016; Yigezu et al., 2018). Selling farm output is a proxy of farm income and positively
predicts choice and use-intensity of soil and water conservation technologies (Kuehne et
al., 2017). This is attributable to the increased ability of the farmer to purchase inputs and
also hire labour. Distance to produce and input market may positively as well as negatively
influence choice and use-intensity of agricultural technologies (Muriithi et al., 2018;
Wekesa et al., 2018). Proximal access to markets lowers the transactional costs incurred
during transportation of inputs to the farm and outputs to the markets.
Intrinsic farmer characteristics such as attitudes and perceptions towards conservation
agriculture influence adoption patterns of soil and water conservation strategies.
Additionally, farmers’ perspicacity is deliberated as distinctive influence on new
technologies choice decisions (D’Antoni et al., 2012). For example, farmers perceiving soil
erosion to be more severe has been found to positively influence the likelihood of using
soil and water conservation technologies (Biratu & Asmamaw, 2016). This was attributed
16
to severe soil erosion increasing nutrient and surface water loss hence the need for
application of soil and water practices that reduce surface runoff. Also, farmers perceiving
their soils as infertile have higher likelihood of using soil fertility enhancing and
conservation strategies (Belachew et al., 2020).
2.6 Gender integration in agricultural technology uptake
At the household level, understanding technology choice patterns is very important when
up-scaling use of successful agricultural interventions. Empirical studies have extensively
examined gender difference in agrarian innovations choice using sex of the household head
as the gender indicator (Gebre et al., 2019; Lambretch et al., 2016). Despite evidence from
gender analysis studies suggesting that when women farmers have a larger role in decision-
making and control of productive assets, household wellbeing improves (Doss, 2014),
gender gap in agricultural technology use persists in developing countries. 43 percent of
unindustrialized labour in emergent nations comes from women, producing about 80
percent of locally consumed food in Africa (Palacios-Lopez et al., 2017). Also, studies
analyzing gender integration in agriculture have highlighted gender gaps in asset
ownership, education, access to a credit facility and extension trainings, which constrain
women farmers agricultural productivity (Quisumbing et al., 2014; Sell & Minot, 2018).
An implication is that, gender gap in agriculture may have long term inferences both at
households economic welfare and agricultural technological progress (Kantor et al., 2015;
Manfre et al., 2013).
Recent studies consider technology choice and use intensity decisions jointly made by men
and women in the same household (Diiro et al., 2018; Gebre et al., 2019; Muriithi et al.,
2018). Additionally, in the recent literature, joint farm management and decision making
has been reported to positively drive technology use at household level (Lambrecht et al.,
2016; Marenya et al., 2015). Contrariwise, other studies reported that there is no gender
disparity in agricultural technology utilization (Muriithi et al., 2018). Moreover, gender is
a factor of influence to farmers’ perceptions on uptake of new technologies as women and
17
men experience their social, economic, cultural and environmental realities (Obiero et al.,
2019). Therefore, household resource endowment among other socioeconomic
characteristics and farmer intrinsic attributes are key factors when assessing gender effects
on uptake of new technologies.
2.7 Gaps in literature review
Extensively, literature has covered the possible impacts of soil fertility loss and soil water
stress on agricultural production especially in the drylands (Bradford et al., 2017; Bradford
et al., 2019; Issahaku & Abdul-Rahaman, 2019). These studies generally indicate that
smallholder farmers have the choice of addressing soil moisture stress and soil fertility loss
by implementing climate smart options. Much of the literature on soil and water
conservation has drawn consideration to a variety of factors driving choice and use
intensity of such strategies by smallholders (Mango et al., 2017; Wekesa et al., 2018;
Thinda et al., 2020). However, a lot of these literature merely disaggregate households,
farm characteristics and institutional services as key technology uptake drivers with respect
to gender. Therefore, there is dearth of information on the preferred technology attributes
and drivers of choice and use intensity among men and women farmers. Further still, many
studies targeting promotion of soil and water conservation consider gender as a
demographic indicator, which may not evidently reveal household’s characterisation with
regard to adoption drivers. This study therefore focused on undertaking a gendered
household and farm level analysis on the preference, choice and use intensity of soil and
water conservation strategies.
2.8 Theoretical framework
The study followed random utility maximization theory, which postulates that, a rational
farmer will choose a given innovation or a bundle of innovations if the benefits derived
from their choice exceed the benefits derived from not choosing (Feder & Umali, 1993).
The utility (u) that an individual (m) gains from utilizing (n) soil and water conservation

18
technologies can be defined by Eq 2, where (v) is the utility determinants and (Ɛ)is the error
term.
𝑢𝑚𝑛 = 𝑣𝑚𝑛 + 𝜀𝑚𝑛 (2.1)
The assumption is that (u) depends on individual preferences from a package of (n) soil
and water management alternatives Cascetta (2009). Thus, the utility function can further
be expressed as Eq 2.2.
𝑢𝑚𝑛 = 𝑉(𝑥𝑚, 𝑧𝑛) (2.2)
xm is the soil and water conservation strategy, and zn are farmers' desired technology-
specific attributes and farmer characteristics.
A farmer with the intention of maximizing present farm productivity through increased soil
and water conservation will select preferred strategy among a set of (n) soil and water
conservation innovations. The choice of innovation (n) is dependent on expected higher
benefits when compared to other innovations (𝑞) ; if 𝑢𝑛>. 𝑢𝑞 . Among other factors,
specific characteristics of an innovation influence levels of satisfaction an individual
derives from utilizing an innovation. Chances that an individual (𝑚) will choose
innovation (𝑛) from a set of selected innovations (𝑞) could be defined by Eq 2.3.
𝑝[(𝑣𝑛 − 𝑣𝑞) > 𝑢] + Ɛ (2.3)
Variations in choice are accounted for by a random element (Ɛ), included in the utility
function.
19
2.9 Conceptual framework
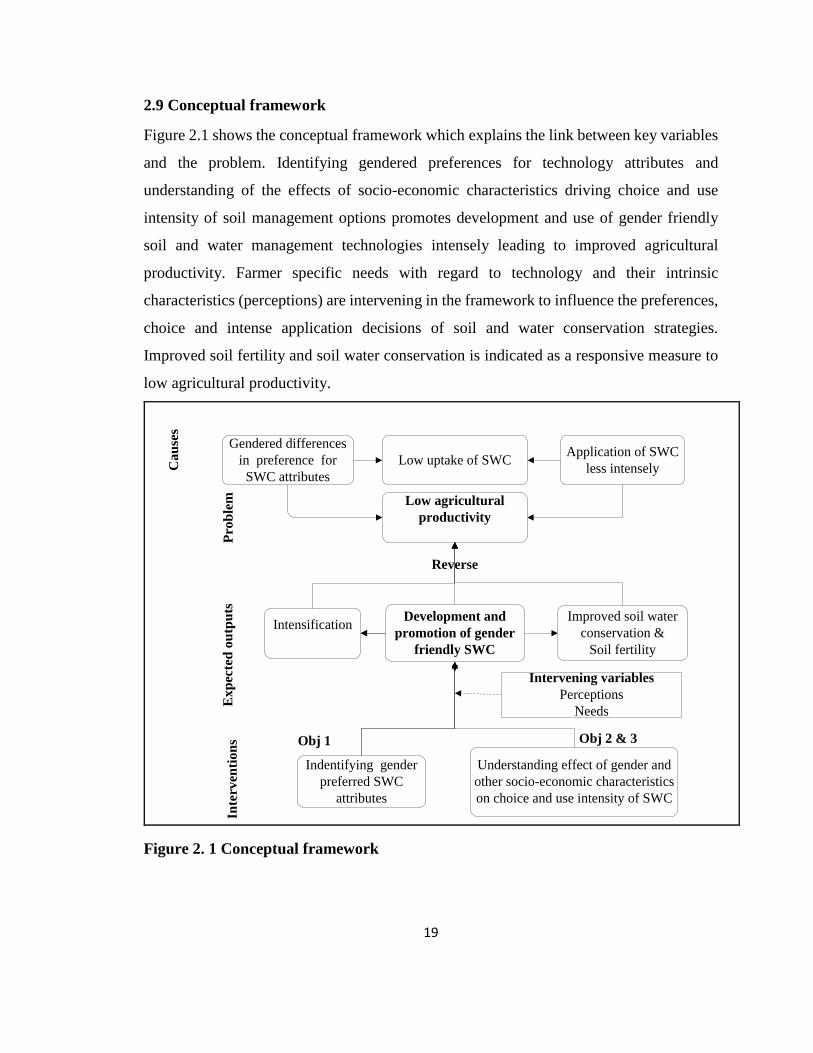
Figure 2.1 shows the conceptual framework which explains the link between key variables
and the problem. Identifying gendered preferences for technology attributes and
understanding of the effects of socio-economic characteristics driving choice and use
intensity of soil management options promotes development and use of gender friendly
soil and water management technologies intensely leading to improved agricultural
productivity. Farmer specific needs with regard to technology and their intrinsic
characteristics (perceptions) are intervening in the framework to influence the preferences,
choice and intense application decisions of soil and water conservation strategies.
Improved soil fertility and soil water conservation is indicated as a responsive measure to
low agricultural productivity.
Low uptake of SWC
Gendered differences
in preference for
SWC attributes
Low agricultural
productivity
Development and
promotion of gender
friendly SWC
Understanding effect of gender and
other socio-economic characteristics
on choice and use intensity of SWC
Intensification
Indentifying gender
preferred SWC
attributes
Application of SWC
less intensely
Improved soil water
conservation &
Soil fertility
Cau
ses
Prob
lem
Exp
ecte
d o
utp
uts
Inte
rven
tion
s
Reverse
Obj 1 Obj 2 & 3
Intervening variables
Perceptions
Needs
Figure 2. 1 Conceptual framework
20
2.10 Operationalizing variables
2.10.1 Choice of dependent and independent variables
Choice of variables was guided by relevant theories and past studies (Feder et al., 1985;
Chianu & Tsujii, 2004; Belachew et al., 2020). However, some variables were selected
with regard to theorized relationship with the explained variable (Table 2.1). Studies
included in the choice of variables demonstrate that farm characteristics and farmer
attributes mostly influenced choice and use-intensity of agricultural innovations (Kassie et
al., 2014; Mango et al., 2017; Thinda et al., 2020). The influence of these variables was
tested in the empirical models.
The first stage dependent variable was a dummy variable (whether a farmer chose to use
zai technology or not). Similarly, for mineral fertiliser choice, the first stage dependent
variable was a dummy variable (whether a farmer chose to use mineral fertiliser technology
or not) (Table 2.1). It takes the value of 1 if yes and 0 otherwise. The second stage
dependent variable was a continuous variable and defined as the proportion of cultivated
land (ha) dedicated to zai technology and fertiliser application rates (kg ha-1). Past studies
have conceptualized intensification as the area of land in hectares planted with improved
seeds, fertilizer application rate per acre and number of technologies adopted (Feder et al.,
1985; Nkonya et al. 1997; Mensah-Bonsu et al. 2017). Additionally, other studies
conceptualize use-intensity as the amount of land under a technology ( Nchinda et al., 2010;
Asfaw et al., 2011).

21
Table 2.1 Descriptions and units of measurement of hypothesized variables
Variable Variable description and measurement Expected
sign
Dependent variables
Zai technology choice Household head decision to use zai technology is a dummy variable: 1=Yes; 0=Otherwise
Zai use-intensity Proportion of total cultivated land allocated to zai technology in hectares (continuous)
Fertiliser choice Household head decision to use mineral fertiliser is a dummy variable: 1=Yes; 0=Otherwise
Fertiliser use-intensity Mineral fertiliser application rate (Kg/ha) (continuous)
Independent
variables
HHAGE Age of the household head was measured in years (continuous) -
HHEDUC Education of the household head was measured in years of decision making (continuous) +/-
HHSIZE Household size was measured in number (continuous) +
EXTENSION Access to extension services is a binary variable: 1= Received extension; 0= otherwise +
LIVSTCK Livestock densities was measured in number (continuous) +
PERCSOILERSN Perception on soil erosion is a dummy variable:1= Not severe; 2= Moderate; 3= Very severe +
FAMEXP Household head farming experience is a continuous variable measured in years +
MKTDST Distance in walking to the nearest input/output market (continuous) -
LAND Total land cultivated is a continuous variable measured in hectares +/-
CREDIT Access to credit is a binary variable: 1= Household head received credit; 0= Otherwise +
TRAINING Farmers training is a binary variable: 1= Household head received training; 0= Otherwise +
GRPMBR Group membership is a binary variable:1= Farmer had group membership; 0=Otherwise +
LANDOWN Land ownership is a binary variable: 1= Ownership with a formal title deed; 0=Otherwise +
LABOUR Access to timely labour is a binary variable: 1= Farmer had access to labour; 0=Otherwise +
FAMIMPLNT Access to animal-drawn farm implement is a binary variable: 1= access to implement; 0=Otherwise +
RELIEF Access to relief is a binary variable: 1= Farmer received relief; 0=Otherwise +
SELLOUTPUT Selling output is a binary variable: 1= Farmer sold output; 0=Otherwise +
PERSOILFERT Perception on soil fertility status is a dummy variable: 1= Fertile; 0=Otherwise +

22
CHAPTER THREE
RESEARCH METHODOLOGY
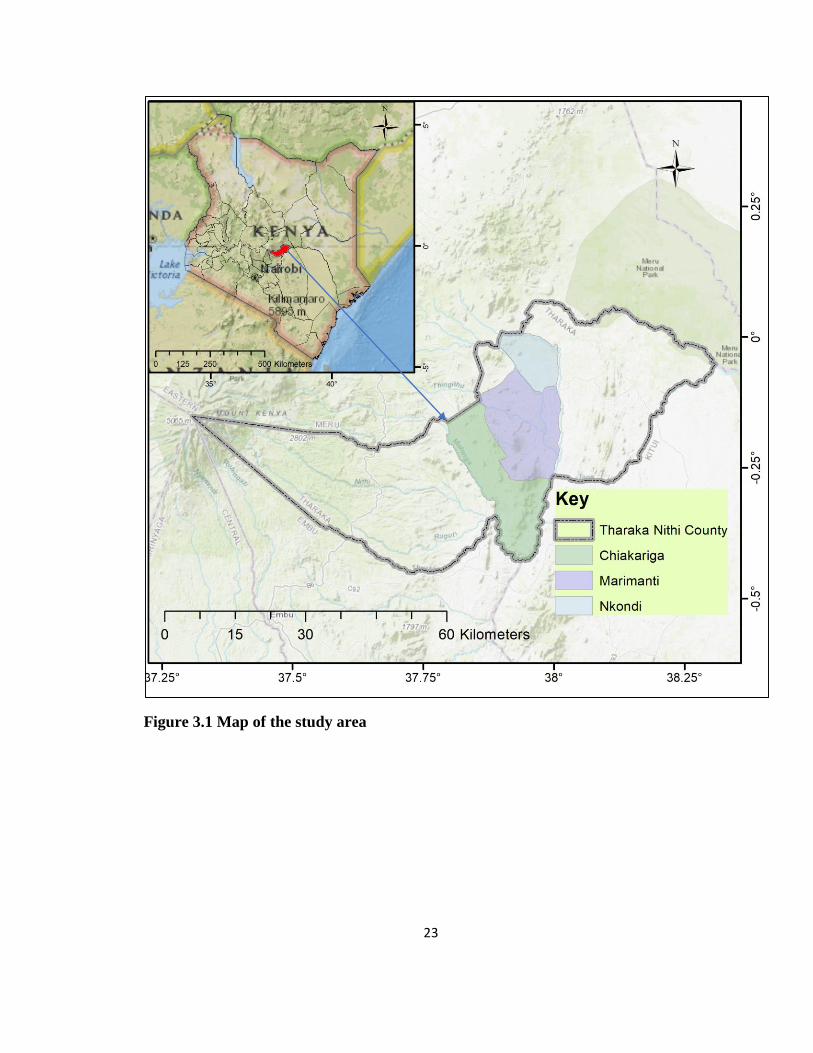
3.1 Description of the study area
The study was conducted in Tharaka Nithi County, Kenya, covering three wards in Tharaka
South sub-county: Chiakariga, Marimanti, and Nkondi (Figure 1). The sub-county covers
about 637 km2 with a population of 75,250 persons, and a population count of
approximately 118 persons per square kilometre (Kenya National Bureau of Statistics,
2019). The Agro-Ecological Zones (AEZs) covering the area range from the wetter Lower
Midland (LM)4 to the drier Intermediate Lowland (IL)6 (Jaetzold et al., 2007). The area
receives bi-modal rainfall: March-May "long rains" and October-December "short rains"
(Jaetzold al., 2007; Recha et al., 2012). The annual rainfall amount ranges from 1100 mm
in the LM4 to less than 800 mm in the IL6. Farmers in the region prefer the October-
December season for its reliability and accurate predictability. The annual temperature
ranges from 21 to 25 ℃ (Smucker & Wisner, 2008). Shallow, highly weathered, and
leached Ferrasols are the main soils in Tharaka South sub-county (Jaetzold et al., 2007).
As a semiarid sub-county, rainfall is highly variable, affecting the community livelihood
strategies, which is primarily agro-pastoralism (Smucker & Wisner, 2008; Recha et al.,
2012). The sub-county's erratic rainfall has contributed to wide variability in crop and
livestock production, escalating poverty levels and overdependence on relief from
government and development agencies (Muriu Ng’ang’a et al., 2017; Kimaru-Muchai et
al., 2020). Ongoing development efforts in the area along with devolution target
diversification of livelihood options that are responsive to climate change. The choice of
the sub-county was guided by earlier research efforts in the area and the understanding that
being a semiarid area, livelihood options are limited and vulnerability levels differ across
gender and households.
23
Figure 3.1 Map of the study area
24
3.2 Research design
The study applied mixed-methods approach to collect two sets of data; qualitative and
quantitative data. Quantitative and qualitative approaches in combination provides better
understanding of research, and complex phenomena than either of the approaches alone
(Timans et al., 2019).
3.3 Target population and sample size
The target population comprised the smallholder farming households. The sample size was
determined using Cochran (2007) formula (Eq 3.1) as given below:
𝑛 =𝑍2 𝑝𝑞
𝑑2 ≈1.962 ∗(0.5)∗(1−0.5)
0.0492 ≈ 400 (3.1)
Where n = sample size, Z= 1.96 the standard normal deviate at the required confidence
level, p = (0.5) the proportion in the target population estimated to have the characteristic
under observation, q =1-p =0.5 = the proportion of the population without the
characteristics being measured d = 0.049 = the desired level of precision. In total, 400
farmers were sampled.
3.4 Sampling strategy
Sampling units for quantitative data were drawn using multistage sampling procedures.
Tharaka South Sub-county was pre-defined because farmers in that region were already
implementing soil and water conservation. In the second stage, all the three wards
(Chiakariga, Marimanti and Nkondi) (Fig 3.1) in the Tharaka South sub-county were
selected using a sampling framework. In the third stage; at ward level, sample households
were randomly selected. A list of 4,000 farmers was obtained from Tharaka South Sub-
county agricultural office. The basic element in the sampling frame was the farm
household. A probability proportional to size sampling technique was employed to
determine the number of households sampled per ward (Table 3.1). A sample of 400
25
farming households was randomly selected. Random numbers were generated to reduce
the chances of sample selection bias.
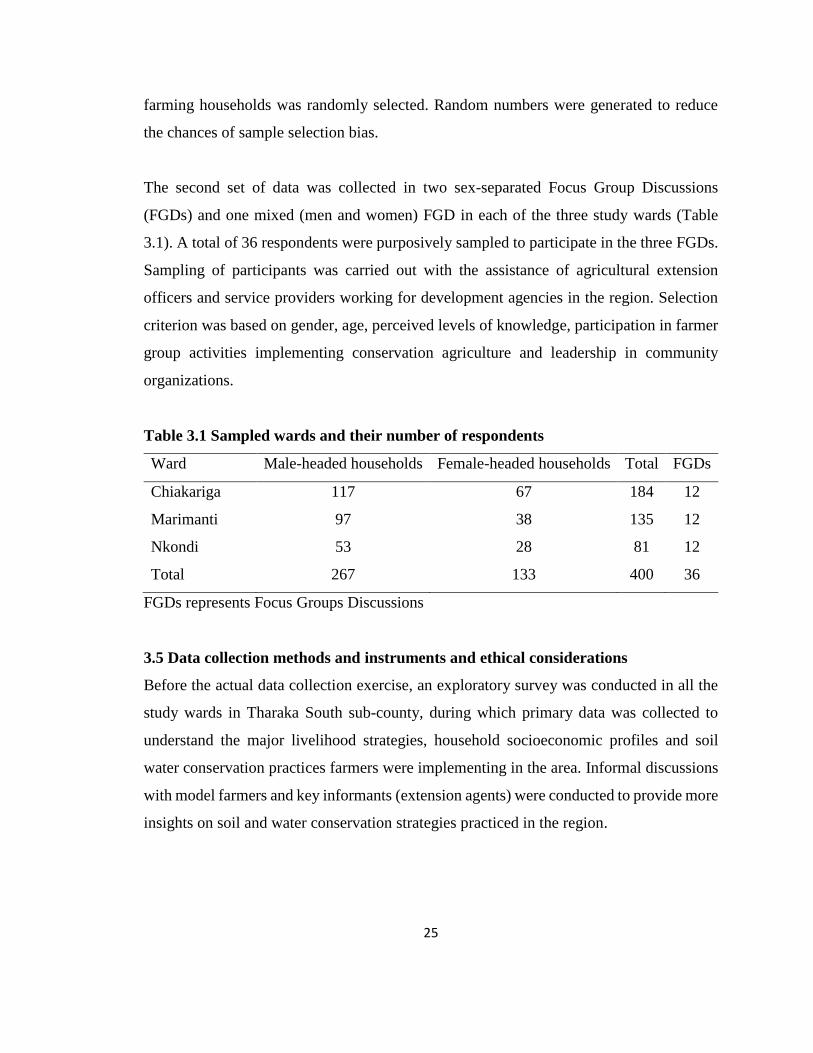
The second set of data was collected in two sex-separated Focus Group Discussions
(FGDs) and one mixed (men and women) FGD in each of the three study wards (Table
3.1). A total of 36 respondents were purposively sampled to participate in the three FGDs.
Sampling of participants was carried out with the assistance of agricultural extension
officers and service providers working for development agencies in the region. Selection
criterion was based on gender, age, perceived levels of knowledge, participation in farmer
group activities implementing conservation agriculture and leadership in community
organizations.
Table 3.1 Sampled wards and their number of respondents
Ward Male-headed households Female-headed households Total FGDs
Chiakariga 117 67 184 12
Marimanti 97 38 135 12
Nkondi 53 28 81 12
Total 267 133 400 36
FGDs represents Focus Groups Discussions
3.5 Data collection methods and instruments and ethical considerations
Before the actual data collection exercise, an exploratory survey was conducted in all the
study wards in Tharaka South sub-county, during which primary data was collected to
understand the major livelihood strategies, household socioeconomic profiles and soil
water conservation practices farmers were implementing in the area. Informal discussions
with model farmers and key informants (extension agents) were conducted to provide more
insights on soil and water conservation strategies practiced in the region.

26
A check list was used to seek information from FGDs participants. The choice of questions
facilitated spontaneous opinions and avoided restrictions. The discussions were facilitated
in Swahili and where necessary translation was done in the local language. The purpose of
FGDs was to generate more in depth information on gendered preference for soil and water
conservation technologies.
At the household level, the interviewer administered questionnaires with modules on farm
and farmer's socioeconomic characteristics. Institutional factors were used to collect
quantitative data in a cross-sectional survey. The tool was programmed into an electronic
format using Open Data Kit (ODK) software and sufficiently pre-tested for reliability and
validity and corrected for errors. Trained enumerators were used in administering the
questionnaires.
All participants gave informed consent to their involvement and were aware that they can
withdraw their consent at any point.
3.6 Data processing and statistical analysis
Livestock densities were determined for each unit following Musafiri et al. (2020). For
every cow, sheep, goat, and chicken, Total Livestock Unit (TLU) of 0.7, 0.1,0.1, and 0.01,
was assigned respectively. Area of land was converted to hectares. Secondly, data was
cleaned, organized in Microsoft Excel, and analysed using STATA and SPSS softwares'.
The analyses disaggregated the results by sex of the household head based on key
indicators of the study. Chi-square and t-test were used to test statistical relationships for
categorical and continuous variables respectively. Comparisons were made between zai
technology and mineral fertiliser users and non-users in male-headed households and
female-headed households. Heckman's two step selection model was employed in
estimating the determinants of zai technology and mineral fertiliser choice and use-
intensity.

27
3.7 Model diagnostics
Preliminary diagnostics were conducted for statistical problems of multicollinearity. Inter-
correlation among dependent variables was tested using the Variance Inflation Factor
(VIF). The VIF values obtained were below 10, hence the conclusion that, their existed
weak inter-association among the explanatory variables. To validate Heckman's 2-stage
selection model viability, golden standards in applying the model were observed. Inverse
Mills Ratio (Lambda), a function of the correlation coefficient between first and second
stage error terms (rho) that accounts for potential sample selection bias was significant; an
indication that sample selection bias was resolved for (Wooldridge, 2010; Certo et al.,
2016). Therefore, the study concluded that Heckman 2-stage model was sufficient in
determining zai technology choice and use-intensity from the sample.
3.8 Methods of analysis
3.8.1 Objective one: Gendered preference for technologies attributes
To determine the soil and water management technologies preferred attributes by gender,
farmers were asked to list attributes of specific soil and water management technologies
from a list of soil and water management technologies characteristics. The list of attributes
was generated in FGDs with a random sample of farmers prior to the household survey.
Most frequently mentioned positive attributes were; ability of the technologies to increase
soil fertility, conserve soil water, increase economic returns (yields) and availability of
sufficient extension information and trainings on the technologies application modalities.
On the other hand, negative attributes that were frequently mentioned were labor intensive
and high input cost associated with soil and water management technologies.
Farmer’s stated preferences for the attributes were scored in a ten-point scale where, 0 was
the least score and 10 was the highest score. A t-test was run to determine if there were
significance differences between the average scores of each attribute with respect to gender
of the household head. For each household type, one-way Analysis of Variance (ANOVA)
was used to determine whether there was statistical evidence that the associated attributes
28
average scores were significantly different. Tukey’s honestly significant difference test was
used to compare all possible pairs of means.
Qualitative data was transcribed and translated into generative themes “salient recurrent
ideas” in evaluating whether and how the research illuminated the research questions. The
analytical process entailed reducing the volumes of information “narratives”, sorting out
significant facts, identifying patterns and trends and constructing a framework for a
plausible and coherent interpretation. Themes were coded to create order out of the
different patterns of transcribed participants’ narratives. The data was reduced into small
manageable set of themes.
3.8.2 Objective two and three: Examining the determinants of choice and use
intensity of selected technologies
3.8.2.1The analytical framework: Heckman's two-step procedure
To determine the choice and use intensity of the selected soil and water conservation
technologies, the study employed the Heckman's two step selection model to obtain
unbiased estimates at the second stage (use intensity) of decision making. In the Heckman's
selection model, we presumed that, sample selection bias existed necessitating unbiased
estimation in the second stage (use-intensity) (Jaleta et al., 2013; Lambrecht et al., 2014;
Rabbi et al., 2019). Furthermore, when employing the Heckman's selection model, the
assumption is that choice and use-intensity are not determined with exactly a similar set of
dependent variables. In this study, frequency of training and farmers' perceptions of soil
fertility were the identifier variables that only influenced the first stage (probability of
choice) but not the second-stage (use-intensity) of the selected technologies.
A two-step estimation procedure was followed. In the first step, we estimated the
probability of choice and obtained the Inverse Mill's Ratio (IMR). The IMR was
incorporated in estimating the second step as a remedy for sample selection bias.
Heckman's model is anchored on two latent variables (Heckman, 1979). The first step
29
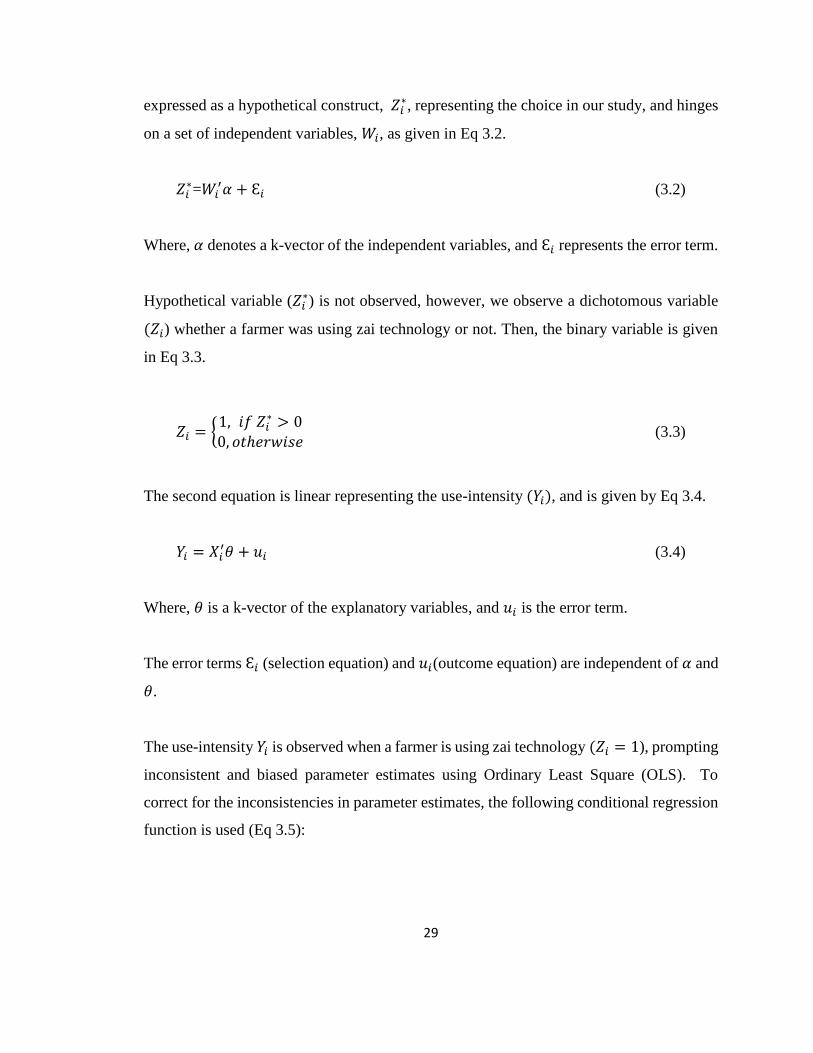
expressed as a hypothetical construct, 𝑍𝑖∗, representing the choice in our study, and hinges
on a set of independent variables, 𝑊𝑖, as given in Eq 3.2.
𝑍𝑖∗=𝑊𝑖
′𝛼 + Ɛ𝑖 (3.2)
Where, 𝛼 denotes a k-vector of the independent variables, and Ɛ𝑖 represents the error term.
Hypothetical variable (𝑍𝑖∗) is not observed, however, we observe a dichotomous variable
(𝑍𝑖) whether a farmer was using zai technology or not. Then, the binary variable is given
in Eq 3.3.
𝑍𝑖 = {1, 𝑖𝑓 𝑍𝑖
∗ > 0
0, 𝑜𝑡ℎ𝑒𝑟𝑤𝑖𝑠𝑒 (3.3)
The second equation is linear representing the use-intensity (𝑌𝑖), and is given by Eq 3.4.
𝑌𝑖 = 𝑋𝑖′𝜃 + 𝑢𝑖 (3.4)
Where, 𝜃 is a k-vector of the explanatory variables, and 𝑢𝑖 is the error term.
The error terms Ɛ𝑖 (selection equation) and 𝑢𝑖(outcome equation) are independent of 𝛼 and
𝜃.
The use-intensity 𝑌𝑖 is observed when a farmer is using zai technology (𝑍𝑖 = 1), prompting
inconsistent and biased parameter estimates using Ordinary Least Square (OLS). To
correct for the inconsistencies in parameter estimates, the following conditional regression
function is used (Eq 3.5):

30
𝐸 = (𝑌𝑖
𝑍𝑖> 0)=𝑋𝑖
′𝜃 + 𝜃𝜆 + 𝜆𝑖 (3.5)
Where 𝜆𝑖 is the IMR and given as (Eq 3.6):
𝜆𝑖 =𝜙𝑊𝑖
′𝛼
𝜑𝑊𝑖′𝛼
(3.6)
Where 𝜙 is the standard normal, probability density function and 𝜑 represents the
cumulative distribution function for a standard random variable. Lambda is unknown,
nevertheless, the variables 𝛼 can be assessed in a probit model with regard to the observed
binary outcome (𝑍𝑖).
In estimating the second stage, IMR, 𝜆𝑖 =𝜙𝑊𝑖
′𝛼
𝜑𝑊𝑖′𝛼
is interleaved into outcome equation as
independent variable and given as (Eq 3.7).
𝑌𝑖 = 𝑋𝑖′𝜃 + 𝜃𝜆𝜆𝑖+𝑢𝑖 (3.7)
This gives rise to self-selection bias when 𝜃 is non-zero. To avoid self-selection bias and
obtain consistent estimators, the model parameters were estimated using the maximum
likelihood criterion.
3.8.2.2 Empirical model specification
In Heckman's selection model, the first step dependent variable was dummy in nature
(whether a farmer was using zai technology or not); (whether a farmer was using mineral
fertiliser technology or not) and was explained using a set of independent variables,
namely age, education, household size, off-farm income, total land cultivated, land
ownership, access to farm implements, livestock densities, perceptions on soil fertility and
soil erosion, farmer training, group membership, access to relief, frequency of training, the
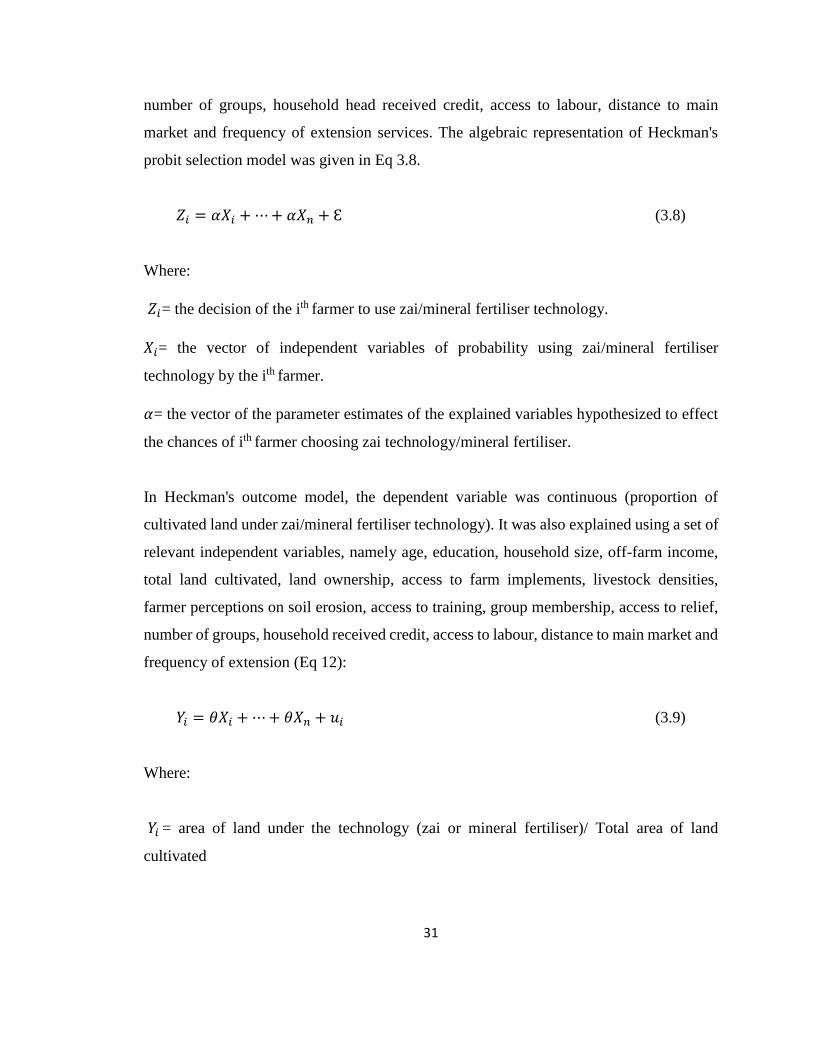
31
number of groups, household head received credit, access to labour, distance to main
market and frequency of extension services. The algebraic representation of Heckman's
probit selection model was given in Eq 3.8.
𝑍𝑖 = 𝛼𝑋𝑖 + ⋯ + 𝛼𝑋𝑛 + Ɛ (3.8)
Where:
𝑍𝑖= the decision of the ith farmer to use zai/mineral fertiliser technology.
𝑋𝑖= the vector of independent variables of probability using zai/mineral fertiliser
technology by the ith farmer.
𝛼= the vector of the parameter estimates of the explained variables hypothesized to effect
the chances of ith farmer choosing zai technology/mineral fertiliser.
In Heckman's outcome model, the dependent variable was continuous (proportion of
cultivated land under zai/mineral fertiliser technology). It was also explained using a set of
relevant independent variables, namely age, education, household size, off-farm income,
total land cultivated, land ownership, access to farm implements, livestock densities,
farmer perceptions on soil erosion, access to training, group membership, access to relief,
number of groups, household received credit, access to labour, distance to main market and
frequency of extension (Eq 12):
𝑌𝑖 = 𝜃𝑋𝑖 + ⋯ + 𝜃𝑋𝑛 + 𝑢𝑖 (3.9)
Where:
𝑌𝑖 = area of land under the technology (zai or mineral fertiliser)/ Total area of land
cultivated

32
𝑋𝑖= the vector of independent variables of zai/mineral fertiliser technology by the ith farmer
use-intensity
𝜃= the vector of the parameter estimates of the independent variables conjectured to effect
the outcome stage.
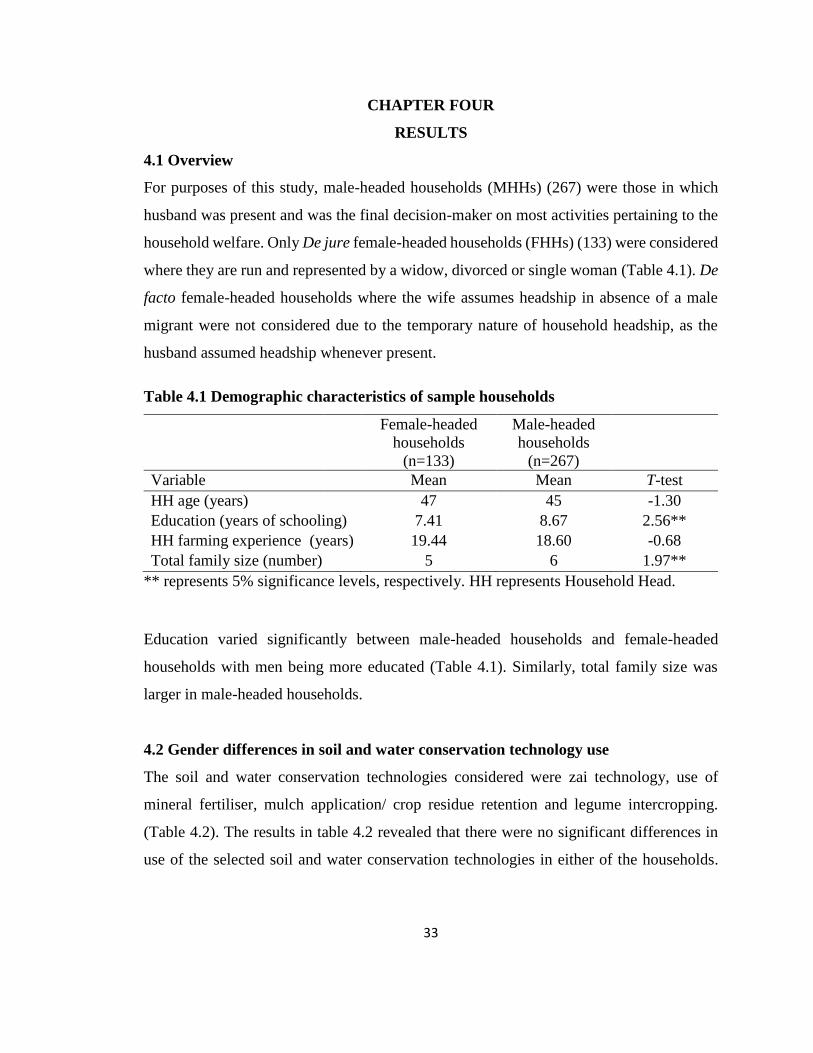
33
CHAPTER FOUR
RESULTS
4.1 Overview
For purposes of this study, male-headed households (MHHs) (267) were those in which
husband was present and was the final decision-maker on most activities pertaining to the
household welfare. Only De jure female-headed households (FHHs) (133) were considered
where they are run and represented by a widow, divorced or single woman (Table 4.1). De
facto female-headed households where the wife assumes headship in absence of a male
migrant were not considered due to the temporary nature of household headship, as the
husband assumed headship whenever present.
Table 4.1 Demographic characteristics of sample households
Female-headed
households
(n=133)
Male-headed
households
(n=267)
Variable Mean Mean T-test
HH age (years) 47 45 -1.30
Education (years of schooling) 7.41 8.67 2.56**
HH farming experience (years) 19.44 18.60 -0.68
Total family size (number) 5 6 1.97**
** represents 5% significance levels, respectively. HH represents Household Head.
Education varied significantly between male-headed households and female-headed
households with men being more educated (Table 4.1). Similarly, total family size was
larger in male-headed households.
4.2 Gender differences in soil and water conservation technology use
The soil and water conservation technologies considered were zai technology, use of
mineral fertiliser, mulch application/ crop residue retention and legume intercropping.
(Table 4.2). The results in table 4.2 revealed that there were no significant differences in
use of the selected soil and water conservation technologies in either of the households.

34
However, the technology use levels for mineral fertiliser (53%) in female-headed
households and (52%) in male-headed households and zai technology (44%) in female-
headed households and (38%) in male-headed households, were considered low when
compared to other technologies (Fig 4.1).
Table 4.2 Household level soil and water conservation technology uptake by gender
FHHs MHHs ꭓ2
Technology Users Non-users Users Non-users
Animal manure 111(83) 22(17) 219(82) 48(18) 0.418
Mulch/crop residue retention 109(82) 24(18) 214(80) 53(20) 0.121
Mineral fertilizer use 70 (53) 63(47) 138(52) 129(48) 0.471
Zai technology 58(44) 75(56) 102(38) 165(62) 0.112
Legume-intercropping 114(86) 44(14) 233(87) 19(13) 0.340
No significant association observed, ꭓ2 = Chi Square value. % are in parentheses.
MHHs represent Male-headed households, FHHs represents Female-headed households
Figure 4.1 Farmers level of usage of soil and water management techniques
83
82
53
44
86
82
80
52
38
87
A ni ma l
ma nur e
c r o p r e s i due
r e t e n t i o n
M i ne r a l
f e r t i l i z e r
Za i t e c hno l o g y L e g ume
i n t e r c r o pp i ng
Per
cen
tag
e of
use
rs
Soil management techniques
FHH%( Users) MHH %Users

35
4.3 Gender differences in land under technologies
On average, male-headed households have dedicated more land to legume-intercrop 0.92
ha, in comparison to 0.67ha in female-headed households (Table 4.3). A possible
implication that, male-headed households own and control more land than do female-
headed households.
Table 4.3 Land allocation under different technologies by gender
FHHs MHHs T-test
Technology Mean Std. Dev. Mean Std. Dev.
Land under animal manure (ha) 0.37 0.34 0.43 0.48 1.53
Land under mulch (ha) 0.62 0.70 0.61 0.65 -0.14
Land under fertilizer (ha) 0.34 0.60 0.38 0.81 0.17
Land under Zai pits (ha) 0.12 0.21 0.11 0.24 -0.24
Land under legume-intercrops (ha) 0.67 0.57 0.92 0.97 3.199**
***, ** and * represents 1%, 5% and 10% significance levels, respectively. MHHs
represent Male-headed households, FHHs represents Female-headed households
Largely, trends in land allocation under different technologies depicted that men allocated
more land to the technologies when compared to female farmers (Fig 4.2).
Figure 4.2 Trends in land allocation under different soil management techniques
0.37
0.62
0.34
0.12
0.67
0.43
0.61
0.38
0.11
0.92
1 2 3 4 5
Pro
port
ion
of
lan
d H
a (
Use
rs)
1= Animal manure 2= Crop residue retention 3= Mineral fertiliser 4= Zai
technology 5= Legume-intercropping
FHH proportion( Users) MHH proportion Users
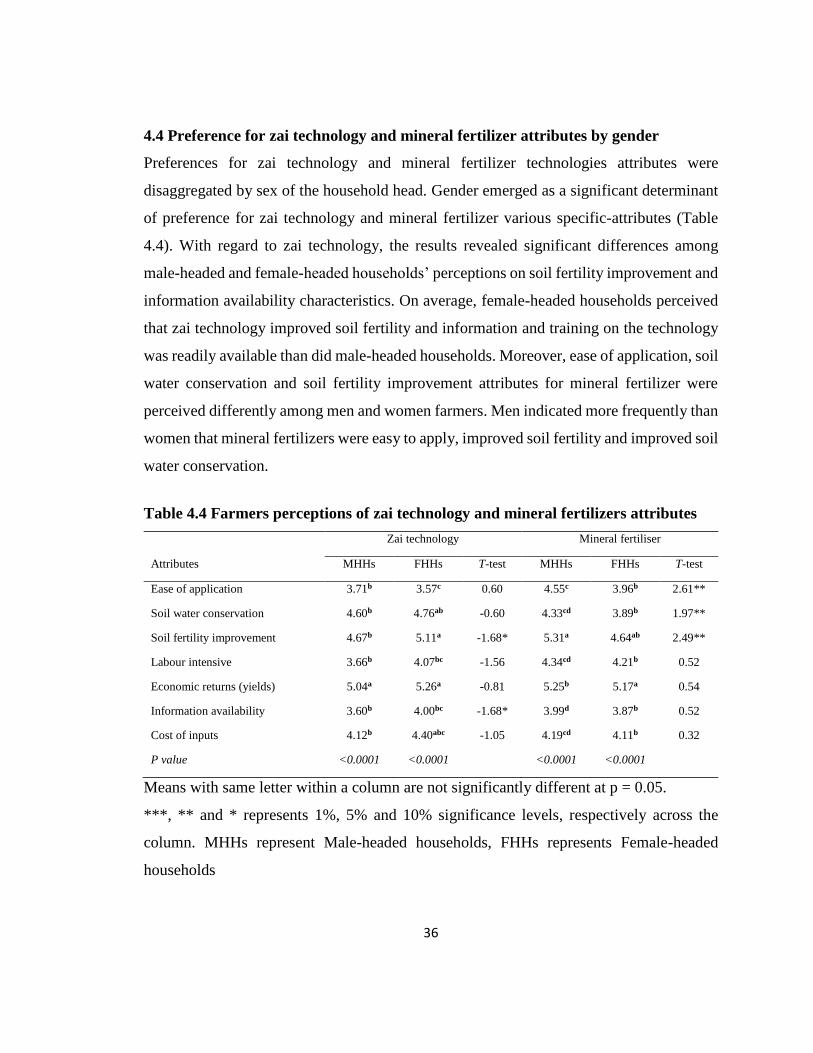
36
4.4 Preference for zai technology and mineral fertilizer attributes by gender
Preferences for zai technology and mineral fertilizer technologies attributes were
disaggregated by sex of the household head. Gender emerged as a significant determinant
of preference for zai technology and mineral fertilizer various specific-attributes (Table
4.4). With regard to zai technology, the results revealed significant differences among
male-headed and female-headed households’ perceptions on soil fertility improvement and
information availability characteristics. On average, female-headed households perceived
that zai technology improved soil fertility and information and training on the technology
was readily available than did male-headed households. Moreover, ease of application, soil
water conservation and soil fertility improvement attributes for mineral fertilizer were
perceived differently among men and women farmers. Men indicated more frequently than
women that mineral fertilizers were easy to apply, improved soil fertility and improved soil
water conservation.
Table 4.4 Farmers perceptions of zai technology and mineral fertilizers attributes
Zai technology Mineral fertiliser
Attributes MHHs FHHs T-test MHHs FHHs T-test
Ease of application 3.71b 3.57c 0.60 4.55c 3.96b 2.61**
Soil water conservation 4.60b 4.76ab -0.60 4.33cd 3.89b 1.97**
Soil fertility improvement 4.67b 5.11a -1.68* 5.31a 4.64ab 2.49**
Labour intensive 3.66b 4.07bc -1.56 4.34cd 4.21b 0.52
Economic returns (yields) 5.04a 5.26a -0.81 5.25b 5.17a 0.54
Information availability 3.60b 4.00bc -1.68* 3.99d 3.87b 0.52
Cost of inputs 4.12b 4.40abc -1.05 4.19cd 4.11b 0.32
P value <0.0001 <0.0001 <0.0001 <0.0001
Means with same letter within a column are not significantly different at p = 0.05.
***, ** and * represents 1%, 5% and 10% significance levels, respectively across the
column. MHHs represent Male-headed households, FHHs represents Female-headed
households

37
Overall, the results indicate that, within female-headed and male-headed households, the
technology attributes were significant determinants of preference at less than 1%. One-way
ANOVA results indicated that, the means of the attributes within the households were
unequal (p=˂ 0.0001) (Table 4.4). Further, results show that the most preferred zai
technology attributes in female-headed households were the ability to improve soil fertility
(5.11) and increase economic returns (5.26) whereas in male-headed households’ ability to
increase economic returns (5.04) was the most preferred attribute. With regard to mineral
fertilizer, within female-headed households, ability to increase economic returns (5.17)
was the most preferred attribute while among male-headed households, ability to improve
soil fertility (5.31) was the most preferred technology attribute.
4.4.1 Preference for zai technology and mineral fertiliser
Four major themes were important in terms of preference for zai pits and mineral fertilizer
(Table4.5). These were; technology awareness, participants’ expressions about the
technologies, gendered roles in technology use and technology needs and concerns intrinsic
to each participant.
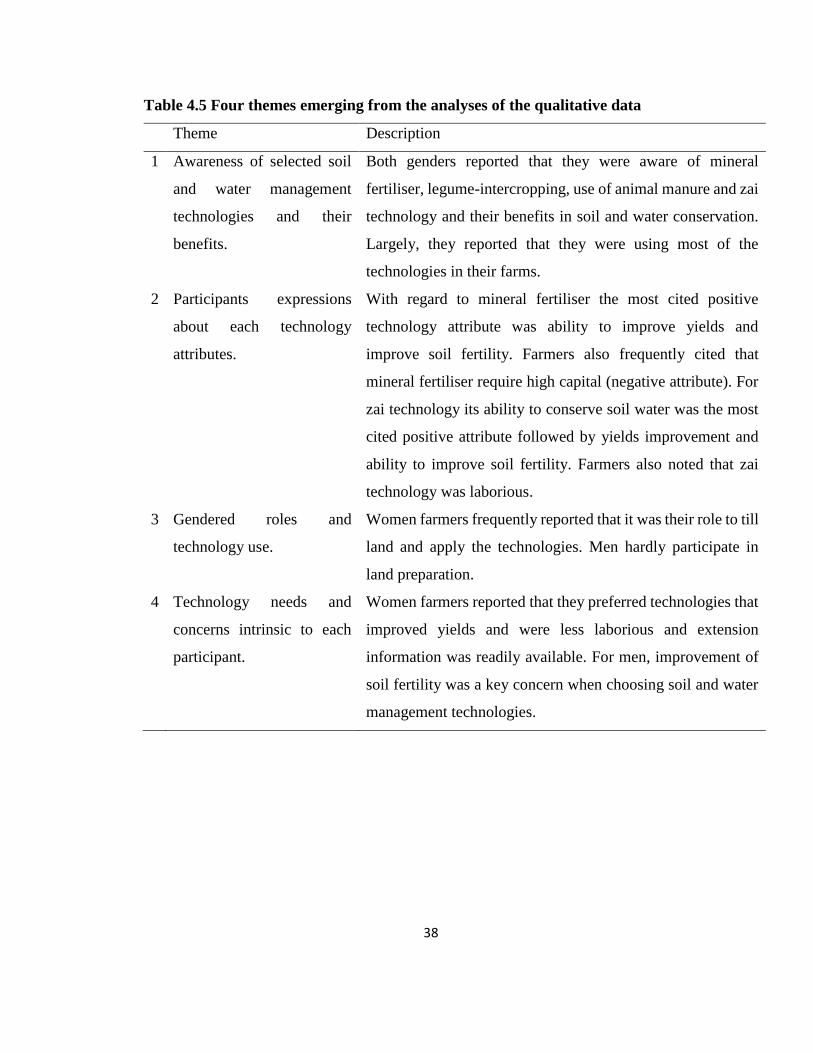
38
Table 4.5 Four themes emerging from the analyses of the qualitative data
Theme Description
1 Awareness of selected soil
and water management
technologies and their
benefits.
Both genders reported that they were aware of mineral
fertiliser, legume-intercropping, use of animal manure and zai
technology and their benefits in soil and water conservation.
Largely, they reported that they were using most of the
technologies in their farms.
2 Participants expressions
about each technology
attributes.
With regard to mineral fertiliser the most cited positive
technology attribute was ability to improve yields and
improve soil fertility. Farmers also frequently cited that
mineral fertiliser require high capital (negative attribute). For
zai technology its ability to conserve soil water was the most
cited positive attribute followed by yields improvement and
ability to improve soil fertility. Farmers also noted that zai
technology was laborious.
3 Gendered roles and
technology use.
Women farmers frequently reported that it was their role to till
land and apply the technologies. Men hardly participate in
land preparation.
4 Technology needs and
concerns intrinsic to each
participant.
Women farmers reported that they preferred technologies that
improved yields and were less laborious and extension
information was readily available. For men, improvement of
soil fertility was a key concern when choosing soil and water
management technologies.

39
4.5 Comparison of zai technology users and non-users by gender
Among the interviewed households, (44%) female-headed households and (38%) male-
headed households were utilizing zai technology (Table 4.6). On average, within female-
headed households, the farming experience was significantly different at 10% level, with
non-users of zai technology being more experienced in farming (21) when likened to users
(17.28) (Table 4.6). The number of females in male-headed households varied significantly
at 5% level, with user households having more females (2.93) as compared to non-users
(2.53) (Table 4.6).
Table 4.6 Demographic factors influencing zai technology choice and use-intensity
disaggregated by gender of the household head
Female-headed
households
Male-headed
households
Mean Mean
Variable Non- users
(n=75)
Users
(n=58)
T-
test
Non- users
(n=165)
Users
(n=102)
T-
test
HH age 48.00 45.16 1.19 45.53 43.73 1.02
Farming
experience 21.00 17.28 1.89c 18.78 17.71 0.68
Education 7.36 7.48 -0.16 8.41 9.10 -1.18
Household size
Males 2.19 2.29 -0.41 2.75 2.81 -0.34
Females 2.71 2.79 -0.37 2.53 2.93 2.16b
b and c represents 5% and 10% significance levels, respectively. HH represents Household
Head.
There existed a significant relationship between group membership and choice and use-
intensity of zai technology in male-headed households and female-headed households at
1% level. About (53%) of zai technology users in female-headed households were
members of a farmer group compared to (47%) non-users. For male-headed households,
(46%) users had group membership compared to (54%) of non-users (Table 4.7). Within
male-headed households, users and non-users also differed significantly at 1% in levels of
participation in farmer training. About (51%) of users participated in farmer training,
40
whereas (49%) non-users participated in training (Table 4.7). Also, results suggest a
significant association at 1% level between choice and use-intensity of zai technology and
access to extension services among male-headed households (Table 4.7).
Results also showed a significant relationship at 5% level between access to relief and use
of zai technology in male-headed households. Some (47%) non-users of zai technology
had received government relief compared with (53%) users (Table 4). On average, total
landholding significantly differed at 5% level within male-headed households, with users
of zai technology having a larger land size compared with non-users (Table 4.5). Similarly,
total cultivated land significantly differed within male-headed households at 1% level, with
users of zai technology cultivating more land than non-users. Averagely, the frequency of
training and extension contacts varied markedly for users and non-users of zai in male-
headed households. Users of zai technology had more extension contacts and training as
compared to non-users (Table 4.7).
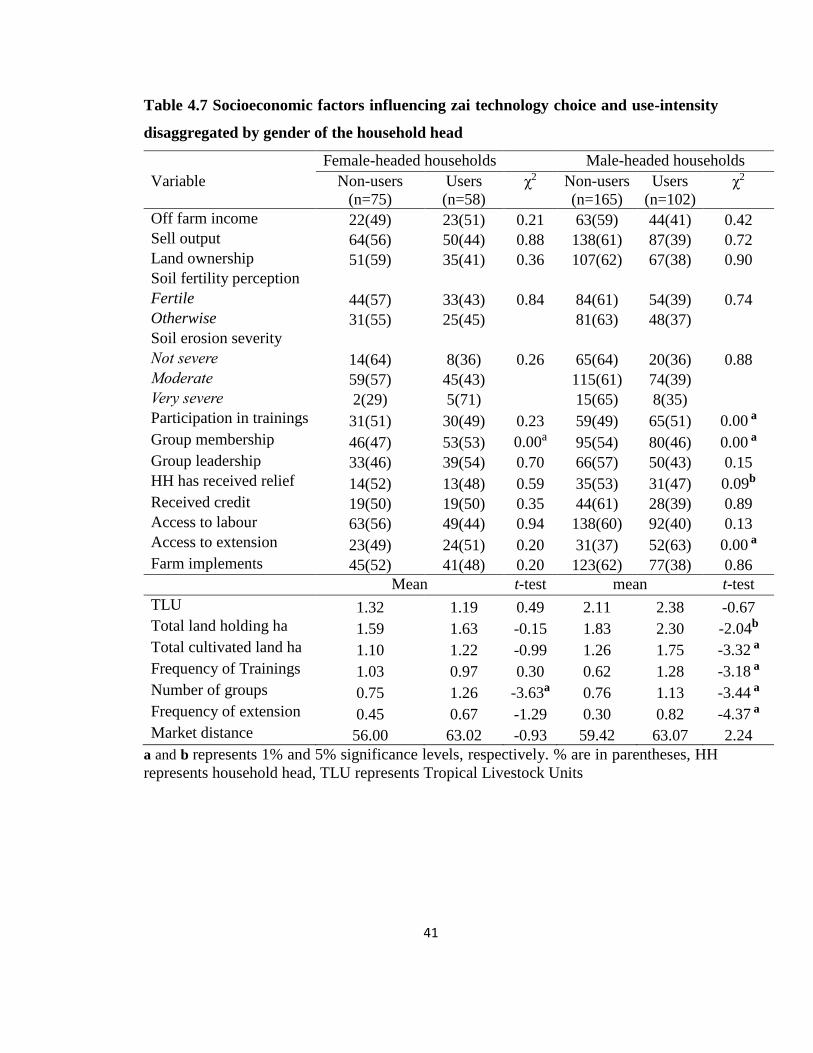
41
Table 4.7 Socioeconomic factors influencing zai technology choice and use-intensity
disaggregated by gender of the household head
Female-headed households Male-headed households
Variable Non-users
(n=75)
Users
(n=58)
ꭓ2 Non-users
(n=165)
Users
(n=102)
ꭓ2
Off farm income 22(49) 23(51) 0.21 63(59) 44(41) 0.42
Sell output 64(56) 50(44) 0.88 138(61) 87(39) 0.72
Land ownership 51(59) 35(41) 0.36 107(62) 67(38) 0.90
Soil fertility perception
Fertile 44(57) 33(43) 0.84 84(61) 54(39) 0.74
Otherwise 31(55) 25(45) 81(63) 48(37)
Soil erosion severity
Not severe 14(64) 8(36) 0.26 65(64) 20(36) 0.88
Moderate 59(57) 45(43) 115(61) 74(39)
Very severe 2(29) 5(71) 15(65) 8(35)
Participation in trainings 31(51) 30(49) 0.23 59(49) 65(51) 0.00 a
Group membership 46(47) 53(53) 0.00a 95(54) 80(46) 0.00 a
Group leadership 33(46) 39(54) 0.70 66(57) 50(43) 0.15
HH has received relief 14(52) 13(48) 0.59 35(53) 31(47) 0.09b
Received credit 19(50) 19(50) 0.35 44(61) 28(39) 0.89
Access to labour 63(56) 49(44) 0.94 138(60) 92(40) 0.13
Access to extension 23(49) 24(51) 0.20 31(37) 52(63) 0.00 a
Farm implements 45(52) 41(48) 0.20 123(62) 77(38) 0.86
Mean t-test mean t-test
TLU 1.32 1.19 0.49 2.11 2.38 -0.67
Total land holding ha 1.59 1.63 -0.15 1.83 2.30 -2.04b
Total cultivated land ha 1.10 1.22 -0.99 1.26 1.75 -3.32 a
Frequency of Trainings 1.03 0.97 0.30 0.62 1.28 -3.18 a
Number of groups 0.75 1.26 -3.63a 0.76 1.13 -3.44 a
Frequency of extension 0.45 0.67 -1.29 0.30 0.82 -4.37 a
Market distance 56.00 63.02 -0.93 59.42 63.07 2.24
a and b represents 1% and 5% significance levels, respectively. % are in parentheses, HH
represents household head, TLU represents Tropical Livestock Units

42
4.6 Determinants of zai technology choice by gender
Table 4.8 shows the Heckman 2-step model results of the determinants of zai technology
choice and use-intensity. Findings revealed that, for both gender, land under cultivation
significantly determined zai technology choice at the 5% level. A unit change in land under
cultivation increased the likelihood of zai technology choice by 12.2% and 6.8% in female-
headed households and male-headed households, respectively. Ownership and access to
higher-value agricultural farm implement significantly influenced zai technology choice
by women farmers at the 10% level. A unit change in access and ownership of farm
implements increased the likelihood of choosing zai technology by 15.8% in female-
headed households. Membership to a farmer group significantly influenced zai
technology's choice in female-headed households and male-headed households at the 5%
level. Specifically, group membership increased the likelihood of choosing zai technology
by 26.8% and 8.8% among female-headed households and male-headed households,
respectively. Within Male-headed households, an increase in agricultural extension access
increased the likelihood of selecting zai technology by 5.9%.
4.7 Determinants of zai technology use-intensity by gender
Further, the results indicated that, age of the household head negatively and significantly
(= -0.026, p<0.01) and (= -0.019, p<0.01) influenced zai technology use-intensity among
female-headed households and male-headed households, respectively. Years of education
negatively predicted zai technology use-intensity within female-headed households (= -
0.048, p<0.10). The study found a significant and positive relationship with zai technology
use-intensity concerning livestock densities within female-headed households (= 0.111,
p<0.01). The coefficient of farmers' perception of soil erosion severity was significantly
and positively associated with zai technology use-intensity among male-headed
households (= 0.250, p<0.10). The study also established a positive and significant
relationship within female-headed households (= 0.140, p<0.10) between the frequency of
training on conservation practices and zai technology use-intensity.
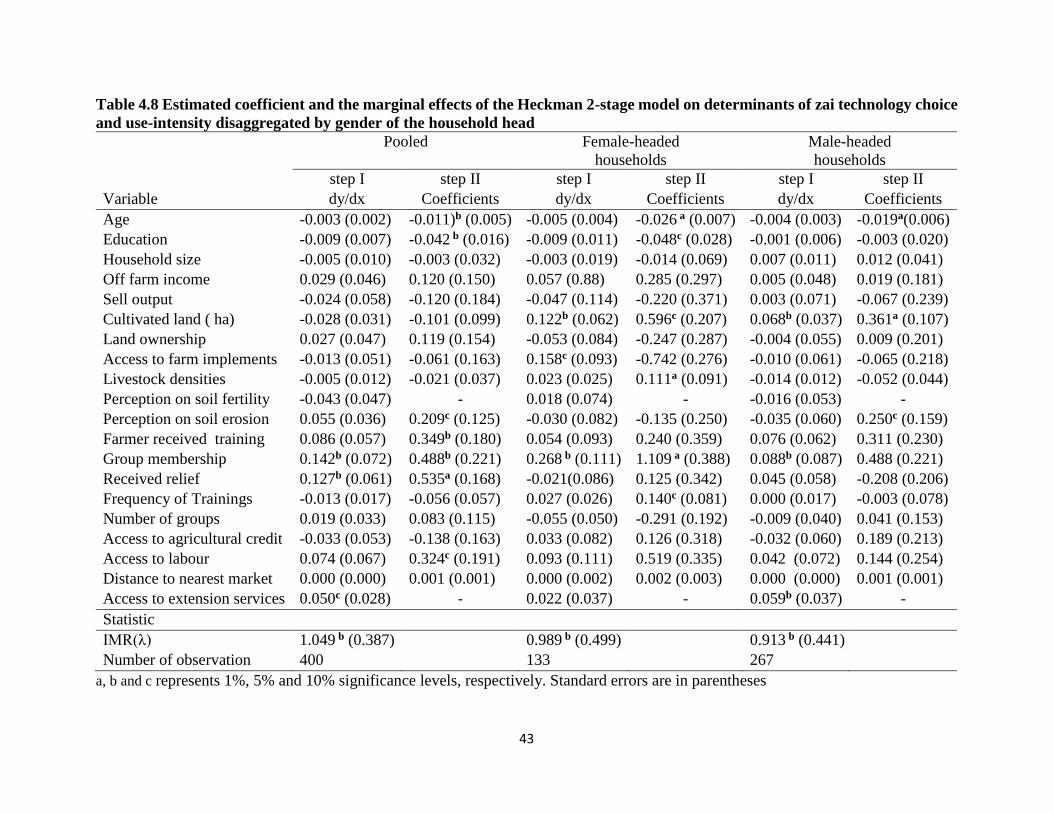
43
Table 4.8 Estimated coefficient and the marginal effects of the Heckman 2-stage model on determinants of zai technology choice
and use-intensity disaggregated by gender of the household head
Pooled Female-headed
households
Male-headed
households
step I step II step I step II step I step II
Variable dy/dx Coefficients dy/dx Coefficients dy/dx Coefficients
Age -0.003 (0.002) -0.011)b (0.005) -0.005 (0.004) -0.026 a (0.007) -0.004 (0.003) -0.019a(0.006)
Education -0.009 (0.007) -0.042 b (0.016) -0.009 (0.011) -0.048c (0.028) -0.001 (0.006) -0.003 (0.020)
Household size -0.005 (0.010) -0.003 (0.032) -0.003 (0.019) -0.014 (0.069) 0.007 (0.011) 0.012 (0.041)
Off farm income 0.029 (0.046) 0.120 (0.150) 0.057 (0.88) 0.285 (0.297) 0.005 (0.048) 0.019 (0.181)
Sell output -0.024 (0.058) -0.120 (0.184) -0.047 (0.114) -0.220 (0.371) 0.003 (0.071) -0.067 (0.239)
Cultivated land ( ha) -0.028 (0.031) -0.101 (0.099) 0.122b (0.062) 0.596c (0.207) 0.068b (0.037) 0.361a (0.107)
Land ownership 0.027 (0.047) 0.119 (0.154) -0.053 (0.084) -0.247 (0.287) -0.004 (0.055) 0.009 (0.201)
Access to farm implements -0.013 (0.051) -0.061 (0.163) 0.158c (0.093) -0.742 (0.276) -0.010 (0.061) -0.065 (0.218)
Livestock densities -0.005 (0.012) -0.021 (0.037) 0.023 (0.025) 0.111a (0.091) -0.014 (0.012) -0.052 (0.044)
Perception on soil fertility -0.043 (0.047) - 0.018 (0.074) - -0.016 (0.053) -
Perception on soil erosion 0.055 (0.036) 0.209c (0.125) -0.030 (0.082) -0.135 (0.250) -0.035 (0.060) 0.250c (0.159)
Farmer received training 0.086 (0.057) 0.349b (0.180) 0.054 (0.093) 0.240 (0.359) 0.076 (0.062) 0.311 (0.230)
Group membership 0.142b (0.072) 0.488b (0.221) 0.268 b (0.111) 1.109 a (0.388) 0.088b (0.087) 0.488 (0.221)
Received relief 0.127b (0.061) 0.535a (0.168) -0.021(0.086) 0.125 (0.342) 0.045 (0.058) -0.208 (0.206)
Frequency of Trainings -0.013 (0.017) -0.056 (0.057) 0.027 (0.026) 0.140c (0.081) 0.000 (0.017) -0.003 (0.078)
Number of groups 0.019 (0.033) 0.083 (0.115) -0.055 (0.050) -0.291 (0.192) -0.009 (0.040) 0.041 (0.153)
Access to agricultural credit -0.033 (0.053) -0.138 (0.163) 0.033 (0.082) 0.126 (0.318) -0.032 (0.060) 0.189 (0.213)
Access to labour 0.074 (0.067) 0.324c (0.191) 0.093 (0.111) 0.519 (0.335) 0.042 (0.072) 0.144 (0.254)
Distance to nearest market 0.000 (0.000) 0.001 (0.001) 0.000 (0.002) 0.002 (0.003) 0.000 (0.000) 0.001 (0.001)
Access to extension services 0.050c (0.028) - 0.022 (0.037) - 0.059b (0.037) -
Statistic
IMR(λ) 1.049 b (0.387) 0.989 b (0.499) 0.913 b (0.441)
Number of observation 400 133 267
a, b and c represents 1%, 5% and 10% significance levels, respectively. Standard errors are in parentheses
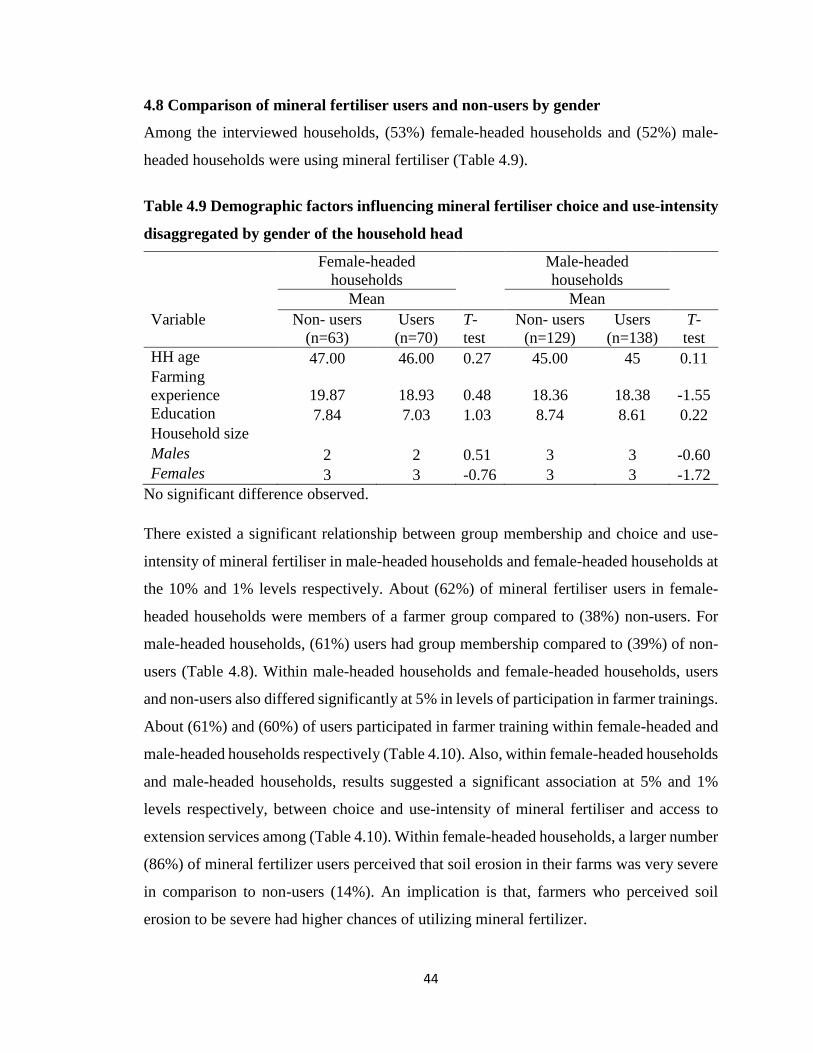
44
4.8 Comparison of mineral fertiliser users and non-users by gender
Among the interviewed households, (53%) female-headed households and (52%) male-
headed households were using mineral fertiliser (Table 4.9).
Table 4.9 Demographic factors influencing mineral fertiliser choice and use-intensity
disaggregated by gender of the household head
Female-headed
households
Male-headed
households
Mean Mean
Variable Non- users
(n=63)
Users
(n=70)
T-
test
Non- users
(n=129)
Users
(n=138)
T-
test
HH age 47.00 46.00 0.27 45.00 45 0.11
Farming
experience 19.87 18.93 0.48 18.36 18.38 -1.55
Education 7.84 7.03 1.03 8.74 8.61 0.22
Household size
Males 2 2 0.51 3 3 -0.60
Females 3 3 -0.76 3 3 -1.72
No significant difference observed.
There existed a significant relationship between group membership and choice and use-
intensity of mineral fertiliser in male-headed households and female-headed households at
the 10% and 1% levels respectively. About (62%) of mineral fertiliser users in female-
headed households were members of a farmer group compared to (38%) non-users. For
male-headed households, (61%) users had group membership compared to (39%) of non-
users (Table 4.8). Within male-headed households and female-headed households, users
and non-users also differed significantly at 5% in levels of participation in farmer trainings.
About (61%) and (60%) of users participated in farmer training within female-headed and
male-headed households respectively (Table 4.10). Also, within female-headed households
and male-headed households, results suggested a significant association at 5% and 1%
levels respectively, between choice and use-intensity of mineral fertiliser and access to
extension services among (Table 4.10). Within female-headed households, a larger number
(86%) of mineral fertilizer users perceived that soil erosion in their farms was very severe
in comparison to non-users (14%). An implication is that, farmers who perceived soil
erosion to be severe had higher chances of utilizing mineral fertilizer.

45
Table 4.10 Socioeconomic factors influencing mineral fertiliser choice and use-
intensity disaggregated by gender of the household head
Female-headed households Male-headed households
Variable Non-users
(n=63)
Users
(n=70)
ꭓ2 Non-users
(n=129)
Users
(n=138)
ꭓ2
Off farm income 22(49) 23(51) 0.80 47(44) 60(56) 0.24
Sell output 56(49) 58(51) 0.32 114(51) 111(49) 0.08b
Land ownership 42(49) 44(51) 0.65 85(49) 89(51) 0.81
Soil fertility perception
Fertile 33(43) 44(57) 0.22 60(44) 78(56) 0.10a
Otherwise 30(54) 26(46) 69(54) 60(46)
Soil erosion severity
Not severe 8(36) 14(34) 0.08b 28(51) 27(49) 0.08b
Moderate 54(52) 50(48) 85(45) 104(55)
Very severe 1(14) 6(86) 16(70) 7(30)
Participation in trainings 24(39) 37(61) 0.08 b 48(40) 73(60) 0.01 b
Group membership 38(38) 61(62) 0.00c 68(39) 107(61) 0.00 a
Group leadership 33(46) 39(54) 0.70 46(40) 70(60) 0.01 b
HH has received relief 3(11) 24(89) 0.40 27(41) 39(59) 0.17
Received credit 19(50) 19(50) 0.70 26(36) 46(64) 0.02 b
Access to labour 54(48) 58(52) 0.65 109(47) 12(53) 0.45
Access to extension 17(36) 30(64) 0.06 b 28(34) 55(66) 0.00a
Farm implements 48(56) 38(44) 0.01 b 98(49) 102(51) 0.70
Mean t-test mean t-test
TLU 1.31 1.22 0.34 2.18 2.34 -0.59
Total land holding ha 1.65 1.57 0.32 1.97 2.04 -0.35
Total cultivated land ha 1.05 1.25 -1.77 1.35 1.55 -1.63
Frequency of Trainings 1.06 0.94 0.40 0.75 0.99 -1.30
Number of groups 0.84 1.09 -1.66c 0.74 1.05 -2.95 a
Frequency of extension 0.48 0.61 -0.82 0.41 0.58 -1.50
Market distance 57.70 60.29 -0.34 67.91 54.19 2.24 b
a and b represents 1% and 5% significance levels, respectively. % are in parentheses, HH
represents household head, TLU represents Tropical Livestock Units
There existed a significant relationship between sale of farm output and choice and use
intensity of mineral fertiliser at 5% level in male headed households. A majority of mineral
fertilizer non-users (51%) sold farm produce compared to users (49%). This implies that
selling of outputs negatively influenced use of mineral fertilizer. Further explanation is

46
that, farmers abandoned use of mineral fertilizers and perhaps this could be as a result of
low returns. Regarding soil fertility, within male headed-households, a majority of mineral
fertilizer users (56%) perceived their soils to be fertile compared to non-users (44%), an
implication is that, farmers perceiving their soils to be fertile were more likely to use
mineral fertilizers.
Within male-headed households, there existed a significant relationship between access to
credit and mineral fertilizer choice and use intensity at 5% level. More users in male-
headed households (64%) had access to credit facility in comparison to non-users (36%).
At 5% and 1% significance levels, access to extension services influenced mineral fertiliser
choice and use intensity within female-headed and male-headed households. More user’s
(64%) and (66%) within female-headed and male-headed households respectively, had
access to extension services, a positive indication that access to extension positively
influenced mineral fertilizers use. Within female-headed households, the study also found
a significant relationship at 5% level regarding access to farm implement and mineral
fertiliser choice and use intensity
Among male-headed households, on average, distance to the nearest input/output market
significantly varied at 5% level with mineral fertiliser non-users walking longer distances
(67.91 walking minutes) to access the nearest market facility when compared to users
(54.19 walking minutes). The same trend was observed with group membership. Users of
mineral fertiliser in male-headed households had more group membership when compared
to non-users. Group membership varied significantly at 1% level (Table 4.10).
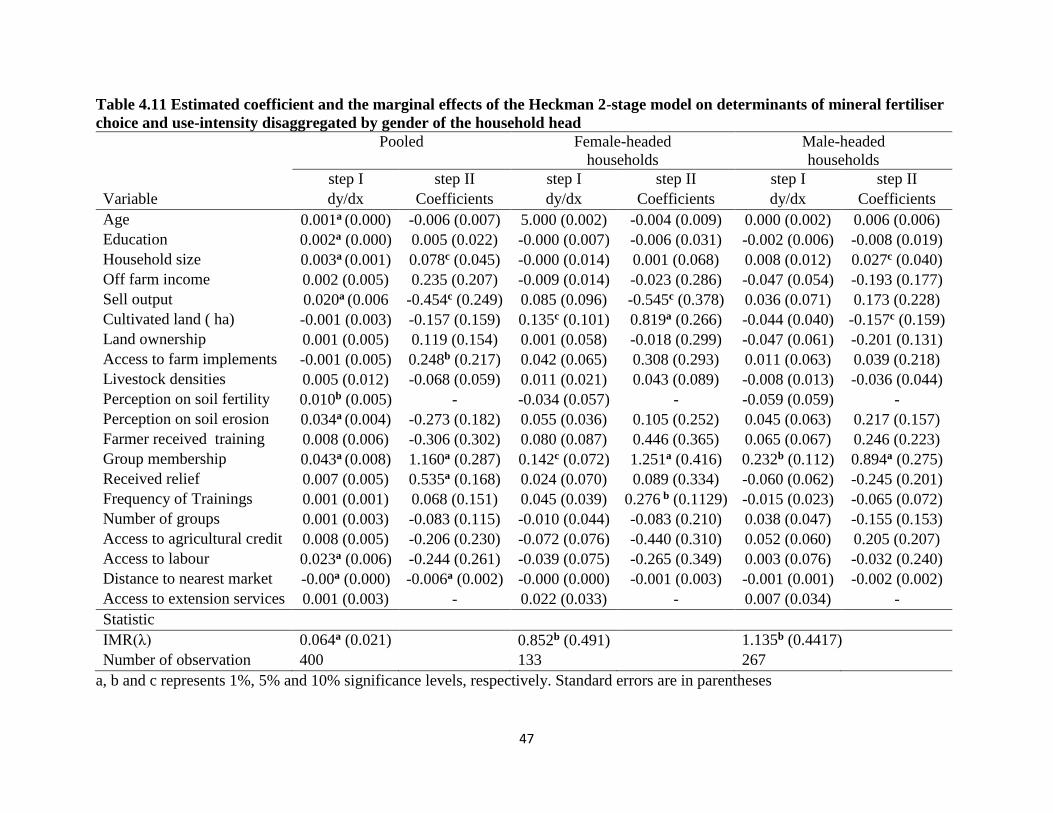
47
Table 4.11 Estimated coefficient and the marginal effects of the Heckman 2-stage model on determinants of mineral fertiliser
choice and use-intensity disaggregated by gender of the household head Pooled Female-headed
households
Male-headed
households
step I step II step I step II step I step II
Variable dy/dx Coefficients dy/dx Coefficients dy/dx Coefficients
Age 0.001a (0.000) -0.006 (0.007) 5.000 (0.002) -0.004 (0.009) 0.000 (0.002) 0.006 (0.006)
Education 0.002a (0.000) 0.005 (0.022) -0.000 (0.007) -0.006 (0.031) -0.002 (0.006) -0.008 (0.019)
Household size 0.003a (0.001) 0.078c (0.045) -0.000 (0.014) 0.001 (0.068) 0.008 (0.012) 0.027c (0.040)
Off farm income 0.002 (0.005) 0.235 (0.207) -0.009 (0.014) -0.023 (0.286) -0.047 (0.054) -0.193 (0.177)
Sell output 0.020a (0.006 -0.454c (0.249) 0.085 (0.096) -0.545c (0.378) 0.036 (0.071) 0.173 (0.228)
Cultivated land ( ha) -0.001 (0.003) -0.157 (0.159) 0.135c (0.101) 0.819a (0.266) -0.044 (0.040) -0.157c (0.159)
Land ownership 0.001 (0.005) 0.119 (0.154) 0.001 (0.058) -0.018 (0.299) -0.047 (0.061) -0.201 (0.131)
Access to farm implements -0.001 (0.005) 0.248b (0.217) 0.042 (0.065) 0.308 (0.293) 0.011 (0.063) 0.039 (0.218)
Livestock densities 0.005 (0.012) -0.068 (0.059) 0.011 (0.021) 0.043 (0.089) -0.008 (0.013) -0.036 (0.044)
Perception on soil fertility 0.010b (0.005) - -0.034 (0.057) - -0.059 (0.059) -
Perception on soil erosion 0.034a (0.004) -0.273 (0.182) 0.055 (0.036) 0.105 (0.252) 0.045 (0.063) 0.217 (0.157)
Farmer received training 0.008 (0.006) -0.306 (0.302) 0.080 (0.087) 0.446 (0.365) 0.065 (0.067) 0.246 (0.223)
Group membership 0.043a (0.008) 1.160a (0.287) 0.142c (0.072) 1.251a (0.416) 0.232b (0.112) 0.894a (0.275)
Received relief 0.007 (0.005) 0.535a (0.168) 0.024 (0.070) 0.089 (0.334) -0.060 (0.062) -0.245 (0.201)
Frequency of Trainings 0.001 (0.001) 0.068 (0.151) 0.045 (0.039) 0.276 b (0.1129) -0.015 (0.023) -0.065 (0.072)
Number of groups 0.001 (0.003) -0.083 (0.115) -0.010 (0.044) -0.083 (0.210) 0.038 (0.047) -0.155 (0.153)
Access to agricultural credit 0.008 (0.005) -0.206 (0.230) -0.072 (0.076) -0.440 (0.310) 0.052 (0.060) 0.205 (0.207)
Access to labour 0.023a (0.006) -0.244 (0.261) -0.039 (0.075) -0.265 (0.349) 0.003 (0.076) -0.032 (0.240)
Distance to nearest market -0.00a (0.000) -0.006a (0.002) -0.000 (0.000) -0.001 (0.003) -0.001 (0.001) -0.002 (0.002)
Access to extension services 0.001 (0.003) - 0.022 (0.033) - 0.007 (0.034) -
Statistic
IMR(λ) 0.064a (0.021) 0.852b (0.491) 1.135b (0.4417)
Number of observation 400 133 267
a, b and c represents 1%, 5% and 10% significance levels, respectively. Standard errors are in parentheses
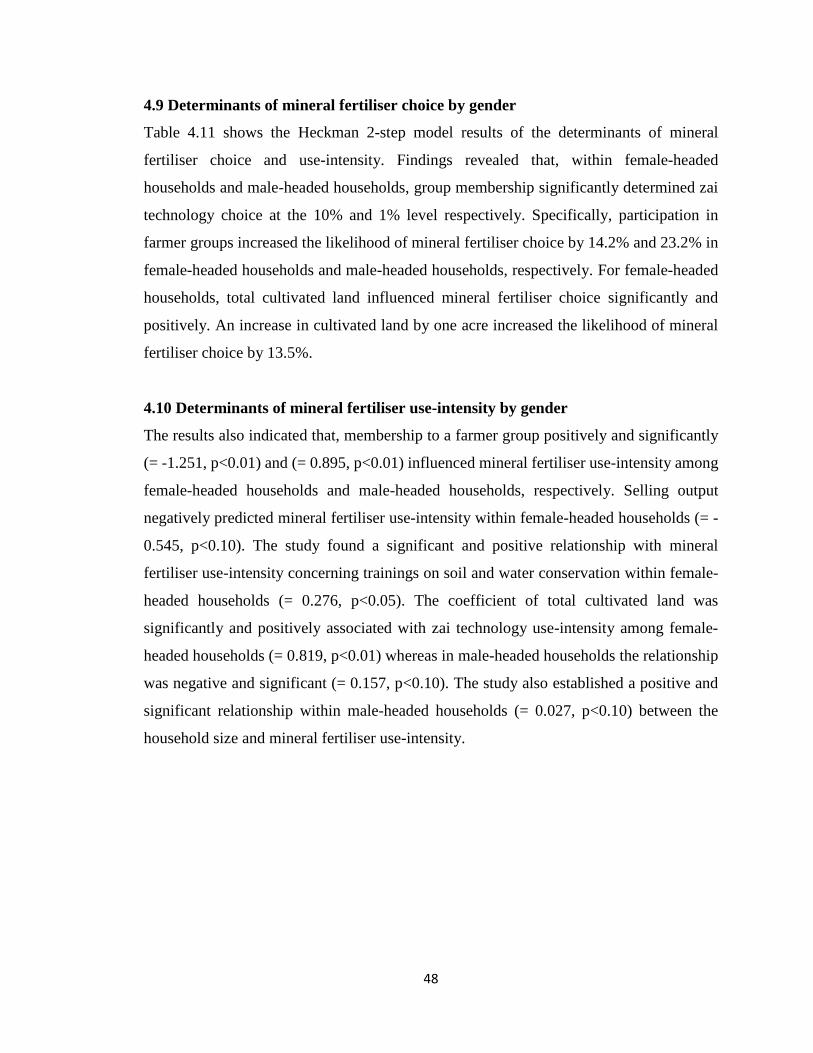
48
4.9 Determinants of mineral fertiliser choice by gender
Table 4.11 shows the Heckman 2-step model results of the determinants of mineral
fertiliser choice and use-intensity. Findings revealed that, within female-headed
households and male-headed households, group membership significantly determined zai
technology choice at the 10% and 1% level respectively. Specifically, participation in
farmer groups increased the likelihood of mineral fertiliser choice by 14.2% and 23.2% in
female-headed households and male-headed households, respectively. For female-headed
households, total cultivated land influenced mineral fertiliser choice significantly and
positively. An increase in cultivated land by one acre increased the likelihood of mineral
fertiliser choice by 13.5%.
4.10 Determinants of mineral fertiliser use-intensity by gender
The results also indicated that, membership to a farmer group positively and significantly
(= -1.251, p<0.01) and (= 0.895, p<0.01) influenced mineral fertiliser use-intensity among
female-headed households and male-headed households, respectively. Selling output
negatively predicted mineral fertiliser use-intensity within female-headed households (= -
0.545, p<0.10). The study found a significant and positive relationship with mineral
fertiliser use-intensity concerning trainings on soil and water conservation within female-
headed households (= 0.276, p<0.05). The coefficient of total cultivated land was
significantly and positively associated with zai technology use-intensity among female-
headed households (= 0.819, p<0.01) whereas in male-headed households the relationship
was negative and significant (= 0.157, p<0.10). The study also established a positive and
significant relationship within male-headed households (= 0.027, p<0.10) between the
household size and mineral fertiliser use-intensity.
49
CHAPTER FIVE
DISCUSSION, CONCLUSIONS, AND RECOMMENDATIONS
5.1 Overview
This chapter provides the discussion of results for the three specific objectives,
conclusions, policy and future research recommendations.
5.2 Discussion
5.2.1 Socioeconomic characteristics of zai technology and mineral fertiliser users
A majority of the interviewed households were male-headed. This finding collaborates
with other studies conducted in the region by Mugwe et al. (2009) and Mwaura et al.
(2021). The implication is that, men dominate major farm decision-making activities at the
household level (Macharia et al., 2014). Contrariwise, the results revealed that more female
farmers were using zai technology and mineral fertiliser when compared to men. This
probably explains the importance of women participating in agricultural decision making
at household level and having access and control over productive resources such as land
and income. The finding resonates with that of Murage et al. (2015), who reported that
women adopted more climate-smart strategies when compared to men to avert the
overarching constraints of climate shocks that affected them more directly than men. The
results further underscore the importance of larger households in driving choice and use-
intensity of agricultural innovations. The propensity of choosing and using zai technology
and mineral fertiliser intensely was high in larger male-headed households. Usman et al.
(2021) pointed out that larger families provide voluntarily available labour required in
implementing labour-intensive technologies.
This study's demographic characteristics show that, among female-headed households,
non-users of zai technology were more experienced than users. Farming experience has
been found to positively as well as negatively influence the likelihood of adopting
agricultural technologies (Knowler & Bradshaw, 2007). This could be associated with
trade-offs involved in technology choice. With time, as farmers gain more experience, they
50
gradually shift from technologies with diminishing marginal returns to improved
technologies. Further, with rapid technological advancement, experience devalues with
time necessitating frequent refreshment of knowledge for effectual technology choice and
implementation decisions. Previous research by Ainembabazi et al. (2014) reported that
farming experience is mostly important at the try-out stage. Then, farmers may opt out
when the returns to investment start decreasing. More so, farmers may abandon zai
technology that is labour intensive and requires more land allocation for intensive
application.
Results showed that users of zai technology and mineral fertiliser were members of farmer
groups, accessed extension services, and participated in soil and water conservation
training. These findings may be co-attributed to farmer groups, extension services, and
training, providing capacity-building avenues to disseminate information to farmers on
agricultural innovations. As was noted by Genius et al. (2014), extension agents and farmer
groups link-up researchers and farmers reducing transaction costs when disseminating new
and improved technologies to a larger heterogeneous group of farmers. In addition, through
extension training, model farmers extend knowledge to other farmers through farmer to
farmer training. Farm size is an important factor in the utilization process of agricultural
technologies. Application of scale-dependent technologies determined by land size (Feder
et al., 1985). User male-households had larger land size. This implies that zai technology
is a lumpy technology requiring large farm sizes to maximize returns on investment.
5.2.2 Preferences for zai technology and mineral fertiliser attributes by gender
With regard to zai technology, farmers’ perceptions on ability of the technology to improve
soil fertility and information availability significantly varied by gender of the household
head. More female headed households perceived zai technology to improve soil fertility
and sufficient extension information to be readily available than did male headed
households. This is likely to be a reflection of the history of extension programmes and
training on soil and water conservation in the area. The implication is that, there are strong

51
positive associations of zai technology with high yields and improvement of soil fertility.
Also, female headed households are more sensitive to soil fertility and information
availability characteristics when considering soil and water conservation measures. These
findings are in consonance with those of Ndiritu et al (2014) who found that women base
their choices for soil and water conservation strategies on opportunity cost of realizing
better yields. In another study by Andersson et al (2015), the results revealed that, extension
information was an important factor in promoting continued use of conservation agriculture
after tryout stage by female farmers.
According to a focus group discussion (female farmers), a participant reported that;
“I am able to construct zai pits in my farm because I was trained in a project on
the measurements and how to incorporate manure and crop residue in the pits; Our
officer demonstrated how to construct the pits and followed up what I did in my
farm; Although its tiring and one cannot manage a large piece of land with zai
technology, crops planted in the pits do well when compared to planting furrows
and other practices.”
In relation to mineral fertilizer, female farmers cited the ability of the technology to
increase yields more frequently suggesting that there are strong positive associations of
mineral fertilizer with high yields. For the male farmers, the most frequently cited attribute
was ability of mineral fertilizer to improve soil fertility. Misiko et al (2011) carried out a
study on strengthening understanding and perceptions of mineral fertilizer use among
smallholder farmers in Western Kenya and found that farmers perceive mineral fertilizer
differently, especially characteristics resulting from erratic crop responses such as yields.
The findings suggest that, perceptions are substantiated and calls for more research and
training over a long period to enable farmers understand the effects of mineral fertilizer on
yields and soil fertility. In a focus group discussion (female farmers), a participant reported
that;

52
“Those who use fertilizer have money, after selling our produce we use all the
money on educating our children; I used mineral fertilizer once which was given
as relief through our farmer group, the produce that season was high. I was not
able to buy fertilizer for the subsequent seasons due to lack of capital”
In male FGD a farmer reported that;
“Mineral fertilizers improve yields but require consistency in use to maintain soil
fertility. When I don’t use fertilizer yields decrease and that’s the risk of lack of
consistency in use.”
Ease of application characteristic was least cited by both genders with regard to use of zai
technology and mineral fertilizer technology. This implies that the technologies are labour
demanding. These findings resonate with those of Wodon & Blackden (2006) and
Komatsu et al, (2018) who found that women are more likely to be attracted to less labour
intensive technologies other than zai technology due to their commitment in care work and
other household.
A female farmer reported that;
“In my household I am the one who tills my farm, I don’t have enough money to
hire labour, I am only able to work on a small piece of land; I am not able to dig
zai pits and all my children are grown and gone, I have nobody to help me with
farm work”.
In a mixed focus group discussion (men and women), farmers agreed that;
“Using zai technology was laborious and was mostly applicable with hired labour;
also use of fertilizer is not easy because you need the skill and you cannot use
animal power in applying fertilizer.”
53
5.2.3 Determinants of zai technology and mineral fertiliser choice and use intensity
For both genders, membership in a farmers’ group increased the likelihood of choosing
and using zai technology and mineral fertiliser intensely. Group membership and other
social fora provide linkage to access agricultural information through extension contacts
and other farmers' interactions where they exchange ideas and practically demonstrate
agricultural innovations. Also, farmers’ groups are target points for researchers' and other
development agents disseminating research findings. These results are consistent with the
finding of Gido et al. (2015) and Kassie et al. (2014), who reported that farmers’ groups
and other rural institutions create avenues through which information on agricultural
innovations is channelled to farmers thus .reducing the cost of information delivery through
increased economies of scale. Further, in a group platform, early adopters can share their
testimonies (success stories), encouraging other members to adopt the technologies
(Mango et al., 2017).
Among male-headed households, access to extension increased the likelihood of choosing
zai technology. Extension services bridge farmers’ knowledge gaps on improved farming
practices and application modalities. The study finding concurs with several other studies,
for example, Gebregziabher (2018), Donkor et al. (2019) and Ehiakpor et al. (2019). These
studies noted that extension contact increased smallholder farmers' probability of adopting
zai technology, among other soil conservation technologies. Additionally, the results are
consistent with the findings of Mponela et al. (2016), who found extension services to
positively determined the choice of soil conservation practices. Also, Ndiritu et al. (2014)
found that the probability of adopting chemical fertilizer increased with access to
agricultural extension. Conversely, Chirwa et al. (2008) reported that extension contacts
may sometimes not result in increased technology use. This may arise when extension
agents have preferential approaches targeting resource-poor households who lack
resources necessary for implementing new technologies.
54
Within male-headed and female-headed households, total land cultivated positively
influenced the choice and use intensity of zai technology and mineral fertiliser. This was
an indication that larger farm sizes increased the likelihood of choosing soil and water
management technologies. This could be attributed to flexibility of devoting a portion of
land for new technologies increasing with increase in land size. Our results corroborate
with those of Kassie et al. (2010), Mwangi & Kariuki (2015) and Gebre et al. (2019), who
reported that increasing land size under cultivation increases the likelihood of utilizing
agrarian technologies among smallholder households with an explanation that, the land is
an indicator of wealth, which relaxes capital constraints of implementing the practices.
Contrariwise, Thinda et al. (2020) contend that large farms are not always a prerequisite
for the choice of agrarian technologies. Farmers' with large farm size may prioritize labour-
saving technologies abandoning labour-intensive technologies such as zai pits. In addition,
farmers may fail to adopt zai technology as it hinders animal traction, a cheaper alternative
source of farm power when compared with other ploughing mechanization for resource
poor households (Kimaru-Muchai et al., 2020).
Ownership and access to farm implements (a proxy of household wealth in productive
assets) within female-headed households increased the likelihood of choosing zai
technology. This could be due to the availability of farm implements, which save on both
time and labour costs for female farmers trapped in drudgery rural agriculture. This agrees
with Johnson et al. (2016), who found that household assets could influence the use of
agricultural interventions among female farmers and increase returns to productive assets.
The study also noted that farmers with low-value farm assets are limited to low-impact
technologies that are appropriate with low-value agricultural implements. Similarly,
Peterman et al. (2014) reported that farm implements significantly determined the choice
of agricultural technologies for men and women farmers.
In female-headed households, training on soil and water conservation increased the
likelihood to use zai technology intensely. Similarly, trainings increased the likelihood of

55
using mineral fertiliser intensely. Training increases farmers’ knowledge on agricultural
innovations application modalities. Additionally, frequent knowledge-refreshing increase
the chances of continued adoption after the try-out stage. Well-versed farmers make
accurate estimates of expected returns, a cushion from frustrations of returns
overestimation resulting in stagnating and abandoning technologies. The results are
consistent with Li et al. (2020) who found information accumulation to have a positive and
significant impact on technology adoption. Another study by Okeyo et al. (2020) also found
that farmer training positively influenced improved sorghum varieties' adoption among
smallholders. Further, they reported that, trained farmers were better informed on varying
production patterns under changing agroclimatic conditions and often they prefer climate
smart agriculture. Moreover, a study by Gebre et al. (2019) reported that participation in
farmer training had more effect on increasing farmers' ability to effectively apply new
technologies.
Kimaru-muchai et al. (2020) pointed out that the probability of zai technology use is higher
among younger farmers. The study attributed the finding to the labour-demanding nature
of zai technology and younger farmers having a better understanding and up-to-date
information on zai technology application modalities. In agreement with our current
finding, Asfaw & Neka ( 2017) reported that age negatively influenced acceptance level
and use of conservation practices. The negative interaction between age and use of the
practices was ascribed to age decreasing farmer assertiveness, hence reducing farm care
involvement. Contrary, Wekesa et al. (2018) noted that, farming experience increases with
age and farmers upgrade from smaller agrarian practices packages to more rewarding
options.
The study established a negative relationship between years of education and zai
technology use-intensity, suggesting that more educated farmers were more inclined
towards non-farming activities. The findings were consistent with those of Alwang et al.
(2019) and Okeyo et al. (2020), who reported that educated farmers are more
56
knowledgeable in predicting and analysing agricultural-related risks and uncertainties
associated with biophysical and agro-ecological conditions. In addition, educated farmers
may opt-out from farming, taking up secondary non-farming opportunities that are better
rewarding, secure, and offer a wide range of alternatives. However, this finding is
inconsistent with Mango et al. (2017) and Wordofa et al. (2020), who found the education
level of the household head to influence the choice of soil and water conservation practices
positively. These studies attributed their findings to the influence of education in raising
farmer receptiveness on important conservation measures.
Male-headed households who perceived soil erosion to be severe were more likely to use
zai technology intensely. The implication is that, zai technology has the water-holding
capacity and when applied together with manure, soil water infiltration and porosity
improve and, subsequently, reduces water loss. Low soil fertility occurs as a result of soil
loss, among other factors; hence farmers who experience soil loss adopt zai technology
more (Kimaru-Muchai et al., 2020). A study by Biratu & Asmamaw (2016) points out that
farmers who perceived soil erosion on their farmland as a problem and had good motives
to implement soil water conservation activities.
Within male headed households, larger households had higher likelihoods of utilizing
mineral fertiliser intensely. A probable explanation is that, there is high potential for supply
of family labour and high demand for food among larger households. Mensah-Bonsu et al.
(2017) observed a positive association between fertilizer adoption by male headed
households and household size ascribing the findings to the need for increased crop yield
to cater for food demand. The results are also in line with those of Danso-Abbeam et al.
(2019) and Ndiritu et al. (2014) who found that large family size was positively correlated
with the adoption soil conservation measures. Similarly, Mugwe et al. (2009) found
household size to have positive influence on the decision to adopt integrated soil fertility
management techniques by smallholders farmers in Kenya.
57
Farm output sales (a proxy for farm income) significantly and negatively influenced
mineral fertilizer use-intensity among female headed households. This can be ascribed to
the low returns to capital intensive mineral fertiliser investment hence farmers are not able
to plough back proceeds from farming. In addition, if the returns realized are far below
expected returns, farmers might be discouraged on technological investment hence
abandoning it at tryout stage. Moreover, female farmers when compared to their male
counterparts sell only a small proportion of their produce and reserve larger proportions
for household consumption. These results collaborate with those of Kijima &
Sserunkuuma, (2011) who points out that farmers abandoned technologies of improved
rice varieties in Uganda due to unrealistic expectations about returns. Returns to
agricultural technology are subject to biophysical and agro-ecological conditions. For
example, soils may vary in their responsiveness to different mineral fertilizers and this may
affect intensity of use of a particular technology by farmers (Lambrecht & Vanlauwe,
2014). In another study by Olumeh et al. (2018) characterizing smallholder maize farmers’
marketing in Kenya found that female headed households reserve three-fifth of their
produce for home consumption, and are more concerned with household welfare hence
foregoing sale of farm produce.
In terms of total livestock densities, the study found a positive relationship with zai
technology use-intensity within female-headed households. Livestock ownership signifies
women's empowerment in agriculture, translating to household wellbeing (Kristjanson et
al., 2014). Proceeds from livestock can be ploughed back to cater for costs of labour-
demanding zai technology. Most commonly, zai pits are applied in combination with
animal manure; hence households with readily available animal manure are more likely to
allocate more land under zai technology. These findings agree with Ndiritu et al. (2014),
who found livestock ownership to influence soil conservation measures positively. Further,
their study pointed out that female plot managers faced with resource constraints (livestock,
credit, and labour) have reduced chances to use soil conservation measures compared with
male plot managers.

58
5.3 Conclusions
Three conclusions emerge from this study,
1. The results indicated that preference for zai technology and mineral fertiliser specific-
attributes differed for male and female farmers. Female farmers preferred soil and water
conservation strategies that improved soil fertility and those with sufficient extension
information whereas male farmers preferred strategies that increased yields and
improved soil fertility.
2. The results further indicated that, female headed households and male headed
households’ choice of mineral fertiliser and zai technology was influenced by
membership to a farmer group and total cultivated land. In addition, access to extension
services positively predicted zai technology choice in male headed households.
3. The key finding is that, female and male farmers have the potential to use soil and water
conservation strategies intensely. Specifically, within male-headed households, the
study revealed that, efforts to promote zai technology and mineral fertiliser
intensification should consider the total cultivated land, farmers' perceptions on soil
erosion, group membership, and access to extension services. For female-headed
households, total land cultivated, livestock densities, group membership, frequency of
training and ownership and access to farm implements were important determinants of
zai technology and mineral fertiliser use-intensity.
5.4 Recommendations
1. Researchers and extension agents should focus on needs identification to recognize
women and men farmers’ felt needs and preferences with regard to soil and water
conservation, therefore, designing and promoting technologies that can meet their
particular needs. This will encourage technology uptake among women and men
farmers.
59
2. Male and female farmers should be encouraged to join farmer groups and other social
networks. Farmer groups could provide avenues for women to participate in leadership
and link up with extension services and other development agents promoting soil and
water conservation. In addition, gender-sensitive farm-level policies oriented towards
land use should promote equitable, secure ownership and access to land by male and
female farmers.
3. There is need to develop gender-sensitive policies that advocate equitable and secure
ownership of productive assets (livestock, land and extension information). Such policy
frameworks could be embraced as a guideline to women’s empowerment in agriculture.
Moreover, the study recommends that extension systems need to be reformed and
tailored to serve male and female farmers' specific needs and preferences with regard
to utilization of agricultural innovations. This will enable both female and male
farmers, to choose and use zai technology and mineral fertiliser intensely as adaptation
strategies to climate shocks in sub-Saharan Africa's drylands.
5.5 Areas of further research
Intra-household dynamics expound more on the preferred technology attributes and
determinants of choice and intensification decisions among the different genders. As such,
further studies on gender integration on soil and water conservation should be considered
at plot level.
60
REFERENCES
Adesina, A. A., & Baidu-Forson, J. (1995). Farmers' perceptions and adoption of new
agricultural technology: evidence from analysis in Burkina Faso and Guinea, West
Africa. Agricultural economics, 13(1), 1-9.
Ainembabazi, J. H., Mugisha, J., Ainembabazi, J. H., & Mugisha, J. (2014). The Role of
Farming Experience on the Adoption of Agricultural Technologies: Evidence from
Smallholder Farmers in Uganda. The Journal of Development Studies, 50(5), 666–
679.
Alwang, J., Gotor, E., Thiele, G., Hareau, G., Jaleta, M., & Chamberlin, J. (2019).
Pathways from research on improved staple crop germplasm to poverty reduction
for smallholder farmers. Agricultural Systems, 172, 16–27.
Andersson, J. A., Misiko, M., Farnworth, C. R., Badstue, L., & Stirling, C. M. (2015).
Gender and conservation agriculture in East and Southern Africa: towards a
research agenda. 1–24.
Asfaw, D., & Neka, M. (2017). Factors affecting adoption of soil and water conservation
practices: The case of Wereillu Woreda (District), South Wollo Zone, Amhara
Region, Ethiopia. International Soil and Water Conservation Research, 5(4), 273–
279.
Asfaw, S., Shiferaw, B., Simtowe, F., & Hagos, M. (2011). Agricultural technology
adoption, seed access constraints and commercialization in Ethiopia. Journal of
Development and Agricultural Economics, 3(9), 436-477.
Awotide, B. A., Karimov, A. A., & Diagne, A. (2016). Agricultural technology adoption,
commercialization and smallholder rice farmers' welfare in rural Nigeria.
Agricultural and Food Economics, 4(1), 3.
Rejesus, R. M., Knight, T. O., Jaramillo, M., Coble, K. H., Patrick, G. F., & Baquet, A.
(2008). Preference for risk management information sources: implications for
extension and outreach programming. Agricultural and Resource Economics
Review, 37(1), 106-116.
Barbier, E. B., & Hochard, J. P. (2018). Poverty, rural population distribution and climate
change. Environment and Development Economics, 23(3), 234-256.
Belachew, A., Mekuria, W., & Nachimuthu, K. (2020). Factors influencing adoption of
soil and water conservation practices in the northwest Ethiopian highlands.
International Soil and Water Conservation Research, 8(1), 80–89.
61
Beshir, B., & Wegary, D. (2014). Determinants of smallholder farmers' hybrid maize
adoption in the drought prone Central Rift Valley of Ethiopia. African Journal of
Agricultural Research, 9, 1334-1343.
Beuchelt, T. D., & Badstue, L. (2013). Gender, nutrition-and climate-smart food
production: Opportunities and trade-offs. Food Security, 5(5), 709-721.
Biratu, A. A., & Asmamaw, D. K. (2016). Farmers' perception of soil erosion and
participation in soil and water conservation activities in the Gusha Temela
watershed, Arsi, Ethiopia. International Journal of River Basin Management,
14(3), 329–336.
Blasch, J., van der Kroon, B., van Beukering, P., Munster, R., Fabiani, S., Nino, P., &
Vanino, S. (2020). Farmer preferences for adopting precision farming technologies:
a case study from Italy. European Review of Agricultural Economics, (00), 1-49.
Bradford, J. B., Schlaepfer, D. R., Lauenroth, W. K., Palmquist, K. A., Chambers, J. C.,
Maestas, J. D., & Campbell, S. B. (2019). Climate-driven shifts in soil temperature
and moisture regimes suggest opportunities to enhance assessments of dryland
resilience and resistance. Frontiers in Ecology and Evolution, 7, 358.
Bradford, J. B., Schlaepfer, D. R., Lauenroth, W. K., Yackulic, C. B., Duniway, M., Hall,
S., Jia, G., Jamiyansharav, K., Munson, S.M., Wilson, S.D., & Tietjen, B. (2017).
Future soil moisture and temperature extremes imply expanding suitability for
rainfed agriculture in temperate drylands. Scientific reports, 7(1), 1-11.
Cascetta, E. (2009). Transportation systems analysis: models and applications (Vol. 29).
Springer Science & Business Media.
Certo, S. T., Busenbark, J. R., & Woo, H. (2016). Sample selection bias and Heckman
models in strategic management research. Strategic Management Journal, 2657,
2639–2657.
Chianu, J. N., & Tsujii, H. (2004). Determinants of farmers' decision to adopt or not adopt
inorganic fertilizer in the savannas of northern Nigeria. Nutrient cycling in
agroecosystems, 70(3), 293-301.
Chirwa, E. W., Kumwenda, I., Jumbe, C., Chilonda, P., & Minde, I. (2008). Agricultural
growth and poverty reduction in Malawi: Past performance and recent
trends. ReSAKSS-SA Working Paper, 8.
Cochran, W. G. (2007). Sampling techniques. John Wiley & Sons.

62
Colfer, C. J. P., Achdiawan, R., Roshetko, J. M., Mulyoutami, E., Yuliani, E. L., Mulyana,
A., Moeliono, M., Adnan, H., & Erni. (2015) The balance of power in household
decision-making: encouraging news on gender in southern Sulawesi. World
Development, 76, 147–164.
Cragg, J. G. (1971). Some statistical models for limited dependent variables with
application to the demand for durable goods. Econometrica: Journal of the
Econometric Society, 829-844.
D’Antoni, J. M., Mishra, A. K., & Joo, H. (2012). Farmers’ perception of precision
technology: The case of autosteer adoption by cotton farmers. Computers and
Electronics in Agriculture, 87, 121–128.
Danjuma, M. N., & Mohammed, S. (2015). Zai pits system: a catalyst for restoration in the
dry lands. Journal of Agriculture and Veterinary Science, 8(2), 1–4.
Danso-Abbeam, G., Dagunga, G., & Ehiakpor, D. S. (2019a). Adoption of Zai technology
for soil fertility management: evidence from Upper East region, Ghana. Journal of
Economic Structures, 8(1), 1–14.
Diouf, N. S., Ouedraogo, I., Zougmoré, R. B., Ouedraogo, M., Partey, S. T., & Gumucio,
T. (2019). Factors influencing gendered access to climate information services for
farming in Senegal. Gender, Technology and Development, 23(2), 93-110.
Djoudi, H., & Brockhaus, M. (2011). Is adaptation to climate change gender neutral?
Lessons from communities dependent on livestock and forests in northern Mali.
International Forestry Review, 13(2), 123-135.
Donkor, E., Onakuse, S., Bogue, J., & Rios-carmenado, I. D. L. (2019). Land Use Policy
Fertiliser adoption and sustainable rural livelihood improvement in Nigeria. Land
Use Policy, 88, 104193.
Doss, C. (2014). Data needs for gender analysis in agriculture. In Gender in
agriculture (pp. 55-68). Springer, Dordrecht.
Doss, C., Meinzen-Dick, R., Quisumbing, A., & Theis, S. (2018). Women in agriculture:
Four myths. Global food security, 16, 69-74.
Ehiakpor, D. S., Danso-Abbeam, G., Dagunga, G., & Ayambila, S. N. (2019). Impact of
Zai technology on farmers' welfare: Evidence from northern Ghana. Technology in
Society, 59, 101189.
63
Farooq, M., & Siddique, K. H. (Eds.). (2017). Innovations in dryland agriculture. Springer.
Fatondji, D., Martius, C., Bielders, C. L., Vlek, P. L. G., Bationo, A., & Gerard, B. (2006).
Effect of planting technique and amendment type on pearl millet yield, nutrient
uptake, and water use on degraded land in Niger. Nutrient Cycling in
Agroecosystems, 76, 203-217.
Feder, G., & Umali, D. L. (1993). The adoption of agricultural innovations: a review.
Technological Forecasting and Social Change, 43(3–4), 215–239.
Feder, G., Just, R. E., & Zilberman, D. (1985). Adoption of agricultural innovations in
developing countries: A survey. Economic Development and Cultural Change,
33(2), 255–298.
Gebre, G. G., Isoda, H., Rahut, D. B., Amekawa, Y., & Nomura, H. (2019). Gender
differences in the adoption of agricultural technology: the case of improved maize
varieties in southern Ethiopia. Women's Studies International Forum, 76. Elsevier.
Gebregziabher, K. (2018). The impact of agricultural extension on households' welfare in
Ethiopia. International Journal of Social Economics, 5-2014-0088.
Genius, M., Koundouri, P., Nauges, C., & Tzouvelekas, V. (2014). Information
transmission in irrigation technology adoption and diffusion: Social learning,
extension services, and spatial effects. American Journal of Agricultural
Economics, 96(1), 328-344.
Gido, E. O., Sibiko, K. W., Ayuya, O. I., & Mwangi, J. K. (2015). Demand for agricultural
extension services among small-scale maize farmers: Micro-level evidence from
Kenya. The Journal of Agricultural Education and Extension, 21(2), 177–192.
Heckman, J. J. (1979). Sample selection bias as a specification error. Econometrica:
Journal of the Econometric Society, 153–161.
Huyer, S. (2016). Closing the gender gap in agriculture. SAGE Publications Sage India:
New Delhi, India.
IPCC, (2014). Climate Change 2014: Synthesis Report. Core Writing Team, R.K.,
Pachauri, L.A., Meyer (Eds.), In Proceedings of Contribution of Working Groups
I, II and III to the Fifth Assessment Report of the Intergovernmental Panel on
Climate Change. IPCC, Geneva, Switzerland, p. 151.
Issahaku, G., & Abdul-Rahaman, A. (2019). Sustainable land management practices, off-
farm work participation and vulnerability among farmers in Ghana: Is there a
nexus? International soil and water conservation research, 7(1), 18-26.
64
Jaetzold, R., Schmidt, H., Hornetz, B., & Shisanya, C. (2007). Farm management
handbook of Kenya: part C, East Kenya. Ministry of Agriculture, Nairobi.
Jaetzold, R., Schmidt, H., Hornetz, B., & Shisanya, C. (2007). Farm management
handbook of Kenya: part C, East Kenya. Ministry of Agriculture, Nairobi.
Jaleta, M., Yirga, C., Kassie, M., De Groote, H., & Shiferaw, B. (2013). Knowledge,
adoption and use intensity of improved maize technologies in Ethiopia (No. 309-
2016-5268).
Johnson, N. L., Kovarik, C., Meinzen-Dick, R., Njuki, J., & Quisumbing, A. (2016).
Gender, Assets, and Agricultural Development: Lessons from Eight Projects.
World Development, 83, 295–311.
Kantor, P., Morgan, M., & Choudhury, A. (2015). Amplifying outcomes by addressing
inequality: the role of gender-transformative approaches in agricultural research for
development. Gender, Technology and Development, 19(3), 292–319.
Kassie, M., Jaleta, M., Shiferaw, B., Mmbando, F., & Mekuria, M. (2013). Adoption of
interrelated sustainable agricultural practices in smallholder systems: Evidence
from rural Tanzania. Technological forecasting and social change, 80(3), 525-540.
Kassie, M., Ndiritu, S. W., & Stage, J. (2014). What determines gender inequality in
household food security in Kenya? Application of exogenous switching treatment
regression. World Development, 56, 153–171.
Kassie, M., Zikhali, P., & Pender, J. (2010). The Economics of Sustainable Land
Management Practices in the Ethiopian Highlands. Journal of agricultural
economics, 61(3), 605–627.
Kawarazuka, N., Prain, N., Forsythe, L., Mayanja, S., Mudege, N., Babini, C., & Polar, V.
(2018). Gender in Agricultural Mechanization: Key Guiding Questions.
Kelly, V. A. (2006). Factors affecting demand for fertilizer in Sub-Saharan Africa (No.
37060, pp. 1-89). The World Bank.
Kenya National Bureau of Statistics. (2019). The 2019 Kenya Population and Housing
Census: Population by County and Sub-county. Kenya National Bureau of
Statistics.
Kiboi, M. N., Ngetich, K. F., Diels, J., Mucheru-Muna, M., Mugwe, J., & Mugendi, D. N.
(2017). Minimum tillage, tied ridging and mulching for better maize yield and yield
stability in the Central Highlands of Kenya. Soil & Tillage Research, 170, 157–
166.
65
Kijima, Y., Otsuka, K., & Sserunkuuma, D. (2011). An inquiry into constraints on a green
revolution in Sub-Saharan Africa: the case of NERICA rice in Uganda. World
Development, 39(1), 77-86.
Kimaru-Muchai, S. W., Ngetich, F. K., Baaru, M., & Mucheru-Muna, M. W. (2020).
Adoption and utilisation of Zai pits for improved farm productivity in drier upper
Eastern Kenya. Journal of Agriculture and Rural Development in the Tropics and
Subtropics (JARTS), 121(1), 13–22.
Knowler, D., & Bradshaw, B. (2007). Farmers' Adoption of Conservation Agriculture: A
Review and Synthesis of Farmers' adoption of conservation agriculture: A review
and synthesis of recent research. Food policy, 32(1), 25-48.
Komatsu, H., Malapit, H. J. L., & Theis, S. (2018). Does women’s time in domestic work
and agriculture affect women’s and children’s dietary diversity? Evidence from
Bangladesh, Nepal, Cambodia, Ghana, and Mozambique. Food Policy, 79, 256-
270.
Kristjanson, P., Waters-Bayer, A., Johnson, N., Tipilda, A., Njuki, J., Baltenweck, I.,
Grace, D., & MacMillan, S. (2014). Livestock and women's livelihoods. In Gender
in agriculture (pp. 209-233). Springer, Dordrecht.
Kuehne, G., Llewellyn, R., Pannell, D. J., Wilkinson, R., Dolling, P., Ouzman, J., & Ewing,
M. (2017). Predicting farmer uptake of new agricultural practices: A tool for
research, extension and policy. Agricultural Systems, 156, 115–125.
Lambrecht, I., & Vanlauwe, B. (2014). Understanding the Process of Agricultural
Technology Adoption: Mineral Fertilizer in Eastern DR Congo. World
development, 59, 132–146.
Lambrecht, I., Vanlauwe, B., & Maertens, M. (2016). Agricultural extension in Eastern
Democratic Republic of Congo: Does gender matter? European Review of
Agricultural Economics, 43, 841-874.
Li, H., Huang, D., Ma, Q., Qi, W., & Li, H. (2020). Factors Influencing the Technology
Adoption Behaviours of Litchi Farmers in China. Sustainability, 12(1), 271.
Macharia, J., Mugwe, J., Mucheru-Muna, M., & Mugendi, D. (2014). Socioeconomic
factors influencing levels of knowledge in soil fertility management in the central
highlands of Kenya. Journal of Agricultural Science and Technology, 4(9), 701-
711.
Malesu, M. M. (2006). Rainwater harvesting innovations in response to water scarcity:
The Lare experience. World Agroforestry Centre.

66
Manfre, C., Rubin, D., Allen, A., Summerfield, G., Colverson, K., & Akeredolu, M. (2013).
Reducing the gender gap in agricultural extension and advisory services: How to
find the best fit for men and women farmers. Meas Brief, 2.
Mango, N., Makate, C., Tamene, L., Mponela, P., & Ndengu, G. (2017). Awareness and
adoption of land, soil and water conservation practices in the Chinyanja Triangle,
Southern Africa. International Soil and Water Conservation Research, 5(2), 122–
129.
Marenya, P., Kassie, M., & Tostao, E. (2015). Fertilizer use on individually and jointly
managed crop plots in Mozambique. Journal of Gender, Agriculture and Food
Security (Agri-Gender), 1, 62-83.
Meinzen-Dick, R., Quisumbing, A., Doss, C., & Theis, S. (2019). Women's land rights as
a pathway to poverty reduction: Framework and review of available evidence.
Agricultural Systems, 172, 72–82.
Melesse, B. (2018). A review on factors affecting adoption of agricultural new technologies
in Ethiopia. Journal of Agricultural Science and Food Research, 9(3), 1–4.
Mensah-Bonsu, A., Sarpong, D. B., Al-Hassan, R., Egyir, I. S., Asuming-Brempong, S.,
Egyir, I. S., Osei-Asare, Y. B. (2017). Intensity of and factors affecting land and
water management practices among smallholder maize farmers in Ghana. African
Journal of Agricultural and Resource Economics, 12(2), 142–157.
Mganga, K. Z., Musimba, N. K. R., & Nyariki, D. M. (2015). Combining sustainable land
management technologies to combat land degradation and improve rural
livelihoods in semiarid lands in Kenya. Environmental management, 56(6), 1538-
1548.
Misiko, M., Tittonell, P., Giller, K. E., & Richards, P. (2011). Strengthening understanding
and perceptions of mineral fertilizer use among smallholder farmers: evidence from
collective trials in western Kenya. Agriculture and Human Values, 28(1), 27-38.
Mponela, P., Tamene, L., Ndengu, G., Magreta, R., Kihara, J., & Mango, N. (2016). Land
Use Policy Determinants of integrated soil fertility management technologies
adoption by smallholder farmers in the Chinyanja Triangle of Southern Africa.
Land Use Policy, 59, 38–48.
Mucheru-Muna, M., Pypers, P., Mugendi, D., Kung’u, J., Mugwe, J., Merckx, R., &
Vanlauwe, B. (2010). A staggered maize–legume intercrop arrangement robustly
increases crop yields and economic returns in the highlands of Central Kenya. Field
Crops Research, 115(2), 132-139.
67
Mugwe, B. J., Mugendi, D., Mucheru-Muna, M., Merckx, R., Chianu, J., & Vanlauwe, B.
(2009). Determinants of the decision to adopt integrated soil fertility management
practices by smallholder farmers in the central highlands of Kenya. Experimental
Agriculture, 45(1), 61-75.
Mugwe, J., Ngetich, F., & Otieno, E. O. (2019). Integrated Soil Fertility Management in
Sub-Saharan Africa: Evolving Paradigms Toward Integration. Zero Hunger.
Encyclopedia of the UN Sustainable Development Goals. Springer, Cham.
Mukoni, M. (2018). Gender, Power and Women's Participation in Community
Environmental Education. Southern African Journal of Environmental Education,
34(0).
Murage, A. W., Amudavi, D. M., Obare, G. A., Chianu, J., & Khan, Z. R. (2010).
Determining smallholder farmers’ preferences for Push-Pull technology
dissemination pathways in western Kenya (No. 308-2016-5101, pp. i-18).
Murage, A. W., Midega, C. A. O., Pittchar, J. O., Pickett, J. A., & Khan, Z. R. (2015).
Determinants of adoption of climate-smart push-pull technology for enhanced food
security through integrated pest management in eastern Africa. Food Security, 7,
709-724.
Murage, A. W., Pittchar, J. O., Midega, C. A. O., Onyango, C. O., & Khan, Z. R. (2015).
Gender specific perceptions and adoption of the climate-smart push–pull
technology in eastern Africa. Crop Protection, 76, 83-91.
Muriithi, B. W., Menale, K., Diiro, G., & Muricho, G. (2018). Does gender matter in the
adoption of push-pull pest management and other sustainable agricultural
practices? Evidence from Western Kenya. Food Security, 10(2), 253–272.
Muriu-Ng'ang'a, F. W., Mucheru-Muna, M., Waswa, F., & Mairura, F. S. (2017).
Socioeconomic factors influencing utilisation of rain water harvesting and saving
technologies in Tharaka South, Eastern Kenya. Agricultural Water Management,
194, 150-159.
Musafiri, C. M., Macharia, J. M., Ng'etich, O. K., Kiboi, M. N., Okeyo, J., Shisanya, C.
A., Okwuosa, E.A., Mugendi, D.N. & Ngetich, F. K. (2020). Farming systems'
typologies analysis to inform agricultural greenhouse gas emissions potential from
smallholder rain-fed farms in Kenya. Scientific African, 8, e00458.
Mwangi, M., & Kariuki, S. (2015). Factors determining adoption of new agricultural
technology by smallholder farmers in developing countries. Journal of Economics
and Sustainable Development, 6(5).
68
Mwangi, P. (2020). A climate-smart agriculture approach using double digging, Zai pits
and Aquacrop model in rain-fed sorghum cultivation at Wiyumiririe location of
Laikipia County, Kenya. Africa Journal of Physical Sciences 2313-3317, 4.
Mwaura, G. G., Kiboi, M. N., Bett, E. K., Mugwe, J. N., Muriuki, A., Nicolay, G., &
Ngetich, F. K. (2021). Adoption intensity of selected organic-based soil fertility
management technologies in the Central Highlands of Kenya. Frontiers in
Sustainable Food Systems, 4: 570190.
Nchinda, V. P., Ambe, T. E., Holvoet, N., Leke, W., Che, M. A., Nkwate, S. P., &
Ngassam, S.B., Njualem, D. K. (2010). Factors influencing the adoption intensity
of improved yam (Dioscorea spp.) seed technology in the western highlands and
high guinea savannah zones of Cameroon. Journal of Applied Biosciences, 36,
2389–2402.
Ndiritu, S Wagura, Kassie, M., & Shiferaw, B. (2014). Are there systematic gender
differences in the adoption of sustainable agricultural intensification practices?
Evidence from Kenya. Food Policy, 49, 117–127.
Ndiritu, Simon W, Kassie, M., & Shiferaw, B. (2011). Adoption of agricultural
technologies in Kenya: How does gender matter?
Ngetich, K. F., Diels, J., Shisanya, C. A., Mugwe, J. N., Mucheru-Muna, M., & Mugendi,
D. N. (2014). Effects of selected soil and water conservation techniques on runoff,
sediment yield, and maize productivity under sub-humid and semiarid conditions
in Kenya. Catena, 121, 288-296.
Nichols, M. H., Shaw, J. R., & Brandau, W. K. (2021). Unintended consequences of
rangeland conservation structures. International Soil and Water Conservation
Research, 9(1), 158-165
Njuki, J., Kaaria, S., Chamunorwa, A., & Chiuri, W. (2011). Linking smallholder farmers
to markets, gender and intra-household dynamics: does the choice of commodity
matter? The European Journal of Development Research, 23(3), 426-443.
Nkonya, E., Schroeder, T., & Norman, D. (1997). Factors affecting adoption of improved
maize seed and fertiliser in Northern Tanzania. Journal of Agricultural Economics,
48(1), 1–12.
Nyamekye, C., Thiel, M., Schönbrodt-Stitt, S., Zoungrana, B. J. B., & Amekudzi, L. K.
(2018). Soil and water conservation in Burkina Faso, West Africa. Sustainability,
10(9), 1–24.
69
Obiero, K. O., Waidbacher, H., Nyawanda, B. O., Munguti, J. M., Manyala, J. O., &
Kaunda-Arara, B. (2019). Predicting uptake of aquaculture technologies among
smallholder fish farmers in Kenya. Aquaculture International, 27, 1689-1707.
Obisesan, A. A., Amos, T. T., & Akinlade, R. J. (2016). Causal Effect of Credit and
Technology Adoption on Farm Output and Income: The Case of Cassava Farmers
in Southwest Nigeria. 5th International Conference of the African Association of
Agricultural Economists, (No. 310-2016-5370).
Ogada, M. J., Mwabu, G., & Muchai, D. (2014). Farm technology adoption in Kenya: a
simultaneous estimation of inorganic fertilizer and improved maize variety
adoption decisions. Agricultural and food economics, 2(1), 1-18.
Okeyo, S. O., Ndirangu, S. N., Hisaboke, H. N., Njiru, L. K., & Omenda, J. A. (2020).
Analysis of the determinants of farmer participation in sorghum farming among
small-scale farmers in Siaya County, Kenya. Scientific African, 10, e00559.
Onyalo, P. O. (2019). Women and agriculture in rural Kenya: role in agricultural
production. International Journal of Humanities and Social Science, 4(4), 1-10.
Palacios-Lopez, A., Christiansen, L., & Kilic, T. (2017). How much of the labor in African
agriculture is provided by women? Food Policy, 67, 52–63.
Partey, S. T., Zougmoré, R. B., Ouedraogo, M., & Campbell, B. M. (2018). Developing
climate-smart agriculture to face climate variability in West Africa: challenges and
lessons learnt. Journal of Cleaner Production, 187, 285–295.
Peter, K., & Itabari, J. K. (2014). In-situ soil moisture conservation: Utilisation and
management of rainwater for crop production. Adapting African Agriculture to
Climate Change,127-142.
Peterman, A., Behrman, J. A., & Quisumbing, A. R. (2014). A review of empirical
evidence on gender differences in nonland agricultural inputs, technology, and
services in developing countries. In Gender in agriculture, 145–186.
Pircher, T., Almekinders, C. J., & Kamanga, B. C. (2013). Participatory trials and farmers'
social realities: understanding the adoption of legume technologies in a Malawian
farmer community. International Journal of Agricultural Sustainability, 11(3),
252-263.
Quisumbing, A. R., Meinzen-Dick, R., Raney, T. L., Croppenstedt, A., Behrman, J. A., &
Peterman, A. (2014). Gender in agriculture: Closing the knowledge gap on gender
in agriculture. Gender in agriculture, 3-27.
70
Rabbi, F., Ahamad, R., Ali, S., Chandio, A. A., Ahmad, W., Ilyas, A., & Din, I. U. (2019).
Determinants of commercialization and its impact on the welfare of smallholder
rice farmers by using Heckman's two-stage approach. Journal of the Saudi Society
of Agricultural Sciences, 18(2), 224–233.
Recha, C. W., Makokha, G. L., Traore, P. S., Shisanya, C., Lodoun, T., & Sako, A. (2012).
Determination of seasonal rainfall variability, onset and cessation in semiarid
Tharaka district, Kenya. Theoretical and Applied Climatology, 108(3–4), 479–494.
Rogers, E. M., Singhal, A., & Quinlan, M. M. (2014). Diffusion of innovations (pp. 432-
448). Routledge.
Rojas, R. V., Achouri, M., Maroulis, J., & Caon, L. (2016). Healthy soils: a prerequisite
for sustainable food security. Environmental Earth Sciences, 75(3), 180.
Rola-Rubzen, M. F., Paris, T., Hawkins, J., & Sapkota, B. (2020). Improving Gender
Participation in Agricultural Technology Adoption in Asia: From Rhetoric to
Practical Action. Applied Economic Perspectives and Policy, 42(1), 113–125.
Roose, E., Kabore, V., & Guenat, C. (1999). Zai practice: A west african traditional
rehabilitation system for semiarid degraded lands, a case study in Burkina Faso.
Arid Soil Research and Rehabilitation, 13(4), 343–355.
Sawadogo, H., Hien, F., Sohoro, A., & Kambou, F. (2001). Pits for trees: How farmers in
semiarid Burkina Faso increase and diversify plant biomass. Farmer Innovation in
Africa: A Source of Inspiration for Agricultural Development.’
Sell, M., & Minot, N. (2018). What factors explain women's empowerment? Decision-
making among small-scale farmers in Uganda. Women's Studies International
Forum, 71, 46-55.
Shahid, S. A., & Al-Shankiti, A. (2013). Sustainable food production in marginal lands—
Case of GDLA member countries. International soil and water conservation
research, 1(1), 24-38.
Serraj, R., Siddique, K.H.M., 2012. Conservation agriculture in dry areas. Field Crops Res.
132, 1–6
Sinyolo, S. (2020). Technology adoption and household food security among rural
households in South Africa: The role of improved maize varieties. Technology in
Society, 60, 101214.
Slingerland, M. A., & Stork, V. E. (2000). Determinants of the practice of zai and mulching
in north Burkina Faso. Journal of Sustainable Agriculture, 16(2), 53–76.
71
Smil, V. (2011). Nitrogen cycle and world food production. World Agriculture, 2(1), 9-13.
Smucker, T. A., & Wisner, B. (2008). Changing household responses to drought in
Tharaka, Kenya: vulnerability, persistence and challenge. Disasters, 32(2), 190–
215.
Sultana, A. (2012). Patriarchy and Women's Subordination: A Theoretical Analysis. Arts
Faculty Journal, 1–18.
Teklewold, H., Kassie, M., & Shiferaw, B. (2013). Adoption of multiple sustainable
agricultural practices in rural Ethiopia. Journal of agricultural economics, 64(3),
597-623.
Teshome, A., de Graaff, J., & Kassie, M. (2016). Household-level determinants of soil and
water conservation adoption phases: Evidence from North-Western Ethiopian
highlands. Environmental Management, 57(3), 620–636.
Thinda, K. T., Ogundeji, A. A., Belle, J. A., & Ojo, T. O. (2020). Understanding the
adoption of climate change adaptation strategies among smallholder farmers:
Evidence from land reform beneficiaries in South Africa. Land Use Policy, 99,
104858.
Timans, R., Wouters, P., & Heilbron, J. (2019). Mixed methods research: what it is and
what it could be. Theory and Society, 48(2), 193-216.
Tobin, J. (1958). Estimation of relationships for limited dependent variables. Econometrica
26, 24–36.
Olumeh, D. E., Adam, R., Otieno, D. J., & Oluoch-Kosura, W. An Insight into the Intra-
Household Gender, Wealth-Status, Educational and Credit Access Dimensions.
Usman, Z., Olagunju, K. O., & Ogunpaimo, O. R. (2021). Determinants of adoption of
multiple sustainable agricultural practices among smallholder farmers in
Nigeria. International Soil and Water Conservation Research, 9(2), 241-248.
Vanlauwe, B., & Giller, K. E. (2006). Popular myths around soil fertility management in
sub-Saharan Africa. Agriculture, ecosystems & environment, 116(1-2), 34-46.
Vanlauwe, B., Wendt, J., Giller, K. E., Corbeels, M., Gerard, B., & Nolte, C. (2014). A
fourth principle is required to define conservation agriculture in sub-Saharan
Africa: the appropriate use of fertilizer to enhance crop productivity. Field Crops
Research, 155, 10-13.
72
Wale, E., & Yalew, A. (2007). Farmers' variety attribute preferences: implications for
breeding priority setting and agricultural extension policy in Ethiopia. African
Development Review, 19(2), 379-396.
Wekesa, B. M., Ayuya, O. I., & Lagat, J. K. (2018). Effect of climate ‑ smart agricultural
practices on household food security in smallholder production systems: micro ‑
level evidence from Kenya. Agriculture & Food Security, 1–14.
White, R. P., Tunstall, D. B., & Henninger, N. (2002). An ecosystem approach to drylands:
building support for new development policies (pp. 1-14). Washington, DC: World
Resources Institute.
Wodon, Q., & Blackden, C. M. (Eds.). (2006). Gender, time use, and poverty in sub-
Saharan Africa. The World Bank.
Wooldridge, J. M. (2010). Econometric analysis of cross section and panel data. MIT
press.
Wordofa, M. G., Okoyo, E. N., & Erkalo, E. (2020). Factors influencing adoption of
improved structural soil and water conservation measures in Eastern Ethiopia.
Environmental Systems Research, 9(1), 1-11.
Yigezu, Y. A., Mugera, A., El-Shater, T., Aw-Hassan, A., Piggin, C., Haddad, A., Loss, S.
(2018). Enhancing adoption of agricultural technologies requiring high initial
investment among smallholders. Technological Forecasting and Social Change,
134, 199–206.
Zeng, D., Alwang, J., Norton, G., Jaleta, M., Shiferaw, B., & Yirga, C. (2018). Land
ownership and technology adoption revisited: Improved maize varieties in
Ethiopia. Land Use Policy, 72, 270-279.

73
APPENDICES
Appendix 1 Questionnaire
Questionnaire No……………
You are among several farmers in this area who have been selected for this study. The
study seeks to evaluate the influence of gender on use of selected soil fertility and soil
water conservation strategies. The information provided will be treated with utmost
confidentiality. Your assistance in answering the questions truthfully and accurately will
be highly appreciated.
Date ………………….Enumerator’s name………………………………….
Geographical location
Ward ………………………….
Farmer characteristics
1. Gender of the household head 1=Male 0 =Female
2. Gender of household decision maker (Who makes key agricultural decisions at
household level i.e. relate to household headship) 1=Male 0 =Female
Follow-up on gender of the household decision maker
Major decision making activity at
household level
Decision maker (indicate the
decision maker i.e. 1 or 0
Remarks
What crops to grow
What size of land to cultivate
Which SWC technologies to use
Allocation of agricultural credit
Control of farm income
Farm produce sales
Labour allocation
3. Age of the household head …………………. years
4. Years of education of household head ……...years
What is your education level? 1=Primary, 2= Secondary, 3=Tertiary 4=Non formal
education
5. Farming experience of the household head (years the farmer has been making key
farming decisions independently) …….

74
6. Household size
Number of males ………
Number of females………
7. Does the household head participate in off-farm employment? 1= Yes 2=No
If yes, what is the average monthly income from off-farm employment………. Ksh
8. Are you a member of farmer based group/ organisation? 1= Yes 2=No
If yes, how many groups/ organisations ………….
If yes, what benefits does he/she derive from group membership?
1=Information on credit 2=General advice on farming 3=Information on climate change
4=Help in credit access 5=Others (specify)……
Farm characteristics
9. Do you own land that you are currently farming on with a formal title deed? 1=Yes 2=No
What is the size of land owned?...............acres
10. What is the total size of land under cultivation? …………...acres
11. Have you sold farm produce in the last one cropping season? 1=Yes 2=No
12. Do you have access to timely labour? (during planting, harvesting periods or when
applying SWC measures) 1=Yes 2=No
13. Do you have access to animal drawn farm equipment? (“access” includes both
ownership and renting) 1=Yes 2=No
14. Do you keep livestock? 1=Yes 2=No
If yes, which livestock and how many of each do you keep in your farm? Please tick on
livestock owned and indicate the number
Type of livestock Number
1=Cattle
2=Sheep
3=Goats
4=Donkeys
5=Chicken
6=Pigs
7=Any other specify
………………………….
75
15. Have you received any agricultural extension services within the last one year? 1=Yes
2=No
16. Have you received training on soil fertility and soil water management within the last
one year? 1=Yes 2=No
If yes, how many times were you trained in the last one cropping season…………….
17. Do you have access to agricultural credit? 1=Yes 0=No
If yes, indicate the amount received last year……………. Ksh
Is the credit used in improving soil fertility and soil water management? 1=Yes 0=No
18. What is the distance in walking minutes to the nearest input/output market?...........
19. Have you received any form of relief either in form of inputs, farming implements or
cash? 1=Yes 0=No
If yes, was the relief beneficial in addressing soil infertility and soil water stress? 1=Yes
0=No
Soil and water conservation
20. What is the terrain of the cultivated land? 1=Sloppy 0=Otherwise
21. How do you perceive soil fertility status of the cultivated farm? 1=Very fertile, 2=
moderate 3=Poor
22. Have you experienced soil erosion in your farm? 1= Yes 0=No
If yes, how do you perceive the severity of the soil erosion in your farm currently? 1=Very
severe 2= Moderate 3= Not severe
Zai technology
23. Are you aware of zai technology/pits as a soil and water conservation technique? (try
to interrogate the respondent with more questions on measurements, spacing and
application modalities to clearly know if they are aware) 1= Yes 0=No
24. Are you using or have used zai technology in the last one cropping season? (Where
applicable, make observations)1= Yes 0=No
If yes, what is the size of land is under zai technology? (confirm the size of land by
measuring) ........acres
If yes, when incorporating zai do you add manure? 1= Yes 0=No
If yes, when incorporating zai do you add mineral fertilizer? 1= Yes 0=No
76
Mineral fertiliser
25. Are you aware of mineral fertiliser as a soil fertility enhancing technique? (try to
interrogate the respondent with more questions on application rates and other modalities,
types of fertiliser to clearly know if they are aware) 1= Yes 0=No
26. Are you using or have used mineral fertiliser in the last one cropping season? (Where
applicable, make observations)1= Yes 0=No
If yes, what is the size of land is under mineral fertiliser? (confirm the size of land by
measuring) ........acres
If yes, when incorporating zai do you combine with animal manure? 1= Yes 0=No
If yes, how many kilograms of fertilizer did you apply in the area of land given
above?......Kgs (Interrogate more on amount of fertiliser applied vs the area of land)
Crop residue retention/ Mulching
27. Are you aware of crop residue retention/ mulching as a soil and water conservation
technique? (try to interrogate the respondent with more questions on residue retention,
application modalities to clearly know if they are aware also types of mulch) 1= Yes 0=No
28. Have you applied mulch/crops residue in the last one cropping season? (Where
applicable, make observations)1= Yes 0=No
If yes, what is the size of land under mulch/crops residue? (confirm the size of land by
measuring) ........acres
If yes, when incorporating zai do you add mineral fertilizer? 1= Yes 0=No
Animal manure
29. Are you aware of animal manure use as a soil and water conservation technique? (try
to interrogate the respondent with more questions on manure application modalities to
clearly know if they are aware) 1= Yes 0=No
30. Have you applied animal manure in the last one cropping season? (Where applicable,
make observations)1= Yes 0=No
If yes, what is the size of land under animal manure? (confirm the size of land by
measuring) ........acres
Legume-integration
31. Are you aware of legume-integration as a soil and water conservation technique? (try
to interrogate the respondent with more questions types of legumes used and spacing) 1=
Yes 0=No

77
32. Have intercropped with legumes in the last one cropping season? (Where applicable,
make observations)1= Yes 0=No
If yes, what is the size of land under legume-intercropping? (confirm the size of land by
measuring) ........acres
If yes, what are the major types of legumes used for intercropping?
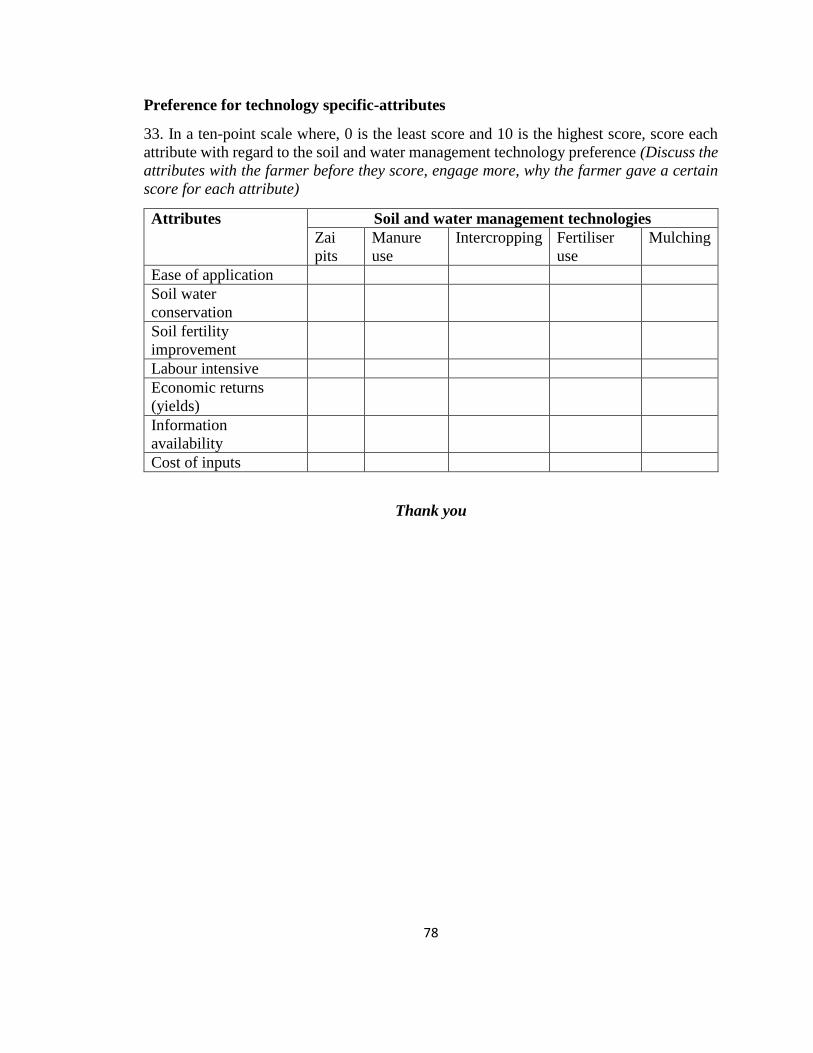
78
Preference for technology specific-attributes
33. In a ten-point scale where, 0 is the least score and 10 is the highest score, score each
attribute with regard to the soil and water management technology preference (Discuss the
attributes with the farmer before they score, engage more, why the farmer gave a certain
score for each attribute)
Attributes Soil and water management technologies
Zai
pits
Manure
use
Intercropping Fertiliser
use
Mulching
Ease of application
Soil water
conservation
Soil fertility
improvement
Labour intensive
Economic returns
(yields)
Information
availability
Cost of inputs
Thank you

79
Appendix 2 Checklist for focus group discussion
Theme one: Awareness and use of soil and water conservation techniques applied by
farmers in the area. (Guide the discussion to capture the technologies farmers are using
currently and if they are aware of them as soil and water conservation strategies).
Theme two: Major challenges when implementing soil and water management
technologies.
Theme Three: Who majorly works in the farm, especially when applying the soil and
water management technologies (Discuss in line with gender, men women and youth).
Theme four: which are the most preferred soil and water management technologies
attributes and why? Discuss the technologies (zai, manure, mulching, intercropping and
fertiliser use) and any other technology frequently mentioned. Reference the attributes
below;
1) How easy the technology is to apply?
2) Ability of the technology to conserve soil and water
3) Ability of the technology to improve soil fertility
4) Nature of the technology with regard to labor needs
5) Ability of the technology to improve yields (economic returns)
6) Information availability and training on the technology
7) Cost implications when implementing the technology (inputs and not labor related
inputs)
Thank you
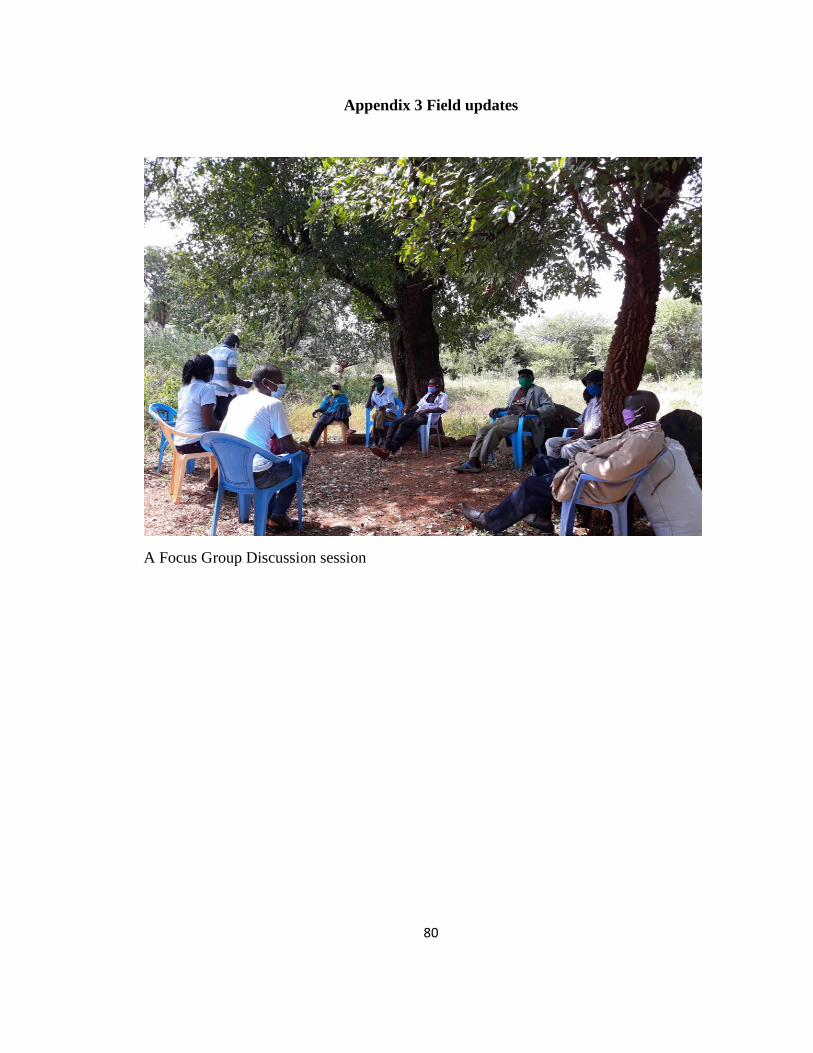
80
Appendix 3 Field updates
A Focus Group Discussion session
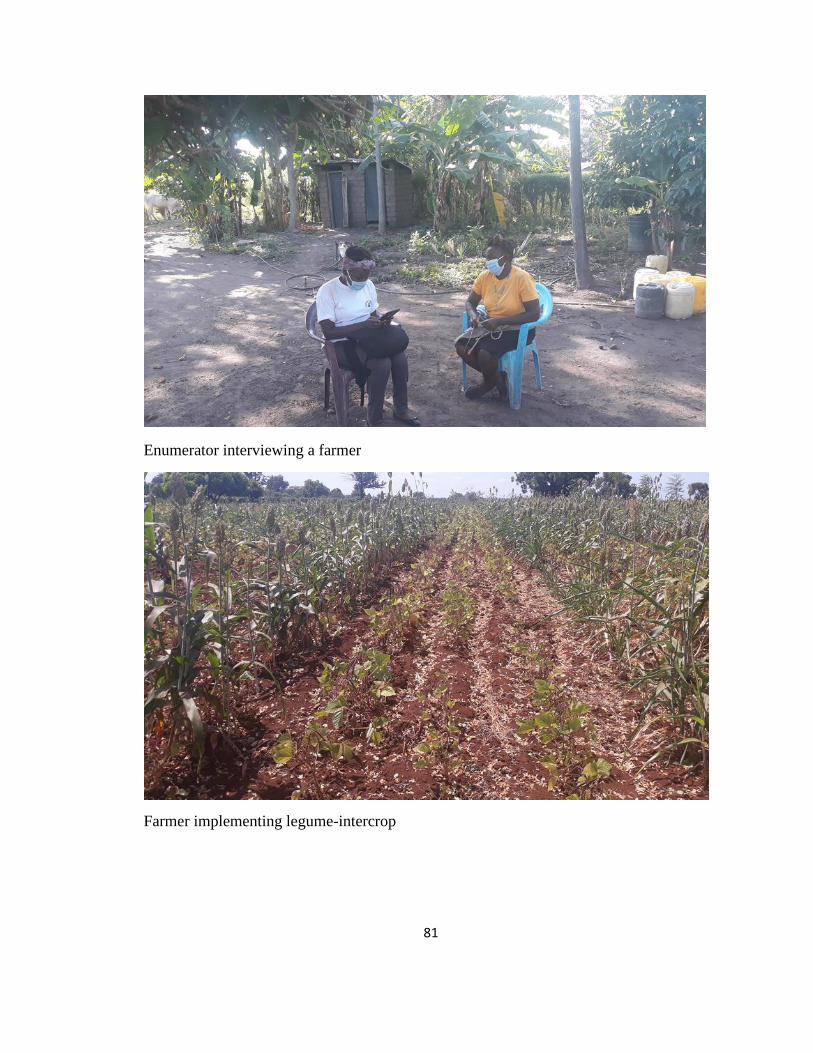
81
Enumerator interviewing a farmer
Farmer implementing legume-intercrop

82
Farmers constructing zai pits