Gender Inference Based On Twitter Pro les Inference Based On Twitter Pro les Francesco Ferrari...
7
Gender Inference Based On Twitter Profiles Francesco Ferrari A53204320 Department of Computer Science UC San Diego [email protected] Ayush Jasuja A53103338 Department of Computer Science UC San Diego [email protected] Manu Seth A53219535 Department of Electrical and Computer Engineering UC San Diego [email protected] Ranti Dev Sharma A53223197 Department of Computer Science UC San Diego [email protected] Abstract The rapid growth of social networks has produced an unprecedented amount of user-generated data. Twitter, being one of the most accessible sources, is ideal for performing text analysis and determining profile demographics like gender, age and geographical location. In this study we seek to identify the gender of Twitter users based on their profile and one random tweet. Gender classification can serve multiple purposes. For example, commercial organizations can use gender classification for advertising. Law enforcement may use gender classification as part of legal investigations. Others may use gender information for social reasons. Our method makes use of users profile picture, profile description, link color, sidebar color apart from one tweet text to classify the profile as male, female or brand. A novel tech- nique combining deep neural networks with classic text mining methods is employed to achieve an accuracy above 86%. 1 Similar Literature The dataset is produced by Crowd- flower, a data wrangling company, that aims to produce rich data for better analysis. In this case, contrib- utors were asked to view the Twitter profiles and classify them as male, female and brand for 20,000 tweets. The model built on this data is then expected to produce similar results on other tweets, as it is built using a rich training data source. [1] focuses only on colors used in the profiles at five different places and identify the band of colors that rep- resent the male and female commu- nities. [2] focuses mainly on tweets and uses N-gram character features to identify patterns of characters including acronyms and emoticons, used by the two communities. We found no literature which studies the combined effect of text, colors and images. 1
Transcript of Gender Inference Based On Twitter Pro les Inference Based On Twitter Pro les Francesco Ferrari...
Gender Inference Based On Twitter Profiles
Francesco FerrariA53204320
Department of Computer ScienceUC San Diego
Ayush JasujaA53103338
Department of Computer ScienceUC San Diego
Manu SethA53219535
Department of Electrical and Computer EngineeringUC San Diego
Ranti Dev SharmaA53223197
Department of Computer ScienceUC San Diego
Abstract
The rapid growth of social networks has produced an unprecedented amountof user-generated data. Twitter, being one of the most accessible sources,is ideal for performing text analysis and determining profile demographicslike gender, age and geographical location. In this study we seek to identifythe gender of Twitter users based on their profile and one random tweet.Gender classification can serve multiple purposes. For example, commercialorganizations can use gender classification for advertising. Law enforcementmay use gender classification as part of legal investigations. Others mayuse gender information for social reasons. Our method makes use of usersprofile picture, profile description, link color, sidebar color apart from onetweet text to classify the profile as male, female or brand. A novel tech-nique combining deep neural networks with classic text mining methods isemployed to achieve an accuracy above 86%.
1 Similar Literature
The dataset is produced by Crowd-flower, a data wrangling company,that aims to produce rich data forbetter analysis. In this case, contrib-utors were asked to view the Twitterprofiles and classify them as male,female and brand for 20,000 tweets.The model built on this data is thenexpected to produce similar resultson other tweets, as it is built using arich training data source.
[1] focuses only on colors used in theprofiles at five different places andidentify the band of colors that rep-resent the male and female commu-nities. [2] focuses mainly on tweetsand uses N-gram character featuresto identify patterns of charactersincluding acronyms and emoticons,used by the two communities. Wefound no literature which studies thecombined effect of text, colors andimages.
1

2 Dataset
We started our task by analyzing thedetails in the dataset that we had atour disposal. The dataset consistedof 20,000 rows collected from Twit-ter containing three different typesof gender: male, female and brands(companies with an official Twitteraccount). Each row had a certaindegree of confidence for the genderlabel. In order to make sure that weworked on the cleanest data possi-ble we filtered every row that had adegree of confidence less than 1 andalso every row that had unknown asgender. After filtering the datasetwe had approximately 14,000 rowsremaining with about 5,000 malesand females and 4,000 brands.
The dataset was split further into atraining set consisting of 80% of therows and a validation set containingthe remaining rows. The split be-tween the training set and the vali-dation set was consistent across allthe different used models in order tomake sure that we would get a vali-dation accuracy over the same sam-ples.
We had several features to work onwhich we will list below split in dif-ferent types of categories.
Text-based features:
• username
• description of user profile
• one tweet selected randomlyfrom the users tweets
Quantitative features:
• number of re-tweets
• link and sidebar color
• tweet location
• user’s timezone
Images-based features:
• user’s profile pictures
We approached each feature cate-gory in a different way since imagesand text require different types ofpre-processing.
2.1 Building features fromtext
We started analyzing the text fea-tures by simply observing whichwords were most recurrent in each
genders description. We did this butfirstly separating the rows by gen-der, removing all the stop words andfinally creating three wordclouds toplot them efficiently.
Fig 1: Wordcloud for females, malesand brands based on their
description.
From fig 1 we can see that, eventhough there are many terms thatare shared across gender, there arealso many others which are unique ofeach category such as girl, husbandand official.
After confirming that the languagedoes differ between gender we pro-ceeded with a deeper analysis. Wecollected the top words appearingin the dataset, filter the ones thatappear less than three times, andcreated a feature vector containingthe top words and their frequencyfor each row. We then treated eachrow as a document used a pythonlibrary called Gensim to apply La-tent Dirichlet Allocation and ob-served the main topics that each gen-der talks about.
Once we obtained the average topicdistribution for each gender we cal-culated the average topic distribu-tion across the whole dataset. Wethen divided the topic distributionfor each gender by the average oneacross the population and notedwhich topics per gender overindex or
2

underindex when compared to thegeneral distribution. Below we showthe top overindexing topics for eachgender.
Word P (word|topic)ig 0.1135girl 0.0761team 0.0430friend 0.0324watching 0.0220smart 0.0207kids 0.0193mean 0.01808needs 0.0176dog 0.0175
Table 1: Top 10 words for topoverindexing topic for females (theyare 32% more likely to talk about it
than average)
Word P (word|topic)ig 0.1135girl 0.0761team 0.0430friend 0.0324watching 0.0220smart 0.0207kids 0.0193mean 0.01808needs 0.0176dog 0.0175
Table 2: Top 10 words for topoverindexing topic for males (they
are 25% more likely to talk about itthan average)
Word P (word|topic)news 0.1722people 0.0800much 0.0364latest 0.0308think 0.0256tv 0.0253believe 0.0250fans 0.0248entertainment 0.0233stories 0.0177
Table 3: Top 10 words for topoverindexing topic for brands (theyare 48% more likely to talk about it
than average)
3 Predictive Task
As a point of reference to our mod-els we designed a very simple pre-dictive model that would functionas baseline. Since ”female” wasthe most frequent label our baselinewould simply classify every row as”female”, achieving a 39.01% accu-racy.
We completed the task by usingan ensemble of methods that wouldleverage on specific features in thedataset. We used three model in to-tal:
• a convolutional neural networkto analyze the profile pictures
• a gradient boosting classifier toclassify the user behaviour andthe description
• a multi-class classifier to classifythe tweets of each user
In this section we will discuss indetails the implementation of eachmodel.
3.1 Inferring gender fromuser’s behavior anddescription
For this model we had a total of83 features that we used to train aGradient Boosting Classifier (GBC).The GBC was chosen for its abilitynot to overfit (since we are averag-ing the results over multiple classi-fiers) and its readability (it is easyto tell which are the most impor-tant features and what is the de-cision process behind its classifica-tion). The first feature, the numberof re-tweets of a user, was related tothe users behavior and was provideddirectly by the original dataset with-out the need of pre-processing them.We extracted two features from theusername of each user by returningthe length of each username and bychecking if males names (obtainedfrom a list posted on the US Cen-sus website) were present in the user-name. We also had thirty topics dis-tribution features obtained by ap-plying LDA on the description ofeach user. Finally we had fifty fea-tures that represented the color ofthe sidebar of each user. Originallythere were more then 700 colors. Inorder to reduce the dimensionality
3

of the color feature we encoded eachcolor number into a one hot vectorand applied PCA on the resultingmatrix. It is important to mentionalso that the original dataset pro-vided additional features, includingthe time zone of the user, the coor-dinates of the tweets etc. but we didnot use them as there are not highlycorrelated to the gender of a user.
3.2 Inferring gender based ontext from Tweets
3.2.1 Bag of Words
We implemented the bag of wordsmodel for gender classification. Inthe data for every twitter profile wehad one of their tweet and also thedescription in their profile. We tookthe tweets from the profiles, removedpunctuation symbols from them andconverted all the words into lowercase to ensure uniformity. Further,we calculated the frequency of pro-cessed words and selected the thou-sand most frequent words from theuser tweets to fit the model. Below isa map for fifty most frequent wordsafter processing. The top five wordsare - weather, im, get, channel andupdates.
Fig 2: The top five words are -weather, im, get, channel and
updates.
Similarly, we processed the wordsin the profile description and calcu-lated the frequency of words to selectthe thousand most frequent wordsfrom profile description. The topfive most frequent words are - love,im, news, life, music.
Fig 3: The top five most frequentwords are - love, im, news, life,
music.
Finally, after choosing top 1000 mostfrequent words from both tweets anddescription, we applied a multino-mial naive bayes, one vs all classi-fication to find probabilities of dif-ferent profiles belonging to one ofthe classes - male, female or brand.The model performed fairly well ascompared to the baseline estimationand we got an accuracy of 65 per-cent. We also analysed the mostcritical words in prediction for allthe classes, based on the weightsthey got after training. Below arethe maps for twenty most importantwords for each class.
Fig 4: Maps for twenty mostimportant words for each class.
Fig 5: MFor female class, words likeweather, im, get, channel, good etc
were most positively weightedwords.
4
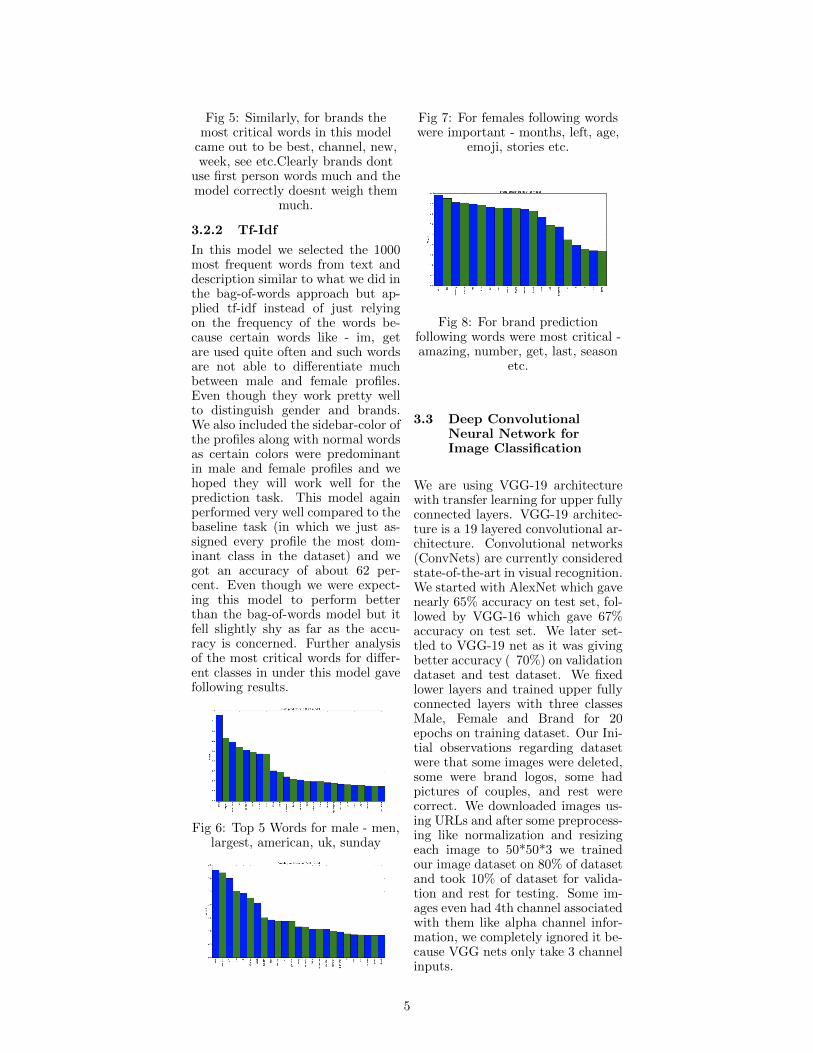
Fig 5: Similarly, for brands themost critical words in this model
came out to be best, channel, new,week, see etc.Clearly brands dont
use first person words much and themodel correctly doesnt weigh them
much.
3.2.2 Tf-Idf
In this model we selected the 1000most frequent words from text anddescription similar to what we did inthe bag-of-words approach but ap-plied tf-idf instead of just relyingon the frequency of the words be-cause certain words like - im, getare used quite often and such wordsare not able to differentiate muchbetween male and female profiles.Even though they work pretty wellto distinguish gender and brands.We also included the sidebar-color ofthe profiles along with normal wordsas certain colors were predominantin male and female profiles and wehoped they will work well for theprediction task. This model againperformed very well compared to thebaseline task (in which we just as-signed every profile the most dom-inant class in the dataset) and wegot an accuracy of about 62 per-cent. Even though we were expect-ing this model to perform betterthan the bag-of-words model but itfell slightly shy as far as the accu-racy is concerned. Further analysisof the most critical words for differ-ent classes in under this model gavefollowing results.
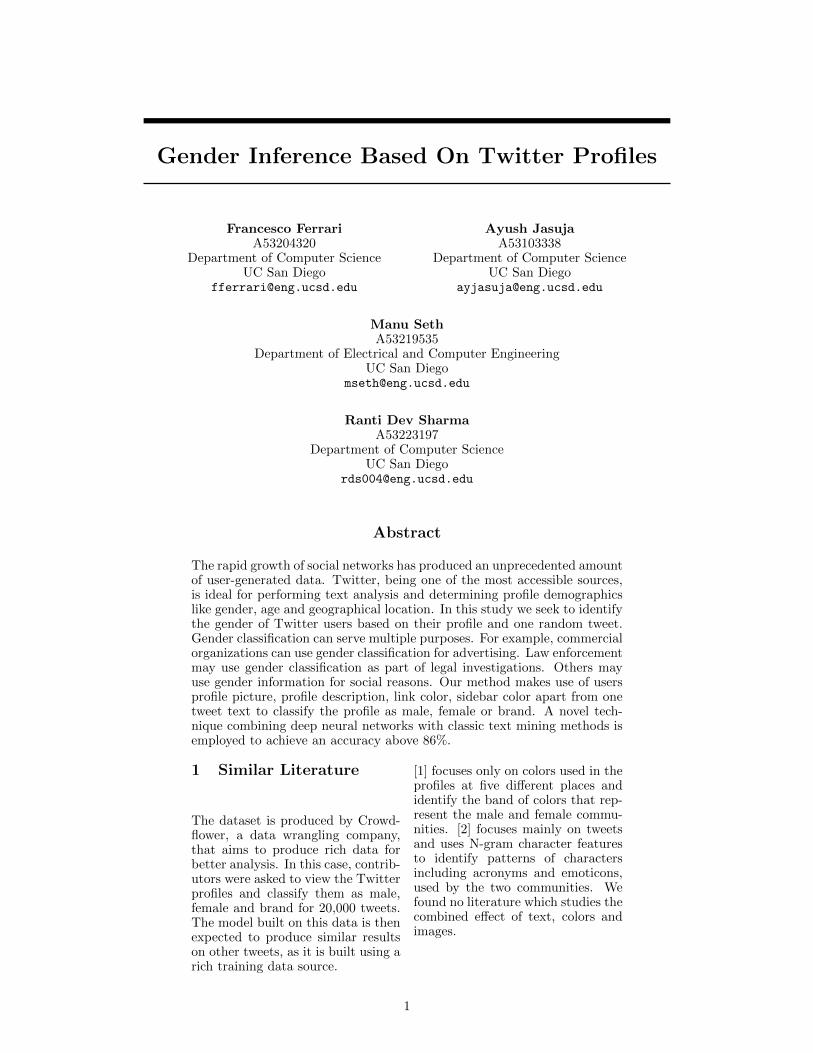
Fig 6: Top 5 Words for male - men,largest, american, uk, sunday
Fig 7: For females following wordswere important - months, left, age,
emoji, stories etc.
Fig 8: For brand predictionfollowing words were most critical -amazing, number, get, last, season
etc.
3.3 Deep ConvolutionalNeural Network forImage Classification
We are using VGG-19 architecturewith transfer learning for upper fullyconnected layers. VGG-19 architec-ture is a 19 layered convolutional ar-chitecture. Convolutional networks(ConvNets) are currently consideredstate-of-the-art in visual recognition.We started with AlexNet which gavenearly 65% accuracy on test set, fol-lowed by VGG-16 which gave 67%accuracy on test set. We later set-tled to VGG-19 net as it was givingbetter accuracy ( 70%) on validationdataset and test dataset. We fixedlower layers and trained upper fullyconnected layers with three classesMale, Female and Brand for 20epochs on training dataset. Our Ini-tial observations regarding datasetwere that some images were deleted,some were brand logos, some hadpictures of couples, and rest werecorrect. We downloaded images us-ing URLs and after some preprocess-ing like normalization and resizingeach image to 50*50*3 we trainedour image dataset on 80% of datasetand took 10% of dataset for valida-tion and rest for testing. Some im-ages even had 4th channel associatedwith them like alpha channel infor-mation, we completely ignored it be-cause VGG nets only take 3 channelinputs.
5
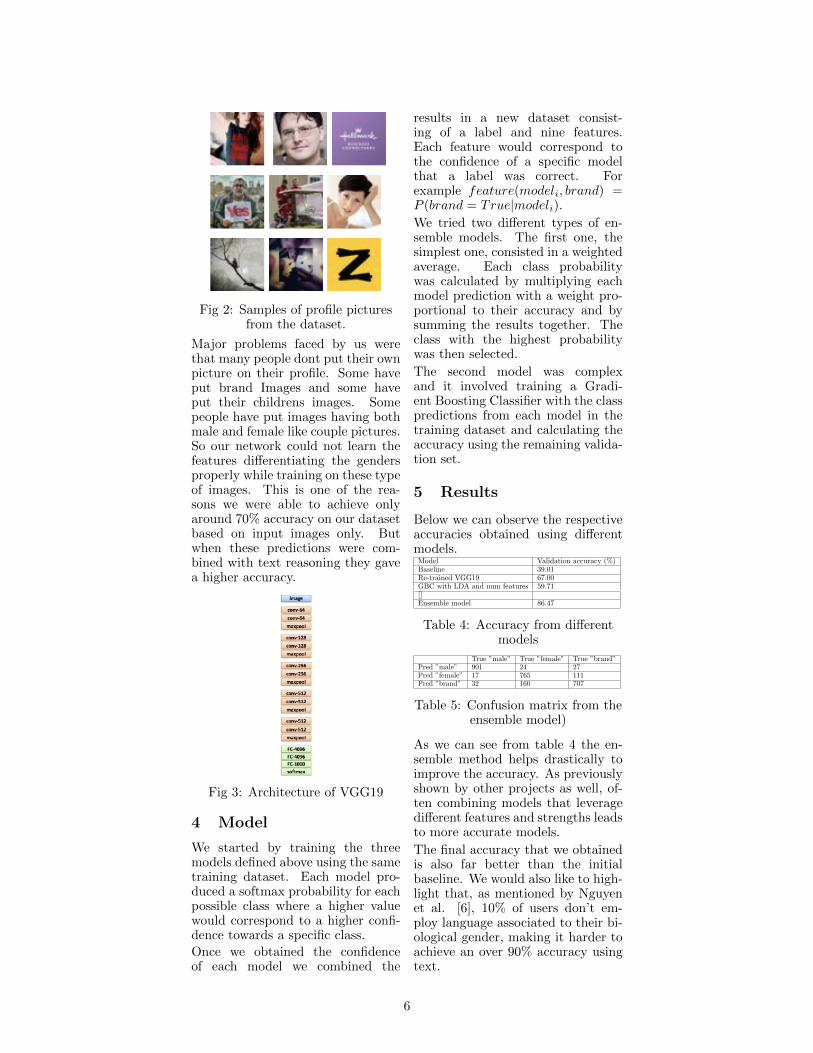
Fig 2: Samples of profile picturesfrom the dataset.
Major problems faced by us werethat many people dont put their ownpicture on their profile. Some haveput brand Images and some haveput their childrens images. Somepeople have put images having bothmale and female like couple pictures.So our network could not learn thefeatures differentiating the gendersproperly while training on these typeof images. This is one of the rea-sons we were able to achieve onlyaround 70% accuracy on our datasetbased on input images only. Butwhen these predictions were com-bined with text reasoning they gavea higher accuracy.
Fig 3: Architecture of VGG19
4 Model
We started by training the threemodels defined above using the sametraining dataset. Each model pro-duced a softmax probability for eachpossible class where a higher valuewould correspond to a higher confi-dence towards a specific class.
Once we obtained the confidenceof each model we combined the
results in a new dataset consist-ing of a label and nine features.Each feature would correspond tothe confidence of a specific modelthat a label was correct. Forexample feature(modeli, brand) =P (brand = True|modeli).
We tried two different types of en-semble models. The first one, thesimplest one, consisted in a weightedaverage. Each class probabilitywas calculated by multiplying eachmodel prediction with a weight pro-portional to their accuracy and bysumming the results together. Theclass with the highest probabilitywas then selected.
The second model was complexand it involved training a Gradi-ent Boosting Classifier with the classpredictions from each model in thetraining dataset and calculating theaccuracy using the remaining valida-tion set.
5 Results
Below we can observe the respectiveaccuracies obtained using differentmodels.
Model Validation accuracy (%)Baseline 39.01Re-trained VGG19 67.00GBC with LDA and num features 59.71[]Ensemble model 86.47
Table 4: Accuracy from differentmodels
True ”male” True ”female” True ”brand”Pred ”male” 901 24 27Pred ”female” 17 765 111Pred ”brand” 32 160 707
Table 5: Confusion matrix from theensemble model)
As we can see from table 4 the en-semble method helps drastically toimprove the accuracy. As previouslyshown by other projects as well, of-ten combining models that leveragedifferent features and strengths leadsto more accurate models.
The final accuracy that we obtainedis also far better than the initialbaseline. We would also like to high-light that, as mentioned by Nguyenet al. [6], 10% of users don’t em-ploy language associated to their bi-ological gender, making it harder toachieve an over 90% accuracy usingtext.
6

References
[1] Alowibdi, Jalal S., Ugo A. Buy,and S. Yu Philip. ”Say it withcolors: Language-independentgender classification on twitter.”Springer International Publish-ing, 2014.
[2] Z. Miller, B. Dickinson and W.Hu, ”Gender Prediction on Twit-ter Using Stream Algorithmswith N-Gram Character Fea-tures.” International Journal ofIntelligence Science, Vol. 2 No.4A, 2012.
[3] Chen, X., Wang, Y., Agichtein,E., and Wang, F. ”A Com-parative Study of DemographicAttribute Inference in Twitter.”ICWSM, 15, 590-593, 2015.
[4] Culotta, A., Kumar, N. R.,and Cutler, J., ”Predicting theDemographics of Twitter Usersfrom Website Traffic Data.” InAAAI (pp. 72-78), 2015.
[5] Liu, W., and Ruths, D, ”What’sin a Name? Using First Namesas Features for Gender Inferencein Twitter.”, In AAAI springsymposium: Analyzing microtext(Vol. 13, p. 01), 2013
[6] Nguyen, D.; Trieschnigg, D.;Dogruo z, A. S.; Gravel, R.;Theune, M.; Meder, T.; andde Jong, ”Why gender and ageprediction from tweets is hard:Lessons from a crowdsourcingexperiment.” In Proceedings ofCOLING 2014
7