Gender Inequality and Economic Growth in Spain: An Exploratory
26
The Review of Regional Studies 2009, Vol. 39, No. 1, pp. 23–48 © Southern Regional Science Association 2010. SRSA, 1601 University Avenue, PO Box 6025, Morgantown, West Virginia 26506-6025, USA. Gender Inequality and Economic Growth in Spain: An Exploratory Analysis + Rafael Domínguez Martín and Marta Guijarro Garvi ABSTRACT. This paper compares the geometric variant of the Gender-Related Development Index with that of the Human Development Index for Spanish provinces (EUROSTAT Nomenclature of Territorial Units for Statistics-3, NUTS-3) in 1959, 1981, and 1999. The main objective is to carry out an exploratory analysis of the relationship between these indices and two alternative indices of gender inequality— the Relative Status of Women and the Gender Inequality Index. An analysis of the relationship between these indices and economic growth at the provincial level is also conducted. Key Words: Gender Inequality, Economic Growth, Human Development. JEL Classifications: O15, O18. 1. INTRODUCTION Over the last three decades, development economics has opened up a research program into the construction and use of synthetic welfare indices. Following early work by Nordhaus and Tobin (1972), Seers (1972), Usher (1973), Sen (1976, 1979 and 1981), Goedhart et al. (1977), Morris (1979), and Morris and McAlpin (1979), a series of criticisms and new proposals led to what Fukuda-Parr (2003) termed the “human development paradigm.” This new paradigm is related to Sen and Anand’s ideas on capabilities. The indices have contributed to a burgeoning literature on welfare since 1990. These indices are products of refined articulation and expansion of basic concepts and measuring tools proposed by Sen and Anand (1990, 1994a, 1994b, 1995, 2000). Through them, the human development paradigm has extended into gender development (Firebaugh and Beck, 1994; Bardhan and Klasen, 1999; Villota, 1999; Dijkstra and Hanmer, 2000; Robeyns, 2003; Maestro and Martínez, 2003; Martínez and Cairó, 2004; Klasen, 2006; Dijkstra, 2006; Schüler, 2006). This research program has raised many new issues. This paper focuses on the direction and nature of the relationship between the various welfare indices and economic growth. We therefore perform a fairly long-run intertemporal analysis of gender inequality in a country that is transitioning toward greater development. This differentiates the paper from its predecessors, given that most research of this genre has focused on static or, at best, short-run analysis in developed or developing countries. Literature on welfare indices in Spain has focused on a series of provincial and regional analyses of the physical quality of life index (henceforth, PQLI) (Domínguez, 1999, 2002; Domínguez and Guijarro, 2000, 2001), international comparisons of the PQLI and the human development index (henceforth, HDI) (Escudero and Simón, 2003), and provincial and regional reconstruction of the HDI, the gender-related development index (GDI), and the human poverty + The authors are very grateful for the comments from the referees and the editor who have helped to improve the scope of the article. Likewise, they express their gratitude to Mercedes Arias, Naomi Patterson, and Izaskun Sánchez from the Iberoamerican International Cooperation Research Office at the University of Cantabria—to Mercedes and Naomi for translation assistance and to Izaskun for production of the maps. Rafael Domínguez Martín is an Associate Professor in Economic History, Department of Economics, University of Cantabria. Marta Guijarro Garvi.is an Associate Professor in Statistics, Department of Economics, University of Cantabria. Contact author: Marta Guijarro Garvi, Department of Economics, University of Cantabria, Av. de los Castros s/n, 39005 Santander. Spain. Phone: (+34) 942201626. Fax: (+34) 942201603. E-mail: [email protected] .
Transcript of Gender Inequality and Economic Growth in Spain: An Exploratory

The Review of Regional Studies 2009, Vol. 39, No. 1, pp. 23–48
© Southern Regional Science Association 2010. SRSA, 1601 University Avenue, PO Box 6025, Morgantown, West Virginia 26506-6025, USA.
Gender Inequality and Economic Growth in Spain: An Exploratory Analysis+ Rafael Domínguez Martín and Marta Guijarro Garvi
ABSTRACT. This paper compares the geometric variant of the Gender-Related Development Index with that of the Human Development Index for Spanish provinces (EUROSTAT Nomenclature of Territorial Units for Statistics-3, NUTS-3) in 1959, 1981, and 1999. The main objective is to carry out an exploratory analysis of the relationship between these indices and two alternative indices of gender inequality— the Relative Status of Women and the Gender Inequality Index. An analysis of the relationship between these indices and economic growth at the provincial level is also conducted.
Key Words: Gender Inequality, Economic Growth, Human Development.
JEL Classifications: O15, O18.
1. INTRODUCTION
Over the last three decades, development economics has opened up a research program into the construction and use of synthetic welfare indices. Following early work by Nordhaus and Tobin (1972), Seers (1972), Usher (1973), Sen (1976, 1979 and 1981), Goedhart et al. (1977), Morris (1979), and Morris and McAlpin (1979), a series of criticisms and new proposals led to what Fukuda-Parr (2003) termed the “human development paradigm.” This new paradigm is related to Sen and Anand’s ideas on capabilities. The indices have contributed to a burgeoning literature on welfare since 1990. These indices are products of refined articulation and expansion of basic concepts and measuring tools proposed by Sen and Anand (1990, 1994a, 1994b, 1995, 2000). Through them, the human development paradigm has extended into gender development (Firebaugh and Beck, 1994; Bardhan and Klasen, 1999; Villota, 1999; Dijkstra and Hanmer, 2000; Robeyns, 2003; Maestro and Martínez, 2003; Martínez and Cairó, 2004; Klasen, 2006; Dijkstra, 2006; Schüler, 2006). This research program has raised many new issues. This paper focuses on the direction and nature of the relationship between the various welfare indices and economic growth. We therefore perform a fairly long-run intertemporal analysis of gender inequality in a country that is transitioning toward greater development. This differentiates the paper from its predecessors, given that most research of this genre has focused on static or, at best, short-run analysis in developed or developing countries.
Literature on welfare indices in Spain has focused on a series of provincial and regional analyses of the physical quality of life index (henceforth, PQLI) (Domínguez, 1999, 2002; Domínguez and Guijarro, 2000, 2001), international comparisons of the PQLI and the human development index (henceforth, HDI) (Escudero and Simón, 2003), and provincial and regional reconstruction of the HDI, the gender-related development index (GDI), and the human poverty
+ The authors are very grateful for the comments from the referees and the editor who have helped to improve the scope of the article. Likewise, they express their gratitude to Mercedes Arias, Naomi Patterson, and Izaskun Sánchez from the Iberoamerican International Cooperation Research Office at the University of Cantabria—to Mercedes and Naomi for translation assistance and to Izaskun for production of the maps. Rafael Domínguez Martín is an Associate Professor in Economic History, Department of Economics, University of Cantabria. Marta Guijarro Garvi.is an Associate Professor in Statistics, Department of Economics, University of Cantabria. Contact author: Marta Guijarro Garvi, Department of Economics, University of Cantabria, Av. de los Castros s/n, 39005 Santander. Spain. Phone: (+34) 942201626. Fax: (+34) 942201603. E-mail: [email protected].

24 The Review of Regional Studies, Vol. 39, No 1, 2009
© Southern Regional Science Association 2010.
index for the period 1980- 2000 (IVIE, 2004a, 2004b, 2004c, 2004d, 2005a, 2005b; Herrero, Soler, and Villar, 2004). The research laid out here aims to take advantage of the somewhat backward nature of Spain’s fairly recent economic past to advance the aforementioned literature in order to investigate the nature of the country’s advancements in development and gender equality.
The underlying hypothesis of the paper, therefore, is that distributive issues between genders are important when measuring welfare. Hence, the research presented here has two objectives. First, it is designed to perform a comparative analysis of the geometric variants of the GDI (GDIg), the HDI (HDIg) and the Relative Status of Women (henceforth, RSW) for the Spanish provinces in 1959, 1981, and 1999. Three indices—life expectancy, education, and income indicators—are used to calculate the GDI. The additive nature of the GDI and HDI can lead to erroneous interpretations since an increase in their values can be due to an increase in a single component. Therefore, in this study we propose the geometric variants GDIg and HDIg, whose multiplicative natures avoid this type of error and its implication in economic policy. The study will include analysis of a) interprovincial, or -convergence of the three indices; and b) gender convergence, from this point onward referred to as -convergence, by comparing the GDIg and HDIg using the gender inequality index (henceforth, GII). The second objective involves an exploratory analysis of the GDIg, HDIg, RSW, and economic growth at the provincial level. This is done to determine the extent to which economic growth influences gender inequality (or perhaps whether gender inequality influences growth) and to discover why gender inequality persists in certain Spanish regions but generally tends to converge due to strong migration flows among provinces. The results are relevant to the discussion about the relationship between gender inequalities and economic growth in the current development and transition economics.
The paper is structured as follows. The following section provides a brief description of the construction of the GDI, RSW and GII. Section 3 summarizes the nature and direction of the relationship between gender development/gender inequality (GDIg, RSW, and GII) and economic growth. Section 4 focuses on the construction of the GDIg, the HDIg, and the RSW for the Spanish provinces in 1959, 1981 and 1999. Section 5 provides details of the exploratory analysis of gender development, gender inequality and growth. The paper concludes by presenting the main results and offering some considerations for future research. 2. GENDER DEVELOPMENT AND GENDER INEQUALITY INDICES
The introduction of the GDI by the United Nations in 1995 coincided with the institutionalization of feminist economics (The International Association for Feminist Economics was created in 1992 and the first copy of the journal Feminist Economics was published in 1995). The GDI is a compound index that evaluates gender equality and is constructed similar to the manner in which the HDI is built: that is, the GDI is essentially the HDI adjusted (downwards) for gender inequality. Following the Human Development Report issued by the United Nations Development Programme (UNDP, 1995), while the HDI measures average achievement of a region or country’s adult population, the GDI adjusts this average achievement to reflect the inequalities between men and women in three dimensions. A low GDI value represents a high degree of inequality. In order to obtain the HDI and the GDI, the principal health indicator is taken as the index of life expectancy at birth; the indicator of knowledge is taken as an education index (the rate of adult literacy weighted at 0.67 and the gross rate of
DOMÍNGUEZ & GUIJARRO: GENDER INEQUALITY & ECONOMIC GROWTH 25
© Southern Regional Science Association 2010.
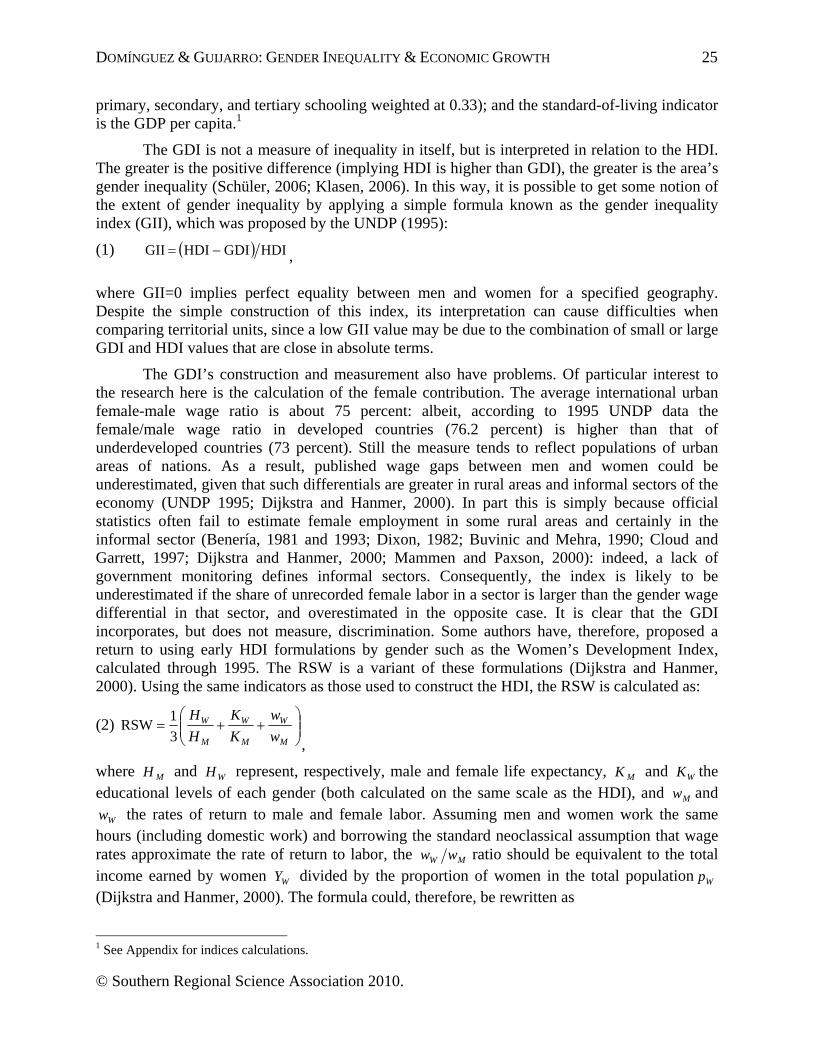
primary, secondary, and tertiary schooling weighted at 0.33); and the standard-of-living indicator is the GDP per capita.1
The GDI is not a measure of inequality in itself, but is interpreted in relation to the HDI. The greater is the positive difference (implying HDI is higher than GDI), the greater is the area’s gender inequality (Schüler, 2006; Klasen, 2006). In this way, it is possible to get some notion of the extent of gender inequality by applying a simple formula known as the gender inequality index (GII), which was proposed by the UNDP (1995):
(1) HDIGDIHDIGII ,
where GII=0 implies perfect equality between men and women for a specified geography. Despite the simple construction of this index, its interpretation can cause difficulties when comparing territorial units, since a low GII value may be due to the combination of small or large GDI and HDI values that are close in absolute terms.
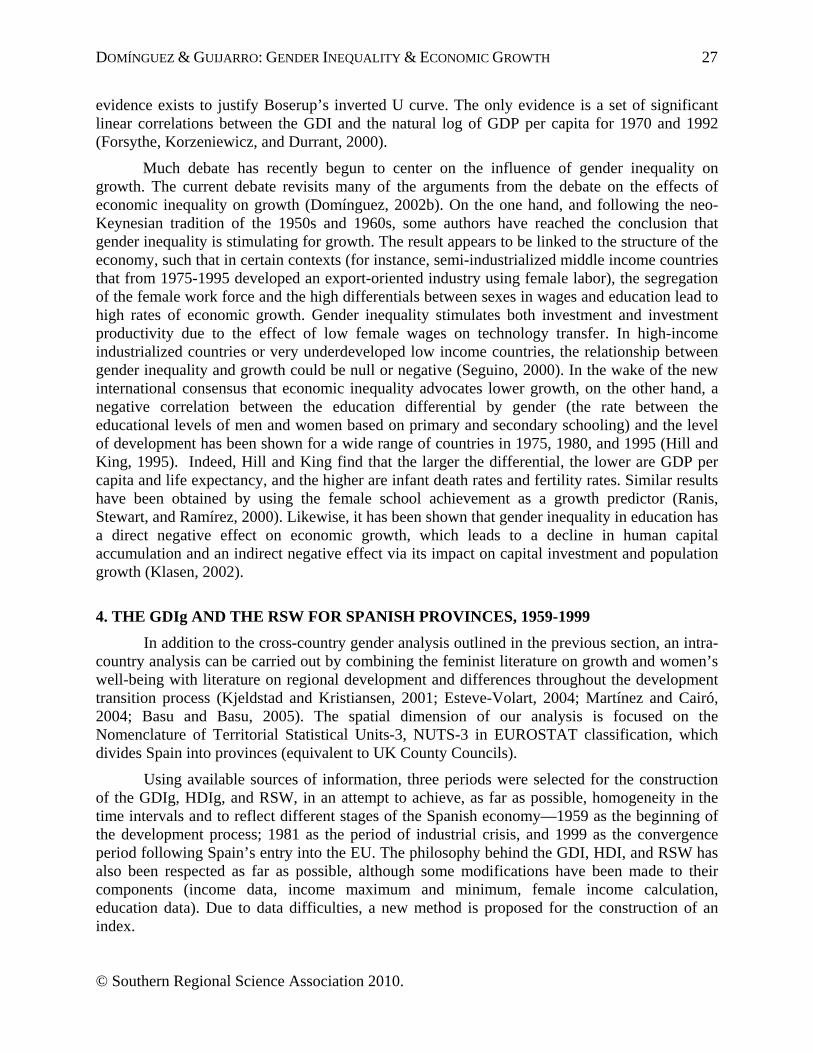
The GDI’s construction and measurement also have problems. Of particular interest to the research here is the calculation of the female contribution. The average international urban female-male wage ratio is about 75 percent: albeit, according to 1995 UNDP data the female/male wage ratio in developed countries (76.2 percent) is higher than that of underdeveloped countries (73 percent). Still the measure tends to reflect populations of urban areas of nations. As a result, published wage gaps between men and women could be underestimated, given that such differentials are greater in rural areas and informal sectors of the economy (UNDP 1995; Dijkstra and Hanmer, 2000). In part this is simply because official statistics often fail to estimate female employment in some rural areas and certainly in the informal sector (Benería, 1981 and 1993; Dixon, 1982; Buvinic and Mehra, 1990; Cloud and Garrett, 1997; Dijkstra and Hanmer, 2000; Mammen and Paxson, 2000): indeed, a lack of government monitoring defines informal sectors. Consequently, the index is likely to be underestimated if the share of unrecorded female labor in a sector is larger than the gender wage differential in that sector, and overestimated in the opposite case. It is clear that the GDI incorporates, but does not measure, discrimination. Some authors have, therefore, proposed a return to using early HDI formulations by gender such as the Women’s Development Index, calculated through 1995. The RSW is a variant of these formulations (Dijkstra and Hanmer, 2000). Using the same indicators as those used to construct the HDI, the RSW is calculated as:
(2)
M
W
M
W
M
W
w
w
K
K
H
H
3
1RSW
,
where MH and WH represent, respectively, male and female life expectancy, MK and WK the educational levels of each gender (both calculated on the same scale as the HDI), and Mw and
Ww the rates of return to male and female labor. Assuming men and women work the same hours (including domestic work) and borrowing the standard neoclassical assumption that wage rates approximate the rate of return to labor, the MW ww ratio should be equivalent to the total income earned by women WY divided by the proportion of women in the total population Wp (Dijkstra and Hanmer, 2000). The formula could, therefore, be rewritten as
1 See Appendix for indices calculations.

26 The Review of Regional Studies, Vol. 39, No 1, 2009
© Southern Regional Science Association 2010.
(3)
W
W
M
W
M
W
p
Y
K
K
H
H
3
1RSW
.
All of the RSW components have equal weight. Therefore, on a scale of 0 to 1, if
(4) 1RSW W
W
M
W
M
W
p
Y
K
K
H
H
there is equality between men and women. If 1RSW , women are discriminated against and if 1RSW , then men are discriminated against. This new index can help to identify areas with
high levels of inequality at specific levels of development, such as women’s income participation, which depends on their level of involvement within the active population and the gender wage gap (Martínez and Cairó, 2004). It can also be used in tests of the possible influence of inequality on the rate of economic growth.
3. GENDER DEVELOPMENT AND ECONOMIC GROWTH
There has been a parallel evolution in the literature on gender inequality and economic growth and the debates over economic inequality and growth (Domínguez, 2002b). Research initially explored the relationship between economic growth and the evolution of gender inequality. However, recent studies have turned this around and explored the influence of gender inequality on growth.
The relationship between economic growth and gender inequality was originally analyzed by Adam Smith (1776) and Nicolas de Condorcet (1794): the wealth of nations—and therefore their level of development—was correlated with the gradual decrease of the level of inequality between men and women (Nyland, 1993; Sutherland, 1995; Groenewegen, 2003). The Smith-Condorcet thesis was adopted over a period of many years by neoclassically inspired development literature, an approach adopted by influential international institutions such as the World Bank. New theories of growth have recently verified it (Lagerlöf, 2003): gender equality is positively and highly correlated with per capita income and negatively with fertility rate (in rich countries women have a higher status and fewer children than in poor countries). For the years 1970 and 1992, the correlations between the GDI and the GDP per capita in a sample of 130 countries have respective coefficients of 0.83 and 0.81; and the data show that the improvement in GDI was more pronounced in those countries that grew more quickly (Forsythe, Korzeniewicz, and Durrant, 2000). A study by Boserup (1970) produces similar results and plots a gender inequality curve resembling Kuznets’s inverted U curve. In the early stages of growth there is an increase in inequality between men and women up to a certain threshold. From that point there is a decrease in inequality in the long term due to the effects of technological progress on growth—the expansion of market opportunities reduces fertility rates, which in turn suppresses discriminatory practices in education and the work environment (Boserup, 1970 and 1987). This model was questioned by some economists on account of the impoverishing effects of some structural adjustment policies on women and the effects of globalization (Elson, 1995, 2000; Benería, 2000; Pyle and Summerfield, 2000; Bakker, 2000; Berik, 2000). Such policies were designed to eliminate the downward section of the inverted U curve. It has since been shown that at low levels of economic development initial improvements in GDP per capita do not result in a significant increase in GDI and that, at a certain point, the GDI improves more rapidly alongside a rise in GDP per capita until reaching a certain threshold beyond which GDI returns from GDP growth per capita diminish (Dijkstra and Hanmer, 2000). Finally, no empirical
DOMÍNGUEZ & GUIJARRO: GENDER INEQUALITY & ECONOMIC GROWTH 27
© Southern Regional Science Association 2010.
evidence exists to justify Boserup’s inverted U curve. The only evidence is a set of significant linear correlations between the GDI and the natural log of GDP per capita for 1970 and 1992 (Forsythe, Korzeniewicz, and Durrant, 2000).
Much debate has recently begun to center on the influence of gender inequality on growth. The current debate revisits many of the arguments from the debate on the effects of economic inequality on growth (Domínguez, 2002b). On the one hand, and following the neo-Keynesian tradition of the 1950s and 1960s, some authors have reached the conclusion that gender inequality is stimulating for growth. The result appears to be linked to the structure of the economy, such that in certain contexts (for instance, semi-industrialized middle income countries that from 1975-1995 developed an export-oriented industry using female labor), the segregation of the female work force and the high differentials between sexes in wages and education lead to high rates of economic growth. Gender inequality stimulates both investment and investment productivity due to the effect of low female wages on technology transfer. In high-income industrialized countries or very underdeveloped low income countries, the relationship between gender inequality and growth could be null or negative (Seguino, 2000). In the wake of the new international consensus that economic inequality advocates lower growth, on the other hand, a negative correlation between the education differential by gender (the rate between the educational levels of men and women based on primary and secondary schooling) and the level of development has been shown for a wide range of countries in 1975, 1980, and 1995 (Hill and King, 1995). Indeed, Hill and King find that the larger the differential, the lower are GDP per capita and life expectancy, and the higher are infant death rates and fertility rates. Similar results have been obtained by using the female school achievement as a growth predictor (Ranis, Stewart, and Ramírez, 2000). Likewise, it has been shown that gender inequality in education has a direct negative effect on economic growth, which leads to a decline in human capital accumulation and an indirect negative effect via its impact on capital investment and population growth (Klasen, 2002).
4. THE GDIg AND THE RSW FOR SPANISH PROVINCES, 1959-1999
In addition to the cross-country gender analysis outlined in the previous section, an intra-country analysis can be carried out by combining the feminist literature on growth and women’s well-being with literature on regional development and differences throughout the development transition process (Kjeldstad and Kristiansen, 2001; Esteve-Volart, 2004; Martínez and Cairó, 2004; Basu and Basu, 2005). The spatial dimension of our analysis is focused on the Nomenclature of Territorial Statistical Units-3, NUTS-3 in EUROSTAT classification, which divides Spain into provinces (equivalent to UK County Councils).
Using available sources of information, three periods were selected for the construction of the GDIg, HDIg, and RSW, in an attempt to achieve, as far as possible, homogeneity in the time intervals and to reflect different stages of the Spanish economy—1959 as the beginning of the development process; 1981 as the period of industrial crisis, and 1999 as the convergence period following Spain’s entry into the EU. The philosophy behind the GDI, HDI, and RSW has also been respected as far as possible, although some modifications have been made to their components (income data, income maximum and minimum, female income calculation, education data). Due to data difficulties, a new method is proposed for the construction of an index.

28 The Review of Regional Studies, Vol. 39, No 1, 2009
© Southern Regional Science Association 2010.
Since it is comprised of three component indices, the GDI can be constructed as a geometric variant as long as no particular set of relative weights is attributed to the components. We label the result the GDIg, the geometric mean of the three components (see Appendix). As opposed to the additive version, the value of the multiplicative equivalent index is improved only if each of the components behaves in the same direction (Sagar and Najam, 1998). Therefore, all three components are essential to determining the level of gender development. Hence, while the additive nature of GDI supposes that the index can increase as a result of an increase in any one of its components, GDIg is not as sensitive to changes in a single component.
Regarding component modifications, the first is the use of the minimum and maximum values for the GDP per capita. Given that our series starts several decades earlier than that of the UNDP and refers to the provinces of a single country, we have provisionally adopted 20,000 and 8,000,000 pesetas in constant year 1986 terms as GDP per capita’s minimum and maximum, respectively. These have been obtained in the following way. Following the procedure corresponding to the first report from the UNDP (1990), the lowest value for the previous few years has been taken, which in the BBVA income series can be calculated in 1955 with the female per capita GDP data for the active population in the 1950 Census and which correspond (in rough figures) to the province of Cáceres—[ 761,29507.0000,000,616,92 ]. To deduce the maximum we applied 2.5 percent, which is the result of the quotient 100/40,000 from the UNDP data. These values are then used to calculate the RSW female/male income ratio, unlike Dijkstra and Hanmer (2000), who for this particular indicator prefer to forgo use of the systematic GDI maximum and minimum scale. For this reason, as with the GDIg, we opt not to apply natural logarithms.
The study years contain the values closest to the set of data that is taken as a reference, which is the market-price GDP of the BBVA Foundation (1999, 2000) income series for 1959, 1981, and 1999. The GDP per capita has been calculated using the population for 1960 and 1981 from the Population Census and for year 2000 from the 2001 Statistical Year Book of Spain. The female GDP per capita has been calculated by multiplying GDP by the share of the women among the total working population (from the Population Census of 1960 and 1981 and from the four-month average extracted from the 1999 Economically Active Population Survey, and the denominator is population of all women for the corresponding years.
Unfortunately, due to a lack of statistical information it is not possible to use wage differentials. A national wage differential for 1959 and 1981 is unavailable. Indeed, since in the 1960s only very general information regarding aspects of national production was available (Benería, 1977). Increased feminization of the working population and an increased focus on the manufacturing and service sectors have introduced biases that are difficult to eliminate (Capel, 1999; Klasen, 2006). In 1959, if a large share of the female working population was to be employed in the resource industries, the index for income could be biased downward if the share of the unrecorded working female population over the total working population was greater than the wage differential in that sector, and biased upwardly in the opposite case. The problem becomes more serious given that, research advances aside (Silvestre, 2005), no data are available for provincial wage differentials during the second half of the 20th century. A fall in national differentials between 1959 and 1981 (as the female working population moved out of agriculture) and a tendency towards convergence in disparities at the provincial level can only be speculated.

DOMÍNGUEZ & GUIJARRO: GENDER INEQUALITY & ECONOMIC GROWTH 29
© Southern Regional Science Association 2010.
After 1981, it is possible that the wage differentials and the disparities arising from them rebounded. The first available national figure is to be found in the Survey on Living Conditions and Work in Spain 1985-1986 (a sample survey of 60,000 homes) and indicates a national female/male wage ratio of between 55 and 60 percent. This is a rather unreliable estimate since it is based on controls for the various types of contracts that exist. The Pilot Study on Discrimination against Women in the Workplace, which was carried out in 1988, was generated from 3,000 interviews. It provides information that suggests a national wage ratio between 80.8 percent and 83.0 percent, depending on the different controls that are applied (Hernández, 1995 and 1996; Ugidos, 1997; Moltó, 2002). For the 1990s, the 1995 Wage Structure Survey combines data from a survey of 175,000 employees in the manufacturing and service sectors—the Survey on Wages in Industry and the Service Sector—with those from another on the budgets of 25,000 homes—the Family Budget Surveys. It indicates a notable rise in the differentials after 1988—to 70 percent in 1995, between 74.9 percent and 78.1 percent for 1996-1999, and between 77.1 percent and 79 percent for 1994-1997, respectively (Martín and Zarapuz, 2000; Moltó, 2002). Durán (1997) reaches the same conclusion using tax sources for 1994, as does Lago (2002). Based on their work, the generally accepted average for the 1990s ranges between 70 percent and 72 percent. Finally, Herrero, Soler, and Villar (2004) from the IVIE (2004d) calculate that the ratio of the average female to average male wage for 1989-2000 period was 71 percent in Spain, ranging from 78.2 percent in the Canaries to 63.7 percent in Aragón.
With regard to life expectancy and education we follow UNDP standards. In our case, data on education correspond exclusively to the adult literacy rate. Since this variable accounts for two thirds of the education achievement indicator and progress in the area of schooling is strongly correlated with that of reading and writing abilities, it is reasonable to assume that the result would be very similar if unbiased schooling data were used. The problem, however, is that no such data exist at the regional level in Spain. The gross education rate does not enable students who live in one province and study in another to be properly accounted for, adding an upward bias in favor of those provinces with more educational facilities (especially at the university level) or those which, for a variety of reasons, receive students from other provinces. It has been proven that the sum of this bias plus that deriving from students older than 23 years enrolling at educational centers (in the numerator for the schooling rate, the age group of the population taken into account is from 6 to 23 years of age) can actually cause the schooling rate to exceed 100 in certain provinces (IVIE, 2004b; Herrero, Soler, and Villar, 2004).
A final point to be made here is that life expectancy for 1959 corresponds to the average for 1960-1961 and life expectancy for 1981 to the average for 1975-1980 as recorded in Devolder (1986) by province and sex; that for 1999 is available from the Spanish National Statistical Office (INEbase) for provinces by gender only through 1995. Hence, we use the projection produced by Herrero, Soler, and Villar (2004) for 1999.
Data for the literacy variable are taken from the Population Census for the years 1960, 1981, and 1991: the last being the most recent census available when this paper was written. By all accounts, however, the figures from the 1991 Census are very similar to those deduced from the active population literacy for 2000 in the IVIE (2004b) by Herrero, Soler, and Villar (2004). It is, however, important to clarify changes inherent across these different sources. The 1960 Population Census collects two different kinds of literacy data. Using the number of people identifying themselves as literate, it is possible to deduce a much lower literacy crude rate (74.9 percent at national level) than one obtained using the residual of the percentage of people who
30 The Review of Regional Studies, Vol. 39, No 1, 2009
© Southern Regional Science Association 2010.
identify themselves as illiterate (88.8 percent). We have chosen this second alternative because its derivation more closely approximates those used to produce the literacy figures available for 1981 and 1991. The figures in the 1981 Census indicate the illiteracy rate for the population aged 10 years and over, which we have transformed into the residual literacy rate expressed in a percentage. The 1991 Census contains the same kind of data in percentage form, which we have once again transformed into a residual literacy rate. 5. GENDER DEVELOPMENT, CONVERGENCE, AND GROWTH IN SPAIN
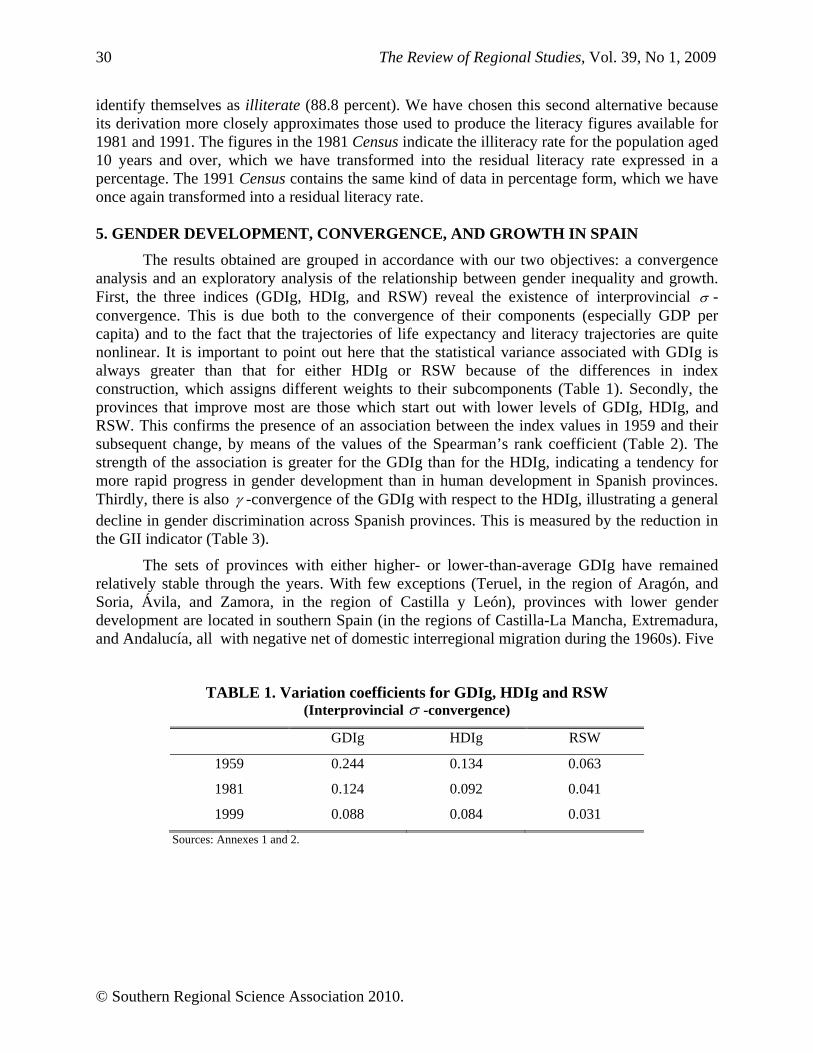
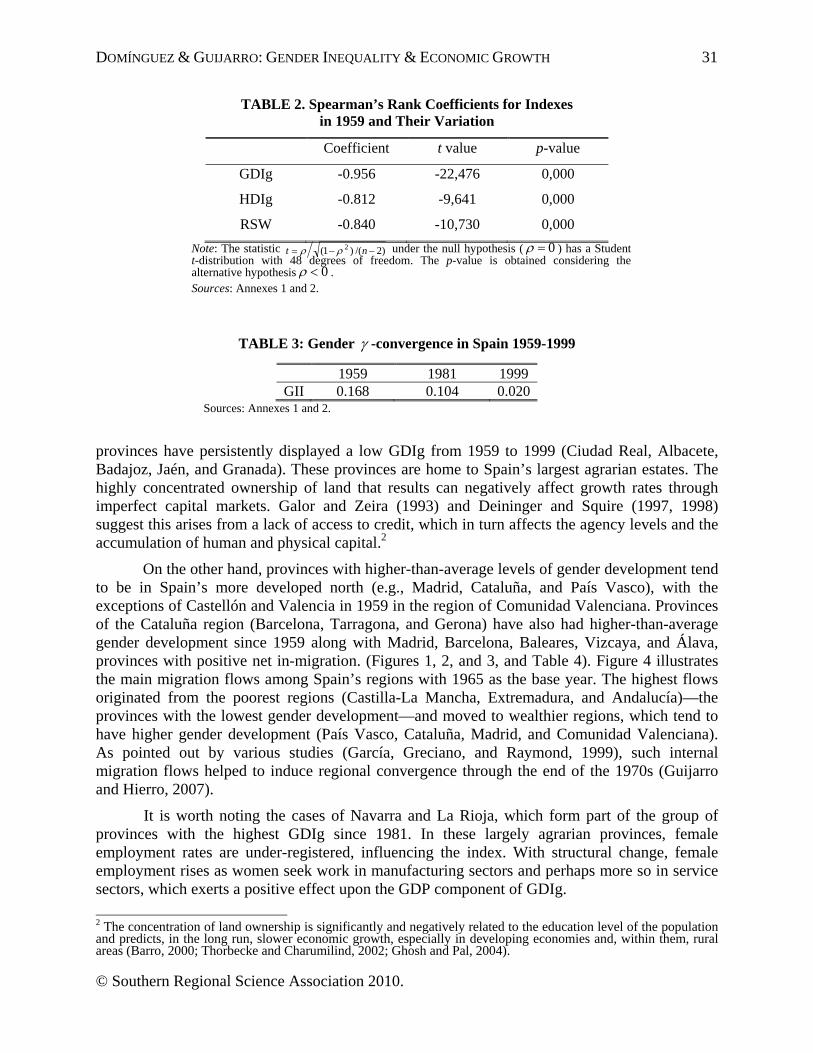
The results obtained are grouped in accordance with our two objectives: a convergence analysis and an exploratory analysis of the relationship between gender inequality and growth. First, the three indices (GDIg, HDIg, and RSW) reveal the existence of interprovincial -convergence. This is due both to the convergence of their components (especially GDP per capita) and to the fact that the trajectories of life expectancy and literacy trajectories are quite nonlinear. It is important to point out here that the statistical variance associated with GDIg is always greater than that for either HDIg or RSW because of the differences in index construction, which assigns different weights to their subcomponents (Table 1). Secondly, the provinces that improve most are those which start out with lower levels of GDIg, HDIg, and RSW. This confirms the presence of an association between the index values in 1959 and their subsequent change, by means of the values of the Spearman’s rank coefficient (Table 2). The strength of the association is greater for the GDIg than for the HDIg, indicating a tendency for more rapid progress in gender development than in human development in Spanish provinces. Thirdly, there is also -convergence of the GDIg with respect to the HDIg, illustrating a general decline in gender discrimination across Spanish provinces. This is measured by the reduction in the GII indicator (Table 3).
The sets of provinces with either higher- or lower-than-average GDIg have remained relatively stable through the years. With few exceptions (Teruel, in the region of Aragón, and Soria, Ávila, and Zamora, in the region of Castilla y León), provinces with lower gender development are located in southern Spain (in the regions of Castilla-La Mancha, Extremadura, and Andalucía, all with negative net of domestic interregional migration during the 1960s). Five
TABLE 1. Variation coefficients for GDIg, HDIg and RSW (Interprovincial -convergence)
GDIg HDIg RSW
1959 0.244 0.134 0.063
1981 0.124 0.092 0.041
1999 0.088 0.084 0.031
Sources: Annexes 1 and 2.
DOMÍNGUEZ & GUIJARRO: GENDER INEQUALITY & ECONOMIC GROWTH 31
© Southern Regional Science Association 2010.
TABLE 2. Spearman’s Rank Coefficients for Indexes in 1959 and Their Variation
Coefficient t value p-value
GDIg -0.956 -22,476 0,000
HDIg -0.812 -9,641 0,000
RSW -0.840 -10,730 0,000
Note: The statistic )2/()1( 2 nt under the null hypothesis ( 0 ) has a Student t-distribution with 48 degrees of freedom. The p-value is obtained considering the alternative hypothesis 0 . Sources: Annexes 1 and 2.
TABLE 3: Gender -convergence in Spain 1959-1999
1959 1981 1999 GII 0.168 0.104 0.020
Sources: Annexes 1 and 2.
provinces have persistently displayed a low GDIg from 1959 to 1999 (Ciudad Real, Albacete, Badajoz, Jaén, and Granada). These provinces are home to Spain’s largest agrarian estates. The highly concentrated ownership of land that results can negatively affect growth rates through imperfect capital markets. Galor and Zeira (1993) and Deininger and Squire (1997, 1998) suggest this arises from a lack of access to credit, which in turn affects the agency levels and the accumulation of human and physical capital.2
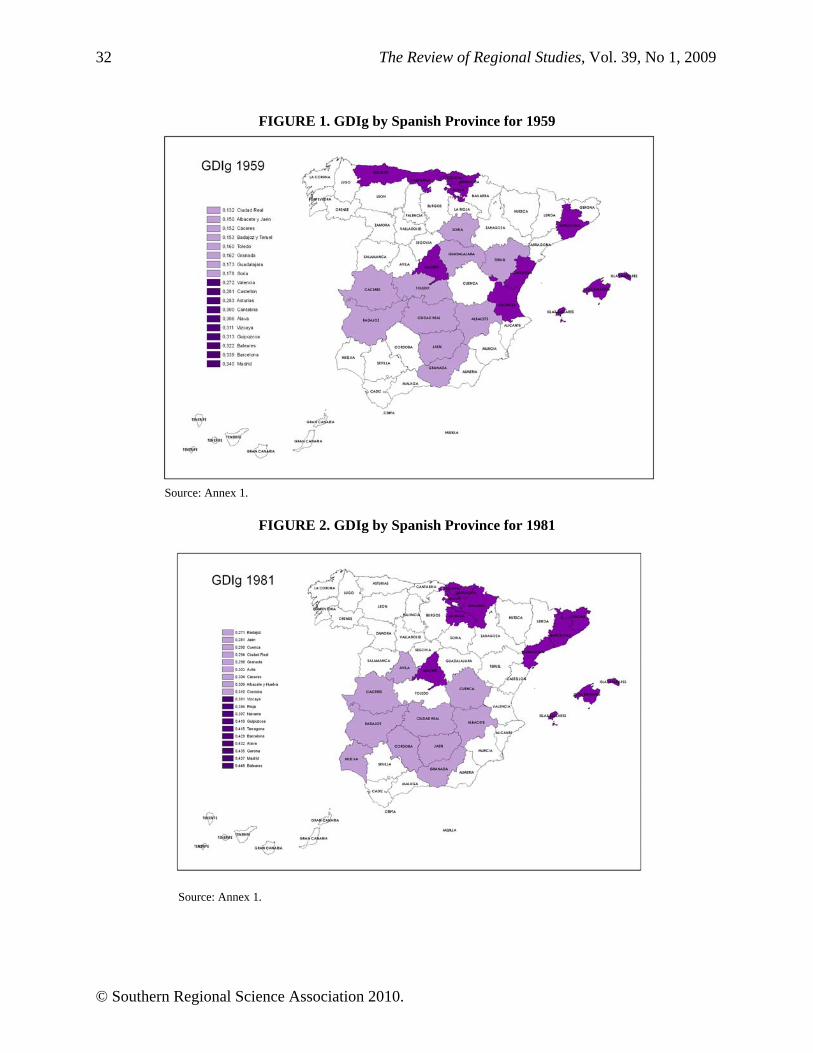
On the other hand, provinces with higher-than-average levels of gender development tend to be in Spain’s more developed north (e.g., Madrid, Cataluña, and País Vasco), with the exceptions of Castellón and Valencia in 1959 in the region of Comunidad Valenciana. Provinces of the Cataluña region (Barcelona, Tarragona, and Gerona) have also had higher-than-average gender development since 1959 along with Madrid, Barcelona, Baleares, Vizcaya, and Álava, provinces with positive net in-migration. (Figures 1, 2, and 3, and Table 4). Figure 4 illustrates the main migration flows among Spain’s regions with 1965 as the base year. The highest flows originated from the poorest regions (Castilla-La Mancha, Extremadura, and Andalucía)—the provinces with the lowest gender development—and moved to wealthier regions, which tend to have higher gender development (País Vasco, Cataluña, Madrid, and Comunidad Valenciana). As pointed out by various studies (García, Greciano, and Raymond, 1999), such internal migration flows helped to induce regional convergence through the end of the 1970s (Guijarro and Hierro, 2007).
It is worth noting the cases of Navarra and La Rioja, which form part of the group of provinces with the highest GDIg since 1981. In these largely agrarian provinces, female employment rates are under-registered, influencing the index. With structural change, female employment rises as women seek work in manufacturing sectors and perhaps more so in service sectors, which exerts a positive effect upon the GDP component of GDIg.
2 The concentration of land ownership is significantly and negatively related to the education level of the population and predicts, in the long run, slower economic growth, especially in developing economies and, within them, rural areas (Barro, 2000; Thorbecke and Charumilind, 2002; Ghosh and Pal, 2004).
32 The Review of Regional Studies, Vol. 39, No 1, 2009
© Southern Regional Science Association 2010.
FIGURE 1. GDIg by Spanish Province for 1959
Source: Annex 1.
FIGURE 2. GDIg by Spanish Province for 1981
Source: Annex 1.

DOMÍNGUEZ & GUIJARRO: GENDER INEQUALITY & ECONOMIC GROWTH 33
© Southern Regional Science Association 2010.
FIGURE 3. GDIg by Spanish Province for 1999
Source: Annex 1.
FIGURE 4: Interprovincial Migration Flows in Spain, 1965-2000
Source: Own elaboration of data from Guijarro and Hierro (2007).

34 The Review of Regional Studies, Vol. 39, No 1, 2009
© Southern Regional Science Association 2010.
TABLE 4. Ten Provinces with Least and Most Gender Development (GDIg), 1959, 1981, and 1999
1959 1981 1999 Ciudad Real 0.132 Badajoz 0.271 Badajoz 0.419 Jaén 0.150 Jaén 0.281 Granada 0.423 Albacete 0.150 Cuenca 0.290 Cádiz 0.429 Cáceres 0.152 Ciudad Real 0.294 Jaén 0.429 Teruel 0.153 Granada 0.298 Sevilla 0.430 Badajoz 0.153 Ávila 0.303 Cuenca 0.434 Toledo 0.160 Cáceres 0.304 Córdoba 0.442 Granada 0.162 Albacete 0.309 Ciudad Real 0.449 Guadalajara 0.173 Huelva 0.309 Albacete 0.450 Soria 0.178 Córdoba 0.310 Zamora 0.450 Spain 0.257 Spain 0.381 Spain 0.510 Madrid 0.340 Baleares 0.448 Álava 0.580 Barcelona 0.339 Madrid 0.437 Gerona 0.578 Baleares 0.322 Gerona 0.435 Madrid 0.567 Guipúzcoa 0.313 Álava 0.432 Barcelona 0.561 Vizcaya 0.311 Barcelona 0.429 Baleares 0.558 Álava 0.306 Tarragona 0.415 Rioja 0.553 Cantabria 0.300 Guipúzcoa 0.410 Navarra 0.552 Asturias 0.283 Navarra 0.397 Tarragona 0.549 Castellón 0.281 Rioja 0.394 Vizcaya 0.542 Valencia 0.272 Vizcaya 0.391 Zaragoza 0.537
Source: Annexes 1 and 2.
Unfortunately, it appears that RSW’s performance in at least ten of Spain’s provinces somewhat weakens the value of the GDIg as an indicator. Some of its performance is confirmatory, however. Several provinces with a lower RSW are in southern Spain (in the regions of Castilla-La Mancha, Extremadura, and Andalucía). An exception is Teruel, one of five that have been in this sector from 1959 to 1999. The others are Ciudad Real, Albacete, Badajoz, and Jaén, all of which demonstrate negative domestic net migration during the period. Conversely, provinces with a greater RSW in northern Spain since 1959 are Pontevedra, Barcelona, Baleares, Vizcaya, and Álava, which demonstrate positive domestic net migration (Table 5). Still, there are the exceptions. The high position of the Galician provinces (La Coruña, Lugo, Orense, and Pontevedra) in the rankings appears to be caused by the greater weight that the RSW gives to the income component and to female labor-force participation rates. Hence, since it fails to account for wage differentials, the validity of RSW as an indicator of gender disparities may need cautious consideration (Dijkstra and Hanmer, 2000). In fact, all the exploratory analysis adjustments concerning inequality and growth are weakened with the incorporation of RSW data.
The triple convergence process that we have analyzed has been in concert with GDP per capita. Growth in income appears to have stimulated improvements in both GDIg and HDIg (Table 6). Changes over time in Spearman’s rank correlation coefficients between each of the two indices and GDP suggest that economic growth has not benefited men and women equally,

DOMÍNGUEZ & GUIJARRO: GENDER INEQUALITY & ECONOMIC GROWTH 35
© Southern Regional Science Association 2010.
TABLE 5. Ten Spanish Provinces with Lowest and Highest RSW in 1959, 1981, and 1999
1959 1981 1999 Ciudad Real 0.621 Ciudad Real 0.682 Cuenca 0.790 Jaén 0.624 Jaén 0.685 Ciudad Real 0.801 Albacete 0.627 Cuenca 0.689 Zamora 0.813 Toledo 0.638 Albacete 0.703 Jaén 0.819 Teruel 0.641 Badajoz 0.704 Toledo 0.836 Córdoba 0.644 Toledo 0.705 Teruel 0.839 Granada 0.647 Ávila 0.709 Guadalajara 0.842 Cáceres 0.649 Córdoba 0.710 Badajoz 0.842 Badajoz 0.649 Huelva 0.711 Albacete 0.843 Guadalajara 0.651 Teruel 0.713 Murcia 0.851 Spain 0.709 Spain 0.758 Spain 0.875 La Coruña 0.800 Pontevedra 0.797 Gerona 0.912 Pontevedra 0.792 Guipúzcoa 0.794 Pontevedra 0.903 Cantabria 0.776 Lugo 0.792 Orense 0.902 Barcelona 0.772 Madrid 0.790 Vizcaya 0.902 Álava 0.757 Barcelona 0.784 Baleares 0.901 Madrid 0.754 Álava 0.783 Álava 0.899 Baleares 0.754 Gerona 0.780 Lugo 0.896 Guipúzcoa 0.751 Navarra 0.780 Las Palmas 0.896 Asturias 0.745 Baleares 0.779 Tarragona 0.896 Vizcaya 0.742 Vizcaya 0.778 Barcelona 0.895
Source: Annexes 1 and 2.
Table 6. Correlation of Economic Growth and Gender and Human Progress in Spain, 1959-1999
Coefficient t value p-value GDIg 0.711 7.007 0.000 HDIg 0.953 21.923 0.000 RSW 0.376 2.812 0.002
Note Spearman’s rank coefficients amongst per capita GDP variation rates, 1959-1999. The p-value is obtained considering the alternative hypothesis 0 .
Source: Annexes 1 and 2. For per capita GDP data see BBVA Foundation (1999-2000).
although it does suggest that the gap between them has reduced. This could partly explain the poor intertemporal adjustment displayed by the RSW (no improvement from 1959-1981, 0.344, or from 1981-1999, -0.023.)
Analysis of the relationship between gender inequality and growth yields results contrary to those outlined in neo-Keynesian literature. This can largely be explained by the levels of GDP per capita of Spanish provinces; the usual linkages between inequality and lower growth rates do appear to exist in Spain (Barro, 2000). The GDIg, HDIg, and RSW values in the first year of study all have a negative and statistically significant correlation with long-term per capita GDP growth rates. (That is, provinces with the highest levels of growth were those with an initially lower level of human development or greater gender inequality.) Still, the set of provinces at the

36 The Review of Regional Studies, Vol. 39, No 1, 2009
© Southern Regional Science Association 2010.
extremes of GDP-growth ranking remained quite stable over the study period.3 Analysis of GII yields similar findings: provinces with higher levels of growth early on tended to have more gender inequality at the start and, therefore, also a higher GII. The relationships highlight the period of greatest positive influence as that between 1959 and 1981. This highlights the importance of exploring the relationship between domestic migration and inequality reduction. Migration is clearly a possible key element that can induce convergence according to Hirschman’s (1993) reflections on the voice strategy of migration (García, Greciano, and Raymond, 1999; Raymond, 2002).4 Finally, it is important to emphasize that inequality in human development has a greater influence on growth than gender inequality (Table 7).
6. CONCLUSIONS
The principle contribution of the research presented here is the inclusion of a spatial analysis of inequality and gender convergence in the development transition process of Spanish provinces. Spain is a country that, over the course of 50 years, has emerged from being somewhat economically backward with rather low human and gender development to find itself now “catching-up” rather rapidly, gaining higher levels of human and gender development. This paper presents geometric variants of United Nation’s HDI and GDI to demonstrate what occurred internally in Spain during this period of economic shift. The variants are the HDIg and the GDIg, which incorporate indicators that directly measure gender inequality, such as the RSW and the GII for 1959, 1981, and 1999.
The main research results can be summarized in five parts. First, it appears that the RSW may have rather poor analytical properties. Second, the results highlight interprovincial -convergence of all indices, an association between lower initial index levels and their increase, and a reduction in gender inequality, which we call -convergence. There is also a certain north-south stability among the provinces at the extremes of the GDI distribution for the entire period, coinciding with the different provincial GDP per capita levels and confirming the existence of convergence clubs also from the perspective of gender inequalities.
Table 7. Correlation of Gender Inequality and Economic Growth in Spain by Period
1959-1999 1959-1981 1981-1999 Coefficient t value Coefficient t value Coefficient t value GDIg -0.611 -5.343* -0.597 -5.151* -0.246 -1.757** HDIg -0.645 -5.850* -0.610 -5.339* -0.252 -1.804** RSW -0.500 -3.995* -0.498 -3.981* -0.186 -1.311*** GII 0.509 4.097* 0.497 3.964* 0.166 1.166
Notes: Spearman’s rank coefficients amongst initial values and per capita GDP variation rates. The p-value is obtained considering the alternative hypothesis 0 for GDIg, HDIg and RSW, and 0 for GII. *Significant at 1%; ** significant at 5%; *** significant at 10%. Source: Annexes 1 and 2. For per capita GDP data see BBVA Foundation (1999, 2000).
3 The existence of convergence clubs where countries polarize in distributions integrated by rich and poor (Quah, 1996) is confirmed for the Spanish provinces by Villaverde and Sánchez-Robles (1998). 4 Population decline (in absolute or relative terms) of provinces with negative domestic net migration contributed in numerous provinces to the establishment of convergence patterns and structural change by default (Collantes and Domínguez, 2006).

DOMÍNGUEZ & GUIJARRO: GENDER INEQUALITY & ECONOMIC GROWTH 37
© Southern Regional Science Association 2010.
Third, related to the direction and relationships between gender inequality and economic growth, we find that GDP growth appears to stimulate improvements in GDI and HDI and to reduce the gap between them. In addition, the GDIg, HDIg, and RSW values in the first year of study showed a negative and statistically significant correlation with the long-term per capita GDP growth rates, although extreme rankings (the highest and lowest) revealed considerable stability. The findings for GII were similar: provinces with higher levels of growth tended to have greater gender inequality and therefore higher GIIs. The relationships underline the greatest positive influence between 1959 and 1981. Fourth, we show that inequality in human development tended to have a greater influence on growth than gender development. Finally, we find that life expectancy and education components on the Spanish GDIg are greater than 100 for the three study years, 1959, 1981, and 1999 (although the results present a downward trend: 294, 217, and 177 for life expectancy and 345, 246, and 190 for education, respectively) whereas the income component is well below 100 (although presenting an upward trend: 10, 19, and 30).
Future research should further address the hypotheses that gender inequality induces internal migration or, alternatively, that internal migration causes gender inequality. It could also create a body of evidence to develop a more definitive range for the elasticities of GDP per capita upon the various indices.
Although we contend that our results are important, we do so recognizing they are truly provisional since they should rely on a more appropriately devised set of interprovincial wage differentials. Such differentials could be obtained by applying a national calculation based on the industrial structure of both male and female employment and gross value added by province.
REFERENCES
Bakker, Isabella. (2000) “Development Policies,” in Janice Peterson and Margaret Lewis (eds), The Elgar Companion to Feminist Economics. Edward Elgar Publishing: Cheltenham, pp. 95–107.
Bardhan, Kalpana and Stephan Klasen. (1999) “UNDP’s Gender-Related Indexes: A Critical Review,” World Development, 27, 985–1010.
Barro, Robert J. (2000) “Inequality and Growth in a Panel of Countries,” Journal of Economic Growth, 5, 5–32.
Basu, Saswati and Parikshit Basu. (2005) “Regional Disparity in Australia: Analysis of Gender Development Index,” International Review of Business Research Papers, 1, 56–66.
Benería, Lourdes. (1977). Mujer, economía y patriarcado durante la España franquista. Anagrama: Barcelona.
_____. (1981) “Conceptualizing the Labor Force: The Underestimation of Women's Economic Activities,” Journal of Development Studies, 17(3), 8–28.
_____. (1993) “The Measurement of Women’s Economic Activities: Assessing the Theoretical and Practical Work of Two Decades,” in David A. Westendorff and Dharam P. Ghai (eds), Monitoring Social Progress in the 1990s: Data Constraints, Concerns, and Priorities. United Nations Research Institute for Social Development: Geneva, pp. 263–283.

38 The Review of Regional Studies, Vol. 39, No 1, 2009
© Southern Regional Science Association 2010.
_____. (2000) “Structural Adjustment Policies,” in Janice Peterson and Margaret Lewis (eds), The Elgar Companion to Feminist Economics. Edward Elgar Publishing: Cheltenham, U.K., pp. 687–695.
Berik, Günseli. (2000) “Globalization,” in Janice Peterson and Margaret Lewis (eds), The Elgar Companion to Feminist Economics. Edward Elgar Publishing: Cheltenham, U.K., pp. 402–411.
Boserup, Esther. ([1970] 1989) Woman's Role in Economic Development. Earthscan Publications: London.
_____. (1987) “Inequality between the Sexes,” in John Eatwell, Murray Milgate, and Peter Newman (eds), The New Palgrave Dictionary of Economics. Cambridge University Press: London, pp. 824–827
Buvinic, Mayra and Rekha Mehra. (1990) “Women and Agricultural Development,” in Carl K. Eicher and John M. Staatz (eds), Agricultural Development in the Third World. The Johns Hopkins University Press: Baltimore-London.
Capel, Rosa María. (1999) Mujer y trabajo en el siglo XX. Arco: Valladolid.
Cloud, Kathleen and Nancy Garrett. (1997) “A Modest Proposal for Inclusion of Women’s Household Human Capital Production in Analysis of Structural Transformation,” Feminist Economics, 3, 151–177.
Collantes, Fernando and Rafael Domínguez. (2006) “La demografía importa: Convergencia y cambio estructural por defecto en las regiones y provincias españolas, 1959-1999,” Problemas del Desarrollo: Revista Latinoamericana de Economía, 37(146), 147–168.
Condorcet, Marie Jean Antoine Nicholas. (1795) Sketch for a Historical Picture of the Progress of the Human Mind (Translated by June Barraclough in 1955). Weidenfeld & Nicolson: London.
Deininger, Klaus W. and Lyn Squire. (1997) “Economic Growth and Income Inequality: Re-examining the Links,” Finance and Development, 34, 38–41.
_____. (1998) “New Ways of Looking at Old Issues: Inequality and Growth,” Journal of Development Economics, 57, 259–287.
Devolder, Daniel. (1986) “Tablas de Mortalidad Provinciales, 1976-80,” Papeles de Demografia. Documento de Trabajo, Centre d'Estudis Demogràfics 15.
Dijkstra, A. Geske. (2006) “Towards a Fresh Start in Measuring Gender Equality: A Contribution to the Debate,” Journal of Human Development, 7, 275–283.
Dijkstra, A. Geske and Lucia C Hanmer. (2000) “Measuring Socio-Economic Gender Inequality: Toward an Alternative to the UNDP Gender-Related Development Index,” Feminist Economics, 6, 41–75.
Dixon, Ruth B. (1982) “Women in Agriculture: Counting the Labor Force in Developing Countries,” Population and Development Review, 8, 539–566.
Domínguez, Rafael. (1999) “El Índice Físico de Calidad de Vida en España: Evolución de las Disparidades Espaciales, 1860-1910,” in Jaume Torras and Bartolomé Yun (eds),

DOMÍNGUEZ & GUIJARRO: GENDER INEQUALITY & ECONOMIC GROWTH 39
© Southern Regional Science Association 2010.
Consumo, condiciones de vida y comercialización: Cataluña, Castilla, siglos XVII-XIX. Junta de Castilla y León: Valladolid, pp. 183-204.
_____. (2002b) “Desigualdades Sociales y Crecimiento Económico Regional en España a Largo Plazo,” Revista de Historia Industrial, 22, 177–196.
Domínguez, Rafael and Marta Guijarro. (2000) “Evolución de las disparidades espaciales del bienestar en España, 1860-1930. El Índice Físico de Calidad de Vida,” Revista de Historia Económica, 18(1), 109–137.
_____. (2001) “Hacia una Reconstrucción Normativa del Bienestar: Evolución del Índice Físico de Calidad de Vida en España, 1900-1960,” Estudios de Economía Aplicada, 18, 157–174.
Durán, María Ángeles. (1997) “El Papel de las Mujeres y Hombres en la Economía Española,” Información Comercial Española, 760, 9–42.
Elson, Diane. (1995) “Gender Awareness in Modeling Structural Adjustment,” World Development, 23, 1851–1868.
_____. (2000) “Theories of Development,” in Janice Peterson and Margaret Lewis (eds), The Elgar Companion to Feminist Economics. Edward Elgar Publishing: Cheltenham, U.K., pp. 95–107.
Escudero, Antonio and Hipólito J. Simón (2003) “El Bienestar en España: una Perspectiva a Largo Plazo,” Revista de Historia Económica, 21, 525–565.
Esteve-Volart, Berta. (2009) “Gender Discrimination and Growth: Theory and Evidence from India,” Development Economics Papers Discussion Papers, 42, STICERD, London School of Economics and Political Science, available at http://dept.econ.yorku.ca/~berta/disc-january2009.pdf. Last accessed in March 2010.
Fedderke, Johannes and Robert Klitgaard. (1998) “Economic Growth and Social Indicators: An Exploratory Analysis,” Economic Development and Cultural Change, 46, 455–489.
Firebaugh, Glenn andFrank D. Beck (1994) “Does Economic Growth Benefit the Masses? Growth, Dependence and Welfare in the Third World,” American Sociological Review, 59, 631–653.
Forsythe, Nancy, Roberto Patricio Korzeniewicz and Valerie Durrant. (2000) “Gender Inequalities and Economic Growth: A Longitudinal Evaluation,” Economic Development and Cultural Change, 48, 573–617.
Fukuda-Parr, Sakiko. (2003) “The Human Development Paradigm: Operationalizing Sen´s Ideas on Capabilities,” Feminist Economics, 9, 301–317.
Fundación BBVA. (1999) Renta Nacional de España y su Distribución Provincial. Serie homogénea años 1955 a 1993 y avances 1994 a 1997. Tomo II. Serie por provincias. Fundación BBVA: Bilbao.
_____. (2000) Renta Nacional de España y su Distribución Provincial. Año 1995 y avances 1996-1999. Fundación BBVA: Bilbao.
Galor, Oded and Joseph Zeira. (1993) “Income Distribution and Macroeconomics,” Review of Economic Studies, 60, 35–52.
40 The Review of Regional Studies, Vol. 39, No 1, 2009
© Southern Regional Science Association 2010.
García Greciano, Begoña and José Luis Raymond. (1999) “Las Disparidades Regionales y la Hipótesis de Convergencia: una Revisión,” Papeles de Economía Española, 80, 2–18.
Ghosh, Sugata and Sarmistha Pal. (2004) “The Effect of Inequality on Growth: Theory and Evidence from the Indian States,” Review of Development Economics, 8, 164–177.
Goedhart, Theo, Victor Halberstadt, Arie Kapteyn, and Bernard van Praag (1977) “The Poverty Line: Concept and Measurement,” Journal of Human Resources, 12, 503–520.
Groenewegen, Peter. (2003) “Condorcet and Equality of Sexes: One of Many Fronts for a Great Fighter for Liberty in the Eighteenth Century,” in Robert Dimand and Chris Nyland (eds), The Status of Women in Classical Economic Thought. Edward Elgar Publishing: Cheltenham, U.K., pp. 127–141.
Guijarro, Marta and María Hierro. (2007) “La Inmigración Extranjera y la Convergencia Regional en España,” in Rafael Domínguez (ed), Inmigración: Crecimiento Económico e Integración Social. Universidad de Cantabria. Parlamento de Cantabria: Santander, pp. 47–60.
Hernández, Pedro J. (1995) “Análisis Empírico de la Discriminación Salarial de la Mujer de España,” Investigaciones Económicas, 19, 195–215.
_____. (1996) “Segregación Ocupacional de la Mujer y Movilidad Laboral,” Revista de Economía Aplicada, 11, 57–80.
Hill, M. Anne and Elizabeth M. King (1995) “Women’s Education and Economic Well-being,” Feminist Economics, 1(2), 21–46.
Hirschman, Albert Otto. (1993) “Salida, Voz y Destino de la RDA. Un Ensayo de Historia Conceptual,” in Tendencias Autosubversivas. Ensayos. FCE: México.
IVIE. (2004a) “Componentes del Índice de Desarrollo Humano: la Esperanza de Vida al Nacer,” Capital Humano, 43. Available at: http://www.ivie.es.
_____. (2004b) “El Desarrollo Humano y los Conocimientos: Alfabetización de Adultos,” Capital Humano, 45, Available at: http://www.ivie.es.
_____. (2004c) “El Desarrollo Humano y los Conocimientos: la Matriculación de Alumnos en España,” Capital Humano, 45 Available at: http://www.ivie.es.
_____. (2004d) “La Discriminación de Género en el Acceso a la Riqueza y la Exclusión Social en España,” Capital Humano, 48, Available at: http://www.ivie.es.
_____. (2005a) “El Índice de Desarrollo Humano en España, 1981-2000,” Capital Humano, 49, Available at: http://www.ivie.es.
_____. (2005b) “El Índice de Desarrollo de Género en España, 1981-2000,” Capital Humano, 50, Available at: http://www.ivie.es.
Jameson, Kenneth P. and Charles K. Wilber, eds. (1996): The Political Economy of Development and Underdevelopment. McGraw Hill: New York.
_____. (1993) “Performance in Living Standards: An International Comparison,” Journal of Development Economics, 41, 307–336.

DOMÍNGUEZ & GUIJARRO: GENDER INEQUALITY & ECONOMIC GROWTH 41
© Southern Regional Science Association 2010.
Klasen, Stephan. (2002) “Low Schooling for Girls, Slower Growth for All? Cross-Country Evidence on the Effect of Gender Inequality in Education on Economic Development,” World Bank Economic Review, 16, 345–373.
_____. (2006) “UNDP´s Gender-related Measures: Some Conceptual Problems and Possible Solutions,” Journal of Human Development, 7, 243–274.
Lagerlöf, Nils-Petter. (2003) “Gender Equality and Long-Run Growth,” Journal of Economic Growth, 8, 403–426.
Lago, Ignacio. (2002) “La Discriminación Salarial por Razones de Género: un Análisis Empírico del Sector Privado en España,” Revista Española de Investigaciones Sociológicas, 98, 171–176.
Maestro, Irene and Javier Martínez. (2003) “La Pobreza Humana y su Feminización en España y las Comunidades Autónomas,” Revista Española de Investigaciones Sociológicas, 104, 57–89
Mammen, Kristen and Christina Paxson. (2000) “Women’s Work and Economic Development,” Journal of Economic Perspectives, 14(4), 141–164.
Martín, Carlos and Luis Zarapuz. (2000) Empleo y Discriminación Salarial. Un Análisis Desde la Perspectiva de Género. Secretaría Confederal de la Mujer de CC.OO./Forem: Madrid.
Martínez, Javier and Gemma Cairó. (2004) “Gender and Regional Inequality in Human Development: The Case of Spain,” Feminist Economics, 10(1), 37–64.
Mazumdar, Krishna. (1999) “Measuring the Well-Beings of the Developing Countries: Achievement and Improvement Indices,” Social Indicators Research, 47(1), 1–60.
Moltó, María L. in collaboration with Rosario Sánchez. (2002) The Gender Pay Gap in Spain. Report for the European Commission’s Group of Experts “Gender and Employment” http://www.mbs.ac.uk/research/europeanemployment/projects/gendersocial/documents/GPG2002_ES.pdf. Last accessed March 2010.
Morris, Morris David. (1979) Measuring the Condition of the World's Poor: The Physical Quality of Life Index. Overseas Development Council: New York.
Morris, Morris David and Michelle B. McAlpin. (1982) Measuring the Condition of India's Poor. The Physical Quality of Life. Promilla&CO: New Delhi.
Nyland, Chris. (1993) “John Locke and the Social Position of Women,” History of Political Economy, 25, 39–63.
Nordhaus, William D. and James Tobin (1976) “¿Está Anticuado el Crecimiento?,” Revista Española de Economía, 6, 349–375. (published in English in 1973 as “Is Growth Obsolete?,” in Milton Moss, ed., The Measurement of Economic and Social Performance, pp. 509–564.)
Peterson, Janice and Margaret Lewis, eds. (2000) The Elgar Companion to Feminist Economics. Edward Elgar Publishing: Cheltenham.
Pyle, Jean Larson and Gale Summerfield. (2000) “Economic Restructuring,” in Janice Peterson and Margaret Lewis (eds), The Elgar Companion to Feminist Economics. Edward Elgar Publishing: Cheltenham, pp. 289–302.

42 The Review of Regional Studies, Vol. 39, No 1, 2009
© Southern Regional Science Association 2010.
Quah, Danny. (1996) “Empirics for Economic Growth and Convergence,” European Economic Review, 40, 1325–1353.
Ranis, Gustav, Frances Stewart, and Alejandro Ramírez. (2000) “Economic Growth and Human Development,” World Development, 28, 197–219.
Robeyns, Ingrid. (2003) “Sen’s Capability Approach and Gender Inequality: Selecting Relevant Capabilities,” Feminist Economics, 9(2/3), 61–92.
Sagar, Ambuj D. and Adil Najam. (1998) “The Human Development Index: A Critical Review,” Ecological Economics, 25, 249–264.
Seguino, Stephanie. (2000) “Gender Inequality and Economic Growth: A Cross-Country Analysis,” World Development, 28, 1211–1230.
Seers, Dudley. (1972) “What Are We Trying to Measure?,” Journal of Development Studies, 8, 21–36.
Sen, Amartya K. (1976) “Poverty: An Ordinal Approach to Measurement,” Nueva Economía del Bienestar. Escritos Seleccionados. Universidad de Valencia: Valencia, pp. 219–231.
_____. (1979) “Informational Bases of Alternative Welfare Approaches. Aggregation and Income Distribution,” Journal of Public Economics, 3, 387–403.
_____. (1981) “Public Action and the Quality of Life in Developing Countries,” Oxford Bulletin of Economics and Statistics, 43, 287–319.
_____. (1999) “The Possibility of Social Choice,” American Economic Review, 89, 349–378.
Sen, Amartya K. and Sudhir Anand. (1990) “The Concept of Human Development,” Background Paper for the Human Development Report 1990. Available at http://hdr.undp.org/.
_____. (1994a) “Sustainable Human Development: Concepts and Measurement,” Background Paper for the Human Development Report 1994. Available at http://hdr.undp.org/.
_____.. (1994b) “Human Development Index: Methodology and Measurement,” United Nations Development Programme Occasional Paper 12. http://hdr.undp.org/.
_____. (1995): “Gender Inequality in Human Development: Theories and Measurement,” Background Paper for the Human Development Report 1995. Available at http://hdr.undp.org/.
_____. (2000) “The Income Component of the Human Development Index,” Journal of Human Development, 1(1), 83–106.
Silvestre, Javier. (2005) “El Grado de Discriminación Salarial de las Mujeres en España, 1930: una Primera Aproximación,” Investigaciones de Historia Económica, 2, 105 –144.
Stern, David I. (2004) “The Rise and Fall of the Environmental Kuznets Curve,” World Development, 32, 1419–1439.
Schüler, Dana. (2006) “The Uses and Misuses of the Gender-related Development Index and Gender Empowerment Measure: A Review of the Literature,” Journal of Human Development, 7, 161–181.

DOMÍNGUEZ & GUIJARRO: GENDER INEQUALITY & ECONOMIC GROWTH 43
© Southern Regional Science Association 2010.
Smith, Adam. (1776) An Inquiry Into the Nature and Causes of the Wealth of Nations. W. Strahan and T. Cadell: London.
Sutherland, Kathryn. (1995) “Adam Smith's Master Narrative: Women and the Wealth of Nations,” in Stephen Copley and Kathryn Sutherland (eds), Adam Smith's Wealth of Nations. New Interdisciplinary Essays: Manchester, U.K., pp. 97–121.
Thorbecke, Erik and Chutatong Charumilind. (2002) “Economic Inequality and its Socioeconomic Impact,” World Development, 30, 1477–1495.
Torras, Jaime and Bartolomé Yun (eds). (1999) Consumo, Condiciones de Vida y Comercialización: Cataluña y Castilla, siglos XVII-XIX. Junta de Castilla y León: Valladolid.
Ugidos, Arantza. (1997) “Gender Wage Discrimination in the Spanish Labor Market,” Revista Española de Economía, 14(1), 3–21.
UNDP (1990) Human Development Report. Concept and Measurement of Human Development. Oxford University Press: New York.
_____. (1995) Human Development Report. Gender and Human Development. Oxford University Press: New York.
Usher, Dan. (1973) “An Imputation to the Measure of Economic Growth for Changes in Life Expectancy,” in Milton Moss (ed), The Measurement of Economic and Social Performance. Columbia University Press: New York, pp. 193-232.
Westendorff, David and Dharam Ghai (eds). (1993) Monitoring Social Progress in the 1990s. Data Constraints, Concerns and Priorities. Aldershot: Avebury.
Villaverde, José and Blanca Sánchez-Robles. (1998) “Disparidades Provinciales y Clubes de Convergencia en España,” Estudios Regionales, 52, 177–199.
Villota, Paloma de. (1999) “Reflexiones Sobre el IDH Relacionado Con el IDM-IDG del PNUD. La Desigualdad de Género en España” in Paloma de Villota (ed), Globalización y Género. Síntesis: Madrid, pp. 109–166.

44 The Review of Regional Studies, Vol. 39, No 1, 2009
© Southern Regional Science Association 2010.
APPENDIX: Calculating the HDI and the GDI5
The HDI measures the average of three dimensions of human development: health (measured by life expectancy at birth), knowledge (adult literacy and gross rate of primary, secondary and tertiary schooling) and standard of living (GDP per capita). Before the HDI is calculated, these three dimensions are expressed as a value between 0 and 1 by the general formula:
(6) valueminimum-luemaximun va
lueminimun va- valueactualindexdimension
The maximum and minimum (goalpost) values are 85 and 25 years for life expectancy at birth, 100 percent and 0 percent for adult literacy rate and combined gross enrolment ratio and 40,000 and 100 PPP US$ for GDP per capita.
Then, the HDI is a simple average of the three dimension indices.
The construction of the GDI has three steps. First, the dimension indices are calculated for females and males, according to the former formula; the maximum and minimum values for life expectancy at birth are 87.5 and 27.5 for women and 82.5 and 22.5 for men. Second, if MH and WH are, respectively, the dimension indices for men and women in the health component and Mp and Wp their populations shares, the equally distributed index is the harmonic mean:
(7) 111 MMFFH HpHpI
Analogously, KI and YI are the equally distributed indices for education and standard of living. Finally, the GDI is a simple arithmetic mean of the three equally distributed indices:
(8) 3GDI YKH III
The GDI geometric variant, GDIg, is the geometric mean of the three equally distributed indices:
(9) 31GDIg YKH III .
5 See UNDP (1995) for further information about the process used to construct the indices.

DOMÍNGUEZ & GUIJARRO: GENDER INEQUALITY & ECONOMIC GROWTH 45
© Southern Regional Science Association 2010.
ANNEX 1. GDIg and HDIg for Spanish Provinces
Provinces and regions GDIg
1959
GDIg
1981
GDIg
1999
HDIg
1959
HDIg
1981
HDIg
1999 Andalucía Almería 0.196 0.317 0.469 0.250 0.373 0.479Cádiz 0.187 0.311 0.429 0.273 0.377 0.442Córdoba 0.187 0.310 0.442 0.260 0.362 0.452Granada 0.162 0.298 0.423 0.246 0.348 0.434Huelva 0.183 0.309 0.450 0.259 0.386 0.463Jaén 0.150 0.281 0.429 0.239 0.351 0.445Málaga 0.195 0.340 0.459 0.273 0.386 0.469Sevilla 0.226 0.328 0.430 0.284 0.377 0.441Aragón Huesca 0.185 0.378 0.514 0.312 0.445 0.524Teruel 0.153 0.348 0.510 0.266 0.423 0.526Zaragoza 0.262 0.389 0.537 0.326 0.438 0.551Asturias (Principado) Asturias 0.283 0.380 0.480 0.325 0.433 0.490Baleares (Illes) Baleares 0.322 0.448 0.558 0.351 0.485 0.565Canarias Palmas, Las 0.221 0.370 0.491 0.288 0.418 0.501Santa Cruz T 0.218 0.365 0.483 0.279 0.415 0.497Cantabria (Comunidad) Cantabria 0.300 0.388 0.496 0.331 0.436 0.514Castilla y León Avila 0.192 0.303 0.474 0.252 0.377 0.487Burgos 0.220 0.372 0.533 0.293 0.423 0.543León 0.190 0.364 0.487 0.283 0.405 0.496Palencia 0.215 0.357 0.500 0.280 0.418 0.518Salamanca 0.214 0.340 0.501 0.287 0.398 0.511Segovia 0.191 0.335 0.506 0.286 0.405 0.517Soria 0.178 0.339 0.509 0.271 0.392 0.523Valladolid 0.236 0.374 0.518 0.306 0.433 0.529Zamora 0.187 0.322 0.450 0.268 0.366 0.477Castilla-La Mancha Albacete 0.150 0.305 0.450 0.245 0.363 0.461Ciudad Real 0.132 0.294 0.449 0.237 0.371 0.470Cuenca 0.199 0.290 0.434 0.245 0.360 0.458Guadalajara 0.173 0.365 0.521 0.281 0.427 0.538Toledo 0.160 0.325 0.467 0.255 0.388 0.480Cataluña Barcelona 0.339 0.429 0.561 0.369 0.463 0.570Gerona 0.306 0.435 0.578 0.344 0.471 0.584

46 The Review of Regional Studies, Vol. 39, No 1, 2009
© Southern Regional Science Association 2010.
Lérida 0.247 0.388 0.532 0.312 0.438 0.541Tarragona 0.259 0.415 0.549 0.328 0.467 0.557Valenciana (Comunidad) Alicante 0.248 0.381 0.496 0.303 0.426 0.504Castellón 0.281 0.383 0.537 0.314 0.430 0.547Valencia 0.272 0.381 0.517 0.333 0.426 0.529Extremadura Badajoz 0.153 0.271 0.419 0.241 0.345 0.433Cáceres 0.152 0.304 0.463 0.237 0.362 0.474Galicia Coruña (La) 0.270 0.372 0.490 0.282 0.405 0.496Lugo 0.227 0.351 0.466 0.260 0.371 0.470Orense 0.195 0.318 0.466 0.252 0.354 0.468Pontevedra 0.270 0.375 0.486 0.284 0.400 0.490Madrid (Comunidad) Madrid 0.340 0.437 0.567 0.385 0.473 0.577Murcia (Región de) Murcia 0.213 0.337 0.470 0.270 0.390 0.483Navarra (Comunidad) Navarra 0.256 0.397 0.552 0.328 0.442 0.564País Vasco Álava 0.307 0.432 0.580 0.347 0.478 0.586Guipúzcoa 0.313 0.410 0.534 0.366 0.450 0.541Vizcaya 0.311 0.391 0.542 0.367 0.440 0.548Rioja (Comunidad) La Rioja 0.260 0.394 0.553 0.318 0.439 0.569Spain 0.257 0.381 0.510 0.309 0.424 0.521
Source: own elaboration
DOMÍNGUEZ & GUIJARRO: GENDER INEQUALITY & ECONOMIC GROWTH 47
© Southern Regional Science Association 2010.
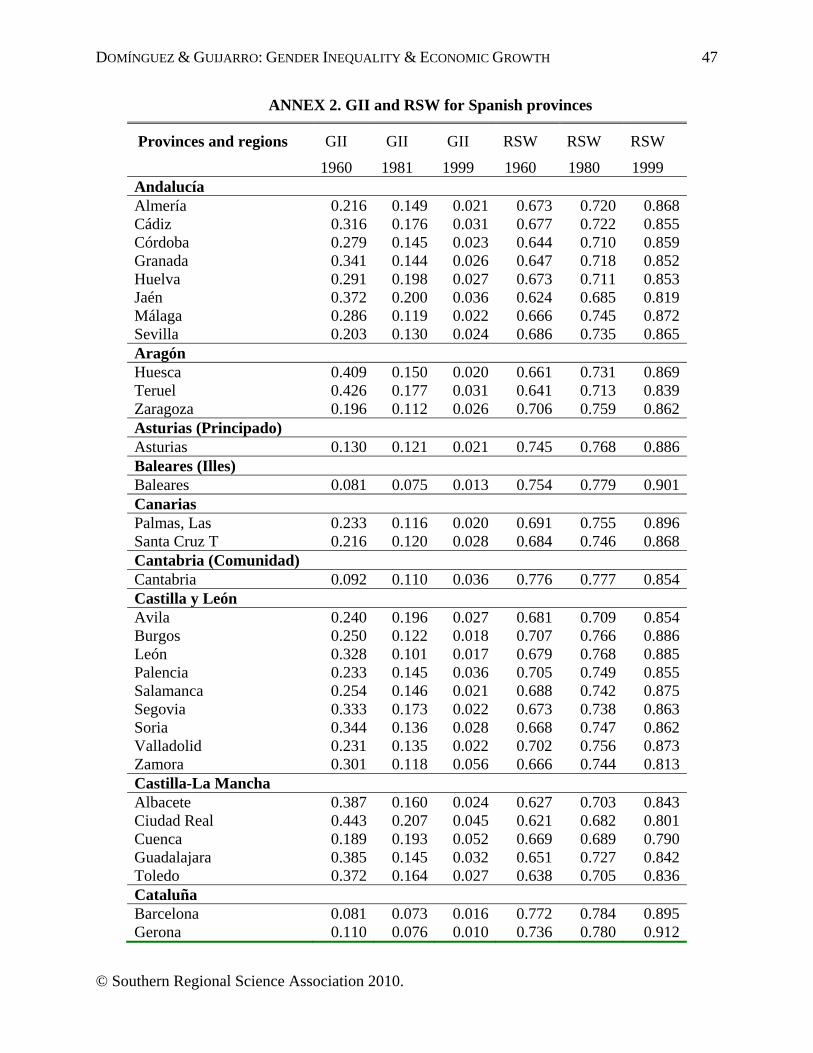
ANNEX 2. GII and RSW for Spanish provinces
Provinces and regions GII
1960
GII
1981
GII
1999
RSW
1960
RSW
1980
RSW
1999 Andalucía Almería 0.216 0.149 0.021 0.673 0.720 0.868Cádiz 0.316 0.176 0.031 0.677 0.722 0.855Córdoba 0.279 0.145 0.023 0.644 0.710 0.859Granada 0.341 0.144 0.026 0.647 0.718 0.852Huelva 0.291 0.198 0.027 0.673 0.711 0.853Jaén 0.372 0.200 0.036 0.624 0.685 0.819Málaga 0.286 0.119 0.022 0.666 0.745 0.872Sevilla 0.203 0.130 0.024 0.686 0.735 0.865Aragón Huesca 0.409 0.150 0.020 0.661 0.731 0.869Teruel 0.426 0.177 0.031 0.641 0.713 0.839Zaragoza 0.196 0.112 0.026 0.706 0.759 0.862Asturias (Principado) Asturias 0.130 0.121 0.021 0.745 0.768 0.886Baleares (Illes) Baleares 0.081 0.075 0.013 0.754 0.779 0.901Canarias Palmas, Las 0.233 0.116 0.020 0.691 0.755 0.896Santa Cruz T 0.216 0.120 0.028 0.684 0.746 0.868Cantabria (Comunidad) Cantabria 0.092 0.110 0.036 0.776 0.777 0.854Castilla y León Avila 0.240 0.196 0.027 0.681 0.709 0.854Burgos 0.250 0.122 0.018 0.707 0.766 0.886León 0.328 0.101 0.017 0.679 0.768 0.885Palencia 0.233 0.145 0.036 0.705 0.749 0.855Salamanca 0.254 0.146 0.021 0.688 0.742 0.875Segovia 0.333 0.173 0.022 0.673 0.738 0.863Soria 0.344 0.136 0.028 0.668 0.747 0.862Valladolid 0.231 0.135 0.022 0.702 0.756 0.873Zamora 0.301 0.118 0.056 0.666 0.744 0.813Castilla-La Mancha Albacete 0.387 0.160 0.024 0.627 0.703 0.843Ciudad Real 0.443 0.207 0.045 0.621 0.682 0.801Cuenca 0.189 0.193 0.052 0.669 0.689 0.790Guadalajara 0.385 0.145 0.032 0.651 0.727 0.842Toledo 0.372 0.164 0.027 0.638 0.705 0.836Cataluña Barcelona 0.081 0.073 0.016 0.772 0.784 0.895Gerona 0.110 0.076 0.010 0.736 0.780 0.912

48 The Review of Regional Studies, Vol. 39, No 1, 2009
© Southern Regional Science Association 2010.
Lérida 0.210 0.115 0.017 0.694 0.748 0.883Tarragona 0.210 0.113 0.013 0.690 0.749 0.896Valenciana (Comunidad) Alicante 0.181 0.106 0.016 0.699 0.750 0.884Castellón 0.108 0.111 0.020 0.722 0.744 0.872Valencia 0.183 0.104 0.022 0.698 0.755 0.870Extremadura Badajoz 0.364 0.213 0.031 0.649 0.704 0.842Cáceres 0.361 0.159 0.023 0.649 0.714 0.856Galicia Coruña (La) 0.040 0.080 0.012 0.800 0.776 0.888Lugo 0.129 0.054 0.009 0.718 0.792 0.896Orense 0.225 0.103 0.005 0.674 0.753 0.902Pontevedra 0.047 0.061 0.008 0.792 0.797 0.903Madrid (Comunidad) Madrid 0.117 0.076 0.018 0.754 0.790 0.891Murcia (Región de) Murcia 0.213 0.137 0.027 0.673 0.723 0.851Navarra (Comunidad) Navarra 0.220 0.100 0.022 0.719 0.780 0.878País Vasco Álava 0.115 0.096 0.010 0.757 0.783 0.899Guipúzcoa 0.145 0.088 0.014 0.751 0.794 0.890Vizcaya 0.155 0.111 0.011 0.742 0.778 0.902Rioja (Comunidad) Rioja 0.183 0.103 0.029 0.719 0.768 0.858Spain 0.168 0.104 0.020 0.709 0.758 0.875
Source: own elaboration