
Gender Impacts of ITS FINAL
42
Assessment of Gender Impacts of ITS 2016 Public Disclosure Authorized Public Disclosure Authorized Public Disclosure Authorized Public Disclosure Authorized
Transcript of Gender Impacts of ITS FINAL
Assessment of Gender Impacts of ITS
2016
Pub
lic D
iscl
osur
e A
utho
rized
Pub
lic D
iscl
osur
e A
utho
rized
Pub
lic D
iscl
osur
e A
utho
rized
Pub
lic D
iscl
osur
e A
utho
rized
Content
Introduction .................................................................................................................. 4
Chapter One Overview ................................................................................................ 5
1 ITS in China ................................................................................................................ 5
2 Gender and Urban Transportation ........................................................................... 6
2.1 Gender Mainstreaming ........................................................................................ 6
2.2 Gender Differences in Travel Behavior and Patterns .......................................... 7
2.3 Gender and ITS .................................................................................................... 8
3 Research Method ........................................................................................................ 8
3.1 Research Object ................................................................................................... 9
3.2 Survey Method .................................................................................................... 9
3.3 Report Structure ................................................................................................. 12
Chapter Two Gender Analysis on Travel Characteristics of Residents ................ 14
1 An Overview of Resident Travel Patterns in Two cities ........................................ 14
1.1 Wuhan ................................................................................................................ 14
1.2 Urumqi ............................................................................................................... 14
2 The comparison on trip purpose and time distribution by gender ...................... 15
2.1 Primary daily trips purposes .............................................................................. 15
2.2 Trip chains of respondents surveyed the day before .......................................... 17
3 The comparison on trip frequency, duration and cost by gender ........................ 18
4 The comparison of mode choice by gender ............................................................ 20
5 Gender comparison: multi-oriented travel requirements ..................................... 21
5.1 What factors do people concern about for travel ............................................... 21
5.2 Females support safety measures more ............................................................. 22
5.3 Difference in setback experience in transport safety by gender ........................ 23
Chapter Three the Evaluation of ITS and Gender ................................................. 26
1 Bus dispatching management and passenger information service system .......... 26
1.1 Bus dispatching and management system ......................................................... 26
1.2 Passenger information service system ............................................................... 26
2 Public Transport IC card ......................................................................................... 29
2.1 IC card ownership .............................................................................................. 29
2.2 Real name system of IC card ............................................................................. 29
2.3 Way of swiping IC card ..................................................................................... 30
2.4 Recharging the IC card ...................................................................................... 31
3 CCTV for Public Transport ..................................................................................... 31
4 Traffic Signal System ............................................................................................... 33
5 E-Police ...................................................................................................................... 34
6 Parking guidance system ......................................................................................... 35
7 VMS for Traffic Information ................................................................................... 36
8 Positioning and Navigation ...................................................................................... 37
Ethnic minority and Transport ........................................................................................ 38

Chapter Four Conclusion .......................................................................................... 40
1 Research Findings .............................................................................................. 40
1.1 Travel Characteristics by Gender....................................................................... 40
1.2 ITS is Using Technology to Bridge the Gender Inequality ................................ 40
2 Gender Issues in ITS Development – Raising Gender Awareness ................. 41
3 Issues to be Studied ............................................................................................ 41
P a g e | 4
Introduction
The World Bank and China has over 30 years of partnership and this partnership has evolved
over time. In the early years, the World Bank shared its global knowledge with China on
infrastructure development and institutional capacity building, which contributed to shaping
China’s modernization and development. In recent years, the learning became more mutual and
the World Bank is drawing from China’s experience in a range of development areas to help
other developing countries to reduce poverty.
Today, many Chinese cities are making significant investment in Intelligent Transport Systems
(ITS) and the scale is among the largest in all countries. The World Bank is supporting over 20
urban transport projects in China. The majority of these projects have ITS components such as
bus dispatching system, IC card system, CCTV monitoring system, and etc., providing people
with better reliability and more convenience in public transport services, and enhancing their
safety and security in daily commuting.
Men and women have different transport needs, travel patterns and behavior. There is a growing
effort in many countries to address gender aspects in urban transport planning and design. There
is, however, a lack of evident data and systematic knowledge about the gender dimensions of
ITS. Little analytical work has been conducted to collect gender-disaggregated feedback on ITS
applications in urban transport. Moreover, there is a knowledge gap in how to maximize the
benefits of ITS through incorporating gender-specific needs during the planning, design,
implementation, and operation stages.
This study uses Wuhan and Urumqi as two case studies to evaluate the gender impacts of their
existing urban transport ITS, by adopting methods of survey and focus group discussion. Under
the support of the World Bank, Urumqi and Wuhan have completed its first Bank-financed ITS
construction in 2007 and 2010 respectively. They are now proposing to expand or upgrade ITS
in their new Bank-financed projects. Taking advantage of this good opportunity, our team
visited two case study cities and explored impacts of ITS on gender. The findings suggest that
men and women have unique travel patterns and transport demands, which result in special
requirements of ITS; the findings also suggest that ITS can play a significant role in filling the
gender gap in urban transport. In addition to improving infrastructure and intelligent transport
facilities, the pressing issue is to build gender awareness for policy makers and practitioners
and mainstream gender in transport and ITS.
The study is funded by the Umbrella Facility for Gender Equality (UFGE) in East Asia Pacific
(EAP), which aims at strengthening capacity for gender-informed operations and policy making
in EAP countries. Besides this report, the team has also developed a technical guideline to better
incorporate gender considerations in ITS planning, design, implementation and operation.

P a g e | 5
Chapter One Overview
1 ITS in China
Intelligent Transport Systems (ITS) in urban transport are a set of transport planning,
traffic management, transport operation and customer service applications that are
enabled by advanced information and communications technologies (ICT). They act to
enhance the effectiveness, efficiency, safety and usability of transport services for urban
transport authorities, operators and users.
China began developing ITS in urban transport in early 1990s. During the initial stage,
most of the investments were stand-alone systems that assist respective local transport
authorities to manage traffic (e.g. Area Traffic Control System) or operate transport
services (e.g. Bus Locating and Dispatching System). Later when national ITS
standards and system architecture became available, cities aligned their ITS sub-
systems with the standardized system architecture and developed short-term and long-
term ITS development plans. During the past decade, local governments have been
making significant investment in various ITS applications, with the objective to
improve and maximize the efficiency of existing urban transport infrastructure. For
instance, the majority of World Bank-financed urban transport projects in China support
ITS development in the cities, with an investment ranging from US$10 to 30 million
over the project period of about 5 years each. A more recent focus of many Chinese
cities is to develop an overarching platform that integrates various ITS applications for
comprehensive resource sharing, processing, dissemination and decision making. In
advanced cities such as Beijing, Shanghai, Shenzhen and Guangzhou, such platforms
are already in function, not only providing transport authorities with effective tools for
traffic management and transport operation, but also making people’s daily commuting
safer, more efficient and better informed.
Generally speaking, urban transport ITS investment in Chinese cities can be divided
into two categories. The first category is ITS for Traffic Management and
Enforcement, which is usually developed and utilized by the Traffic Police Department.
This includes: Traffic Signal Control System, or sometimes Area Traffic Control
System; CCTV Monitoring System, E-Police for enforcement of speeding, red-light
running, and lane violation, Incident Detection System, Variable Message Signs, and
Parking Guidance System, etc. The second category is ITS for Public Transport
Operations, Management and Passenger Services, which is usually developed and
operated by the Transport Commission/Bureau and Bus Company. This includes Bus
Locating and Dispatching System, IC Card System, Passenger Information System,
Electronic Bus Signs, CCTV Monitoring System in bus vehicles or at bus stops, and
Passenger Counting System, etc.
In addition, recent development in GPS and mobile phone based applications also
provide the public with personal travel assistance such as Navigation System, Trip
Planning Software and Taxi Apps. These services are believed to have great market

P a g e | 6
potentials in China, and meanwhile re-shaping people’s travel behaviors and patterns.
2 Gender and Urban Transportation
As public goods, urban transport affects everyone. The seemingly equal supply of
public goods may increase social inequality due to the differences of social class,
gender and ethnic. Therefore, it is critical for the relevant government departments to
be more sensitive to the potential differences of gender, age, class, urban and rural areas
and ethnic in the design and construction of urban transport, and carry out impact
evaluation of projects in terms of social inequality alleviation.
2.1 Gender Mainstreaming
The word gender is often intended to emphasize the social and cultural, as opposed to
the biological, distinctions between the sexes. Gender is used to describe the character,
role, activity and responsibility of a group with specific gender in the society1. Together
with the other social stratification elements such as age, race, income, education levels,
social gender shapes the individual aspects of the living world, affecting people’s
behavior. Therefore, as one of the most common daily activities, travel is subject to the
impact of individual social gender2 and presents different characteristics.
To make the male and female benefit equally in the transport sector, gender
mainstreaming serves as an important tool in the process of transportation project
planning, implementation, monitoring and evaluation. The United Nations Economic
and Social Council defines gender mainstreaming as: “Mainstreaming a gender
perspective is the process of assessing the implications for women and men of any
planned action, including legislation, policies or programmes, in all areas and at all
levels. It is a strategy for making women's as well as men's concerns and experiences
an integral dimension of the design, implementation, monitoring and evaluation of
policies and programmes in all political, economic and societal spheres so that women
and men benefit equally and inequality is not perpetuated. The ultimate goal is to
achieve gender equality3.”
In the Gender Action Plan: Gender Equality as Smart Economics (World Bank, 2007),
women’s economic empowerment is emphasized to speed up economic. Urban
transport planning and construction are closely linked with people’s work and lives,
affecting the efficiency of commuting, convenience of shopping and safety of travel.
Equal access to transportation is essential to empower women to obtain more economic
opportunities. In China, the construction of transportation for the elderly, children, sick,
disabled and other vulnerable groups have been gradually improved, but the perspective
1 March, C., Smyth, I. A., & Mukhopadhyay, M. (1999). A guide to gender-analysis frameworks. Social Gender
Consciousness Group Translates(2004). Social Science Academic Press:17. 2 Garrett, M., & Wachs, M. (1996). Transportation planning on trial: the clean air act and travel forecasting. Sage Publications.
3 Assembly, U. G. (1997). Report of the Economic and Social Council for 1997. A/52/3, 18 September 1997.[online] Available from: h ttp://www. un. org/documents/ga/docs/52/plenary/a52-3. htm,[Accessed 20 March 2012]. UNDP (2011) Human Development Roport 2011: Angola.

P a g e | 7
of social policy for gender differences is still absent. Taking gender into consideration
would make the urban transport system more equal and efficient. Moreover, social
gender roles, affected by geographic, economy, culture and politics, is constantly
changing. Therefore, traffic planning and construction in different regions and cultural
background should address gender differences of residents’ travel in the local context,
making male and female benefit equally in the development of transport.
2.2 Gender Differences in Travel Behavior and Patterns
Many studies have shown that there are significant differences in daily travel between
male and female, due to gender differences in physiological function and psychological
characteristics as well as household responsibility. Specifically, gender differences in
transport are shown in the following five aspects:
2.2.1 Space
Due to the different family roles, women generate more diverse trips than men, as they
need to go to the supermarket, banks, schools and other places to conduct household
chores in addition to daily work commute. The statistics of Beijing household travel
survey in 2005 shows that commuting trips account for 39.67% of women’s total trips
(except going home), about 10% less than men; shopping trips account for 35% of
women total travel, 13% higher than men; trips for picking up people or thing account
for 8.91% of women’s total trips, 2% higher than men4. As shown, women tend to make
more complex trips in space than men, who linearly travel between home and
workplace.
2.2.2 Time
The time dimension of daily travel refers to how much time people spend on travel and
when they travel.
For residents in urbanized areas, whether their average daily travel time is absolute
stable or they have a constant travel time budget has been one of the focuses of urban
transportation research. Studies indicate that the commuting time by men is 10% higher
than women. However, the trip time for shopping and social by women is significantly
higher than men5. As a result, men’s travel time is concentrated in the morning and
evening peak hours, while women’s travel time is distributed throughout the day.
2.2.3 Trip Mode
Since incoming-generating trips are deemed more important than household trips, men
has a priority to use the private transport such as cars and motorcycles at home, while
women are more likely to take public transport or walk. This situation is also related to
the fact that women usually have low income and more household responsibilities.
4 Meng Zhang.(2007). Travel Behavior Characteristics Analysis for Women. (Doctoral dissertation, Beijing:
Beijing Jiaotong University). 5 Ibid.

P a g e | 8
2.2.4 Affordability
When it comes to mode choice, women are more sensitive to costs. Women are more
likely to make chained trips, which means that when they travel, they tend to have
multiple purposes and destinations within one trip, which further make women make
more transfers and purchase more than one ticket. Therefore, travel costs have a great
impact on women’s mode choice.
2.2.5 Psychological Needs
Women pay more attention to safety and security than men. Travel hours, lighting, and
cleanliness during the travel are important factors to influence women’s sense of
personal security6. Men focus more on the efficiency and reliability of trip.
2.3 Gender and ITS
We often see this scene in front of IC card reader on bus: a female passenger with both
her hands full is struggling to pull the IC card out of her bag to pay for the trip. However,
as a matter of fact, one minor modification to the card reader would enable her to swipe
the card across the handbag - and since women tend to travel with more bags while men
travel lightly, such adjustment will greatly improve the convenience for women.
We also often find that at the intersection, ordinary people need to trot in order to cross
the road within the limited time of pedestrian’s green lights, but for special groups of
people like people with limited mobility, women (especially pregnant or wearing high-
heels), children, the elderly, when they pass just half of road, the traffic lights already
switched.
Thus, due to different travel needs and behaviors, men and women have different needs
and expectations for intelligent transportation system. Compared to the transport
infrastructure, the planning and design of intelligent transportation should be demand-
oriented, providing people with personalized travel services to meet the special needs
of different groups.
3 Research Method
In order to evaluate the gender impacts of urban ITS scientifically and comprehensively,
the World Bank commissioned Tong Xin, a professor from the Department of Sociology,
Peking University as the chief expert of the project; other researchers from Peking
University, Wuhan University, Xinjiang University, Women’s Studies Institute of China
Women’s Federation, and China Women’s University jointly formed the survey team
(later referred to as the project team) to carry out the evaluation.
6 Lynch, G., & Atkins, S. (1988). The influence of personal security fears on women's travel patterns. Transportation, 15(3), 257-277.

P a g e | 9
3.1 Research Object
Wuhan and Urumqi are among the first few Chinese cities with World Bank loan for
urban transport development. Both cities completed the initial construction of ITS with
the support of government investment and loans from the World Bank, and recently
applied for a new batch of the Bank loans to integrate and upgrade the existing ITS
subsystems. Therefore, the project team selected Wuhan and Urumqi as two case
studies and collected basic trip data of residents from these two cities. The team focused
on the differences of men and women when using the public transport information
service system, IC card system, monitoring facilities at bus stops and in-vehicle, traffic
signal system, e-police system, parking guidance system, variable message signs, ETC
system, and navigation and positioning systems.
Wuhan, located in Hubei Province of China, has a unique geographical location
with the Yangtze River and Han River flowing through the city dividing its main urban
area into three parts. As the capital of Hubei Province, Wuhan sustains a rapid economic
growth in recent years with the city’s GDP more than five hundred billion RMB and
the population of residents over ten million. To address the environmental pollution and
traffic congestion brought by urbanization, Wuhan plans to build “one center, five
platforms, twelve application directions” as the main framework of the new generation
of ITS. So far, Wuhan has already developed ITS for traffic monitoring, traffic
information collection, transport information services, public transport management,
road traffic management, highway toll, ETC and commercial vehicles management.
Urumqi, the capital of Xinjiang Uygur Autonomous Region, is an important hub of
road, railway, and civil aviation in the northwest of China. By the end of 2014, the
population in Urumqi reached 3.53 million. The growing urban population and
economy lead to new and higher requirements for transport development in Urumqi.
The goal of ITS development in Urumqi is one comprehensive information center, six
industry management centers, and ten key development directions. The existing and
planned ITS in Urumqi includes the traffic management system, bus operations
management systems, taxi management system, road transport management system,
road maintenance and management system, emergency response and security system,
parking management system, GIS-based city integrated transportation database,
electronic payment and information services, and construction of smart city.
3.2 Survey Method
The project team takes both quantitative and qualitative research methods. In the pre-
investigation stage, the team visited the transport agencies in Wuhan and Urumqi to
carry out technical exchanges and field observations. Subsequently, the team conducted
a survey questionnaire among local residents, and held focus group discussions in the
local communities.
3.2.1 Field Survey and Participatory Observation
P a g e | 10
The project team visited Wuhan and Urumqi in April and June 2015 respectively, and
met with the Traffic Management Bureau, Transportation Commission, Public
Transport Management Office and the Institute of Transport Development Strategy in
Wuhan, as well as Transport Research Center, Public Transport Group, Jumbo Bus
Group, Transport Bureau and Transportation Management Bureau in Urumqi. Through
these visits, the team got an understanding of the transport development status of the
two cities as well as relevant policy and decision-making direction. The team also
obtained existing available data of ITS facilities. Finally, the team experienced the
transport infrastructure and ITS services of two cities. Based on these findings, the team
designed the survey questionnaires and drafted the interview outline.
3.2.2 Questionnaire
The team collected 600 valid questionnaires in Wuhan, and 510 valid questionnaires in
Urumqi.
3.2.2.1 Basic Characteristics
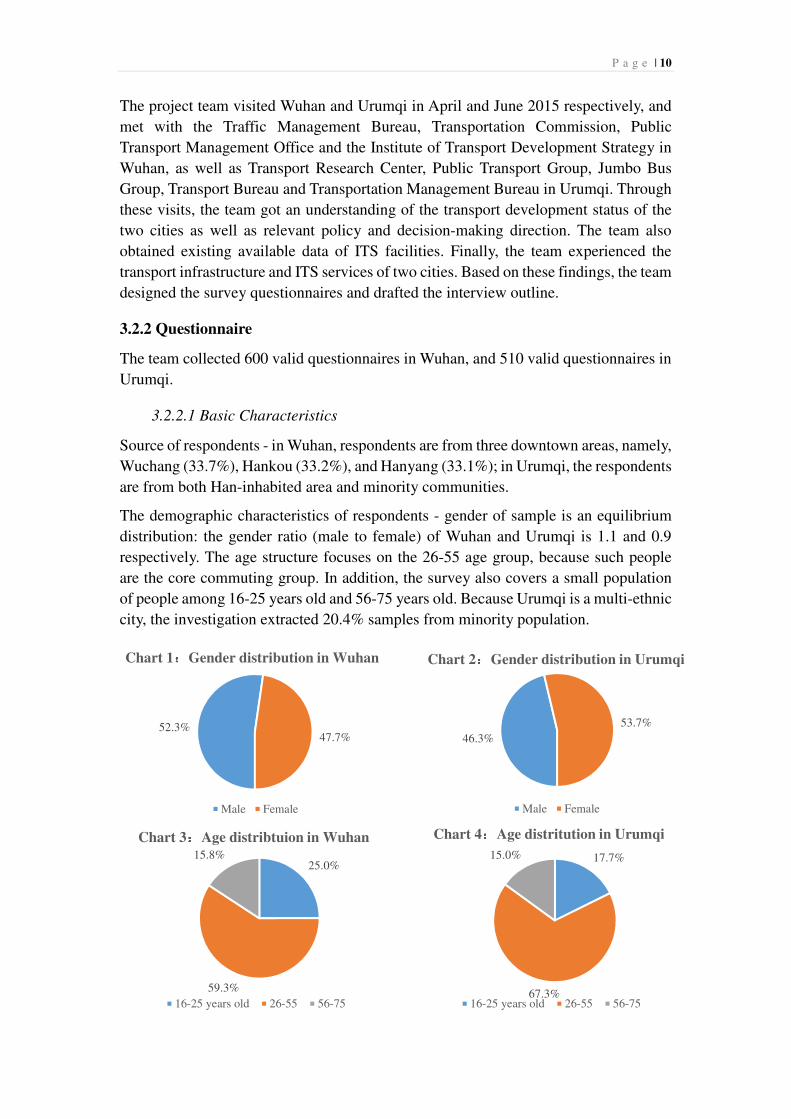
Source of respondents - in Wuhan, respondents are from three downtown areas, namely,
Wuchang (33.7%), Hankou (33.2%), and Hanyang (33.1%); in Urumqi, the respondents
are from both Han-inhabited area and minority communities.
The demographic characteristics of respondents - gender of sample is an equilibrium
distribution: the gender ratio (male to female) of Wuhan and Urumqi is 1.1 and 0.9
respectively. The age structure focuses on the 26-55 age group, because such people
are the core commuting group. In addition, the survey also covers a small population
of people among 16-25 years old and 56-75 years old. Because Urumqi is a multi-ethnic
city, the investigation extracted 20.4% samples from minority population.
52.3%47.7%
Chart 1:::
:Gender distribution in Wuhan
Male Female
17.7%
67.3%
15.0%
Chart 4:::
:Age distritution in Urumqi
16-25 years old 26-55 56-75
46.3%
53.7%
Chart 2:::
:Gender distribution in Urumqi
Male Female
25.0%
59.3%
15.8%
Chart 3:::
:Age distribtuion in Wuhan
16-25 years old 26-55 56-75

P a g e | 11
The Socio-economic characteristics of respondents - similar to the age dimension, the
majority of sample have regular travel patterns: as opposed to school attendants, the
unemployed, retiree and other groups, the main respondents are “employees” (70.7%
in Wuhan, 85.1% in Urumqi); these people include company’s employees, workers,
service personnel, administrative staff, professional and technical personnel, the self-
employed and others. In addition, most of the respondents have local household
registers (63.5% in Wuhan, 72.7% in Urumqi) with their income by self-assessment
concentrated at the lower-middle and middle level (75.4% in Wuhan, 71.6% in Urumqi),
in line with the overall situation of the region.
3.2.2.2 Travel Data
In addition to basic characteristics of the respondents, some of the external transport
provisions will also affect the respondents’ travel patterns, such as accessibility to
transportation infrastructure and type and number of vehicles owned by the household.
Public transport accessibility - in this survey, the project team chooses the walking time
of respondents from their home to the nearest bus stops and subway stations (Wuhan)
or BRT stations (Urumqi) as an indicator to analyze the transport accessibility of the
respondents. We find that in both cities there are bus stops close to the respondents’
home (as investigated, the average walking time to the nearest bus stops for Wuhan
respondents is 7.18 minutes and for Urumqi respondents 9.14 minutes), wherein 87.0%
and 78.8% respondents in Wuhan and Urumqi respectively live within 10 minutes’ walk
from the nearest bus stop; most respondents are also living nearby subway or BRT
stations (the average walking time from the nearest subway station is 17.4 minutes in
Wuhan, and the walking time from the nearest BRT station is 14.3 minutes in Urumqi),
wherein the respondents’ walking time within 20 minutes accounts for 69.9% and
86.7%, respectively.
From the analysis, we find that the walking time of 10 minutes to the nearest bus stop
and 20 minutes to the nearest subway or BRT station is the respondents’ determination
value of “convenience” in terms of transport accessibility: as long as the home of
respondents meets one of the two conditions above, they are very likely to rate their
transport environment as convenient without gender difference. In fact, the
investigation in Wuhan and Urumqi shows 79.1% and 87.7% of respondents believe
70.7%
7.7%
5.7%
15.4%0.5%
Chart 5:::
:Employment status in Wuhan
work study unemployment (including housewife) retire others
85.1%
2.0%
8.4%1.2%
3.3%
Chart 6:::
:Employment status in Urumqi
work study unemployment (including housewife) retire others
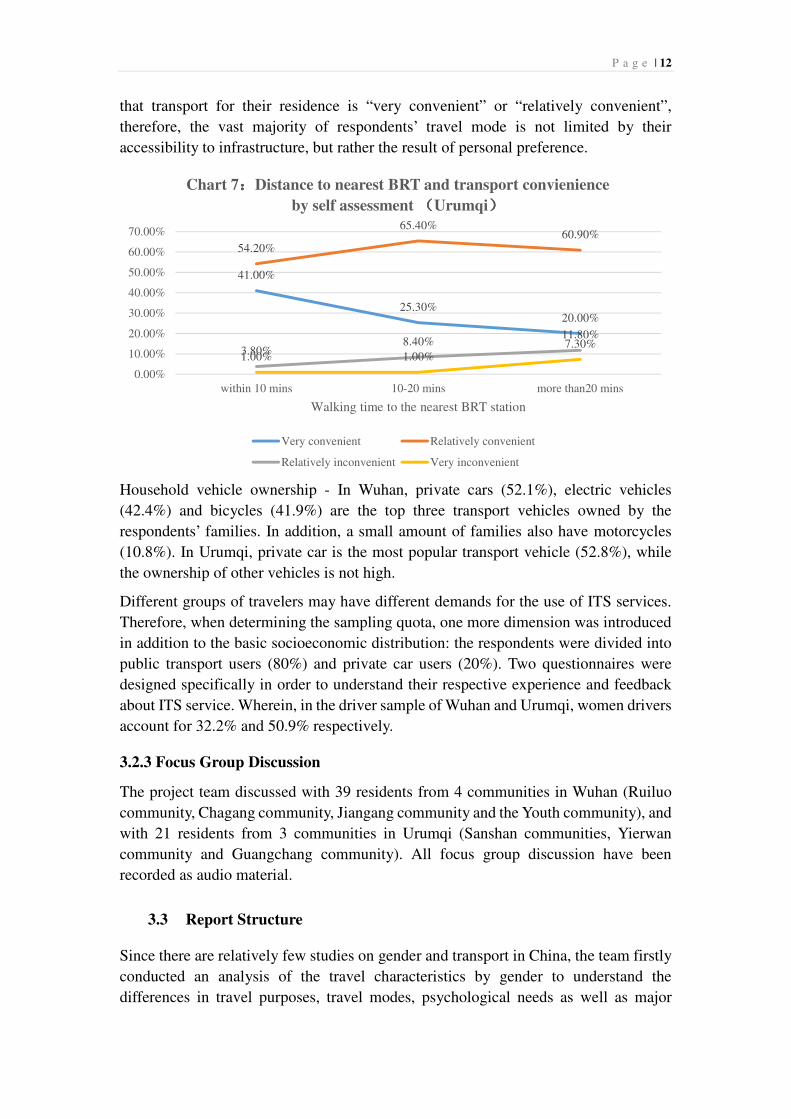
P a g e | 12
that transport for their residence is “very convenient” or “relatively convenient”,
therefore, the vast majority of respondents’ travel mode is not limited by their
accessibility to infrastructure, but rather the result of personal preference.
Household vehicle ownership - In Wuhan, private cars (52.1%), electric vehicles
(42.4%) and bicycles (41.9%) are the top three transport vehicles owned by the
respondents’ families. In addition, a small amount of families also have motorcycles
(10.8%). In Urumqi, private car is the most popular transport vehicle (52.8%), while
the ownership of other vehicles is not high.
Different groups of travelers may have different demands for the use of ITS services.
Therefore, when determining the sampling quota, one more dimension was introduced
in addition to the basic socioeconomic distribution: the respondents were divided into
public transport users (80%) and private car users (20%). Two questionnaires were
designed specifically in order to understand their respective experience and feedback
about ITS service. Wherein, in the driver sample of Wuhan and Urumqi, women drivers
account for 32.2% and 50.9% respectively.
3.2.3 Focus Group Discussion
The project team discussed with 39 residents from 4 communities in Wuhan (Ruiluo
community, Chagang community, Jiangang community and the Youth community), and
with 21 residents from 3 communities in Urumqi (Sanshan communities, Yierwan
community and Guangchang community). All focus group discussion have been
recorded as audio material.
3.3 Report Structure
Since there are relatively few studies on gender and transport in China, the team firstly
conducted an analysis of the travel characteristics by gender to understand the
differences in travel purposes, travel modes, psychological needs as well as major
41.00%
25.30%20.00%
54.20%
65.40%60.90%
3.80%8.40%
11.80%
1.00% 1.00%7.30%
0.00%
10.00%
20.00%
30.00%
40.00%
50.00%
60.00%
70.00%
within 10 mins 10-20 mins more than20 mins
Walking time to the nearest BRT station
Chart 7::::Distance to nearest BRT and transport convienience
by self assessment ((((Urumqi))))
Very convenient Relatively convenient
Relatively inconvenient Very inconvenient
P a g e | 13
reasons behind these features. Secondly, the team analyzed the difference of usage and
needs of the ITS services and facilities by gender, and further explored possible
improvements and measures. Thirdly, the team used Urumqi as a case study to analyze
the application and improvement of ITS in minority-inhabited areas.

P a g e | 14
Chapter Two Gender Analysis on Travel Characteristics of
Residents
Gender differences in travel behaviors and travel characteristics is a theoretical
presupposition to understand that males and females have differentiated demand for
and participation in ITS. This also provides a practical guidance for the design, planning
and management of transportation service facilities. For this reason, this chapter first
summarizes the resident travel patterns in two cities and then compares the travel
characteristics of females and males. It mainly covers the comparison on trip purpose
and time distribution, travel frequency, trip length, travel expense, mode share and
psychological need during travel.
1 An Overview of Resident Travel Patterns in Two cities
1.1 Wuhan
The project team surveyed 600 residents in the district of Wuchang, Hanyang and
Hankou in Wuhan.
Trip purpose: Respondents made 1491 trips in total the day before, 2.49 trips per person.
Therein, most trips were for commute with a frequency of 0.65 times per person;
entertainment trip was 0.31 times per person; and housekeeping trip was 0.22 times per
person.
Travel time: Respondents spent a total of 30126 minutes on travel the day before, 50.2
minutes per person. Therein, commute travel took the longest time of 21.1 minutes per
person; entertainment travel took 8.2 minutes per person; and housekeeping travel took
5.7 minutes per person.
Travel expense: Respondents
spent a total of 7112.4 RMB on
travel the day before, 11.9 RMB
per person. Therein, commute
travel cost the most, at 5.0 RMB
per person; entertainment travel
cost 1.2 RMB per person; and
housekeeping travel cost 1.1 RMB
per person.
Mode choice: Chart 8 shows the
mode split of the trips made by the
respondents the day before.
1.2 Urumqi
The project team surveyed 510 residents in Urumqi.
On foot35.9%
Bicycle and tricycle2.5%E-bike
6.8%Motocycle
0.5%Car (drive)
12.9%
Car (ride)3.3%
Taxi3.3%
Bus21.7%
Subway11.3%
Ferry0.3%
Company/ school bus
1.0%Others0.5%
Chart 8:::
:Mode Split of Wuhan respondents

P a g e | 15
Trip purpose: Respondents made 1233 trips in total the day before, 2.41 trips per person.
Therein, most trips were for commute with a frequency of 0.74 times per person;
entertainment travel was 0.25 times per person; and housekeeping travel was 0.18 times
per person.
Travel time: Respondents spend a total of 18210 minutes on travel the day before, 35.7
minutes per person. Therein, commute travel took the longest time of 16.5 minutes per
person; entertainment travel took 6.37 minutes per person; and housekeeping travel
took 4.15 minutes per person.
Travel expense: Respondents
spent a total of 4302.4 RMB on
travel the day before, 8.4 RMB
per person. Therein, commute
travel cost the most, at 4.0 RMB
per person; entertainment travel
cost 1.1 RMB per person; and
housekeeping travel cost 0.6
RMB per person.
Mode choice: Chart 9 shows the
mode split of trips made by the
respondents the day before.
2 Trip purpose and time distribution by gender
2.1 Primary and secondary daily trip purpose
Since males and females play different social roles, males travel mostly for work, while
female travel more for housekeeping.
Primary and secondary daily trip purposes of the respondents surveyed in the two cities
were collected through questionnaires. In both cities, commute was the primary trip
purpose for most of the respondents (Wuhan 68.1%, Urumqi 84.1%). However, by
gender, more males took commute as the primary travel purpose than females in both
cities (Wuhan 71.0%-65.0%, Urumqi 87.3%-81.4%). If taking business travel into
account, 74.8% of male respondents in Wuhan and 90.2% of male respondents in
Urumqi traveled primarily for work (commute and business travel); the corresponding
percentage among female respondents is only 66.0% and 81.7% respectively. On the
contrary, 17.9% of female respondents in Wuhan and 11.7% of female respondents in
Urumqi traveled primarily for housekeeping (including school drop-off or pick-up); the
corresponding percentage among male respondents is only 9.7% and 3.8% respectively.
In general, females engaged in fewer work activities and many more household duty
activities than males.
On foot, 20.4%
Bicycle and
tricycle, 0.5%
E-bike, 0.3%
Motocycle, 0.2%
Car (drive), 18.2%
Car (ride), 3.9%Taxi, 8.1%
Bus, 34.4%
BRT, 9.8%
Unlicensed taxi, 1.1%
Company/ school bus,
2.5%
Others, 0.6%
Chart 9:::
:Mode Split of Urumqi respondents

P a g e | 16
In terms of secondary trip purpose, respondents in the two cities have shown similar
behaviors: most respondents traveled for the purpose of entertainment (Wuhan 41.5%,
Urumqi 43.9%) and housekeeping including school drop-off and pick-up (Wuhan
33.2%, Urumqi 35.6%). However, gender division of labor also resulted in some
differences in the percentage of the two purposes. Among male respondents in Wuhan,
41.8% of trips were for entertainment and 30.1% for housekeeping, similar to female’s
entertainment travel (41.2%) and lower than female’s housekeeping travel (36.6%).
Among respondents in Urumqi, male respondents (46.5%) traveled more than females
(41.8%) for entertainment, while much less (30.4%) than females respondents (39.9%)
for housekeeping.
An analysis on previous-day travel record of the respondents who need to drop off their
kid shows: 21.4% of male respondents in Wuhan and 18.8% of male respondents in
Urumqi drop off/pick up their children to/from school. Correspondingly, 34.9% and
32.5% of female respondents do so in the two cities respectively. It is worth noting that
74.8%
9.7% 8.1%
66.0%
17.9%
10.2%
90.2%
3.8% 4.2%
81.7%
11.7%
3.3%
0.0%
10.0%
20.0%
30.0%
40.0%
50.0%
60.0%
70.0%
80.0%
90.0%
100.0%
Work Housekeeping Entertainment
Chart 10: Primary travel purposes of the male and female in two
cities
Wuhan male Wuhan female Urumqi male Urumqi female
17.0%
30.1%
41.8%
10.7%
36.6%
41.2%
12.6%
30.4%
46.5%
10.6%
39.9%41.8%
0.0%
5.0%
10.0%
15.0%
20.0%
25.0%
30.0%
35.0%
40.0%
45.0%
50.0%
Work Housekeeping Entertainment
Chart 11: Secondary travel purposes of the male and female in two
cities
Wuhan male Wuhan female Urumqi male Urumqi female

P a g e | 17
among the surveyed respondents, percentage of male and female respondents with full-
time jobs were similar, meaning that females undertake more family responsibility
when sharing the economic burden at the same time.
2.2 Travel record of respondents surveyed the day before
First, we analyzed the respondents’ trip purpose of the day before in the two cities, by
calculating the percentage of each trip purpose excluding the back-to-home trips. In
Wuhan, except home trips, 512 trips were made in total by male respondents the day
before, and trip purposes in descending order by percentage are: going to work (42.6%),
entertainment (18.9%), housekeeping (9.2%), business (5.9%) and dropping
off/picking up children (5.9%). Female respondents made 482 times in total the day
before. Therein compared to males, fewer trips were for work (35.7%) and business
(3.7%), while more trips were for housekeeping (17.2%) and dropping off/picking up
children (8.1%). The situation in Urumqi is quite similar. Without taking home trips
into account, male and female respondents traveled 342 and 394 times the day before
respectively. Similarly, more males traveled for work (55.6%-47.2%) and business
(8.5%-2.5%) than female, and more females traveled for housekeeping (16.5%-7.9%)
and dropping off/picking up children (7.4%-4.4%) than males. The data further
confirmed the characteristics of trip purpose by gender: males travel more for work
than females, while females travel more for housekeeping than males.
Moreover, based on household travel data collected in Urumqi, we further analyzed the
travel time of males and females. In Urumqi, morning peak is between 8 a.m. to 10 a.m.,
Beijing time, and evening peak is between 6 p.m. to 8 p.m., Beijing time. According to
the respondents’ trip chains, we found that more males travel during the two peak hours,
and travel primarily for commute, while more females travel during off-peak period.
Among all the trips conducted by males, 33.9% of them were done during morning
peak (8 a.m.-10 a.m.), 25.3% during evening peak (6 p.m.-8 p.m.) and 30.6% during
off-peak period (10 a.m.-6 p.m.), and the corresponding percentage for females is
31.2%, 23.7% and 35.1% respectively.
In terms of trip purposes during different time periods, males and females showed
different travel patterns. During peak hours, trips by males were mostly for commute,
47.2%
55.6%
35.7%
42.6%
2.5%
8.5%
3.7%
5.9%
16.2%
18.4%
18.9%
18.9%
16.5%
7.9%
17.2%
9.2%
7.4%
4.4%
8.1%
5.9%
10.2%
5.2%
16.4%
17.5%
0% 10% 20% 30% 40% 50% 60% 70% 80% 90% 100%
Urumchi female
Urumchi male
Wuhan female
Wuhan male
Chart 12: Percentage of trip purpose by gender in two cities the day before
Work Business Entertainment Housekeeping Escorting Children Others

P a g e | 18
while trips by females, in addition to commute, were also for housekeeping. During the
morning peak, males (63.9%) conducted more working trips than females (59.8%).
While during the morning and evening peak, females conducted more child dropping
and shopping trips than males (child dropping: 5.1% for female and 4.2% for male;
shopping: 11.7% for female and 6.6% for male). In addition, during the off-peak period,
females also conduct more housekeeping trips than males. On shopping, for instance,
females (16.0%) traveled more than males (8.7%) during the off-peak period.
3 Trip frequency, duration and expense by gender
Firstly, males and females show differences in travel frequency. In Wuhan, average
number of trips made by male respondents is 2.4 times/day and female respondents 2.6
times/day; in Urumqi, male respondents 2.5 times/day, and female respondents 2.4
times/day.
Secondly, males and females show differences in trip duration: male respondents spent
more time on travel than female the day before. In Wuhan, males spent 54.0 minutes
per day, and females 46.1 minutes per day. In Urumqi, males spent 39.3 minutes, and
females 32.6 minutes.
In Wuhan, 217 male respondents and 171 female respondents have made commuting
trips the day before, and the total of commuting trips made were 390 times. Therein,
males spent 31.8 minutes and females spent 34.0 minutes on the trip. In Urumqi, 190
-0.79%
-1.25%
-1.80%
-4.36%
-15.78%
-6.90%
-3.42%
-1.99%
-5.11%
-3.50%
-6.62%
-3.44%
-3.56%
-6.25%
-20.74%
-9.91%
-1.25%
-0.31%
-0.09%
-0.02%
-0.01%
-0.02%
-0.01%
-2.86%
0.55%
0.98%
1.42%
3.50%
14.30%
7.44%
4.02%
2.45%
5.24%
3.41%
6.85%
4.74%
4.85%
6.84%
19.65%
8.23%
0.89%
0.14%
0.02%
0.01%
0
0.01%
0.01%
4.43%
-25.00%-20.00%-15.00%-10.00% -5.00% 0.00% 5.00% 10.00% 15.00% 20.00% 25.00%
23:00-23:59
22:00-22:59
21:00-21:59
20:00-20:59
19:00-19:59
18:00-18:59
17:00-17:59
16:00-16:59
15:00-15:59
14:00-14:59
13:00-13:59
12:00-12:59
11:00-11:59
10:00-10:59
09:00-09:59
08:00-08:59
07:00-07:59
06:00-06:59
05:00-05:59
04:00-04:59
03:00-03:59
02:00-02:59
01:00-01:59
00:00-00:59
Chart 13: Distribution of trips by gender in one day
(Urumqi household survey)
female
male

P a g e | 19
male respondents and 186 female respondents have made commuting trips the day
before, and the total of commuting trips made were 376 times. Therein, males spent
26.7 minutes and females 20.7 minutes on the trip.
Based on the travel data collected in Urumqi, we compared the time duration of each
trip purpose and found the following (see in Chart 14):
(1) For all trips purposes, females’ trip duration is shorter than male’s. In other word,
females had a smaller daily travel radius than male; (2) Compared to work trips (e.g.,
commuting or business travels), housekeeping trips (e.g., school drop-off/pick-up or
shopping) were much less time-consuming. A further conclusion is that: males spent
longer time on travel, mainly work trips. Females traveled more frequently and the
duration varies. Most of their trips were for housekeeping (less time-consuming and
more frequent).
Thirdly, males and females show differences in travel expense. The travel expense of
females is lower and females are more sensitive to travel cost.
According to statistics of the transportation expenses of the respondents, in Wuhan,
male respondent spent an average 15.0 yuan per person the day before, and females
spent only 8.4 yuan; in Urumqi, the expense was 10.8 yuan for males and 6.4 yuan for
females. We also divided the respondents into driving group and public transport group.
The result shows (see in Chart 15, 16): the average daily expense on public
transportation 7 is much lower than driving 8 ; no matter driving or taking public
transport, the travel expense by females is always less than males. When it comes to
average monthly transportation expense, the gap further widens: in Wuhan, male
respondents (514.3 yuan) spent 182.8 yuan more than females (331.5 yuan); while in
Urumqi, the gap (male 330.5 yuan, female 205.0 yuan) is relatively smaller but still
substantial.
7 The expense on public transport includes cash and IC card payments. 8 The expense on driving includes fuels, road charges and parking fees, but excludes maintenance cost for cars.
33.7
47.4
39.9
28.2
29.1
27.9
31.4
39
32.6
26.1
23.9
26.9
0 5 10 15 20 25 30 35 40 45 50
Commute
Business
Personal affairs
Shopping
Escorting
Entertainment
Average time-span (minute)
Chart 14: Duration of each trip purpose by gender (Urumqi household
survey data)
female male

P a g e | 20
4 Trip mode split by gender
The preference for trip mode is influenced by socioeconomic status, family structure
and many other factors. In addition, gender itself is an important influential factor.
Findings show that males are more likely to get the driving right of the private cars in
the family. We studied the distribution of driving right between couples. Assuming that
there is one car and the car is not driven by their parents or children, 78.1% of male
respondents in Wuhan suggested that they are the ones to use the car mostly when going
out; only 16.4% of female respondents in Wuhan gave the same answer, and the rest
83.6% suggested that their spouse was using the car mostly. In Urumqi, the distribution
of driving right is quite similar: in general, 58.1% male respondents were drivers in
their family, while only 12.7% of female respondents drove themselves. As a result,
females travel more on foot or by public transportation than males.
If analyzing the percentage of trips by each mode among all trips (i.e. trip mode share),
we find out that (see in Chart 17) mode share of walking and bus of female respondents
is much higher than males, while their private car mode share is much lower. The
finding also validated that compared to private car, females tend to travel more by
public transportation.
8.3
34.0
15.0
5.9
21.5
8.4
0.0
10.0
20.0
30.0
40.0
Publictransportation
Self-drive Others
Ways of travel
Chart 15: Transportation expenses
per capita of male and female
respondents (Wuhan)
male female
3.3
21.8
10.8
2.6
15.6
6.4
0.0
5.0
10.0
15.0
20.0
25.0
Publictransportation
Self-drive Others
Ways of travel
Chart 16: Transpotation
expenses per capita of male and
female respondents (Urumqi)
male female
22.80%
17.80%
39.80%
32.30%
35.20%
33.60%
23.00%
20.20%
12.30%
10.30%
10.10%
9.60%
15.90%
20.90%
8.50%
17.40%
6.70%
9.70%
2.40%
4.10%
5.90%
1.60%
3.80%
2.80%
3.40%
6.80%
10.20%
12.90%
0% 10% 20% 30% 40% 50% 60% 70% 80% 90% 100%
Urumqi female
Urumqi male
Wuhan female
Wuhan male
Chart 17: Trip mode split by gender in two cities the day before
Walk Bus Subway BRT Car (drive) Taxi Car (ride) Others

P a g e | 21
5 Gender comparison: multi-oriented travel requirements
People have multiple expectations for travel. First, travel is efficiency-oriented, i.e.,
people need to move from A to B in a fast manner. Efficiency-oriented travel seeks for
effectiveness and speed. Secondly, travel is safety-oriented, i.e., any safety-threatening
incident should be avoided during such move in space. However, survey shows that
although both genders attach importance to efficiency, males cares even more about
“time saving” while female values efficiency only when safety is guaranteed.
5.1 What factors do people concern about for travel - differences between
males and females
Men and women have diverse priorities in their valuation of transport attributes. Based
on the rating of six factors (timesaving/efficiency, safe, comfortable, reliable, eco-
friendly and economical), we analyzed the most important factor as well as the top 3
factors.
Firstly, “safe” appears to be the most important factor for both men and women.
However, male respondents are more likely to prioritize “timesaving” over “safety”,
while female are more worried about safety. For the most important factor, among all
Wuhan respondents, 62.3% of males chose “safe” and 26.8% “timesaving”; 70.2% of
females chose “safe” and 17.9% “timesaving”. Among all Urumqi respondents, 64.0%
of males and 75.5% of females chose “safe”, and the corresponding percentage of
“timesaving” is 24.6% and 16.5% respectively.
The project team then analyzed the on-site traffic accident data of 2012 to 2014 from
the traffic police department of Urumqi. According to the data, among all traffic
accidents caused by speeding, males accounted for 82.2% of them; among accidents
caused by illegal overtaking, males accounted for 85.7% of them; among accidents
caused by forceful lane changing, males accounted for 74.3% of them; and among
accidents caused by red-light running, males accounted for 77.2% of them. These
accident data reflect that in order to “save time”, males are more likely to take high-
risk actions such as speeding, illegal overtaking and running the red lights.
Secondly, when it comes to the top three factors, both genders in the two cities are most
concerned with “safe” and “time saving”. Over 90% of respondents in both cities chose
“safe” as one of their top 3 factors. Females generally paid more attention on “safety”
than males did, and males generally emphasized more on “saving time” than females
did. Beyond that, females were more responsive on “eco-friendly” and “economical”,
while males focused more on “comfortable”.

P a g e | 22
Attached table:::
:The score of each concern by gender in two cities
timesaving safe comfortable reliable eco-friendly economical
Males in Wuhan 1.58 2.36 0.79 0.31 0.47 0.37
Females in Wuhan 1.40 2.53 0.75 0.29 0.53 0.45
Males in Urumqi 1.45 2.40 0.81 0.75 0.26 0.31
Female in Urumqi 1.28 2.60 0.64 0.96 0.35 0.32
Attached:(the score=first concern*3+second concern*2+third concern*1)
5.2 Females support personal-security measures more
Females are more supportive to various transportation personal-security related
measures. Among respondents in Wuhan and Urumqi, suggestions for transport
infrastructure improvement by females are consistently focused on safety measures,
while, on controversial safety measures, a certain percentage of males would question
or oppose such measures that may sacrifice efficiency.
Among Wuhan respondents, females are more responsive to all suggestions about
transportation safety measures. Firstly, on suggestions to create safe transport
environment at stations and in-vehicle through traditional manpower and equipment:
55.3% of females (46.8% of males) strongly called for improvement in lighting for
stations and roads; 54.0% of females (42.0% of males) strongly called for increase on
police force and security guard; and 19.8% of females (12.5% of males) strongly called
for in-vehicle conductors. Secondly, on suggestions to promote safety through ITS
facilities: 48.9% of females (41.8% of male) strongly called for additional surveillance
cameras around the stations, and 32.0% of females (21.5% of males) strongly called for
aiding intercom installed inside vehicles. Thirdly, on operating hours and operating
mode of transportation services: 37.9% of females (32.7% of males) strongly expected
to extend the operation hours of metro service.
00.5
11.5
22.5
3timesaving
safe
comfortable
reliable
Eco-friendly
economical
Chart 18: The top three concerns about
travel among male and female (Wuhan)
Males Females
00.5
11.5
22.5
3timesaving
safe
comfortable
reliable
Eco-friendly
economical
Chart 19: The top three concerns about
travel among male and female (Urumqi)
Males Female

P a g e | 23
When there are conflicts between safety and efficiency, gender difference is more
apparent: most females would insist on safety, while males tend to priority efficiency.
For instance, on suggestions about “women-only train cars” and “on-demand stop night
lines”, 28.3% and 24.6% of females supported the two suggestions respectively even at
the possible cost of efficiency, which is similar to the percentage of female respondents
(around 30%) that opposed the suggestions. While among males, the supporting rate
for each suggestions was 12.5% and 19.6% respectively, while over half of male
respondents are against these suggestions.
In summary, females attach greater importance to safety than males. No matter what
categories these measures belong to, traditional or intelligent, females show higher
degree of support for all kinds of measures in favor of safety improvement.
5.3 Difference in setback experience in transport safety by gender
With the shared concern of “safety”, males emphasize more on “timesaving”, while
females stick to “safety”. What makes the difference? From the perspective of gender,
males and females differ in their experience of being “victims” of transportation. In the
public environment, women are more likely to be targeted and face higher risk of being
violated. Therefore, the project team surveyed the respondents’ experience in being
sexually harassed, being stolen, returning late and traveling alone.
The survey shows that females all have security concerns in public transportation.
When asked about females’ experience of being violated, 24.6% of Wuhan females and
19.3% of Urumqi females reported 88 and 62 sexual harassment cases when using
public transportation, respectively, mostly inside the vehicle (64.8% in Wuhan and 74.2%
in Urumqi) and sometimes at stations, underpass and on street (there is also likelihood
that some female respondents may keep silent about their experience due to privacy
concerns, so the real number could be bigger). Contrary to females, male respondents
said they have never been sexually harassed. When answering the question, most of
24.6%
28.3%
37.9%
32.0%
48.9%
19.8%
54.0%
55.3%
19.6%
12.5%
32.7%
21.5%
41.8%
12.5%
42.0%
46.8%
0.0% 10.0% 20.0% 30.0% 40.0% 50.0% 60.0%
One-call stop night lines
Provide female-exclusive train car
Extend metro service hours
Install aiding intercom on buses
Add more surveillance cameras
Increase conductors on buses
Increase security guard
Improve lighting for stations
Chart 20: Supporting rate of different safety measures among
male and female (Wuhan)
male female

P a g e | 24
them laughed.
The survey also shows that females would actively take some protective measures. The
common measures for female respondents in Wuhan and Urumqi are avoiding returning
home late or going to places with potential danger. According to the survey on the time
of returning home in the most recent month, a much smaller percentage of females
returned home in late hours than males (see Chart 21). When asked about the reason
for returning home early, female respondents admitted they were concerned about
encountering dangers (51.6% in Wuhan and 73.8% in Urumqi); while the number for
males were 11.3% and 31.8% respectively. Females have more obvious security
concerns about returning home in late hours.
Due to security concerns, only a quarter of female respondents in Wuhan walked home
the last time they returned home late, while 41.8% chose to take a taxi when buses were
out of service. Survey results in Urumqi are more obvious—only 9.0% female
respondents who returned home late walked, while 64.1% took a taxi.
“She usually called to say she had a meeting and would get back late. My son would
drive to pick her up no matter what.” (said a female respondent in Luorui Community
in Wuhan, “she” refers to her daughter-in-law)
“We care much about students’ safety, especially in the evening when girls get out of
school. We do concern about this because even the best public security and buses
system cannot eliminate all dangers.” (said a female respondent in Youth Community
in Wuhan)
“I don’t like coming back late. The latest time I got home late was for my friend’s
wedding. I usually get home at 10 p.m. If I work overtime I go home immediately, and
I wouldn’t stop by anywhere.” (said a female respondent in Erwan Community in
Urumqi)
13.5%
30.1%
56.4%
21.9%
46.5%
31.6%
0.0%
10.0%
20.0%
30.0%
40.0%
50.0%
60.0%
22:30-23:30 23:31-00:30 after 00:30
Chart 21: Distribution of residents who have returned home late
in the most recent month (Urumqi)
male female

P a g e | 25
Females’ safety concerns for traveling also reflects in their fear when entering the quiet
public space (see Chart 22). Compared to Wuhan, both male and female residents in
Wuhan expressed higher security need. We assumed ethnic relationship played a role
here. We asked local respondents whether they would mind the driver’s ethnic group
when taking a taxi, and it turned out that 41.5% females and 30.8% males of ethnic
minorities admitted that they would; and for Han group, the number was 58.9% and
42.6% respectively. Thus Urumqi residents have more profound regional and ethnic
reasons for having security concerns of taking public transportation; however, gender
differences remain. This shows that people’s security need for transportation increases
along with the tensions among social groups, while females’ security need due to gender
is general.
In all, females face more risks during travel, and are more vulnerable to gender based
violence, such as sexual harassment. Such experience and the knowledge of it make
females consider more about safety when traveling. To protect themselves, females may
restrict their travel hours and locations. To some extent, this means that security
concerns can limit females’ travel radius and time. Designing safer public transportation
for females is thus a matter of equal access to public facilities and services.
21.5%17.7% 15.9%
75.3% 74.2% 72.5%
39.7%36.3% 33.8%
77.6% 75.7% 76.8%
0.0%
10.0%
20.0%
30.0%
40.0%
50.0%
60.0%
70.0%
80.0%
90.0%
Sparsely populatedstreets
Underpass Remote bus station
Chart 22: Fear toward quiet public places by region and gender
Male (Wuhan)
Female (Wuhan)
Male (Urumqi)
Female (Urumqi)

P a g e | 26
Chapter Three the Evaluation of ITS and Gender
In Wuhan and Urumqi, various urban transport ITS have been widely used. We evaluate
each ITS application in terms of its utilization, efficiency and user feedback.
1 Bus dispatching management and passenger information service
system
Advanced public transport system acquires bus information such as real-time location
and speed via GPS and communications modules installed on the bus vehicles, so that
the bus management personnel can schedule and dispatch the bus vehicle and drivers
in real time. In addition, combining with static information such as bus routes and
transfer information, it can also offer convenient information services to the passengers.
Generally speaking, these information systems benefit both genders, but differences
exist in using the service.
1.1 Bus dispatching and management system
Bus companies in both cities have established bus control centers for dispatching and
managing all buses in real time to improve the buses’ on-time ratio and to regulate the
driver’s driving behavior.
Under the World Bank-funded project, Urumqi Bus Company introduced the bus
dispatching system in 2007. The system not only increased bus dispatching efficiency
by providing visual interface to manage buses and routes, but also improved the drivers’
driving performance through real time monitoring, which significantly reduced fatal
accidents as well as injuries caused by emergency brake (most of the casualties were
the elderly, children and women).
“There used to be over 1,000 buses and more than 10 killing accidents. Now we have
over 3,000 buses but zero killing accident in 2013, and 1-2 accidents in 2014-2015.”
(said Zhao Changyong, the general manager of bus dispatching information center in
Urumqi)
In the early period of using the system, bus companies provide job training for previous
bus dispatchers (mostly middle-aged women), and helped them how to use computers
and the real-time dispatching software. Those dispatchers soon accepted the new type
of information management system.
1.2 Passenger information service system
Both cities have established and launched various channels for releasing public
transportation information. Taking Wuhan as an example, there are electronic bus
information signs, bus service hotline “12345”, SMS platform, Internet-based map and
smart bus apps. Among those, the electronic signs, bus service hotline and SMS
platform are established, managed and maintained by the government; and Internet-

P a g e | 27
based map and smart bus apps are mostly run by the private sector. Information
dissemination channels cover a wide range. 92.6% respondents reported having used at
least one of those channels. Among all those channels, electronic bus information signs
and smart bus apps are most frequently used. The site survey shows that bus stations
and subway stations in the arterial roads of Wuhan and BRT stations of Urumqi all have
electric signs, and many young people have installed smart bus apps on their phones.
It is worth noticing that compared with smart transport apps related to driving and taxis,
female respondents use information dissemination channels for public transport more
frequently than males (see Graph 23). This is mainly because females travel more by
public transport; besides, females combine multiple purposes in one trip, thus requiring
more accurate and real-time information to make plans. Smart public transport
information service has become a great helper for females to make trips.
1.2.1 Electric bus information signs
Electronic signs installed at bus stations provide passengers with the distance and
arrival time of the next bus, which are widely welcomed by citizens. In Wuhan, 52.6%
respondents reported that they would like to know the next bus arrival information; in
Urumqi, 65.7% thought the information necessary. Our survey finds that females care
more about the distance and crowdedness of the next bus. In Wuhan, 59.3% females
would like to know whether the bus is crowded; in Urumqi, the percentage is 75.3%.
In addition, female respondents preferred to adding the arrival information about the
second next bus. When the bus is crowded, more females (51.7%) tend to wait for the
next bus than males (39.7%). Knowing the information of the second next bus could
help females decide whether to wait for the next bus or squeeze in the current one.
6.1%
8.0%
28.9%
37.6%
68.2%
47.3%
19.6%
16.1%
11.3%
10.3%
8.4%
6.7%
11.2%
30.5%
38.3%
63.2%
40.4%
14.0%
10.2%
9.1%
5.3%
6.3%
0.0% 10.0%20.0%30.0%40.0%50.0%60.0%70.0%80.0%
Service hotline
Mobile phone message
Smart bus App
Electronic bus information boards
Internet Map
Taxi App
Dynamic vehicle navigation
Traffic radio station
Official wechat account of traffic police in…
Realtime traffic guidance screen
No need of help
Chart 23: Comparison of usage ratio of transport
information service channels by gender (Wuhan)
Female Male
Service for Private car / Taxi
Service for public transportation
P a g e | 28
“If I’m in a hurry I will squeeze in. If I’m not, I will wait for an uncrowded one.” (said
a female in Yierwan Community in Urumqi)
“I get on the bus no matter how crowded it is because I don’t like waiting for the next
one.” (said a male in Yierwan Community in Urumqi)
Generally speaking, electronic bus signs allow people to better control their travel time
and provide information for them to choose routes or trip mode. However, it can be
improved to be more passenger-friendly by adding information such as the
crowdedness of the next bus and the arrival information (estimated time/distance) of
the second next bus.
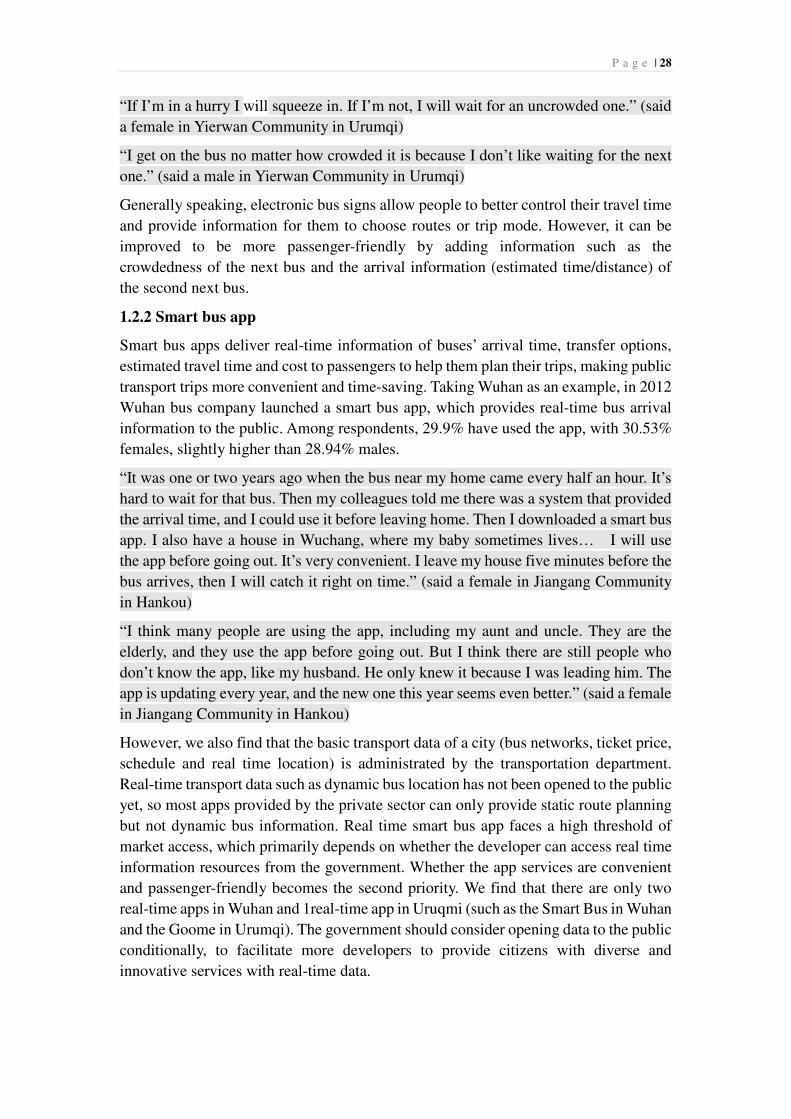
1.2.2 Smart bus app
Smart bus apps deliver real-time information of buses’ arrival time, transfer options,
estimated travel time and cost to passengers to help them plan their trips, making public
transport trips more convenient and time-saving. Taking Wuhan as an example, in 2012
Wuhan bus company launched a smart bus app, which provides real-time bus arrival
information to the public. Among respondents, 29.9% have used the app, with 30.53%
females, slightly higher than 28.94% males.
“It was one or two years ago when the bus near my home came every half an hour. It’s
hard to wait for that bus. Then my colleagues told me there was a system that provided
the arrival time, and I could use it before leaving home. Then I downloaded a smart bus
app. I also have a house in Wuchang, where my baby sometimes lives… I will use
the app before going out. It’s very convenient. I leave my house five minutes before the
bus arrives, then I will catch it right on time.” (said a female in Jiangang Community
in Hankou)
“I think many people are using the app, including my aunt and uncle. They are the
elderly, and they use the app before going out. But I think there are still people who
don’t know the app, like my husband. He only knew it because I was leading him. The
app is updating every year, and the new one this year seems even better.” (said a female
in Jiangang Community in Hankou)
However, we also find that the basic transport data of a city (bus networks, ticket price,
schedule and real time location) is administrated by the transportation department.
Real-time transport data such as dynamic bus location has not been opened to the public
yet, so most apps provided by the private sector can only provide static route planning
but not dynamic bus information. Real time smart bus app faces a high threshold of
market access, which primarily depends on whether the developer can access real time
information resources from the government. Whether the app services are convenient
and passenger-friendly becomes the second priority. We find that there are only two
real-time apps in Wuhan and 1real-time app in Uruqmi (such as the Smart Bus in Wuhan
and the Goome in Urumqi). The government should consider opening data to the public
conditionally, to facilitate more developers to provide citizens with diverse and
innovative services with real-time data.

P a g e | 29
2 Public Transport IC card
Urban public transportation has witnessed the history of manual ticket sellers,
automatic coin collection and public transport IC card. The introduction of IC card has
not only made citizens’ travel more convenient, but also reduced cash transaction and
wearing out and saved human and material resources. Today, IC card can not only pay
bus fare but also be used for supermarkets, convenient stores and automatic vending
machines.
Based on the survey data, we find gender differences in IC card usage.
2.1 IC card ownership
According to the survey, 85% Wuhan passengers have IC cards (excluding elderly
cards), and the percentage in Urumqi is 60% (excluding elderly cards). Wuhan has a
higher percentage because it has opened subways, so using the IC card spares the
residents’ time to queue for the subway tickets; besides, Wuhan government offers
preferential policies that an IC card users enjoy a 20% discount on public transport; and
finally, IC card can also be used in big supermarkets and shopping malls.
Among IC card holders in Wuhan, 46.5% are males and 53.5% are females; in Urumqi,
40.2% are males and 59.8% are females. Females have a higher ownership than males
in both cities, mostly because females choose to travel by public transportation more
often.
2.2 Real name system of IC card
According to the survey, although IC card plays an increasingly important role in daily
travel and shopping, people only recharge a small amount of money to their cards each
time and the balance in the card always remains low. Over 90% passengers (94.0% in
Wuhan and 93.5% in Urumqi) recharge less than 100 yuan to their cards every time.
Such a small amount can meet passengers’ basic need of travel, but cannot achieve the
objective of ”one card for all”. One of the reasons is that passengers believe doing so
can minimize their loss if the card is lost.
70% respondents in Wuhan support the real name system of IC card, with 49.5% males
and 50.5% females; in Urumqi, 82% support the system, with 44.9% males and 55.1%
females. The ratio of females is slightly higher than males in both cities. Many citizens
also expressed their support for the real name system in the interview.
“That is great! I love the real name system.” (said a female in Three Mountains
Community in Urumqi)
“I think real name system is helpful. Now if we lose the card, we can’t get the money
back, so we only recharge a little. The system will solve that problem.” (said a male in
Luorui Community in Wuhan)
Thus, if the bus IC card is to be used everywhere in people’s life, the government should
P a g e | 30
establish not only the real name system, but also a mechanism that enables passengers
to have their cards frozen once lost, and get a new card. In the follow-up survey, we
learnt that now Urumqi citizens can choose to get a real name card or an ordinary card.
For a real name one, they need to bring their ID card to apply for it.
Another advantage of the real name system is the massive data collected from the IC
card system with social information. Easy as it is, swiping cards sends out a lot of
valuable transportation information, e.g., , the time of swiping cards represents the
beginning and ending time of journey; the station of swiping cards represents the origin
and destination of travel. As many people use the card, the data collected can cover 60-
80% of all public transport trips. But if there’s no real name system, key information of
personal identity such as gender and age will be missing.
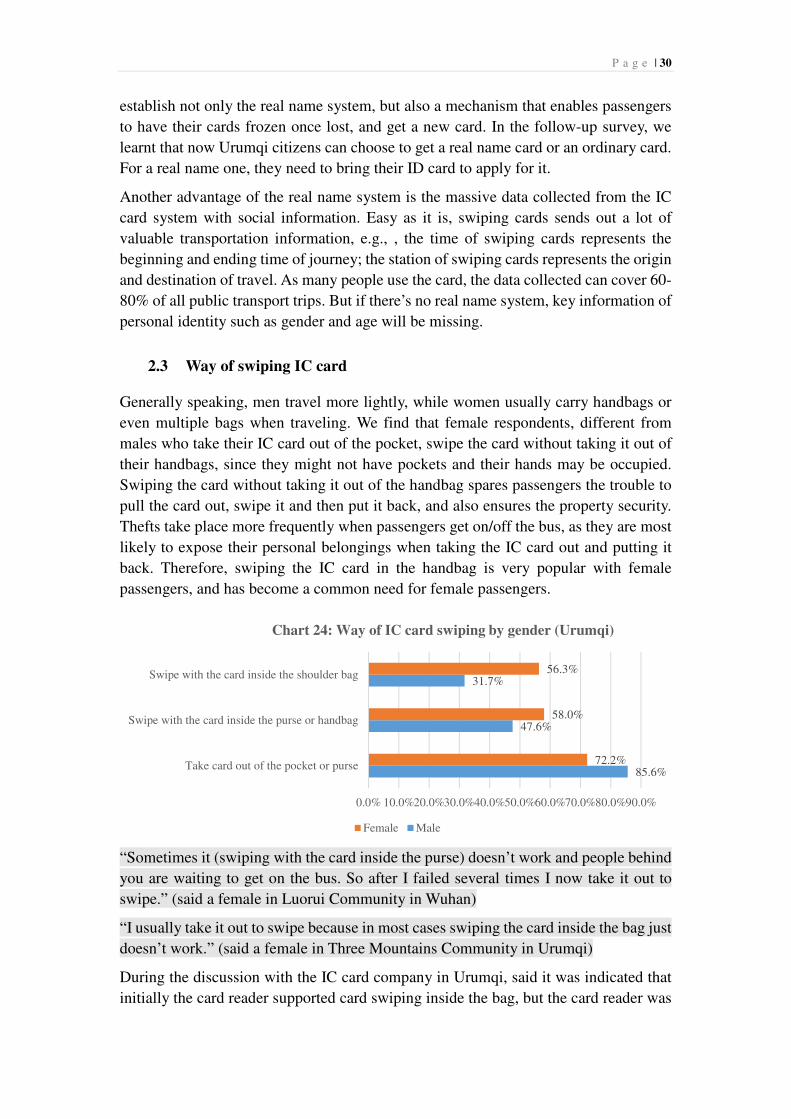
2.3 Way of swiping IC card
Generally speaking, men travel more lightly, while women usually carry handbags or
even multiple bags when traveling. We find that female respondents, different from
males who take their IC card out of the pocket, swipe the card without taking it out of
their handbags, since they might not have pockets and their hands may be occupied.
Swiping the card without taking it out of the handbag spares passengers the trouble to
pull the card out, swipe it and then put it back, and also ensures the property security.
Thefts take place more frequently when passengers get on/off the bus, as they are most
likely to expose their personal belongings when taking the IC card out and putting it
back. Therefore, swiping the IC card in the handbag is very popular with female
passengers, and has become a common need for female passengers.
“Sometimes it (swiping with the card inside the purse) doesn’t work and people behind
you are waiting to get on the bus. So after I failed several times I now take it out to
swipe.” (said a female in Luorui Community in Wuhan)
“I usually take it out to swipe because in most cases swiping the card inside the bag just
doesn’t work.” (said a female in Three Mountains Community in Urumqi)
During the discussion with the IC card company in Urumqi, said it was indicated that
initially the card reader supported card swiping inside the bag, but the card reader was
85.6%
47.6%
31.7%
72.2%
58.0%
56.3%
0.0% 10.0%20.0%30.0%40.0%50.0%60.0%70.0%80.0%90.0%
Take card out of the pocket or purse
Swipe with the card inside the purse or handbag
Swipe with the card inside the shoulder bag
Chart 24: Way of IC card swiping by gender (Urumqi)
Female Male

P a g e | 31
so sensitive that passengers complained about their card being swiped for multiple
times without them knowing. In response to that, the IC card company had to reduce
its sensitivity. The IC card company could consider configuring the card reader in the
way that only one swipe is allowed from each trip, so that passengers can swipe it inside
the bag and avoid having their money deducted for multiple times.
2.4 Recharging the IC card
The survey shows most of the IC card users are using traditional methods instead of
smart recharging methods. In Wuhan, 50.0% male respondents and 42.3% female
respondents most often recharge at the service window, while 19.6% males and 16.4%
females most often recharge at the automatic vending machine. Relying on traditional
recharging ways reduces the efficiency and wastes resources. Measures to promote
automatic vending machines need to be promoted, such as allocating volunteers to
explain how to use the machine.
In Wuhan we find some noteworthy practice — setting up recharging spot at
supermarkets. 28.3% males and 38.5% females use this method, not only reducing
service windows’ workload at stations but also improving passenger convenience,
especially female passengers who perform household duties. Statistics suggest women
recharging at such spots is 10% higher than that of men.
3 CCTV for Public Transport
CCTV monitoring cameras are widely used at bus stations and in vehicles. On one hand,
the monitoring center can monitor the real-time situation inside the bus or at the bus
station. On the other hand, it can extract relevant videos ex post to support the handling
of public security incidents or other disputes. This represents the social significance of
cameras safeguarding individual safety and security.
The survey shows that 91.5% respondents in Wuhan find it necessary to have CCTV
cameras on the bus, and the percentage for Urumqi was 88.4%. For the past year, 22.5%
50.0%
19.6%
28.3%
42.3%
16.4%
38.5%
0.0%
10.0%
20.0%
30.0%
40.0%
50.0%
60.0%
Service window Automatic ticket vendingmachine
Supermarket recharging spot
Chart 25: Common methods of IC card recharging by gender
(Wuhan)
Male Female

P a g e | 32
and 31.5% female respondents in the two cities respectively reported having been stolen
when traveling by public transport, while the percentage for male respondents was 22.4%
and 27.0% respectively. In general, a higher percentage of females have experienced
thefts.
There is a dedicated division in Urumqi Police responsible for thefts on buses, and the
division can assist in dealing with theft cases through playing back the video recording.
If the video has captured pictures of the suspect committing a crime, the police can use
them as evidence to arrest the criminal; if the video has not captured relevant pictures,
it can still help the police identify the suspects, so that they can arrest the criminals
when they commit the crime again.
“Recently I have read a lot in newspaper that cameras are good for us. They can capture
those stealing cases and they also can solve misunderstandings. When there were no
cameras, if people touched one another by accident, one may ask, ‘are you a thief?’
Then the other may reply, ‘No. It was just an accident.’ Misunderstandings like that can
happen and people might fight on the bus. (said a female in Erwan Community in
Urumqi)
“Now citizens have accepted the camera and wish for more. Buses here, no matter big
or small, all have cameras. Although we don’t know whether it works or not, we feel
safe when it’s around.” (said a female in Guangchang Community in Urumqi)
86.9% and 86.4% respondents in Wuhan and Urumqi respectively believe that having
cameras at bus and BRT stations can improve their personal security. 94.2% and 86.6%
respondents in Wuhan and Urumqi respectively suggest that cameras should also be
installed on main road sections between the stations, so that CCTV cameras can have
full coverage which makes travel safer and more secure especially at night.
Opponents worry about the privacy issue. They believe that while installing cameras
increases people’s sense of security, it may violate privacy by exposing individuals to
the public. Although women are usually considered to be more concerned about privacy,
when it comes to personal security, they care more about the latter.
“This is because we don’t expose our privacy in public. We will follow our religious
customs and our own manners. These things (CCTV cameras) in public do not expose
our privacy, as long as they’re not in the bathroom.” (said a female in Yierwan
Community in Urumqi)
Women’s caution toward GPS on their phones in some degree demonstrates their
concerns for personal security. Our survey shows in both cities the ratio of women using
cell phone map software is less than that of men (68.2% males and 63.2% females in
Wuhan; 59.2% males and 55.7% females in Urumqi). Women refrain themselves from
using GPS-based software or disable GPS from time to time, for fear of leaking their
location information and endangering themselves. 42.6% female respondents and 27.6%
male respondents in Wuhan have disabled the GPS function on their cellphone.
Therefore, the conflict between personal security and privacy poses a challenge to ITS
development. Solving the problem will help increase people’s sense of security about
P a g e | 33
ITS applications, especially women’s sense of security.
4 Traffic Signal System
In the past decades, great progress has been made in the technology and functions of
traffic signal controlling system. The system supports remote control and area
coordination of signal lights, which increases road network efficiency and traffic safety.
The traffic signal system can also provide signal priority for buses. However, the system
is only a tool to manage the traffic, what is more important is the management concept.
Traffic signals face two contradictions: the one between pedestrians and vehicles, and
the one between efficiency and safety. When designing and operating the signal system,
priority should be given to pedestrians and safety, which is also the best approach to
encourage people to walk and use public transportation. When interviewing residents
in both cities we have found common problems summarized as below for both genders.
Firstly, traffic green time for pedestrians in both cities is too short. Pedestrians cannot
complete street crossing before the light turns red, which is a danger especially for the
elderly and the disabled. 65.5% residents in Wuhan had such experiences; the
percentage for Urumqi was 80.4%. In Wuhan, 64.9% people aged over 50 think the
green time is too short and has caused inconvenience for them; the percentage is 81.5%
in Urumqi.
“Some green time are long enough but others are not. When the light turns green, I get
across very, very quickly.” (said a male in Luorui Community in Wuhan)
Secondly, vehicle right turning and pedestrian crossing are giving green lights at the
same time, which violates the pedestrians’ right of way. So even during green light,
pedestrians still face conflicts with cars. 81.4% respondents in Wuhan and 82.9% in
Urumqi said they have witnessed right-turning vehicles hitting pedestrians.
“Some elderly people don’t know vehicles can turn right when pedestrians cross the
road at the green light, so they don’t pay much attention to vehicles. If a vehicle comes,
those elderly people will be scared. I have seen such things for many times, right at this
intersection.” (said a male in Guangchang Community in Urumqi)
Thirdly, there are still many roads without traffic lights, posing a great threat to citizens’
safety. In Wuhan and Urumqi respectively, 64.1% respondents and 62.9% respondents
reported they have crossed such roads, feeling very usafe.
“Sometimes I need to cross the street but there’s no traffic light. However there’s a
zebra crossing, meaning pedestrians can cross. So you have to be very cautious and
seize the opportunity to cross. It is dangerous, but what else can I do?” (said a female
in Jiangang Community in Wuhan)
In summary, citizens in both cities are highly concerned about the safety at intersections.
As discussed before, we think pedestrian safety at intersections cannot be solved solely
by technologies; priority of right of way need to be re-aligned. The project team
recommends “pedestrians first”. To fulfill that concept, apart from educating and
encouraging drivers to show courtesy to pedestrians, what is more important is to roll

P a g e | 34
out practical policies and action plans.
5 E-Police
Through image detecting, collecting, processing, and transmitting, E-Police
enforcement cameras can record traffic violations, such as red-light running, speeding,
illegal lane change and so on. It has been widely used all over the country and improved
traffic management efficiency. In both Wuhan and Urumqi, E-Police has played an
increasingly important role in capturing violations over on-the-spot enforcement.
Survey data in Wuhan shows among all drivers interviewed, nearly one quarter (24.1%)
of violations were recorded by traffic police on the spot, while, the rest three quarters
(75.9%) were captured by E-Police. In Urumqi, data shows that one third (31.9%) were
recorded by traffic police and two thirds (68.1%) were by E-Police.
In the past year, among Wuhan divers interviewed, male drivers had 2.7 violations on
average and female drivers had 2. In Urumqi, male drivers interviewed had 1.1
violations on average, and
female drivers had 1.2.
Further analysis showed (see
Chart 26) the percentage of
female drivers who are
caught by E-Police is much
higher than males. We found
through the interview that
one of the reasons was that
male drivers were better at
memorizing the location of
E-Police camers, so they
could avoid penalty.
“Yes. I know most of the locations of E-Police on roads that I am familiar with, so I can
pay attention to them when I am there.” (Wuhan, male, Youth Community)
“I don’t notice the E-Police. I do not violate, and I have a weakness of forgetting routes
easily. Even I passed through it today, I would not find it tomorrow. ” (Urumqi, female,
Three Mountains Community)
We believe the aim of E- Police is to regulate driving behavior and promote
management efficiency, rather than fining. Therefore, traffic police department should
establish a set of fairer and more transparent enforcement system, e.g., disclosing the
location of E-Police cameras to the public on a regular basic, with explanation of the
rationale for safety improvement, and combine enforcement with publicity and
education to raise citizen’s awareness of compliance with traffic laws and regulations.
In addition, according to Urumqi Traffic Police, the survey result may not necessarily
reflect the reality of violations by gender. Many female drivers replace males and accept
off-site penalty, which, to some extent, influences the justice of traffic law enforcement
75.6%87.5%
70.8% 73.6%
24.4%12.5%
29.2% 26.4%
0%
20%
40%
60%
80%
100%
Male (Wuhan) Female(Wuhan)
Male (Urumqi) Female(Urumqi)
Chart 26: Enforcement methods of traffic
violations by gender in Wuhan and Urumqi
(2014)
Electronic police On-the-spot enforcement
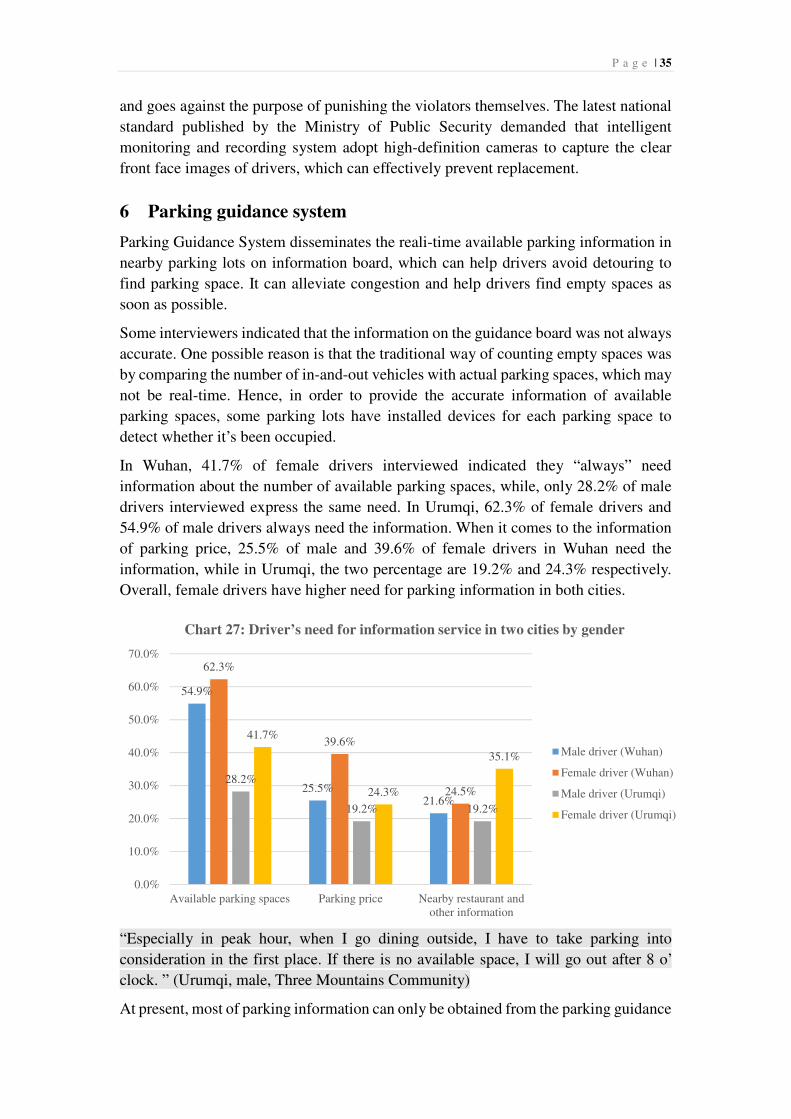
P a g e | 35
and goes against the purpose of punishing the violators themselves. The latest national
standard published by the Ministry of Public Security demanded that intelligent
monitoring and recording system adopt high-definition cameras to capture the clear
front face images of drivers, which can effectively prevent replacement.
6 Parking guidance system
Parking Guidance System disseminates the reali-time available parking information in
nearby parking lots on information board, which can help drivers avoid detouring to
find parking space. It can alleviate congestion and help drivers find empty spaces as
soon as possible.
Some interviewers indicated that the information on the guidance board was not always
accurate. One possible reason is that the traditional way of counting empty spaces was
by comparing the number of in-and-out vehicles with actual parking spaces, which may
not be real-time. Hence, in order to provide the accurate information of available
parking spaces, some parking lots have installed devices for each parking space to
detect whether it’s been occupied.
In Wuhan, 41.7% of female drivers interviewed indicated they “always” need
information about the number of available parking spaces, while, only 28.2% of male
drivers interviewed express the same need. In Urumqi, 62.3% of female drivers and
54.9% of male drivers always need the information. When it comes to the information
of parking price, 25.5% of male and 39.6% of female drivers in Wuhan need the
information, while in Urumqi, the two percentage are 19.2% and 24.3% respectively.
Overall, female drivers have higher need for parking information in both cities.
“Especially in peak hour, when I go dining outside, I have to take parking into
consideration in the first place. If there is no available space, I will go out after 8 o’
clock. ” (Urumqi, male, Three Mountains Community)
At present, most of parking information can only be obtained from the parking guidance
54.9%
25.5%21.6%
62.3%
39.6%
24.5%28.2%
19.2% 19.2%
41.7%
24.3%
35.1%
0.0%
10.0%
20.0%
30.0%
40.0%
50.0%
60.0%
70.0%
Available parking spaces Parking price Nearby restaurant andother information
Chart 27: Driver’s need for information service in two cities by gender
Male driver (Wuhan)
Female driver (Wuhan)
Male driver (Urumqi)
Female driver (Urumqi)
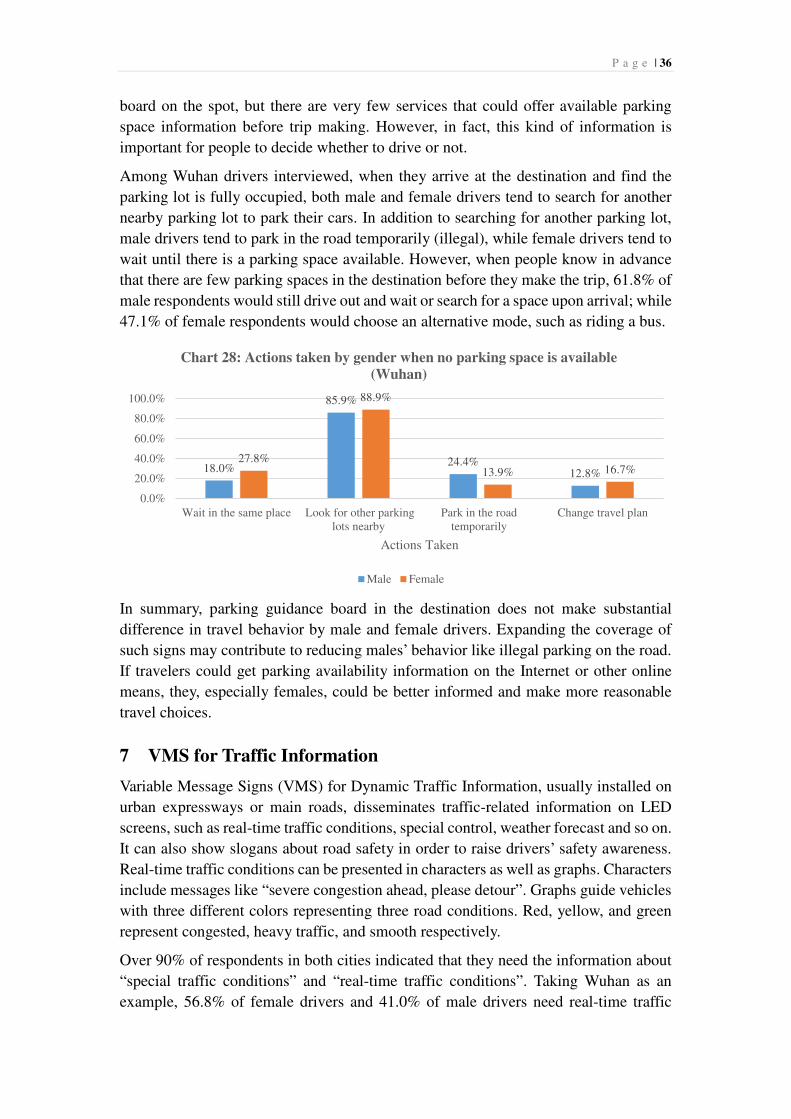
P a g e | 36
board on the spot, but there are very few services that could offer available parking
space information before trip making. However, in fact, this kind of information is
important for people to decide whether to drive or not.
Among Wuhan drivers interviewed, when they arrive at the destination and find the
parking lot is fully occupied, both male and female drivers tend to search for another
nearby parking lot to park their cars. In addition to searching for another parking lot,
male drivers tend to park in the road temporarily (illegal), while female drivers tend to
wait until there is a parking space available. However, when people know in advance
that there are few parking spaces in the destination before they make the trip, 61.8% of
male respondents would still drive out and wait or search for a space upon arrival; while
47.1% of female respondents would choose an alternative mode, such as riding a bus.
In summary, parking guidance board in the destination does not make substantial
difference in travel behavior by male and female drivers. Expanding the coverage of
such signs may contribute to reducing males’ behavior like illegal parking on the road.
If travelers could get parking availability information on the Internet or other online
means, they, especially females, could be better informed and make more reasonable
travel choices.
7 VMS for Traffic Information
Variable Message Signs (VMS) for Dynamic Traffic Information, usually installed on
urban expressways or main roads, disseminates traffic-related information on LED
screens, such as real-time traffic conditions, special control, weather forecast and so on.
It can also show slogans about road safety in order to raise drivers’ safety awareness.
Real-time traffic conditions can be presented in characters as well as graphs. Characters
include messages like “severe congestion ahead, please detour”. Graphs guide vehicles
with three different colors representing three road conditions. Red, yellow, and green
represent congested, heavy traffic, and smooth respectively.
Over 90% of respondents in both cities indicated that they need the information about
“special traffic conditions” and “real-time traffic conditions”. Taking Wuhan as an
example, 56.8% of female drivers and 41.0% of male drivers need real-time traffic
18.0%
85.9%
24.4%12.8%
27.8%
88.9%
13.9% 16.7%
0.0%
20.0%
40.0%
60.0%
80.0%
100.0%
Wait in the same place Look for other parkinglots nearby
Park in the roadtemporarily
Change travel plan
Actions Taken
Chart 28: Actions taken by gender when no parking space is available
(Wuhan)
Male Female

P a g e | 37
conditions information, and 51.4% of female drivers and 43.6% male drivers need
special traffic conditions information. It can be seen that females have a greater need
for traffic information.
Although both Wuhan and Urumqi have installed a set of VMS, their usage rate is
relatively low comparing with dynamic vehicle navigation or traffic radio. In Wuhan,
the usage rates of the three services are 41.2%, 33.3% and 21.9%, respectively. In
Urumqi, the rates are 60.6%, 48.5% and 24.2%, respectively. The order of usage of
three services is the same in two cities and the usage does not make show distinctions
by gender.
8 Positioning and Navigation
Mobile navigation and in-vehicle GPS are the main tools for drivers to position and
navigate. They can promote drivers’ efficiency and effectiveness in finding roads, and
have now been widely used. 93% of Wuhan’s drivers interviewed and 78.2% of
Urumqi’s drivers interviewed use mobile navigation or in-vehicle GPS. Over 90% of
drivers (Wuhan 95.3%, Urumqi 93.3%) will use navigation system only when they are
not familiar with the routes. Besides route query, some drivers also take advantage of
other functions in the navigation system, such as automatic reminder of over speed and
the location of e-police cameras.
“I don’t use them in familiar roads. There’s no need.” (Wuhan, male, Port Construction
Community)
“I only use GPS when I drive to somewhere I am not familiar with. I don’t need to use
56.8%
51.4%
41.0%
43.6%
0.0% 10.0% 20.0% 30.0% 40.0% 50.0% 60.0%
Realtime traffic conditions
Special traffic conditions
Tra
ffic
info
rmat
ion s
ervic
es Chart 29: Need for traffic information by gender (Wuhan)
Male Famale
0.0% 10.0% 20.0% 30.0% 40.0% 50.0% 60.0% 70.0%
VMS for Traffic Information
Traffic radio
Dynamic vehicle navigation
Tra
ffic
info
rmat
ion s
ervic
es
Chart 30: Usage rate of various traffic information services in two cities
Driver (Urumqi) Driver (Wuhan)

P a g e | 38
it inside the city. When I drive out of the city and go to some other places, I will use it.”
(Urumqi, male, Square Community)
The survey found there is a gender difference in using mobile navigation and in-vehicle
GPS. Among Wuhan’s respondents, 82.1% of male drivers use GPS only when they
drive in unfamiliar roads. The percentage of female is 77.8%. 14% of female drivers
and 11.5% of male drivers “use GPS wherever they go”. Obviously, female drivers rely
much more on navigation than male drivers.
In some news reports, as female drivers are unfamiliar with routes and road signs and
may have poor parking skills, they are often called “road killers”. This gender stigma
have discouraged female’s willingness to drive, and made them question their own
driving skill. More importantly, it may hide existing issues in the transport system and
traffic management, such as unreasonable road signs, inadequate parking spaces, or
inaccurate guidance information.
“It is convenient to take a bus, but difficult to drive. I am afraid of driving. There are
so many vehicles on the road, so I am afraid.” (Urumqi, female, Square Community,
interview information)
So it should be appreciated that in-vehicle GPS, mobile navigation, VMS and other
driving-assistance facilities help females learn about routes, improve driving safety,
strengthen psychological security, and reduce traffic violations.
Ethnic minority and Transport
In addition to gender and transport, our study took ethnic dimensions into consideration
when analyzing urban transport in Urumqi. Results from questionnaire survey and
interview showed that language and culture of ethnic minority have an impact on their
travels.
Firstly, ethnic gap and language barrier is the common problem in public transport.
“For example, when passengers insert coins on bus, the driver is kind to the Han-ethnic
group, but has a bad attitude toward ethnic minority. He thinks we cannot understand
what he says because of different appearances. (Urumqi, male, Erwan Community)
Although all the buses and BRTs have bi-lingual announcement in Urumqi, some
electronic signs such as electronic bus signs and VMS for traffic information have
problems displaying Uygur characters due to technical limitation of the LED screen
displays or different ethnic reading habit. Because of these technical or cultural
differences, some Uygur passengers cannot benefit from ITS and face difficulties in
taking public transport, especially those passengers from outside of Urumqi.
“They (south Xinjiang Uygurs) have to take a bus with us. Which bus should they take?
Where does the bus go? How many stations do they have to take? They have to rely on
our assistance... They seem to be at lost when they take Urumqi’s public transport
because they do not know which one they should take.” (Urumqi, male, Uygur, Square
Community)

P a g e | 39
“Being the provincial capital of Xinjiang, however, Urumqi is not fully considerate for
people from south Xinjiang. They cannot read Chinese characters and have to ask.”
(Urumqi, male, Three Mountains Community)
Questionnaire survey showed a higher percentage of women in Urumqi (17.2%) drive
compared to Wuhan (12.6%). Till 2014, the total number of private cars in Urumqi has
exceeded 520,000. Many families own more than one car. The cold weather and
security environment result in high percentage of female drivers. Percentage of females
and males who travel in their spouses’ cars are 55.6% and 50.0%, respectively. This
may be relevant to local culture that males often join banquets and drink.
“Male often drink, so their wives are worried. If women drive, their husbands can drink.
My friend is a case in point: he taught his wife to drive so that she can pick him up.”
(Urumqi, male, Uygur, Three Mountains Community)
In summary, we noticed some differences between Urumqi and Wuhan, which should
be discussed or improved. Compared with Wuhan, firstly, public transport mode share
in Urumqi is higher, but with fewer pedestrians. This may be due to weather conditions,
public transport convenience and travel cost, as well as public security. Secondly, most
residents interviewed in Urumqi have a sense of insecurity. This may account for the
high usage of private cars and high percentage of females who drive. Thirdly, local
government should improve bi-lingual information on all dissemination channels,
including ITS services, to make it convenient for Uygur passengers. Fourthly, the last
service of Urumqi’s public transport is too early, probably out of social security concern.
However, we suggest the hours of public transport service could be extended based on
further demand analysis.

P a g e | 40
Chapter Four Conclusion
1 Research Findings
1.1 Travel Characteristics by Gender
Through the research in the cities of Wuhan and Urumqi, we find there are many
similarities between genders in travel; gender differences in travel are represented by
many characteristics related to social division of gender roles. These features of
Chinese residents are also consistent with travel characteristics by gender as recognized
internationally.
First, the primary purpose of travel is for work for the vast majority of residents. Men
travel mostly for commute, while women travel are mostly for commute and
housekeeping.
Second, there are significant gender differences in mode choice of travel. Women are
more inclined to choose walking and public transport, while men are more likely to
choose private car or taxi.
Third, the transportation costs of women are significantly lower than men’s, whether
by car or public transport, and women’s costs are nearly 65% of men’s.
Fourth, safety is put in the first place by both genders. However, when “time-saving”
and “safety” are contradict with each other, men are more likely to expose to safety
risks in pursuit of efficiency; while women’s are more concerned about safety.
Fifth, in public transport environment, women in travel are more likely to encounter
risks in terms of personal safety and security, which has led to women’s self-refrain of
travel time and travel area.
Based on the above various aspects, we find public transport can not only satisfy
people’s demand for safer, more accessible and more cost-efficient trips, but also
coincide with the travel needs of women.
1.2 ITS is Using Technology to Bridge the Gender Gaps
The main purpose of ITS is to provide more efficient management and higher quality
services, and the application of technology contributes to bridging the gender gaps in
transportation.
First, the use of ITS may enhance women’s satisfaction with public transport.
The average satisfaction of Wuhan respondents with transport infrastructure is 3.17
points (out of 5), with no gender differences. But female respondents reports a higher
satisfaction with ITS: 3.23 points by women and 3.16 points by men. Urumqi is also
the same case, 3.24 points by women and 3.15 points by men.

P a g e | 41
Second, the female respondents’ frequency of using public transport-related ITS is
generally higher than men’s. This may be related to greater use of public transportation
of female; this may also due to the fact that women often combine multiple purposes
into one trip, thus requiring more accurate and real-time information to plan their trips.
Third, the relationship between safety and privacy is a concern.
The ITS applications (such as CCTV monitoring) related to the safety, as well as the
financial security-related measures (such as the real-name system of IC card) both
receive higher support from women. Meanwhile, women express concerns about
privacy and security risks from such applications/measures (such as positioning
function on mobile phones). As ITS will have a wider coverage in the future, how to
ensure the security and privacy of individuals is worth high attention.
2 Gender Issues in ITS Development – Raising Gender Awareness
First of all, we are very pleased to see that the use of ITS contribute significantly to
gender equality in social environment. However, such contribution is a relatively
“unexpected effect”, that is, its effect is not a consequence of the proactive design and
choice, but rather an unintended achievement. That is to say, the technology
advancement itself makes women enjoy more benefits.
Field survey finds that transport administrators, designers or general public involved in
daily travel all lack awareness on gender differences in transport. Many titter or scratch
their heads when they are interviewed. We strongly believe that ITS development has
a great potential to bridge gender gaps; but in order to achieve this goal transport
designers and administrators need to take proactive steps.
The study finds that compared with the general support of public transport safety
measures, some measures that focus on the welfare of women (such as women-only
subway cars) have a lot of controversy, and men are more skeptical. The main reason
for opposing is its potential impact on “efficiency”, that is, when the efficiency and
gender equality contradict with each other, people are more likely to choose efficiency.
We believe that raising the gender awareness of transport practitioners and
administrators and taking gender into consideration during all process for ITS planning,
design, construction and operation, will tap the enormous potential of ITS, and make
ITS development a new mechanism to realize gender equality. Therefore, we have
summarized the findings and recommendations into a technical guideline:
Incorporating Gender into ITS Planning, Design and Operation.
3 Issues to be Studied
First, for the implementation of transport policies and the construction of public
facilities that address different gender needs, full-cycle data collection and monitoring
will be required to analyze their gender impacts. For example, the impact of improving
lighting of bus stops at night to attract passengers, or the impact of adding more
surveillance cameras.

P a g e | 42
Second, the study finds that women are more likely to choose public transport or
walking. But due to the lack of data like income, we cannot make an in-depth analysis
of women’s motivation. If women still choose public transport when economic
conditions permit, it can be argued that women are more inclined to choose eco-friendly
travel. Furthermore, it is necessary to conduct a deep investigation into the
environmental awareness of travel by gender, that is, the analysis of people’s priority
of environmental protection, safety and efficiency on mode choice.
Third, the introduction of real-name system for bus IC card will provide a full-sample
transport data of different gender and age. In addition, the location and social data of
mobile phone based positioning and taxi App can also provide a basis for the further
research to understand the different needs and characteristics of travel between genders.