Gender gaps and gendered action in a first-year physics ... · PDF fileGender gaps and...
14
Gender gaps and gendered action in a first-year physics laboratory James Day, 1 Jared B. Stang, 1 N. G. Holmes, 2 Dhaneesh Kumar, 1 and D. A. Bonn 1,* 1 Department of Physics and Astronomy, University of British Columbia, Vancouver, British Columbia, Canada V6T 1Z1 2 Department of Physics, Stanford University, Stanford, California, 94305, USA (Received 30 January 2015; published 1 August 2016) [This paper is part of the Focused Collection on Gender in Physics.] It is established that male students outperform female students on almost all commonly used physics concept inventories. However, there is significant variation in the factors that contribute to the gap, as well as the direction in which they influence it. It is presently unknown if such a gender gap exists on the relatively new Concise Data Processing Assessment (CDPA) and, therefore, whether gendered actions in the teaching lab might influence—or be influenced by—the gender gap. To begin to get an estimates of the gap, its predictors, and its correlates, we have measured performance on the CDPA at the pretest and post-test level. We have also made observations of how students in mixed-gender partnerships divide their time in the lab. We find a gender gap on the CDPA that persists from pre- to post-test and that is as big as, if not bigger than, similar reported gaps. We also observe compelling differences in how students divide their time in the lab. In mixed-gender pairs, male students tend to monopolize the computer, female and male students tend to share the equipment equally, and female students tend to spend more time on other activities that are not the equipment or computer, such as writing or speaking to peers. We also find no correlation between computer use, when students are presumably working with their data, and performance on the CDPA post-test. In parallel to our analysis, we scrutinize some of the more commonly used approaches to similar data. We argue in favor of more explicitly checking the assumptions associated with the statistical methods that are used and improved reporting and contextualization of effect sizes. Ultimately, we claim no evidence that female students are less capable of learning than their male peers, and we suggest caution when using gain measures to draw conclusions about differences in science classroom performance across gender. DOI: 10.1103/PhysRevPhysEducRes.12.020104 I. INTRODUCTION A consensus has developed in the physics education research literature that a gender gap exists for many of the commonly used physics concept inventories (e.g., FCI, FMCE, BEMA, and CSEM), with male students generally outperforming female students. However, across published studies there is significant variation in the development of the gap over time, the various factors that influence the gap, and even the way in which factors influence the gap (see Ref. [1], which is a review article summarizing 17 different studies). In all likelihood, the observed gender gaps are due to a combination of many gendered factors rather than any one that can be easily modified. For many physics courses— with a variety of learning environments and activities, both in and out of class, and all of the previous life experience of the students—it is difficult to isolate the root causes. This difficulty has contributed to a difference between the actual and desired state of affairs in the physics education research community. There is much that we would like to know that we simply do not yet know. An examination of our ignorance highlights some of the field’ s needs, and we are in a position to address some of these issues. The first issue we address is related to a measure of the gender gap. One diagnostic for which the gender gap has not yet been explored is the Concise Data Processing Assessment (CDPA), a relatively new concept inventory that provides a quantitative measure of student abilities related to the nature of measurement and uncertainty and to handling data [2]. We do not know whether a gender gap exists on the CDPA and, if it does, how big the effect is. The second issue we address is related to the analyses of such data, that should tell us about the absence or presence and magnitude of the gender gap. Some commonly used techniques, such as calculating an estimate of gain, are often too simple for a problem as complex as how people learn (which includes but is not limited to acquiring new skills, modifying existing knowledge, and reinforcing specific behaviors) and how learning may differ between genders. We will present a range of alternative analysis methods, including five different metrics for calculating gain. The third issue we address is related to the dynamics of student interactions in the teaching labs and how they might influence, or are influenced by, the gender gap. * [email protected] Published by the American Physical Society under the terms of the Creative Commons Attribution 3.0 License. Further distri- bution of this work must maintain attribution to the author(s) and the published article’s title, journal citation, and DOI. PHYSICAL REVIEW PHYSICS EDUCATION RESEARCH 12, 020104 (2016) 2469-9896=16=12(2)=020104(14) 020104-1 Published by the American Physical Society
Transcript of Gender gaps and gendered action in a first-year physics ... · PDF fileGender gaps and...
Gender gaps and gendered action in a first-year physics laboratory
James Day,1 Jared B. Stang,1 N. G. Holmes,2 Dhaneesh Kumar,1 and D. A. Bonn1,*1Department of Physics and Astronomy, University of British Columbia, Vancouver,
British Columbia, Canada V6T 1Z12Department of Physics, Stanford University, Stanford, California, 94305, USA
(Received 30 January 2015; published 1 August 2016)
[This paper is part of the Focused Collection on Gender in Physics.] It is established that male studentsoutperform female students on almost all commonly used physics concept inventories. However, there issignificant variation in the factors that contribute to the gap, as well as the direction in which they influenceit. It is presently unknown if such a gender gap exists on the relatively new Concise Data ProcessingAssessment (CDPA) and, therefore, whether gendered actions in the teaching lab might influence—or beinfluenced by—the gender gap. To begin to get an estimates of the gap, its predictors, and its correlates, wehave measured performance on the CDPA at the pretest and post-test level. We have also made observationsof how students in mixed-gender partnerships divide their time in the lab. We find a gender gap on theCDPA that persists from pre- to post-test and that is as big as, if not bigger than, similar reported gaps. Wealso observe compelling differences in how students divide their time in the lab. In mixed-gender pairs,male students tend to monopolize the computer, female and male students tend to share the equipmentequally, and female students tend to spend more time on other activities that are not the equipment orcomputer, such as writing or speaking to peers. We also find no correlation between computer use, whenstudents are presumably working with their data, and performance on the CDPA post-test. In parallel to ouranalysis, we scrutinize some of the more commonly used approaches to similar data. We argue in favor ofmore explicitly checking the assumptions associated with the statistical methods that are used andimproved reporting and contextualization of effect sizes. Ultimately, we claim no evidence that femalestudents are less capable of learning than their male peers, and we suggest caution when using gainmeasures to draw conclusions about differences in science classroom performance across gender.
DOI: 10.1103/PhysRevPhysEducRes.12.020104
I. INTRODUCTION
A consensus has developed in the physics educationresearch literature that a gender gap exists for many ofthe commonly used physics concept inventories (e.g., FCI,FMCE, BEMA, and CSEM), with male students generallyoutperforming female students. However, across publishedstudies there is significant variation in the development ofthe gap over time, the various factors that influence the gap,and even the way in which factors influence the gap (seeRef. [1], which is a review article summarizing 17 differentstudies). In all likelihood, the observed gender gaps are dueto a combination of many gendered factors rather than anyone that can be easily modified. For many physics courses—with a variety of learning environments and activities, bothin and out of class, and all of the previous life experience ofthe students—it is difficult to isolate the root causes. Thisdifficulty has contributed to a difference between the actualand desired state of affairs in the physics education research
community. There is much that we would like to knowthat we simply do not yet know. An examination of ourignorance highlights some of the field’s needs, and we are ina position to address some of these issues.The first issue we address is related to a measure of the
gender gap. One diagnostic for which the gender gap hasnot yet been explored is the Concise Data ProcessingAssessment (CDPA), a relatively new concept inventorythat provides a quantitative measure of student abilitiesrelated to the nature of measurement and uncertainty and tohandling data [2]. We do not know whether a gender gapexists on the CDPA and, if it does, how big the effect is. Thesecond issue we address is related to the analyses of suchdata, that should tell us about the absence or presence andmagnitude of the gender gap. Some commonly usedtechniques, such as calculating an estimate of gain, areoften too simple for a problem as complex as how peoplelearn (which includes but is not limited to acquiring newskills, modifying existing knowledge, and reinforcingspecific behaviors) and how learning may differ betweengenders. We will present a range of alternative analysismethods, including five different metrics for calculatinggain. The third issue we address is related to the dynamicsof student interactions in the teaching labs and how theymight influence, or are influenced by, the gender gap.
Published by the American Physical Society under the terms ofthe Creative Commons Attribution 3.0 License. Further distri-bution of this work must maintain attribution to the author(s) andthe published article’s title, journal citation, and DOI.
PHYSICAL REVIEW PHYSICS EDUCATION RESEARCH 12, 020104 (2016)
2469-9896=16=12(2)=020104(14) 020104-1 Published by the American Physical Society
Given the right type of data, correlations (or lack thereof)between student performance on a relevant diagnostic andtheir gendered in-lab behaviors—naturally connected tolearning and/or practicing data handling skills—wouldbecome apparent. Our interest in a gender gap on theCDPA is closely associated to our concern over how genderplays out in a laboratory environment.To make a measurement of the gender gap, the CDPA
was deployed at the University of British Columbia (UBC),as a pretest and as a post-test, and across several years. Toevaluate differences in students’ performance on the CDPA,we performed an analysis of covariance (ANCOVA),calculated effect sizes, and contextualized our results.This particular path was chosen after carefully scrutinizingour original approach to the data, one which was similar tomany previous studies. To explore how student dynamicsmight influence student performance on the CDPA, weobserved how students spent their time handling the labequipment, working on the computer, or performing othertasks, and explored relevant correlations.This paper begins with a brief summary of the theoretical
framework that guides our study. We then present thegender gap that exists for the CDPA and work towards anunderstanding of what our data are telling us. In parallel to adescription and application of some standard analyses, wescrutinize some of the issues related to measurements ofgain with concept inventories; given the biases introducedby various estimates, we suggest caution when using gainmeasures to draw conclusions about differences in scienceclassroom performance across gender. We next share theresults from an ANCOVA, used to determine the effect ofgender on post-test CDPA scores after controlling forpretest CDPA scores. The persistence of the gender gapon the CDPA, from pre- to post-test, raises the question ofwhat might be happening in the lab that could lead to aninteraction effect: How do students’ gendered dynamics inthe lab affect how they ultimately perform on the CDPApost-test? We assess this with observations that comparefemale and male students’ use of lab equipment (presum-ably to collect data) and computers (presumably to analyzedata) in mixed-gender pairs. Finally, we highlight theconfounding factors in our work and touch on somepotential implications for instructors and future researchquestions.
II. THEORETICAL BACKGROUND
The theoretical framework we use borrows keyideas from poststructural gender theory [3] and situatedcognition [4–6].By gender, in this paper, we mean the social roles based
on the biological sex of the person (culturally learned) and/or the personal identification of one’s own gender based onan internal awareness (gender identity). We explicitlyacknowledge that the gendering of the discipline of physicsis complex in nature; learning physics—and also becoming
a physicist—is a gendered experience [7]. Brotman andMoore [8] provide an extensive review of the literatureabout gender bias in the construction of scientific knowl-edge, the cultural norms and values of scientific commun-ities, and curricular and pedagogical practices in scienceeducation.In situated cognition [5], knowledge is a product of the
activity, context, and culture within which it is developedand used. The enterprise of learning itself is viewed asbeing contextually constrained; the context limits what canbe learned and shapes how it is learned. The concept of acommunity of practice is fundamental to situated learning[6]. A community of practice is a group of people engagedin a mutual activity, in pursuit of a shared goal. The doingof physics may be understood as participating in acommunity of practice. The doing of gender may alsobe understood as participating in a community of (mascu-line and feminine) practice [9,10]. A second—different butinterrelated—perspective of communities of practice per-tains to identity, and is concerned with how the individualparticipants relate to their community of practice. Thenotion of communities of practice is particularly relevant inour laboratory course by design; we are guiding students toconstruct their own knowledge and habits of mind in anenvironment that is nearly 100% collaborative.We use these systems to make sense of how our physics
students perform on a data handling skills diagnostic at the
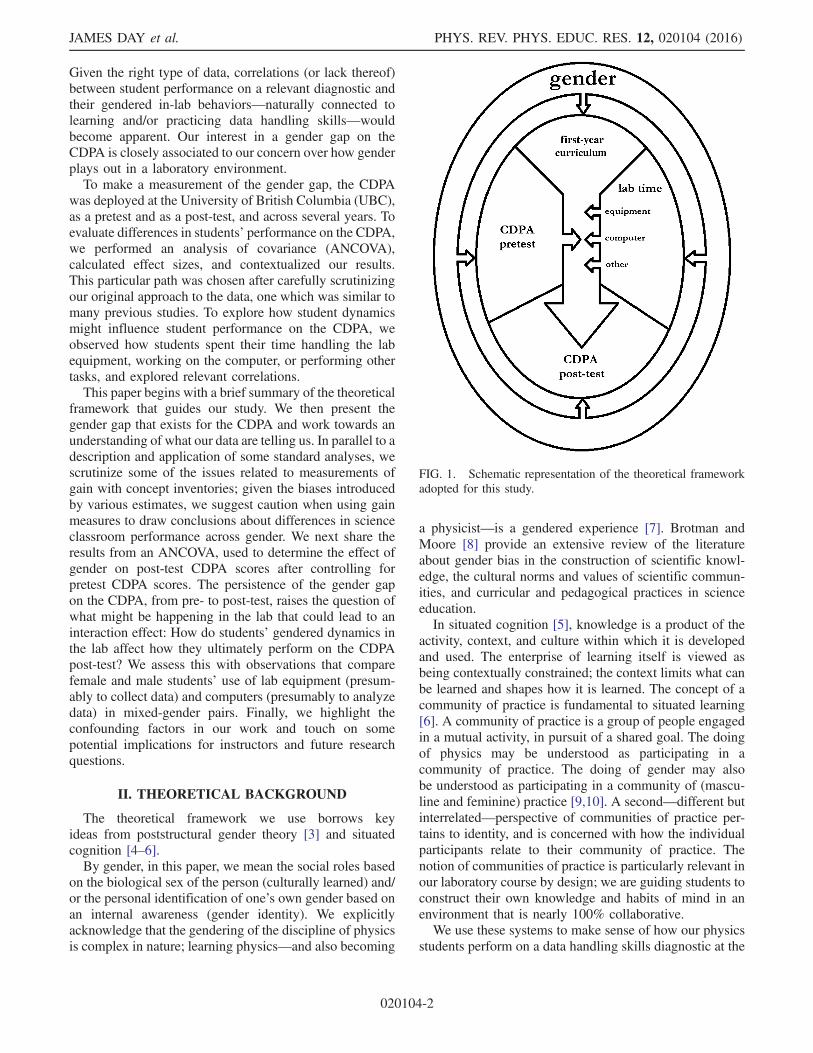
FIG. 1. Schematic representation of the theoretical frameworkadopted for this study.
JAMES DAY et al. PHYS. REV. PHYS. EDUC. RES. 12, 020104 (2016)
020104-2

beginning and end of their first academic year, as well ashow they behave in the lab.The ways in which these theories relate to learning in our
lab course are shown in Fig. 1. At a base level, students’learning is guided by the first-year curriculum (upper, innerarea), and their interaction with this curriculum shouldpredict how they perform on the post-test (lower, innerarea). At some higher level, we recognize that how studentsassimilate this first-year curriculum depends critically onwhat they bring with them into their first year, represented bytheir performance on the pretest (left, inner area). How theyassimilate the curriculum is also dependent on how theypractice physics, represented by their behavior in the lab(right, inner area). Finally, we acknowledge that ubiquitousand complex gendering always applies (outer boundary). Allfour of these sections fall under the influence of gender.
III. METHODS
A. Research environment
Our data were collected from the laboratory componentof an introductory physics course at the University ofBritish Columbia.The course is calculus based and is offered as two,
consecutive, single-semester labs. It is intended for first-year students with an interest in the science, technology,engineering, and math (STEM) fields. Most of these studentswill eventually earn a degree in physics, chemistry, or the lifesciences. About 80% of the students who take the firstsemester also take the second semester, while about 5% ofthe students in the second semester were not registered in thefirst semester. However, we report only on students whowere registered in both semesters, and for whom we havepaired pre- and post-test data. Students attend a weekly,three-hour lab section, with 30–50 students in each section,facilitated by two graduate teaching assistants and oneinstructor. The lecture component associated with this labcovers standard first-year physics material.The learning goals for this physics laboratory [11] focus
on a specific set of foundational experimentation skills.These skills include accounting for the nature of uncer-tainty in all measurements, developing statistical andgraphical methods for evaluating data, and initiatingproficiency at collecting and interpreting data. (Similarbasic skills can be equally important to those pursuingcareers outside of physics, for example, in the medicalsciences [12,13].) Such goals are considerably differentfrom those of the traditional first-year physics laboratory,which are often focused on illustrating fundamental con-cepts and theories, facility with laboratory equipment,and written or oral scientific communication. However,they align well with the AAPT recommendations for theundergraduate physics laboratory curriculum [14], whichfocuses on constructing knowledge, modeling, designingexperiments, developing technical and practical laboratory
skills, analyzing and visualizing data, and communicatingphysics. Physics concepts can be—and are—carefullywoven into the course. Substantial research on the extentto which labs can contribute to students’ conceptualunderstanding of physics has been well documented[15]; nevertheless, the primary aim of these laboratoriesis to establish a meaningful understanding of and a practicalmastery of handling data.Data were collected over five academic years, from
2009–10 to 2013–14. The number of students enrolledranged from 130 to 145 each year, with a total of 471having matched pretest and post-test scores. Female studentrepresentation in the class ranged from 37% to 44%.
B. Data collection
1. Gender
As mentioned above in Sec. II, we hold the complexgendering of physics to be true. As far as our categoricalgender data are concerned, however, we do not—andcannot—properly treat gender as constructed, flexible,and continuous. Instead, we simplify and treat gender asa dichotomous, stable category. We focus on the differencesbetween the genders rather than on the variations within.Our categorical gender data are generated when an
individual first creates a student account as a part of theirapplication to UBC. During the account creation, variousbiographical data are required: the “First Name” and “LastName” categories are both open-ended text boxes; the“Date of Birth” categories (day, month, and year) are drop-down menus; the “Gender” category is a radio buttonselection with only “male” or “female” options available.
2. Concept inventory
Our concept inventory data were obtained using theConcise Data Processing Assessment, a ten-question,multiple-choice instrument that provides a quantitativemeasure of student abilities related to understandingmeasurement and uncertainty and to handling data.Specific learning goals targeted by the CDPA include,but are not limited to, being able to weigh the relativeimportance of numbers that have differing uncertainty;judge whether or not a model fits a data set; linearizeexponential distributions, by using semilog plots, andpower-law distributions, by using log-log plots andpower-law scaling; and extract meaning from the slopeand intercept of data that have been linearized. The CDPAwas used as both a pretest and a post-test, and wasadministered during the first (early September) and final(late March) weeks of labs. Students were given 30 minutesto complete all ten questions and were asked not to use acalculator. Their performance was motivated by the explan-ation that the collective results will help us to improve thequality of the course, as well as the promise that theirindividual scores could only have an upward influence on
GENDER GAPS AND GENDERED ACTION … PHYS. REV. PHYS. EDUC. RES. 12, 020104 (2016)
020104-3
their final lab grade (up to 1% bonus). The CDPA has goodevidence of validity, and statistical tests indicate that theCDPA is a reliable assessment tool, with good dynamicrange, for measuring targeted abilities in undergraduatephysics students. Scores on the CDPA range from about25% (pretest, for novices) to about 80% (for experts).Details of its development and administration can be foundelsewhere [2,16].We use the CDPA for pedagogical reasons. Beyond
having undergone careful item construction, the CDPAprobes many of the broadly applicable skills that will be ofvalue to our students regardless of their later academic path.The primary goals of the lab course, described above, alsoalign well to the skills tested by the CDPA. There may besome gender effects specifically related to laboratoryinstruction and group work in a laboratory environment.We also use the CDPA for research reasons. Research
suggests that more difficult tests produce greater stereotypethreat effects [17]. In parallel with our analysis of studentperformance on the CDPA, we carefully scrutinize theassumptions associated with commonly used statisticalmethods, the methods themselves, and the contextualiza-tion of effect sizes. To best do this, a difficult assessmenthelps us to achieve the biggest signal.
3. In-lab observations
Our in-lab, student behavior data were collected using ascheme similar to that of two recent studies [18,19] and wasinspired by the Baker-Rodrigo Observation MethodProtocol [20,21]. On a spatial map of the lab room,observers recorded snapshots of student activity. Froman unobtrusive vantage point and while wandering aroundthe room, an observer would record whether a student washandling the lab equipment (coded as Equipment); workingon their computer (coded as Computer); or doing anythingelse (coded as Other), which, in effect, meant writing,talking, being temporarily absent from the room, or offtask. Each observation was tagged to a specific seat in thelab room, and each seat corresponded to a specific desktopcomputer, assigned to a pair of randomly partnered stu-dents. This procedure allowed us to obtain a snapshot of theentire classroom (record the instantaneous behavior of eachstudent) in 2–3 minutes. By repeating this process atroughly five-minute intervals, we can construct a timelineof student behaviors over the course of a full lab session.Two separate observers collected data. One observer
(NGH) was a teaching assistant (TA) in two sections of thecourse while the other observer (JBS) had no previousconnection to the course. An observer never served as a TAfor any of the lab sections they observed; the lab wasalways overseen by an instructor and two TAs. In order toestablish the reliability of observations, both observersperformed a full set of observations for a single lab period.They did not make observations of individuals at thesame time; rather, they followed the observation protocol,
individually, for the full session. Comparing the codes fromthe two raters provides a measure of the reliability of thecoding scheme for individual students across a full labsession. For each student, a normalized participation ineach behavior was calculated from each observer’s results.These are the fractions of time that the student was recordedin that behavior when at least one partner in the pair wasrecorded in that behavior. The Spearman correlationbetween observers for student equipment use was 0.79,the correlation for student computer use was 0.92, and thecorrelation for other behaviors was 0.80, all showing goodagreement between the two observers.Observations were collected in all four sections of three
separate lab experiments during the second term of thecourse, of the 2013–2014 academic year. Each female-malepair was observed (a snapshot of their behaviors wasrecorded) an average of 16 times per lab experiment, anda total of 2133 observations of female-male pairs were madethrough the three weeks of observations. The three experi-ments were the first, second, and sixth of ten experimentsover the term. The first experiment required making a high-quality measurement of a spring constant using Hooke’s law.The second experiment required making a high-qualitymeasurement of the resonant oscillation frequency of thesame mass-on-a-spring system. The third experimentrequired making a high-quality measurement of the timeconstant of a discharging capacitor in a parallel resistor-capacitor (RC) circuit. These labs offered the best oppor-tunity for observing instances of each type of behavior.
IV. RESULTS AND DISCUSSION
A. Concept inventory
Our assessment data address the open question ofwhether there exists a gender gap for the CDPA on pretestand on post-test, and whether that gap changes from pre- topost-test.
1. Identifying whether a gap exists
The independent-samples t-test is commonly used todetermine whether a statistically significant difference existsbetween the means of two independent groups on acontinuous dependent variable. Upon overview of severalpublished research studies in the physics education literature,we have noticed that oftentimes an examination of theunderlying assumptions behind a statistical test are notpresented (see, e.g., Refs. [22–26], which have collectivelybeen cited more than 250 times). This very well could be aself-selection effect; i.e., only manuscripts containing datafulfilling the assumptions are submitted. But it could also bethat violations of assumptions are rarely checked for in thefirst place—something we were guilty of in the early stagesof writing this paper. This is consistent with the findingsfrom a recent study [27] that further revealed a generallack of knowledge about the assumptions themselves, the
JAMES DAY et al. PHYS. REV. PHYS. EDUC. RES. 12, 020104 (2016)
020104-4

robustness of the techniques with regards to the assumptions,and how or whether the assumptions should be checked.Applying any statistical techniques with unmet assumptionscan influence both type I and type II errors, as well as resultin overestimation or underestimation of inferential measuresand effect sizes. Keselman et al. [28] argue that “the appliedresearcher who routinely adopts a traditional procedurewithout giving thought to its associated assumptions mayunwittingly be filling the literature with non-replicableresults.” To help avoid the fate of nonreplicable results here,the six assumptions that must first be considered in order torun an independent-samples t-test are explicitly addressed inAppendix A.Pre- and post-test scores, for female and male students,
are shown in Fig. 2 and Table I. These low scoresdemonstrate that the CDPA is a difficult assessment; infact, random guessing produces a score of 23.5%. Asummary of the difficulty and discriminatory power ofthe CDPA is included in Appendix B. On the pretest, thereis a statistically significant gender gap favoring males,which has a value of 8.6� 2.7% [mean difference �95%confidence interval (CI)], tð469Þ ¼ 5.95, p < 0.001. Onthe post-test, there is also a statistically significant gendergap favoring males, which has a value of (11.1� 2.7)%,tð469Þ ¼ 6.13, p < 0.001. Examining student post-testperformance item by item shows that the gap is fairlyuniform across the entire test (see Appendix C). The twoexceptions are both questions that require judging thequality of fit of a linear model to data, which are equallydifficult for all students.
That the mean difference is statistically significant,however, is the less interesting thing about the data. Thisabsolute difference does not take into account the variabil-ity in scores [29]—after all, not every subject achieved theaverage outcome. We care not only about whether there is adifference but also about the size of the difference.An effect size is a quantitative measure of the strength of a
particular phenomenon. Knowing the magnitude of an effectallows us to ascertain the practical significance of statisticalsignificance. We use Hedges’ g effect size value [30], insteadof the more commonly encountered Cohen’s d, since thesample sizes of our two groups are unequal. Hedges’ gsuggests a medium effect size for both our pretest result(g ¼ 0.56) and our post-test result (g ¼ 0.57). These num-bers should be interpreted as group means that differ byslightly more than half a standard deviation, each. In Cohen’sterminology [31,32], a small effect size is one in which thereis a real effect—something is really happening in the world—but which you can only see through careful study. A largeeffect size is one that is big enough and/or consistent enoughthat you may be able to see it “with the naked eye.” Amedium effect size lies between the above two.To better contextualize this finding, we can ask what sort
of effect sizes other similar studies have found. A recentreview of the literature on the gender gap on conceptinventories in physics provides a summary of these data:in particular, see Figs. 1 and 2 of Madsen et al. [1]. In theseventeen separate studies that they reviewed—of the FCI,FMCE, BEMA, and CSEM—there was (almost) always agender gap favoring males, on pretests and post-tests. Thesecan be used to calculate effect sizes for each of thoseseventeen studies, against which we can contrast our effectsizes. Figure 3 shows a histogram of the effect sizes, onpretests and post-tests, for each of the seventeen studiesreviewed in Ref. [1] alongside the effect sizes associated withour study. The effect sizes we are observing on the CDPA areat least as large as any found in other similar studies.Evaluating effect sizes is not easily done. One reason is
that most phenomena are multivariable problems: to isolatejust one that has an effect on an interesting outcome is atriumph even when, in particular instances, that variablemight be overwhelmed by others with opposite influence.
female male
0
2
4
CD
PA
scor
epretest post-test
FIG. 2. CDPA pretest (solid columns) and post-test (hatchedcolumns) results for the populations studied. The raw CDPAscore is out of a maximum possible of ten points. Our students arelearning, but the status quo remains. Uncertainty bars representthe 95% confidence interval. These data consist of 191 femaleand 280 male students (the ones for which we have paired pre-and post-test data).
TABLE I. Summary of CDPA pretest and post-test data shownin Fig. 2.
CDPA score, with 95% CI
Gender Lower bound Mean Upper bound
PretestFemale 2.27 2.46 2.65Male 3.13 3.32 3.51
Post-testFemale 2.98 3.23 3.48Male 4.10 4.34 4.58
GENDER GAPS AND GENDERED ACTION … PHYS. REV. PHYS. EDUC. RES. 12, 020104 (2016)
020104-5

Another reason is that even “small” effects can result inlarge consequences over time. The CDPA effect sizesindicate that we probably should care about the size ofthe gap. They are large enough that the difference inperformance might be noticed by the students and, there-fore, could reinforce negative stereotypes about the womenwho have already made it this far along the leaky pipelineof STEM [33]. They imply that a sizable minority areperforming less well on some rather important skills—thisis a theoretical problem, not just a practical one. Theperspective of effect size is requisite for informedjudgment; without it, we cannot parse that which is firmlyrelevant from that which is vanishingly subtle and, in somecases, notoriously difficult to replicate.While our analysis thus far tells us that gaps exist at the
pre- and post-test, we further want to explore the impact ofour first-year curriculum and students’ experiences in thelab on their performance. How does the gap change overtime? To explore this, we first examine measures oflearning “gain.”
2. Gain
Many instructors rely on some measure of gain toquantify how students’ performances have changed, frompre- to post-test: a proxy for how much has been learned.But pre- and post-test scores are not exactly measures ofthe same variable; change, by nature, is multivariate. Thereis more than one way to measure gain [34], and argumentsin favor of using any one of them are, superficially,sensible. But it can be easy to mistake understandinghow something is used with whether something shouldbe used. In principle, as researchers, we understand thatsufficient context is required when drawing conclusionsfrom one’s data. In practice, we have found that this contextis significantly less easy to come by when dealing withmeasures of learning gain.Recently, the appropriate use of normalized gain and
other gain score calculations has been scrutinized byeducation researchers, noting a strong positive correlationbetween pretest scores and normalized gain [23]. Given thebiases introduced by various learning gains, caution mustbe taken when using these measures to draw conclusionsabout differences in science classroom performance acrossgender. Brogt et al. [35] have shown that different expres-sions for calculating gains have different inherent biases,with Hake’s normalized gain [36] being particularly sensi-tive to high pretest scores.To emphasize this point, we characterize the gain, from
pre- to post-test on the CDPA, using several differentestimators. These varied estimates of gain can be biasedagainst different pretest scores.First, we use the average normalized change [37] hci,
defined as the ratio of the gain to the maximum possiblegain (or as the loss to the maximum possible loss). Theequations used to calculate c are given below. Students whoscore perfectly or zero on both pretest and post-test shouldbe dropped from the data set (none of our students fell intothis category). Once normalized changes have been com-puted for each student, an average normalized change hcican be calculated:
c ¼
8><
>:
ðpost − preÞ=ðmax − preÞ if post > pre
0 if post ¼ pre
ðpost − preÞ=ðpreÞ if post < pre:
Second, we use the average absolute gain hgabsi that hasbeen normalized by the maximum possible test score (to setthe dimensions). It has been argued that absolute gain is amore transparent measure to reflect equity across sampleswithin a single population because it does not compensatefor different pretest scores, which do exist in cases ofinequality [38]. The equation used to calculate gabs is givenbelow; once absolute gains have been computed for eachstudent, an average absolute gain hgabsi can be calculatedfor each group:
-0.1 0.0 0.1 0.2 0.3 0.4 0.5 0.6 0.70
1
2
3
4
Hedges' g
-0.1 0.0 0.1 0.2 0.3 0.4 0.5 0.6 0.7
0
1
2
3
4
post-testcoun
tpretest
FIG. 3. Histogram of Hedges’ g effect sizes for the FCI, FCME,BEMA, and CSEM results (white) (summarized in Ref. [1]) andthe CDPA (black). Pretests are given by the solid columns andpost-tests by the hatched columns. None of the effect sizes fromthe studies involving the FCI, FCME, BEMA, and CSEM are aslarge as the effect sizes associated with this study of the CDPA.
JAMES DAY et al. PHYS. REV. PHYS. EDUC. RES. 12, 020104 (2016)
020104-6

gabs ¼ ðpost − preÞ=max :
Third, we use Hake’s normalized gain [36] hgi, which isequivalent to the course average normalized gain. Thisestimator is the most popularly used one in the literature.The importance of Hake’s work cannot be overemphasized,as normalized gain has provided many instructors andresearchers with a readily accessible and objective measureof performance in their introductory mechanics courses. Inthis equation, hprei and hposti are the classes’ averagepretest and post-test scores out of 100%, respectively:
hgi ¼ ðhposti − hpreiÞ=ðmax−hpreiÞ:
Fourth, we use the absolute gain divided by twice theaverage of the two hg2avi, which has been used before[35,39] to demonstrate the potential pitfalls of the estimatorof choice. The equation used to calculate g2av is givenbelow; once absolute gains divided by twice the average ofthe two have been computed for each student, an averageabsolute gain divided by twice the average of the two hg2avican be calculated:
g2av ¼ ðpost − preÞ=ðpostþ preÞ:
Fifth, we use the percent increase over pretest perfor-mance hgreli, which is similarly computed from the grelvalues of each student. This is the standard definition ofrelative change:
grel ¼ ðpost − preÞ=ðpreÞ:
Results from these five metrics of gain are presentedin Fig. 4.We found that male students’ average scores resulted in
higher apparent learning gains than female students’average scores, but only when hci was used. Whenhgabsi, hgi, hg2avi, and hgreli are used, the statisticalsignificance goes away and the effect size vanishes (andmaybe even flips sign). That we find statistical significancein one estimate but not the others suggests to us that noneshould be trusted here. It is difficult to argue for a verifiabledifference in learning gains between female and malestudents, even if the female students start and end at lowerlevels of achievement. This type of conflicting patternhas been observed and explained before [39]. These factshighlight that examination of gain scores must beapproached with great care and, perhaps, that we are betteradvised to avoid examining gain scores at all. If differentmeasures of gain are applied to the same raw data anddifferent narratives result, then perhaps, rather than askingquestions regarding gain scores, we are better served byframing our question in another way. The question ofwhether one gender has learned more than another isfraught with unspoken major premises. Instead we canask whether there is a gendered difference on post-test
scores after having controlled for (some of the) differencesthat female and male students begin the course with.
3. ANCOVA
An analysis of covariance can be used to test the nullhypothesis of the equality of two (or more) populationmeans. The assumptions that must first be considered inorder to run an ANCOVA are explicitly addressed inAppendix D. An ANCOVAwas run to determine the effectof gender on post-test CDPA scores after treating pretestCDPA scores as a covariate. After adjustment for pretestscores, there was a statistically significant difference inpost-test scores between genders, Fð1; 468Þ ¼ 16.86,p < 0.001, partial η2 ¼ 0.035, with males scoring higherthan females. The adjusted CDPA scores by gender, withpretest as a covariate, are presented in Table II.
FIG. 4. The “gain” by female and male students on the CDPA,as defined by five different estimators. The asterisk indicates astatistically significant difference below the p ¼ 0.05 level froman independent-samples t-test. Uncertainty bars represent thestandard errors of the mean. From left to right: (1) the averagenormalized change hci; (2) the average absolute gain normalizedby the total test score hgabsi; (3) the course average normalizedgain hgi; (4) the absolute gain normalized by twice the average ofthe pre- and post-test hg2avi; and (5) the relative change hgreli.That different estimators lead to different stories suggests that thegain results are suspect.
TABLE II. Adjusted CDPA scores by gender, with pretest as acovariate; cf. with the unadjusted scores in Table I.
Adjusted, with 95% CI
N Lower bound Mean Upper bound
Female students 191 3.20 3.46 3.72Male students 280 3.97 4.18 4.40
GENDER GAPS AND GENDERED ACTION … PHYS. REV. PHYS. EDUC. RES. 12, 020104 (2016)
020104-7

In summary, the effect of gender is statistically signifi-cant but smallish in size, accounting for at least 3.5% of thevariance in CDPA post-test scores. The covariate of CDPApretest score has had a significant impact on the differencewe have observed between female and male students,having accounted for as much as 13.1% of the variancein the CDPA post-test scores: how the students finish islargely predicted by how they started.But small effects can be important in certain contexts.
One way in which small effects can be relevant is if theyaccumulate into larger effects. We know that small effectscan add up because students come into the lab with agender gap that did not exist when they first came into thisworld. We are measuring over only about 5% of their life sofar—that the dominant driver of post-test performance ispretest performance is a testimony to the integral of smalleffects over time. Small effects can also trigger largerconsequences, and we do not want a student awareness ofthe gender gap on the CDPA—a small effect—to havefurther-reaching influence and serve as a tipping point forfemales to disengage in the lab or, worse, depart fromphysics.
4. Discussion
The gender gap is a complex phenomenon that cannot beeasily explained. Many factors very likely contribute to andinfluence the gender gap, but they are also difficult toobserve and quantify. Differential background and prepa-ration are a possible factor. An issue, though, is that itcannot be determined if the differences in the backgroundand preparation variables (which do explain a large portionof the gap observed with other concept inventories) are truedifferences in preparation or merely artifacts of the testingsituation [1].Stereotype threat is another possible contributing factor.
But it is unclear how stereotype threat may affect the gendergap on the CDPA, as there are a number of variables thatcan moderate stereotype threat effects. Some of theseinvolve the test itself, some involve the test taker, andsome involve the testing environment. Research suggeststhat more difficult tests produce greater stereotype threateffects [17]. The CDPA is an objectively difficult test.Given the crucial role that performance anxiety may play inmediating stereotype threat, it is no surprise that frustrat-ingly hard tests are most likely to induce stereotype threat.Independent of the actual properties of a test, stereotypethreat effects can be exacerbated or attenuated by therepresentation of the test to examinees. Stereotyped groupsshow greater performance decrements when a test ispurported to show intergroup score differences or isrepresented as diagnostic of ability (see, e.g., Ref. [40]).Related to our data here, the persistence of the gender
gap on the CDPA (i.e., it exists on the pretest and itcontinues to exist on the post-test) raises the question ofwhat might be happening in the lab that could lead to this
interaction effect. To assess this, we used observations thatcompare female and male students’ use of lab equipment(presumably, to collect data) and computers (presumably, toanalyze data) in mixed-gender pairs and throughout severallab periods.
B. In-lab observations
Our observation data address the open question of howthe dynamics of student interactions might influence thegender gap, or vice versa.
1. Activity participation
To probe the dynamics of student interactions, westudied how behavioral modes differ in mixed-genderpairs. For the academic year in which these observationswere collected (2013–2014), student partners wereassigned by the course instructor to maximize the numberof mixed-gender pairs. These partnerships were constantfor the first two weeks of observations, but were differentfor the third week. Given the gender disparity in enroll-ment, this meant that there were almost no female-femalepairs. For all other years, students have been allowed topartner with whomever they want.Participation in computer, equipment, and other activ-
ities are shown in Table III. Each observation of a pairshows up as one count in the appropriate cell in the table.For example, in 153 of the 2133 distinct observations ofmixed-gender pairs, the female partner was using theequipment while the male partner was doing some otheractivity. As another example, in 42 of the 2133 distinctobservations of mixed-gender pairs, both partners wereobserved to be using a computer at the same time.Collectively, these numbers tell us that female and malestudents allocate their time differently in the lab. Bothgenders spend most of their respective time in otheractivities (60.2% for female students and 49.3% for malestudents). However, while female students roughly splittheir remaining time between the computer (20.6%) and theequipment (19.1%), male students tend to spend more of iton the computer (29.1%) and less with the equipment
TABLE III. Contingency table of gender and in-lab activity,used for the Bhapkar test. Each observation of a pair shows up asone count in the appropriate cell of the table. A similar analysiswas done for each week individually, and no noticeable effectexists by topic or as the term goes along. Female and malestudents do spend their time differently in the lab.
Female
Equipment Computer Other Total
Male Equipment 137 112 212 461Computer 118 42 461 621Other 153 286 612 1051Total 408 440 1285 2133
JAMES DAY et al. PHYS. REV. PHYS. EDUC. RES. 12, 020104 (2016)
020104-8

(21.6%). Correspondingly, this means that the male studentin a female-male pair tends to spend 15 more minutes onthe computer than his lab partner (52.4 minutes versus37.1 minutes). Also, this means that the female student in afemale-male pair engages in 20 more minutes than herlab partner in other activities (108.4 minutes versus88.7 minutes).The chi-square test for association is commonly used to
determine whether two categorical variables are statisticallyindependent, but it is a test that cannot be used oncorrelated data. Here, this assumption is violated as weobtain more than one measurement from the same pair.An extension of McNemar’s test can instead be used, totest for differences between related variables. WhileMcNemar’s test is restricted to two related variables, theBhapkar test is a powerful extension that allows for largercontingency tables [41,42]. The assumptions relevan to aBhapkar test are addressed in Appendix E.The Bhapkar test compares these marginal proportions,
and was conducted between gender and participation incomputer, equipment, and other. All expected cell frequen-cies were greater than five. There was a statisticallysignificant association between gender and participationamong activities, χ2ð2Þ ¼ 51.7, p ≤ 0.001. As discussedabove, these differences are primarily in computer use andtime spent in other activities.To help contextualize these numbers, local odds ratios
may be calculated. Compared to their male peers, femalesare 1.73 times as likely to engage in other activities versususe a computer. Compared to their female peers, males are1.58 times as likely to use the computer versus doing allelse combined. Compared to their female peers, males are1.25 times as likely to use the computer versus use theequipment. We observe a real but smallish effect in howbehavioral modes differ in mixed-gender pairs.
2. Discussion
This analysis makes it clear that female and malestudents spend their time differently in the lab. It issurprising that no difference existed on equipment use,since a pilot study using this coding scheme did suggest amarginal gendered effect for equipment [19]. We suspectthat this would not have been true a generation ago, whenmales likely would have entered the first-year physics labwith significant experience in “tinkering,” whether it bewith engines, ham radios, or household gadgets.Our observations of male students using the computers
significantly more than female students does have aconfound that we did not address at the time of our datacollection: we did not discriminate between personal laptopcomputers and the in-lab computer towers (one per pair). Itis possible that simply more male than female studentsbring their laptops with them to the lab, and that (naturally)people are reluctant to use someone else’s computer. Therewere lab computers available to all groups, however, so
students still had the opportunity to use a computer if theydid not bring their own.
C. Relationship between CDPA performanceand in-lab actions
Our assessment data revealed a gender gap on the CDPApretest that persisted on the post-test. Our observation datarevealed differences in how female and male students spendtheir time in the lab. Together, these raise questions about apossible interaction effect. How might students’ gendereddynamics in the lab affect how they ultimately perform onthe CDPA post-test?
1. Correlations
For each student, a normalized participation may becalculated for the equipment, computer, and other behav-ioral modes. These are the fractions of time that the studentwas observed in a behavioral mode when at least onepartner in their pair was observed in that behavioral mode.A score of zero would mean that the student was neverobserved using the computer, for example (and the pair wasobserved to be using the computer at least once). A score of1 would mean that the student was in sole control of thecomputer.With a measure of student performance (CDPA post-test
score) and of how much time they spend on the computer(normalized computer time), we can gauge the correlationalstrength of the relationship between these two variables.However, the normalized computer time is bimodal (lots ofhigh usage and lots of low usage, with little in between),and visual inspection of a normalQ-Q plot suggests that wefail to meet the assumption of normality. This fact pre-cludes us from being able to run a Pearson’s correlation onour data. Spearman’s correlation, though, provides analternative to obtain a valid and interpretable result.The first assumption for Spearman’s correlation relates
to the measurements made: the two variables should bemeasured at the continuous level. Our variables, the CDPApost-test score and the normalized computer time, wereeach measured at the continuous level. To establish whetherthe correlation coefficient is significant, two additionalassumptions are required: paired observations and a mon-otonic relationship between the two variables. Our varia-bles are paired and possess a weak, monotonicallyincreasing relationship.Spearman’s correlation was run to assess the relationship
between CDPA post-test score and normalized computeruse. We found that there was no correlation betweenCDPA post-test score and normalized computer use,rSð122Þ ¼ 0.084, p ¼ 0.353.
2. Discussion
We found that there was no correlation between CDPApost-test scores and students’ normalized computer use in
GENDER GAPS AND GENDERED ACTION … PHYS. REV. PHYS. EDUC. RES. 12, 020104 (2016)
020104-9

the lab. A lack of correlation may be due to a number ofvariables. First, since introductory students generally obtainlow scores on the CDPA (average was less than 50%), wemay be witnessing range restriction. Since the range ofscores does not span the full spectrum, our correlation isdecreased. Alternatively, since the ANCOVA results dem-onstrated that the size of the gender effect was, in fact, quitesmall, the gendered relationship between our two variablesmay be similarly small and, in this case, undetectable.Finally, data handling skills may not be what is learnedwhen students are working on the computer. That is, we didnot code for how students spend their time on the computer,so it very well may be that time spent using the computermostly involves entering data and creating tidy graphicalrepresentations. It is reasonable to suppose that most of thepractice related to data handling happens when the studentsare writing in their lab books. Perhaps logbook use is whenstudents were extracting a plausible mathematical modelfrom their data or reconciling data with differing levels ofuncertainty. Since time spent writing in a logbook wascoded as performing an other activity, this information waslost in the coding scheme we used; however, it does leaveus with another possible avenue of pursuit. Perhaps there isa gendered difference in how logbooks are used.Coupled to no difference in how often female and male
students handled the equipment in the lab, we take this tomean that in-lab, gendered interactions seem not to influencelearning of data handling skills. Of all the things that mayaffectCDPApost-test performance,we seem tohave removedone potential candidate (time on computer) from an innumer-ably long list. It remains interesting, however, that both ofthese—apparently unrelated—measures are gendered.Other correlations might exist. Our students have a rather
broad cultural background and it is possible that culturallytempered social characteristics raise barriers to their learn-ing physics in a Canadian lab. Of the four possiblecombinations, it may matter how Canadians and non-Canadians are partnered with respect to gender. Ourstudents also share a range of native languages and it ispossible that performance on the CDPA is consequentlyhindered. To this end, we are developing a simplifiedChinese version of the CDPA (besides English, Chinese isthe most common language spoken by our students).Our present findings force us to modify the theoretical
framework presented in Fig. 1. Within this framework, weasserted that gendered, in-lab actions would interact with ourfirst-year curriculum. We do not have the evidence to makethis claim. Furthermore, we have underestimated the strengthof the influence of the CDPA pretest on the post-test.Given what we have now measured, our modified
theoretical framework is presented in Fig. 5. This schematicis meant to show a few things. First, what the students comeinto the lab with, as measured by the CDPA pretest, largelydetermines how they perform on the CDPA post-test.Hypothesizing about what might be responsible for the
CPDA pretest results is challenging; they are likely atestimony to the integral of small effects (i.e., gendermicroaggressions [43]) over time. Second, the first-yearlab curriculum contributes to an increase on CDPA scoresbut not as a function of gender. Third, how students dividetheir time in the lab is a function of gender but does notseem to impact their performance on the CDPA post-test,although it is possible that an uncoded-for behavior mightplay some small role.
V. CONCLUSION
The doing of physics and the doing of gender areinseparable, and must be kept in mind when hoping tomake some sense of the gendered experience of learningphysics.The CDPA was used to reveal a statistically and practi-
cally significant gender gap at the pre- and post-test level.We can say that everybody learns in our lab, but the statusquo (regarding the gender gap) remains at the end of theterm. The best predictor of post-test achievement is pretestachievement. Differences in student behavior in the labwere also uncovered: female and male students tend toshare the equipment equally, but male students spend moretime on the computer and female students spend more timeon other activities. However, these gendered actions appearnot to correlate with post-test performance measures relatedto data handling.
FIG. 5. Schematic representation of the modified theoreticalframework, adapted to better align with the results of this study.
JAMES DAY et al. PHYS. REV. PHYS. EDUC. RES. 12, 020104 (2016)
020104-10

In parallel, we have scrutinized some of the commonlyemployed analysis techniques for the type of data we havecollected. The fact that a significant gender effect emergedfrom the ANCOVA may suggest that the normalizedchange measure (which was the only other gain measureto provide a significant gender effect) is the most sound.The significant difference in the sizes of the gender effects,however, suggests otherwise. That a method is popular isinsufficient reason for its use. We also contend thatstatistical techniques commonly used in physics educationresearch are often reported with too little information onwhether the data being analyzed satisfy the correspondingunderlying assumptions: researchers should explicitlycheck all assumptions so that the use of statistics isnever misguided or opportunistic. Further, we argue thatresearchers use effect size measurements, properly contex-tualized, to promote clarity in education reform.We believe that one key reason for the underrepresentation
and underperformance of female students in physics [44] isstrongly related to their belief in their ability to succeed.Female students generally report lower confidence in them-selves than male students. Learning physics requires exten-sive effortful practice, and having students work in groupscan be a valuable tool for effortful practice. The groupinteractions can provide encouragement and persistence viaenjoyable social interactions. To push yourself and get themost out of your practice, one has to believe that success ispossible. One way to achieve this belief might be throughequivalent peer groups. Equivalent peer groups (for example,matched by GPA and gender) may be a worthwhile endeavorfor us, as each group then has approximately the samepreparation and motivation, which means one student is not“explaining” to the others. Designed in this way, groups offera safe environment for the exchange of ideas with peers whoare at the same level, thereby allowing for productiveconversations to happen. It has been shown that femalestudents profit less than male students from mixed-gendercooperative learning in physics, especially where problemsolving is involved [45]. It has also been shown that groupswhere the members have equal ability result in the mostproductive interactions and learning [46]. Since our datashow that female students are participating in the labdifferently than male students in mixed-gender groups,equivalent peer groups may help balance participation—after all, participation in any lab activity is a zero-sum game.This may subsequently affect female student confidence,leading to changes in the CDPA scores.Other open questions that come from this work are related
to when practice with data handling actually happens. Arestudents actually practicing their data handling skills? If so,is the logbook where students practice them? How is time onthe computer spent? These questions should be investigatedin future studies. Finally, the meaning of the gender gap onthe CDPA and the nature of gendered actions in the labshould not be categorized as well understood.
ACKNOWLEDGMENTS
The authors thank Catherine Rawn for her guidance withour statistical tests. This work has been supported by theDepartment of Physics and Astronomy at the Universityof British Columbia, through the Carl Wieman ScienceEducation Initiative.
APPENDIX A: ASSUMPTIONS FOR THEINDEPENDENT-SAMPLES t-TEST
The first three assumptions relate to the study design andthe measurements made. One must have a dependentvariable that is measured at the continuous level; anindependent variable that consists of two categorical,independent groups; and independence of observations,which means that there is no relationship between theobservations in each group of the independent variable orbetween the groups themselves. All three of these assump-tions are met. Our dependent variable, measured at thecontinuous level, is the raw score obtained on the CDPA(at pre- or post-test). Our independent variable, of twocategorical and independent groups, is the self-identifiedgender of the students. And our observations within eachsample are independent (they do not influence each other—collecting a CDPA score for a male student does notinfluence the CDPA score for any other male student or forany female student).The next three assumptions relate to the characteristics of
the data collected. One must have no significant outliers inthe two groups of your independent variable in terms of thedependent variable; an approximately normally distributeddata set for each group of the independent variable; andhomogeneity of variances, which means that the variance isequal in each group of the independent variable. Our CDPAdata sets contain no significant outliers (i.e., equal to orbelow Q1 − 3 × IQR, or equal to or above Q3þ 3 × IQR,where IQR is the interquartile range). Our CDPA data setsare approximately normal, as assessed by visual inspectionof normal Q-Q plots—independent-samples t-tests areanyway robust to violations of normality. There washomogeneity of variance on the pretest, as assessed bythe variance ratio [47], Hartley’s Fmax ¼ 1.46. There wasalso homogeneity of variance on the (paired) post-test, asassessed by the variance ratio [47], Hartley’s Fmax ¼ 1.39.
APPENDIX B: CLASSICAL TEST METRICSFOR THE CDPA
The difficulty, discriminatory power, and reliability of theCDPA have been presented before [2]; those results—whichfocus both on item analysis (item difficulty index, itemdiscrimination index, and point-biserial coefficient) and onthe entire test (test reliability and Ferguson’s delta)—aresummarized in Table IV. Scores on the CDPA range fromchance (for novices) to about 80% (for experts), indicatingthat it possesses good dynamic range. These results indicate
GENDER GAPS AND GENDERED ACTION … PHYS. REV. PHYS. EDUC. RES. 12, 020104 (2016)
020104-11

that the CDPA is sufficiently reliable for the purposes ofprobing how well students actually handle data.
APPENDIX C: BY ITEM AND BY GENDERPERFORMANCE
Student performance, by item and by gender, is shown inFig. 6. Questions 5 and 6, which require judging the qualityof fit of a linear model to data, are equally difficult for allstudents. Otherwise, the gap is fairly uniform across theremaining items.
APPENDIX D: ASSUMPTIONS FORTHE ANCOVA
While an analysis of variance (ANOVA) can also be usedfor this purpose, an ANCOVA carries a few advantages.The first advantage is that it has better ability in finding asignificant difference between groups—when one exists—by reducing the within-group error variance. The second
advantage is that it reduces bias associated with a chancedifference (or differences) previously existing betweengroups. The ANCOVA captures these advantages byinclusion of a covariate measurement (or measurements).These covariates are incorporated into the ANCOVAanalysis such that the ANCOVA error term is almostalways smaller (often by a fair bit) than the correspondingANOVA error term. Furthermore, the dependent variablemeans are adjusted to partially account for previouslyexisting chance differences between the groups.An ANCOVA requires that multiple assumptions be met
for valid and interpretable results. The first three assumptionsare shared with all linear models: the residuals are normallydistributed; there are no outliers in the data; and there ishomogeneity of variance (i.e., the variance of the residuals isequal for the different groups of the independent variable).Three important additional considerations are there is homo-geneity of regression slopes; the covariate is linearly relatedto the dependent variable at each level of the independentvariable; and there is homoscedacity (i.e., the variance of theresiduals is equal for all predicted values). A final, importantassumption is that the covariate and the independent variableare independent from one another. The problem of thecovariate and independent variable sharing variance iscommon, and is misunderstood by many [48]. Our covariateof CDPA pretest score certainly shares variance with CDPApost-test score, as both depend on gender. That our groupsdiffer on the covariate means that our partial η2 result shouldbe thought of as a lower bound rather than absolutely.There was normality of standardized residuals of CDPA
post-test scores for each gender, as assessed by visualinspection of normal Q-Q plots. (An ANCOVA is anywayfairly robust to deviations from normality. The central limittheorem means that as sample sizes get larger, the less theassumption of normality matters because the samplingdistribution will be normal regardless of what our pop-ulation or sample data look like [49].) There were nosignificant outliers in the data (i.e., equal to or belowQ1 − 3 × IQR, or equal to or above Q3þ 3 × IQR). Therewas homogeneity of variance, as assessed by the varianceratio [47], Hartley’s Fmax ¼ 1.39. There was homogeneityof regression slopes; as the interaction term was notstatistically significant, Fð1; 467Þ ¼ 0.382, p ¼ 0.540.There was a linear relationship between pre- and post-testof the CDPA for each gender, as assessed by visualinspection of a scatter plot.A linear regression established that pretest scores could
statistically significantly predict post-test scores: for malestudents, Fð1; 278Þ ¼ 47.97, p < 0.001, and the pretestscore accounted for 14.4% of the explained variability inthe post-test score; for female students, Fð1; 189Þ ¼ 21.23,p < 0.001, and the pretest score accounted for 9.6% of theexplained variability in the post-test score. The regressionequations were as follows: for males, CDPA post-testscore ¼ 2.75þ 0.48 × ðCDPApretest scoreÞ; for female
TABLE IV. Summary of statistical post-test results for theCDPA.
Reasonable CDPATest statistic Lower bound Value
Item difficulty index, P ≥0.3 0.39Item discrimination index, D ≥0.3 0.43Point-biserial coefficient, rpb ≥0.2 0.21Ferguson’s delta, δ ≥ 0.9 0.94Test-retest stability (Pearson) ≥0.7 0.80
1 2 3 4 5 6 7 8 9 100.0
0.2
0.4
0.6
0.8
1.0
item
sco
re
female studentsmale students
CDPA item
FIG. 6. Summary of post-test performance on each item of theCDPA, by gender. Uncertainty bars represent the standard errorsof the mean. These data consist of 191 female and 280 malestudents (the ones for which we have paired pre- and post-testdata). Item by item, the male student population outperforms thefemale student population.
JAMES DAY et al. PHYS. REV. PHYS. EDUC. RES. 12, 020104 (2016)
020104-12

students, CDPA post-test score ¼ 2.23þ 0.41 × ðCDPApretest scoreÞ. There was homoscedasticity, as assessed byvisual inspection of a scatter plot.
APPENDIX E: ASSUMPTIONS FOR THEBHAPKAR TEST
As it is an extension, the Bhapkar test must satisfy thesame assumptions required of the McNemar test [50]. Thefirst two assumptions relate to the characteristics of the datathemselves: one must have a categorical dependent variablewith more than two categories and a categorical independentvariable with two (or more) related groups, and the groups of
the dependent variable are mutually exclusive. The thirdassumption relates to how the data were collected: the casesare a random sample from the population of interest.All three of these assumptions are met. Our dependent
variable, measured at the categorical level, is the observedbehavioral mode of the student (equipment, computer, andother). Our independent variable, of two categorical andmutually exclusive groups, is the self-identified gender ofthe students. And our observations were collected ran-domly (they occurred at roughly five-minute intervals butwere completely independent of the timing and content ofthe lab instruction).
[1] A. Madsen, S. B. McKagan, and E. C. Sayre, Gender gapon concept inventories in physics: What is consistent, whatis inconsistent, and what factors influence the gap?, Phys.Rev. ST Phys. Educ. Res. 9, 020121 (2013).
[2] J. Day and D. Bonn, Development of the concise dataprocessing assessment, Phys. Rev. ST Phys. Educ. Res. 7,010114 (2011).
[3] J. Butler, Gender Trouble (Routledge, New York, 1999).[4] J. S. Brown, A. Collins, and P. Duguid, Situated cognition
and the culture of learning, Educ. Res. 18, 32 (1989).[5] J. Lave and E. Wenger, Situated Learning: Legitimate
Peripheral Participation (Cambridge University Press,Cambridge, England, 1991).
[6] M. K. Smith, Jean Lave, Etienne Wenger and communitiesof practice, www.infed.org/biblio/communities_of_practice.htm.
[7] A. T. Danielsson and C. Linder, Learning in physics bydoing laboratory work: towards a new conceptual frame-work, Gender Educ. 21, 129 (2009).
[8] J. S. Brotman and F. M. Moore, Girls and science: A reviewof four themes in the science education literature, J. Res.Sci. Teach. 45, 971 (2008).
[9] C. Paechter, Women’s Studies International Forum(Elsevier, New York, 2003), Vol. 26, pp. 69–77.
[10] C. Paechter, Being Boys, Being Girls: Learning Mascu-linities and Femininities (McGraw-Hill Education,Maidenhead, Berkshire, 2007).
[11] http://www.phas.ubc.ca/~phys109/LearningGoals.html.[12] S. L. Sheridan and M. Pignone, Numeracy and the medical
student's ability to interpret data, Effect. Clin. Pract.: ECP5, 35 (2002).
[13] L. M. Schwartz, S. Woloshin, W. C. Black, and H. G.Welch, The role of numeracy in understanding the benefitof screening mammography, Ann. Intern. Med. 127, 966(1997).
[14] http://www.aapt.org/Resources/upload/LabGuidlinesDocument_EBendorsed_nov10.pdf.
[15] L. C. McDermott and E. F. Redish, Resource letter: PER-1:Physics education research, Am. J. Phys. 67, 755 (1999).
[16] https://www.physport.org/assessments/Assessment.cfm?I=55&A=CDPA.
[17] C. M. Steele, S. J. Spencer, and J. Aronson, Contendingwith group image: The psychology of stereotype and socialidentity threat, Adv. Exp. Soc. Psychol. 34, 379 (2002).
[18] J. B. Stang and I. Roll, Interactions between teachingassistants and students boost engagement in physics labs,Phys. Rev. ST Phys. Educ. Res. 10, 020117 (2014).
[19] N. G. Holmes, I. Roll, and D. A. Bonn, Participating in thephysics lab: Does gender matter?, Phys. Can. 70, 84 (2014).
[20] J.Ocumpaugh,Baker-RodrigoObservationMethodProtocol(BROMP) 1.0. Training Manual Version 1.0 (TechnicalReport. New York, NY: EdLab. Manila, Philippines: AteneoLaboratory for the Learning Sciences, 2012).
[21] J. Ocumpaugh, R. Baker, S. Gaudino, M. Labrum, and T.Dezendorf, in Artificial Intelligence in Education, LectureNotes in Computer Science Vol. 7926, edited by H. Lane,K. Yacef, J. Mostow, and P. Pavlik (Springer, Berlin, 2013),pp. 624–627.
[22] D. E. Meltzer, The relationship between mathematicspreparation and conceptual learning gains in physics:A possible “hidden variable” in diagnostic pretest scores,Am. J. Phys. 70, 1259 (2002).
[23] V. P. Coletta and J. A. Phillips, Interpreting FCI scores:Normalized gain, preinstruction scores, and scientificreasoning ability, Am. J. Phys. 73, 1172 (2005).
[24] M. Lorenzo, C. H. Crouch, and E. Mazur, Reducing thegender gap in the physics classroom, Am. J. Phys. 74, 118(2006).
[25] L. E. Kost, S. J. Pollock, and N. D. Finkelstein, Character-izing the gender gap in introductory physics, Phys. Rev. STPhys. Educ. Res. 5, 010101 (2009).
[26] A. Miyake, L. E. Kost-Smith, N. D. Finkelstein, S. J.Pollock, G. L. Cohen, and T. A. Ito, Reducing the genderachievement gap in college science: A classroom study ofvalues affirmation, Science 330, 1234 (2010).
[27] R. Hoekstra, H. A. L. Kiers, and A. Johnson, Are assump-tions of well-known statistical techniques checked, andwhy (not)?, Front. Psychol. 3, 137 (2012).
GENDER GAPS AND GENDERED ACTION … PHYS. REV. PHYS. EDUC. RES. 12, 020104 (2016)
020104-13

[28] H. J. Keselman, C. J. Huberty, L. M. Lix, S. Olejnik, R. A.Cribbie, B. Donahue, R. K. Kowalchuk, L. L. Lowman,M. D. Petoskey, J. C. Keselman, and J. R. Levin, Statisticalpractices of educational researchers: An analysis of theiranova, manova, and ancova analyses, Rev. Educ. Res. 68,350 (1998).
[29] G. M. Sullivan and R. Feinn, Using Effect Size—or Whythe P Value Is Not Enough, J. Grad. Med. Educ. 4, 279(2012).
[30] L. V. Hedges, Distribution theory for glass's estimator ofeffect size and related estimators, J. Educ. Stat. 6, 107(1981).
[31] J. Cohen, A power primer, Psychol. Bull. 112, 155 (1992).[32] J. Cohen, Statistical Power Analysis for the Behavioral
Sciences (Routledge Academic, New York, 2013).[33] J. C. Blickenstaff, Women and science careers: Leaky
pipeline or gender filter?, Gender Educ. 17, 369 (2005).[34] L. Törnqvist, P. Vartia, and Y. Vartia, How should relative
changes be measured?, Am. Stat. 39, 43 (1985).[35] E. Brogt, D. Sabers, E. E. Prather, G. L. Deming, B.
Hufnagel, and T. F. Slater, Analysis of the astronomydiagnostic test, Astron. Educ. Rev. 6, 25 (2007).
[36] R. R. Hake, Interactive-engagement versus traditionalmethods: A six-thousand-student survey of mechanics testdata for introductory physics courses, Am. J. Phys. 66, 64(1998).
[37] J. D. Marx and K. Cummings, Normalized change, Am. J.Phys. 75, 87 (2007).
[38] E. Brewe, V. Sawtelle, L. H. Kramer, G. E. OBrien, I.Rodriguez, and P. Pamelá, Toward equity through partici-pation in Modeling Instruction in introductory universityphysics, Phys. Rev. ST Phys. Educ. Res. 6, 010106 (2010).
[39] S. D. Willoughby and A. Metz, Exploring genderdifferences with different gain calculations in astronomyand biology, Am. J. Phys. 77, 651 (2009).
[40] C. M. Steele and J. Aronson, Stereotype threat and theintellectual test performance of African Americans, J. Pers.Soc. Psychol. 69, 797 (1995).
[41] A. Agresti, Categorical Data Analysis (Wiley, Hoboken,New Jersey, 2013).
[42] V. P. Bhapkar, A note on the equivalence of two test criteriafor hypotheses in categorical data, J. Am. Stat. Assoc. 61,228 (1966).
[43] https://www.unh.edu/sites/www.unh.edu/files/departments/unh_advance/PDFs/microaggressions.pdf.
[44] L. E. Kost-Smith, University of Colorado, Ph.D. thesis,2011.
[45] E. Harskamp, N. Ding, and C. Suhre, Group compositionand its effect on female and male problem-solving inscience education, Educational Research 50, 307 (2008).
[46] Y. Lou, P. C. Abrami, J. C. Spence, C. Poulsen, B.Chambers, and S. d’Apollonia, Within-class grouping: Ameta-analysis, Rev. Educ. Res. 66, 423 (1996).
[47] E. S. Pearson and H. Hartley, Biometrika Tables forStatisticians (Cambridge University Press, Cambridge,1954).
[48] A. Miller and J. P. Chapman, Misunderstanding analysis ofcovariance, Journal of abnormal psychology, 110, 40(2001).
[49] A. Field, Discovering Statistics Using SPSS (SagePublications, Los Angeles, 2009).
[50] For membership holders: https://statistics.laerd.com/premium/spss/mt/mcnemars‑test‑in‑spss‑3.php, for non-membership holders https://statistics.laerd.com/spss-tutorials/mcnemars-test-using-spss-statistics.php.
JAMES DAY et al. PHYS. REV. PHYS. EDUC. RES. 12, 020104 (2016)
020104-14