Gender Differences in Perceptions of Organizational Climate
70
Gender Differences in Perceptions of Organizational Climate by Trishna Gautam Patel A thesis submitted to the Graduate Faculty of Auburn University in partial fulfillment of the requirements for the Degree of Master of Science Auburn, Alabama December 13 th , 2014 Keywords: Organizational climate, psychological contract, perceptions of discrimination, gender in workplace, gender equality, multiple group confirmatory factor analysis Approved by Daniel Svyantek, Chair, Professor and Program Director, Department of Psychology Jesse Michel, Associate Professor, Department of Psychology Alejandro Lazarte, Associate Professor, Department of Psychology
Transcript of Gender Differences in Perceptions of Organizational Climate
Gender Differences in Perceptions of Organizational Climate
by
Trishna Gautam Patel
A thesis submitted to the Graduate Faculty of Auburn University
in partial fulfillment of the requirements for the Degree of
Master of Science
Auburn, Alabama December 13th, 2014
Keywords: Organizational climate, psychological contract, perceptions of discrimination, gender in workplace, gender equality, multiple group confirmatory factor analysis
Approved by
Daniel Svyantek, Chair, Professor and Program Director, Department of Psychology Jesse Michel, Associate Professor, Department of Psychology
Alejandro Lazarte, Associate Professor, Department of Psychology
Abstract
Organizations that have a progressive culture emphasize respect for people through
fairness, equality, and support for all employees. Espoused organization values can endorse a
progressive climate in theory; however, the pervasive climate that actually exists may not be
experienced the same way by all members of the organization. When the perceived inequity
targets a specific group, such as women, the result could be a substantial loss in productivity for
the organization. Organizational climate is examined for two latent variables—psychological
contract maintenance and perceived discrimination—that may be perceived differentially by
men and women in the workplace. Remedying the perceived gap between espoused and
practiced values of organizational culture may help that organization remain competitive and
successful in its external business environment.
ii
Acknowledgments
Thank you to Bryan Aiken, Jaymi Patel, Carolyn Guerra, and Aayush Patel, for all the
support you have given me in the pursuit of my degree. You constantly pushed me to keep going;
your unfaltering and tenacious encouragement inspired me to the very end.
Thank you to Jesse Michel and Alejandro Lazarte for your invaluable feedback, and for
working with me on this project. This work has become stronger with your involvement.
Finally, thank you to my advisor, Dan Svyantek, for all your infinite wisdom, patience,
support, and creative ideas. Through your guidance, this project was a success. I will endeavor to
continue with this trend under your tutelage.
iii
Table of Contents
Abstract…………………………………………………………………………………………...ii
Acknowledgments………………………………………………………………………………..iii
List of Tables………………………………………………………………...…………………...vi
List of Figures……………………………………………………………………………………vii
Gender Differences in Perceptions of Organizational Climate……………………………………1
Culture and Climate: Perception and Open versus Closed Climates……………………………...3
Perceptions of Psychological Contract Maintenance……………………………………………...5
Perceptions of Discrimination……………………………………………………………..............8
Gender in the Workplace ………………………………………………………………………..10
Method…………………………………………………………………………………………...15
Participants……………………………………………………………………………….15
Measures……………………………………………………………………………...….15
Procedure………………………………………………………………………………...16
Results…………………………………………………………………………………………....17
Preliminary Analysis……………………………………………………………………..17
Multiple Group Confirmatory Factor Analysis………………………………………….18
Step 1: Establish Model Fits for Both groups…………………………………...19
Step 2: Establish a Baseline Model……………………………………………...19
Step 3: Test for Equality of Factor Loadings……………………………………20
iv
Step 4: Test for Equality of Factor Intercepts…………………………………....21
Step 5: Test for Partial Equality of Factor Intercepts……………………………21
Step 6: Test for Latent Factor Mean……………………………………………..22
Post-Hoc Power Analysis………………………………………………………..………23
Model Identification…………………………………………………………….......……24
Discussion………………………………………………………………………………….…….24
Gender Differences………………………………………………………………………24
Practical and Theoretical Implications………………………………………….………..26
Limitations and Future Research……………………………………….………………..29
Conclusion……………………………………………………………………….………………32
References…………………………………………………………………………..……………33
Appendix A………………………………………………………………………………………63
v
List of Tables
Table 1: Descriptive Statistics for Males ................................................................................... 42
Table 2: Descriptive Statistics for Females ................................................................................ 43
Table 3: Model Fit Information ................................................................................................ 44
Table 4: Model Results for Men (Parameter Estimates) ............................................................ 45
Table 5: Model Results for Women (Parameter Estimates). ....................................................... 46
Table 6: Model Fit Information (Establishing a Baseline Model) .............................................. 47
Table 7: Model Results (Parameter Estimates for Establishing a Baseline Model) .................. 48
Table 8: Model Fit Information (Test for Equality of Factor Loadings) .................................... 50
Table 9: Model Results (Parameter Estimates for Test for Factor Loading Invariance) ........... 51
Table 10: Model Fit Information (Test for Equality of Factor Intercepts) ................................. 53
Table 11: Model Results (Parameter Estimates for Factor Intercept Invariance ...................... 54
Table 12: Model Fit Information (Test for Partial Equality of Factor Intercepts) .................... 56
Table 13: Model Results (Parameter Estimates for Partial Equality of Factor Intercepts) ....... 57
Table 14: Normalized Residuals for the Means/Intercepts/Thresholds ...................................... 59
Table 15: Test for Equality of Latent Factor Means................................................................... 60
Table 16: Item Correlations for Males ....................................................................................... 61
Table 17: Item Correlations for Females.................................................................................... 62
vi
List of Figures
Figure 1: Proposed MGCFA Model ........................................................................................... 18
vii

Gender Differences in Perceptions of Organizational Climate
The study of organizational climate and culture is one of the most broadly researched
areas in psychology. Organizational culture has become key to understanding behavioral
patterns in employees, because all behavior in a workplace occurs within an existing cultural
context (Mason, 2004). Each organization has its own unique culture and climate that translates
into how employees perceive and act within their given environment. There are many differing
descriptions of organizational culture; Ravisi and Schultz (2006) have integrated these concepts
into a comprehensive, elegant definition. They define organizational culture as “a set of shared
mental assumptions that guide interpretation and action in organizations by defining appropriate
behavior for various situations” (p. 437). In this view, culture can be seen as the mode through
which employees can interpret the expectations in an environment, and that this interpretation
guides the appropriate workplace behavior to fit those expectations.
Culture has been shown to manifest itself as six different levels within an organization,
ranging from the CEO and executive level, to the departmental level, the divisional levels,
geographic/local level, professional level, and issue-related level (Janson, 1994). Of interest to
this study is the issue-related level, which can be viewed as a metaphorical level that is related to
an important issue that permeates throughout the organization. For instance, cultures of safety or
equality are generally viewed as important, and are existent at all functional levels of a company
(Janson, 1994).
Within these levels, culture has been shown exist in three layers (Schein, 1985). The first
layer is the most observable. It can include any identifiable artifacts, available technology, and/or
behavior patterns within a given organization. This layer has been most closely identified as an
organization’s climate. Although there has been debate about whether culture and climate should
1
be treated as separate concepts, no consensus on distinction has been reached and they are often
viewed as interchangeable (Denison, 1996; Katz & Kahn, 1978; Payne, 2000; Schneider, 2000),
or parts of the same whole. This study will provide reasoning for treating the concepts as
interchangeable. The second layer is less observable, and is identified as the fundamental beliefs
and assumptions of all members within an organization. These assumptions are ingrained in
workers, and are largely taken for granted. In turn, this affects the other two layers of culture.
The last layer of culture is identified as an individual’s shared values. This is the basic tendency
for individuals to have variable preferences that they share with members across the organization
(Schein, 1985). Similarly, organizations also declare their own values. However, there is often a
disconnect in the values an organization espouses through public claims and the true values that
are actually in operation (Gundling, 2000). This translates as the gap between the strategy and
governance intended by an organization and employees’ overt, at times contrary, behavior.
For instance, most organizations claim to have an open or progressive culture, but often
their practices do not reflect these ideals—at least, not uniformly. Employees often experience
organizational climate differently based on their subgroup membership. Cultural aspects of an
institution experienced by CEOs may not be what lower-level employees experience, and the
same variability can exist for members of different ethnic groups, age groups, departments, or
genders within an organization. The purpose of this study is to distinguish such possible differing
perceptions of open organizational climate between genders within an organization, particularly
in the academic environment, where there has been a history of gender inequality. Specifically,
the goal is to delineate their differing perceptions of discrimination (based on their subgroup
membership), and maintenance of the psychological contract within an organization that has
espoused an open climate. In order to examine these differential experiences comprehensively, it
2
is important to first consider what is meant by an organizational climate, why the perception of
discrimination can be detrimental, the importance of maintaining a psychological contract, and
why gender is a significant subgroup of consequence in the workplace.
Culture and Climate: Perception and Open versus Closed Climates
As mentioned previously, there has been debate about the distinction between
organizational climate and culture, and whether such a distinction exists at all (Ashkanasy,
Wilderom, & Peterson, 2000). There has been no conclusion that is agreed upon in literature.
For example, James and Jones (1974) compared similarities and differences in the definitions of
climate, concluding that organizational climate can be conceptualized as organizational
attributes, main effects, and stimuli in present in the environment. Conversely, Schein (2000)
described climate as an older, more technical, less exciting way to talk about culture. Climate can
also be described as the cultural artifacts in an organization that result from its espoused values
and shared assumptions; those artifacts represent a more direct attempt to convey culture
(Schein, 1983). In this view, climate can be construed as the identifiable and observable aspect of
organizational culture. When culture is viewed as those espoused beliefs, values, and
attributions, both concepts are thought to cause one other (Schneider, 2000). Ashkanasy et al.
(2000) diverged from this view and discussed climate as the attributes, feelings, and social
processes experienced. However, even in their own evaluation, they maintained that the two
concepts are not strongly different and represent overlapping interpretations of the same
phenomenon. With these conclusions in mind, this study adheres to research that treats
organizational climate and culture as interdependent parts to a greater whole.
Now that the rationale of interchangeability between culture and climate has been
discussed, the focus is turned to the structure of organizational climate. Halpin (1966)
3
constructed the Organizational Climate Description Questionnaire (OCDQ) in order to make
practical sense of the knowledge about nature of organizations. Through the questionnaire, he
identified six organizational climates that exist on a continuum, ranging from ‘open’ to ‘closed.’
Open climates are described as energetic, forward-thinking, moving toward its goals, and one
that provides satisfaction to members’ social and task-related needs. Leaders emerge easily, and
fairly, and the climate is seen as an authentic one. A closed climate, contrarily, involves a high
degree of apathy in all members, low morale, lack of notable movement, inequity or
inappropriateness in leader emergence, and member insecurity that their task or social needs are
being met satisfactorily by the organization (Halpin, 1966; Roussell, 1974). The key is that the
difference between open and closed climates is based on the perceptions and interpretations of
the organizational members. The same experiences may be experienced differently by various
individuals and sub-groups within an organization.
This study examines climate and its effects on the two primary sub-groups, defined by
gender, within an organization. Most organizations claim to be on the progressive and equal end
of the climate spectrum, when often the resulting climate is closer to a closed profile. The
implications of this disparity in vision and execution are cause for concern, in terms of adhering
to an overall organizational strategy. If an employee’s expectations of an organization’s culture
are not met, or there is poor fit, consequences can negatively impact their job satisfaction and
overall performance (Adkins & Caldwell, 2004; Svyantek & Bott, 2004). Culture and climate
have also been related to organizational outcomes such as leadership effectiveness and
organizational citizenship behaviors (Ashkanasy, Wilderom, & Peterson, 2000). Another notable
impact of organizational culture is its role in the recruitment process; organizations recruit
employees with similar values to their own. In turn, once hired, employees may not choose to
4
remain with an organization that does not exhibit compatibility to their values, which could
result in employee turnover and loss of organizational investment in member training (Schneider,
1987). Loss of productivity is a significant consequence to organizations; for this reason, it is
essential to bridge the gap between employee expectations and experiences.
Current measures of climate profiles administer an array of questions directed at
assessing overall experiences and perceptions of climate within an organization. This study aims
to dissect a climate questionnaire to uncover the effects of existent latent constructs, which may
lead to perceptions of differential treatment between employees and their perception of this
climate as open versus closed. The first latent construct of interest is the perception of a climate
that maintains the employer/employee psychological contract. The second construct is the
perception of a climate of discrimination. Alternately stated, this research believes that the
existent organizational variable of Organizational Climate, actually has two latent constructs
within it (Climate of Psychological Contract Maintenance and Climate of Perception of
Discrimination), and that these constructs relate to males and females differently. Both of these
phenomena are believed to be of importance in profiling perceptions of organizational climates;
their differential experiences relative to subgroup membership of gender may result in important
organizational implications.
Perceptions of Psychological Contract Maintenance
Rousseau (1995) conceptualizes a psychological contract as “individual beliefs, shaped
by an organization regarding terms of an exchange agreement between individuals and their
organization” (p. 9). It can largely be viewed as an output of social and economic exchange of
an employer and employee relationship (Argyris, 1960; Schein, 1965). It should be stressed that
a psychological contract between an employee and an organization differs from any other form
5
of agreement in that it is not written. The terms of the contract are a perception, mutually agreed
upon by both parties; when they are working interdependently within the confines of the
unspoken agreement, performance should be satisfactory for the organization and the employee.
Psychological contracts are self-fulfilling to the extent that there is a mutual predictability of
outcomes based on an understanding (Rousseau, 1995). These contracts are created based on
promises in interviews, reliance on norms, acceptance of expectations, and the perception of
mutuality in this understanding. An example of a psychological contract is an employee’s belief
that their employer will provide benefits, opportunities, or even basic experiences such as
training. These are expectations that are not specified in a formal contract (Cangemi & Miller,
2007; Stirling, Kilpatrick, & Orpin, 2011).
Failure of an organization to meet these expectations is interpreted by the individual in
varying degrees; they can interpret it as a breach (cognitive assessment of circumstances) or as a
violation (emotional state caused by circumstances). Additionally, inability to meet these
unwritten expectations can cause employee disengagement, decreased organizational or task
commitment (Chiang et al., 2012; Robinson & Morrison, 2000), and reduction in productivity
(Cangemi & Miller, 2007). Psychological contracts mediate the role between employee
engagement and commitment (Bal, Kooil, & De Jong, 2013). Further, failure to maintain a
psychological contract has also been linked to decisions influencing turnover (Botsford & King,
2012; Stirling, Kilpatrick, & Orpin, 2011).
These consequences highlight the importance of examining the perceived maintenance of
a psychological contract in terms of organizational climate. Research has previously linked
psychological contracts with several different types of organizational cultures. Richard,
McMillan-Capehart, Bhuian, and Taylor (2009) found that hierarchical organizational cultures
6
(i.e., those that emphasize rules and increased power distance between managers and
subordinates) negatively impacted perceptions of psychological contract, whereas clan cultures
(i.e., those that emphasize internal cohesiveness) had a positive impact on them. Absence
cultures (i.e., those that promote salience of the normative practices regarding appropriate
instances of employee absenteeism) had a negative relationship with perceptions of
psychological contract (Nicholson & Johns, 1985). A few studies have examined psychological
contracts as they relate to perceptions of open organizational culture. Cangemi and Miller (2007)
determined that formulation and maintenance of psychological contracts are effective processes
that result in an open organizational climate as an outcome. Open organizational culture and the
maintenance of psychological contracts have also been studied as joint antecedents that result in
organizational effectiveness (Paull, 2000).
This paucity of research has amounted to no studies that have investigated the role of
psychological contracts as a functioning component of organizational climate, or how this
conceptualization may result in differential perceptions of organizational climate by subgroup
membership. Suliman’s (2002) view of psychological contracts as a dimension of their overall
measure of Work Climate, has come closest to assessing this relationship in extant literature.
Nonetheless, they did not elaborate on their use of psychological contracts—whether they have
been maintained or breeched—specifically, nor did they provide any conclusions about the use
of viewing psychological contracts as a working element within the larger workplace climate.
Considering the breadth of organizations claiming to have a fair and equitable workplace
climate, the growing need to better understand its actual pervasiveness in the workplace is
becoming evident. Relatedly, the effects of a perceived climate of psychological contract
maintenance on different genders of employees working within an espoused progressive climate,
7
may provide valuable information about the broader context in which organizational culture
operates.
This study aims to further explore the complexities of organizational culture, by
investigating latent constructs that operate within its framework, and discussing potential
implications of any observed differential functioning of these latent constructs. The importance
of examining the first latent construct, a climate of psychological contract maintenance, has been
discussed; in order to understand the role of the perception of discrimination within the context
of organizational culture, it is necessary to first understand the nature and consequences of this
phenomenon in the workplace.
Perceptions of Discrimination
Banerjee (2008) defines perceived discrimination as the “situation in which an individual
feels they have been treated unfairly because of their membership of a particular social category”
(p. 384). The perception of discrimination can be just as damaging and consequential as the
actual act of discrimination. Employees who perceive discriminatory behavior towards them, are
actually experiencing treatment that is a deviation from the expected norm (Banerjee, 2008;
Daldy, Poot, & Roskruge, 2013).
These perceptions of discrimination are so detrimental, because they can lead to conflict
or feelings of alienation, which in turn can have organizational and personal consequences. For
example, it has been shown to decrease productivity, organizational commitment, job
satisfaction, and well-being by way of physical and psychological health (Bradley, 2010; Daldy
et al., 2013; Ensher, Grant-Vallone, & Donaldson, 2001; Pavalko, Mossakowski, & Hamilton,
2003). It has also been shown to increase turnover intentions and the intent to file a claim for
discrimination (Bradley, 2010; Jagusztyn, 2011).
8
A concern with the study of a perceived climate of discrimination, is that it tends to be
under-reported (Kaiser & Major, 2006). The tendency to withhold its experience, along with the
subjective nature of the cases that are recounted, has led to difficulties in the study of this
phenomenon (Banerjee, 2008). Consequently, there have only been a few studies that have
linked perceptions of discrimination to organizational cultures; even in those cases, the specific
types of culture that have been examined are largely based on demographic attributes. For
example, perceptions of discrimination have been negatively related to racial climate (i.e. a
climate that encourages the comprehension of attitudes and behavior toward race and ethnicity)
in a campus setting (Tynes, Rose, & Markoe , 2013). Another study found the joint effects of age
diversity and perceived climate of age discrimination, to negatively relate to performance
(Kunze, Boehm, & Bruch, 2011). An alternative study to the stream of research that focuses on
demographic-based cultures has implied that lower levels of employees’ perceived
discrimination, in conjunction with an affirming culture, can lead to higher engagement and
involvement (Chrobot-Mason & Button, 1999), but has not directly examined the relationship of
these two variables.
There have been no studies in extant literature that have examined the perceptions of
climate of discrimination as a functioning component of studying overall organizational cultures.
Climates of perceived discrimination are in stark contrast to the values espoused by
organizations that claim to advocate progressive climates—much to their detriment. The possible
concurrence of these divergent climates provides further reasoning for examining perception of
discrimination as a latent construct while assessing organizational climate questionnaires.
According to social identity theory, when a comparison group readily exists, and an
individual feels that they have been treated unfairly because of their membership in a subgroup,
9
discrimination is perceived (Banerjee, 2008). Additionally, members who strongly identify with
a subgroup that has been historically shown to be at a disadvantage perceive greater
discrimination than their comparison group. A widely-known example of a historically
disadvantaged subgroup is women in the workplace. It is critical to overview this history, in
order to understand the need to look at gender as a subgroup that is at risk of experiencing an
inequitable organizational climate.
Gender in the Workplace
The disparity in employee experiences of climate—as they differ from the organization,
or other subgroups within an organization—has been discussed with regard to the need of further
examination of this phenomenon (Jagusztyn, 2011; Kaiser & Major, 2006; Stirling et al., 2011).
Researchers are beginning to consider the significance of differences in perspective and
experiences associated with different social groups (Berdahl & Anderson, 2005). Understanding
these differential experiences could give valuable insight into predicting group norms, behavior,
and preferences as they affect the workplace environment. In order to begin comprehension of
the intricacies of perceptions of climate, it is critical to identify potential groups that may be
experiencing or perceiving an imbalance. This study examines gender as a critical subgroup, one
of particular importance in the workplace. Historically, women have been at a disadvantage of
tremendous magnitude in the workplace (Bryan & Boring, 1947; Astin, 1972). As women
gradually acquire more leadership positions in organizations, it becomes increasingly important
to examine the nature and extent of the similarities and differences they experience in culture as
compared to males (Eagly, Karau, & Makhijani, 1995).
This need for focusing on gender is especially necessary because of the particular
historical adversities women have endured in the workplace. Examples of unfair treatment of
10
genders in organizations have been evident in a variety of settings, but the obstacles faced in
academia have been particularly challenging (Astin, 1972; Pfafflin, 1984; Solmon, 1978).
Traditionally, in academic settings, especially at the university level, women are reported to hold
lower ranking positions (Astin, 1972; Bronstein, Black, Pfennig, & White, 1986), have less
recognition for their work (Astin, 1972; Over, 1981), acquire less tenure (Astin, 1982; Pfafflin,
1984), have a lower rate of hiring and promotion (Teghtsoonian , 1974), and—perhaps the most
consistent results over time—earn less salary (Astin, 1972; Bryan & Boring, 1947; Over, 1981;
Pfafflin, 1984; Teghtsoonian, 1974) as compared to their male counterparts. Even when other
qualifiers were equal—such as number of publications, level of degree earned, academic
ranking, position held, and immobility—women still have been shown to earn lower salaries
compared to men, have less of a chance for upward mobility, and have unequal stature within
departments (Solmon, 1978).
Decades later, contemporary studies are still finding similar results in terms of gender
inequity. A study on culture and gender in medical schools found that the medical schools
employ an average of 43 women compared to 192 men; in these institutions, male career
advancement was also reported to be faster than female career advancement (Pololi, Civian,
Brennan, Dottolo, & Krupat, 2012). The study concludes that medical schools have failed to
create a workplace environment that supports and fully accepts female employees (Pololi et al.,
2012). A lack of feeling acceptance and inclusion is not uncommon for females in academia;
even when they hold higher ranking positions, they experience higher rates of exclusion from
doctoral committees, group grants, decision making processes, and departmental discussions of
research or promotions (Martano & Griffin, 2011). Other studies have reported female
employees having increased feelings of isolation from their male peers (Schroen, Brownstein, &
11
Sheldon, 2004), and lower rates of academic productivity, available time to spend on research,
and overall support received (Kaplan et al., 1996). Females still receive less salary, positions of
tenure, leadership, rank, promotions, and opportunities for advancement compared to their male
counterparts (Foster, McMurray, Linzer, Leavitt, Rosenberg, & Carnes, 2000; Kaplan et al.,
1996; Polpli et al., 2012; Touchton, Musil, & Campbell, 2008; Wright et al., 2003). The need to
focus on the experiences of this subgroup is evident.
Research on these discriminatory practices against women in academic settings has
attempted to provide insight into the challenges they may face, justifications that have been
previously used to propel such disparate treatment, and consequences of this inequity. For
instance, females have been reported to hold greater non-tenure track positions and lower
positions of governance processes in academic institutions; however, even if they are on a track
to tenure, they are more likely to face barriers in actually obtaining tenure and/or advancement to
leadership positions (Bilimoria, Joy, & Liang, 2008; Eagly et al., 1995; Furumoto &
Scarborough, 1986), and encounter more negative experiences than their male counterparts. A
historical explanation of this transpiration purports that women are not preferred in top level
positions because they have been viewed as being less prestigious than men (Boring, 1951).
Another reason for their lower academic advancement is that in the past, women have been
believed to be less productive than men (Guyer & Fidell, 1973). Even successful female leaders
have been viewed as less effective in their positions than males; this negative perception leads to
discriminatory treatment (Guyer & Fidell, 1973).
Bilimoria et al. (2008) administered a climate survey to several universities, at the micro
and macro level, with the goal of obtaining knowledge and direction to break down barriers for
women’s participation and effectiveness within those existent organizational climates. They
12

found that women have been perceiving the internal climate of their respective universities to be
more disrespectful, noncollegial, sexist, competitive, non-supportive, intolerant of diversity, and
non-egalitarian than males. Discouraging as these results may seem, their study has provided
valuable insight into what female employees at universities have been experiencing, on a large
scale.
The cause of these negative climate perceptions is difficult to determine. One possible
explanation could be attributed to social role theory (Eagly et al., 1995). With regard to this
situation, social role theory states that members have implicit social expectations for different
gender roles in the workplace. If females act consistently to these gender-based expectations (i.e.
are interpersonal and supportive), no negative consequences arise. However, if they act
inconsistently to social expectations of feminine behavior (i.e., are authoritative or directive),
negative perceptions surface regarding their effectiveness, especially at the leader level, and they
experience role conflict. If females continue to challenge the expected norms by exhibiting traits
expected from males, they amplify their role conflict, increase chances of receiving negative
evaluations, and increase feelings of devaluation (Eagly et al., 1995; Pratch & Jacobowitz, 1996).
In turn, they are likely to further experience a more negative perception of organizational
climate; this has been shown to lower self-confidence, which is related to lower performance
(Eagly et al., 1995). Similarly, expectations of female employees also could potentially play a
part in explaining their negative perceptions of organizational climate in academic settings.
Through the prevalent culture of an organization, if women have expectations of an existent
glass-ceiling, they may be less likely to apply for leadership positions than equally qualified
males (Eagly et al., 1995), potentially resulting in a self-fulfilling prophecy of low levels of
advancement.
13
The negative outcomes of gender-related social expectations are examples of perceived
discrimination. This is a problem for organizations because in certain settings—especially in
educational organizations—males performed slightly worse than females in leadership
effectiveness (Eagly et al., 1995; Martell & DeSmet, 2001). In more “masculine” settings, such
as the military, males perform more effectively in leadership positions; female leaders are
underrepresented and associated with stereotypes of more emotion-based attributes (i.e.,
cheerfulness, understanding, friendly, etc.) that are not as valued at higher levels (Looney,
Robinson Kurpius, & Lucart, 2004). These gender stereotypes are often translated into
discriminatory behavior—such as mistreatment and unequal hiring decisions—that adversely
affects female employees (Davison & Burke, 2000; Martell & DeSmet, 2001).
Compared to the historic treatment of women in academia, contemporary views
recognize their significance as a resource in the workplace, and are steadily acquiring more
leadership positions. However, there is still a notable amount of inequity in their treatment and
utility. The evidence of incongruous treatment of female employees in the workplace, especially
in academia, is indisputable and plentiful. Holding this in consideration, there is reason to
believe that gender subgroups experience perceptions of organizational climate differentially.
This study aims to examine this differential perception by identifying and analyzing two latent
constructs of organizational climate perceptions—climate of psychological contract maintenance
and perceptions of a climate of discrimination based on subgroup membership—in hopes of
better understanding the nature of how organizational culture manifests. The results are expected
to be consistent with literature on gender discrimination.
14
Hypothesis 1: Male employees will have an increased perception of an organizational
climate that reflects psychological contract maintenance as compared to female
employees.
Hypothesis 2: Male employees will have a decreased perception of an organizational
climate that reflects discriminatory practices as compared to female employees.
Method
Participants
The data for this study was archival, and was collected from a large southeastern
university. An assessment was performed at the university level, and a uniformly distributed to
all faculty members electronically. The sample consisted of 268 faculty members; 130 female
and 138 male. Of the participants, 208 were Caucasian/European, 13 were African American, 11
were Asian/Pacific Islander, 6 were Latin/Hispanic, 2 were Native American/American Indian, 3
were Multiracial, and 25 participants did not indicate race or ethnicity. Participants were selected
from various colleges and departments within the university to capture variation in differing
climates.
Measures
Organizational Climate. A climate questionnaire based on the Harvard Collaborative on
Academic Careers in Higher Education (COACHE, 2007) was modified and administered to
assess perception of an organizational climate. The COACHE survey initially polled faculty
members to compile and compare trends between public and private institutions of higher
education. Specifically, they examined pre-tenure faculty satisfaction with key elements of their
work lives and workplace climate (Ponjuan, Conley, & Trower, 2011). They examined several
workplace outcomes. The initial survey assessed various aspects of climate: clarity and
15
reasonableness of the expectations for tenure; support for teaching and research; support for
family and personal life; climate, culture, and collegiality; policies and practices; and
compensation and benefits (Benson & Trower, 2012; Trower, 2009). Unfortunately, regarding
climate, culture, and collegiality, results did not differ dramatically between departments
(Gallagher, 2007). For this reason, the survey was shortened and modified to fit the current
university setting in an attempt to assess an organizational climate profile showing differential
perceptions by gender. Items of this modified questionnaire assessed differing climate
perceptions with respect to morale, discrimination, fairness, accountability, assistance,
discrimination, and leadership. Items are statements which the subject must rate using their
judgment. The overall scale consists of eight items. Each item is measured with a 5-point, Likert-
type scale ranging from 1 (strongly disagree) to 5 (strongly agree). (Values coded as 6= n/a;
these items were recoded as missing and removed). Items are provided in Appendix A.
Procedure
As discussed, this research is interested in studying a variable (Organizational Climate)
that has two latent constructs within it (Perceptions of a Psychological Contract Maintenance
Climate and Perceptions of a Discrimination Climate), and how these constructs relate to males
and females differentially. Participants were instructed to take an anonymous survey measuring
organizational culture. The culture survey, based on the Harvard Coache measure, assessed
participants’ respective perceptions of organizational climate within their workplace, and
ascertained demographic information (i.e., gender, department, etc.) as it might relate to their
experiences of workplace climate. Each participant was given a personal identification number;
all of their assessments were coded under their corresponding code in order to protect privacy.
The items on the questionnaires were presented in a brief online session. Any participants were
16
removed from sample if they had incomplete responses on all items of the climate scale.
Participant responses were analyzed for existence of the proposed latent constructs and any
differential results of organizational climate perceptions based on participant gender.
Results
Preliminary Analyses
All data were coded for missing values; subjects missing all data were removed from the
dataset. A missing value analysis was conducted in Mplus; missing data patterns and covariance
convergence of data were examined. The missing data patterns revealed 7 patterns, but only
between 1-3 cases of each were missing. The covariance convergence of data revealed that all
items had above 97% complete data when two variables were paired. Due to the fact that there
were missing data, Little’s Missing Completely At Random (MCAR) test was conducted to
determine if the data was missing completely at random. The data were determined to be missing
at random or missing not at random. To best deal with this pattern, all subsequent analyses were
conducted using the Full Information Maximum Likelihood model (FIML). The method of
analysis needs to examine fit statistics of multiple models, so the FIML method was viewed as
more advantageous than multiple imputation or deletion.
To further examine the normality of data, a check for outliers, skewness, and kurtosis was
conducted. Skewness for all variables was within the standard range of -3 to 3; kurtosis values
were all fairly close to 0, which is less than the recommended absolute value of 10 (see Table1
for descriptive statistics for males; see Table 2 for descriptive statistics for females). Outliers
were checked in triplicate; no outliers were found. Univariate outliers were assessed with the test
for the median value +/- 2IQR (Interquartile Range); all items were within range. Bivariate
outliers were assessed with observing scatterplots; multivariate outliers were checked for using
17
the test for Mahalanobis distance, at the p < 0.001 significance level. Data were determined as
normal and were split by gender to run subsequent analyses.
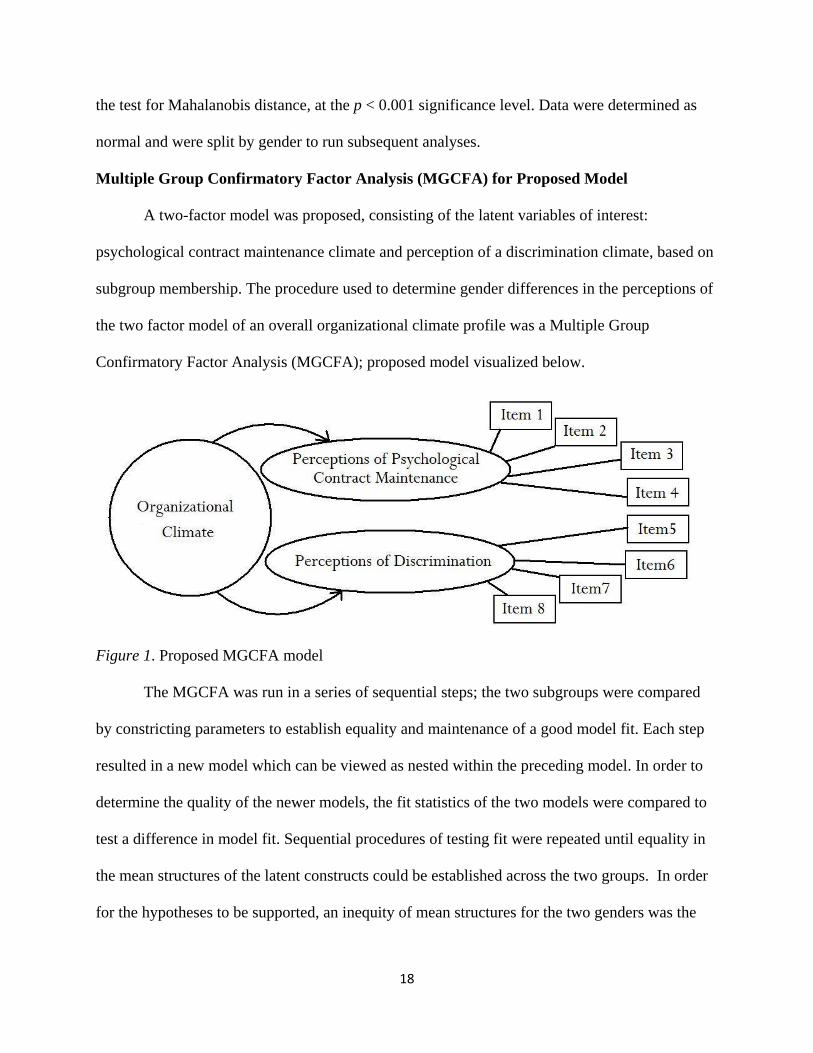
Multiple Group Confirmatory Factor Analysis (MGCFA) for Proposed Model
A two-factor model was proposed, consisting of the latent variables of interest:
psychological contract maintenance climate and perception of a discrimination climate, based on
subgroup membership. The procedure used to determine gender differences in the perceptions of
the two factor model of an overall organizational climate profile was a Multiple Group
Confirmatory Factor Analysis (MGCFA); proposed model visualized below.
Figure 1. Proposed MGCFA model
The MGCFA was run in a series of sequential steps; the two subgroups were compared
by constricting parameters to establish equality and maintenance of a good model fit. Each step
resulted in a new model which can be viewed as nested within the preceding model. In order to
determine the quality of the newer models, the fit statistics of the two models were compared to
test a difference in model fit. Sequential procedures of testing fit were repeated until equality in
the mean structures of the latent constructs could be established across the two groups. In order
for the hypotheses to be supported, an inequity of mean structures for the two genders was the
18
expected result. The detailed statistical procedures, analyses, and their resulting products are
described below.
Step 1: Establish Model Fits for Both Genders
In the first step, a Confirmatory Factor Analysis (CFA) was conducted on both groups to
ensure the model was a good fit for both genders. This determined that the same overall two-
factor structure worked for both groups. Two separate CFAs were conducted for each group and
the model fit (see Table 3) and general unstandardized model estimates were examined (see
Table 4 for men and Table 5 for females). The model fit was good for both groups. The Chi-
Square test statistic (χ2) was not significant so the chi-square null hypothesis, that the fit is
perfect, could not be rejected for either group (Males χ2 = 23.343, p = 0.226; Females χ2 =
27.385, p = 0.096). The lower limit of RMSEA (Male: 0.000, 0.089; Female 0.000, 0.103)
indicates the hypothesis that the fit is close cannot be rejected because it is less than .05 for both
groups; the upper limit indicates that the poor fit hypothesis for males can be rejected because it
is less than .10, but not for females; SRMR indicates a low average discrepancy between implied
and observed correlation matrices for both groups (Males = 0.053; Females = 0.045). CFI/TLI
are above .97 for both groups. The factor loadings were observed as similar across both groups.
No loadings were determined as potentially problematic; overall fit was good.
Step 2: Establish a Baseline Model
Once good fit was established for both genders, data for both groups were combined. A
CFA was conducted on both groups simultaneously; all factor loadings across both groups were
freed, in order to establish a baseline model (or equal form) for comparison in subsequent steps.
The model fit (see Table 6) and general unstandardized model estimates are reported (see Table
7). The following steps were nested in our baseline model. If the χ2 values are compared to those
19
from step 1, it can be observed that step 2 yields a sum of the χ2 and Degrees of Freedom (DF)
values from both groups. The results convey that the same number of factors fits both groups.
Overall fit was still good; chi square (χ2= 50.728, p = 0.0811) was not significant the perfect fit
null hypothesis cannot be rejected. RMSEA (0.000, 0.083) indicates the close fit hypothesis
cannot be rejected, but the poor fit hypothesis can be rejected; SRMR (0.049) indicates a low
average discrepancy between implied and observed correlation matrices for both groups.
CFI/TLI are each above .98. Taken together, these indicated a good overall fit, so there is
justification in proceeding to step three.
For each of the following steps, the resultant models were compared to the one from the
step before (e.g., step three model was compared to step 2, step 4 model was compared to step 3,
etc.) to maintain that the newer models still have good fit as compared to the preceding ones.
Step 3: Test for Equality of Factor Loadings
In this step, in order to establish factor loading invariance, a multiple group analysis
model was run, while constraining the factor loadings for each item to be equal across both
groups. In order to proceed, it must first be determined that the factors for each items load the
same way onto the latent variables for both genders. The model fit (see Table 8) and general
unstandardized model estimates are reported (see Table 9). The new fit of this constrained model
was compared against the baseline model to justify further analysis. A χ2 difference test was
conducted between this and our baseline model from step two in order to test for equivalence of
factor loadings across groups (comparing the nested model to the baseline model). At this point,
the factor loadings are equal, but the factor variances, factor covariances, residual variances, and
intercepts were still freely estimated. Our χ2 is slightly larger, but not significant enough to reject
the perfect fit null hypothesis. RMSEA (0.000, 0.080), SRMR (0.058), and CFI/TLI (above .98)
20
still indicated a good fit. The χ2 difference test yielded a value of 6.796; the critical value for 6
DF of the difference test in standardized χ2 distribution table is: 12.59. 6.796 < 12.89, so full
factor loading invariance was established. It was concluded that constraining factor loadings to
be equal across both genders does not significantly worsen the fit from our baseline model. The
results justified in proceeding to step four.
Step 4: Test for Equality of Factor Intercepts
In this step, the test was for cross-group equality of intercepts. The analysis was
conducted by fixing the intercepts for all items to be equal across both groups; however, the
means for the female group were allowed to load freely, and males were fixed at zero. The same
basic idea as step three applied; in order to proceed, it had to be determined that the intercepts for
each item were equal for both genders. The model fit (see Table 10) and general unstandardized
model estimates are reported (see Table 11). The new fit in this equal intercept model was
compared to the previous, loading constraint model of step three. A χ2 difference test between
this model fit and step three was conducted. Our χ2 for this step is larger, but not significant
enough to reject the perfect fit null hypothesis. RMSEA (0.051, 0.103), SRMR (0.077), and
CFI/TLI (above .95) still indicated a moderately good model fit, even though the values indicate
a slightly poorer fit than the preceding model. The χ2 difference test yielded a value of 32.981;
the critical value for 6 DF of the difference test in standardized χ2 distribution table is: 12.59.
32.981>12.59, so full cross-group intercept invariance was not established. It was concluded that
constraining intercepts to be equal across both genders does significantly worsen the fit from our
baseline model. Before proceeding to the next stage in the sequence, partial intercept invariance
must be established across genders.
Step 5: Test for Partial Equality of Factor Intercepts
21
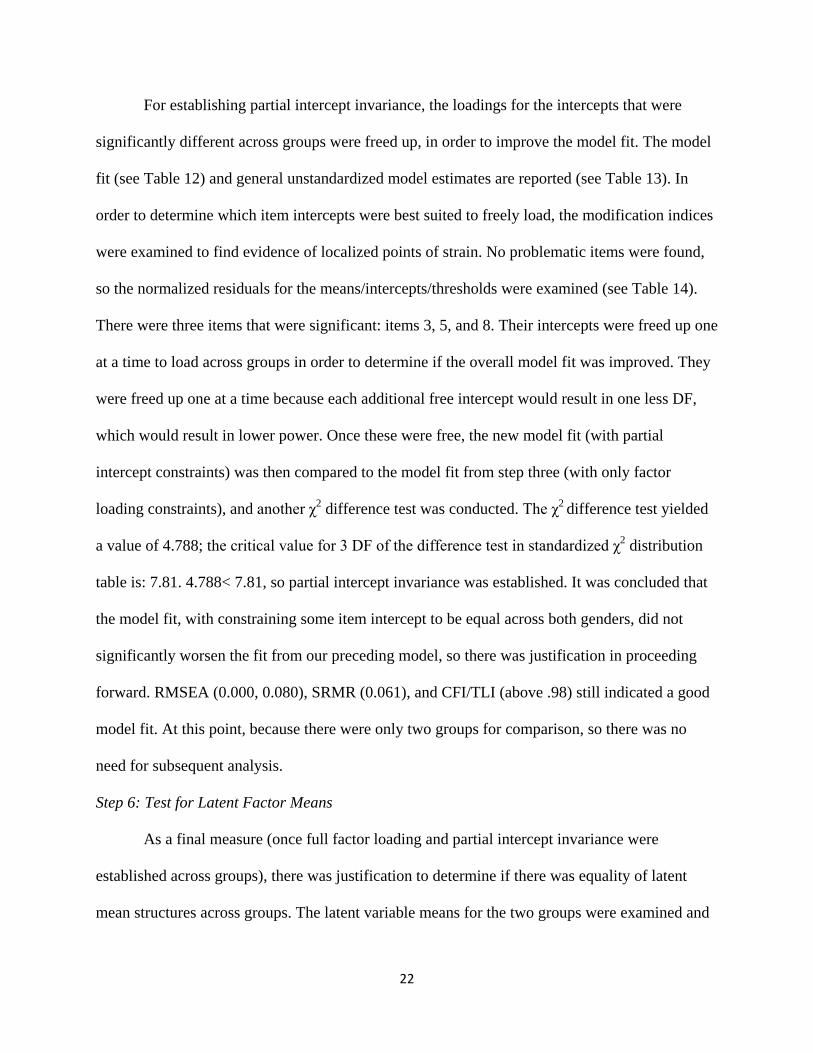
For establishing partial intercept invariance, the loadings for the intercepts that were
significantly different across groups were freed up, in order to improve the model fit. The model
fit (see Table 12) and general unstandardized model estimates are reported (see Table 13). In
order to determine which item intercepts were best suited to freely load, the modification indices
were examined to find evidence of localized points of strain. No problematic items were found,
so the normalized residuals for the means/intercepts/thresholds were examined (see Table 14).
There were three items that were significant: items 3, 5, and 8. Their intercepts were freed up one
at a time to load across groups in order to determine if the overall model fit was improved. They
were freed up one at a time because each additional free intercept would result in one less DF,
which would result in lower power. Once these were free, the new model fit (with partial
intercept constraints) was then compared to the model fit from step three (with only factor
loading constraints), and another χ2 difference test was conducted. The χ2 difference test yielded
a value of 4.788; the critical value for 3 DF of the difference test in standardized χ2 distribution
table is: 7.81. 4.788< 7.81, so partial intercept invariance was established. It was concluded that
the model fit, with constraining some item intercept to be equal across both genders, did not
significantly worsen the fit from our preceding model, so there was justification in proceeding
forward. RMSEA (0.000, 0.080), SRMR (0.061), and CFI/TLI (above .98) still indicated a good
model fit. At this point, because there were only two groups for comparison, so there was no
need for subsequent analysis.
Step 6: Test for Latent Factor Means
As a final measure (once full factor loading and partial intercept invariance were
established across groups), there was justification to determine if there was equality of latent
mean structures across groups. The latent variable means for the two groups were examined and
22
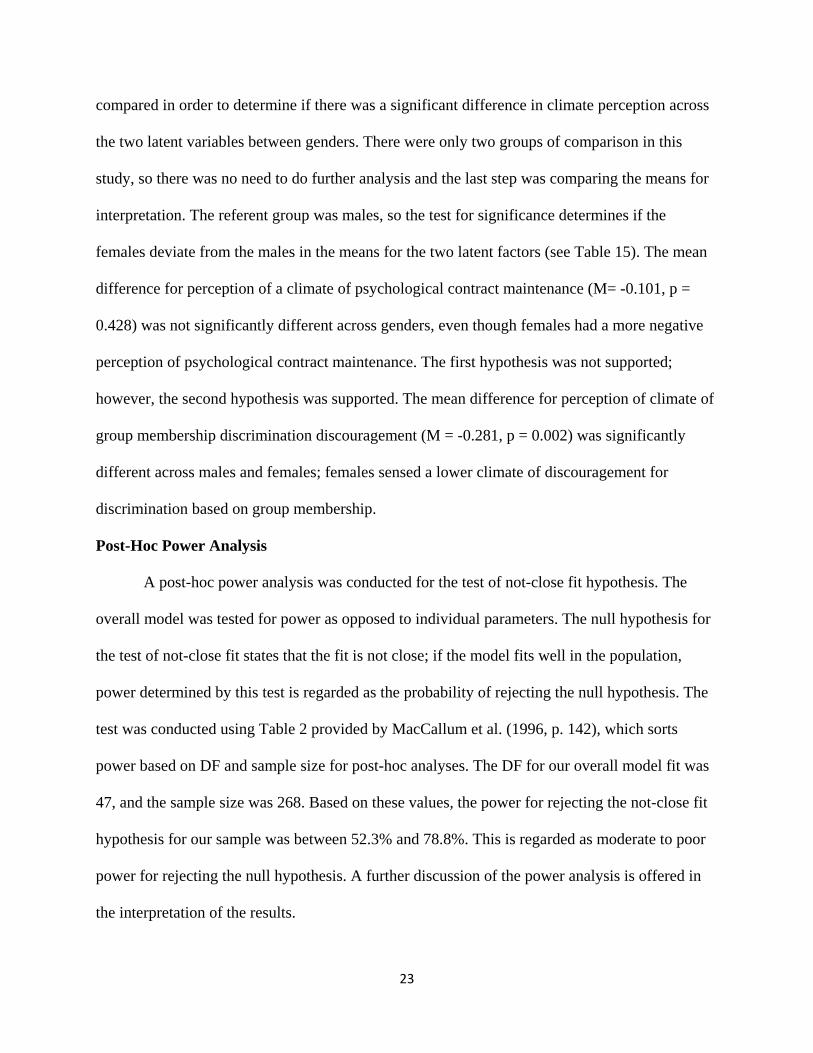
compared in order to determine if there was a significant difference in climate perception across
the two latent variables between genders. There were only two groups of comparison in this
study, so there was no need to do further analysis and the last step was comparing the means for
interpretation. The referent group was males, so the test for significance determines if the
females deviate from the males in the means for the two latent factors (see Table 15). The mean
difference for perception of a climate of psychological contract maintenance (M= -0.101, p =
0.428) was not significantly different across genders, even though females had a more negative
perception of psychological contract maintenance. The first hypothesis was not supported;
however, the second hypothesis was supported. The mean difference for perception of climate of
group membership discrimination discouragement (M = -0.281, p = 0.002) was significantly
different across males and females; females sensed a lower climate of discouragement for
discrimination based on group membership.
Post-Hoc Power Analysis
A post-hoc power analysis was conducted for the test of not-close fit hypothesis. The
overall model was tested for power as opposed to individual parameters. The null hypothesis for
the test of not-close fit states that the fit is not close; if the model fits well in the population,
power determined by this test is regarded as the probability of rejecting the null hypothesis. The
test was conducted using Table 2 provided by MacCallum et al. (1996, p. 142), which sorts
power based on DF and sample size for post-hoc analyses. The DF for our overall model fit was
47, and the sample size was 268. Based on these values, the power for rejecting the not-close fit
hypothesis for our sample was between 52.3% and 78.8%. This is regarded as moderate to poor
power for rejecting the null hypothesis. A further discussion of the power analysis is offered in
the interpretation of the results.
23
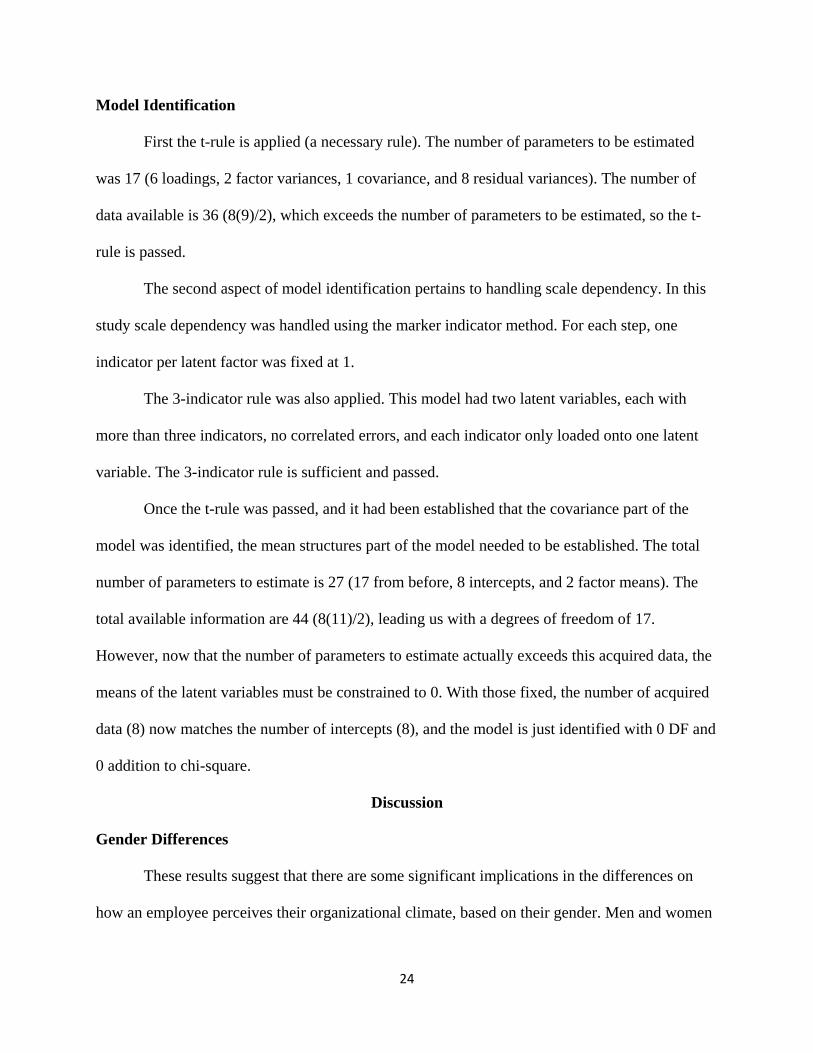
Model Identification
First the t-rule is applied (a necessary rule). The number of parameters to be estimated
was 17 (6 loadings, 2 factor variances, 1 covariance, and 8 residual variances). The number of
data available is 36 (8(9)/2), which exceeds the number of parameters to be estimated, so the t-
rule is passed.
The second aspect of model identification pertains to handling scale dependency. In this
study scale dependency was handled using the marker indicator method. For each step, one
indicator per latent factor was fixed at 1.
The 3-indicator rule was also applied. This model had two latent variables, each with
more than three indicators, no correlated errors, and each indicator only loaded onto one latent
variable. The 3-indicator rule is sufficient and passed.
Once the t-rule was passed, and it had been established that the covariance part of the
model was identified, the mean structures part of the model needed to be established. The total
number of parameters to estimate is 27 (17 from before, 8 intercepts, and 2 factor means). The
total available information are 44 (8(11)/2), leading us with a degrees of freedom of 17.
However, now that the number of parameters to estimate actually exceeds this acquired data, the
means of the latent variables must be constrained to 0. With those fixed, the number of acquired
data (8) now matches the number of intercepts (8), and the model is just identified with 0 DF and
0 addition to chi-square.
Discussion
Gender Differences
These results suggest that there are some significant implications in the differences on
how an employee perceives their organizational climate, based on their gender. Men and women
24
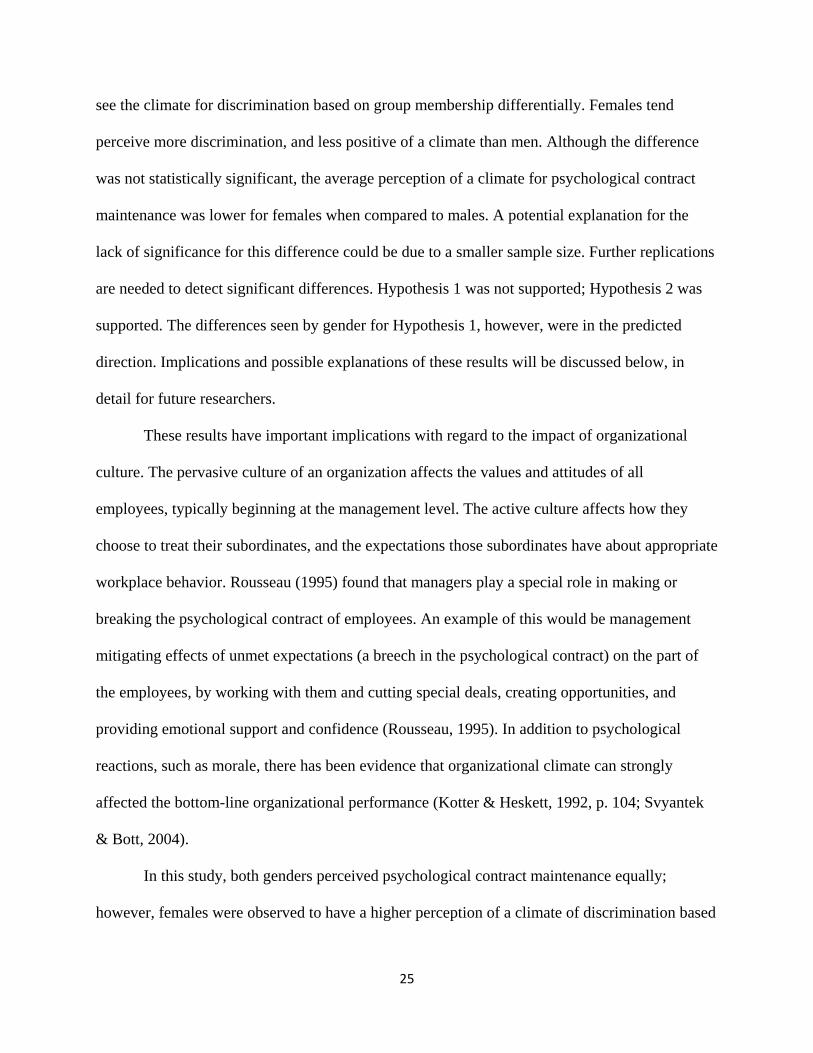
see the climate for discrimination based on group membership differentially. Females tend
perceive more discrimination, and less positive of a climate than men. Although the difference
was not statistically significant, the average perception of a climate for psychological contract
maintenance was lower for females when compared to males. A potential explanation for the
lack of significance for this difference could be due to a smaller sample size. Further replications
are needed to detect significant differences. Hypothesis 1 was not supported; Hypothesis 2 was
supported. The differences seen by gender for Hypothesis 1, however, were in the predicted
direction. Implications and possible explanations of these results will be discussed below, in
detail for future researchers.
These results have important implications with regard to the impact of organizational
culture. The pervasive culture of an organization affects the values and attitudes of all
employees, typically beginning at the management level. The active culture affects how they
choose to treat their subordinates, and the expectations those subordinates have about appropriate
workplace behavior. Rousseau (1995) found that managers play a special role in making or
breaking the psychological contract of employees. An example of this would be management
mitigating effects of unmet expectations (a breech in the psychological contract) on the part of
the employees, by working with them and cutting special deals, creating opportunities, and
providing emotional support and confidence (Rousseau, 1995). In addition to psychological
reactions, such as morale, there has been evidence that organizational climate can strongly
affected the bottom-line organizational performance (Kotter & Heskett, 1992, p. 104; Svyantek
& Bott, 2004).
In this study, both genders perceived psychological contract maintenance equally;
however, females were observed to have a higher perception of a climate of discrimination based
25
on their group membership. Females perceived their workplace climate to have more of a lack of
accountability for discrimination, as compared to males, which may have led to increased
negative perceptions of overall organizational climate. This could be indicative of female
employees experiencing a more closed climate profile within the organization. If one subgroup
of employees (in this case, females in the university setting) experiences these negative climate
perceptions more than another, it could lead to feelings of inequity or being under-valued, which
could lead to attrition. This is cause for concern because if women feel the need to self-select
out, organizations stand to lose a substantial portion of talent in the workforce through loss of
diversity (Astin, 1972). Additionally, failing to provide the same encouragement to women as is
provided for men has a similar effect, resulting in an issue of poor human resources utilization
(Pflafflin, 1984).
Practical and Theoretical Implications
The implications of this study call for a more thorough and deliberate development of
organizational culture. Schein (1992) outlined two major processes of organizational culture as
external adaptation and internal integration. As this study highlights the need for organizations to
reexamine the true culture they may have in effect, a potential motivation for this analysis could
be external adaptation. External adaptation can be viewed as an evolutionary process (Schein,
1992); organizations assess the changing needs of their external environment, and must adapt to
be successful in that macro-level business economy. In this case, the global workforce
environment is becoming increasingly egalitarian, with a need for more diversity and equality
(Bilimoria et al., 2008). Organizations with a perceived climate of discrimination must firstly
recognize its existence, and in response, adapt to their outside, progressive environment. The
second process, internal integration, is the commitment of values throughout the social structures
26
of the organization. Integration leads to increased cohesion and professional socialization
(Schein, 1992). In this case, on a micro-level, organizations must actively integrate a functionally
open climate across its different levels in pursuit of strengthening the structure of its climate.
In order to cultivate equity, organizations must refocus the traditional character of the
workplace away from just utilizing employees of a certain type, and instead accommodating a
different type; institutionalized routines and social practices that have been ingrained in the
fabric of their social structures need to be transformed wholly (Bilimoria et al., 2008). In sum, an
adaptive culture is better than an unchanging organizational culture, and organizations must
strive to adjust and acclimate to their changing external environments (Schein, 1992).
Adaptation involves large-scale transformation. Transformation requires fundamentally
altering the organization’s culture by carefully establishing the vision of the end-goal, outlining a
strategy to achieve that vision, offering comprehensive administrative support, collaborating on
leadership, and most importantly, showing visible action (Bilimoria et al., 2008). Bilimoria et al.
(2008) provide literature on an example of a successful organizational change initiative through
the implementation of their ADVANCE program in certain universities. Moreover, the
ADVANCE program is an example of the exact sort of cultural restructuring that this study calls
a need for—one that refocuses actual practices of gender equality in the workplace. The
ADVANCE program suggested climate initiative ideas at certain universities. These initiatives
included educating, training, and developing male colleagues in order to improve their awareness
and practices. Initiatives also devoted effort on making the micro-climates (departments) more
collegial, egalitarian, equitable, and transparent. Lastly, the initiatives created increasing
awareness of organizational diversity and the problems associated with non-inclusionary
practices (Bilimoria et al., 2008).
27
Other studies have suggested restructuring organizational culture by changing the specific
practices related to the way employees are utilized. A recurrent theme that surfaced in literature
was the need to increase female leadership positions in an attempt to change organizational
culture at the management level. Berdahl and Anderson (2005) suggested increasing the
participation of women in groups. Gender has an effect on the group structure and the dynamics
of the resultant emergent leaders, which has had positive effects on group cohesion. In the past,
females who portrayed salient masculine characteristics have been seen as more promotable
(Looney & Kurpius, 2004). Even successful managerial women have been seen as less effective
leaders, who lack the qualities to lead, compared to their male counter parts (Martell & DeSmet,
2001). Involving more women to participate at the group level would increase the salience of
more female characteristics, potentially demonstrating their utility on a more wide-spread scale
that effects promotions and understanding of their effectiveness as leaders. In today’s business
environment, leaders must demonstrate greater cooperation, support, employee participation,
along with other qualities associated with female behavior more so than male (Martell &
DeSmet, 2001). The rise of women in the workplace has thus far been limited by outdated gender
role attitudes of decision makers; increasing female inclusion in specific practices at differing
levels could begin to combat these practices and change organizational cultures to truly become
more progressive (Looney & Kurpius, 2004; Pratch & Jacobowitz, 1996).
Changing organizational practices in order to reflect an espoused progressive and equal
organizational culture is increasingly important with the growing diversity in the workforce. If
one particular group within the organization is continually having a negative and closed
experience of climate, that group may have a lower level of performance. At the university level,
if this group is female—a group that is composed of a substantial portion of employees—then
28
this indicates a significant negative effect in overall organizational performance. As
demonstrated in this study, a culture for group discrimination is deemed more salient to females,
having perceived an existing climate for it more than males. Avoiding discrimination, and the
numerous negative consequences on the large subgroup that experiences it, call for a
restructuring of egalitarian practices in academic institutions. Although female employees in
academia did not perceive more of a breech in their psychological contracts than males, a greater
understanding of this phenomenon still needs to be further researched. It is possible that when an
employee starts working with an organization, an expected aspect of their psychological contract
could be the expectation to work within a discrimination-free environment. To this end, it is
interesting that an employee can experience discrimination, but not a breech in their
psychological contract. One explanation could be that gender based discrimination could be the
factor that is offsetting the differential effects of the perceived equality of psychological contract
maintenance between males and females. In order to better understand these gender-based
differences in equality of perceptions, future research should examine mediation effects of
discrimination on psychological contract maintenance within an overall organizational climate.
Gaining a better understanding of the functionality involved in differential group perceptions of
culture would allow organizations to more readily avoid experiences of discrimination, resulting
in a cohesive, progressive workplace environment.
Limitations and Future Research
There were a few limitations to note. One limitation in this study was the low power. It
should be acknowledged that according to the not-close fit hypothesis, this level of power would
not be very strong in rejecting a null that claims the model fit is not close. However, good model
fit was established. It is concluded that even though there is low power, the model fit was still
29
good enough to offset the low power of the sample. Regarding power, it is recommended that
future research be conducted with a greater sample size to test the effects of greater power.
Researchers should also test if the faculty status or tenure within the department would
matter with regard to climate perceptions. It would be interesting to see if faculty members who
have been in a position longer experience more discrimination than newer employees. The
proportion of gender in tenured faculty would need to be taken into account when discerning
perceived discrimination. A replication with a stratified sample in an academic setting could
yield interesting results. Future research could implement other methods of stratifying the sample
that include examining the differences in perceived climate within different departments. For
instance, certain academic departments have a higher concentration of female faculty (i.e.,
English departments) or male faculty (i.e., Engineering) which could have different results in the
gender-based experiences of a uniformly open organizational culture. Another example could
look at race as a potential factor in differential perceptions of discrimination.
Another limitation of this study was that it was conducted in a large southeastern
university. The national and regional culture impacts the actual impact of organizational culture
(Kotter & Heskett, 1992, p. 41). A replication of this sample in another location (or with smaller
universities) would help with generalization of the results. There could be existing geographic
differences in how men and women are treated in the workplace, or how well maintained their
psychological contracts are. Perhaps replicating the study in a different region could find
significant gender differences for psychological contract maintenance.
Additionally, there could be regional differences in the emphasis paid on the importance
of having an open and progressive organizational climate. This study should be replicated within
an open organizational culture context, a closed organizational culture, and other climate
30
profiles, to assess the potential emergence of different latent factors, as well as examine their
relationship to different organizational outcomes.
The cross-sectional nature of this study also inhibits a more global understanding of
climate; particularly at the organizational level, climate change is an interesting phenomenon,
because it directly reflects on its external environment. As the outside environment changes,
different demands on workforce practices are required, and adaptation becomes necessary to
survive. The importance placed on progressive organizational climates could be functional at this
time, but when the economy evolves, emphasis could be paid on different aspects of
organizational culture. On a micro-level, differences in perceptions of discrimination at one point
in time (for instance, as a newcomer) could be different than perceptions of discrimination after
having worked with the organization for some time. This study should be replicated
longitudinally, to gain a better understanding of the structure and functionality of organizational
culture. Relatedly, replicating this study in a non-academic environment could have stronger
implications for the generalization of these results.
Lastly, this is a confirmatory factor analysis, so no causal interpretation can be drawn
between the latent factors; any sort of inference should be carefully drawn. As with any
statistical models, there will always be equivalent models that exist which may provide an
identical good fit, but with substantively different interpretations. For instance, in this case, if we
changed the covariance between the two latent factors into a causal pathway (SEM), we are now
making completely different claims about the mechanisms of the model. However, the fit would
still be identical to the current model. This study acknowledges that there are other models that
exist that have the same fit, and would like to maintain that the exploratory nature of how these
two latent variables relate was more of interest to this study. As such, this is the model that we
31
proposed to learn more about this interaction. Future research should also replicate these findings
with a different model structure in order to better understand the effects of gender on
organizational climate perception.
Conclusion
Organizations that have an open culture emphasize respect for people through fairness,
tolerance, equality, and support for all employees (O’Reilly, Chatman, & Caldwell, 1991). As
previously discussed, organizational climate is important in the functionality of the workplace; it
has been shown to have an impact on several organizational outcomes. Espoused organization
values can endorse a progressive, non-discriminatory climate in theory; however, in practice, the
pervasive climate that actually exists may not be experienced the same way by all members of
the organization. This is of concern, because the effect of superficially neutral policies may
actually be detrimental rather than benign (Pfafflin, 1984). When organizations have
misrepresented beliefs—beliefs that do not reflect accurate workplace conditions for
employees—they could foster animosity amongst workers and hinder progress. When the
misrepresented beliefs target a specific group, such as women—a fairly large group—the result
could be a substantial loss in productivity for the organization. It would be very beneficial for
organizations to investigate whether a disconnect exists between the climate they claim to foster
and the one that exists in practice. Remedying a disconnect in espoused and practiced values of
organizational culture may help that organization adapt to remain successful in its external
business environment.
32
References
Adkins, B., & Caldwell, D. (2004). Firm or subgroup culture: Where does fitting in matter most?
Journal of Organizational Behavior, 25(8), 969-978.
Argyris, C. (1960). Understanding Organizational Behavior. Dorsey, Homewood, IL.
Ashkanasy, N. M., Wilderom, C. P., & Peterson, M. F. (2000), Handbook of organizational
culture & climate (pp. 1-20). California: Sage Publications, Inc.
Astin, H. S. (1972). Employment and career status of women psychologists. American
Psychologist, 27(5), 371-381.
Bal, P., Kooij, D. M., & De Jong, S. B. (2013). How do developmental and accommodative
HRM enhance employee engagement and commitment? The role of psychological
contract and SOC strategies. Journal of Management Studies, 50(4), 545-572.
Banerjee, R. (2008). An Examination of Factors Affecting Perception of Workplace
Discrimination. Journal Of Labor Research, 29(4), 380-401.
Benson, R. T., & Trower, C. A. (2012). Data, leadersip, and catalyzing culture change. Change,
27-34.
Berdahl, J. L., & Anderson, C. (2005). Men, Women, and Leadership Centralization in Groups
Over Time. Group Dynamics, 9(1), 45-57.
Bilimoria, D., Joy, S., & Liang, X. (2008). Breaking barriers and creating inclusiveness: Lessons
of organizational transformation to advance women faculty in academic science and
engineering. Human Resource Management, 47(3), 423-441.
33
Boring, E. G. (1951). The Woman Problem. American Psychologist, 6(12), 679-682.
Botsford, M. W., & King, E. B. (2012). Mothers' psychological contracts: Does supervisor
breach explain intention to leave the organization?Human Resource Management, 51(5),
629-649.
Bradley, J. (2010). Antecedents and outcomes of workplace discrimination as perceived by
employees with disabilities. Dissertation Abstracts International, 70, 5215.
Bronstein, P., Black, L., Pfennig, J., & White, A. (1986). Getting academic jobs: Are women
equally qualified—and equally successful? American Psychologist, 41(3), 318-322.
Bryan, A. I., & Boring, E. G. (1947). Women in American psychology: Factors affecting their
professional careers. American Psychologist, 2(1), 3-20.
Cangemi, J., & Miller, R. (2007). Breaking-out-of-the-box in organizations: Structuring a
positive climate for the development of creativity in the workplace. Journal of
Management Development, 26(5), 401-410.
Chiang, J. C., Chechen, L., Jiang, J., & Klein, G. (2012). Consequences of psychological
contract violations for IS personnel. Journal of Computer Information Systems, 52(4), 78-
87.
Chrobot-Mason, D., & Button, S. B. (1999). Sexual identity management strategies: An
exploration of antecedents and consequences. Academy of Management Proceedings &
Membership Directory, GDO, H1-H6.
Daldy, B., Poot, J., & Roskruge, M. (2013). Perception of Workplace Discrimination among
Immigrants and Native Born New Zealanders. Australian Journal of Labour Economics,
16(1), 137-154.
34
Davison, H. K., & Burke, M. J. (2000). Sex discrimination in simulated employment contexts: A
meta-analytic investigation. Journal of Vocational Behavior, 56(2), 225-248.
Denison, D. R. (1996). What is the difference between organizational culture and organizational
climate? A native’s point of view on a decade of paradigm wars. Academy of
Management Review, 21(3), 619-654.
Eagly, A. H., Karau, S. J., & Makhijani, M. G. (1995). Gender and the effectiveness of leaders:
A meta-analysis. Psychological Bulletin, 117(1), 125-145.
Ensher, E. A., Grant-Vallone, E. J., & Donaldson, S. I. (2001) Effects of perceived
discrimination on job satisfaction, organizational commitment, organizational citizenship
behaviors and grievances. Human Resource Development Quarterly, 12, 5-72.
Foster, S.W., McMurray, J.E., Linzer, M., Leavitt, J.W., Rosenberg, M., & Carnes, M. (2000).
Results of a gender-climate and work-environment survey at a Midwestern academic
health center. Academic Medicine, 75(6), 653-660.
Furumoto, L., & Scarborough, E. (1986). Placing women in the history of psychology: The first
American women psychologists. American Psychologist, 41(1), 35-42.
Gallagher, A. (2007). Study challenges: Assumption that private colleges make better faculty
workplaces. Academic Sourcebook, 25-26.
Gundling, E. (2000). The 3M way to innovation: Balancing people and profit. Tokyo: Kodansha
International.
35
Guyer, L., & Fidell, L. (1973). Publications of men and women psychologists: Do women
publish less? American Psychologist, 28(2), 157-160.
Halpin, A. W. (1966). Theory and research in administration. Oxford, England: Macmillan.
Jagusztyn, N. (2011). Perceived workplace discrimination as a mediator of the relationship
between work environment and employee outcomes: Does minority status matter?
Dissertation Abstracts International, 71, 7132
James, L. R., & Jones, A. P. (1974). Organizational climate: A review of theory and research.
Psychological Bulletin, 81(12), 1096-1112.
Janson, N. (1994). Safety culture: A study of permanent way staff at British Rail. Amsterdam:
Vrije University.
Kaiser, C. R. & Major, B. (2006). A Social Psychological Perspective on Perceiving and
Reporting Discrimination. Law & Social Inquiry, 31(4), 801-830.
Kaplan, S.H., Sullivan, L.M., Dukes, K.A., Phillips, C.F., Kelch, R.P., Schaller, J.G. (1996). Sex
differences in academic advancement. The New England Journal of Medicine, 335,
1282–1289.
Katz, D., & Kahn, R. L. (1978). The social psychology of organizations (2nd ed.). New York:
Wiley.
Kotter, J. P., & Heskett, J. L. (1992). Corporate culture and performance. New York: Free Press.
36
Kunze, F., Boehm, S. A., & Bruch, H. (2011). Age diversity, age discrimination climate and
performance consequences-a cross organizational study. Journal of Organizational
Behavior, 32(2), 264-290.
Litwin, G. H., & Stringer, R. A. (1968). Motivation and Organizational Climate. Boston:
Harvard University Press.
Looney, J., Robinson Kurpius, S. E., & Lucart, L. (2004). Military leadership evaluations effects
of evaluator sex, leader sex, and gender role attitudes. Consulting Psychology Journal:
Practice & Research, 56(2), 104-118.
MacCallum, R. C., Browne, M. W., & Sugawara, H. M. (1996). Power analysis and
determination of sample size for covariance structure modeling. Psychological Methods,
1(2), 130-149.
Maranto, C., & Griffin, A. (2011). The antecedents of a ‘chilly climate’ for women faculty in
higher education. Human Relations, 64(2), 139-159.
Martell, R. F., & DeSmet, A. L. (2001). A diagnostic-ratio approach to measuring beliefs about
the leadership abilities of male and female managers. Journal of Applied Psychology,
86(6), 1223-1231.
Mason, R. O. (2004). Lessons in organizational ethics from the Columbia disaster: Can a culture
be lethal? Organizational Dynamics, 33(2), 128-142.
Nicholson, N., & Johns, G. (1985). The Absence Culture and Psychological Contract-Who's in
Control of Absence? Academy Of Management Review, 10(3), 397-407.
37
O’Reilly, C. A., Chatman, J., & Caldwell, D. F. (1991). People and organizational culture: A
profile comparison approach to assessing person-environment fit. Academy of
Management Journal, 34, 487-516.
Over, R. (1981). Representation of women on the editorial boards of psychology journals.
American Psychologist, 36(8), 885-891.
Paull, M. (2000). Managing volunteer performance: The role of the feedback environment.
Australian Journal on Volunteering, 5(2), 19-31.
Pavalko, E. K., Mossakowski, K. N., & Hamilton, V. J. (2003) Does perceived discrimination
affect health? Longitudinal relationships between work discrimination and women’s
physical and emotional health. Journal of Health and Social Behavior, 43, 18-33.
Payne, R. L. (2000). Climate and culture. In N. M. Ashkanasy, C. P. Wilderom, & M. F.
Peterson (Eds.), Handbook of organizational culture & climate (pp. 163-176). California:
Sage Publications, Inc.
Pfafflin, S. M. (1984). Women, science, and technology. American Psychologist, 39(10), 1183-
1186.
Ponjuan, L., Conley, V. M., & Trower, C. (2011). Career stage differences in pre-tenure track
faculty perceptions of professional and personal relationships with colleagues. Journal of
Higher Education, 82(3), 319-346.
38
Pratch, L., & Jacobowitz, J. (1996). Gender, motivation, and coping in the evaluation of
leadership effectiveness. Consulting Psychology Journal: Practice and Research, 48(4),
203-220.
Ravisi, D., & Schultz, M. (2006). Responding to organizational identity threats: Exploring the
role of organizational culture. Academy of Management Journal, 49, 433-458.
Richard, O. C., McMillan-Capehart, A., Bhuian, S. N., & Taylor, E. C. (2009). Antecedents and
consequences of psychological contracts: Does organizational culture really matter?
Journal of Business Research, 62(8), 818-825.
Robinson, S. L., & Morrison, E.W. (2000). The development of psychological contract breach
violation – a longitudinal study. Journal of Organizational Behaviour, 15,(3), 245–59.
Rousseau, D. M. (1995). Psychological contracts in organizations: Understanding written and
unwritten agreements. Thousand Oaks, CA, US: Sage Publications, Inc.
Roussell, C. (1974). Relationship of Sex of Department Head to Department Climate.
Administrative Science Quarterly, 19(2), 211-220.
Schein, E. H. (1965). Organizational psychology. Engelwood Cliffs, NJ: Prentice-Hal
Schein, E. H. (1983). The role of the founder in creating organizational culture. Organizational
Dynamics, Summer, 13-28.
Schein, E. H. (1985). Organizational culture and leadership: A dynamic view. (2nd ed.). San-
Francisco: Jossey-Bass. 1992.
39
Schein, E. H. (2000). Sense and nonsense about culture and climate. In N. M. Ashkanasy, C. P.
Wilderom, & M. F. Peterson (Eds.), Handbook of organizational culture & climate (pp.
xxiii-xxx). California: Sage Publications, Inc.
Schneider, B. (1987). The people make the place. Personnel Psychology, 40(3), 437-453.
Schneider, B. (2000). The psychological life of organizations. In N. M. Ashkanasy, C. P.
Wilderom, & M. F. Peterson (Eds.), Handbook of organizational culture & climate (pp.
xvii-xxi). California: Sage Publications, Inc.
Schroen, A.T., Brownstein, M.R., & Sheldon, G.F. (2004). Women in academic general surgery.
Academic Medicine, 79(4), 310–318.
Solmon, L. C. (1978). Attracting women to psychology: Effects of university behavior and the
labor market. American Psychologist, 33(11), 990-999.
Stirling, C., Kilpatrick, S., & Orpin, P. (2011). A psychological contract perspective to the link
between non-profit organizations' management practices and volunteer sustainability.
Human Resource Development International, 14(3), 321-336.
Suliman, A. M. (2002). Is it really a mediating construct? The mediating role of organizational
commitment in work climate-performance relationship. The Journal of Management
Development, 21, 170-183.
Svyantek, D. J., & Bott, J. P. (2004). Organizational culture and organizational climate
measures: An integrative review. In J. C. Thomas (Ed.), Comprehensive Handbook of
40
Psychological Assessment, Vol. 4: Industrial and organizational assessment (pp. 507-
524). Hoboken, NJ: John Wiley & Sons Inc.
Teghtsoonian, M. (1974). Distribution by sex of authors and editors of psychological journals,
1970-1972: Are there enough women editors? American Psychologist, 29(4), 262-269.
Touchton, J., Musil, C., & Campbell, K. (2008) A Measure of Equity: Women’s progress in
higher education. Washington, DC: Association of American Colleges and Universities.
Trower, C. A. (2009). Toward a greater understanding of the tenure track for minorities. Change,
38-45.
Tynes, B. M., Rose, C. A., & Markoe, S. L. (2013). Extending campus life to the Internet: Social
media, discrimination, and perceptions of racial climate. Journal of Diversity in Higher
Education, 6(2), 102-114.
West, M. S., Curtis, J. W. (2006). American Association of University Professors ( AAUP)
Faculty Gender Equity Indicators. American Association of University Professors.
Wright, A.L., Schwindt, L.A., Bassford, T.L., Reyna, V.F., Shisslak, C.M., St. Germain, P.A., &
Reed, K.L. (2003). Gender differences in academic advancement: patterns, causes, and
potential solutions in one U.S. college of medicine. Academic Medicine, 78(5), 500–508.
41
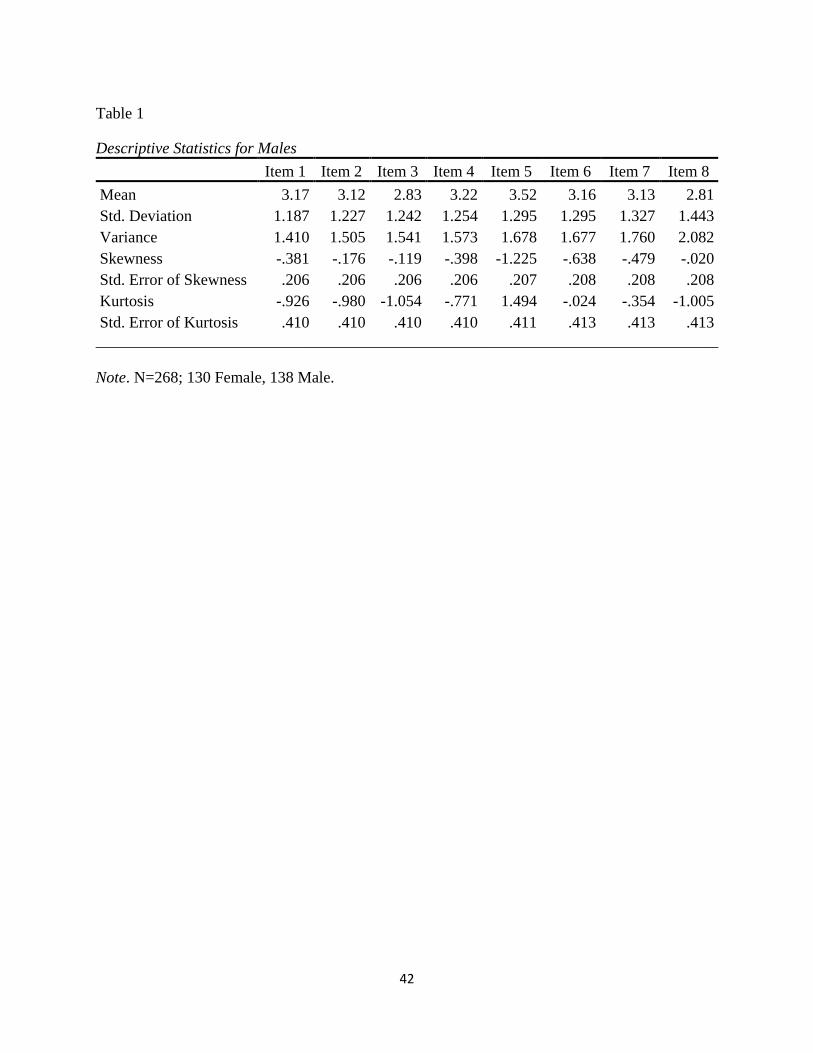
Table 1
______________________________________________________________________________ Note. N=268; 130 Female, 138 Male.
Descriptive Statistics for Males Item 1 Item 2 Item 3 Item 4 Item 5 Item 6 Item 7 Item 8 Mean 3.17 3.12 2.83 3.22 3.52 3.16 3.13 2.81 Std. Deviation 1.187 1.227 1.242 1.254 1.295 1.295 1.327 1.443 Variance 1.410 1.505 1.541 1.573 1.678 1.677 1.760 2.082 Skewness -.381 -.176 -.119 -.398 -1.225 -.638 -.479 -.020 Std. Error of Skewness .206 .206 .206 .206 .207 .208 .208 .208 Kurtosis -.926 -.980 -1.054 -.771 1.494 -.024 -.354 -1.005 Std. Error of Kurtosis .410 .410 .410 .410 .411 .413 .413 .413
42
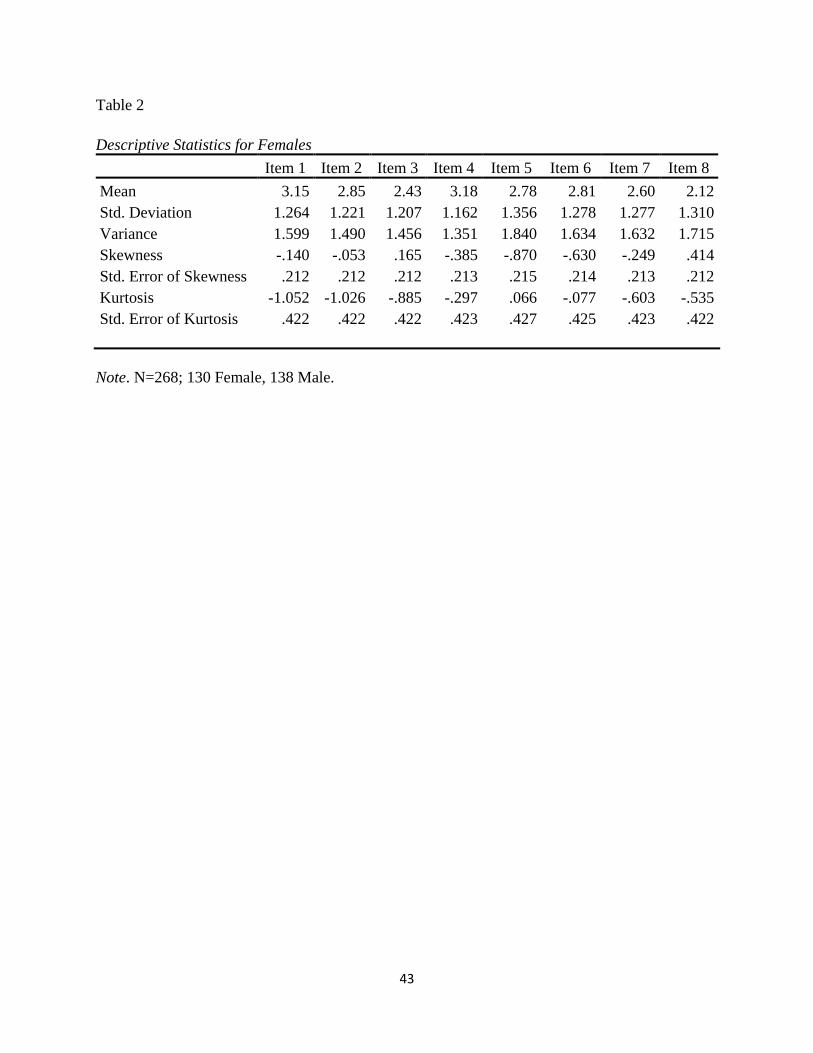
Table 2 Descriptive Statistics for Females
Item 1 Item 2 Item 3 Item 4 Item 5 Item 6 Item 7 Item 8 Mean 3.15 2.85 2.43 3.18 2.78 2.81 2.60 2.12 Std. Deviation 1.264 1.221 1.207 1.162 1.356 1.278 1.277 1.310 Variance 1.599 1.490 1.456 1.351 1.840 1.634 1.632 1.715 Skewness -.140 -.053 .165 -.385 -.870 -.630 -.249 .414 Std. Error of Skewness .212 .212 .212 .213 .215 .214 .213 .212 Kurtosis -1.052 -1.026 -.885 -.297 .066 -.077 -.603 -.535 Std. Error of Kurtosis .422 .422 .422 .423 .427 .425 .423 .422 Note. N=268; 130 Female, 138 Male.
43
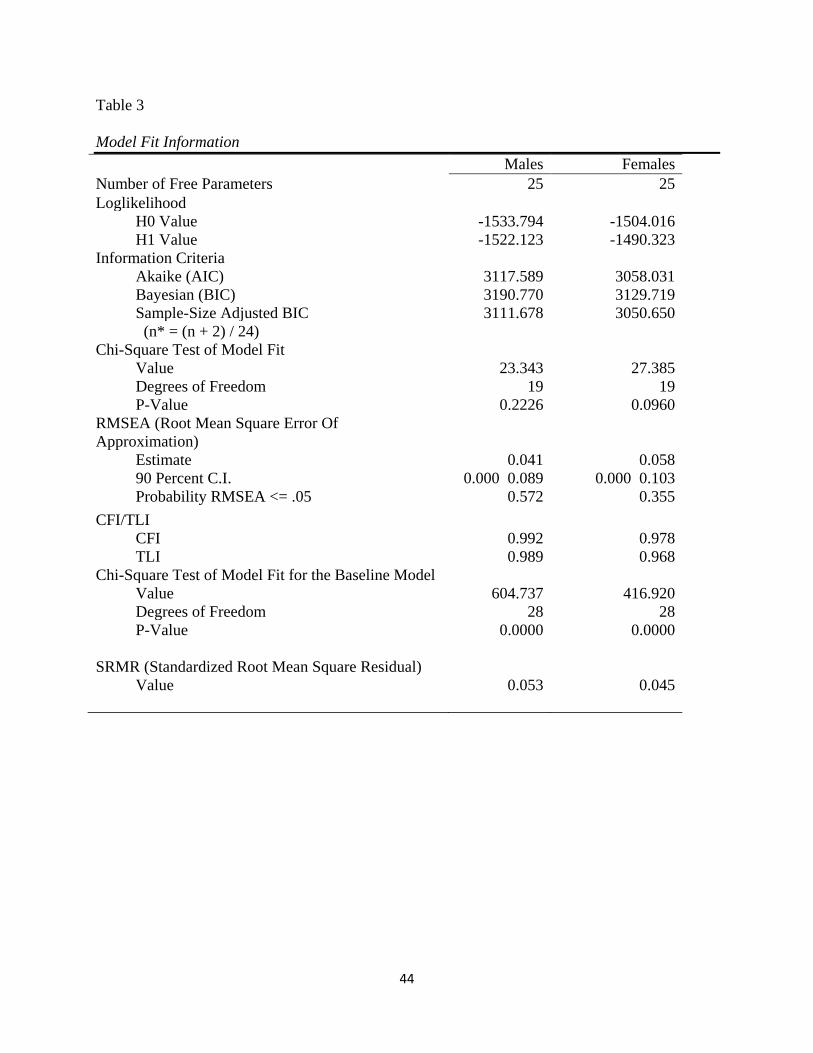
Table 3 Model Fit Information Males Females Number of Free Parameters 25 25 Loglikelihood H0 Value -1533.794 -1504.016 H1 Value -1522.123 -1490.323 Information Criteria Akaike (AIC) 3117.589 3058.031 Bayesian (BIC) 3190.770 3129.719 Sample-Size Adjusted BIC 3111.678 3050.650 (n* = (n + 2) / 24) Chi-Square Test of Model Fit Value 23.343 27.385 Degrees of Freedom 19 19 P-Value 0.2226 0.0960 RMSEA (Root Mean Square Error Of Approximation)
Estimate 0.041 0.058 90 Percent C.I. 0.000 0.089 0.000 0.103 Probability RMSEA <= .05 0.572 0.355 CFI/TLI CFI 0.992 0.978 TLI 0.989 0.968 Chi-Square Test of Model Fit for the Baseline Model Value 604.737 416.920 Degrees of Freedom 28 28 P-Value 0.0000 0.0000 SRMR (Standardized Root Mean Square Residual) Value 0.053 0.045
44
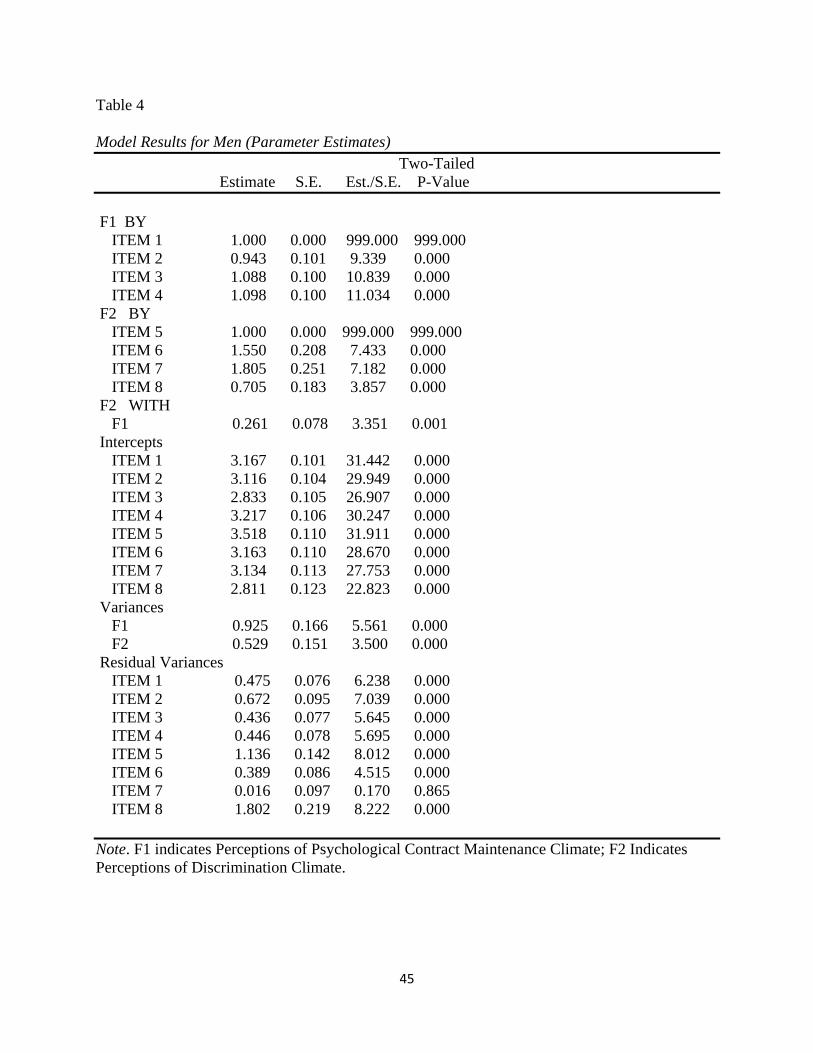
Table 4 Model Results for Men (Parameter Estimates) Two-Tailed Estimate S.E. Est./S.E. P-Value F1 BY ITEM 1 1.000 0.000 999.000 999.000 ITEM 2 0.943 0.101 9.339 0.000 ITEM 3 1.088 0.100 10.839 0.000 ITEM 4 1.098 0.100 11.034 0.000 F2 BY ITEM 5 1.000 0.000 999.000 999.000 ITEM 6 1.550 0.208 7.433 0.000 ITEM 7 1.805 0.251 7.182 0.000 ITEM 8 0.705 0.183 3.857 0.000 F2 WITH F1 0.261 0.078 3.351 0.001 Intercepts ITEM 1 3.167 0.101 31.442 0.000 ITEM 2 3.116 0.104 29.949 0.000 ITEM 3 2.833 0.105 26.907 0.000 ITEM 4 3.217 0.106 30.247 0.000 ITEM 5 3.518 0.110 31.911 0.000 ITEM 6 3.163 0.110 28.670 0.000 ITEM 7 3.134 0.113 27.753 0.000 ITEM 8 2.811 0.123 22.823 0.000 Variances F1 0.925 0.166 5.561 0.000 F2 0.529 0.151 3.500 0.000 Residual Variances ITEM 1 0.475 0.076 6.238 0.000 ITEM 2 0.672 0.095 7.039 0.000 ITEM 3 0.436 0.077 5.645 0.000 ITEM 4 0.446 0.078 5.695 0.000 ITEM 5 1.136 0.142 8.012 0.000 ITEM 6 0.389 0.086 4.515 0.000 ITEM 7 0.016 0.097 0.170 0.865 ITEM 8 1.802 0.219 8.222 0.000 Note. F1 indicates Perceptions of Psychological Contract Maintenance Climate; F2 Indicates Perceptions of Discrimination Climate.
45
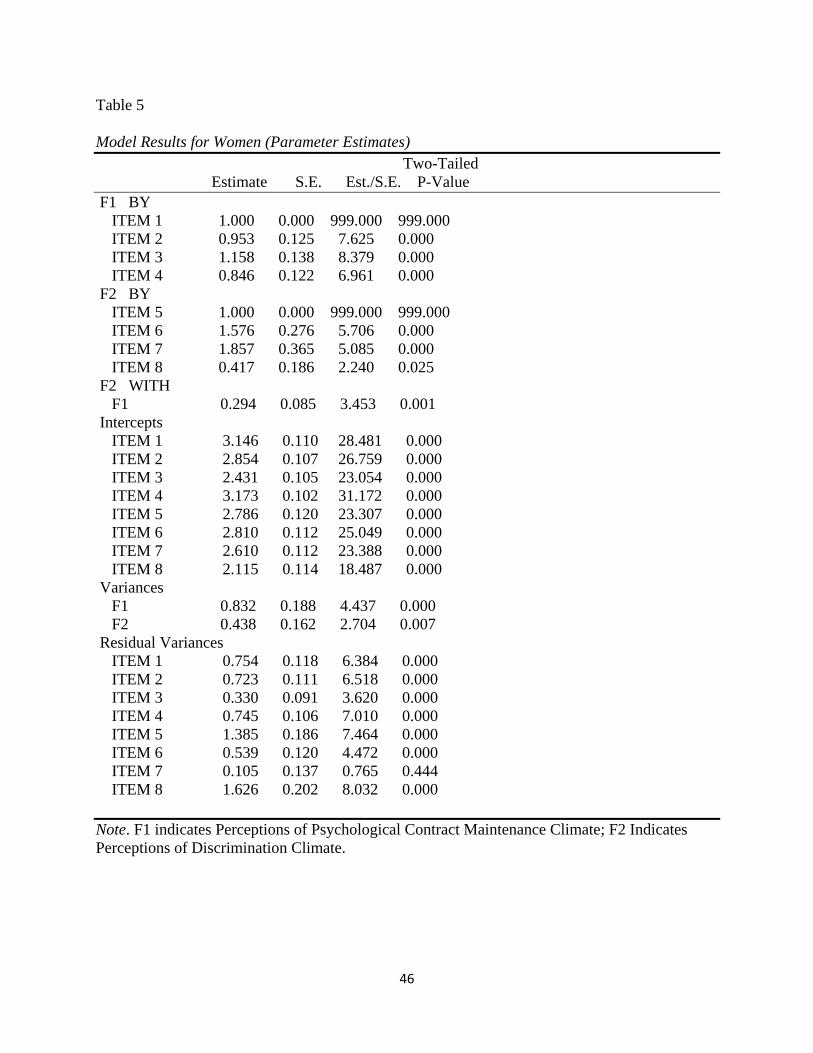
Table 5 Model Results for Women (Parameter Estimates) Two-Tailed Estimate S.E. Est./S.E. P-Value F1 BY ITEM 1 1.000 0.000 999.000 999.000 ITEM 2 0.953 0.125 7.625 0.000 ITEM 3 1.158 0.138 8.379 0.000 ITEM 4 0.846 0.122 6.961 0.000 F2 BY ITEM 5 1.000 0.000 999.000 999.000 ITEM 6 1.576 0.276 5.706 0.000 ITEM 7 1.857 0.365 5.085 0.000 ITEM 8 0.417 0.186 2.240 0.025 F2 WITH F1 0.294 0.085 3.453 0.001 Intercepts ITEM 1 3.146 0.110 28.481 0.000 ITEM 2 2.854 0.107 26.759 0.000 ITEM 3 2.431 0.105 23.054 0.000 ITEM 4 3.173 0.102 31.172 0.000 ITEM 5 2.786 0.120 23.307 0.000 ITEM 6 2.810 0.112 25.049 0.000 ITEM 7 2.610 0.112 23.388 0.000 ITEM 8 2.115 0.114 18.487 0.000 Variances F1 0.832 0.188 4.437 0.000 F2 0.438 0.162 2.704 0.007 Residual Variances ITEM 1 0.754 0.118 6.384 0.000 ITEM 2 0.723 0.111 6.518 0.000 ITEM 3 0.330 0.091 3.620 0.000 ITEM 4 0.745 0.106 7.010 0.000 ITEM 5 1.385 0.186 7.464 0.000 ITEM 6 0.539 0.120 4.472 0.000 ITEM 7 0.105 0.137 0.765 0.444 ITEM 8 1.626 0.202 8.032 0.000 Note. F1 indicates Perceptions of Psychological Contract Maintenance Climate; F2 Indicates Perceptions of Discrimination Climate.
46
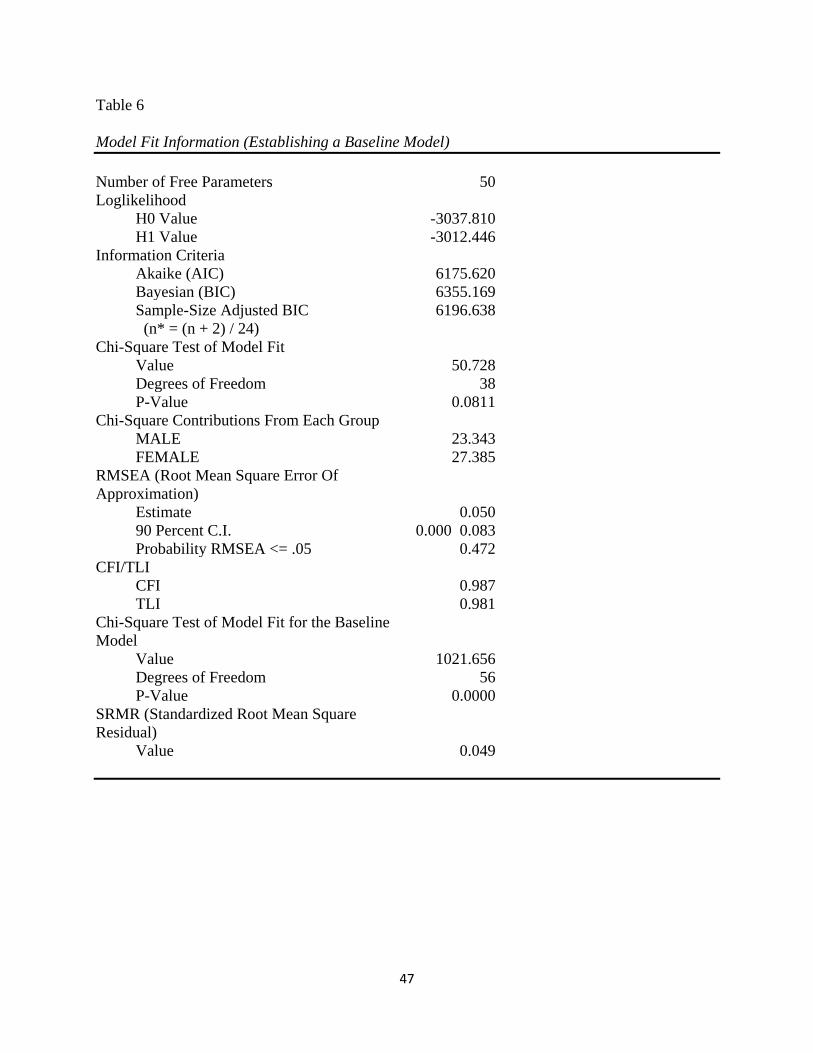
Table 6 Model Fit Information (Establishing a Baseline Model) Number of Free Parameters 50 Loglikelihood H0 Value -3037.810 H1 Value -3012.446 Information Criteria Akaike (AIC) 6175.620 Bayesian (BIC) 6355.169 Sample-Size Adjusted BIC 6196.638 (n* = (n + 2) / 24) Chi-Square Test of Model Fit Value 50.728 Degrees of Freedom 38 P-Value 0.0811 Chi-Square Contributions From Each Group MALE 23.343 FEMALE 27.385 RMSEA (Root Mean Square Error Of Approximation)
Estimate 0.050 90 Percent C.I. 0.000 0.083 Probability RMSEA <= .05 0.472 CFI/TLI CFI 0.987 TLI 0.981 Chi-Square Test of Model Fit for the Baseline Model
Value 1021.656 Degrees of Freedom 56 P-Value 0.0000 SRMR (Standardized Root Mean Square Residual)
Value 0.049
47
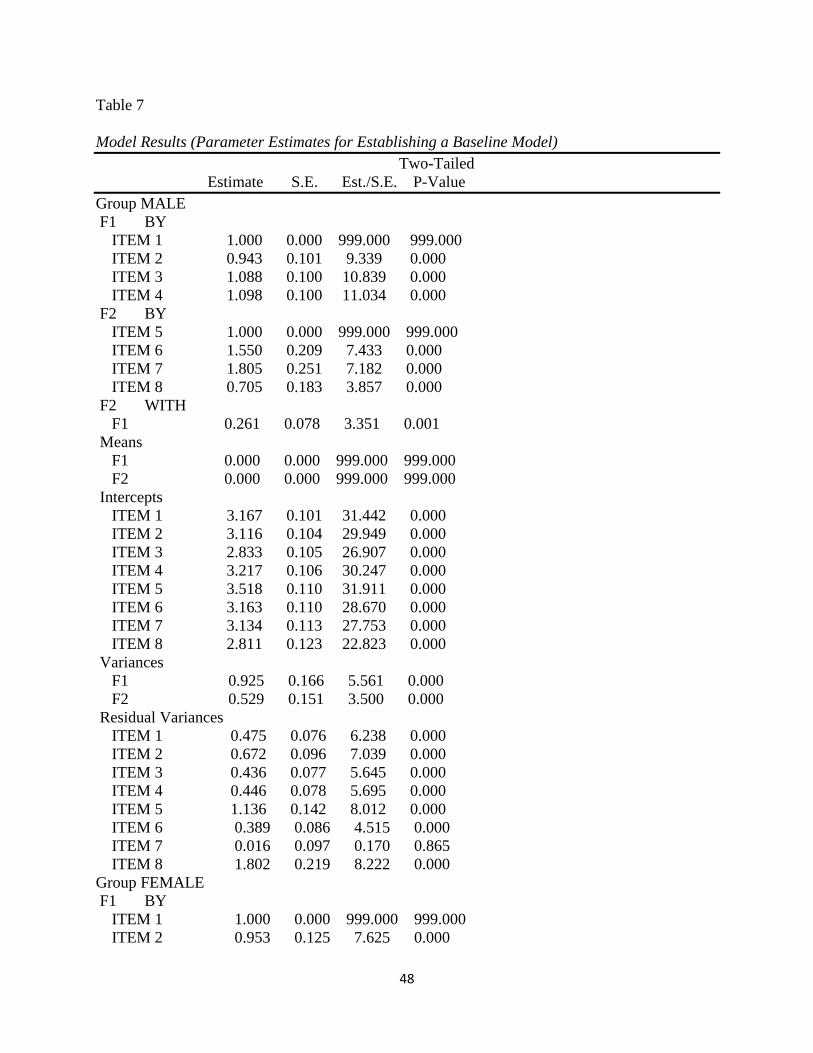
Table 7 Model Results (Parameter Estimates for Establishing a Baseline Model) Two-Tailed Estimate S.E. Est./S.E. P-Value Group MALE F1 BY ITEM 1 1.000 0.000 999.000 999.000 ITEM 2 0.943 0.101 9.339 0.000 ITEM 3 1.088 0.100 10.839 0.000 ITEM 4 1.098 0.100 11.034 0.000 F2 BY ITEM 5 1.000 0.000 999.000 999.000 ITEM 6 1.550 0.209 7.433 0.000 ITEM 7 1.805 0.251 7.182 0.000 ITEM 8 0.705 0.183 3.857 0.000 F2 WITH F1 0.261 0.078 3.351 0.001 Means F1 0.000 0.000 999.000 999.000 F2 0.000 0.000 999.000 999.000 Intercepts ITEM 1 3.167 0.101 31.442 0.000 ITEM 2 3.116 0.104 29.949 0.000 ITEM 3 2.833 0.105 26.907 0.000 ITEM 4 3.217 0.106 30.247 0.000 ITEM 5 3.518 0.110 31.911 0.000 ITEM 6 3.163 0.110 28.670 0.000 ITEM 7 3.134 0.113 27.753 0.000 ITEM 8 2.811 0.123 22.823 0.000 Variances F1 0.925 0.166 5.561 0.000 F2 0.529 0.151 3.500 0.000 Residual Variances ITEM 1 0.475 0.076 6.238 0.000 ITEM 2 0.672 0.096 7.039 0.000 ITEM 3 0.436 0.077 5.645 0.000 ITEM 4 0.446 0.078 5.695 0.000 ITEM 5 1.136 0.142 8.012 0.000 ITEM 6 0.389 0.086 4.515 0.000 ITEM 7 0.016 0.097 0.170 0.865 ITEM 8 1.802 0.219 8.222 0.000 Group FEMALE F1 BY ITEM 1 1.000 0.000 999.000 999.000 ITEM 2 0.953 0.125 7.625 0.000
48
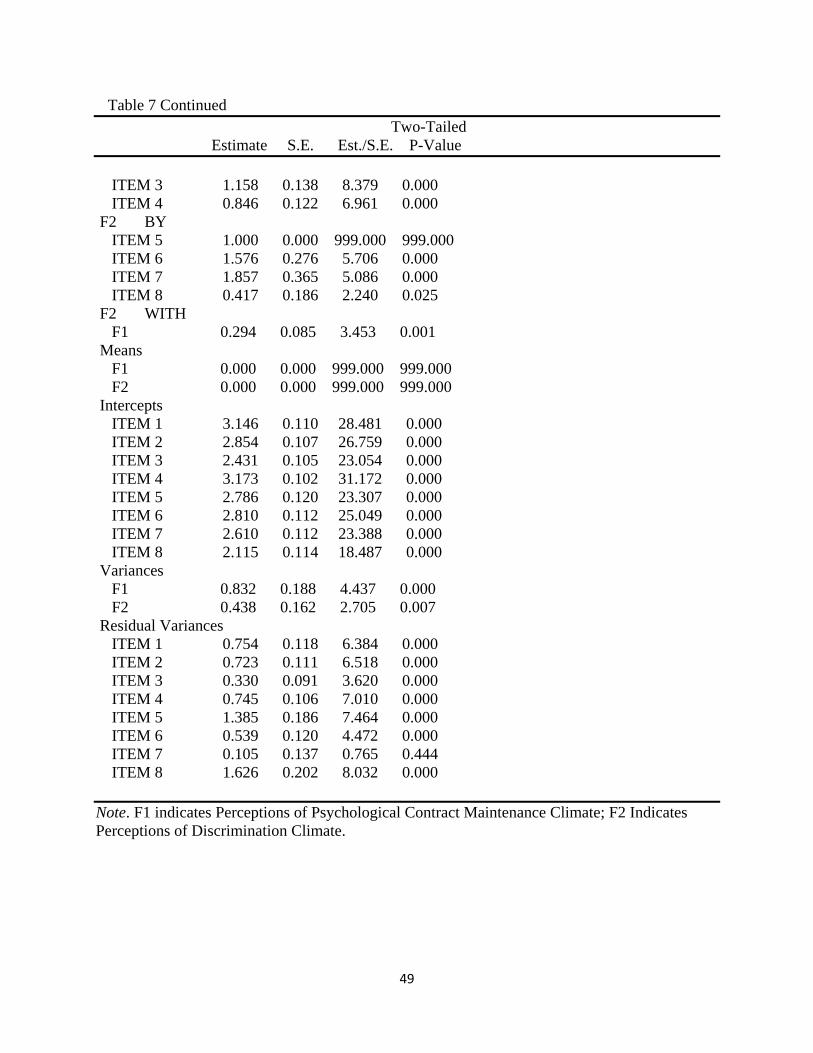
Table 7 Continued Two-Tailed Estimate S.E. Est./S.E. P-Value ITEM 3 1.158 0.138 8.379 0.000 ITEM 4 0.846 0.122 6.961 0.000 F2 BY ITEM 5 1.000 0.000 999.000 999.000 ITEM 6 1.576 0.276 5.706 0.000 ITEM 7 1.857 0.365 5.086 0.000 ITEM 8 0.417 0.186 2.240 0.025 F2 WITH F1 0.294 0.085 3.453 0.001 Means F1 0.000 0.000 999.000 999.000 F2 0.000 0.000 999.000 999.000 Intercepts ITEM 1 3.146 0.110 28.481 0.000 ITEM 2 2.854 0.107 26.759 0.000 ITEM 3 2.431 0.105 23.054 0.000 ITEM 4 3.173 0.102 31.172 0.000 ITEM 5 2.786 0.120 23.307 0.000 ITEM 6 2.810 0.112 25.049 0.000 ITEM 7 2.610 0.112 23.388 0.000 ITEM 8 2.115 0.114 18.487 0.000 Variances F1 0.832 0.188 4.437 0.000 F2 0.438 0.162 2.705 0.007 Residual Variances ITEM 1 0.754 0.118 6.384 0.000 ITEM 2 0.723 0.111 6.518 0.000 ITEM 3 0.330 0.091 3.620 0.000 ITEM 4 0.745 0.106 7.010 0.000 ITEM 5 1.385 0.186 7.464 0.000 ITEM 6 0.539 0.120 4.472 0.000 ITEM 7 0.105 0.137 0.765 0.444 ITEM 8 1.626 0.202 8.032 0.000 Note. F1 indicates Perceptions of Psychological Contract Maintenance Climate; F2 Indicates Perceptions of Discrimination Climate.
49

Table 8 Model Fit Information (Test for Equality of Factor Loadings) Number of Free Parameters 44 Loglikelihood H0 Value -3041.208 H1 Value -3012.446 Information Criteria Akaike (AIC) 6170.416 Bayesian (BIC) 6328.419 Sample-Size Adjusted BIC 6188.912 (n* = (n + 2) / 24) Chi-Square Test of Model Fit Value 57.524 Degrees of Freedom 44 P-Value 0.0830 Chi-Square Contributions From Each Group MALE 26.064 FEMALE 31.460 RMSEA (Root Mean Square Error Of Approximation)
Estimate 0.048 90 Percent C.I. 0.000 0.080 Probability RMSEA <= .05 0.514 CFI/TLI CFI 0.986 TLI 0.982 Chi-Square Test of Model Fit for the Baseline Model
Value 1021.656 Degrees of Freedom 56 P-Value 0.0000 SRMR (Standardized Root Mean Square Residual)
Value 0.058
50
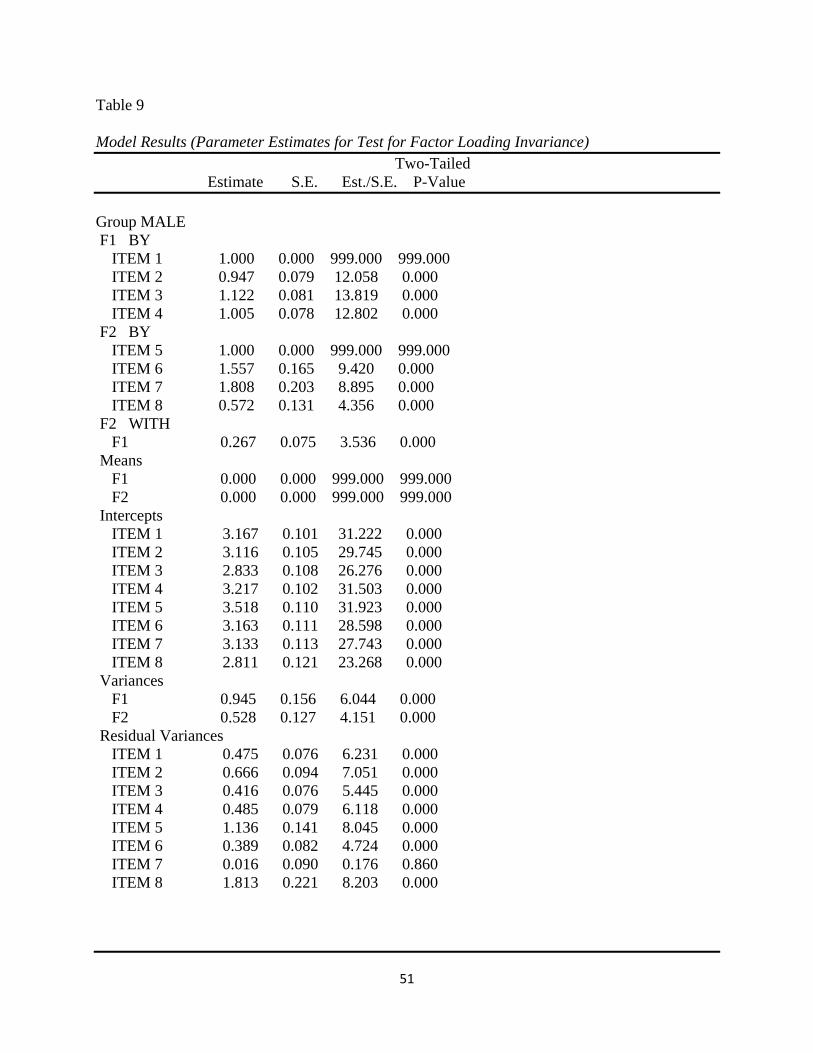
Table 9 Model Results (Parameter Estimates for Test for Factor Loading Invariance) Two-Tailed Estimate S.E. Est./S.E. P-Value Group MALE F1 BY ITEM 1 1.000 0.000 999.000 999.000 ITEM 2 0.947 0.079 12.058 0.000 ITEM 3 1.122 0.081 13.819 0.000 ITEM 4 1.005 0.078 12.802 0.000 F2 BY ITEM 5 1.000 0.000 999.000 999.000 ITEM 6 1.557 0.165 9.420 0.000 ITEM 7 1.808 0.203 8.895 0.000 ITEM 8 0.572 0.131 4.356 0.000 F2 WITH F1 0.267 0.075 3.536 0.000 Means F1 0.000 0.000 999.000 999.000 F2 0.000 0.000 999.000 999.000 Intercepts ITEM 1 3.167 0.101 31.222 0.000 ITEM 2 3.116 0.105 29.745 0.000 ITEM 3 2.833 0.108 26.276 0.000 ITEM 4 3.217 0.102 31.503 0.000 ITEM 5 3.518 0.110 31.923 0.000 ITEM 6 3.163 0.111 28.598 0.000 ITEM 7 3.133 0.113 27.743 0.000 ITEM 8 2.811 0.121 23.268 0.000 Variances F1 0.945 0.156 6.044 0.000 F2 0.528 0.127 4.151 0.000 Residual Variances ITEM 1 0.475 0.076 6.231 0.000 ITEM 2 0.666 0.094 7.051 0.000 ITEM 3 0.416 0.076 5.445 0.000 ITEM 4 0.485 0.079 6.118 0.000 ITEM 5 1.136 0.141 8.045 0.000 ITEM 6 0.389 0.082 4.724 0.000 ITEM 7 0.016 0.090 0.176 0.860 ITEM 8 1.813 0.221 8.203 0.000
51
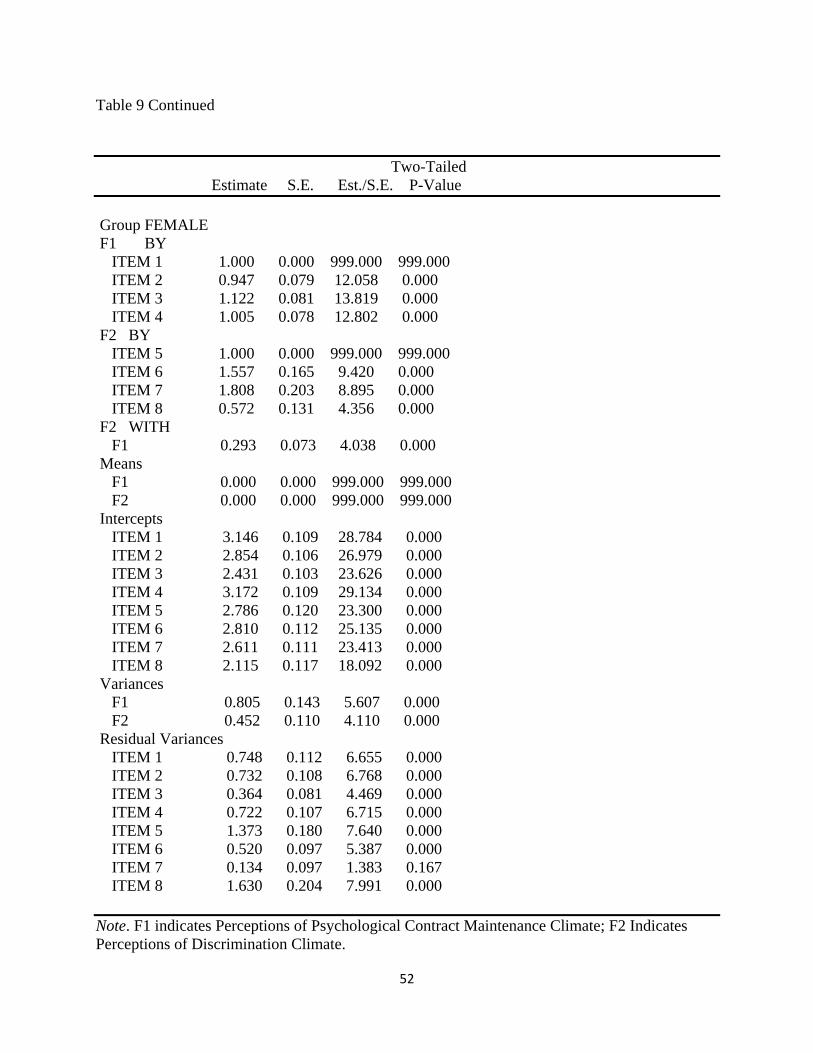
Table 9 Continued
Two-Tailed Estimate S.E. Est./S.E. P-Value Group FEMALE F1 BY ITEM 1 1.000 0.000 999.000 999.000 ITEM 2 0.947 0.079 12.058 0.000 ITEM 3 1.122 0.081 13.819 0.000 ITEM 4 1.005 0.078 12.802 0.000 F2 BY ITEM 5 1.000 0.000 999.000 999.000 ITEM 6 1.557 0.165 9.420 0.000 ITEM 7 1.808 0.203 8.895 0.000 ITEM 8 0.572 0.131 4.356 0.000 F2 WITH F1 0.293 0.073 4.038 0.000 Means F1 0.000 0.000 999.000 999.000 F2 0.000 0.000 999.000 999.000 Intercepts ITEM 1 3.146 0.109 28.784 0.000 ITEM 2 2.854 0.106 26.979 0.000 ITEM 3 2.431 0.103 23.626 0.000 ITEM 4 3.172 0.109 29.134 0.000 ITEM 5 2.786 0.120 23.300 0.000 ITEM 6 2.810 0.112 25.135 0.000 ITEM 7 2.611 0.111 23.413 0.000 ITEM 8 2.115 0.117 18.092 0.000 Variances F1 0.805 0.143 5.607 0.000 F2 0.452 0.110 4.110 0.000 Residual Variances ITEM 1 0.748 0.112 6.655 0.000 ITEM 2 0.732 0.108 6.768 0.000 ITEM 3 0.364 0.081 4.469 0.000 ITEM 4 0.722 0.107 6.715 0.000 ITEM 5 1.373 0.180 7.640 0.000 ITEM 6 0.520 0.097 5.387 0.000 ITEM 7 0.134 0.097 1.383 0.167 ITEM 8 1.630 0.204 7.991 0.000 Note. F1 indicates Perceptions of Psychological Contract Maintenance Climate; F2 Indicates Perceptions of Discrimination Climate.
52
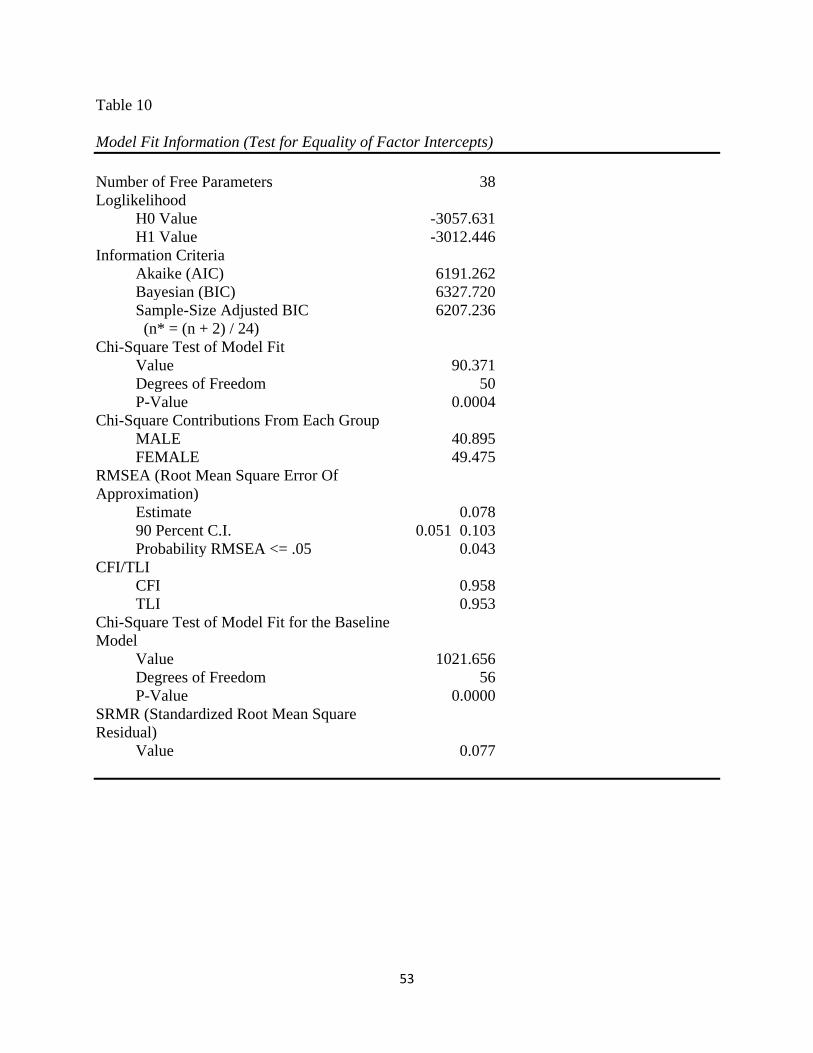
Table 10 Model Fit Information (Test for Equality of Factor Intercepts) Number of Free Parameters 38 Loglikelihood H0 Value -3057.631 H1 Value -3012.446 Information Criteria Akaike (AIC) 6191.262 Bayesian (BIC) 6327.720 Sample-Size Adjusted BIC 6207.236 (n* = (n + 2) / 24) Chi-Square Test of Model Fit Value 90.371 Degrees of Freedom 50 P-Value 0.0004 Chi-Square Contributions From Each Group MALE 40.895 FEMALE 49.475 RMSEA (Root Mean Square Error Of Approximation)
Estimate 0.078 90 Percent C.I. 0.051 0.103 Probability RMSEA <= .05 0.043 CFI/TLI CFI 0.958 TLI 0.953 Chi-Square Test of Model Fit for the Baseline Model
Value 1021.656 Degrees of Freedom 56 P-Value 0.0000 SRMR (Standardized Root Mean Square Residual)
Value 0.077
53
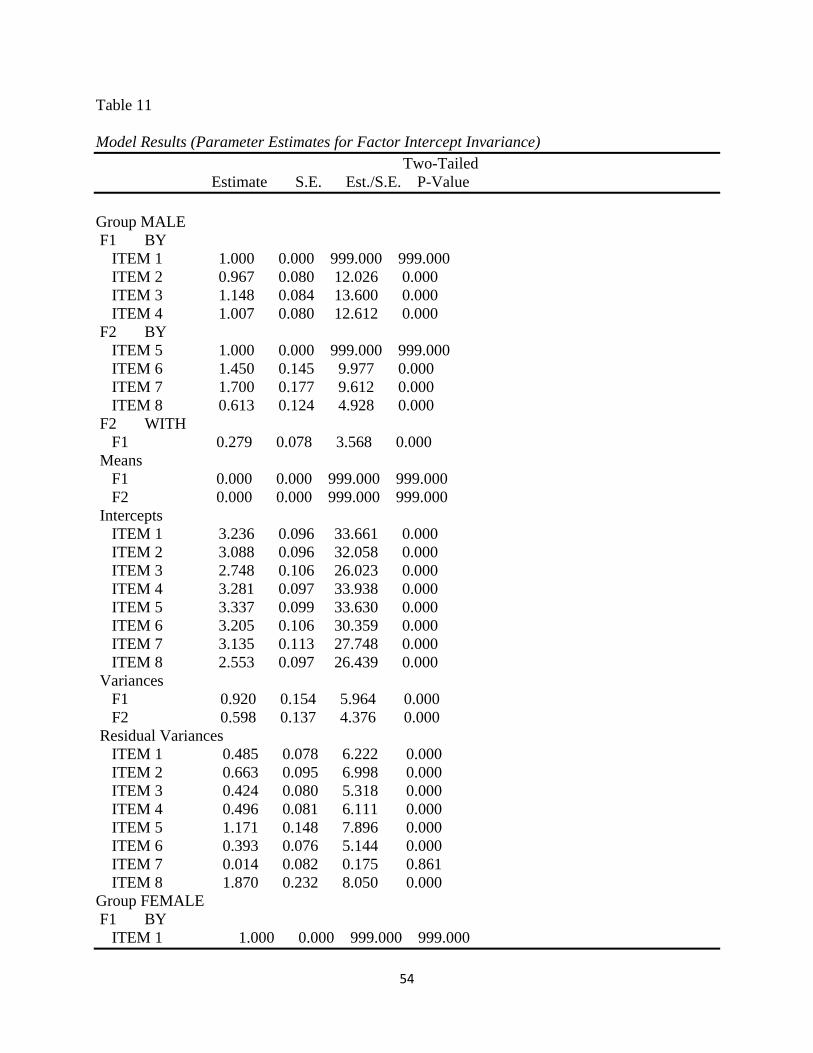
Table 11 Model Results (Parameter Estimates for Factor Intercept Invariance) Two-Tailed Estimate S.E. Est./S.E. P-Value Group MALE F1 BY ITEM 1 1.000 0.000 999.000 999.000 ITEM 2 0.967 0.080 12.026 0.000 ITEM 3 1.148 0.084 13.600 0.000 ITEM 4 1.007 0.080 12.612 0.000 F2 BY ITEM 5 1.000 0.000 999.000 999.000 ITEM 6 1.450 0.145 9.977 0.000 ITEM 7 1.700 0.177 9.612 0.000 ITEM 8 0.613 0.124 4.928 0.000 F2 WITH F1 0.279 0.078 3.568 0.000 Means F1 0.000 0.000 999.000 999.000 F2 0.000 0.000 999.000 999.000 Intercepts ITEM 1 3.236 0.096 33.661 0.000 ITEM 2 3.088 0.096 32.058 0.000 ITEM 3 2.748 0.106 26.023 0.000 ITEM 4 3.281 0.097 33.938 0.000 ITEM 5 3.337 0.099 33.630 0.000 ITEM 6 3.205 0.106 30.359 0.000 ITEM 7 3.135 0.113 27.748 0.000 ITEM 8 2.553 0.097 26.439 0.000 Variances F1 0.920 0.154 5.964 0.000 F2 0.598 0.137 4.376 0.000 Residual Variances ITEM 1 0.485 0.078 6.222 0.000 ITEM 2 0.663 0.095 6.998 0.000 ITEM 3 0.424 0.080 5.318 0.000 ITEM 4 0.496 0.081 6.111 0.000 ITEM 5 1.171 0.148 7.896 0.000 ITEM 6 0.393 0.076 5.144 0.000 ITEM 7 0.014 0.082 0.175 0.861 ITEM 8 1.870 0.232 8.050 0.000 Group FEMALE F1 BY ITEM 1 1.000 0.000 999.000 999.000
54
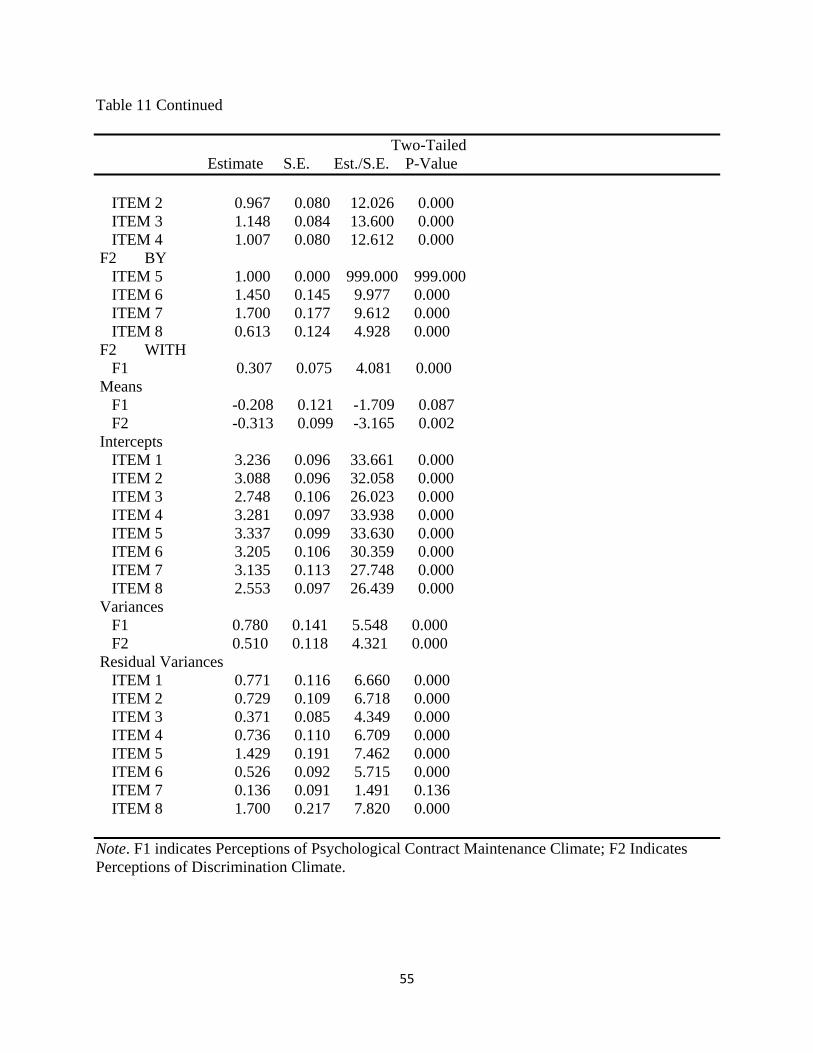
Table 11 Continued Two-Tailed Estimate S.E. Est./S.E. P-Value ITEM 2 0.967 0.080 12.026 0.000 ITEM 3 1.148 0.084 13.600 0.000 ITEM 4 1.007 0.080 12.612 0.000 F2 BY ITEM 5 1.000 0.000 999.000 999.000 ITEM 6 1.450 0.145 9.977 0.000 ITEM 7 1.700 0.177 9.612 0.000 ITEM 8 0.613 0.124 4.928 0.000 F2 WITH F1 0.307 0.075 4.081 0.000 Means F1 -0.208 0.121 -1.709 0.087 F2 -0.313 0.099 -3.165 0.002 Intercepts ITEM 1 3.236 0.096 33.661 0.000 ITEM 2 3.088 0.096 32.058 0.000 ITEM 3 2.748 0.106 26.023 0.000 ITEM 4 3.281 0.097 33.938 0.000 ITEM 5 3.337 0.099 33.630 0.000 ITEM 6 3.205 0.106 30.359 0.000 ITEM 7 3.135 0.113 27.748 0.000 ITEM 8 2.553 0.097 26.439 0.000 Variances F1 0.780 0.141 5.548 0.000 F2 0.510 0.118 4.321 0.000 Residual Variances ITEM 1 0.771 0.116 6.660 0.000 ITEM 2 0.729 0.109 6.718 0.000 ITEM 3 0.371 0.085 4.349 0.000 ITEM 4 0.736 0.110 6.709 0.000 ITEM 5 1.429 0.191 7.462 0.000 ITEM 6 0.526 0.092 5.715 0.000 ITEM 7 0.136 0.091 1.491 0.136 ITEM 8 1.700 0.217 7.820 0.000 Note. F1 indicates Perceptions of Psychological Contract Maintenance Climate; F2 Indicates Perceptions of Discrimination Climate.
55

Table 12 Model Fit Information (Test for Partial Equality of Factor Intercepts) Number of Free Parameters 41 Loglikelihood H0 Value -3043.600 H1 Value -3012.446 Information Criteria Akaike (AIC) 6169.200 Bayesian (BIC) 6316.430 Sample-Size Adjusted BIC 6186.435 (n* = (n + 2) / 24) Chi-Square Test of Model Fit Value 62.308 Degrees of Freedom 47 P-Value 0.0666 Chi-Square Contributions From Each Group MALE 28.200 FEMALE 34.108 RMSEA (Root Mean Square Error Of Approximation)
Estimate 0.049 90 Percent C.I. 0.000 0.080 Probability RMSEA <= .05 0.488 CFI/TLI CFI 0.984 TLI 0.981 Chi-Square Test of Model Fit for the Baseline Model
Value 1021.656 Degrees of Freedom 56 P-Value 0.0000 SRMR (Standardized Root Mean Square Residual)
Value 0.061
56
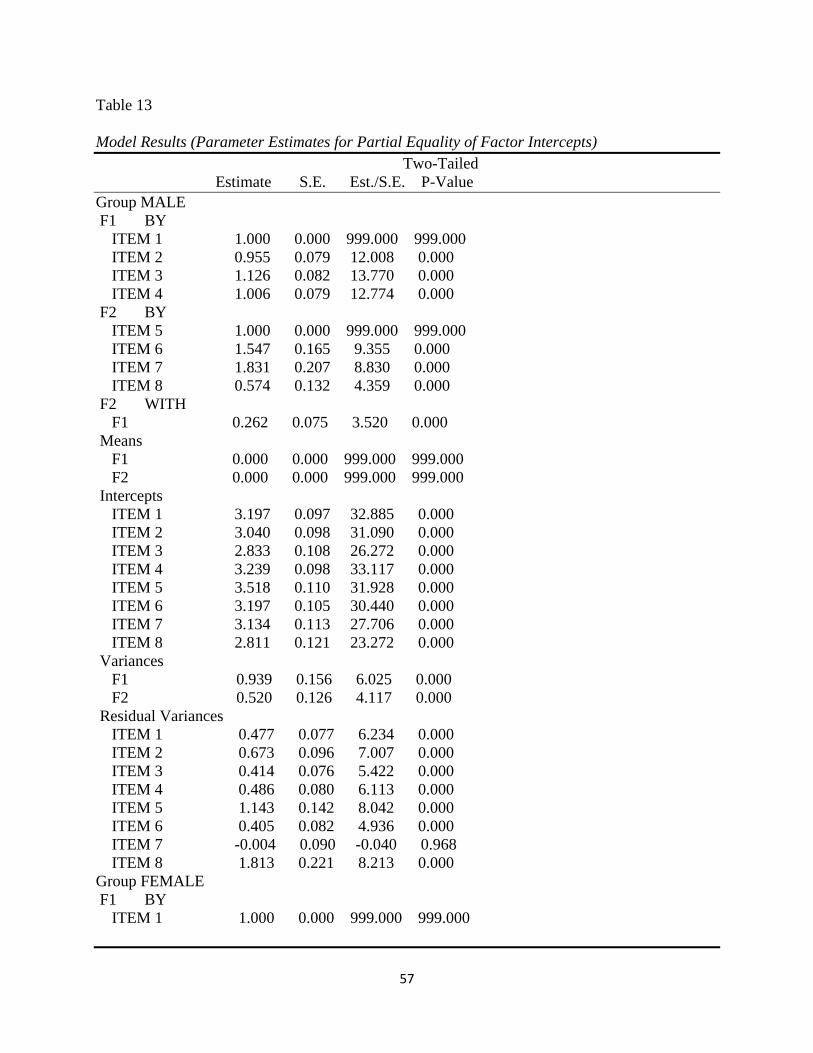
Table 13 Model Results (Parameter Estimates for Partial Equality of Factor Intercepts) Two-Tailed Estimate S.E. Est./S.E. P-Value Group MALE F1 BY ITEM 1 1.000 0.000 999.000 999.000 ITEM 2 0.955 0.079 12.008 0.000 ITEM 3 1.126 0.082 13.770 0.000 ITEM 4 1.006 0.079 12.774 0.000 F2 BY ITEM 5 1.000 0.000 999.000 999.000 ITEM 6 1.547 0.165 9.355 0.000 ITEM 7 1.831 0.207 8.830 0.000 ITEM 8 0.574 0.132 4.359 0.000 F2 WITH F1 0.262 0.075 3.520 0.000 Means F1 0.000 0.000 999.000 999.000 F2 0.000 0.000 999.000 999.000 Intercepts ITEM 1 3.197 0.097 32.885 0.000 ITEM 2 3.040 0.098 31.090 0.000 ITEM 3 2.833 0.108 26.272 0.000 ITEM 4 3.239 0.098 33.117 0.000 ITEM 5 3.518 0.110 31.928 0.000 ITEM 6 3.197 0.105 30.440 0.000 ITEM 7 3.134 0.113 27.706 0.000 ITEM 8 2.811 0.121 23.272 0.000 Variances F1 0.939 0.156 6.025 0.000 F2 0.520 0.126 4.117 0.000 Residual Variances ITEM 1 0.477 0.077 6.234 0.000 ITEM 2 0.673 0.096 7.007 0.000 ITEM 3 0.414 0.076 5.422 0.000 ITEM 4 0.486 0.080 6.113 0.000 ITEM 5 1.143 0.142 8.042 0.000 ITEM 6 0.405 0.082 4.936 0.000 ITEM 7 -0.004 0.090 -0.040 0.968 ITEM 8 1.813 0.221 8.213 0.000 Group FEMALE F1 BY ITEM 1 1.000 0.000 999.000 999.000
57
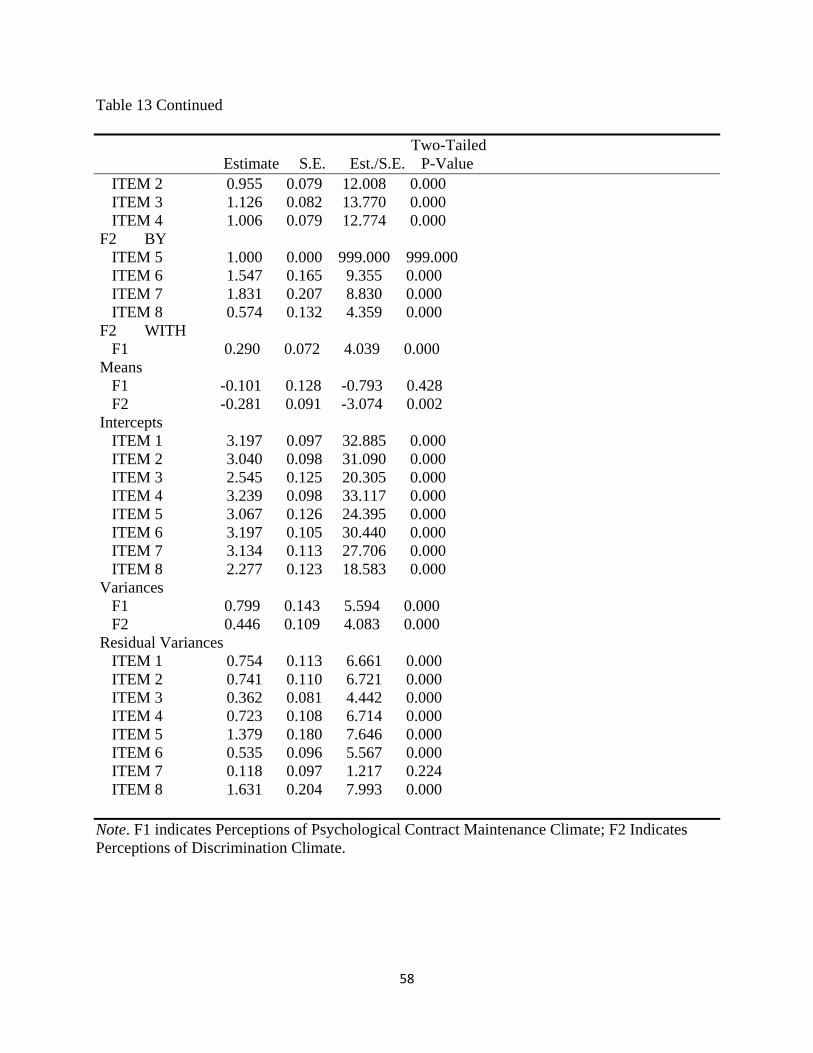
Table 13 Continued Two-Tailed Estimate S.E. Est./S.E. P-Value ITEM 2 0.955 0.079 12.008 0.000 ITEM 3 1.126 0.082 13.770 0.000 ITEM 4 1.006 0.079 12.774 0.000 F2 BY ITEM 5 1.000 0.000 999.000 999.000 ITEM 6 1.547 0.165 9.355 0.000 ITEM 7 1.831 0.207 8.830 0.000 ITEM 8 0.574 0.132 4.359 0.000 F2 WITH F1 0.290 0.072 4.039 0.000 Means F1 -0.101 0.128 -0.793 0.428 F2 -0.281 0.091 -3.074 0.002 Intercepts ITEM 1 3.197 0.097 32.885 0.000 ITEM 2 3.040 0.098 31.090 0.000 ITEM 3 2.545 0.125 20.305 0.000 ITEM 4 3.239 0.098 33.117 0.000 ITEM 5 3.067 0.126 24.395 0.000 ITEM 6 3.197 0.105 30.440 0.000 ITEM 7 3.134 0.113 27.706 0.000 ITEM 8 2.277 0.123 18.583 0.000 Variances F1 0.799 0.143 5.594 0.000 F2 0.446 0.109 4.083 0.000 Residual Variances ITEM 1 0.754 0.113 6.661 0.000 ITEM 2 0.741 0.110 6.721 0.000 ITEM 3 0.362 0.081 4.442 0.000 ITEM 4 0.723 0.108 6.714 0.000 ITEM 5 1.379 0.180 7.646 0.000 ITEM 6 0.535 0.096 5.567 0.000 ITEM 7 0.118 0.097 1.217 0.224 ITEM 8 1.631 0.204 7.993 0.000 Note. F1 indicates Perceptions of Psychological Contract Maintenance Climate; F2 Indicates Perceptions of Discrimination Climate.
58
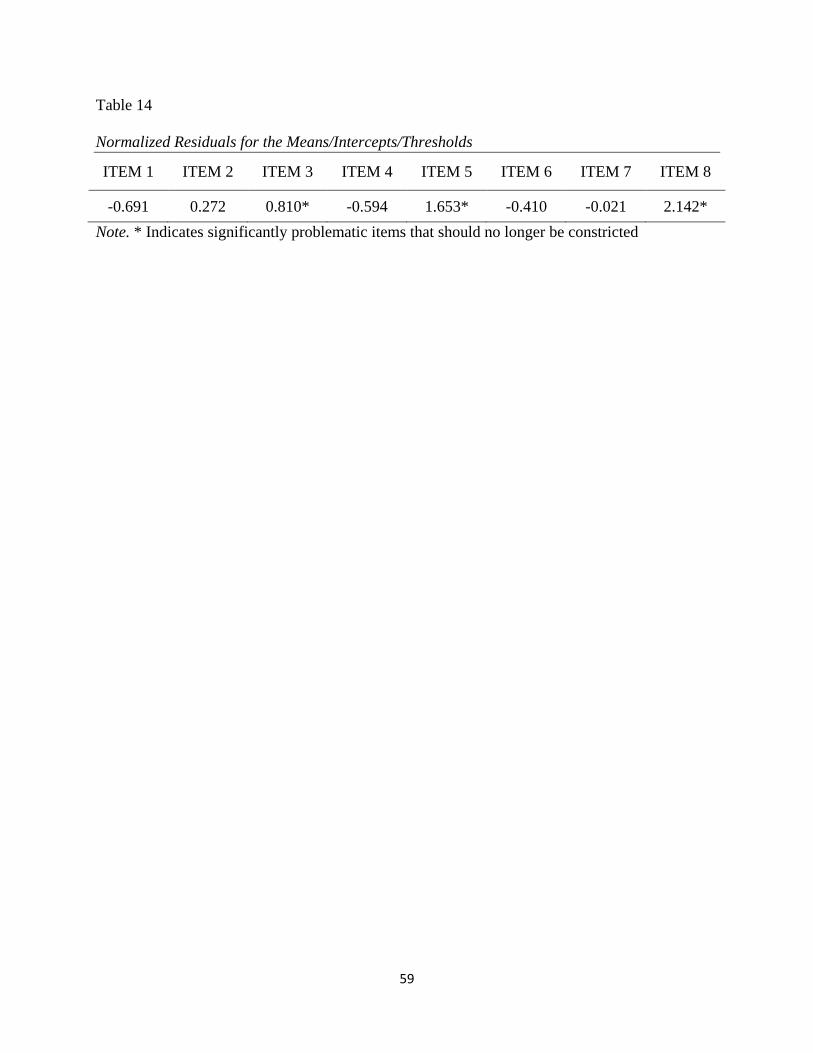
Table 14 Normalized Residuals for the Means/Intercepts/Thresholds
ITEM 1 ITEM 2 ITEM 3 ITEM 4 ITEM 5 ITEM 6 ITEM 7 ITEM 8
-0.691 0.272 0.810* -0.594 1.653* -0.410 -0.021 2.142* Note. * Indicates significantly problematic items that should no longer be constricted
59
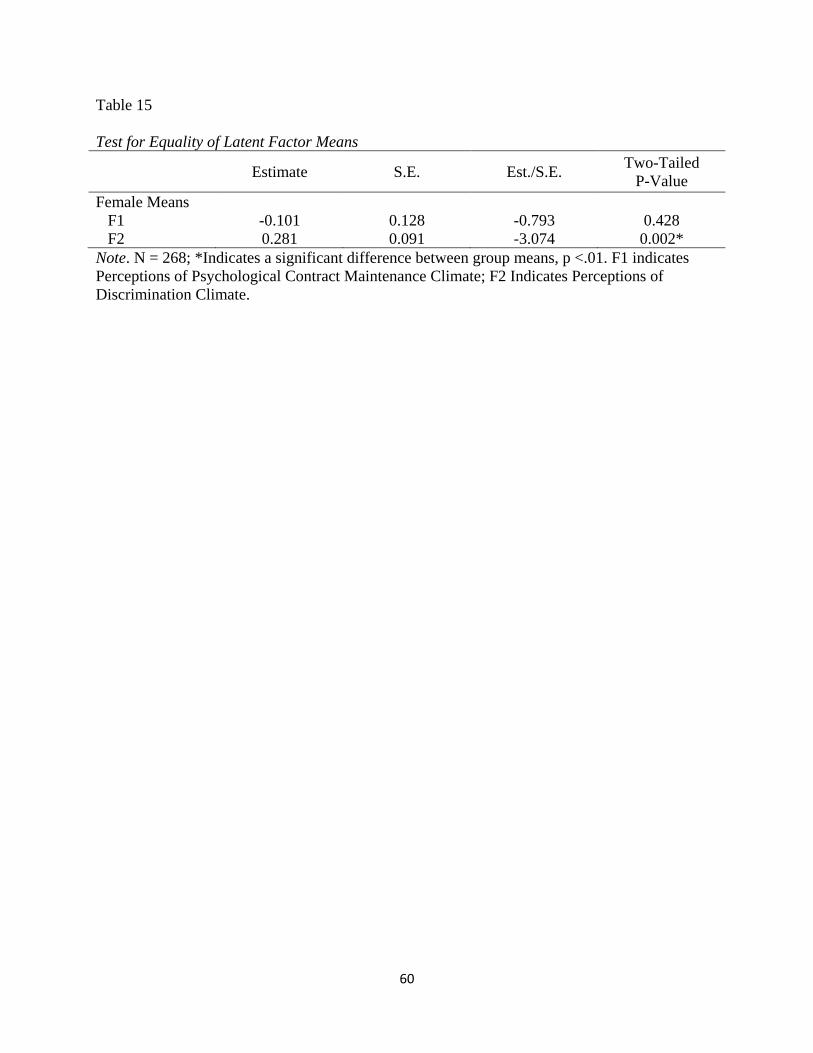
Table 15 Test for Equality of Latent Factor Means
Estimate S.E. Est./S.E. Two-Tailed P-Value
Female Means F1 -0.101 0.128 -0.793 0.428 F2 0.281 0.091 -3.074 0.002* Note. N = 268; *Indicates a significant difference between group means, p <.01. F1 indicates Perceptions of Psychological Contract Maintenance Climate; F2 Indicates Perceptions of Discrimination Climate.
60
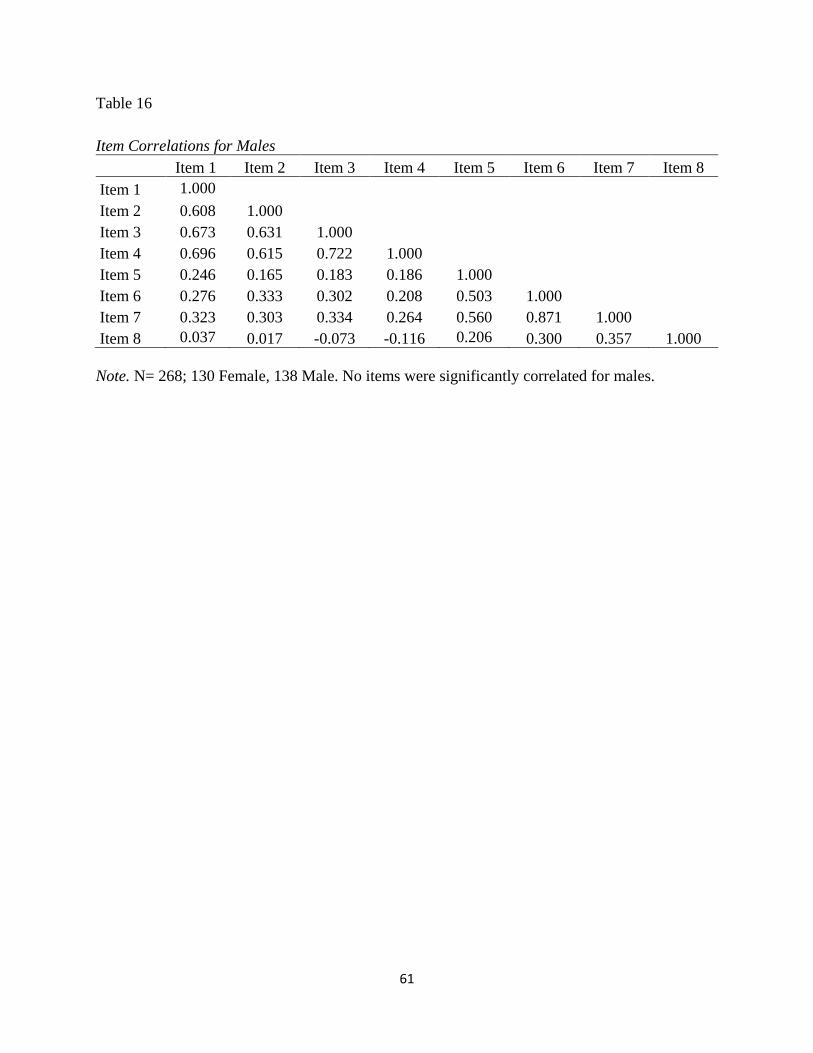
Note. N= 268; 130 Female, 138 Male. No items were significantly correlated for males.
Table 16 Item Correlations for Males
Item 1 Item 2 Item 3 Item 4 Item 5 Item 6 Item 7 Item 8 Item 1 1.000 Item 2 0.608 1.000 Item 3 0.673 0.631 1.000 Item 4 0.696 0.615 0.722 1.000 Item 5 0.246 0.165 0.183 0.186 1.000 Item 6 0.276 0.333 0.302 0.208 0.503 1.000 Item 7 0.323 0.303 0.334 0.264 0.560 0.871 1.000 Item 8 0.037 0.017 -0.073 -0.116 0.206 0.300 0.357 1.000
61
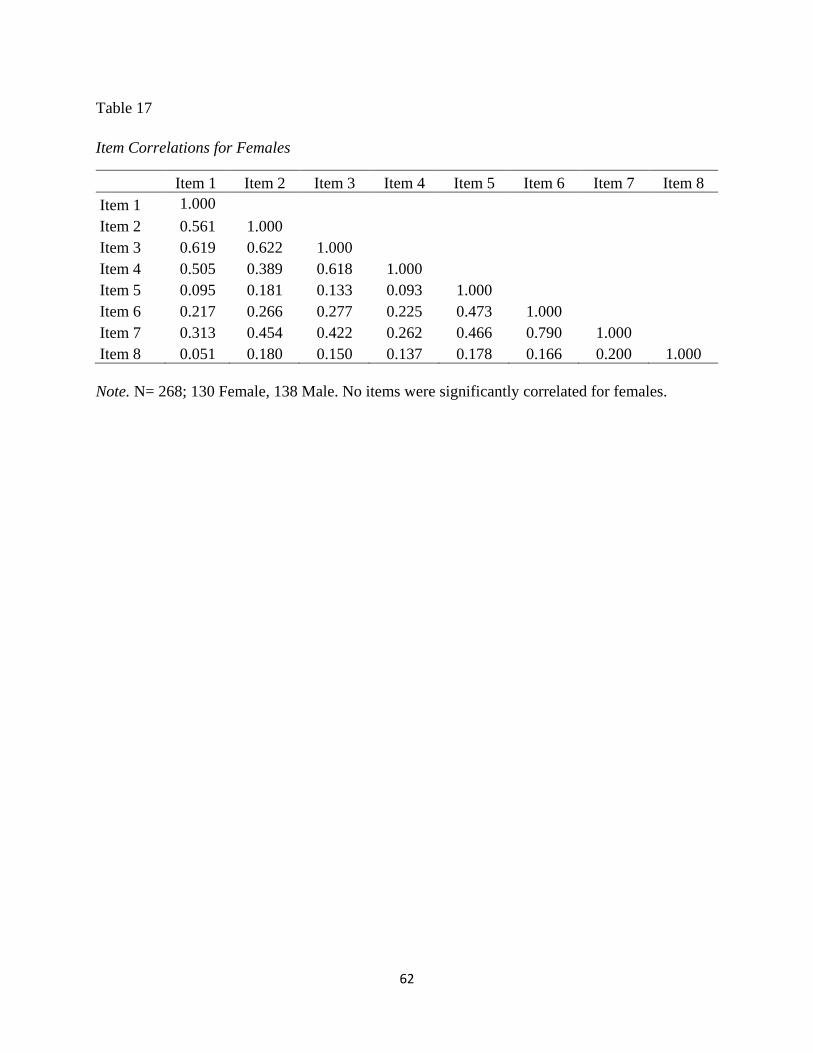
Table 17 Item Correlations for Females
Note. N= 268; 130 Female, 138 Male. No items were significantly correlated for females.
Item 1 Item 2 Item 3 Item 4 Item 5 Item 6 Item 7 Item 8 Item 1 1.000 Item 2 0.561 1.000 Item 3 0.619 0.622 1.000 Item 4 0.505 0.389 0.618 1.000 Item 5 0.095 0.181 0.133 0.093 1.000 Item 6 0.217 0.266 0.277 0.225 0.473 1.000 Item 7 0.313 0.454 0.422 0.262 0.466 0.790 1.000 Item 8 0.051 0.180 0.150 0.137 0.178 0.166 0.200 1.000
62
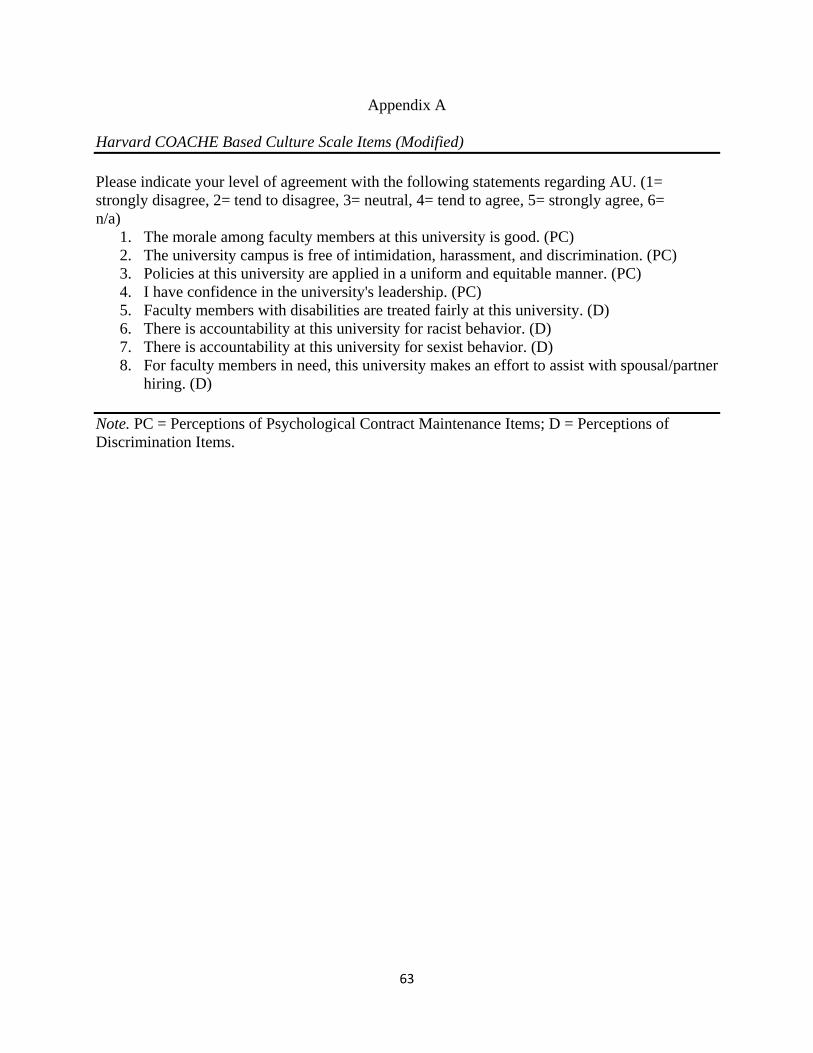
Appendix A
Harvard COACHE Based Culture Scale Items (Modified) Please indicate your level of agreement with the following statements regarding AU. (1= strongly disagree, 2= tend to disagree, 3= neutral, 4= tend to agree, 5= strongly agree, 6= n/a)
1. The morale among faculty members at this university is good. (PC) 2. The university campus is free of intimidation, harassment, and discrimination. (PC) 3. Policies at this university are applied in a uniform and equitable manner. (PC) 4. I have confidence in the university's leadership. (PC) 5. Faculty members with disabilities are treated fairly at this university. (D) 6. There is accountability at this university for racist behavior. (D) 7. There is accountability at this university for sexist behavior. (D) 8. For faculty members in need, this university makes an effort to assist with spousal/partner
hiring. (D) Note. PC = Perceptions of Psychological Contract Maintenance Items; D = Perceptions of Discrimination Items.
63