Gender Differences in Honesty: The Role of Social Value ...cege/Diskussionspapiere/DP308.pdf ·...
17
ISSN: 1439-2305 Number 308 – March 2017 GENDER DIFFERENCES IN HONESTY: THE ROLE OF SOCIAL VALUE ORIENTATION Kerstin Grosch Holger A. Rau
Transcript of Gender Differences in Honesty: The Role of Social Value ...cege/Diskussionspapiere/DP308.pdf ·...
ISSN: 1439-2305
Number 308 – March 2017
GENDER DIFFERENCES IN HONESTY:
THE ROLE OF SOCIAL VALUE
ORIENTATION
Kerstin Grosch
Holger A. Rau
Gender Differences in Honesty:
The Role of Social Value Orientation∗
Kerstin Grosch †1 and Holger A. Rau‡2
1University of Gottingen2University of Mannheim, University of Gottingen
March 2017
Abstract
This paper experimentally analyzes the determinants of the honesty norm in a lying
game. The findings confirm common gender differences, i.e., men cheat significantly
more than women. We detect a novel correlation between subjects’ magnitude of
concern they have for others (social value orientation) and their moral valuation of
the norm honesty. The data suggest that individualistic subjects are less honest
than prosocial ones. Interestingly, this difference can explain the gender differences
we observe. First, we find that the distribution of social value orientation differs
between gender, i.e., significantly more male subjects are characterized as individ-
ualistic subjects. Second, once we control for social value orientation the gender
differential disappears.
JEL Classification numbers: C91, H26, J16.
Keywords: Experiment, Gender Differences, Honesty, Social Value Orientation.
∗We thank Marcela Ibanez, Martin Kocher, Stephan Muller, and Lilia Zhurakhovska for helpful com-ments. Financial support is acknowledged from the German Research Foundation (grant number RTG1666) and the University of Gottingen.
†Corresponding author, Heinrich-Duker-Weg 12, 37073 Gottingen (Germany), E-mail: kgrosch@uni-
goettingen.de
‡Platz der Gottinger Sieben 3, 37073 Gottingen (Germany), E-mail: [email protected]
1 Introduction
Honesty plays a key role in many personnel interactions such as purchasing tickets in
buses, behaving compliant in exams or cooperating in principal-agent relations. However,
compliance on imposed tasks, rules or norms is imperfect and people often bend rules for
their individual benefit. As a consequence, dishonest behavior might increase the need
for monitoring to avoid higher transaction costs (e.g., Cialdini et al. 2004). Therefore, it
is important to get a clearer understanding of the norm honesty to effectively counteract
cheating behavior. It is especially relevant to learn more about the determinants (e.g.,
individual preferences) which may be correlated with dishonest behavior. In this regard,
experimental economics is a powerful discipline as one of its evident strengths is the
elicitation of subjects’ preferences, and the consequences of their choices. Hence, many
experiments study honesty and truth-telling behavior.
In an excellent survey, Rosenbaum et al. (2014) emphasize that despite honesty is
not a fixed trait, most of the studies report that women cheat less than men.1 This is
shown in the lab (e.g., Erat and Gneezy, 2012; Houser et al., 2012; Conrads et al., 2014;
Kocher et al., 2016)2 and in the field (Azar et al., 2013; Bucciol et al., 2013). Although,
the literature predominately finds that men cheat significantly more, some studies find no
gender differences (e.g., Childs, 2012; Djawadi and Fahr, 2015).
The empirical evidence suggests that subjects’ gender does not solely influences why
people may behave dishonest. According to Rosenbaum et al. (2014), “[..] it seems that
the experimental agenda regarding honesty could greatly benefit from having a more
precise understanding of underlying individual-level motives and how they aggregate to
prosocial norms, which would provide a better understanding of how dishonest behavior
may be impeded” (p.194). Many experiments on dishonest behavior analyze settings
where cheating has an externality on another person (e.g., Sutter 2009; Gneezy et al. 2013;
Cappelen et al. 2013). Of course dishonest behavior can incorporate a social component
when the act of lying benefits somebody else. In settings with a social component lying
may not only be affected by motivations of the norm honesty, but also by other-regarding
behavior. However, we aim at drawing general conclusions on the drivers of violating the
norm honesty. Hence, we focus on a setting where dishonesty has no consequence on a
matched player.
1There is even experimental evidence that lying behavior also significantly occurs among kids (Buc-ciol et al. 2013), among nuns (Utikal and Fischbacher 2013) and decreases in age (Glatzle-Rutzler andLergetporer 2015).
2Grolleau et al. 2016 even find that cheating is more pronounced in the loss domain. They reportthat this effect is especially pronounced for men.
1
Social preferences in form of social value orientation (SVO) may be a good candidate
to study subjects’ motivation to behave honest. More precisely, eliciting subjects’ SVO
allows to classify them in prosocial and individualistic types which reflect their attitudes
towards social norms. A meta-analysis from Balliet et al. (2009) concludes that prosocial
subjects are more sensitive to social norms and assess social dilemma situations in terms of
morality.3 By contrast, individualistic subjects assess such dilemmas in terms of strength
and power (Van Lange and Kuhlman, 1994; De Cremer and Van Lange, 2001). In this
vein, prosocial-oriented persons could not only be different in their concern for somebody
else’s payoff but also in the way they evaluate situations with a moral component involved.
The latter may help to get a clearer picture on the individual determinants of the norm
honesty.
In this study, we run a laboratory experiment to elicit subjects’ SVO and test its
impact on dishonest behavior. The paper aims at better understanding the determinants
of dishonest behavior and the common gender effect observed in cheating games (Rosen-
baum et al. 2014). In the beginning of the experiment we measure SVO in a task where
subjects have to choose a money allocation between them and a matched partner. We
map individual SVO to subjects’ honesty in a subsequent die-roll game where they have to
report the rolled number (Fischbacher and Follmi-Heusi, 2013). In our simple setup, dis-
honest behavior has no externality on colleagues, but yields an individual benefit. Thus,
we capture motives such as social norms in form of honesty to comply to a dictated rule
(Gneezy et al. 2013). Importantly, we rule out that honest behavior is motivated by con-
cerns of other-regarding behavior. Instead, in its negative sense, people violate the norm
if they are less concerned to break a rule for an individual benefit.
Our results show that subjects’ gender matters for honesty, i.e., we confirm previous
findings of gender differences (Rosenbaum et al. 2014). Interestingly, we report a novel
result: individual SVO plays an important role for the decision to behave honestly. The
data show that prosocial subjects behave more honest, than individualisitic subjects. We
find that the percentage of prosocial women is significantly higher as compared to men.
The combination of more honest behavior among prosocials and the highest occurrence of
this SVO type among women, can explain the gender difference in cheating. The finding
that honest behavior is correlated with SVO does not only help to understand gender
differences in this domain, but it may also spur research on the motives of individual
honesty.
3The authors find that these subjects cooperate more in social dilemma situations.
2
2 Experimental Design
As our experiments took less than ten minutes we conducted it after another experiment.4
We apply the lying game introduced by Fischbacher and Follmi-Heusi (2013), i.e., at the
end of the experiments subjects were told that they could receive an extra payoff for
completing a questionnaire. Subjects learned that they had to roll a die that would
determine their payoff. Participants were told that they receive the rolled die number
times e0.2, e.g., rolling a 3 yields e0.6. The only exception is the number 6. Subjects
would earn zero if the number of points on the die was 6. Note that, Fischbacher and
Follmi-Heusi (2013) demonstrate that dishonest behavior is not affected by the level of
stake.5
The procedure was as follows: subjects rolled the die ten times in a row and had to
enter the die number after each die roll. Our participants knew that at the end of the
experiment a random draw would select one of the ten die rolls to be paid out. Subjects’
SVO was elicited at the beginning of the experimental session. In this respect we used
the money allocation task introduced by Murphy et al. (2011). Our participants were
matched in dyads and were presented simultaneously six different decision sets. In each
situation subjects had to choose the preferred money allocation for themselves and their
matched partner. For payoff decisions, we presented the original points used in Murphy
et al. (2011). The exchange rate was 1 point = e0.03. At the end, one out of the six
decision sets was selected for payment and one player was randomly assigned the role of
the active decision maker. The other player was passive and had to accept the allocation.
Evaluating the participant’s decisions in the active role, a SVO angle can be calculated
for each person. The angle allows a classification into four groups of altruistic, prosocial,
individualistic, and competitive types. The types differ in their magnitude of concern they
have for other people’s payoff. Individualistic types mainly maximize their own payoffs
whereas prosocial types maximize the sum of earnings for themselves and the matched
participant.
The experiment was conducted at the University of Gottingen and programmed using
z-Tree (Fischbacher, 2007). Subjects from various fields were recruited with ORSEE
(Greiner, 2004). We ran 14 sessions with 268 subjects (129 male and 139 female subjects).
4The experiment encompasses three treatments and focuses on the role of distributive justice on anti-social behavior (Grosch and Rau, 2016). Our data of the die-roll game do not significantly differ betweenthe treatments (for all pairwise comparisons we find for Kolmogorov-Smirnov tests that p > 0.6).
5Moreover, there is evidence that low-stake sizes do not impact the replication of standard resultsin ultimatum, dictator, trust, public-good games (Amir et al. 2012; Kocher et al. 2008), and socialpreferences (Muller and Rau 2016).
3

Subjects’ average payment in the main experiment was e12.65 (they earned e1.54 in the
SVO-elicitation task and e0.63 in the cheating game).
3 Results
In this section we present the results on honesty in the die-roll game. We always report
two-sided p− values when applying non-parametric tests. Before we report our findings
we present descriptive statistics of subjects’ socio-demographic characteristics (see Table
1).
females (n = 139) males (n = 128) aggregate data (n = 267)
SVO angle 28.10 (11.79) 24.63 (14.35) 26.44 (13.17)risk tolerance 5.14 (1.92) 5.60 (2.16) 5.36 (2.04)age 24.40 (4.89) 25.11(4.16) 24.74 (4.56)experience 8.02 (9.75) 7.46 (6.20) 7.76 (8.23)econ student (in%) 0.41 (0.49) 0.47 (0.50) 0.44 (0.50)
Table 1: Descriptive statistics on subjects’ socio demographics. Standard deviations inparentheses.
The reported variables are as follows: SVO angle corresponds to the average SVO angle
calculated in an individual level.6 Risk tolerance is the mean of subjects’ self-reported risk
tolerance.7 Age represents subjects’ average age in years, whereas econ student reports
the percentage of subjects studying economics or business economics. Finally, experience
is the self-reported number of participation in economic experiments.
The table encompasses 267 subjects as we excluded one subject for the further data
analysis as this was the only person who was classified as a competitive type in SVO.8
Overall, it can be seen that women on average have higher mean SVO angles and are
less risk tolerant than men9 which confirms gender differences in risk taking (Charness
and Gneezy 2012). It can be seen that males are slightly older and no differences exist in
the reported number of participation in experiments. We observe a similar percentage of
female (41%) and male (47%) subjects who study economics or business.
6Lower angles indicate selfish behavior and higher angles can be interpreted as more prosocial.7We elicited risk in a questionnaire by asking: “Are you generally a person who is fully prepared to
take risks or do you try to avoid taking risks?” Participants could answer on a scale from 1 (risk averse)to 10 (risk seeking) (Dohmen et al., 2012).
8Our main results do not change, if we include this subject.9We find that the SVO angle a significant difference between the female and male distribution of the
SVO angle (Kolmogorov-Smirnov test, p = 0.025). Men also have a significantly higher risk tolerancethan women (Mann-Whitney test, p = 0.057).
4
3.1 The Impact of Gender and SVO on Honesty
We start our analysis by analyzing the impact of gender and SVO types on subjects’
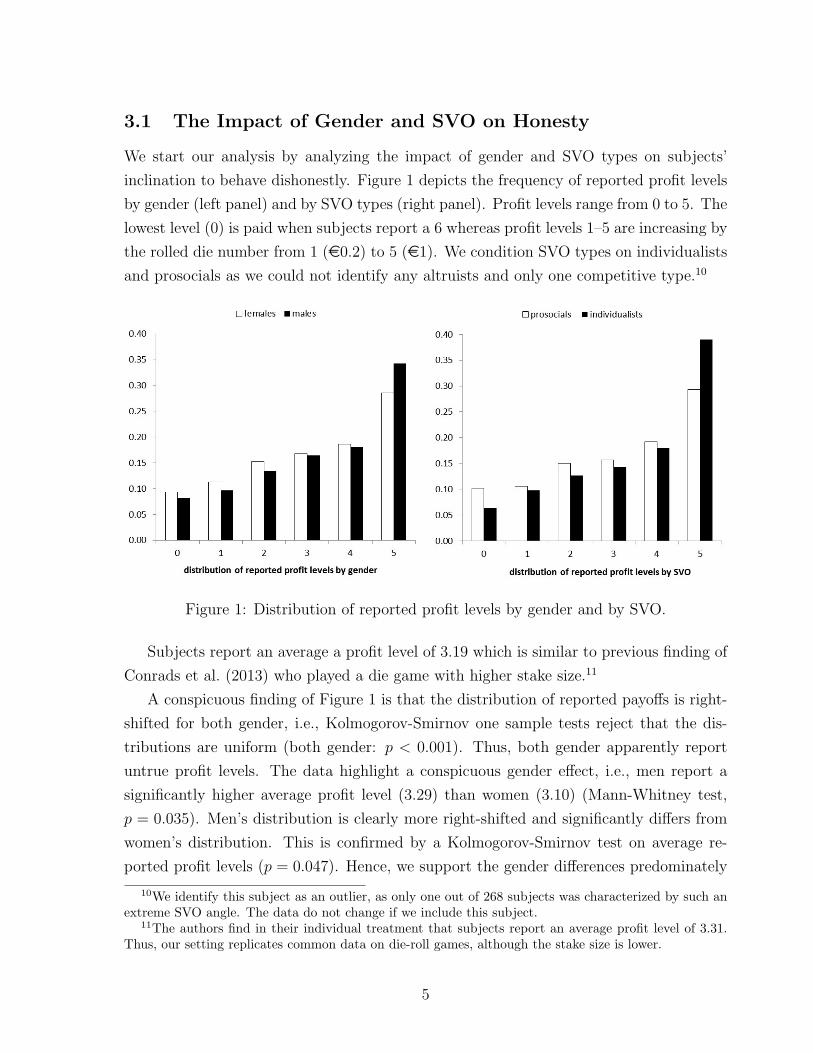
inclination to behave dishonestly. Figure 1 depicts the frequency of reported profit levels
by gender (left panel) and by SVO types (right panel). Profit levels range from 0 to 5. The
lowest level (0) is paid when subjects report a 6 whereas profit levels 1–5 are increasing by
the rolled die number from 1 (e0.2) to 5 (e1). We condition SVO types on individualists
and prosocials as we could not identify any altruists and only one competitive type.10
Figure 1: Distribution of reported profit levels by gender and by SVO.
Subjects report an average a profit level of 3.19 which is similar to previous finding of
Conrads et al. (2013) who played a die game with higher stake size.11
A conspicuous finding of Figure 1 is that the distribution of reported payoffs is right-
shifted for both gender, i.e., Kolmogorov-Smirnov one sample tests reject that the dis-
tributions are uniform (both gender: p < 0.001). Thus, both gender apparently report
untrue profit levels. The data highlight a conspicuous gender effect, i.e., men report a
significantly higher average profit level (3.29) than women (3.10) (Mann-Whitney test,
p = 0.035). Men’s distribution is clearly more right-shifted and significantly differs from
women’s distribution. This is confirmed by a Kolmogorov-Smirnov test on average re-
ported profit levels (p = 0.047). Hence, we support the gender differences predominately
10We identify this subject as an outlier, as only one out of 268 subjects was characterized by such anextreme SVO angle. The data do not change if we include this subject.
11The authors find in their individual treatment that subjects report an average profit level of 3.31.Thus, our setting replicates common data on die-roll games, although the stake size is lower.
5
found in the literature (e.g., Dreber and Johannesson, 2008; Houser et al., 2012; Conrads
et al., 2013).
Result 1
Male subjects report significantly higher profit levels than women.
Next, we analyze the impact of SVO on subjects’ inclination to behave dishonestly.
The right panel of Figure 1 demonstrates that subjects’ SVO crucially matters for honest
behavior. That is, prosocials report lower profit levels (3.07) than individualists (3.44).
A Mann-Whitney test reveals a highly significant difference (p < 0.001). It can be seen
that the distribution of reported profit levels is clearly more right shifted for individual-
ists as compared to prosocials. A Kolmogorov-Smirnov test detects a highly significant
difference (p = 0.006). Strikingly, it can be seen that the distribution of females directly
translates into the distribution of prosocials. That is, no significant difference can be
observed between these two distributions (Kolmogorov-Smirnov test, p = 1.000). Sim-
ilarly, no significant differences can be found when comparing the distribution of males
and individualists (Kolmogorov-Smirnov test, p = 0.675). This suggests that the gender
differences may be explained by differences in the distributions of SVO types between
women and men.
Result 2
Prosocial subjects report significantly lower profit levels than individualists.
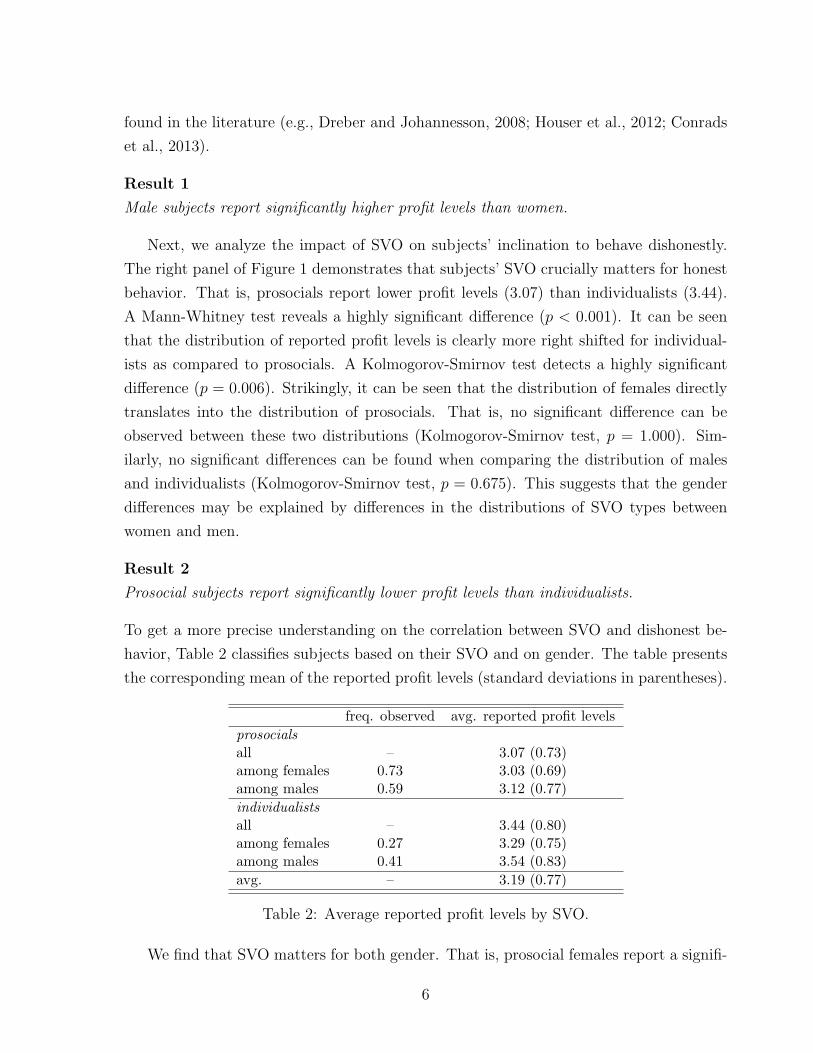
To get a more precise understanding on the correlation between SVO and dishonest be-
havior, Table 2 classifies subjects based on their SVO and on gender. The table presents
the corresponding mean of the reported profit levels (standard deviations in parentheses).
freq. observed avg. reported profit levels
prosocials
all – 3.07 (0.73)among females 0.73 3.03 (0.69)among males 0.59 3.12 (0.77)
individualists
all – 3.44 (0.80)among females 0.27 3.29 (0.75)among males 0.41 3.54 (0.83)
avg. – 3.19 (0.77)
Table 2: Average reported profit levels by SVO.
We find that SVO matters for both gender. That is, prosocial females report a signifi-
6
cantly lower profit level (3.03) than individualists (3.29) (Mann-Whitney test, p = 0.058).
Interestingly, the effect of SVO is clearly more pronounced among men. That is, prosocial
males behave highly significantly more honestly (3.12) than individualists (3.54) (Mann-
Whitney test, p = 0.006). The table highlights that a high fraction of females can be
characterized as prosocial (73%), whereas the share of prosocial men (59%) is lower.
Taken together the evidence that prosocial subjects are more honest and that most of
these subjects are female, suggests that the gender difference may be induced by SVO.
To get deeper insights we focus on gender differences in the distributions of SVO types
in the next section.
3.2 Gender Differences in SVO
The previous results showed that women are significantly more honest than men. We also
observed a novel finding which demonstrated that subjects’ SVO types correlate with
honesty behavior. Hence, it is possible that gender differences in this domain may be
ascribed to gender differences in the distributions of SVO types.
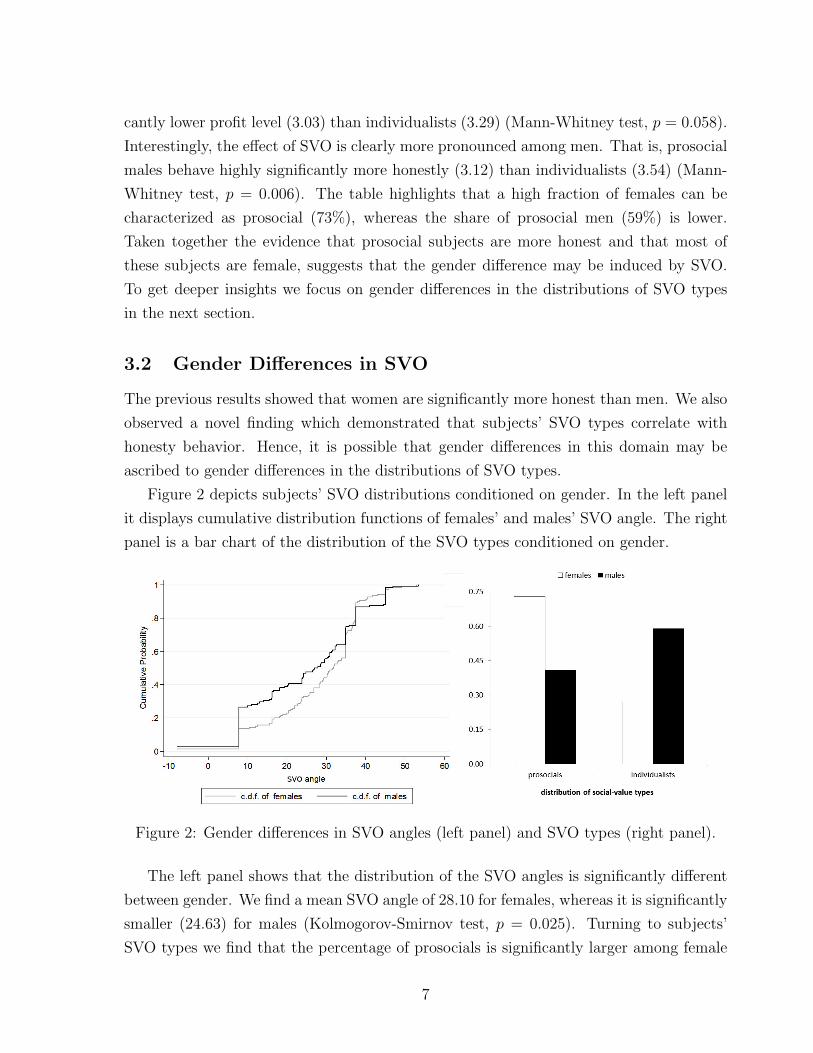
Figure 2 depicts subjects’ SVO distributions conditioned on gender. In the left panel
it displays cumulative distribution functions of females’ and males’ SVO angle. The right
panel is a bar chart of the distribution of the SVO types conditioned on gender.
Figure 2: Gender differences in SVO angles (left panel) and SVO types (right panel).
The left panel shows that the distribution of the SVO angles is significantly different
between gender. We find a mean SVO angle of 28.10 for females, whereas it is significantly
smaller (24.63) for males (Kolmogorov-Smirnov test, p = 0.025). Turning to subjects’
SVO types we find that the percentage of prosocials is significantly larger among female
7
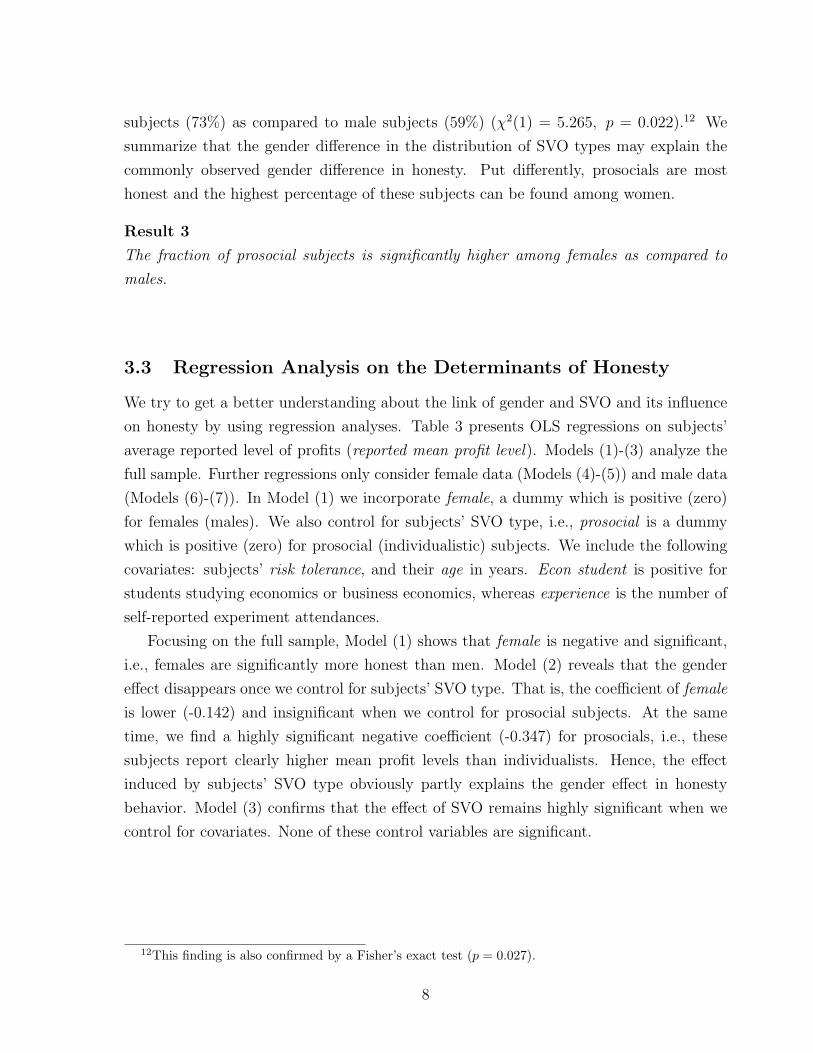
subjects (73%) as compared to male subjects (59%) (χ2(1) = 5.265, p = 0.022).12 We
summarize that the gender difference in the distribution of SVO types may explain the
commonly observed gender difference in honesty. Put differently, prosocials are most
honest and the highest percentage of these subjects can be found among women.
Result 3
The fraction of prosocial subjects is significantly higher among females as compared to
males.
3.3 Regression Analysis on the Determinants of Honesty
We try to get a better understanding about the link of gender and SVO and its influence
on honesty by using regression analyses. Table 3 presents OLS regressions on subjects’
average reported level of profits (reported mean profit level). Models (1)-(3) analyze the
full sample. Further regressions only consider female data (Models (4)-(5)) and male data
(Models (6)-(7)). In Model (1) we incorporate female, a dummy which is positive (zero)
for females (males). We also control for subjects’ SVO type, i.e., prosocial is a dummy
which is positive (zero) for prosocial (individualistic) subjects. We include the following
covariates: subjects’ risk tolerance, and their age in years. Econ student is positive for
students studying economics or business economics, whereas experience is the number of
self-reported experiment attendances.
Focusing on the full sample, Model (1) shows that female is negative and significant,
i.e., females are significantly more honest than men. Model (2) reveals that the gender
effect disappears once we control for subjects’ SVO type. That is, the coefficient of female
is lower (-0.142) and insignificant when we control for prosocial subjects. At the same
time, we find a highly significant negative coefficient (-0.347) for prosocials, i.e., these
subjects report clearly higher mean profit levels than individualists. Hence, the effect
induced by subjects’ SVO type obviously partly explains the gender effect in honesty
behavior. Model (3) confirms that the effect of SVO remains highly significant when we
control for covariates. None of these control variables are significant.
12This finding is also confirmed by a Fisher’s exact test (p = 0.027).
8
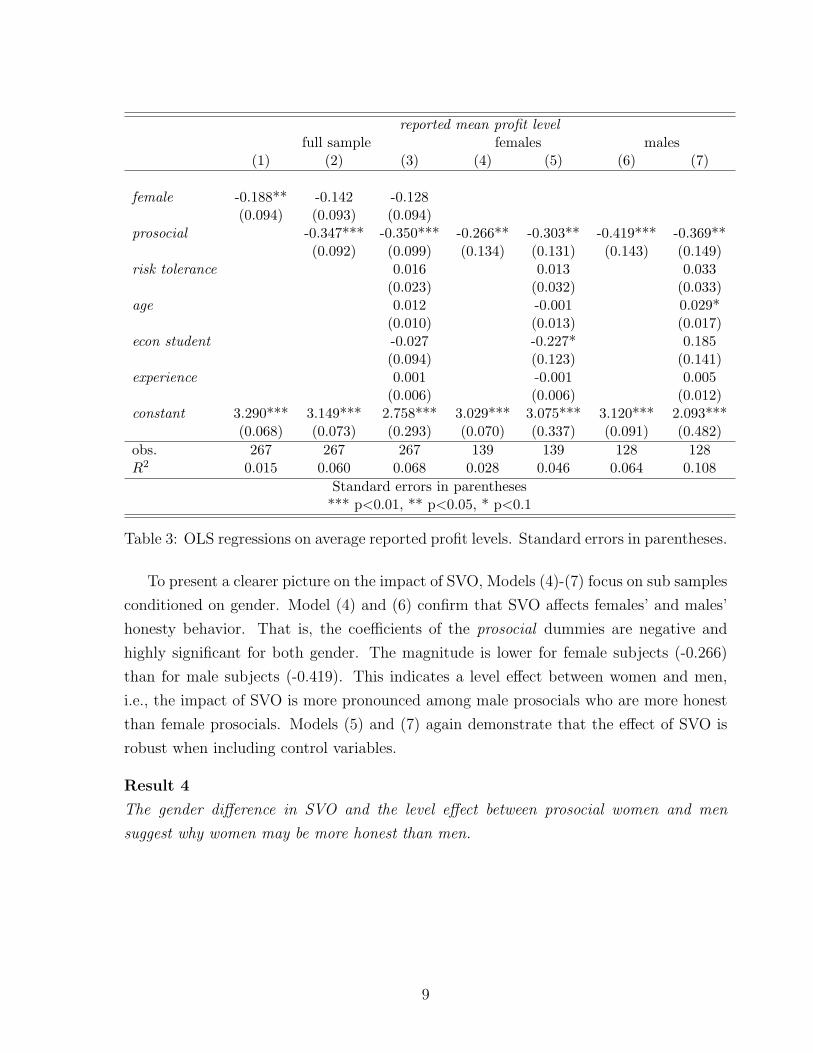
reported mean profit level
full sample females males(1) (2) (3) (4) (5) (6) (7)
female -0.188** -0.142 -0.128(0.094) (0.093) (0.094)
prosocial -0.347*** -0.350*** -0.266** -0.303** -0.419*** -0.369**(0.092) (0.099) (0.134) (0.131) (0.143) (0.149)
risk tolerance 0.016 0.013 0.033(0.023) (0.032) (0.033)
age 0.012 -0.001 0.029*(0.010) (0.013) (0.017)
econ student -0.027 -0.227* 0.185(0.094) (0.123) (0.141)
experience 0.001 -0.001 0.005(0.006) (0.006) (0.012)
constant 3.290*** 3.149*** 2.758*** 3.029*** 3.075*** 3.120*** 2.093***(0.068) (0.073) (0.293) (0.070) (0.337) (0.091) (0.482)
obs. 267 267 267 139 139 128 128R2 0.015 0.060 0.068 0.028 0.046 0.064 0.108
Standard errors in parentheses*** p<0.01, ** p<0.05, * p<0.1
Table 3: OLS regressions on average reported profit levels. Standard errors in parentheses.
To present a clearer picture on the impact of SVO, Models (4)-(7) focus on sub samples
conditioned on gender. Model (4) and (6) confirm that SVO affects females’ and males’
honesty behavior. That is, the coefficients of the prosocial dummies are negative and
highly significant for both gender. The magnitude is lower for female subjects (-0.266)
than for male subjects (-0.419). This indicates a level effect between women and men,
i.e., the impact of SVO is more pronounced among male prosocials who are more honest
than female prosocials. Models (5) and (7) again demonstrate that the effect of SVO is
robust when including control variables.
Result 4
The gender difference in SVO and the level effect between prosocial women and men
suggest why women may be more honest than men.
9
4 Discussion
In our simple experiment we scrutineer social value orientation as a mediator of hon-
esty. Reporting higher numbers increases individual benefits, but has no effect on others.
First, we confirm predominant gender differences in compliance behavior, that is women
are more honest than men (e.g., Friesen and Gangadharan 2012; Conrads et al. 2014).
One could argue that our results may not adequately replicate existing results in hon-
esty behavior as our stakes were low. However, there is evidence that low stake-size
experiments replicate data of standard laboratory experiments (e.g., Amir et al. 2012).
Moreover in lying games Fischbacher and Follmi-Heusi (2013) report that people show
similar dishonest behavior under different stake sizes.13
Our second finding presents important novel insights, i.e., honest behavior is correlated
with subjects’ social value orientation. More precisely, individualists behave clearly more
dishonest than prosocial types. A closer look at the distribution of SVO types reveals
that a higher proportion of men than women are among individualistic types. One might
argue, that observing a gender difference in social value orientation may not be surprising
as gender differences in social preferences exist (Croson and Gneezy 2009). However, the
contribution of our study is that the gender difference in SVO can be translated into the
miscellaneous engagement in dishonest behavior of men and women. In this paper, we
detected a novel correlation between subjects’ SVO and their inclination to be dishonest.
The latter may help to better understand individual-level motives to violate the norm
honesty. More precisely, our regression analysis demonstrates that a combination of social
value orientation and gender may explain honesty behavior. First, prosocial subjects are
generally more honest. Second, it turns out that the effect of social value orientation
is more pronounced for men as compared to women. The combination of both explains
common gender differences.
Dishonest behavior can incorporate a social component when the act of lying benefits
somebody else. For such a white lie, prosocials are willing to violate the norm of being
honest and lie to a higher extent than more individualistic types (Cappelen et al., 2013).
The decision to behave dishonestly is a rational calculation in which the individual weighs
the personal payoff against the expected costs and is dishonest if the net payoff is positive
(Okeke and Godlonton, 2014). Our way of measuring dishonesty inheres no such social
component. Hence, we can rule out that prosocials act more honest in our setup because of
13One could argue that men and women may react differently to low stake sizes. However, thisis unlikely as our aggregate data replicates existing findings on honesty behavior. At the same time,Conrads et al. (2013) find a similar gender effect.
10
their social preference to care more about other’s payoff than individualists. As discussed,
prosocials might be more honest as they see the lying situation as a choice between moral
and immoral and suffer higher moral costs from being dishonest than individualists. The
finding that SVO is correlated with individual honesty is an interesting starting point for
further research. First, it enables us to better understand gender differences in honest
behavior. Second, it may spur research aiming at the motivations of individual cheating
behavior. In this respect we leave the question open which additional factors may play a
role for the more pronounced effect of social value orientation for male subjects.
References
Amir, O., D. G. Rand, et al. (2012). Economic games on the internet: The effect of $1
stakes. PloS one 7 (2), e31461.
Azar, O. H., S. Yosef, and M. Bar-Eli (2013). Do customers return excessive change
in a restaurant?: A field experiment on dishonesty. Journal of Economic Behavior &
Organization 93, 219–226.
Balliet, D., C. Parks, and J. Joireman (2009). Social value orientation and cooperation
in social dilemmas: A meta-analysis. Group Processes & Intergroup Relations 12 (4),
533–547.
Bucciol, A., F. Landini, and M. Piovesan (2013). Unethical behavior in the field: De-
mographic characteristics and beliefs of the cheater. Journal of Economic Behavior &
Organization 93, 248–257.
Cappelen, A. W., E. Ø. Sørensen, and B. Tungodden (2013). When do we lie? Journal
of Economic Behavior & Organization 93, 258–265.
Charness, G. and U. Gneezy (2012). Strong evidence for gender differences in risk taking.
Journal of Economic Behavior & Organization 83 (1), 50–58.
Childs, J. (2012). Gender differences in lying. Economics Letters 114 (2), 147–149.
Cialdini, R. B., P. K. Petrova, and N. J. Goldstein (2004). The hidden costs of organiza-
tional dishonesty. MIT Sloan Management Review 45 (3), 67.
Conrads, J., B. Irlenbusch, R. M. Rilke, A. Schielke, and G. Walkowitz (2014). Honesty
in tournaments. Economics Letters 123 (1), 90–93.
11
Conrads, J., B. Irlenbusch, R. M. Rilke, and G. Walkowitz (2013). Lying and team
incentives. Journal of Economic Psychology 34, 1–7.
Croson, R. and U. Gneezy (2009). Gender differences in preferences. Journal of Economic
literature 47 (2), 448–474.
De Cremer, D. and P. A. Van Lange (2001). Why prosocials exhibit greater cooperation
than proselfs: The roles of social responsibility and reciprocity. European Journal of
Personality 15 (S1).
Djawadi, B. M. and R. Fahr (2015). and they are really lying: Clean evidence on the
pervasiveness of cheating in professional contexts from a field experiment. Journal of
Economic Psychology 48, 48–59.
Dohmen, T., A. Falk, D. Huffman, and U. Sunde (2012). The intergenerational transmis-
sion of risk and trust attitudes. Review of Economic Studies 79 (2), 645–677.
Dreber, A. and M. Johannesson (2008). Gender differences in deception. Economics
Letters 99 (1), 197–199.
Erat, S. and U. Gneezy (2012). White lies. Management Science 58 (4), 723–733.
Fischbacher, U. (2007). z-tree: Zurich toolbox for ready-made economic experiments.
Experimental Economics 10 (2), 171–178.
Fischbacher, U. and F. Follmi-Heusi (2013). Lies in disguise an experimental study on
cheating. Journal of the European Economic Association 11 (3), 525–547.
Friesen, L. and L. Gangadharan (2012). Individual level evidence of dishonesty and the
gender effect. Economics Letters 117 (3), 624–626.
Glatzle-Rutzler, D. and P. Lergetporer (2015). Lying and age: An experimental study.
Journal of Economic Psychology 46, 12–25.
Gneezy, U., B. Rockenbach, and M. Serra-Garcia (2013). Measuring lying aversion. Jour-
nal of Economic Behavior & Organization 93, 293–300.
Greiner, B. (2004). The online recruitment system orsee 2.0-a guide for the organization
of experiments in economics. Working paper, University of Cologne 10 (23), 63–104.
Grolleau, G., M. G. Kocher, and A. Sutan (2016). Cheating and loss aversion: Do people
cheat more to avoid a loss? Management Science.
12
Grosch, K. and H. A. Rau (2016). Unjustified work compensation and antisocial behavior.
mimeo.
Houser, D., S. Vetter, and J. Winter (2012). Fairness and cheating. European Economic
Review 56 (8), 1645–1655.
Kocher, M. G., P. Martinsson, and M. Visser (2008). Does stake size matter for cooper-
ation and punishment? Economics Letters 99 (3), 508–511.
Kocher, M. G., S. Schudy, and L. Spantig (2016). I lie? we lie! why? experimental
evidence on a dishonesty shift in groups.
Muller, S. and H. A. Rau (2016). The relation of risk attitudes and other-regarding
preferences: A within-subjects analysis. European Economic Review 85, 1–7.
Murphy, R. O., K. A. Ackermann, and M. Handgraaf (2011). Measuring social value
orientation. Judgment and Decision Making 6 (8), 771–781.
Okeke, E. N. and S. Godlonton (2014). Doing wrong to do right? social preferences and
dishonest behavior. Journal of Economic Behavior & Organization 106, 124–139.
Rosenbaum, S. M., S. Billinger, and N. Stieglitz (2014). Lets be honest: A review of
experimental evidence of honesty and truth-telling. Journal of Economic Psychology 45,
181–196.
Sutter, M. (2009). Deception through telling the truth?! experimental evidence from
individuals and teams. The Economic Journal 119 (534), 47–60.
Utikal, V. and U. Fischbacher (2013). Disadvantageous lies in individual decisions. Journal
of Economic Behavior & Organization 85, 108–111.
Van Lange, P. A. and D. M. Kuhlman (1994). Social value orientations and impressions of
partner’s honesty and intelligence: A test of the might versus morality effect. Journal
of Personality and Social Psychology 67 (1), 126.
13
Appe dix:
O -scree I structio s t a slated f o Ge a ; ot i te ded fo pu li atio
Social value orie tatio
I this pa t the o pute a do l at hes ou ith a othe pa ti ipa t of this oo . He e, ou a d ou at hed pa t e si ulta eousl ake se e al de isio s. The ide tities of oth pa ti ipa ts ill ot e
e ealed at a poi t i ti e also ot afte the e pe i e t . All de isio s a e ade i Tale . The efo e e ake use of the follo i g e ha ge ate:
Taler = . 3.
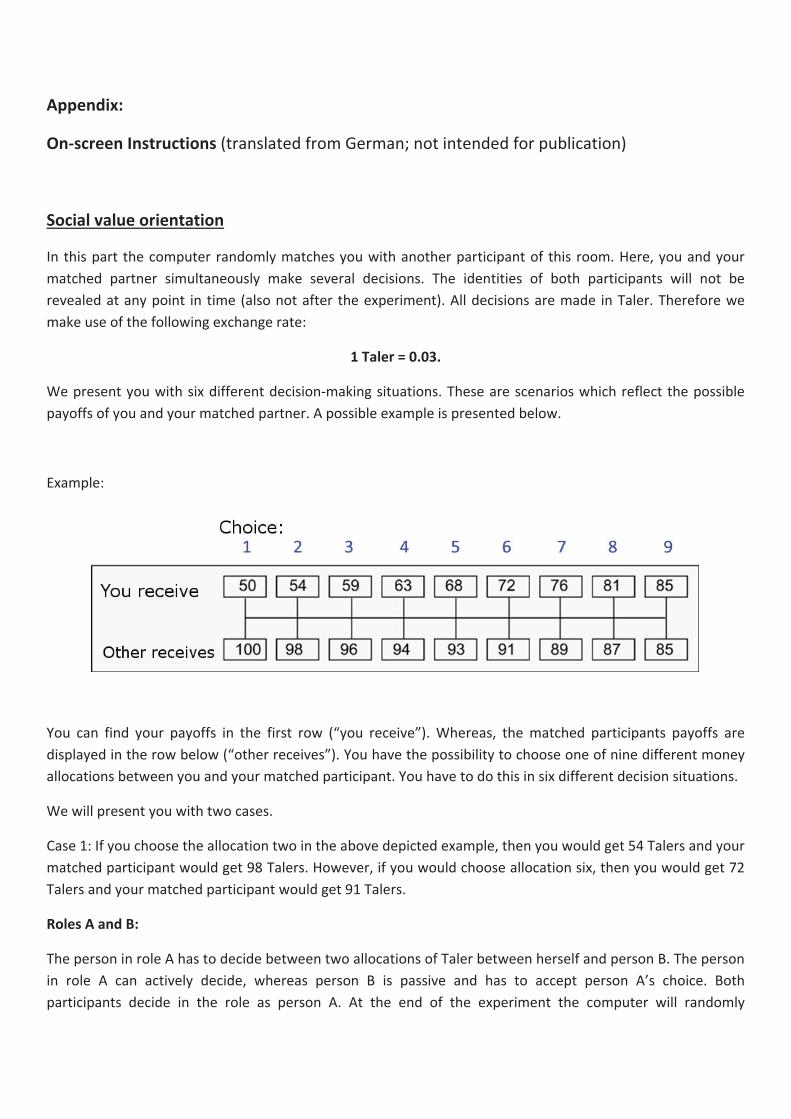
We p ese t ou ith si diffe e t de isio - aki g situatio s. These a e s e a ios hi h efle t the possi le pa offs of ou a d ou at hed pa t e . A possi le e a ple is p ese ted elo .
E a ple:
You a fi d ou pa offs i the fi st o ou e ei e . Whe eas, the at hed pa ti ipa ts pa offs a e displa ed i the o elo othe e ei es . You ha e the possi ilit to hoose o e of i e diffe e t o e allo atio s et ee ou a d ou at hed pa ti ipa t. You ha e to do this i si diffe e t de isio situatio s.
We ill p ese t ou ith t o ases.
Case : If ou hoose the allo atio t o i the a o e depi ted e a ple, the ou ould get Tale s a d ou at hed pa ti ipa t ould get Tale s. Ho e e , if ou ould hoose allo atio si , the ou ould get
Tale s a d ou at hed pa ti ipa t ould get Tale s.
Roles A a d B:
The pe so i ole A has to de ide et ee t o allo atio s of Tale et ee he self a d pe so B. The pe so i ole A a a ti el de ide, he eas pe so B is passi e a d has to a ept pe so A’s hoi e. Both pa ti ipa ts de ide i the ole as pe so A. At the e d of the e pe i e t the o pute ill a do l
dete i e hethe ou a e i the ole of pe so A o B. If ou ill e i the ole of pe so A, the ou a ti e de isio ill ou t a d the at hed pa ti ipa t ill e passi e. Ho e e , if ou a e i the ole of pe so B, the the at hed pa ti ipa t ill e a ti e. I this ase the hoi e of pa ti ipa t B ill dete i e ou pa off.
At the e d of the e pe i e t the o pute ill a do l hoose o e out of the si de isio sets to e o e pa off ele a t. Mo eo e , the o pute ill sele t hethe ou hoi e o the hoi e of the at hed pa ti ipa t ill dete i e the pa offs. Afte a ds the pa offs ill e o e ted to Eu os. At the e d of the e pe i e t ou ill e i fo ed o the sele ted de isio set, hethe ou e e a ti e/passi e. We ill also i fo ou o the pa off of this stage.
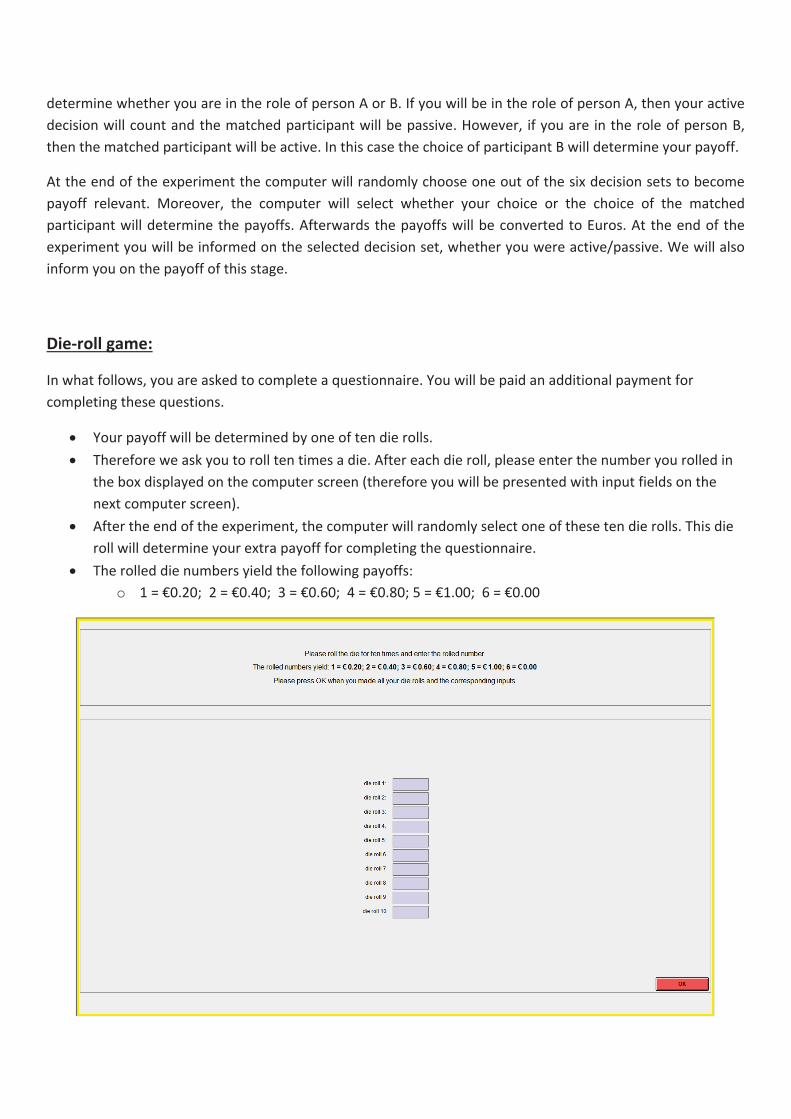
Die-roll ga e:
I hat follo s, ou a e asked to o plete a uestio ai e. You ill e paid a additio al pa e t fo o pleti g these uestio s.
You pa off ill e dete i ed o e of te die olls. The efo e e ask ou to oll te ti es a die. Afte ea h die oll, please e te the u e ou olled i the o displa ed o the o pute s ee the efo e ou ill e p ese ted ith i put fields o the
e t o pute s ee . Afte the e d of the e pe i e t, the o pute ill a do l sele t o e of these te die olls. This die oll ill dete i e ou e t a pa off fo o pleti g the uestio ai e.
The olled die u e s ield the follo i g pa offs: o = € . ; = € . ; = € . ; = € . ; = € . ; = € .