
Gender Classification using Multi-Level Wavelets on … · Gender Classification using Multi-Level...
16
Acta Polytechnica Hungarica Vol. 10, No. 4, 2013 – 193 – Gender Classification using Multi-Level Wavelets on Real World Face Images Sajid Ali Khan, Muhammad Nazir, Naveed Riaz Department of Computer Science, Shaheed Zulfikar Ali Bhutto Institute of Science and Technology, Plot # 67, Street # 9, H/8-4 Islamabad, 44000, Pakistan [email protected], [email protected], n.r.ansari@szabist- isb.edu.pk Abstract: Gender classification is a major area of classification that has generated a lot of academic and research interest over the past decade or so. Being a recent area of interest in classification, there is still a lot of opportunity for further improvements in the existing techniques and their capabilities. In this paper, an attempt has been made to cover some of the limitations that the associated research community has faced by proposing a novel gender classification technique. In this technique, discrete wavelet transform has been used up to five levels for the purpose of feature extraction. To accommodate pose and expression variations, the energies of sub-bands are calculated and combined at the end. Only those features are used which are considered significant, and this significance is measured using Particle Swarm Optimization (PSO). The experimentation performed on real world images has shown a significant classification improvement and accuracy to the tune of 97%. The results also reveal the superiority of the proposed technique over others in its robustness, efficiency, illumination and pose change variation detection. Keywords: Gender Classification; Discrete Wavelet Transform; Particle Swarm Optimization; Feature Selection; Real World Face Images 1 Introduction In today’s technological world Gender Classification plays a vital role. It is widely used in applications such as customer-oriented advertising, visual surveillance, and intelligent user interfaces and demographics. With the evolution of human-computer interaction (HCI), in order to meet the growing demands for secure, reliable and convenient services, computer vision approaches like face identification, gesture recognition and gender classification will play an important role in our lives. Features are generally classified into two categories 1) Appearance-based (Global) and Geometric-based (Local) features. In the appearance-based feature extraction
-
Upload
nguyendiep -
Category
Documents
-
view
226 -
download
0
Transcript of Gender Classification using Multi-Level Wavelets on … · Gender Classification using Multi-Level...

Acta Polytechnica Hungarica Vol. 10, No. 4, 2013
– 193 –
Gender Classification using Multi-Level
Wavelets on Real World Face Images
Sajid Ali Khan, Muhammad Nazir, Naveed Riaz
Department of Computer Science, Shaheed Zulfikar Ali Bhutto Institute of
Science and Technology, Plot # 67, Street # 9, H/8-4 Islamabad, 44000, Pakistan
[email protected], [email protected], n.r.ansari@szabist-
isb.edu.pk
Abstract: Gender classification is a major area of classification that has generated a lot of
academic and research interest over the past decade or so. Being a recent area of interest
in classification, there is still a lot of opportunity for further improvements in the existing
techniques and their capabilities. In this paper, an attempt has been made to cover some of
the limitations that the associated research community has faced by proposing a novel
gender classification technique. In this technique, discrete wavelet transform has been used
up to five levels for the purpose of feature extraction. To accommodate pose and expression
variations, the energies of sub-bands are calculated and combined at the end. Only those
features are used which are considered significant, and this significance is measured using
Particle Swarm Optimization (PSO). The experimentation performed on real world images
has shown a significant classification improvement and accuracy to the tune of 97%. The
results also reveal the superiority of the proposed technique over others in its robustness,
efficiency, illumination and pose change variation detection.
Keywords: Gender Classification; Discrete Wavelet Transform; Particle Swarm
Optimization; Feature Selection; Real World Face Images
1 Introduction
In today’s technological world Gender Classification plays a vital role. It is widely
used in applications such as customer-oriented advertising, visual surveillance,
and intelligent user interfaces and demographics.
With the evolution of human-computer interaction (HCI), in order to meet the
growing demands for secure, reliable and convenient services, computer vision
approaches like face identification, gesture recognition and gender classification
will play an important role in our lives.
Features are generally classified into two categories 1) Appearance-based (Global)
and Geometric-based (Local) features. In the appearance-based feature extraction
S. A. Khan et al. Gender Classificaiton using Multi-Level Wavelets on Real World Face Images
– 194 –
technique, an image is considered as a high dimensional vector and features are
extracted from its statistical information without any dependence on extensive
knowledge about the object of interest. This technique is simple and fast but
unreliable, especially when variations in local appearance occur. In the geometric-
based feature extraction approach, geometric features like nose, mouth and eyes
are extracted from the face portion. This approach has the advantage of rotation
and variation invariability but generally misses a lot of helpful information.
In the early 1990s, Golomb et al. [1] trained a two-layer neural network called
SEX-NET and achieved 91.9% classification accuracy by using 90 frontal face
images. In 1995, Brunelli and Poggio et. al. [2] extracted geometric features and
used them to train the networks, achieving a 79% classification accuracy rate. Sun
et. al. (2002) [3] claimed that Genetic Algorithm (GA) performs well for
important feature's selection task. They used Principal Component Analysis
(PCA) to create the features’ vector and GA to select the important features. They
achieved 95.3% accuracy after training the Support Vector Machine classifier by
using those important features. In 2004, Jain and Huang et. al. [4] extracted facial
features using Independent Component Analysis (ICA) and then classified gender
using Liner Discriminant Analysis (LDA). They performed experiments on a
normalized FERET database and achieved a 99.3 % classification accuracy rate.
In 2006, Sun et al. [5] used Local Binary Pattern (LBP) to create features for the
input of AdaBoost and achieved 95.75% accuracy in terms of the classification
rate. In 2007, Baluja and Rowley et al. [6] achieved 93% classification accuracy.
They used Pixel comparison operators with an Adaboost classifier. In 2010, Nazir
et al. [7] used Discrete Cosine Transform (DCT) to extract the important facial
features and then used a K-nearest neighbor classifier to classify gender. In 2011,
Sajid et al. [8] used Discrete Wavelet Transform (DWT) to extract facial features.
They claimed that classifier performance was better after different classifiers
ensemble using the weight majority technique. They performed experiments on a
Stanford University Medical Students (SUMS) face database and achieved
95.63% classification accuracy rate.
A public setback alongside the above studies is that they have utilized the frontal
face under controlled environments (e.g. SUMS, FERET). The images in these
databases usually contain images that have a clean background, are occlusions
free, provide only frontal faces, contain limited facial expressions and have
consistent lighting effects. However, real-life images are usually captured in
unconstrained environments and conditions. A real-life image usually contains
significant appearance variation, such as illumination change, poor image quality,
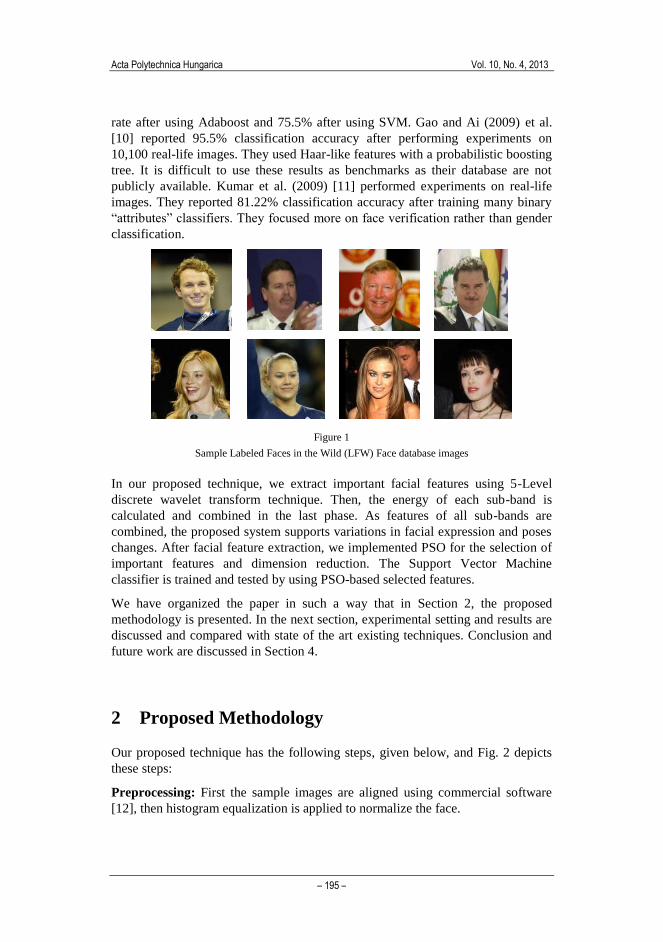
makeup or occlusions and different facial expressions. The images in Fig. 1
demonstrate these facts. Gender recognition in an unconstrained environment is a
more challenging task compared to faces captured in constrained environments
like the FERET and SUMS face databases. In literature, this problem has been
addressed by few studies. Shakharovich et al. (2002) [9] collected 3,500 face
images from the web. They used Haar-like features and obtained a 79% accuracy
Acta Polytechnica Hungarica Vol. 10, No. 4, 2013
– 195 –
rate after using Adaboost and 75.5% after using SVM. Gao and Ai (2009) et al.
[10] reported 95.5% classification accuracy after performing experiments on
10,100 real-life images. They used Haar-like features with a probabilistic boosting
tree. It is difficult to use these results as benchmarks as their database are not
publicly available. Kumar et al. (2009) [11] performed experiments on real-life
images. They reported 81.22% classification accuracy after training many binary
“attributes” classifiers. They focused more on face verification rather than gender
classification.
Figure 1
Sample Labeled Faces in the Wild (LFW) Face database images
In our proposed technique, we extract important facial features using 5-Level
discrete wavelet transform technique. Then, the energy of each sub-band is
calculated and combined in the last phase. As features of all sub-bands are
combined, the proposed system supports variations in facial expression and poses
changes. After facial feature extraction, we implemented PSO for the selection of
important features and dimension reduction. The Support Vector Machine
classifier is trained and tested by using PSO-based selected features.
We have organized the paper in such a way that in Section 2, the proposed
methodology is presented. In the next section, experimental setting and results are
discussed and compared with state of the art existing techniques. Conclusion and
future work are discussed in Section 4.
2 Proposed Methodology
Our proposed technique has the following steps, given below, and Fig. 2 depicts
these steps:
Preprocessing: First the sample images are aligned using commercial software
[12], then histogram equalization is applied to normalize the face.

S. A. Khan et al. Gender Classificaiton using Multi-Level Wavelets on Real World Face Images
– 196 –
Face Extraction: Facial portion is extracted and removal of the unwanted area
using a spatial coordinate system is performed.
Features Extraction: Facial features in vertical and horizontal direction are
extracted using 5-level DWT.
Optimized Features Selection: Feature sets with high importance and high
accuracy are selected using PSO.
Classification: SVM is trained and tested by using optimized features.
Figure 2
Proposed System Architecture
2.1 Facial Portion Extraction
We have preferred to use the system with continous varying coordinates on
discerete indices. In spatial coordinate system, a position of an image is described
in terms of x and y and not in row and column format. Fig. 3 dipicts the spatial
coordinate system.

Acta Polytechnica Hungarica Vol. 10, No. 4, 2013
– 197 –
Figure 3
Spatial Coordinate System
As a single small image may contain thousands of pixels, high dimensional data
affects the computational time and makes the system slow. To remove the
unwanted area and to extract only the facial portion, we have used spatial
coordinate system. By a hit and miss method, we set the X and Y coordinate
values.
Fig. 4, depicts the extracted faces from original images.
Figure 4
Extracted faces using Spatial coordinates
2.2 Feature Extraction
Wavelets are comparatively more beneficial than other mathematical
transformations such as Discrete Fourier Transform (DFT) and Discrete Cosine
Transform (DCT). Functions with interruptions and functions with sharp spikes
generally follow wavelet basis functions to a lesser degree than sine cosine
functions to obtain similar resemblance. Wavelets have been utilized in different
ways in images processing since 1985 [13]. Its potential to furnish spatial and
frequency representations of the image at the same time influences its use for
feature extraction. The dissolution of the input data into many layers of division in
space and frequency permits us to separate the frequency components presented
S. A. Khan et al. Gender Classificaiton using Multi-Level Wavelets on Real World Face Images
– 198 –
by inherent or natural damage. Wavelet-based methods reduce or cut off these
variable sub-bands and concentrate on the space frequency sub-bands that include
the most appropriate information to show the data in a better way and assist in the
classification task. A huge selection of wavelet families exists. These rely on the
selection of the mother wavelet. In 1986, Sergent [14] stated that the low-
frequency band and high-frequency band play different roles. The low-frequency
band provides the universal description while the high-frequency component
provides the first-rate characteristics needed in the identification task. Sergent
argues that as a human face is a flexible object, it has countless facial expressions,
and expressions tend to affect the local spatial components of the face. Wavelets
are very helpful in enhancing the authenticity of image registration. For this
purpose, wavelets take into account both spatial and spectral information by
yielding a multi-resolution representation and keeping away from wandering to
any global or local information. The other advantages of using wavelets include
bringing data with different spatial resolution to a common resolution using the
low-frequency sub-bands while providing access to edge features using the high-
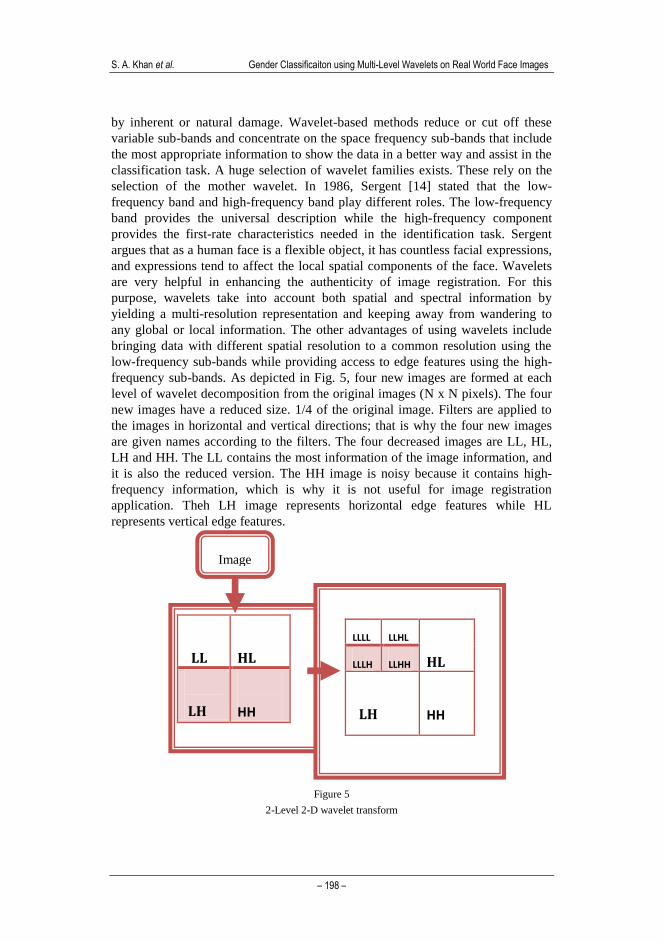
frequency sub-bands. As depicted in Fig. 5, four new images are formed at each
level of wavelet decomposition from the original images (N x N pixels). The four
new images have a reduced size. 1/4 of the original image. Filters are applied to
the images in horizontal and vertical directions; that is why the four new images
are given names according to the filters. The four decreased images are LL, HL,
LH and HH. The LL contains the most information of the image information, and
it is also the reduced version. The HH image is noisy because it contains high-
frequency information, which is why it is not useful for image registration
application. Theh LH image represents horizontal edge features while HL
represents vertical edge features.
Figure 5
2-Level 2-D wavelet transform
Image
LL
HL
LH
HH
LLLL LLHL
HL LLLH LLHH
LH
HH

Acta Polytechnica Hungarica Vol. 10, No. 4, 2013
– 199 –
2.3 Optimized Feature Selection
PSO was put forward by Dr. Eberhart and Dr. Kennedy in 1995 as a
computational model based on the idea of cooperative behavior and swarming in
biological populations influenced by the social behavior of fish schooling [15]. At
present, PSO has been utilized as a prosperous optimizer in countless areas, for
example training man-made neural webs, constrained purpose optimization,
wireless web optimization, and data clustering.
Computation in PSO is derived from a population (Swarm) of processing elements
called particles in which each particle symbolizes a candidate solution. PSO has a
strong resemblance to evolutionary computation techniques like those of GA. This
system is commenced with a population of unplanned solutions and seeks for
optima by modernizing generations. The seeking process makes use of a
combination of deterministic and probabilistic rules that depend on information
sharing among their population fellows to boost their search procedures.
Nevertheless, in contrast to GA, PSO has no evolution operators such as crossover
and mutation. Every particle in the search space develops its candidate solution
over time, utilizing its individual memory and knowledge acquired by the swarm
as a whole. The information sharing mechanism in PSO is altogether different
compared to GA. In GA, chromosomes contribute information to each other. As a
result, the entire population advances as one group toward an optimal area. In
PSO, the word finest particle discovered among the swarm is the sole information
contributed among the particles. It is a one-sided information sharing mechanism.
In PSO, the computation time is considerably less compared to GA because all the
particles in PSO have the tendency to coincide with the finest solution swiftly.
PSO is used for problem optimization. Particles, also known as swarms, are used
to search for the optimal solution in the search space. Each particle represents a
candidate solution in the search space and is represented by particular coordinates.
xxx iDiiiX ,......,21
(1)
Where iX represents the eighth position of the particle. The velocity which is the
rate of change of current and the new position is denoted by the equation 2.
vvv iDiiiV .,.........,21
(2)
The fitness function for each particle is determined after comparison with the
previous best result. It is also compared with the best result in the search space.
Equations 2 and 3 are used to update the position and velocity of the particle after
finding the best values.
)(**)(***22_11
1
XgrandcXprandcVVt
ibest
t
ibesti
t
i
t
i
(3)

S. A. Khan et al. Gender Classificaiton using Multi-Level Wavelets on Real World Face Images
– 200 –
)11
VXXt
i
t
i
t
i
(4)
Where,
- ).......3,2,1( Ni
- N is the size of particle (swarm)
- pbesti _
and gbest
are the local and global best solution in the search
space.
- C1 and C2 are cognitive (represent the particle private itself experience)
and social (represents the cooporation between particles) parameters
having
values between 0 and 2.
- In the first part of equation number 3, w represents the inertia weight that is
used to control the search algorithm balance between exploitation and
exploration.
Fig. 6 represents the pseudo code of PSO.
Figure 6
PSO technique pseudo code
2.3.1 Binary Particle Swarm Optimization (BPSO)
A binary PSO algorithm was developed in [16]. In this edition, the particle locale
is coded as 1 or 0 and the velocity function is used as the probability distribution.
The following is the equation which updates the particle position.

Acta Polytechnica Hungarica Vol. 10, No. 4, 2013
– 201 –
1
1 111 0
1t
i
t t
i iif rand then else
VX X
e
(5)
The bit value ‘1’ indicates that the particle (feature) is used for the next generation
and ‘0’ indicates that particle (feature) is terminated for the next generation.
Each particle is searched for the best solution (Optimal feature) in the search
space. Evolution is driven by fitness function. Each particle is coded as P = F1 F2
F3……Fn, where ‘n’ is the size of the feature set. If a feature set size is 20, i.e. P
= F1 F2 F3…… F20, then theh BPSO selects 1, 4, 5, 6, 7 and 9 as the best
features using the fitness function. Thus, the accuracy of those optimized six
features is greater than the combined 20 features.
Fitness Function: In every iteration, each particle is assessed employing fitness
purpose and worth of the optimal particle returned as the result. This evaluation is
driven by the fitness function ‘F’ that evaluates the quality of the evolved particles
in terms of their ability to minimize the class separation term indicated by the
scatter index among the different classes [17]. Let k1 and k2 denote the classes of
male and female and N1 N2…..Nn represent the number of images each class had.
Let's define M1, M2…… Mn, me as;
( )
1
1, 1,2,3......
ii
i jji
Ni nM K
N
(6)
( )i
jK , J = 1,2,3........iN , indicate the image from class
ik .
01
1 n
iiiN
NM M
Here, 0M is the grand mean and N is the total number of images for both
classes.
Fitness function ‘F’ can be computed by equation 7;
0 01
( ) ( )n
t
i ii
F M M M M
(7)
2.4 Classification using Support Vector Machine (SVM)
The binary classification is a two class (0 or 1) problem, and the goal of this
problem is to separate the two classes by mean of function. SVM is a useful
technique for data classification and is easier to use compared to Neural Networks.

S. A. Khan et al. Gender Classificaiton using Multi-Level Wavelets on Real World Face Images
– 202 –
SVM takes data (features) as input and predicts which data belongs to which class.
The goal of SVM is to find the optimal hyper plan such that it minimizes the error
rate for an unseen test sample. According to the structural risk minimization
principals and VC dimension minimization principle [18] a linear SVM uses a
systematic approach to find a linear function with the lowest capacity.
The SVM classifier correctly separates the training data of labeled sets of M
training samples (Xi, Yi), where Xi ε RN and Yi are the associated label i.e. (Yi ε
{-1,1}).
The hyper plan is defined by equation 8;
1
( ) ( , )M
iiii
f x K x x by
(8)
3 Experimetal Results and Discussion
We used the MATLAB 2009a environment for our experiments. Labeled faces in
the wild (LFW) [19] face database were used in our experiment. This database
contains 13,233 images collected from the web. To remove unwanted areas, a face
portion is extracted using a spatial coordinate system and then, as shown in Fig. 7,
histogram equalization is applied to normalize the face image. We selected 400
face images, 200 male and 200 female, for the experiments. All the faces are
aligned using commercial align software (Wolf et al 2009) [12]. We avoided the
selection of those images for which it is difficult to establish the ground truth
(such as a hidden face). 5-fold cross validation is used in all experiments. All the
images are converted into gray scale from the RGB color space to retain the
luminance factor and to eliminate the hue and saturation information. An 8 bit
grayscale image contains 256 gray levels which have values between 0 and 255.
The image is resized to the size of 32x32 pixels and the spatial coordinate system
is used to extract the facial portion. A hit and miss method is used to find the x1,
x2, y1 and y2 coordinates of an image. As all the images are of the same size, the
same coordinate values are used for all images to extract the face portion. Figure 8
depicts this process.
Five level decomposition is performed using a 2-dimensional Haar wavelet
transform. First, details coefficients of all levels are combined, and their energy is
found out. Then horizontal and vertical coefficients are combined and their energy
is calculated. The combined detail co-efficient and horizontal and vertical co-
efficient of DWT are then passed to PSO. PSO evaluates the features and provides
results as optimized features. Features’ vectors of size 10, 20, 30, 40 and 50 are
obtained after PSO implementation. These features are then passed to SVM with a

Acta Polytechnica Hungarica Vol. 10, No. 4, 2013
– 203 –
train-to test-ratio of 1:3 and 3:1 using 5-fold cross validation. We have also used
some other state-of-the-art classifiers for testing resultant feature sets and
compared their results with SVM classifier. Table 1 shows that the use of the 30-
feature SVM classifier outperforms other classifiers. The accuracy of BPNN and
KNN is same, with both using 10 and 20 features, but the accuracy increases when
the features set size is set to 30. We have also noticed that the accuracy rate
degrades when the features set size is more than 30.
(a)
(b)
Figure 7
(a) Face before normalization
(b) Face after normalization
Table 1
Comparison of SVM classifier accuracy rate with other state-of-the-art classifiers accuracy using
different number of features
Accuracy is evaluated after passing the 5-level DWT combined features to SVM.
We compared it with the proposed techniques as shown in Table 1. Table 1 clearly
shows that the proposed technique’s accuracy rate is high with reduced
dimensions (i.e. it utilizes a minimum number of features). In Fig. 9, the Feature
set of size FS-250, FS-300, FS-450 and FS-500 are used to train and test SVM to
evaluate the DWT+SVM accuracy rate. On the other hand, high classification
accuracy of 97% is obtained with Feature set size reduced (i.e. FS-20, FS-30, FS-
40, FS-50) after optimizing the features using PSO (i.e. using our proposed
technique).
Classifier/
Features
10
20 30
40
50
BPNN 0.7433 0.7433 0.8683 0.8683 0.7017
KNN 0.7433 0.7433 0.8051 0.7433 0.7017
SVM 0.785 0.785 0.973 0.8267 0.7433
FLDA 0.7433 0.785 0.8192 0.8267 0.6183
NMS 0.7017 0.6183 0.7513 0.785 0.785
LDA 0.7017 0.5767 0.8447 0.785 0.7433
NMC 0.7017 0.7433 0.8135 0.785 0.7017
Figure 8
Face image extraction

S. A. Khan et al. Gender Classificaiton using Multi-Level Wavelets on Real World Face Images
– 204 –
Figure 9
Proposed technique (DWT+PSO+SVM) comparison with another mechanism (DWT+SVM) using the
different number of features.
Table 2 Table 3
Parameter settings for PSO Parameter settings for GA
Fig. 10 presents the comparison of the PSO-based optimized feature's
classification accuracy rate with GA-based optimized feature's classification
accuracy rate using a features set size of 20, 30, 40 and 50. The GA-based
optimized features' accuracy rate is high only when we use a features set of size
50; however, in all other cases (i.e. Feature set of size 20, 30 and 40), the PSO-
based optimized feature's accuracy rate is higher. In PSO, the computation time is
substantially less as compared to GAs because all the particles in PSO have the
tendency to coincide to the finest solution swiftly. So the PSO-based optimization
mechanism is considerably more accurate and fast as compared to the GA-based
optimization mechanism in the case of gender classification.
Parameter Name Value
Swarm Size (N) 100
Cognitive Parameter (C1) 2
Social Parameter (C2) 2
Inertia weight (ω) 0.6
Iterations 100
Parameter Name Value
Population Size (N) 100
Cross Over Probability
(Pc)
0.5
Mutation Probability
(Pm)
1
Iterations 100

Acta Polytechnica Hungarica Vol. 10, No. 4, 2013
– 205 –
Figure 10
PSO and GA-based classification accuracy rate comparisons
Table 4 presents a comparison of our proposed technique with other gender
classification techniques. In our proposed technique, we overcome problems such
as high dimensions (by utilizing the minimum number of features) and variation in
pose or occlusions (by combining different level's DWT coefficients). We have
used real-life images that have a large amount of variations in facial expression
and pose. The database that we have used is also publicly available, which helps
to benchmark for the future.
Table 4
Comparison of SVM classifier accuracy rate with other
Methods Database Data
Dimensions
Real
Life
Publically
available
Recognition
Rate
Proposed LFW 30 Yes Yes 97%
Sun et al [3] PCA,SVM General
Faces
150 No No 95.3%
Jain and
Huang [4]
ICA,LDA FERET 200 No Yes 96%
Baluja et al [6] Pixels
Comparisons
FERET 2409 No Yes 94.3%
Nazir et al [7] DCT,K-NN SUMS 256 No Yes 99.3%
Shakhnarovich
et al[9]
Haar-like
features
World
Wide
Web
35,00 Yes No 79%
Gao et al [10] Haar-like
features
Consumer
Images
10,100 Yes No 95.5%
Shan, C [20] LBP, SVM LFW 2891 Yes Yes 95%
Sajid et al [8] DWT,SVM SUMS 20 No Yes 95.63%

S. A. Khan et al. Gender Classificaiton using Multi-Level Wavelets on Real World Face Images
– 206 –
Computational Complexity
In this section, performance is measured in terms of time complexity. Table 5
presents the computational time comparison of our proposed technique with other
techniques. Most of the researchers have used geometric based feature extraction
techniques to extract the face features and classify gender, which makes their
technique computationally more expensive. We can see from the table that [6]
used Adaboost and Support Vector Machine (SVM) to classify gender, and their
technique consumed more time as compared with our proposed technique to
classify gender. Similarly [7] used the Voila and Jones technique to detect the face
portion first and then DCT to get the efficient face features. The Voila and Jones
technique takes more time to extract the face portion as compared to the Spatial
coordinate system. In [10] Boosting tree and Active shape model (ASM) are used
to locate the facial points. The computational time of ASM increases with an
increase in face image sets. In [20] the same ASM geometric feature extraction
based approach is used, which is more time consuming compared to our proposed
appearance-based approach.
Table 5
Computational time comparison with other techniques
Conclusions and Future Work
Gender classification is considered one of the most active research areas in pattern
recognition and image processing. Currently most of the acclaimed work in this
domain revolves around a frontal facial image based classification. In this paper,
we have focused on reducing the data dimensions and have tried to produce a
more optimal feature set that more accurately represents a gender face. If the
Technique Total Time (Sec)
Proposed
20 features 40
30 features 60
40 features 70
Baluja et al. [6]
AdaBoost+SVM
20 features 47
30 features 68
40 features 78
Nazir et al. [7]
Voila & Jones +
DCT+KNN
20 features 130
30 features 160
40 features 183
Gao et al. [10]
Boosting Tree +ASM
20 features 240
30 features 300
40 features 360
Shan, C [20]
ASM+LBP+SVM
20 features 165
30 features 220
40 features 268

Acta Polytechnica Hungarica Vol. 10, No. 4, 2013
– 207 –
inadequate features are used, then even the best classifiers usually fail to achieve
higher accuracy. Therefore, in this paper, we have tried to optimize the features by
using PSO algorithms. After the optimization phase, a large number of redundant
and irrelevant features are eliminated, resulting in a reduction in data dimensions.
We have achieved a 97% classification accuracy rate after performing
experiments on real-world face images (LFW) and have utilized the minimum
number of features. We have combined different level's DWT detail coefficients,
making our system more stable and supportive of variations in facial expressions,
illumination and poses. The results of proposed technique when compared to other
state-of-the-art gender classification techniques show that the proposed technique
provides higher classification accuracy by utilizing the minimum number of
features. This also reduces time complexity and makes the system fast.
Furthermore, we intend to explore more Swarm-based optimization algorithms
(SOAs), such as Ant colony optimization, and to make our system more accurate
and stable.
References
[1] B. Golomb, D. Lawrence, T. Sejnowski: Sexnet: a Neural Network
Identifies Sex from Human Faces, In: Advances in Neural Information
Processing Systems, 1991, pp. 572-577
[2] R. Brunelli, T. Poggio: HyberBF Networks for Gender Classification, in
Proceedings DARPA image understanding workshop, 1995, pp. 311-314
[3] Z. Sun, G. Bebis, X.Yuan, S. J. Louis: Genetic Feature Subset Selection for
Gender Classification: A Comparison Study, In: proceeding 6th
IEEE
workshop on Applications of computer vision, Orlando, FL, USA, 2002,
pp. 165-170
[4] A. Jain, J. Huang, S. Fang: Gender Classification using Frontal Facial
Images, In: IEEE international conference on pattern Recognition, Tampa,
Florida, 2008, pp. 1-4
[5] N. Sun, W. Zheng, C. Sun, C. Zou, L. Zhao: Gender Classification Based
on Boosting Local BINARY pattern, In: Proceedings of the Third
international conference on Advances in Neural Networks, Verlag Berlin,
Heidelberg, 2006, pp. 194-201
[6] S. Baluja and H. Rowley: Boosting Sex Identification Performance,
International Journal of computer vision, Vol. 71, 2007, pp. 111-119
[7] M. Nazir, M. Ishtiaq, A. Batool, A. Jaffar and M. Mirza: Feature Selection
for efficient gender classification, In: 11th
WSEAS International
conference, Wisconsin, USA, 2010, pp. 70-75
[8] S. A. Khan, M. Nazir, N. Naveed and N. Riaz: Efficient Gender
Classification Methodology using DWT and PCA, In: 14th
IEEE
international Multi-topic conference, Karachi, Pakistan, 2011, pp. 155-158
S. A. Khan et al. Gender Classificaiton using Multi-Level Wavelets on Real World Face Images
– 208 –
[9] G. Shakhnarovich, P. Viola and B. Moghaddam: A Unified Learning
Framework for Real Time Face Detection and Classification, In: IEEE
Internet Conference on Automatic Face & Gesture Recognition (FG), 2002,
pp. 14-21
[10] W. Gao and H. Ai: Face Gender Classification on Consumer Images in a
Multiethnic Environment, In: International Conference on Biometrics
(ICB), Verlag Berlin, Heidelberg, 2009, pp. 169-168
[11] N. Kumar, P. N. Belhumeur and S. K. Nayar: Face Tracer: A Search
Engine for Large Collections of Images with Faces, In: European
Conference on Computer Vision (ECCV), 2009, pp. 340-353
[12] L. Wolf, T. Hassner and Y. Taigman, “Similarity Scores Based on
Background Samples”, In: Asian Conf. on Computer Vision (ACCV), 2009
[13] A. S. Samra, S. E. Gad Allah, R. M. Ibrahim: Face Recognition Using
Wavelet Transform, Fast Fourier Transform and Discrete Cosine
Transform, In: Proc. 46th
IEEE International Midwest Symp. Circuits and
Systems (MWSCAS'03), Vol. 1, 2003, pp. 272- 275
[14] J. Sergent: Micro Genesis of Face Perception, In: H. D. Ellis, M. A. Jeeves,
F. Newcombe and A. Young, Editors, Aspects of Face Processing, Nijhoff,
Dordrecht, 1986
[15] J. Kennedy and R. Eberhart: Particle Swarm Optimization, In: Proc. IEEE
International Conference on Neural Networks, 1995, pp. 1942-1948
[16] J. Kennedy and R. C. Eberhart: A Discrete Binary Version of the Particle
Swarm Algorithm, In: Proc. IEEE International Conference on Systems,
Man, and Cybernetics, Vol. 5, 1997, pp. 4104-4108
[17] C. Liu and H. Wechsler: Evolutionary Pursuit and Its Application to Face
Recognition, IEEE Trans. Pattern Analysis and Machine Intelligence, Vol.
22, No. 6, 2000, pp. 570-582
[18] V. Vapnik, The Nature of Statistical Learning Theory, Springer, 1995
[19] G. Huang, M. Ramesh, T. Berg “Labeled Faces in the Wild: A Database for
Studying Face Recognition in Unconstrained Environments”, Tech. Rep.
07-49, University of Massachusetts, Amherst, 2007
[20] C. Shan, “Learning Local Binary Pattern for Gender Classification on Real-
World Face Images”, Pattern Recognition Letter, 2011