Gender Audit Report - United Nations Development … Audit Report.pdf · UNITED NATIONS DEVELOPMENT...
71
UNITED NATIONS DEVELOPMENT PROGRAMME AND THE STATE MINISTRY OF SOCIAL WELFARE, WOMEN AND CHILDREN REPORT ON GENDER AUDIT OF SOUTH KORDOFAN CIVIL SERVICE INSTITUTIONS GOVERNANCE AND RULE OF LAW UNIT July 2007 KADUGLI
-
Upload
nguyentuyen -
Category
Documents
-
view
222 -
download
0
Transcript of Gender Audit Report - United Nations Development … Audit Report.pdf · UNITED NATIONS DEVELOPMENT...

UNITED NATIONS DEVELOPMENT PROGRAMME
AND
THE STATE MINISTRY OF SOCIAL WELFARE, WOMEN AND CHILDREN
REPORT ON
GENDER AUDIT OF SOUTH KORDOFAN
CIVIL SERVICE INSTITUTIONS
GOVERNANCE AND RULE OF LAW UNIT July 2007
KADUGLI

1
Source; Gender Integration Framework, InterAction, January 1999

2
TABLE OF CONTENTS 2 LIST OF TABLES 3 LIST OF FIGURES AND ANNEX 4 ACRONYMS AND ABBREVIATIONS 6 ACKNOWLEDGEMENT 7 EXECUTIVE SUMMARY 8 1. INTRODUCTION 10
1.1 Background 10 1.2 Meaning, Scope and Functions of the Civil Service 10 1.3 Gender context in South Kordofan State 11 1.4 Rationale and Objective 11 1.5 Scope of the assessment 12 1.6 Organization of the Report 12
2. THE GENDER AUDIT PROCESS 13
3. DATA COLLECTION METHODOLOGY 15
3.1 The Gender Audit Questionnaire 15 3.2 Translation of the Gender Audit Questionnaire 16 3.3 Document Review 16 3.4 Sampling method and sample size 16
4. DATA PROCESSING, ANALYSIS AND PRESENTATION 17
4.1 Data Processing Tools and procedures 17 4.1.1 Univariate Analysis 17 4.1.2 Composite Analysis 17 4.1.3 Bivariate Analysis 18
4.2 Narrative Responses 18 4.3 Presentation of Gender Audit Results 18
5. DATA ANALYSIS AND INTERPRETATION OF FINDINGS 19 5.1 Respondents demographic profile 19 5.2 Analysis of Staff perception of gender equity in Programme dimensions 21 A. Programme planning and design 21
B. Programme implementation 22 C. Technical expertise 25 D. Monitoring and Evaluation 27 E. Partner organizations 29
5.3 Analysis of Staff perception of gender equity in organizational processes 31 A. Gender Policy 31 B. Staffing 34 C. Human Resources 36 D. Advocacy, lobbying and communications 40 E. Financial resources 41 F Organizational Culture 42
5.4 Characteristics of an ideal employee 48 5.5 Statistical Inferences 49
6. KEY FINDINGS 52
7. CONCLUSION AND THE WAY FORWARD 54
Annex 1: 56
TABLE OF CONTENTS

3
LIST OF TABLES
Table 3.1: Gender Audit dimensions Table: 4.1 Gender integration Framework Concepts Table 5.1: Staff perception regarding increased gender equity gender disaggregated data Table 5.1D.1 Staff perception with regard to increased gender equity gender disaggregated data Table 5.1E.1 Staff perception with regard to obstacles for gender integration Table 5.2E.1 Staff perception regarding financial resources based on Gender Table 5.3F.1 Staff perception with regards to gap, work, image, thinking and integrity based on gender Table 5.3F.2 Staff perception with regards to more, culture, and meetings, past, unfair (based on gender) Table 5.5.1 Political Will composite Index Table 5.5.2 Technical capacity composite index Table 5.5.3 Accountability composite index Table 5.5.4 Organizational culture composite index Table: 5.5.5 Gender Integration Framework Composite Index

4
LIST OF FIGURES Figure 5.1.1 Respondents characteristics by sex Figure 5.1.2 Respondents Characteristics by Education Figure 5.1.3 Respondents Characteristics by position Figure 5.1.4 Respondents Characteristics by Ministry Figure 5.1.5 Respondents Characteristics by age group Figure 5.2A.1 Staff perception regarding mandate, goal and needs Figure 5.2A.2 Staff perception with regard to best practices, criteria and methods Figure 5.2B.1 Staff perception with regard to access to service and training Figure 5.2B.2 Staff perception with regard to values Figure 5.2B.3 Staff perception with regard to value (based on gender) Figure 5.2B.4 Staff perception with regard to resistance Figure 5.2B.5 Staff perception with regard to resistance (based on gender) Figure 5.2C.1 Staff perception with regard to availability of division and staff Figure 5.2C.2 Staff perception with regard to skills, training and experts Figure 5.2C.3 Staff perception with regard to Expertise Figure 5.2C.4 Staff perception with regard to expertise (based on gender) Figure 5.2D.1 Staff perception with regard to data, impact and sector Figure 5.2D.3 Staff perception with regard to power (based on gender) Figure 5.2D.4 Staff perception with regard to gender Equality Figure 5.2E.1 Staff perception with regard to selection of partners Figure 5.2E.2 Staff perception with regard to obstacles for gender integration Figure 5.3A.1 Staff perception with regard to gender policy Figure 5.3A.2 Staff perception with regard to gender policy (based on gender) Figure 5.3A.3 Staff perception with regard to ownership of gender policy Figure 5.3A.4 Staff perception with regard to gender policy (based on gender) Figure 5.3A.5 Staff perception with regard to management responsibility Figure 5.3A.6 Staff perception with regard to management (based on gender) Figure 5.3B.1 Staff perception with regard to increase representation of women Figure 5.3B.2 Staff perception with regard to representation (based on gender) Figure 5.3B.3 Staff perception with regard to recruitment and diversity Figure 5.3B.4 Staff perception with regard to recruitment and diversity (based on gender) Figure 5.3C.1 Staff perception with regard to policy, flexibility, child care and leave Figure 5.3C.2 Staff perception with regard to policy, flexibility, child care, and leave (based on Gender) Figure 5.3B.3 Staff perception with regard to job description Figure 5.3C.4 Staff perception with regard to job description (based on gender) Figure 5.3C.5 Staff perception regarding awareness, institute, team and promotion Figure 5.3C.6 Staff perception regarding awareness, institute, team and promotion (based on gender) Figure 5.3C.7 Staff perception regarding gender expertise and reward Figure 5.3D.1 Staff perception with regards to Advocacy, advice, media, and public relations Figure 5.3E.1 Staff perception regarding financial resources Table 5.3E.2 Staff perception with regard to financial resources (based on gender) Figure 5.3F.1 Staff perception with regard to behavior, harassment, and commitment Figure 5.3F.2 Staff perception with regard to behavior, harassment, and commitment (Based on gender) Figure 5.3F.3 Staff perception with regards to discussion and bias Figure 5.3F.4 Staff perception with regard to gender discussion and bias (based on gender) Figure 5.3F.5 Staff perception with regards to gap, work, image, thinking and integrity Figure 5.3F.6 Staff perception with regards to gap, work, image, thinking and integrity (Based on gender) Figure 5.3F.7 Staff perception with regards to more, culture, and meetings, past, unfairness Figure 5.3F.8 Staff perception with regards to more, culture, meetings, past, unfair(based on gender) Figure 5.4.1 Respondents’ perception with regard to an ideal worker

5
Annexes Annex 1.1: Respondents Gender profile Annex 1.2: Respondents level of education Annex 1.3: Respondent by Ministry Annex 1.4: Respondents level of education by sex Annex 1.5: Respondents position by sex Annex 1.6: Respondents level of education by Ministry Annex 1.7: Respondents Ministry by sex Annex 1.8: Political will category gender based on mean and standard deviation Annex 1.9: Technical Capacity category gender based on mean and standard deviation Annex 1.10: Accountability category gender based mean and standard deviation Annex 1.11: Organizational culture category bender based mean and standard deviation Annex 1.12: Gender Audit Respondents Profile Annex 1.13: Gender Audit Questionnaire

6
Acronyms and Abbreviations ANOVA Analysis of Variance CPA Comprehensive Peace Agreement CSOs Civil Society Organizations GA Gender Audit GAQ Gender Audit Questionnaire MOAAWNR Ministry of Agriculture, Animal Wealth, and Natural Resources MOCIYS Ministry of Culture, Information, Youth and Sports MOE Ministry of Education MOEI Ministry of Economy and Investment MOF Ministry of Finance MOLGCS Ministry of Local Government and Civil Service MORDWR Ministry of Rural Development and Water Resources MOSWWC Ministry of Social Welfare, Women and Children NCP National Congress Party SIC State Interim Constitution SPLM Sudan Peoples Liberation Movement MOUPPU Ministry of Urban Planning and Public Utilities

7
Acknowledgement This Gender Audit (GA) would not have been possible had it not been for the support of UNDP staff members at Kadugli Field Office level. To this end, we would like to extend our gratitude to those who contributed so generously to ensure that the Gender Audit was conducted on time.
We are most thankful to Mr. Charles Makunja (Governance Trainer), for his support to the team in the process of facilitating the completion of the Gender Audit Questionnaire. We would like to extend our special and sincere appreciation goes to those who took their time to complete and return the Gender Audit Questionnaire. We are also most thankful Ms. Hanan Ahmed Mohamed (Acting Director for Women Department, MOSWWC) and Mr. Hussien El Ahmed Koko (CSO Coordinator, MOSWWC) for their unreserved support in organizing the Gender Audit meetings in all the Ministries. We are also grateful to Mr. Abdalla Eltom for his excellent and professional translation of the Gender Audit Questionnaire (GAQ) into the Arabic Language and for effectively facilitating the completion of the GAQ in each Ministry. Sincere thanks also go to Mr. Usama Kabroun for providing logistical support. In compiling this report the Team has taken the necessary care to represent the views of all respondents correctly. However, any error, by commission or omission remains the responsibility of the Assessment Team. Lealem Berhanu Senior Technical Advisor-Governance Gender Audit Team Leader South Kordofan State, Kadugli July 2007

8
EXECUTIVE SUMMARY The aim of this Gender Audit was to assess and analyze the strength, policies, programmes, organization process and structures of South Kordofan Line Ministries with the view to identify where key strategic initiatives could be initiated and implemented to strengthen commitment to enhance capacities for gender mainstreaming at all levels in the public sector, especially the civil service institutions. The Gender Audit Team assessed the existence and extent of various variables that assist gender mainstreaming in the line Ministries, such as political will and leadership, an appropriate gender policy framework to support a gender mainstreaming initiative, level and sense of accountability for gender mainstreaming, technical skills to embark on gender analysis, planning, implementation and monitoring and evaluation. In collaboration with the Gender Desk of the Ministry of Social Welfare, Children and Women (MOSWCW), the Gender Audit Team conducted a staff perception Survey in which 136 (82 male and 54 female) civil servants participated drawn from nine line Ministries. Over and above, this relevant policy documents such as the Comprehensive Peace Agreement (CPA), the State Interim Constitutions (SIC), and mandates of civil service institutions were consulted during the process. The findings of this Gender Audit were presented to and shared with key staff members of Ministries to validate the results and ensure clear and collective understanding and acceptance of the results of the Gender Audit among stakeholders. The Gender Audit Team reviewed and analyzed the civil service institution’s operating environment and context. From the analysis, the Team understood that the civil service institutions are operating in an environment where there is a slow CPA implementation process, capricious political climate, absence of relevant legal, regulatory and institutional frameworks, an unclear and duplicated mandates of institutions, a slow process of disarmament, demobilization and reintegration process, slow economic development, widespread poverty, low health and educational indicators, and a high level of marginalization of women, especially in the political, leadership and decision making process and structures. The analysis of the responses of staff members either with regard to programme planning and design in line Ministries revealed that most staff members feel that the integration of gender equity in policies, programme and project is not mandated to their Ministry. The analysis shows that gender equity goals and objective are ”Not at all” included in policies, programme and project design in their Ministry. Staff also reported that line Ministries do not conduct a needs Audit that includes gender analysis in the process of policy, programme and project designs. The project proposal approval process in all Ministries does not include gender criterion. This shows that line Ministries have problems in integrating gender issues in procedures and methods used to conceptualize and design government development projects for beneficiaries. The analysis of the Programme implementation strategies revealed that most line Ministries do not include activities that strengthen the skills and provide both men and women with equal access to services and training. Existing gender roles and the interests of both men and women are not taken into consideration in the Progrmame implementation strategies. Most respondents feel that both male and female beneficiaries “do not value” and see programmes of their Ministries as beneficial to their lives. In addition, most staff members agree that their Ministry has low capacity to identify and handle gender related organizational resistances. This reveals the challenges of gender equitable public service provision at field levels. The Audit of technical capacity shed light on the challenges faced by civil service institutions in integrating gender equity. Most staff agreed that there is “no” person or division responsible or assigned for gender integration at Ministry level or department or programs and there are not technical support staff members to seek support for gender activities. Furthermore, staff members reported that line Ministries are “lacking” in necessary knowledge, skills and attitude to carry out their work in a gender sensitive manner. Most staff members feel that they have not received training in gender analysis and planning. It is also revealed that policy/programme/project planning, implementation, monitoring and evaluation teams in line Ministries “seldom” consist of members who are gender-sensitive and include a person with specific expertise and skills on gender issues. The analysis informs us that level of staff expertise in gender analysis and evaluation in most of the Ministries is very low.

9
The Team also analyzed the existence of gender sensitive monitoring and evaluation in the line Ministries. Most staff members feel that their Ministry collects gender disaggregated programme data “to a moderate extent.” However, they feel that the gender impact of programmes is “not at all” monitored and evaluated and there are no gender specific indicators for programmes and projects. Most staff members agree that gender disaggregated data provides useful Progrmame evaluation and subsequent planning and design. Furthermore, most staff members feel that they “Do not Know’ or have “No opinion” with regard to their Ministry’s policy/programmes/projects contribution to the empowerment of women and changing of unequal gender relation. Hence, the analysis reveals that most of the line Ministries has problems in incorporating gender disaggregated data and information is in the monitoring and evaluation of policies/programmes/projects. The analysis of partnership policy and procedures of the line Ministries was also conducted by the Team. Most staff members are of the opinion that commitment to gender equity is “not” a criterion in the selection of partners in any of the line Ministries. Commitment to gender equity has not been included in written agreement with partners and “no” gender training and tools provided in gender planning, analysis and evaluation to partners. Most of respondents agree that local culture (88%), low organizational priority for gender (82%) and lack of financial resources for gender programming (78%) are the main obstacles for gender integration in South Kordofan Line Ministries. The Team also made an Audit of organizational process. The Audit revealed that line Ministries have “No” gender policy and an accompanying gender action plan, and gender is not taken seriously in the process of planning yearly activities. Most staff members (57%) feel that management “rarely” takes responsibility for the development of gender policy. Furthermore, most staff members reported that there was no increase in the representation of women in senior management positions at headquarters and field levels and at committee and task forces. The Audit also revealed that there was “no” proactive strategy to recruit and promote women into senior management positions. Staff members also feel that management “rarely” shows respect for diversity in work style. Ministries have “no” flexible working arrangements and paternity, childcare and dependent care leave policies. However, maternity leave is well provided for in the civil service management policy. Staff also reported that there are ‘no” gender training opportunities for both staff and senior management. The Audit in this dimension revealed challenges for civil service institutions I developing and institutionalizing gender responsive human resources policies and gender consideration in hiring and personnel performance evaluation and reviews. The Gender Audit Team also analyzed quality and gender sensitivity advocacy, lobbying and communication activities of Line ministries. The audit revealed that advocacy, lobbying and communication activities of line Ministries are not informed of gender considerations and advised and influenced by gender networks or experts. The communication strategies of line Ministers do not include gender perspective. Ministries suffer from lack of budget for gender integration and staff gender training activities. Most staff members “do not know” whether line Ministries encourage gender sensitive behavior or not. Furthermore, staff members reported that it is not taken seriously or discussed openly. The Audit also revealed that there is a gap between how men and women view gender issues. Most staff members feel that promoting gender fits the image of their Ministry. It was also found that most staff members of both genders think their Ministries are women friendly. Staff members also feel that their Ministry should do more to institutionalize gender equity.
Finally the Team calculated the composite index for gender integration framework and found that the scores fall on the medium range suggesting an organizational openness of the line Ministries for gender integration efforts in political will (2.98), technical capacity (2.97), Accountability (3.00) and organza ional culture (3.32). All these provide South Kordofan civil service institutions with a solid foundation to incorporate gender equity in policies, programmes, projects and organizations processes and procedures.

10
CHAPTER 1: INTRODUCTION
1.1 BACKGROUND
Southern Kordofan region is located in the heart of Sudan with a diverse background of ethnic and natural resources. It falls under the administrative divisions of South and part of West Kordofan states occupying an area of about 82,000 square kilometer with an estimated population of 1.6 million. More than 80% of the population lives in the rural areas. Though the region is known for its richness and fertility, 17-years of conflict between the SPLM and GOS led to the destruction and disruption of social infrastructure and services resulting in massive displacement of people. Crippling people’s capacity to enhance their livelihood support systems, the long drawn out war has resulted in worsening of the poverty that threatened sever human insecurity in this region. The war led to low capacity of the public sector, specially in the civil service which lost most of its qualified and experienced personnel.
South Kordofan became an autonomous State as a result of the signing of the Comprehensive Peace Agreement (CPA) between the Sudan Peoples Liberation Movement/Arm and the Government of Sudan in January 2005. Following the CPA, a power sharing government was established in South Kordofan.
According to the CPA, South Kordofan implements a three-year transition period in which there will be rotation of Governorship between SPLM/A and NCP. During this transition, South Kordofan follows a parliamentary system of government, whereby the SPLM and NCP share 45% and 55% of the Legislative Council. At present, there is a shift of power from the Sudan Peoples Liberation Movement (SPLM) to the National Congress Party (NCP) where the new Governor from the NCP is appointed and SPLM is relegated to the Deputy Governor position. As a result of this development, there is the expectation that that there will be a change in the State Cabinet.
After three years of transition, a leader of the political party with a majority in the Legislative Council becomes the Governor (Wali) who, in turn, appoints Cabinet Ministers to head Ministries dealing with specific portfolios. Legislative powers are vested in the Legislative Council as per the CPA. Executive powers lie with the Wali of the Sate.
1.2. Meaning, Scope and Functions of the Civil Service in South Kordofan
The South Kordofan Civil Service is currently composed of 23 establishments (including Office of the Wali, Legislative Council, the State Judiciary, Auditor General, 10 Ministries and 9 Localities1)
In the Context of South Kordofan, the Civil Service refers to the body of officials who carry out the functions of government under the direction and supervision of the Ministry of Local Government and Civil Service. Excluded from this definition are employees of state-owned enterprises, the army, the judiciary and the police who, together with civil servants, collectively constitute the South Kordofan public sector. It is the civil service, and not the public sector, which will be the focus of this report. Within the context of South Kordofan, members of the civil service are recruited by the State Civil Service Recruitment Committee which is located in the Ministry of Local Government and Civil Service. The head of government in South Kordofan, under whom the Civil Service is directed and supervised, is the Deputy Wali who is also the Minister of Local Government and Civil Service. The total number of civil servants as of July 2007 is estimated 20,121.2
1 . Pre-CPA South Kordofan had 5 Localities. However, after the establishment of a Power sharing government, the localities were increased to
9. The term Locality is interchangeably used with County which is frequently used by Officials from former SPLM controlled areas. 2 . The Civil Service does not have gender, position, age and education disaggregated data

11
1.3 Gender context in South Kordofan State
Like many States in Sudan and many countries in Africa, the culture, tradition and values of South Kordofan society is patriarchal. It portrays women as being inferior to men. Many women are less educated, have less access to resources and live in oppressive cultures that deny them the right to participate in public life. Women also are challenged by many harmful traditional practices that are discriminatory such as domestic violence and female genital mutilation. Their health is poorer than men and they have less access to education and other basic social services which were further aggravated by the conflict that engulfed the region for 17 years. In the political decision making, there are only 8 women in the State Interim Legislative Council and, there is only one (1) woman at in the State Cabinet. The picture is dark in the civil service where there is only one (1) woman at the level of Director General out of a total civil service of 20,120.
In the economic sphere, women are responsible for at least half of the subsistence agricultural produce and their work day lasts from 15-17 hours depending on the season. Women have less access to land, credit, agricultural inputs, marketing facilities and health and agricultural extension services, advice and packages.
The Government of South Kordofan is working to improve the situation of women in the State. The State Interim Constitution ratified in December 2006 enshrines and guarantees the rights of women in social and political spheres. In addition, the constitution calls for positive discrimination (affirmative action) to promote the role of women in leadership and decision making. To this end, the government has mandated the Ministry of Social Welfare, Women and Children (MOSWWC) to establish gender equity implementation structures and process at State, Locality, and community levels. However, much work remains to be done on the implementation of the law to create a gender equitable society in South Kordofan State.
1.4 Rational and Objective of the Gender Audit
The Government of South Kordofan mandated the Ministry of Social Welfare, Women and Children (MOSWWC) to mainstream women’s and gender concerns in the planning process and all policy areas of all Ministries. The MOSWWC uses the structure and management of government machinery to facilitate the concerns of women and of gender to be taken care of in mainstream policies, programmes and projects. In order to use the structure and management of government machinery, it is important to develop and strengthen government processes to be gender responsive, and the MOSWWC specifically identifies Gender Audits as a direction for action. There have been no previous attempts to mainstream gender concerns systematically into the work of the civil service institutions in the State. The Gender Audit will contribute to strengthening government processes by indicating the status quo and where strategic initiatives can be taken up to build commitment to and strengthen capacities for gender mainstreaming. The output will also assist the MOSWWC to develop appropriate support and guidance for gender mainstreaming within the government machinery. It should be noted, however, that a gender audit alone cannot sustain effective gender mainstreaming within the civil service institution. Consultations with women and public advocacy networks and groups are parallel strategies for sustaining gender mainstreaming.
An audit is an independent, objective assurance activity designed to add value to and improve an organization’s operations. Management audits can be used to assess whether an organization’s mandate is actually followed up in reality, why tasks are performed, how well they are performed, and to what effect. In this context, a gender audit might be conducted to assess the conditions that a particular organization has created to realize gender mainstreaming, what is actually being done to achieve gender mainstreaming goals, and the perception of achievement of those involved in gender mainstreaming. These types of audits are looking at past performance based on pre-established benchmarks provided in policies or action plans, and identifying opportunities to improve

12
performance.3 Other elements have been included in some gender audits, drawn from social audit methodologies. The two major purposes of audit processes as identified by social audit methodologies in general are “a) to assess the accountability of agency work in relation to values, vision and policy and b) to improve agency performance.”4 These social audit approaches recognize the important role that attitudes of individual staff members play in taking up leadership and changing decision-making patterns in order to bring gender equality concerns into the mainstream of an organization’s operations. In this study, certain aspects of these social audit methodologies have been adopted. To this end, the objectives of the gender audit for South Kordofan Civil Service Institutions are: 1. To review and assess the current state of gender mainstreaming and the potential of public
institutions’ for incorporating gender into their policies, programmes and projects 2. To assess the range of understandings, attitudes, perceptions and reported behavior of civil
servants 3. To identify entry points for increasing gender responsiveness of the civil service institutions,
including potential links to and/or support from the MOSWWC, other central agencies, etc.
1.5 Scope of the assessment
This Gender Audit was planned to primarily focus on the ten line Ministries in South Kordofan State. However, the team discovered that the Ministry of Health was not in a position to organize the Gender Audit process due to other priority activities as a result of which only nine line Ministries were able to complete the Gender Audit Questionnaire. In addition, Ministries and public agencies at locality level were not included in the Gender Audit process as a result of logistical problems and the rainy season. Nonetheless, the assessment team believes, the result of the Gender Audit represents the perceptions of staff members regarding the status of gender equity in all public sector institutions in South Kordofan state.
1.6 Organization of the Report
The report has six chapters, each dealing with a particular aspect of the Gender Audit. The First chapter has highlighted the operating environment by providing information regarding South Kordofan State, its governance context and the profile of civil services institutions and the size of the civil service in the State. In addition, this section presented the objectives and scope of the Gender Audit.
Chapter Two presents background, meaning, and assumptions of the Gender Audit process. This section also provides Gender Integration Framework concepts for making organizations gender responsive.
Chapter Three describes the Gender Audit data collection and organizations methodologies, approaches and procedures. The section provides a description of the various tools and methods of this Audit.
Chapter Four presents data processing, organizing and presentation methods and procedure. In this regard, Univariate, Composite and Bivariate analysis methods and procedures in generating required results using SPSS are described.
Chapter Five presents the data analysis and interpretation of findings of staff perceptions on the status of gender equity in their Ministries’ in five (5) areas of Programming and six (6) areas of organizational process.
While Chapter six presents the Key findings of the Gender Audit process in five (5) areas of Programming and six (6) areas of organizational process.
Chapter Seven presents the conclusion and the way forward in enhancing the capacity of civil service institutions to effectively incorporate gender equity issues in policies, programmes and projects of line Ministries.
3 . SNV (Netherlands Development Cooperation). 2000. Manual for the Participatory Gender Audit. The Hague: SNV.
4 Hunt, J. 2000. Report on Institutionalizing Gender Equality Commitments in Development Organizations and Programs. Canberra: Winston Churchill Memorial Trust of Australia. Unpublished document.

13
CHAPTER 2 THE GENDER AUDIT PROCESS
2.1 What is gender Audit?
The importance of Gender Audits has been derived from the growing awareness of the central role of organization structure and culture in the design and delivery of policies, programmes and projects. Hence, a gender audit identifies the importance of examining not just accounts and financial transaction, but also the system and processes within institutions. Accordingly “ development can only have beneficial outcomes for women when the working culture, structure, systems and procedures and underlying values of the institution which shape women’s lives, themselves reflect a concern for gender equity.”5
Traditionally, audits have been associated with financial accounting audits. Accountants performed audits and, with their declaration of approval, certified that finances and administration were legitimate, with established rules and regulations correctly followed. In the 1980s, quality management audits were introduced in companies to promote the improvement of company performance. Quality audits in turn established whether internal arrangements were attuned to each other, and rules followed. Building on these principles, social audits have been developed in a range of community development agencies and enterprises as processes that enable organizations to measure the extent to which they live up to ‘the shared values and objectives’ to which they are committed.6
The American Council for Volunteer International Action (InterAction) and the Netherland Development Organization (SNV) are two international NGOs which have been instrumental in pioneering a methodology by which to measure such internal institutional progress. Accordingly, this assessment adopted the InterAction Gender Audit Process The Gender Audit is an assessment tool and process for organizations to use in identifying staff perceptions of how gender issues are addressed in their programming portfolio and internal organizational processes. 7 The Gender Audit is designed to gather information on the gender status in organizations in light of institutional gender commitments and plan.
2.2 Key Assumptions and outputs of a Gender Audit According to InterAction, a Gender Audit is based on the following key assumptions:
• Gender inequality is often embedded in organizations’ values, culture, processes, policies, programmes and projects
• Gender inequality in organizations often inherently favors masculinity content and working styles and disadvantages feminine content and working styles
• Organizational change in support of gender equality involves changes in women’s and men’s roles and relations
• Gender equality can enhance organizational productivity, efficiency and sustainability because gender crosscuts every sector and section within organizations
• Gender equality in organizations is achievable and positive sum in the long run The Audit provides organizations with the tools and approaches to assess the gender-responsiveness of their organizations and to develop an action plan for addressing identified weaknesses and enhancing strengths. The result of the Gender Audit provides organizations with three useful outputs:
• A reflection of the status of gender equality within the organization • A baseline for collective discussion and analysis • A participatory process that builds organizational ownership for gender equity initiatives
5 . Fenella Poreter, Ines Smyth and Caroline Weetman, eds. (1999). Gender Work: Oxfam Experience in Policy and Practice, Oxfam Publishing,
Oxford. PP. 3-4 6 Netherlands Development Organization (2004); www.caledonia.org.uk; www.cbs-network.org.uk. 7 . InterAction, Commission on the Advancement of Women (CAW), 1995.

14
2.3 Gender integration framework Concepts
In general Gender audit enhances staff understanding of how to create a gender responsive institution. InterAction consistently highlights the significance of four important elements in transforming gender blind organization into gender responsive ones:
(i) POLITICAL WILL: evidenced when top –level leadership publicly support gender
integration, effectively communicate the organization’s commitment to gender equity, commit staff time and financial resources and institute needed policies and procedures
(ii) TECHNICAL CAPACITY: evidenced in increased staff in gender analysis, adoption of new
systems for gender disaggregated data, and the development of gender sensitive tools and procedures
(iii) ACCOUNTABILITY: evidenced in institutional incentive and requirement systems that
encourage and reinforce behavior within individuals and within organizations as a whole
(iv) ORGANIZATION CULTURE: evidenced in gender-balanced staff, a gender sensitive governance structure, and the equal valuing of women and men’s working styles.

15
CHAPTER 3 DATA COLLECTION METHODOLOGY
3.1 The Gender Audit Questionnaire8
The most important tool for the proper collection of data used in this assessment is the Gender Audit Questionnaire (GAQ). The Questionnaire is designed to help organizations assess the range of understandings, attitudes, perceptions and reported behavior among staff in their own organization. In collecting data, the questionnaire focuses on the following five (5) areas of programme and six (6) areas of organizational processes: Table 3.1: Gender Audit dimensions
Programming
Organizations
Policy/programme planning and design Gender policy Policy/programme implementation Staffing Technical expertise Human Resources Monitoring and Evaluation Advocacy, Public Relations and communication Partner organizations Financial Resources Organizational culture
The Gender Audit Questionnaire is designed to solicit three types of information concerning the status of gender equity in organizations in the above areas of programming and organizational processes. The three categories of information are: (i) to what extent, (ii) to what intensity, and (iii) with what frequency. 3.1.1 to what extent Data?
Questions and statements designed to determine the extent of gender equality have the following response categories:
• To the fullest extent: means a comprehensive policy is fully implemented and
monitored, the system is very clear and effective, value and norms are widely shared and evident in action., there are well-designed training programmes regularly available for a large number of staff, and leadership champions the issue.
• To a greater extent: means policy is fully in place and reliable implemented, the system is usually effective, values and norms are widely shared, training is widely implemented, and leadership is strongly and visibly committed
• To a moderate extent: means there is a policy in place and usually implemented, the system is usually effective, values and norms are commonly expressed, training available to some staff, but leadership is clearly supportive
• To a limited extent: means there is a policy being developed or in place but not implemented, the system is some what effective, dialogue on values and norms has begun, minimum training provided, leadership is supportive but not proactive
• Not at all: means there is no policy or system in place, little awareness by staff, no training available, and no expressed commitment to gender equity by the leadership
• Do not know: means I have no knowledge of such a thing
3.1.2 To what intensity data?
Questions and statements designed to determine the intensity of gender equity have the following response categories:
8 . See Annex _______________ for the detail gender audit tool

16
• Strongly agree: very clear and strong support for the statement • Agree: Support for the statement • Disagree: Lack of support for the statement • Strongly disagree: very clear and strong lack of support for the statement • No opinion: neither support or lack of support for the statement
3.1.3 With what frequency?
Questions and statements designed to determine the frequency of gender equity have the following response categories:
• Always: Very consistent and regular practice, behaviors and implementation
policies • Frequently: Fairly reliable practices, behavior and implementation of policies • Occasionally: meaning irregular practices, behavior and implementation of
policies • Seldom: Infrequent, inconsistent practices, behaviors and implementation of policies • Never: No practice, behavior or implementation of policies
3.2 Translation of the Gender Audit Questionnaire
As the Arabic Language is the official working language of the government and most staff members have little understanding of the English Language, it was necessary to translate and test the Gender Audit Tool into the Arabic Language. To this end, the Questionnaire was translated and administered in Arabic in respondents’ meetings in each Ministry with the help of a facilitator and on-the-spot clarification of issues. The in-house facilitation of the filling of the Questionnaires helped to receive and collect questionnaires immediately and on time.
3.3 Document Review
The Assessment Team (AT), reviewed available agency documents in each Ministry. In this regard, organizational mandates, mission, objectives and structures, human resources profile, etc, were collected, analyzed and discussed. The available documents helped the team to better understand the gender mandate and operating environment of local government agencies in South Kordofan.
3.4 Sampling method and sample size
Basically there are two ways of selecting a sample: Random and non-random. Random sampling is a selection based on chance. All units have equal chances or probability. Non-random sampling is any form of selection based completely or partially on the judgment of the assessment team. While non-random sampling has many methods, for the purpose of this assessment, the team used Purposive Sampling.9 A discussion was conducted the Ministry of Social Welfare, Women and Children (MOSWWC), regarding the method and sample size. Hence, the following was agreed in determining the sample method and size: (i) All (ten) Line Ministries based in Kadugli will be included in the present study. (ii) 10-15 staff members in each Ministry will complete the Gender Audit Questionnaire (iii) Staff members selected should represent the three levels of the organizing (Top, Middle and
lower levels) (iv) To the extent possible both sexes should be represented equally
Based on these sampling methods/criteria, 9 Ministries fully participated in the Gender Audit process. It was difficult to engage the staff of the Ministry of Health in the process as they were engaged other priority activities. 136 staff members of Ministers filled and returned the questionnaire.
9 . In purposive sampling the Assessment Team chooses based on its own judgment and interest exactly who will be part of the sample. However, in
this assessment, respondents were selected by Director Generals of each Ministry..

17
CHAPTER 4 DATA PROCESSING, ORAGANIZING AND PRESANETATION
4.1 Data Processing tools and procedure Once the staff responses for the questionnaire were collected, the questionnaire was organized; coded and 106 variables (including 7 demographic) were entered in the Statistical package for Social Sciences (SPSS). The process required the translation of the data from Arabic responses to English which was done by a professional translator. Using SPSS three types of analysis on the data collected from the Questionnaire was conducted. 4.1.1 Univariate Analysis Univariate analysis explores each variable in a data set, separately. It looks at the range of values, as well as the central tendency of the values. It describes the pattern of response to the variable. Descriptive statistics describe and summarize data. Univariate descriptive statistics describe individual variables. In other words, the Univariate analysis focuses on the Reponses of a single question at a time. Univariate (one variable) analysis helps to describe the range and the average answer respondents provide for to each question by constructing a frequency distribution (table of count) of the data for the variable. This is done by identifying the lowest and highest values of the variable, and then putting all the values of the variable in order from lowest to highest. It also helps to group data into classes and calculate cumulative frequency distributions using percentage distributions and cumulative percentages. Since the Gender Questionnaire response categories are ordinal, the response category with the most response represents the average answer. Hence, depending on the variables and the need for clarifying results, the assessment uses SPSS to generate Univariate Analysis for the various Gender Audit variables. Bar and pie charts are indispensable for presenting Univariate analysis results.
4.1.2 Composite Analysis
The composite measure analysis is an index made up on the respondents provide on multiple questions that represent various indicators of a single concept like one of the dimensions of programming or organizations. In developing a composite score, a scale 1-5/6 (1 being low and 5/6 being high) was defined for the selected dimensions. In creating the composite measure or index this assessment followed a three step process. First the assessment team identified and reviews the question that make up the concept or dimensions that need to be measured. In this case, composite measure for the five (5) programming dimension and six (6) organizational dimensions as suggested by InterAction was adopted. Second the average and/or the total score for each question was calculated based on the scores given by each respondent to the question for the selected dimension. The result is the composite total and/or average measure for each dimension/question. Third, we added the total and/or average for each dimension and divided the total/average sum by the total numbers of respondents10 and/or the number of questions for the selected dimension. The table below shows the composite scores for the four (4) Gender Integration Frameworks: Table: 4.1 Gender integration Framework Concepts
Gender Integration Frameworks Questions to include in composite Measure/Index Political will Mandate, goals, criteria, policy, plan, strategy, own, mange,
senior, field, force, recruit, budget 1-3 Technical capacity All questions in the technical expertise sub-section of the
questionnaire Accountability Data, impact, sector, design, power, job 1-2 Organizational Culture All questions in the organizational culture sub-section of he
questionnaire
10 . In this Gender Audit 136 respondents participated. Each respondent provided an answer to each question. If there are 136
respondents and 10 questions in a given category, then thee are 1360 (10 x 136) “respondents!” We divide the total sum of the scores for al selected dimension to this number of “respondents!”

18
4.1.3 Bivariate Analysis
Bivariate Analysis is the examination of two variables at the same time, hence the name bivariate. It is used frequently to compare how two variables correspond with one another. Although it can be used any time we have to have two variables that we want to examine at the same time, bivariate analysis is a good tool to use when we have a hunch that two variables "go together."
Conducting Bivariate Analysis opens the possibility of exploring cause and effect on two variables at a time. In this Gender Audit, of particular interest for conducting a Bivariate Analysis was the need to understand the difference in female and male staff responses to the Gender Audit questions. As the response categories for the questions are ordinal, cross tabulation of the answer to the questions in the Progrmame and organization sections with the answers to the questions in the demographic sections of the Questionnaire was made. This analysis allows of patterns that emerge which try to answer the question “does knowing a respondent’s sex, position, age, education or location of work help to better predict their responses to the questions in the Programme and organization sections.
Furthermore, the measure of association (the contingency coefficient) was calculated. The measure of association indicates the extent and strength of the relationship between the demographic factors and the responses to the programming and organization questions. The test of statistical significance lets us know to what extent the result found in the cross-tabulations could have occurred simply by chance or is systematic (meaning differences in the answers are related to differences in demographic factors such as whether one is male or female, in the field or at headquarters, etc.) In addition, Correlation (Spearman’s RHO11) was calculated for the composite measures particularly in the four (4) concepts in the gender integration framework. The correlation analysis helps to identify the strength of the relationship between political will, organizational culture, technical capacity and accountability. Contingency Tables are used in the presentation of the Bivariate Analysis results.
4.1.4 Narrative Responses
Narrative responses were collected and reviewed to obtain a sense of respondents’ range of answers. Common and top responses for the “characteristics of a good worker” and were tallied and presented. Responses to this question were grouped into the four concepts of Gender Integration Framework presented earlier.
4.1.5 Presentation of Gender Audit Results
After the completion of the analysis of the Gender Audit Questionnaire, a Validation and planning workshop was organized to validate the results of the Audit. The validation and planning workshop allowed provide staff of Ministries to critically review, explore, summarize and display the findings and trends of the Gender Audit Questionnaire results in depth and in a user-friendly manner. The review provided the basis for action planning in support of organizational gender equity initiatives.
11 . Spearman’s rho is a measure of linear relationship between to two variables. It measures the degree of correlation between two variables.

19
CHAPTER 5 DATA ANALYSIS AND INTERPRETATION OF FINDINGS 5.1 RESPONDENTS DEMOGRAPHIC PROFILE12 5.1.1 Respondents’ Sex
The Gender Audit Questionnaire was completed by 136 (82 male and 54 female) respondents. All the respondents were from the Headquarters of the Ministries audited. The following chart depicts the sex distribution of the respondents:
Figure 5.1.1 Respondents characteristics by sex
5.1.2 Respondents’ Education level Figure 5.1.2 Respondents Characteristics by Education
12 . For detail please see Annexed tables
Respondents Sex
(% distribution)
39.7%
60.3%
w omen
man
Respondents' Education level
(% distribution)
5.1%
69.1%
22.1%
2.2%
1.5%
post-graduate
univerity
secondary
Intermediate
primary

20
5.1.3 Respondents’ Position
Figure 5.3 Respondents Characteristics by position
5.1.4 Respondent Ministry Figure 5.4 Respondents Characteristics by Ministry 5.1.5 Respondent Age
Figure 5.5 Respondents Characteristics by age group
Respondent position
(% distribution)
5.9%
10.3%
20.6%
22.8%
16.9%
23.5%
other
support
admin/f inance
Programme
Management team
senior civil servant
Respondent Ministry
(% distribution)
12.5%
10.3%
11.8%
11.8%
11.8%
9.6%
11.0%
11.0%
10.3%
moei
mof
mordw r
mosw w c
mociys
moaaw nr
mouppu
molgcs
moe
Respondent Age Brackets (% distribution)
20-3034%
31-4032%
41-5019%
51-6015%
20-3031-4041-5051-60

21
5.2 ANALYSIS OF STAFF PERCEPTION OF GENDER EQUITY IN PROGRAMME DIMENSIONS
5.2.1 Programme Planning and Design in the Ministry The Programme planning and Design section of the Gender Audit consisted of six questions. The type of perception information sought in this dimension was “the extent to which gender sensitive institutional procedures and methods are used to conceptualize and design policies/programmes/projects in Ministries.” A. Programme Planning and Design This section of the Gender Audit mainly attempts to identify staff perception with regard to procedures and methods used to conceptualize and design government development projects for beneficiaries. The findings in the area are summarized below.
As can be seen from figure 5.2A.1 below, 36% of the respondents agreed that the integration of gender was “Not at all” the mandate to their Ministry. If we add those who responded “I do not know”, nearly 51% of the civil servants reported that gender integration was is not in their mandate. Only 10% of the respondents agreed to “the fullest extent” that gender integration is of mandate in their Ministry. Figure 5.A.1 also depicts that 31% and 36% of the respondents reported that the integration of gender equity goals in policy, programme and project design and conducting gender needs assessment is “not at all” conducted in their Ministries respectively. In terms of gender, 21% of the male and 15% of the female respondents reported that the integration of gender equity is not mandated in their Ministries. 24% male and 13% of the female reported “not at all” that gender equity goals and objective are included in policies, programmes and projects and the same percentage of male and female are of the same opinion regarding gender needs assessment.
Figure 5.2A.1 Staff perception with regard to mandate, goal and needs
Figure 5.2A..2 below shows that 27% , 35% and 32% of the respondents reported that best practices, gender criteria, participatory methods are “Not at all” incorporated or integrate in the policies, programmes and projects of their Ministries respectively. However, 11%, 8.1% and 12% reported that these elements are incorporated to “the fullest extent. In term of gender, 15% of the male and 7% of the female participants reported that they “Do not know” whether best practices are integrated or not. 16% male and 11% female respondents reported “Not at all.” Only 7% of the male and 4% of the female respondents agree that this is done to “the fullest extent.” Regarding the integration of gender taken as a criteria for project approval process, 20% of male and 15% of female respondents reported that they “Do not know” this practice. Only 7% of the male and 2% of the female reported that this is done ‘to the fullest extent.” 19% 0f the male and 13% of the female respondents reported that participatory methods are “Not at all” incorporated in their Ministries policy programme and project designs.
1. Is the integration of gender
equity in policies/programmes/projects mandated in your Ministry?
2. Are gender equity goals and objectives included in policies/programme/project design?
3. For Each policy/programme/project, is there a needs assessment, including an analysis of gender role and responsibilities in the beneficiary community?
I do not knowNot at allTo a limited extentto a moderate extentto a greater extentto the fullest extent
mandate goal needs0.0%
10.0%
20.0%
30.0%

22
Figure 5.2A.2 Staff perception regarding best Practices, criteria and methods
B. Programme Implementation in the Ministry
This section of the Gender Audit attempts to assess staff perception with regard to how government services/projects operate in the field. The findings in this area are summarized below.
Figure 5.2B.1 Staff perception with regard to Access to service and training
Figure 5.2B.1 above shows that 27%, 32% and 23% of the respondents reported that the Ministries’ policies, programmes and project implementation “Not at all” provides women and men with access to services and training and implementation plans and strategies do not take into account existing gender roles and interests respectively. 65% of male and female participants reported that this is done “to the fullest extent.” In terms of gender, 10% of male and 4% of female participants reported access to service and training is done by their Ministries “to a greater extent.” However, 17% male and 10% female respondents stated that this is “Not at all” the reality in their Ministries.
Figure 5.2B.2 below shows that 30% and 32% of the respondents reported that they “Disagree” that both male and female beneficiaries value and see their Ministries’ programmes, policies and projects as beneficiaries to their live. However, 20% and 18% of respondents “strongly agree” both male and female beneficiaries value and see their Ministries’ programmes, policies and projects as beneficial to their live.
1. Are best practices in gender
integration in programming incorporated in subsequent polices/programme/project design?
2. Are gender questions or criterion included in your policies/ programme/project proposal approval process?
3. Does your Ministry use participatory methods to incorporate the views and preferences of both male and female beneficiaries in policies/Progrmame/project design?
I do not knowNot at allTo a lim ited extentto a moderate extentto a greater extentto the fulles t extent
access1 access2 access30.0%
10.0%
20.0%
30.0%1. Does your Ministry’s
policies/programme/project implementation plan include activities that strengthen skills and provide men with equal access to services and training?
2. Does your Ministry’s policies/programme/project implementation plan include activities that strengthen skills and provide women with equal access to services and training?
3. Do your Ministry’s service provision implementation and strategies take into account existing gender roles and interests of both male and female employees?
I do not knowNot at allTo a limited extentto a moderate extentto a greater extentto the fullest extent
best criteria methods0.0%
10.0%
20.0%
30.0%

23
Figure 5.2B.2 Staff perception with regard to values
Figure 5.2B.3 depicts the that, 34% of male reported that they “Disagree” that both male and female beneficiaries value and see their Ministries’ programmes, policies and projects as beneficial to their lives for both access 1 and 2 question. Furthermore, 26% of the female respondents “Disagree” that female beneficial value and see their Ministries’ programmes, policies and projects as beneficiaries to their lives. 33% female respondents also reported that they “Disagree” that male beneficiaries value and see their Ministries’ programmes, policies and projects as beneficial to their live.
Figure 5.2B.3 Staff perception with regard to value (based on gender)
1. Female beneficiaries of my Ministry’s policies/programmes/projects value and see our policies/programmes/projects as beneficial to their lives?
2. Male beneficiaries of my Ministry’s policies/programmes/projects value and see our policies/programmes/projects as beneficial to their lives?
Strongly disagreeDisagreeno opinionAgreeStrongly agree
man value1 man value2 women value1 women value20.0%
10.0%
20.0%
30.0%
Strongly disagreeDis agreeno opinionAgreeStrongly agree
value1 value20.0%
10.0%
20.0%
30.0%
1. Female beneficiaries of my Ministry’s policies/programmes/projects value and see our policies/programmes/projects as beneficial to their lives?
2. Male beneficiaries of my Ministry’s policies/programmes/projects value and see our policies/programmes/projects as beneficial to their lives?
24
Figure 5.2B.4 Staff perception with regard to resistance
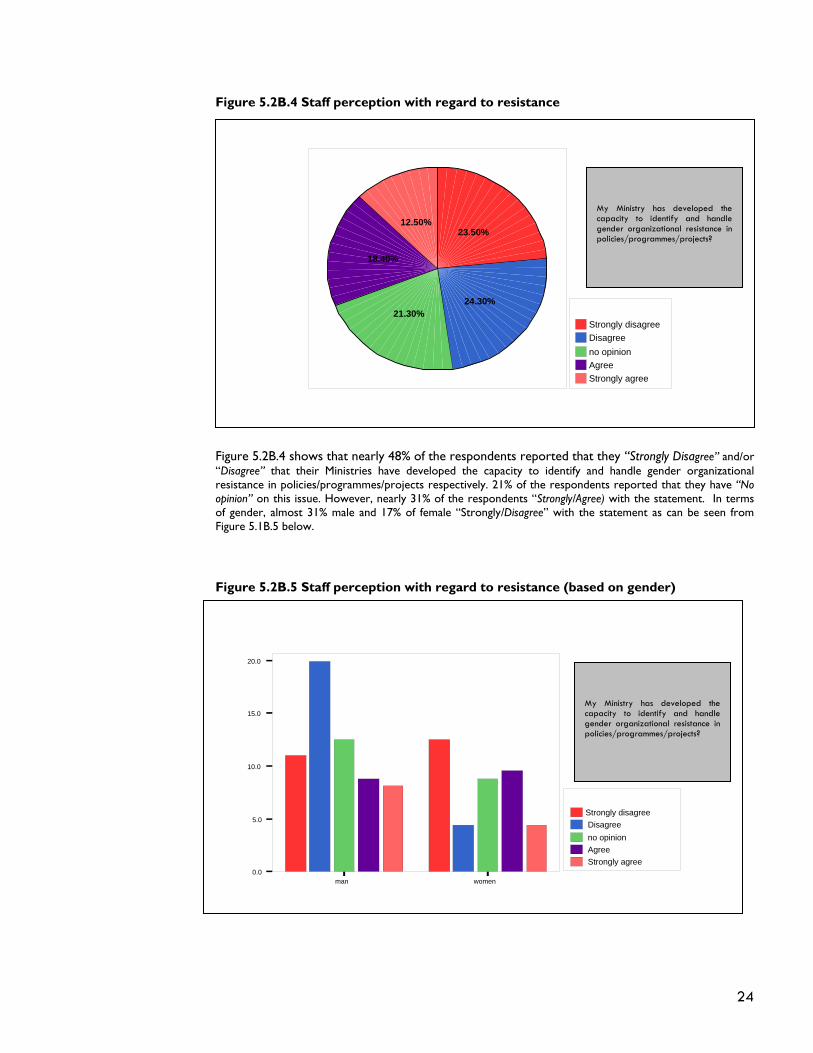
Figure 5.2B.4 shows that nearly 48% of the respondents reported that they “Strongly Disagree” and/or “Disagree” that their Ministries have developed the capacity to identify and handle gender organizational resistance in policies/programmes/projects respectively. 21% of the respondents reported that they have “No opinion” on this issue. However, nearly 31% of the respondents “Strongly/Agree) with the statement. In terms of gender, almost 31% male and 17% of female “Strongly/Disagree” with the statement as can be seen from Figure 5.1B.5 below.
Figure 5.2B.5 Staff perception with regard to resistance (based on gender)
My Ministry has developed the capacity to identify and handle gender organizational resistance in policies/programmes/projects?
Strongly disagreeDisagreeno opinionAgreeStrongly agree
23.50%
24.30%21.30%
18.40%
12.50%
Strongly disagree Disagree no opinion Agree Strongly agree
man women0.0
5.0
10.0
15.0
20.0
My Ministry has developed the capacity to identify and handle gender organizational resistance in policies/programmes/projects?

25
C. Technical Capacity in the Ministry
This section of the Gender Audit attempts to analyze respondents’ perception with regard to the level of staff expertise in gender analysis and evaluation in line Ministries. The findings in this area are summarized below. Figure 5.2C.1 shows that 43% of the staff reported that their Ministry “Not at all” have a person or division responsible for gender. 27% reported that there is “Not at all” assigned staff responsible for gender integration in different departments/programmes and 22% reported that their Ministry “Not at all” constantly seeks technical support from a person or division within the organization who is responsible for gender programming. Only 6% for division, 10% staff 1 and 7% for staff 2 reported that their Ministries have these elements “to the fullest extent.”
Figure 5.2C.1 Staff perception with regard to availability of division and staff
Figure 5.2C.2 below shows that 39% and 31% of the respondents reported that their Ministries “Not at all” have the necessary knowledge, skills and attitude to carry out their work with gender awareness, staff members of their Ministry received training in gender planning and analysis, and policy/programme/project planning, implementation, monitoring and evaluation teams consist of members who are gender-sensitive and include at least one person with specific expertise and skills on gender issues respectively. Only 9% (skills) and 7% (training) of the respondents reported that they have these elements “to the fullest extent”
Figure 5.2C.2 Staff perception with regard to skills, training and experts
1. Is there a person or division responsible for gender in your Ministry?
2. Is there assigned staff responsible for gender integration in different departments/programmes?
3. Does your Ministry constantly seek technical support from a person or division within the organization who is responsible for gender programming?
1. Does your Ministry have the necessary knowledge, skills and attitude to carry out their work with gender awareness?
2. Have staff members of your Ministry received training in gender planning and analysis?
I do not knowNot at allTo a lim ited extentto a moderate extentto a greater extentto the fulles t extent
division staff1 staff2
10.0%
20.0%
30.0%
40.0%
I do not knowNot at allTo a lim ited extentto a moderate extentto a greater extentto the fulles t extent
skil l s train expert
10.00
20.00
30.00
40.00

26
Figure 5.2C.3 Staff perception with regard to Expertise
Figure 5.2C.3 above depicts that 66% of respondents reported that their Ministry policy/Programme/project planning, implementation, monitoring and evaluation teams “Never/Seldom” consist of members who are gender-sensitive and include at least one person with specific expertise and skills on gender issues. Approximately 12% reported that it is the case “always.” In terms of gender, 31% of male and 25% of female respondents reported “Never” and “Seldom” respectively to the statement as shown in Figure 5.2C.4 below..
Figure 5.2C.4 Staff perception with regard to of expertise (based on gender)
Policy/Programme/project planning, implementation, monitoring and evaluation teams in my Ministry consist of members who are gender-sensitive and include at least one person with specific expertise and skills on gender issues?
neverseldomoccassionallyFrequentlyAlways
19.08%
47.05%
8.09%
13.99%
11.79%
expert neverexpert seldomexpert occassionallyexpert Frequentlyexpert Always
man women
5.0
10.0
15.0
20.0
25.0Policy/Programme/project planning, implementation, monitoring and evaluation teams in my Ministry consist of members who are gender-sensitive and include at least one person with specific expertise and skills on gender issues?

27
D. Monitoring and Evaluation
This section of the Gender Audit attempts to analyze perception of respondents in terms of the extent to which gender disaggregated data and information is incorporated in the monitoring and evaluation of policies/programmes/projects in line Ministries. The findings in this area are summarized below.
Figure 5.2D.1 Staff perception with regard to data, impact and sector
Figure 5.2D.1 above shows that 21% the respondents reported that their Ministry “Not at all” collected gender disaggregated data for policies/programmes/project. 35% reported that the gender impact of policies/programmes/projects “not at all” monitored. Besides, 37% reported that the Ministry “not at all” has gender specific indicators for policies/programme/projects. However, 12%, (data), 8% (impact) and 7% (sector) respondents agree that this is happening “to the fullest extent.” In terms of gender, and equal number of men and women 6% of both sexes reported that gender disaggregated data is collected and they agree “to the fullest extent” 28% of male and 20% of female respondents agree that their Ministries do “Not at all” or they “Do not Know” whether their Ministries monitor the gender impact of policies, programmes or projects. 33% of the male and 23% of the female respondents “Do Not know” whether their Ministries have sector specific gender indicators or not or this is “Not at all” happening.
Figure 5.2D.2 below shows that nearly 45% of respondents “Strongly/agree” that gender disaggregated data provides useful information for policies/programme/project evaluation and subsequent programme/project design. However, 36% and 39% of the respondents ether “Disagree” or have “No opinion” regarding the extent to which their Ministry’s policy/programmes/projects contribute to the empowerment of women and changing of unequal gender relations. 46% of the male and 29% of the female also “strongly/disagree” that their Ministry’s policy/programmes/projects contribute to the empowerment of women and changing of unequal gender relations.
Figure 5.2D.2 Staff perception with regard to design and power
1. Is gender disaggregated data colleted for policies/programmes/project run by your Ministry?
2. Is the gender impact of policies/programmes/projects of your Ministry monitored and evaluated?
3. Does your Ministry have sector gender specific indicators for policies/programme/projects?
Strongly disagreeDisagreeno opinionAgreeStrongly agree
design power
10.0%
20.0%
30.0%
40.0%
1. Does gender disaggregated data provides useful information for policies/programme/project evaluation and subsequent programme/project design?
2. Do my Ministry’s policy/programmes/projects contribute to the empowerment of women and changing of unequal gender relations?
I do not knowNot at allTo a limited extentto a moderate extentto a greater extentto the fullest extent
data impact sector0.0%
10.0%
20.0%
30.0%

28
Figure 5.2D.3 Staff perception with regard to power (based on gender)
Figure 5.2D.3 above shows the gender dimension of the responses to the empowerment of women. In this regard, 46% of the male and 19% of the female participants either “Disagree” or have “No opinion” to what extent their Ministry’s policy/programmes/projects contribute to the empowerment of women and changing of unequal gender relations. Only 3% of the male and 2% of the female agree that it is “to the fullest extent.”
Figure 5.2D.4 Staff perception with regard to gender Equality
As can bee seen from the Figure 5.2D.4, more that 53-74% of the respondents reported that their Ministry’s policies/programmes/projects contribute to increased gender equity and policies/programmes/projects collect gender disaggregated data in the areas mentioned from equity 1-17. Table 5.2D.1 below shows detail regarding the distribution of respondents’ responses. However, from 21-36% of respondents reported that there is “No” contribution and 5-13% reported that they “Do not know.”
I do not knowNoyes
equity1equity2
equity3
equiyt4equity5
equity6
equity7equity8
equity9
equity10equity11
equity12
equity13equity14
equity15
equity16equity17
0.0%
25.0%
50.0%
75.0%
Strongly disagreeDisagreeno opinionAgreeStrongly agree
m an wom en0.0
5.0
10.0
15.0
20.0 Do my Ministry’s policy, programmes and projects contribute to the empowerment of women and changing of unequal gender relations?

29
Table 5.2D.1 Staff perception with regard to increased gender equity gender
disaggregated data
My Ministry’s policies/programmes/projects contribute to increased gender equity in the following areas:
Areas Yes No I Do not
Know Equity 1 Material well being 66.9% 23.5% 9.6%
Equity 2 Access resources 52.9% 33.8% 13.2% Equity 3 Access to training 66.2% 23.5% 10.3% Equity 4 Participation in decision-making 73.5% 21.3% 6.2% Equity 5 Self-respect/legal status 62.5% 30.9% 6.6% Equity 6 Control over benefits 60.3% 32.4% 7.4% Equity 7 Control over resources 58.8% 32.4% 8.8% Equity 8 Participation in the public sphere 55.9% 33.1% 11%
My Ministry’s policies/programmes/projects collect gender disaggregated data in the following areas: Equity 9 Material well being 64.0% 27.2% 8.8%
Equity 10 Access resources 65.4% 27.9% 6.6% Equity 11 Access to training 61.8% 30.1% 8.1% Equity 12 Participation in decision-making 58.1% 35.3% 6.6% Equity 13 Self-respect/legal status 68.4% 25% 6.6% Equity 14 Control over benefits 63.2% 32.4% 4.4% Equity 15 Control over resources 61.8% 27.9% 10.3% Equity 16 Participation in the public sphere 64.7% 30.1% 5.1% Equity 17 Beneficiaries view of the programme 53.7% 36% 10.3%
E. Partner Organization
This section attempts to analyze respondents perception with regard to the level of gender integration in line Ministry’s relations with partners. The findings are summarized below.
Figure 5.2E.1 Staff perception with regard to selection of partners
I do not knowNot at allTo a limited extentto a moderate extentto a greater extentto the fullest extent
partners local tools0.0%
10.0%
20.0%
30.0%
1. Is commitment to gender equity a
criteria for your Ministry’s selection of partners?
2. Is commitment to gender equity included in written agreements outlining your Ministry’s relationship with partners?
3. Does your Ministry provide training and tools on gender planning, analysis and evaluation to its partners?

30
As can be seen from Figure 5.2E.1 above 27% of the respondents feel that commitment to gender equity is “Not at all” a criterion for selection of partners. 22% reported that commitment to gender equity is “Not at all” included in written agreements outlining their relationship with partner. 32% reported that their Ministry “Not at all” provides training and tools on gender planning, analysis and evaluation to its partners. However, 27%, 32% and 11% respondents reported these are taken care of by their Ministry “to the greater/fullest extent.” In terms of gender, there no major difference was noticed.
Table 5.2E.1 below shows that local culture (88.2%), low organizational priority for gender (82%), Lack of financial Lack of financial resources for gender programming (78%), lack of staff training in gender (76%) , staff size of the Ministry (71%), lack gender analysis tools (70%), office culture and environment (68%), Ministry size (67%), lack of support from senior management (66%) are the main obstacles to incorporating gender analysis in policies/programme/project planning, implementation, monitoring and evaluation in South Kordofan Ministries as ranked by the respondents. All respondents 91100) reported that there are no other obstacles.
Table 5.2E.1 Staff perception with regard to obstacles for gender integration
What are some of the obstacles to incorporating gender analysis in policies/programme/project planning, implementation, monitoring and evaluation in your Ministry?
Areas
Yes
No I Do not
Know Obstacle 1 Organizational size 66.9% 16.9% 16.2% Obstacle 2 staff size 70.6% 13.2% 16.2% Obstacle 3 office culture/environment 67.6% 15.4% 16.9% Obstacle 4 local culture 88.2% 6.6% 5.1% Obstacle 5 Lack of financial resources for gender programming 77.9% 10.3% 11.8% Obstacle 6 lack of staff training on gender 75.7% 12.5% 11.8% Obstacle 7 Lack of gender analysis tools 69.9% 16.2% 14.0% Obstacle 8 lack of support from senior management 66.2% 18.4% 15.4% Obstacle 9 low organizational priority for gender 82.4% 7.4% 10.3% Obstacle 10 - 100% -
Figure 5.2E.2 Staff perception with regard to obstacles for gender integration
NoyesI do not know
obst1 %obst2 %
obst3 %obst4 %
obst5 %obst6 %
obst7 %opst8 %
obst9 %obst10 %
0.00
25.00
50.00
75.00
100.00
What are some of the obstacles to incorporating gender analysis in policies/programme/project planning, implementation, monitoring and evaluation in your Ministry?

31
5.3 ANALYSIS OF STAFF PERCEPTION OF GENDER EQUITY ORGANIZATION PROCESSES
A. Gender Policy
This section of the Gender Audit attempts to analyze and summarize respondents’ perception with regard to the nature, quality, extent and intensity of support for the Ministry’s gender policy or activities.
Figure 5.3A.1 Staff perception with regard to gender policy
Figure 5.3A.1 shows that 46% of the respondents reported that either they “Do not know” or “Not at all” agree that their Ministries have a written gender policy that affirms a commitment to gender equity. However 22% reported “to a greater/fullest extent” that they have written gender policy. 31% reported that there is “Not at all” operational plan that includes clear allocation of responsibilities and time for monitoring and evaluation and 25% also reported that gender is “Not at all” taken into account during strategic planning process in their Ministries respectively. In terms of gender, 29-31% of both sexes reported that there is “Not at all” a written policy, operational plans and the inclusion of gender in strategic plans as can be seen from Figure 5.2A.2 below.
Figure 5.3A.2 Staff perception with regard to gender policy (based on gender)
1. Does your Ministry have a written gender policy that affirms a commitment to gender equity?
2. Does your Ministry’s gender policy have an operational plan that includes clear allocation of responsibilities and time for monitoring and evaluation?
3. Is gender taken into account during strategic planning process for your Ministry?
I do not knowNot at allTo a lim ited extentto a moderate extentto a greater extentto the fulles t extent
pol icy plan stra tegy0.0%
10.0%
20.0%
30.0%
I do not knowNot at allTo a lim ited extentto a moderate extentto a greater extentto the fulles t extent
m an po l icym an plan
m an stra tegywom en pol icy
wom en p lanwom en stra tegy
0.0%
10.0%
20.0%
30.0%
4. Does your Ministry have a written gender policy that affirms a commitment to gender equity?
5. Does your Ministry’s gender policy have an operational plan that includes clear allocation of responsibilities and time for monitoring and evaluation?
6. Is gender taken into account during strategic planning process for your Ministry?

32
Figure 5.3A.3 Staff perception with regard to ownership of the gender policy
As can be seen from Figure 5.3A.3 above, 62% of the respondents “Strongly/disagree” that everyone in their Ministry feels they have ownership of the gender policy. However, 7% reported that they “Strongly agree” that everyone in their Ministry feels they have ownership of the gender policy even if there is no gender policy. In terms of gender more men (29%) “Disagree” than women (21%). An equal number of both sexes (7%) reported that they “Agree” everyone in their Ministry feels ownership of the gender policy,> However, while 6% of male respondents “Strongly agree” in comparison to 0 .7% of female respondents.
Figure 5.3A.4 Staff perception with regard to gender policy (based on gender)
Strongly disagreeDisagreeno opinionAgreeStrongly agree
14.70%
49.30%
16.20%
13.20%
6.60% Everyone in my Ministry feels they have ownership of the gender policy.
Strongly disagreeDisagreeopinionAgreeStrongly agree
man women
5.0
10.0
15.0
20.0
25.0 Everyone in my Ministry feels ownership of thgender policy.

33
Figure 5.3A.5 Staff perception with regard to management responsibility
Table 5.3A.5 above depicts that 57% of the respondents reported that management “Seldom” takes responsibility for the development and implementation of gender policy. 15% reported that this “Never” happen in their Ministry. 12% reported “Occasionally” and 11% reported “Frequently.” As can also be seen from Figure 5.2A.5, only 5% reported that management “Always” takes responsibility for the development and implementation of gender policy. In terms of gender, 36% of the male and 21% of the female respondents reported that management “Seldom” takes responsibility for the development and implementation of gender policy. 5% of the male and 2% of the female respondents agree that management “Always” takes responsibility for the development and implementation of gender policy as can be seen from Figure 5.2A.6 below.
Figure 5.3A.6 Staff perception with regard to management (based on gender)
neverseldom occassionally Frequently Always
man women0.0
10.0
20.0
30.0
Management takes responsibility for the development and implementation of gender policy
neverseldomoccass ionallyFrequentlyAlways
14.70%
57.40%
11.80%
11.00%
5.10%
Management takes responsibility for the development and implementation of gender policy

34
B. Staffing
This section of the gender Audit attempts to analyze civil servants perception with regard to the gender composition of staff in line Ministries. The findings are summarized below.
Figure 5.3B.1 Staff perception with regard to increase representation of women
As can be seen from Figure 5.3B.1 above 19% of respondents reported that they “Do not know” or whether there was an increase in the representation of women in senior management positions in the past few years at the head office of the Ministry. 28% reported that this is “Not at all” happening in their Ministry. 19% agree that this is happening “to a limited extent.” Near 18% reported that this is happening “to the greatest/fullest extent.” 54% reported that either they “Do not know” or there was “Not at all” an increase in the representation of women in senior management positions in their Ministry’s field locations in the past few years. 39% reported that either they “Do not know” or the witnessed “Not at all” an increase in the representation of women in their Ministry’s committees, task forces, etc. In terms of gender, 28%, 42% and 35% of the male respondents reported that women are “Not at all” represented in senior management, field levels and task forces respectively. For the same question, 28%, 41% and 32%f female respondents reported “Not at all” as can be seen from Figure 5.3B.2 below.
Figure 5.3B.2 Staff perception with regard to representation (based on gender)
I do not knowNot at allTo a lim ited extentto a moderate extentto a greater extentto the fulles t extent
senior field force
10.0%
20.0%
30.0%
40.0%
1. Has there been an increase in the representation of women in senior management positions in the past few years at the head office of your Ministry?
2. In your Ministry’s Field locations, has there been an increase in the representation of women in senior management positions in the past few years?
3. Has there been an increase in the representation of women in your Ministry’s committees, task forces, etc?
I do not knowNot at allTo a limited extentto a moderate extentto a greater extentto the fullest extent
man seniorman field
man forcewomen senior
women fieldwomen force
10.0%
20.0%
30.0%
40.0%

35
Figure 5.3B.3 Staff perception with regard to recruitment and diversity
Figure 5.3B.3 above depicts that 17% respondents reported that they “Do not know” the implementation of proactive strategies to recruit and promote women into senior management positions. 35% reported that proactive strategies were “Not at all” implemented to recruit and promote women into senior management positions. 31% reported that this is implemented “to moderate/greater extent.” 9% reported that this is implemented “to the fullest extent.” Regarding respect to diversity, 32% reported that management “Not at all” show respect for diversity in work and management style between women and men in their Ministry. 15% reported that they “Do not know” such a practice in their Ministry. Nearly 32% reported that management “to a limited/moderate extent” show respect for diversity in work and management style between women and men in their Ministry. 9% reported that this is observed “to the fullest extent.”
Figure 5.3B.4 Staff perception with regard to recruitment and diversity (based on gender)
I do not knowNot at allTo a limited extentto a moderate extentto a greater extentto the fullest extent
recrut diverse0.0%
10.0%
20.0%
30.0%
1. Are there proactive strategies implemented to recruit and promote women into senior management positions?
2. Does management show respect for diversity in work and management style between women and men in your Ministry?
I do not knowNot at allTo a limited extentto a moderate extentto a greater extentto the fullest extent
man recrut man diverse women recrut women diverse0.0%
10.0%
20.0%
30.0%

36
Figure 5.3B.4 above shows that 19% and 34% male respondents reported that they “Do not know” and “Not at all” regarding the implementation of proactive strategies to recruit and promote women into senior management positions. 13% and 37% of the female reported that they “Do not know” and “Not at all” regarding the implementation of proactive strategies to recruit and promote women into senior management positions. 20% of male respondents and 33% of female respondents reported that this is happening “to a moderate/limited extent.” 53% of male and 39% of female respondents reported “Do not know” or “Not at all” regarding management showing respect for diversity in work and management style between women and men in their Ministry.
C. Human Resources
This section of the Gender Audit attempts to analyze perception of respondents with regard to the level, extents and intensity of gender sensitive human resources policies, family friendly policies, and organizational consideration in hiring and personnel performance evaluation and reviews. The findings are summarized below.
Figure 5.3C.1 Staff perception with regard to policy, flexibility, child care and leave
As can be seen from figure 5.3C.1 above, 18% respondents reported that they “Do not know” of the existence of written equal employment opportunity policy in their Ministry. 35% agree that their Ministry “Not at all” has written equal employment opportunity policy. 19% reported that their Ministry has written equal employment opportunity policy “to a moderate extent.” 51% reported either they “Do no Know “or “Not at all” regarding the existence of flexible working arrangements in their Ministries. 30% reported that there are flexible working arrangements in their Ministries “to a moderate/limited extent.” 49% reported “Do not Know” or Not at all” regarding the existence of a maternity and paternity leave policy in their ministry. However, nearly 40% reported the existence of a maternity and paternity leave policy in their ministry “to a moderate/greater /fullest extent.” 52% of the respondents reported that either they “Do not know” or there is “Not at all” a childcare and dependent care leave policy in their Ministry. 10% reported that there is a childcare and dependent care leave policy in their Ministry ‘to the fullest extent.”
I do not knowNot at allTo a limited extentto a moderate extentto a greater extentto the fullest extent
write flexible child leave0.0%
10.0%
20.0%
30.0%
1. Is there a written equal employment opportunity policy in your Ministry?
2. Are there flexible working arrangements in your Ministry?
3. Is there a maternity and paternity leave policy in your Ministry?
4. Is there a childcare and dependent care leave policy in your Ministry?

37
As can be seen from Figure 5.3C.2 below, 37% of the male and 33% of the female respondents reported that written equal employment opportunity policy ‘Not at all” exists in their Ministry. 21% of male and 19% 0f the female respondents reported that written equal employment opportunity policy exists in their Ministry “to a moderate extent.” 35% of the male and 37% of the female respondents agree that of flexible working arrangements “Not at all” exists in their Ministries. 31% of male and 28% of female respondents reported that flexible working arrangements in their Ministries exist “to a moderate/greater extent.” 52% of male and 42% of female respondents reported “Do not know” or “Not at all” regarding the existence of maternity and paternity leave policy in their Ministry. 57% of male and 45% of female respondents reported “Do not know” or “Not at all” regarding the existence of childcare and dependent care leave policy in their Ministries. Figure 5.2C.2 Staff perception with regard to policy, flexibility, child care, and leave (based on gender)
Figure 5.3B.3 Staff perception with regard to job description
I do not knowNot at allTo a lim ited extentto a moderate extentto a greater extentto the fulles t extent
m an wri tem an flexible
m an chi ldm an leave
wom en writewom en flexib le
wom en chi ldwom en leave
10.0%
20.0%
30.0%
40.0%
I do not knowNot at allTo a limited extentto a moderate extentto a greater extentto the fullest extent
job1 job2
10.0%
20.0%
30.0%
40.0%
1. Is gender awareness included in all job descriptions in your Ministry?
2. Is gender awareness included in staff performance and development review criteria in your Ministry?

38
Figure 5.3C.3 above, shows that 40% of the respondents reported that gender awareness is “Not at all” included in all job descriptions in their Ministry. 19% “Do not know” whether gender awareness is included in all job descriptions in their Ministry. 32% reported that gender awareness is “Not at all” included in staff performance and development review criteria in their Ministry. However, 9% reported that gender awareness is included in all job descriptions in their Ministry “to the fullest extent.” And 11% reported that gender awareness is included in staff performance and development review criteria in their Ministry “to the fullest extent.’ As can be seen from Figure 5.2C.4 below, 43% of the male and 35% of the female reported that gender awareness is “Not at all” included in all job descriptions in their Ministry. 35% of male and 26% of female respondents reported that gender awareness is “Not at all” included in staff performance and development review criteria in their Ministry.
Figure 5.3C.4 Staff perception with regard to job description (based on gender) Figure 5.3C.5 Staff perception regarding awareness, institute, team and promotion
I do not knowNot at allTo a limited extentto a moderate extentto a greater extentto the fullest extent
man job1 man job2 women job1 women job2
10.0%
20.0%
30.0%
40.0%
I do not knowNot at allTo a lim ited extentto a moderate extentto a greater extentto the fulles t extent
aware insti tu t team prom
10.00
20.00
30.00
40.00
50.00
1. Is there training of staff in gender awareness and sensitization in you Ministry?
2. Is there training of senior management team in institutionalizing the integration of gender in to the management of your Ministry?
3. My Ministry promotes teamwork, involving both men and women as equal partners.
4. Management is committed to promoting female representation at senior levels in my Ministry?

39
Figure 5.3C.5 above shows that 49% of the respondents reported “Do not know” and “Not at all” regarding the training of staff in gender awareness and sensitization in their Ministry. 29% reported that training of staff in gender awareness and sensitization in their Ministry is happening “to am moderate/greater extent.” 10% feels that this is happening “to the fullest extent.” 27% reported “Not at all” regarding the training of senior management team in institutionalizing the integration of gender in to the management in their Ministry. However, 38% of the respondents reported that training of senior management team in institutionalizing the integration of gender into the management in their Ministry is happening “to a limited/moderate extent.” While 27% reported that their Ministry “Not at all” promotes teamwork, involving both men and women as equal partners, 51% agree that this is happening “to a moderate extent.” 27% reported that management is “Not at all” committed to promoting female representation at senior levels in their Ministry. However, 51% agree that management is committed to promoting female representation at senior levels in their Ministry “to moderate extent.”
In terms of gender, 40% of male and 28% of female respondents reported that the training of staff in gender awareness and sensitization in their Ministry is “Not at all” happening. 24% of male and 30% of female respondents reported that the training of senior management team in institutionalizing the integration of gender in to the management is “Not at all” happening in their Ministry. 52% male and 30% female respondents feel that their Ministry “to a moderate extent” and “Not at all” promotes teamwork, involving both men and women as equal partners respectively. 50% of male and 52% of female respondents reported that management is committed to promoting female representation at senior levels in their Ministry “to moderate extent.” This can be seen from Figure 5.3C.6. Figure 5.3C.6 Staff perception regarding awareness, institute, team and promotion (based on gender) Figure 5.3C.7 below depicts that 50% of the respondents “Agree” that there has been a gradual increase of gender expertise among staff members in their Ministry. 43% reported that they “Agree” that good performance in the field of gender is rewarded in their Ministry. However, 24% “Disagree” on both issues. As can be seen from Figure 5.5.16 below, 47% male and 54% female respondents that they “Agree” that there has been a gradual increase in gender expertise among staff members in their Ministry. 43% of male and female respondents also “Agree” that good performance in the field of gender is rewarded in their Ministry.
I do not knowNot at allTo a limited extentto a moderate extentto a greater extentto the fullest extent
man awareman institut
man teamman prom
women awarewomen institut
women teamwomen prom
10.00
20.00
30.00
40.00
50.00
5. Is there training of staff in gender awareness and sensitization in you Ministry?
6. Is there training of senior management team in institutionalizing the integration of gender in to the management of your Ministry?
7. My Ministry promotes teamwork, involving both men and women as equal partners.
8. Management is committed to promoting female representation at senior levels in my Ministry?

40
Figure 5.3C.7 Staff perception regarding gender expertise and reward D. Advocacy, Lobbying and communication This section of the Gender Audit attempt to analyze perception of participants with regard to the quality and gender sensitivity of advocacy, lobbying and communication efforts in line Ministries. The findings are summarized below. Figure 5.3D.1 Staff perception with regards to Advocacy, advice, media, and public relations Figure 5.3D.1 above shows that 43% of the respondents agree that their Ministry’s advocacy and lobbying initiatives are “Not at all” planned and informed by gender perspectives. 34% agree that their Ministry’s advocacy and lobbying policies and plans are “Not at all” influenced and advised by women’s organizations, networks and gender experts. 43% of the respondents stated that gender is “Not at all” incorporated in their Ministry’s communications, and media strategies. 36% of the respondents are of the opinion that gender perspectives are “Not at all” reflected in their Ministry’s publications, for example in books, brochures, newsletters, etc. In terms of gender, 33-46% of both male and female respondents reported from “Not at all.”
Strongly disagreeDisagreeno opinionAgreeStrongly agree
increase reward
10.0%
20.0%
30.0%
40.0%
50.0%
1. There has been a gradual increase of gender expertise among staff members in my Ministry..
2. Good performance in the field of gender is rewarded in my Ministry.
I do not knowNot at allTo a limited extentto a moderate extentto a greater extentto the fullest extent
advocacy advice pr media
10.0%
20.0%
30.0%
40.0%
1. Are your Ministry’s advocacy and lobbying initiatives planed and informed by gender perspectives?
2. Are your Ministry’s advocacy and lobbying policies and plans influenced and advised by women’s organizations, networks and gender experts?
3. Is gender incorporated in your Ministry’s communications, and media strategies?
4. Is gender perspective reflected in your Ministry’s publications, for example books, brochures,

41
E. Financial Resources This section attempts to analyze the perception of respondents with regard to the level and extent of organizational resources budgeted to support gender equity effort in line Ministries. The findings are summarized below.
Figure 5.3E.1 Staff perception regarding financial resources
As can be seen from Figure 5.3E.1 above, 44% of the respondents agree that their Ministry “Not at all” budget adequate financial resources to support its gender integration work. 36% reported that financial resources are “Not at all”’ allocated for the operationalization of the gender activities at all levels. 34% reported that staff training in gender issues is “Not at all” systematically budgeted for in their Ministry. 22% reported that heir Ministry budget adequate financial resources to support its gender integration work “to a limited/moderate extent.” 29% reported that financial resources are allocated for the operationalization of the gender activities at all levels “to a limited/moderate extent.” 24% reported that staff training in gender issues is systematically budgeted for in their Ministry “to a limited/moderate extent.” In terms of gender, 43% of male and 47% of female respondents reported that heir Ministry “Not at all” budget adequate financial resources to support its gender integration work. 33% of male and 41% of female respondents reported that financial resources are “Not at al”’ allocated for the operationalization of the gender activities at all levels. 35% of male and 32% of female respondents reported that staff training in gender issues is “Not at all” systematically budgeted for in their Ministry. Table 5.3E.1 Staff perception regarding financial resources based on Gender
I do not knowNot at allTo a limited extentto a moderate extentto a greater extentto the fullest extent
bdget1 busdgt2 budgt3
10.0%
20.0%
30.0%
40.0%
1. Does your Ministry budget adequate financial resources to support its gender integration work?
2. Are financial resources allocated for the operationalization of the gender policy at all levels?
3. Is staff training in gender issues systematically budgeted for in your Ministry?
7.3% 13.4% 12.2% 11.1% 7.4% 14.8%
42.7% 32.9% 35.4% 46.3% 40.7% 31.5%
18.3% 17.1% 22.0% 7.4% 14.8% 9.3%
6.1% 13.4% 7.3% 11.1% 13.0% 14.8%
13.4% 9.8% 12.2% 7.4% 14.8% 16.7%
12.2% 13.4% 11.0% 16.7% 9.3% 13.0%
I do not know
Not at all
To a limited extent
to a moderate extent
to a greater extent
to the fullest extent
%bdget1
%busdgt2
%budgt3
man
%bdget1
%busdgt2
%budgt3
women

42
F. Organizational Culture
This section attempts to analyze perception of respondents with regard to the extent and intensity of gender sensitivity in the organizational norms, structures, systems, processes and relations of power. The findings are summarized below.
Figure 5.3F.1 Staff perception with regards to behavior, harassment, and commitment
Figure 5.3F.1 above shows that 37% of the respondents reported that their Ministry “Not at all” encourages a gender sensitive behavior, for example in terms of language use, jokes and comments and their Ministry “Not at all” reinforce gender sensitive behavior and procedure to prevent and address harassment of women. 32% reported that Is staff in their Ministry is “Not at all” committed to the implementation of a gender activities/policy. 11-13% reported that this is happening “to a moderate extent.’ As can be seen from Figure 5.2F.2 below, in terms of gender, 44%, 33%, and 31% male respondents reported “Not at all” to behaviors, harassment, and commitment respectively. 26%, 43% and 35% of female respondents reported ‘Not at all’ to the same questions respectively. Figure 5.3F.2 Staff perception with regard to behaviors, harassment, and commitment (based on gender)
1. Does your Ministry encourage a gender sensitive behavior, for example in terms of language use, jokes and comments?
2. Does your Ministry reinforce gender sensitive behavior and procedure to prevent and address harassment of women?
3. Is staff in your Ministry committed to the implementation of a gender policy?
I do not knowNot at allTo a limited extentto a moderate extentto a greater extentto the fullest extent
man Behaviorman haras
man comitmenwomen Behavior
women haraswomen comitmen
10.0%
20.0%
30.0%
40.0%
I do not knowNot at allTo a limited extentto a moderate extentto a greater extentto the fullest extent
Behavior haras comitmen0.0%
10.0%
20.0%
30.0%

43
Figure 5.3F.3 Staff perception with regards to discussion and bias Figure 5.3F.3 depicts that 29% of the respondents agree that gender issues are “Not at all” taken seriously and discussed openly by men and women in their Ministry. 35% reported that gender bias is “Not at all” addressed and countered by individual staff members in their Ministry. However, 33% reported that gender issues are taken seriously and discussed openly by men and women in their Ministry “to a moderate/greater extent.” 23% reported that gender bias is addressed and countered by individual staff members in their Ministry” to a moderate/greater extent.”
As can be seen in Figure 5.3F.4 below, 53% of male and 50% of female respondents reported “Do not know’ or “Not at all” regarding the extent to which gender issues are taken seriously and discussed openly by men and women in their Ministry. 35% of male and female respondents reported that gender bias is “Not at all” addressed and countered by individual staff members in their Ministry. Figure 5.3F.4 Staff perception with regard to gender discussion and bias (based on gender)
I do not knowNot at allTo a lim ited extentto a moderate extentto a greater extentto the fulles t extent
d iscuss bias0.0%
10.0%
20.0%
30.0%
1. Are gender issues taken seriously and discussed openly by men and women in your Ministry?
2. Is gender bias addressed and countered by individual staff members in your Ministry?
I do not knowNot at allTo a limited extentto a moderate extentto a greater extentto the fullest extent
man discuss man bias women discuss women bias0.0%
10.0%
20.0%
30.0%

44
Figure 5.3F.5 Staff perception with regard to gaps, work, image, think and integrity
Figure 5.3F.5 above shows that 37% of the respondents “Strongly/disagree” that there is a gap between how women and men view gender issues in their Ministry. However, 52% “Strongly/Agree” that there is a gap between how women and men view gender issues in their Ministry. 29% “Strongly/disagree” that staff in their Ministry is enthusiastic about the gender work they do. 63% reported that “Strongly/Agree” that staff in their Ministry is enthusiastic about the gender work they do. 26% of respondents reported that they “Strongly/disagree” that staff in their Ministry thinks that the promotion of gender equity fits into the image of their organization. However, 63% “Strongly/Agree” staff in their Ministry think that the promotion of gender equity fits into the image of their organization. 33% of the respondents “Strongly/disagree” that women in their Ministry think the Ministry is women friendly. On the other hand, 59% “Strongly/Agree” that women in their Ministry think the Ministry is women friendly. 33% “Strongly/disagree” that men in their Ministry think the Ministry is women friendly. 58% think that men in their Ministry think the Ministry is women friendly. 24% of the respondents think “Strongly/disagree” that their Ministry has a reputation of integrity and competence on gender issues compared to other Ministries. However, 66% of the respondents reported that they “Strongly/Agree” that their Ministry has a reputation of integrity and competence on gender issues compared to other Ministries. As can be seen from Figure 5.3F.6 below, and Table 5.4, 37% of the male and 39% of the female respondents “Strongly/disagree” that there is a gap between how women and men view gender issues in their Ministry. However, 51% of the male and 54% of the female respondents “Strongly/Agree” that there is a gap between how women and men view gender issues in their Ministry. 26% of male and 33% of female respondents” Strongly/disagree” that staff in their Ministry is enthusiastic about the gender work they do. 65% male and 59% of female reported that they” Strongly/Agree” that staff in their Ministry is enthusiastic about the gender work they do. 23% of
Strongly disagreeDisagreeno opinionAgreeStrongly agree
gap work image think1 think2 integrit
10.0%
20.0%
30.0%
40.0%
1. There is a gap between how women and men view gender issues in my Ministry?
2. The staff in my Ministry is enthusiastic about the gender work they do.
3. Staff in my Ministry thinks that the promotion of gender equity fits into the image of our organization.
4. Women in my Ministry think the Ministry is women friendly
5. Men in my Ministry think the Ministry is women friendly
6. My Ministry has a reputation of integrity and competence on gender issues compared to other Ministries

45
male and 33% of female respondents “Strongly/disagree” that staff in their Ministry think that the promotion of gender equity fits into the image of their organization. 66% male and 59% female respondents, however, “Strongly/agree” that staff in their Ministry think that the promotion of gender equity fits into the image of their organization. 21% of male and 37% of female respondents “Strongly/disagree” that women in their Ministry think the Ministry is women friendly. 62% of male and 54% of female respondents “Strongly/Agree” that women in their Ministry think the Ministry is women friendly. 29% of male and 39% of female respondents “Strongly/disagree” that men in their Ministry think the Ministry is women friendly. 63% of the male and 50% of the female respondents think that men in their Ministry think the Ministry is women friendly. 24% of male and 22% of female respondents “Strongly/disagree” that their Ministry has a reputation of integrity and competence on gender issues compared to other Ministries. However, 655 of male and 67% of female respondents reported that they “Strongly/Agree” that their Ministry has a reputation for integrity and competence on gender issues compared to other Ministries. Figure 5.3F.6 Staff perception with regards to gap, work, image, think and integrity (based on gender)
Table 5.3F.1 Staff perception with regards to gap, work, image, think and integrity based on gender
Strongly dis agreeDis agreeno opinionAgreeStrongly agree
m an gapm an work
m an image
m an think1m an think2
m an integri t
wom en gapwom en work
wom en image
wom en th ink1wom en th ink2
wom en in tegrit
10.0%
20.0%
30.0%
40.0%
50.0%
11.0% 7.3% 2.4% 11.0% 7.3% 9.8% 7.4% 7.4% 9.3% 9.3% 9.3% 3.7%
25.6% 18.3% 20.7% 19.5% 22.0% 14.6% 31.5% 25.9% 22.2% 27.8% 29.6% 18.5%12.2% 9.8% 11.0% 7.3% 7.3% 11.0% 7.4% 7.4% 9.3% 9.3% 11.1% 11.1%
30.5% 47.6% 51.2% 46.3% 47.6% 46.3% 40.7% 46.3% 35.2% 42.6% 33.3% 48.1%20.7% 17.1% 14.6% 15.9% 15.9% 18.3% 13.0% 13.0% 24.1% 11.1% 16.7% 18.5%
Strongly diDisagreeno opinion
AgreeStrongly ag
%gap
%work
%image
%think1
%think2
%integrit
man
%gap
%work
%image
%think1
%think2
%integrit
women

46
Figure 5.3F.7 Staff perception with regards to doing more, culture, and meetings, improvement in the past two years, unfair issues
Figure 5.3F.7 shows that 27% of the respondents “Strongly/disagree” that their Ministry could do much more than it is currently doing to institutionalize gender equity. 62% “Strongly/agree” that their Ministry could do much more than it is currently doing to institutionalize gender equity. 34% of the respondents “Strongly/disagree” that the culture of their Ministry places a higher value on the ways males tend to work and less value on the ways females tend to work. However, 58% “Strongly/agree” that the culture of their Ministry places a higher value on the ways males tend to work and less value on the ways females tend to work. 26% “Strongly/disagree” that meetings in their Ministry tend to be dominated by male staff. On the other hand, 66% “Strongly/agree” that meetings in their Ministry tend to be dominated by male staff. 28% “Strongly/disagree” that the working environment in their Ministry has improved for women over the past two years. However, 64% “Strongly/agree” that the working environment in their Ministry has improved for women over the past two years. 29% “Strongly/disagree” that it is unfair to promote women more than men in their Ministry’s field programmes/projects. On the other hand, 59% “Strongly/agree” that it is unfair to promote women more than men in my Ministry’s field programmes/projects. 28% of the respondents “Strongly/disagree” that in their Ministry male staff members have a much easier time establishing personal and professional relationships and networks within the Ministry than do females. However, 64% “Strongly/agree” that in their Ministry male staff members have a much easier time establishing personal and professional relationships and networks within the Ministry than do females. As can be seen from the Figure 5.3F.8 and Table 5.3F.2 show that 28% of the male and 26 % of the female respondents “Strongly/disagree” that their Ministry could do much more than it is currently doing to institutionalize gender equity. 62% of the male and 61% of the female respondents “Strongly/agree” that their Ministry could do much more than it is currently doing to institutionalize gender equity. 40% of the male and 24% of the respondents “Strongly/disagree” that the culture of their Ministry places a higher value on the ways males tend to work and less value on the ways
Strongly disagreeDisagreeno opinionAgreeStrongly agree
more culture meeting past unfair1 unfair2
10.0%
20.0%
30.0%
40.0%
50.0%
1. My Ministry could do much more than it is currently doing to institutionalize gender equity
2. The culture of my Ministry places a higher value on the ways male tends to work and less value on the ways female tends to work
3. Meetings in my Ministry tend to be dominated by male staff
4. The working environment in my Ministry has improved for women over the past two years
5. It is unfair to promote women more than men in my Ministry’s field programmes/projects
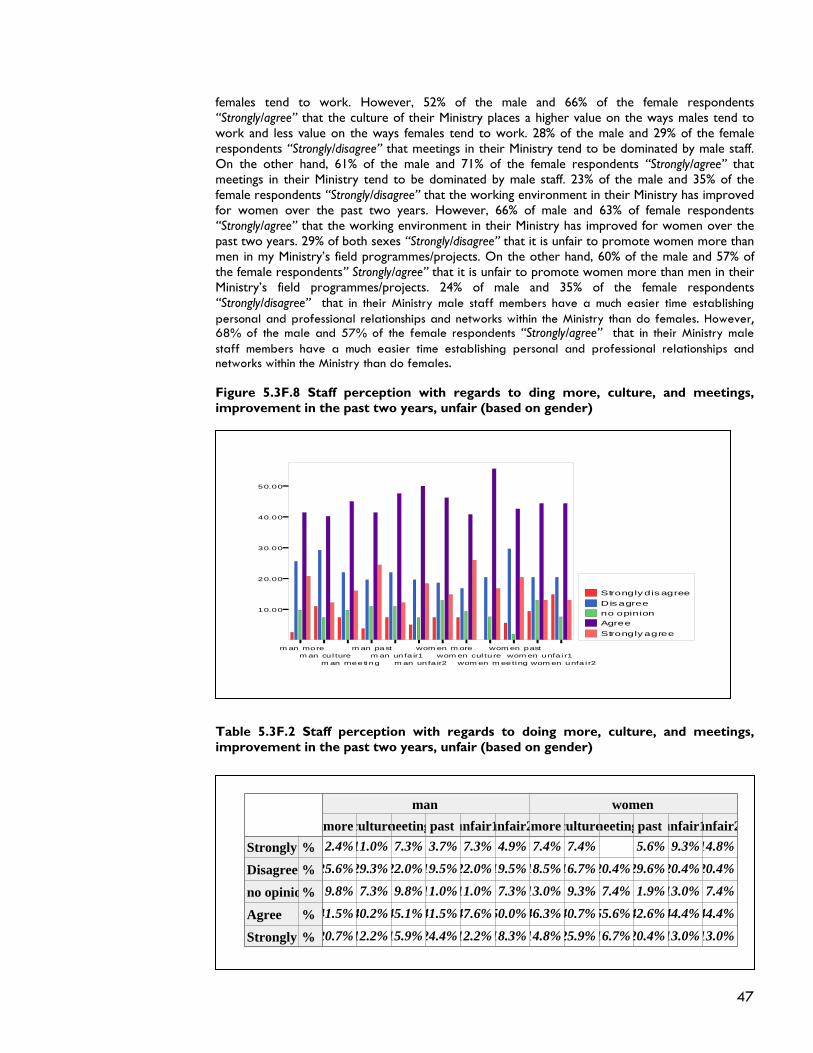
47
females tend to work. However, 52% of the male and 66% of the female respondents “Strongly/agree” that the culture of their Ministry places a higher value on the ways males tend to work and less value on the ways females tend to work. 28% of the male and 29% of the female respondents “Strongly/disagree” that meetings in their Ministry tend to be dominated by male staff. On the other hand, 61% of the male and 71% of the female respondents “Strongly/agree” that meetings in their Ministry tend to be dominated by male staff. 23% of the male and 35% of the female respondents “Strongly/disagree” that the working environment in their Ministry has improved for women over the past two years. However, 66% of male and 63% of female respondents “Strongly/agree” that the working environment in their Ministry has improved for women over the past two years. 29% of both sexes “Strongly/disagree” that it is unfair to promote women more than men in my Ministry’s field programmes/projects. On the other hand, 60% of the male and 57% of the female respondents” Strongly/agree” that it is unfair to promote women more than men in their Ministry’s field programmes/projects. 24% of male and 35% of the female respondents “Strongly/disagree” that in their Ministry male staff members have a much easier time establishing personal and professional relationships and networks within the Ministry than do females. However, 68% of the male and 57% of the female respondents “Strongly/agree” that in their Ministry male staff members have a much easier time establishing personal and professional relationships and networks within the Ministry than do females. Figure 5.3F.8 Staff perception with regards to ding more, culture, and meetings, improvement in the past two years, unfair (based on gender)
Table 5.3F.2 Staff perception with regards to doing more, culture, and meetings, improvement in the past two years, unfair (based on gender)
2.4%11.0% 7.3% 3.7% 7.3% 4.9% 7.4% 7.4% 5.6% 9.3%14.8%
25.6%29.3%22.0%19.5%22.0%19.5%18.5%16.7%20.4%29.6%20.4%20.4%
9.8% 7.3% 9.8%11.0%11.0% 7.3%13.0% 9.3% 7.4% 1.9%13.0% 7.4%
41.5%40.2%45.1%41.5%47.6%50.0%46.3%40.7%55.6%42.6%44.4%44.4%
20.7%12.2%15.9%24.4%12.2%18.3%14.8%25.9%16.7%20.4%13.0%13.0%
%Strongly
%Disagree
%no opinio
%Agree
%Strongly
moreculturemeetingpastunfair1unfair2man
moreculturemeetingpastunfair1unfair2women
Strongly dis agreeDisagreeno opinionAgreeStrongly agree
m an morem an cul ture
m an meeting
m an pastm an unfa ir1
m an unfa ir2
wom en m orewom en cul ture
wom en m eeting
wom en pastwom en unfa i r1
wom en unfa i r2
10.00
20.00
30.00
40.00
50.00

48
5.4 CHARACTERISTICS OF AN IDEAL EMPLOYEE
Respondents of the Gender Audit were requested to identify three characteristics of ideal employee. Respondents reported responses such as honest, accountable, punctual, dedicated to work, fair, knowledgeable, respect colleagues, energetic, high performer, respect of work, self controlled, good relations with staff members, honesty, credibility, professional, efficient, good behavior, love of work, quiet. The responses were collected and analyzed and the results are graphed in Figure 5.4.1 below.
Figure 5.4.1 Respondents’ perception with regard to an ideal worker
As can be seen from Figure 5.4.1 above, most participants reported that the characteristics of an best (ideal) employee are honesty (24%) , good looking (11%), punctuality (10%), dedication to work (10%), etc. This shows that the organizational culture gives more value to honest, punctuality, good looking, etc.
23.53%
10.29%
5.15%
6.62%
9.56%
8.09%8.82%
11.03%
6.62%5.88%
4.41%
0.00%
5.00%
10.00%
15.00%
20.00%
25.00%
Characteristics
Perc
enta
ge
Honesty
Punctuality
Respect for leaders
Respect for colleagues
Dedication to w ork
Know ledgeable
Energetic
Good looking
Quite
Obedient
Sociable

49
5.5 STATISTICAL INFERENCES
5.5.1 Composite measure score for Gender Integration Framework Table 5.5.1 Political Will composite Index
Scale Questions
N Minimum Maximum Sum
Mean
Std. Deviation
mandate 136 1 6 416 3.06 1.627 goal 135 1 6 443 3.28 1.605
criteria 136 1 6 410 3.01 1.491 policy 136 1 6 416 3.06 1.572 plan 136 1 6 408 3.00 1.549
strategy 136 1 6 431 3.17 1.654 own 136 1 5 337 2.48 1.102 mgt 136 1 5 319 2.35 1.028
senior 136 1 6 401 2.95 1.551 field 136 1 6 403 2.96 1.527 force 136 1 6 422 3.10 1.630 recruit 136 1 6 391 2.88 1.508 diverse 136 1 6 412 3.03 1.544
Budget 1 136 1 6 422 3.10 1.607 Budget 2 136 1 6 427 3.14 1.569 Budget 3 136 1 6 426 3.13 1.609
Total mean 47.70 Average composite score: Mean/number of question 2.98 Table 5.5.2 Technical capacity composite index
Scale Questio
n
N Minimum Maximum
Sum
Mean
Std.
Deviation division 136 1 6 401 2.95 1.421 Staff 1 136 1 6 439 3.23 1.624 Staff 2 136 1 6 432 3.18 1.596 skills 136 1 6 388 2.85 1.508 train 136 1 6 418 3.07 1.523
expert 136 1 5 343 2.52 1.276 Total mean 17.80
Average composite score: Mean/number of question 2.97
Table 5.5.3 Accountability composite index
Scale N Minimum Maximum
Sum Mean Std. Deviation
data 136 1 6 455 3.35 1.635 impact 136 1 6 422 3.10 1.555 sector 136 1 6 378 2.78 1.489 design 136 1 5 404 2.97 1.460 Job 1 136 1 6 384 2.82 1.577 Job 2 136 1 6 437 3.21 1.617
Total mean 21.00 Average composite score: Mean/number of question 3.00

50
Table 5.5.4 Organizational Culture composite index Scale
Questions
N Minimum Maximum
Sum
Mean
Std.
Deviation Behavior 136 1 6 410 3.01 1.573
Harassment 136 1 6 418 3.07 1.566 commitment 136 1 6 427 3.14 1.629
discuss 136 1 6 408 3.00 1.656 bias 136 1 6 439 3.23 1.624 gap 136 1 5 439 3.23 1.294 work 136 1 5 465 3.42 1.196 image 136 1 5 476 3.50 1.167 Think 1 136 1 5 448 3.29 1.254 Think 2 136 1 5 453 3.33 1.242 Integrity 136 1 5 480 3.53 1.180
more 136 1 5 474 3.49 1.161 culture 136 1 5 452 3.32 1.282
meeting 136 1 5 478 3.51 1.129 past 136 1 5 483 3.55 1.204
Unfair 1 136 1 5 454 3.34 1.181 Unfair 2 136 1 5 466 3.43 1.227
Total mean 56.40 Average composite score: Mean/number of question 3.32
The results from the above four tables are summarized in Table .5.1 below.: Table: 5.5.5 Gender Integration Frameworks Composite Index
Gender Integration Frameworks
Composite score
Questions included in composite Measure/Index
Political will
2.98
Mandate, goals, criteria, policy, plan, strategy, ownership, mange, senior, field, force, recruit, budget 1-3
Technical capacity
2.97
All questions in the technical expertise sub-section of the questionnaire
Accountability
3.00
Data, impact, sector, design, power, job 1-2
Organizational Culture
3.32
All questions in the organizational culture sub-section of the questionnaire
Table 5.5.5 above reflects the results of the Gender Integration Framework Composite score generated from the Gender Audit Questionnaire on a on a scale 1-5 and 1-6 depending on the question with “1” indicating a low level on the gender integration component and “5/6” indicating high. Nine South Kordofan line Ministries scored 2.98 on Political will, 2.97 on Technical capacity, 3.00 on Accountability and 3.32 on Organizational Culture. These scores, falling on the medium range suggest an organizational openness in South Kordofan civil service institutions for gender integration efforts in those four areas. Experience witnessed that organizations exhibiting the requisite level of political will accompanied by a positive organizational culture, organizational accountability and technical expertise, integrate gender quite successfully in their policies, programmes and human resources procedures.13
13 . InterAction, Commission on the Advancement of Women (CAW), 1995.

51
5.5.2 Mean and Standard deviation
The Gender Audit Questionnaire response questions are scaled giving respondents a number of options from which they can choose to report their perception. The usual procedure to analyze scaled questions is to calculate either percentage Reponses and graph them to calculate In Chapter five we have analyzed the responses using percentage responses to each category and graph the result or calculate the average score or standard deviation of the responses. In Chapter 5, we have used percentage and graph to conduct both bivariate and multivariate analysis by creating a contingency table. The Average Score (mean) tells us where on the scale the average respondent has indicated his/her perception. The average score does not tell the whole story. The same average score obtained fro a number of different questions, may wrongly give the impression that respondents opinion is similar to all. If we calculate standard deviation, we may find that agreement among respondents was high in regard to some questions (indicated by LOW standard deviation) and low in other (indicated by HIGH Standard deviation). Therefore, is necessary to calculate the standard deviation to get full picture of agreement and/or disagreement among respondents’ perception. The standard deviation tells us the amount of variability or spread in respondents’ perceptions. High standard deviation tells us there is quite a bit of disagreement among respondents with regards to a question in the Gender Audit Questionnaire. Low standard deviation tells us there is an agreement among respondents with regards to a question in the Gender Audit Questionnaire. The Gender Audit questions were groups using the Gender Integration Framework Concept for this purpose.
First, as can be seen from Table 5.4.1 above, even if variable “force” and “Budget” and “mandate” and “policy” in the political will category show the same means, they registered different standard deviations. This informs us that there is an agreement among respondents with regard to “Budget 1” and Policy compared to “force” and “mandate.” Furthermore, the table shows that thee is an agreement among respondents regarding the variables “ownership” and “management” as the standard deviation is low compared to other variables in this group.
Second, Table 5.4.2 above shows that the standard deviation for Technical capacity ranges from 1.276 to 1.624. There is an agreement among respondents regarding all variables that make the Technical capacity dimension. However, there is high degree of agreement among respondents with regard to the variable “expert” as indicated by low standard deviation.
Third, Table 5.4.3 above depicts that the standard deviation ranges from 1.460 to 1.635. This shows that there is disagreement among respondents’ with regards to the questions in the category as indicated by relatively high standard deviations.
Fourth, Table 5.4.4 above shows that the standard deviations for organizational culture variables range from 1.129 to 1.656. However, a closer look at the table shows that variables such as “Meetings”, “more”, “image”, “integrity”, “unfair 1” and “work” have lower standard deviations compared to other variables. This shows that there is an agreement among respondents with regards to these variables as these variables have relatively low standard deviations compared to the other in this category. Please refer the annex Gender Audit Questionnaire for the Variables.”
5.5.3 One Factor ANOVA Test
Annex 1.8 shows the distribution of the dependent variables in terms of the independent variables (sex of the respondents). Comparing the statistics in terms of the groups reveals difference between the levels of the independent variable. In this regard the table shows that male mean is higher than that for women except for variables “force” recruit” and divers.” However, the spread of respondent’s perception is approximately constant in most of the variables. In order to determine the importance one-way Analysis of Variance (ANOVA) test of significance was conducted. Small significance value (P < .05) is defined to indicate group difference. One factor Analysis of variance (ANOVA) test was conducted to determine if there existed any statistically significant difference among and between groups at an alpha level of 0.05. The result shows that there are no statistical differences among and between groups indicating that that there no major difference between the male and female groups.

52
CHAPTER 6 KEY FINDINGS
6.1 Gender and Programme Planning and Design
The examination of respondents’ perception in this Gender Audit with regards to the “extent to which gender sensitive institutional procedures and methods are used to conceptualize and design polices/programmes/ project in the Ministries” reveals the following key findings:
• Staff members of Ministries do not know whether their Ministries are mandated to
integrate gender equity or not into polices/programmes/ project • Gender equity goals and objective are rarely considered in the planning and design of
polices/programmes/ project • Gender need analysis is not conducted in the planning and design of programmes and
projects of Ministries • Gender questions or criteria are not incorporated in any proposal approval process • Ministries rarely use participatory approaches to incorporate the views and preferences of
so both male and female beneficiaries • Polices/programmes/ project implementation strategies are devoid of any activity to
strengthen women’s’ access to services training • Both male and female respondents reported that beneficiaries of their
polices/programmes/ project do not see and value their polices/programmes/ project as beneficial to their lives
• South Kordofan civil service institutions lack the capacity to deal with organizational gender resistance
• The gender technical capacity (knowledge, skills and attitude) in general is very weak and there is no unit responsible for gender in many of the Ministries
• Staff members of Ministries do not receive gender analysis and planning training • Polices/programmes/ project evaluation and review task forces or teams do not include
gender aware person(s) • Some Ministries reported that they collect gender disaggregated data to a limited extent • Gender impact of polices/programmes/ project are not monitored or evaluated • There are no gender specific indicators in polices/programmes/ project • Ministries believe that gender disaggregated data provides useful information for
polices/programmes/ project evaluation and subsequent design • Most respondents feel that their Ministries polices/programmes/ project rarely contribute
to the empowerment of women • Ministries do not use gender criteria for partnership selection • Staff members believe that the major obstacle for gender integration are: local culture,
lack of financial resources for gender integration work, and lack of gender technical capacity
6.2 Gender and Organizational processes
The examination of the respondents’ perception in this Gender Audit with regards to the “nature, quality, extent and intensity of support for gender policy or activities of the Ministries” reveals the following key findings:
• No South Kordofan Ministry has written gender policy supported with a gender action
plan • Gender issues are rarely taken into consideration during planning processes • There is limited involvement of management for the development and implementation of
gender policy
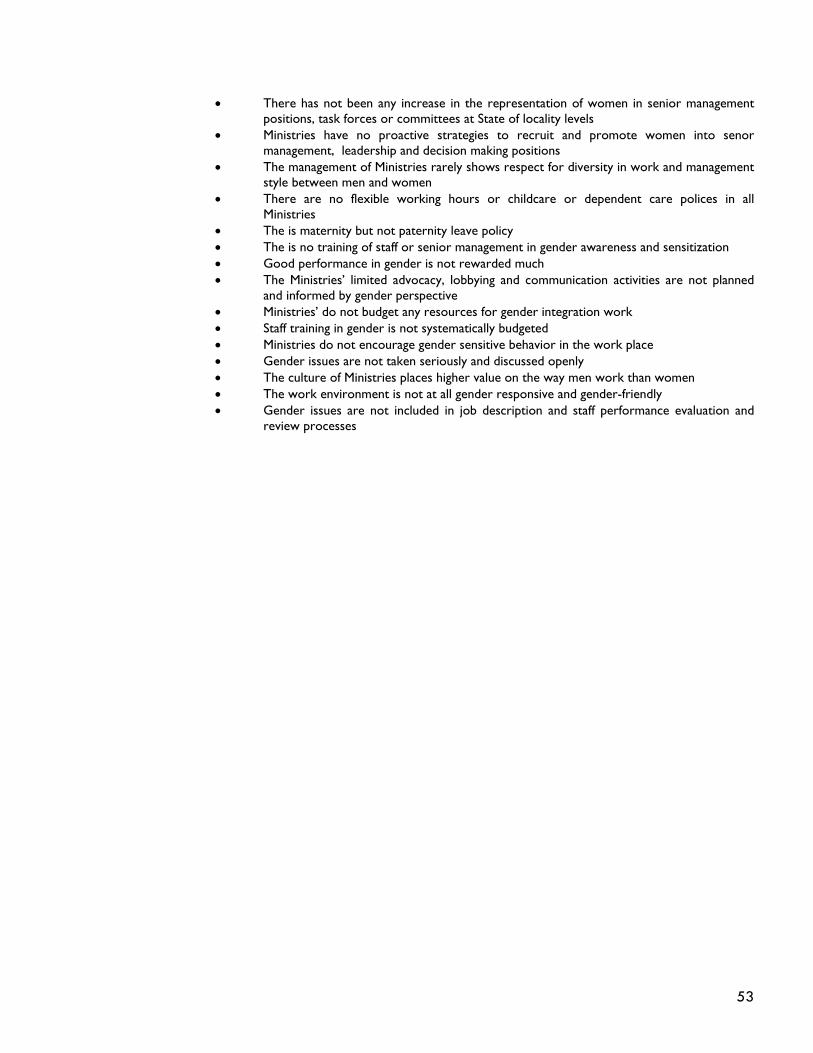
53
• There has not been any increase in the representation of women in senior management positions, task forces or committees at State of locality levels
• Ministries have no proactive strategies to recruit and promote women into senor management, leadership and decision making positions
• The management of Ministries rarely shows respect for diversity in work and management style between men and women
• There are no flexible working hours or childcare or dependent care polices in all Ministries
• The is maternity but not paternity leave policy • The is no training of staff or senior management in gender awareness and sensitization • Good performance in gender is not rewarded much • The Ministries’ limited advocacy, lobbying and communication activities are not planned
and informed by gender perspective • Ministries’ do not budget any resources for gender integration work • Staff training in gender is not systematically budgeted • Ministries do not encourage gender sensitive behavior in the work place • Gender issues are not taken seriously and discussed openly • The culture of Ministries places higher value on the way men work than women • The work environment is not at all gender responsive and gender-friendly • Gender issues are not included in job description and staff performance evaluation and
review processes

54
CHAPTER 7 CONCLUSION AND THE WAY FORWARD 7.1 Conclusion
As described previously, the main aim of this Gender Audit was to assess the range of understandings, attitudes, perception and reported behavior among South Kordofan civil service institutions in 99 identified gender Audit areas. 136 staff members of nine South Kordofan State line Ministers participated in the Gender Audit process. Of the 136 respondents, 82 (60.3% were male and 54 (39.7%) were female. The majority of the respondents (66%) to the Gender Audit were between the ages of 20-40 with 34% ranging in ages 20-30; 32% ranging in ages from 31-40, 19% ranging from 41-50; and 15% ranging from ages 51-60. Responses to the Gender Audit questionnaire came from all positions in each Ministry. This Gender Audit constitutes the baseline information for collective organizational discussions and action. The Gender Audit provides ample opportunity to learn more about gender equity issues in civil service institutions after the Comprehensive Peace Agreement (CPA) and especially after the establishment of a power-sharing government in South Kordofan State.
The Gender Audit reveals that South Kordofan civil service institutions are challenged by gender equity issues in both programme and organizations process dimensions. The governance system in the State requires an overhaul of all structures and processes to incorporate gender equity issues as enshrined in the State Interim Constitution (SIC).
The Gender Audit reveals that South Kordofan civil service institutions are challenged by gender equity issues in both programme and organizations process dimensions. Civil service institutions in the State lack the necessary gender infrastructure (qualified staff, gender supportive systems and process and the allocation of necessary financial resources) to create a gender equitable civil service management system in the State. This requires the overhaul of all structures and processes in the State to incorporate gender equity issues in the governance system as enshrined in the State Interim Constitution (SIC). This gender Audit enables civil service institutions to not only get the information needed for action planning, but to also build institutional commitment to move ahead with all stakeholders on board. This Gender Audit process helps South Kordofan Civil service institution to assess where they are and what they need to do to increase gender equity in their Progrmame portfolio and internal organizational processes.
Finally, as South Kordofan civil service institutions strive to promote equitable and sustainable development and public service delivery system, the Gender Audit process provides handy tools and the results of the Audit serves as a baseline from where to start the long road to the creation of a gender equitable democratic, and suitable governance system in he State.
7.2 The Way Forward 7.2.1 Fostering Political Will
• Civil service institutions should develop clear gender policy and have the courage to implement it at State, locality, administrative units and community levels
• Civil service institution should allocate enough financial resources for gender training of staff

55
• Civil service institution encourage and enforce the collection of gender disaggregated data for planning, monitoring and evaluation of the incorporation of gender in policies/programmes/projects
• Civil service institution should actively recruit and promote women in management and leadership positions
• Civil service institution should invest in the training of women in management , leadership, problem solving and decision making
• Presentation and popularization of gender equity • Civil service institution mainstreaming gender equity goals in
policies/programmes/projects
7.2.2 Enhancing Technical capacity
• Strengthen staff analytical and programme skills in gender analysis and planning
• Provide extensive gender awareness for staff and partners and gender planning and analysis tools
• Create Locality Gender awareness and training teams
7.2.3 Enforcing Accountability
• Civil service institutions should make gender one of the staff performance criteria
• Civil service institutions should encourage and reinforce gender sensitive policies/programmes/projects planning and design
• Include gender awareness as a core staff competency • Civil service institutions should recognize and reward good work on
gender equity 7.2.4 Fostering Gender Responsive Organizational Culture
• Civil service institutions should make gender equity an organizational
norm • Civil service institutions should integrate gender equity in everyday
procedures • Use formal and informal techniques to promote gender equity • Continue to discuss issues of gender equity openly • Civil service institutions should insure that civil service human resources
management and development polices are flexible for both women and men and are family friendly

56
Annex: Annex 1.1: Respondents’ Gender profile Annex 1.2: Respondents’ level of education Annex 1.3: Respondents’ by Ministry Annex 1.4: Respondents’ level of education by sex Annex 1.5: Respondents’ position by sex
82 60.3%
54 39.7%man
women
Count %
2 1.5%3 2.2%
30 22.1%
94 69.1%
7 5.1%
primary
intermidaite
secondary
univerity
post-graduate
Count %
level of education of therespondent
14 10.3%
15 11.0%15 11.0%
13 9.6%16 11.8%
16 11.8%16 11.8%
14 10.3%17 12.5%
moe
molgcsmouppu
moaawnrmociys
moswwcmordwr
mofmoei
Count %Respondent's Ministry
27 32.9% 5 9.3%
12 14.6% 11 20.4%
17 20.7% 14 25.9%
14 17.1% 14 25.9%8 9.8% 6 11.1%
4 4.9% 4 7.4%
senior civil servant
Management team
Programme
admin/finance
supportother
Count %
postion of therespondent
man
Count %
postion of therespondent
women
2 3.7% 3 5.6%
18 22.0% 12 22.2%
58 70.7% 36 66.7%6 7.3% 1 1.9%
primaryintermidaite
secondary
univeritypost-graduate
Count %
level of education of therespondent
man
Count %
level of education of therespondent
women

57
Annex 1.6: Respondents’ level of education by Ministry
Annex 1.7: Respondents’ Ministry by sex Annex 1.8: Political will category gender based mean and standard deviation Annex 1.9 Technical Capacity category gender based mean and standard deviation
1 50.0% 5 16.7% 7 7.4% 1 14.3%
1 3.3% 13 13.8% 1 14.3%
5 16.7% 9 9.6% 1 14.3%
1 50.0% 1 33.3% 4 13.3% 6 6.4% 1 14.3%
2 66.7% 3 10.0% 10 10.6% 1 14.3%
3 10.0% 13 13.8%
14 14.9% 2 28.6%
8 26.7% 6 6.4%
1 3.3% 16 17.0%
moe
molgcs
mouppu
moaawnr
mociys
moswwc
mordwr
mof
moei
Count %Respondent's Ministry
primary
Count %Respondent's Ministry
intermidaite
Count %Respondent's Ministry
secondary
Count %Respondent's Ministry
univerity
Count %Respondent's Ministry
post-graduatelevel of education of the respondent
12.2% 7.4%
9.8% 13.0%
14.6% 5.6%8.5% 11.1%
11.0% 13.0%8.5% 16.7%
14.6% 7.4%
12.2% 7.4%8.5% 18.5%
%moe
%molgcs%mouppu
%moaawnr
%mociys%moswwc
%mordwr
%mof%moei
man women
3.13 3.54 3.21 3.10 2.93 3.23 2.59 2.39 3.01 3.21 3.06 2.80 2.98
1.562 1.557 1.505 1.599 1.554 1.723 1.143 1.003 1.495 1.600 1.636 1.503 1.602
2.94 2.89 2.72 3.00 3.11 3.07 2.31 2.28 2.85 2.59 3.17 2.98 3.11
1.731 1.613 1.433 1.542 1.550 1.552 1.025 1.071 1.642 1.339 1.634 1.523 1.462
3.06 3.28 3.01 3.06 3.00 3.17 2.48 2.35 2.95 2.96 3.10 2.88 3.03
1.627 1.605 1.491 1.572 1.549 1.654 1.102 1.028 1.551 1.527 1.630 1.508 1.544
Mean
Std. Devia
Mean
Std. Devia
Mean
Std. Devia
man
women
Total
GENDE
mandate goal criteria policy plan strategy own mgt senior field force recrut diverse
Report
2.98 3.24 3.24 2.89 3.20 2.44
82 82 82 82 82 821.388 1.630 1.637 1.579 1.543 1.228
2.91 3.20 3.07 2.80 2.89 2.65
54 54 54 54 54 54
1.483 1.630 1.540 1.406 1.488 1.348
2.95 3.23 3.18 2.85 3.07 2.52
136 136 136 136 136 136
1.421 1.624 1.596 1.508 1.523 1.276
Mean
N
Std. Deviation
Mean
N
Std. DeviationMean
N
Std. Deviation
man
women
Total
GENDER
division staff1 staff2 skills train expert

58
Annex 1.10 Accountability category gender based mean and standard deviation Annex 1.11 Organizational culture category gender based mean and standard deviation
Report
3.33 3.16 2.83 3.10 2.74 2.87 3.11
82 82 82 82 82 82 82
1.595 1.503 1.489 1.445 .927 1.616 1.491
3.37 3.02 2.70 2.78 2.80 2.76 3.37
54 54 54 54 54 54 54
1.708 1.642 1.500 1.475 .919 1.529 1.794
3.35 3.10 2.78 2.97 2.76 2.82 3.21
136 136 136 136 136 136 136
1.635 1.555 1.489 1.460 .921 1.577 1.617
Mean
N
Std. Deviation
Mean
N
Std. Deviation
Mean
N
Std. Deviation
man
women
Total
GENDER
data impact sector design power job1 job2
Report
2.84 3.06 3.23 2.91 3.29 3.24 3.49 3.55 3.37 3.43 3.49 3.52 3.13 3.40 3.63 3.35 3.57
82 82 82 82 82 82 82 82 82 82 82 82 82 82 82 82 821.503 1.590 1.673 1.612 1.644 1.339 1.189 1.056 1.272 1.207 1.230 1.157 1.274 1.206 1.160 1.169 1.1443.28 3.09 3.00 3.13 3.13 3.20 3.31 3.43 3.19 3.19 3.59 3.43 3.61 3.69 3.43 3.31 3.20
54 54 54 54 54 54 54 54 54 54 54 54 54 54 54 54 541.653 1.545 1.566 1.727 1.602 1.234 1.210 1.326 1.230 1.290 1.108 1.175 1.250 .987 1.268 1.210 1.323
3.01 3.07 3.14 3.00 3.23 3.23 3.42 3.50 3.29 3.33 3.53 3.49 3.32 3.51 3.55 3.34 3.43136 136 136 136 136 136 136 136 136 136 136 136 136 136 136 136 136
1.573 1.566 1.629 1.656 1.624 1.294 1.196 1.167 1.254 1.242 1.180 1.161 1.282 1.129 1.204 1.181 1.227
Mean
NStd. DeviatMean
NStd. Deviat
MeanN
Std. Deviat
man
women
Total
GENDE
Behavior haras comitmendiscuss bias gap work image think1 think2 integrit more culture meeting past unfair1 unfair2

59
Annex 1.12 Gender Audit Respondents Profile Sn. Name Gender Position Ministry 1. Ali Gawish Adam Male Assistant Computer Inspector MOLGCS 2. Mohamed Kakidllah Gadalla Male Assistant Accounts Inspector MOLGCS 3. Assim Mohamed Omer Male Procurement Inspector MOLGCS 4. Fawzia Abun Mustafa Female Assistant personnel Manager MOLGCS 5. Saleema Khalil Eissa Female Assistant Personnel Manager MOLGCS 6. Mahi el Din Jumaa Angalo Male Personnel Manager MOLGCS 7. Aliya Rahmt Alla Ali Female Personnel Manager MOLGCS 8. Said Musa Ibrahim Male Personnel Manager MOLGCS 9. Amira Ismail El Kinani Female Personnel Manager MOLGCS 10. Niymat Musa Abdalla Female Senior Personnel Clerk MOLGCS 11. Asma Khalifa Jumaa El Kinani Female Personnel Supervisor MOLGCS 12. Omer Mindeel Kurba Male Assistant Training Manager MOLGCS 13. Yassine Abdalla Sameer Male Assistant Labor Manager MOLGCS 14. Alkhidr Mohamed Male Assistant Training Manager MOLGCS 15. Al Rasheed Kafi Kuku Male Technetium MOLGCS 16. Muna Mater Ali Female Assistant Computer Inspector MOLGCS 17. Kudi Abd el Rahman Hannilla Male Land Planning Manager MOUPPU 18. Meki Mohamed Hamid Male Land Inspector MOUPPU 19. Hussein el Zaki el Faki Ali Male Construction Manager MOUPPU 20. Fatima Makin Awad Female Senior Clerk MOUPPU 21. Abla Said Ibrahim Female Clerk MOUPPU 22. Alnayr Mohamed tutu Male manager MOUPPU 23. Ahmed Mohamed Omer Male Roads Director MOUPPU 24. el Sir Ahmed Hasballa Male Finance Director MOUPPU 25. Zaynab Ismail Bakr Female Senior Finance Manager MOUPPU 26. Ibrhim Ahmed Malaa Male Personnel Manager MOUPPU 27. Khalifa Ahmed Idriss Male Surveyor MOUPPU 28. Kudi Kaju Somi Male Director General MOUPPU 29. Zakriya Mohamed Salih Male MOUPPU 30. Abdalla Eissa Adam Male MOUPPU 31. Khadmalla Ahmed Saboun Female Assistant Planning Inspector MOEI
32. Mugahid Ali Balatoun Male Assistant Planning Inspector MOEI 33. Alnazeer Mohamed Al Haj Male Assistant Inspector MOEI 34. Ihsan Dawood Hammad Female Inspector MOEI 35. Azahir Ahmed Al Mustafa Female Manufacture Inspector MOEI 36. Nuha Musa Mohamed Female Assistant Investment Inspector MOEI 37. Kareema Abdu el Rahman Ahmed Female Assistant Investment Inspector MOEI 38. Ferdous Ahmed Zaid Female Assistant Investment Inspector MOEI 39. Ibrahim Omer Ali Alawad Male Assistant Investment Inspector MOEI 40. Samuel Haroun Anglu Male Assistant Investment Inspector MOEI 41. Nawal Mohamed Female Assistant Planning Inspector MOEI 42. Al Sharief Ahmed Mohamed Male Assistant Planning Inspector MOEI 43. Alawiya Al taybe Female Deputy Planning Director MOEI 44. Muneer tawir Almamoun Male Planning Inspector MOEI 45. Amna Hamid Gameel Female Directors Office MOEI 46. Nadiya Rahm talla Female Planning Inspector MOEI 47. Asmaa Tiya Female Planning Inspector MOEI 48. Abdalla Mohamed Saeed Male Logistic Director MOE

60
49. Adam Hamid Ahmed Male Secondary Education Director MOE 50. Jumaa Bero turuk Male Director for Primary Education MOE 51. Ahmed Abu el Basher Male Assistant Training Director MOE 52. Abdalla Shaib Nuh Male Training Director MOE 53. Ismail Adam Al Eisir Male Admin & Finance Manager MOE 54. Hawaa Ismail Bakr Female Finance Manager MOE 55. Um Jumaa Hussein Gaddal Female Adult Education Director MOE 56. Roda Naghbi Kuku Female Christian Education Inspector MOE 57. Omer Mohamed Ahmed Male Personnel Manager MOE 58. Khamis Al Gumla Madra Male Finance Manager MOE 59. Farouk Kuku Sulieman Male Internal auditor MOE 60. Fathiya Ismail Female Managing Director MOE 61. Adu el Moped Solieman Male Water Dept MORDWR
62. Awad Makeen Zaid Male Water Dept MORDWR 63. Mustafa Abdalla Kafi Male Volunteer MORDWR 64. Kamal Musa Zubeir Male Admin & Finance MORDWR 65. Tiya Kafi Kuwa Male Accountant MORDWR 66. Abdu el Biyn Mohamed Marieg Male Clerk MORDWR 67. Musa Abbu Kuku Male Engineer MORDWR 68. Fahmi el Amin Nasir Male Water Dept MORDWR 69. Saad el FadeelBdie Male Community Manager MORDWR 70. Salha Jumaa Fadalla Female Community Manager MORDWR 71. Samiya Hammad Al Maki Female Community Manager MORDWR 72. Haleema Ibrahim Adam Female Clerk MORDWR 73. Isam el Din Al Bushra Male Community Manager MORDWR 74. Zubeida Rabih Abdalla Female Manager MORDWR 75. Said Abdu el Rahim Said Male Manager MORDWR 76. Hashim Subiya Male Deputy Director MORDWR 77. Sumaya Shimeila Tutu Female Manager – Women &
Peace MOSWWC
78. Ibrahim Khamis Anglo Male Inspector MOSWWC 79. Abdu el Aziz Hamri Fadul Alla Male Researcher MOSWWC 80. Um Salama Nour Abu Shuk Female Manager – Public
Relations MOSWWC
81. Majdah Mohamed Suwar Female Director Generals Office MOSWWC 82. Hanan Ahmed Mohamed Female Manager – Women &
Child MOSWWC
83. Gamal Mohamed Burma Male Social Welfare Inspector MOSWWC 84. Ameena Karshuom Ali Female Manager – Women &
Family MOSWWC
85. Fadwa Hassan Musa Female Social Welfare Officer MOSWWC 86. El Zubeir Ibrahim Karshoum Male Religious Advisor MOSWWC 87. Siragah Hassan Female Officer MOSWWC 88. Musa Ahmed Yassine Omran Male Researcher- Kindergarten MOSWWC 89. Majdah Abu Anja Abu Rass Female Officer MOSWWC 90. Yasir Kabbashi Male Researcher MOSWWC 91. Al Faki Abdalla Malik Male Finance Director MOSWWC 92. Marium Faki Hassan Female Researcher MOSWWC 93. Salama Mohamed Musa (Dr.) Male Acting DG MOAAWNR

61
94. Abdu el Salam Abdu el Rahim Male Clerk MOAAWNR 95. El Nour Ali Kafi Male Senior Clerk MOAAWNR 96. Hassan Yuosif Ibrahim Male Horticulture MOAAWNR 97. Adam Abu Rass Madu Male Clerk MOAAWNR 98. Amal Mohamed Zakriya Female Horticulture MOAAWNR 99. Um Gerieda Yahiya Female Horticulture MOAAWNR 100. Intizar Adam Ismail Female Extension MOAAWNR 101. Suaad Mustafa Abdu Female Extension MOAAWNR 102. Einass Ahmed Sheddad Female Extension MOAAWNR 103. Asmehan Hassan Kambal Female Extension MOAAWNR 104. Hugguna Abdalla Hugguna Male Horticulture MOAAWNR 105. Mohamed Ahmed Hussien Male Extension MOAAWNR 106. Jumaa Al raid el Doud Male Personnel Inspector MOCIYS
107. Shadiya Hassan Abdu el Rahman Male Clerk MOCIYS 108. Mohamed Ahmed Guttiya Male Youth Inspector MOCIYS 109. Hassan Mohamed Sharf el Din Male Personnel Director MOCIYS 110. Adam Kais Tutu Male Planning & Researcher MOCIYS 111. Ibrahim Alawi El Nour Male Youth Officer MOCIYS 112. Yousif Abdu el Rahman Adam Male Training Inspector MOCIYS 113. Hussein Musa Zeidan Male Public Relations Inspector MOCIYS 114. Fatima elSheikh Mohamed Female Management Team Director MOCIYS 115. Budoor turki Female Youth Director MOCIYS 116. Seleema Suleiman Female Photographer MOCIYS 117. Igllal Mohamed Abbu Female Public Relations Director MOCIYS 118. Salwa Abbakr Ali Female Public Addressing MOCIYS 119. Mahasin Osman Gibreil Female Protocol Manager MOCIYS 120. Muju Hassan Tutu Male Director General MOCIYS 121. Zaynab Abdu el Kareem Female Youth Director MOCIYS 122. Merghani Fertack Male Expenditure Director MOF
123. Hussien Kannu Mahanna male Computer technician MOF 124. Mohamed el Hassan Male Ministers Office MOF 125. El Faki Ismail male Deputy Revenue Director MOF 126. Adil Mohamed Ahmed el Tuhami male Admin – Finance Manager MOF 127. el Nour Ahmed Salih Male Assistant Expenditure Director MOF 128. Nasr el Din Mohamed Salih Male Chapter One Director MOF 129. Hassan el Nour Abu Galah Male S. Stores Manager MOF 130. Abdalla el Jack Male Finance Manager MOF 131. Mohamed Rahal male Internal Auditor MOF 132. Khadeejah Hussien Female Personnel Director MOF 133. Fatima Mahajoub Female Finance Inspector MOF 134. Hahan Habib Aggala Female Accountant MOF 135. Muna Yousif Hamed Female Account Inspector MOF
Remark: 1 respondent from MOE did not write his/her name

UNITED NATIONS DEVELOPMENT PROGRAMME (UNDP)
AND
STATE MINISTRY OF SOCIAL WELFARE, WOMEN AND CHILDREN
Ministry of:_______________________________________________________
Annex 1.13: Gender Audit Questionnaire
1
1. The Gender Audit Questionnaire14 This gender audit questionnaire is designed to solicit three type of information concerning the status of gender equity in government institutions. The three categories of information are the following: (1) to what extent, (b) to what intensity, and (3) with what frequency?
1. To what extent?
Questions and statements designed to determine the extent of gender equality have the following response categories: • To the fullest extent (E5): means a comprehensive policy is fully implemented and monitored, the system is very clear and effective, value and norms
are widely shared and evident in action., there are well-designed training programmes regularly available for a large number of staff, and leadership champions the issue.
• To a greater extent (E4): means policy is fully in place and reliable implemented, the system is usually effective, values and norms are widely shared, training is widely implemented, and leadership is strongly and visibly committed
• To a moderate extent (E3): means there is a policy in place and usually implemented, the system is usually effective, values and norms are commonly expressed, training available to some staff, but leadership is clearly supportive
• To a limited extent (E2): means there is a policy being developed or in place but not implemented, the system is some what effective, dialogue on values and norms has begun, minimum training provided, leadership supportive but not proactive
• Not at all (E1): means there is no policy or system in place, little awareness by staff, no training available, and no expressed commitment to gender equity by the leadership
• Do not know (E0): means I have no knowledge of such a thing
2. To what intensity?
Questions and statements designed to determine the intensity of gender equity have the following response categories: • Strongly agree (I5): very clear and strong support for the statement • Agree (I4): Support for the statement • Disagree (I3): Lack of support for the statement • Strongly disagree (I2): very clear and strong lack of support fro the statement • No opinion (I1): neither support or lack of support for the statement
3. With what frequency?
Questions and statements designed to determine the frequency of gender equity have the following response categories:
• Always (F5): Very consistent and regular practice, behaviors and implementation policies • Frequently (F4): Fairly reliable practices, behaviors and implementation of policies • Occasionally (F3): meaning irregular practices, behaviors and implementation of policies • Seldom (F2): Infrequent, inconsistent practices, behaviors and implementation of policies • Never (F1): No practice, behavior or implementation of policies
INSTRUCTION: Please indicate your response by putting [ ] mark in the brackets provided for each choice 14 . This Gender Audit Questionnaire is adopted from Commission on the Advancement of Women (CAW), American Council for
Voluntary International Action (InterAction) 1995.

I. PROGRAMMING A. Programme planning and design This section focuses on procedures and methods used to conceptualize and design government development projects for beneficiaries: A1. Is the integration of gender equity in policies/programmes/projects
mandated in your Ministry? [ ] to the fullest extent [ ] to a greater extent [ ] to a moderate extent [ ] to a limited extent [ ] Not at all [ ] I do not know A2. Are gender equity goals and objectives included in
policies/programme/project design?
[ ] to the fullest extent [ ] to a greater extent [ ] to a moderate extent [ ] to a limited extent [ ] Not at all [ ] I do not know A3. For each policy/programme/project, is there a needs assessment, including
an analysis of gender role and responsibilities in the beneficiary community? [ ] to the fullest extent [ ] to a greater extent
[ ] to a moderate extent [ ] to a limited extent [ ] Not at all [ ] I do not know A4. Are best practices in gender integration in programming incorporated in
subsequent polices/programme/project design?
[ ] to the fullest extent [ ] to a greater extent [ ] to a moderate extent [ ] to a limited extent [ ] Not at all [ ] I do not know A5. Are gender questions or criterion included in your policies/
programme/project proposal approval process?
[ ] to the fullest extent [ ] to a greater extent [ ] to a moderate extent [ ] to a limited extent
[ ] Not at all [ ] I do not know A6. Does your Ministry use participatory methods to incorporate the views and
preferences of both male and female beneficiaries in policies/Progrmame/project design?
[ ] to the fullest extent [ ] to a greater extent
[ ] to a moderate extent [ ] to a limited extent [ ] Not at all [ ] I do not know
B. Programme implementation This section focuses on how government services/projects operate in the field B1. Does your Ministry’s policies/programme/project implementation plan
include activities that strengthen skills and provide men with equal access to services and training?
[ ] to the fullest extent [ ] to a greater extent
[ ] to a moderate extent [ ] to a limited extent [ ] Not at all [ ] I do not know B2. Does your Ministry’s policies/programme/project implementation plan
include activities that strengthen skills and provide women with equal access to services and training? [ ] to the fullest extent [ ] to a greater extent
[ ] to a moderate extent [ ] to a limited extent [ ] Not at all [ ] I do not know B3. Do your Ministry’s service provision implementation and strategies take into
account existing gender roles and interests of both male and female employees?
[ ] to the fullest extent [ ] to a greater extent
[ ] to a moderate extent [ ] to a limited extent [ ] Not at all [ ] I do not know B4. Female beneficiaries of my Ministry’s policies/programmes/projects value
and see our policies/programmes/projects as beneficial to their lives?
[ ] strongly agree [ ] agree [ ] disagree [ ] strongly disagree [ ] no opinion
B5. Male beneficiaries of my Ministry’s policies/programmes/projects value
and see our policies/programmes/projects as beneficial to their lives?
[ ] strongly agree [ ] agree [ ] disagree [ ] strongly disagree [ ] no opinion B6. My Ministry has developed the capacity to identify and handle gender
organizational resistance in policies/programmes/projects? [ ] strongly agree [ ] agree
[ ] disagree [ ] strongly disagree [ ] no opinion

1
C. Technical expertise This section focuses on the level of staff expertise in gender analysis and evaluation in your Ministry. C1. Is there a person or division responsible for gender in your Ministry?
[ ] to the fullest extent [ ] to a greater extent
[ ] to a moderate extent [ ] to a limited extent [ ] Not at all [ ] I do not know C2. Is there assigned staff responsible for gender integration in different
departments/programmes?
[ ] to the fullest extent [ ] to a greater extent [ ] to a moderate extent [ ] to a limited extent [ ] Not at all [ ] I do not know C3. Does your Ministry constantly seek technical support from a person or
division within the organization who is responsible for gender programming? [ ] to the fullest extent [ ] to a greater extent
[ ] to a moderate extent [ ] to a limited extent [ ] Not at all [ ] I do not know C4. Does your Ministry have the necessary knowledge, skills and attitude to
carry out their work with gender awareness? [ ] to the fullest extent [ ] to a greater extent
[ ] to a moderate extent [ ] to a limited extent [ ] Not at all [ ] I do not know C5. Have staff members of your Ministry received training in gender planning
and analysis?
[ ] to the fullest extent [ ] to a greater extent [ ] to a moderate extent [ ] to a limited extent [ ] Not at all [ ] I do not know C6. Policy/Programme/project planning, implementation, monitoring and
evaluation teams in my Ministry consist of members who are gender-sensitive and include at least one person with specific expertise and skills on gender issues?
[ ] always [ ] frequently
[ ] occasionally [ ] seldom [ ] never
D. Monitoring and Evaluation This section focuses on the extent to which gender disaggregated data and information is incorporated in the monitoring and evaluation of policies/programmes/projects in your Ministry. D1. Is gender disaggregated data colleted for policies/programmes/project
run by your Ministry?
[ ] to the fullest extent [ ] to a greater extent [ ] to a moderate extent [ ] to a limited extent [ ] Not at all [ ] I do not know D2. Is the gender impact of policies/programmes/projects of your Ministry
monitored and evaluated? [ ] to the fullest extent [ ] to a greater extent
[ ] to a moderate extent [ ] to a limited extent [ ] Not at all [ ] I do not know D3. Does your Ministry have gender specific indicators for
policies/programme/projects?
[ ] to the fullest extent [ ] to a greater extent [ ] to a moderate extent [ ] to a limited extent [ ] Not at all [ ] I do not know D4. Gender disaggregated data provides useful information for
policies/programme/project evaluation and subsequent programme/project design?
[ ] strongly agree [ ] agree
[ ] disagree [ ] strongly disagree [ ] no opinion D5. My Ministry’s policy/programmes/projects contribute to the empowerment
of women and changing of unequal gender relations?
[ ] strongly agree [ ] agree [ ] disagree [ ] strongly disagree [ ] no opinion

2
D6. My Ministry’s policies/programmes/projects contribute to increased gender equity in the following area:
Material well being [ ] Yes [ ] No [ ] Don’t know Access resources [ ] Yes [ ] No [ ] Don’t know Access to training [ ] Yes [ ] No [ ] Don’t know Participation in decision-making [ ] Yes [ ] No [ ] Don’t know
Self-respect/legal status [ ] Yes [ ] No [ ] Don’t know Control over benefits [ ] Yes [ ] No [ ] Don’t know Control over resources [ ] Yes [ ] No [ ] Don’t know Participation in the public sphere [ ] Yes [ ] No [ ] Don’t know
D7. My Ministry’s policies/programmes/projects collect gender disaggregated
data in the following areas: Material well being [ ] Yes [ ] No [ ] Don’t know Access resources [ ] Yes [ ] No [ ] Don’t know Access to training [ ] Yes [ ] No [ ] Don’t know Participation in decision-making [ ] Yes [ ] No [ ] Don’t know
Self-respect/legal status [ ] Yes [ ] No [ ] Don’t know Control over benefits [ ] Yes [ ] No [ ] Don’t know Control over resources [ ] Yes [ ] No [ ] Don’t know Participation in the public sphere [ ] Yes [ ] No [ ] Don’t know Beneficiaries view of the programme [ ] Yes [ ] No [ ] Don’t know
E. Partner Organization This section focuses on the level of gender integration in your Ministry’s relations with partners. E1. Is commitment to gender equity a criteria for your Ministry’s selection of
partners?
[ ] to the fullest extent [ ] to a greater extent [ ] to a moderate extent [ ] to a limited extent [ ] Not at all [ ] I do not know E2. Is commitment to gender equity included in written agreements outlining
your Ministry’s relationship with partners?
[ ] to the fullest extent [ ] to a greater extent [ ] to a moderate extent [ ] to a limited extent [ ] Not at all [ ] I do not know E3. Does your Ministry provide training and tools on gender planning, analysis
and evaluation to its partners?
[ ] to the fullest extent [ ] to a greater extent [ ] to a moderate extent [ ] to a limited extent [ ] Not at all [ ] I do not know
E4. What are some of the obstacles to incorporating gender analysis in
policies/programme/project planning, implementation, monitoring and evaluation in your Ministry? Please tick all that apply [ ].
[ ] Organizational size [ ] staff size [ ] office culture/environment [ ] local culture
[ ] Lack of financial resources for gender programming [ ] lack of staff training on gender
[ ] Lack of gender analysis tools [ ] lack of support from senior management [ ] low organizational priority for gender
[ ] other, please specify below: ____________________________________________________ ____________________________________________________
II. ORGANIZATION Experience shows that there are usually underlying reasons outside of the strictly programmatic realm which affect the dynamic’s of programming. Please take a moment to reflect on the following areas: A. Gender policy This section focuses on the nature and quality of your Ministry’s gender policy A1. Does your Ministry have a written gender policy that affirms a commitment
to gender equity?
[ ] to the fullest extent [ ] to a greater extent [ ] to a moderate extent [ ] to a limited extent [ ] Not at all [ ] I do not know A2. Does your Ministry’s gender policy have an operational plan that includes
clear allocation of responsibilities and time for monitoring and evaluation?
[ ] to the fullest extent [ ] to a greater extent [ ] to a moderate extent [ ] to a limited extent [ ] Not at all [ ] I do not know

3
A3. Is gender taken into account during strategic planning process for your Ministry? [ ] to the fullest extent [ ] to a greater extent
[ ] to a moderate extent [ ] to a limited extent [ ] Not at all [ ] I do not know A4. Everyone in my Ministry feels ownership of the gender policy.
[ ] strongly agree [ ] agree [ ] disagree [ ] strongly disagree [ ] no opinion A5. Management takes responsibility for the development and implementation
of gender policy
[ ] always [ ] frequently [ ] occasionally [ ] seldom [ ] never B. Staffing This section focuses on the gender composition of staff in your Ministry. B1. Has there been an increase in the representation of women in senior
management positions in the past few years at the head office of your Ministry?
[ ] to the fullest extent [ ] to a greater extent
[ ] to a moderate extent [ ] to a limited extent [ ] Not at all [ ] I do not know B2. In your Ministry’s Field locations, has there been an increase in the
representation of women in senior management positions in the past few years?
[ ] to the fullest extent [ ] to a greater extent
[ ] to a moderate extent [ ] to a limited extent [ ] Not at all [ ] I do not know B3. Has there been an increase in the representation of women in your
Ministry’s committees, task forces, etc? [ ] to the fullest extent [ ] to a greater extent
[ ] to a moderate extent [ ] to a limited extent [ ] Not at all [ ] I do not know
B4. Are there proactive strategies implemented to recruit and promote women into senior management positions?
[ ] to the fullest extent [ ] to a greater extent
[ ] to a moderate extent [ ] to a limited extent [ ] Not at all [ ] I do not know B5. Does management show respect for diversity in work and management
style between women and men in your Ministry?
[ ] to the fullest extent [ ] to a greater extent [ ] to a moderate extent [ ] to a limited extent [ ] Not at all [ ] I do not know C. Human resources This section focuses on human resources policies and the level and extent of gender consideration in hiring and personnel performance evaluation and reviews. C1. Is there a written equal employment opportunity policy in your Ministry?
[ ] to the fullest extent [ ] to a greater extent [ ] to a moderate extent [ ] to a limited extent [ ] Not at all [ ] I do not know C2. Are there flexible working arrangements in your Ministry?
[ ] to the fullest extent [ ] to a greater extent [ ] to a moderate extent [ ] to a limited extent [ ] Not at all [ ] I do not know C3. Is there a maternity and paternity leave policy in your Ministry?
[ ] to the fullest extent [ ] to a greater extent [ ] to a moderate extent [ ] to a limited extent [ ] Not at all [ ] I do not know C4. Is there a childcare and dependent care leave policy in your Ministry?
[ ] to the fullest extent [ ] to a greater extent [ ] to a moderate extent [ ] to a limited extent [ ] Not at all [ ] I do not know C5. Is gender awareness included in all job descriptions in your Ministry?
[ ] to the fullest extent [ ] to a greater extent [ ] to a moderate extent [ ] to a limited extent [ ] Not at all [ ] I do not know

4
C6. Is gender awareness included in staff performance and development review criteria in your Ministry?
[ ] to the fullest extent [ ] to a greater extent
[ ] to a moderate extent [ ] to a limited extent [ ] Not at all [ ] I do not know C7. Is there training of staff in gender awareness and sensitization in you
Ministry?
[ ] to the fullest extent [ ] to a greater extent [ ] to a moderate extent [ ] to a limited extent [ ] Not at all [ ] I do not know C8. Is there training of senior management team in institutionalizing the
integration of gender in to the management of your Ministry?
[ ] to the fullest extent [ ] to a greater extent [ ] to a moderate extent [ ] to a limited extent [ ] Not at all [ ] I do not know C9. My Ministry promotes teamwork, involving both men and women as equal
partners.
[ ] strongly agree [ ] agree [ ] disagree [ ] strongly disagree [ ] no opinion C10. Management is committed to promoting female representation at senior
levels in my Ministry?
[ ] strongly agree [ ] agree [ ] disagree [ ] strongly disagree [ ] no opinion C11. There has been a gradual increase of gender expertise among staff
members in my Ministry.
[ ] strongly agree [ ] agree [ ] disagree [ ] strongly disagree [ ] no opinion C12. Good performance in the field of gender is rewarded in my Ministry.
[ ] strongly agree [ ] agree [ ] disagree [ ] strongly disagree [ ] no opinion
D. Advocacy, lobbying and communication This section focuses on the quality and gender sensitivity of your Ministry’s advocacy, lobbying and communication efforts. D1. Are your Ministry’s advocacy and lobbying initiatives planed and informed
by gender perspectives?
[ ] to the fullest extent [ ] to a greater extent [ ] to a moderate extent [ ] to a limited extent [ ] Not at all [ ] I do not know D2. Are your Ministry’s advocacy and lobbying policies and plans influenced
and advised by women’s organizations, networks and gender experts?
[ ] to the fullest extent [ ] to a greater extent [ ] to a moderate extent [ ] to a limited extent [ ] Not at all [ ] I do not know D3. Is gender incorporated in your Ministry’s communications, and media
strategies?
[ ] to the fullest extent [ ] to a greater extent [ ] to a moderate extent [ ] to a limited extent [ ] Not at all [ ] I do not know D4. Is gender perspective reflected in your Ministry’s publications, for example
books, brochures, newsletters, etc
[ ] to the fullest extent [ ] to a greater extent [ ] to a moderate extent [ ] to a limited extent [ ] Not at all [ ] I do not know E. Financial resources This section focuses on the level of resources your Ministry’s budgeted for gender equity. E1. Does your Ministry budget adequate financial resources to support its
gender integration work?
[ ] to the fullest extent [ ] to a greater extent [ ] to a moderate extent [ ] to a limited extent [ ] Not at all [ ] I do not know

5
E2. Are financial resources allocated for the operationalization of the gender policy at all levels?
[ ] to the fullest extent [ ] to a greater extent
[ ] to a moderate extent [ ] to a limited extent [ ] Not at all [ ] I do not know E3. Is staff training in gender issues systematically budgeted for in your
Ministry?
[ ] to the fullest extent [ ] to a greater extent [ ] to a moderate extent [ ] to a limited extent [ ] Not at all [ ] I do not know F. Organizational culture This section focuses on the level of gender sensitivity in the culture of your Ministry F1. Does your Ministry encourage a gender sensitive behavior, for example in
terms of language use, jokes and comments?
[ ] to the fullest extent [ ] to a greater extent [ ] to a moderate extent [ ] to a limited extent [ ] Not at all [ ] I do not know F2. Does your Ministry reinforce gender sensitive behavior and procedure to
prevent and address harassment of women?
[ ] to the fullest extent [ ] to a greater extent [ ] to a moderate extent [ ] to a limited extent [ ] Not at all [ ] I do not know F3. Is staff in your Ministry committed to the implementation of a gender
policy?
[ ] to the fullest extent [ ] to a greater extent [ ] to a moderate extent [ ] to a limited extent [ ] Not at all [ ] I do not know F4. Are gender issues taken seriously and discussed openly by men and women
in your Ministry?
[ ] to the fullest extent [ ] to a greater extent [ ] to a moderate extent [ ] to a limited extent [ ] Not at all [ ] I do not know
F5. Is gender bias addressed and countered by individual staff members in your Ministry?
[ ] to the fullest extent [ ] to a greater extent
[ ] to a moderate extent [ ] to a limited extent [ ] Not at all [ ] I do not know F6. There is a gap between how women and men view gender issues in my
Ministry?
[ ] strongly agree [ ] agree [ ] disagree [ ] strongly disagree [ ] no opinion F7. The staff in my Ministry is enthusiastic about the gender work they do.
[ ] strongly agree [ ] agree [ ] disagree [ ] strongly disagree [ ] no opinion F8. Staff in my Ministry thinks that the promotion of gender equity fits into the
image of our organization.
[ ] strongly agree [ ] agree [ ] disagree [ ] strongly disagree [ ] no opinion F9. Women in my Ministry think the Ministry is women friendly
[ ] strongly agree [ ] agree [ ] disagree [ ] strongly disagree [ ] no opinion F10. Men in my Ministry think the Ministry is women friendly
[ ] strongly agree [ ] agree [ ] disagree [ ] strongly disagree [ ] no opinion F11. My Ministry has a reputation of integrity and competence on gender issues
compared to other Ministries [ ] strongly agree [ ] agree
[ ] disagree [ ] strongly disagree [ ] no opinion
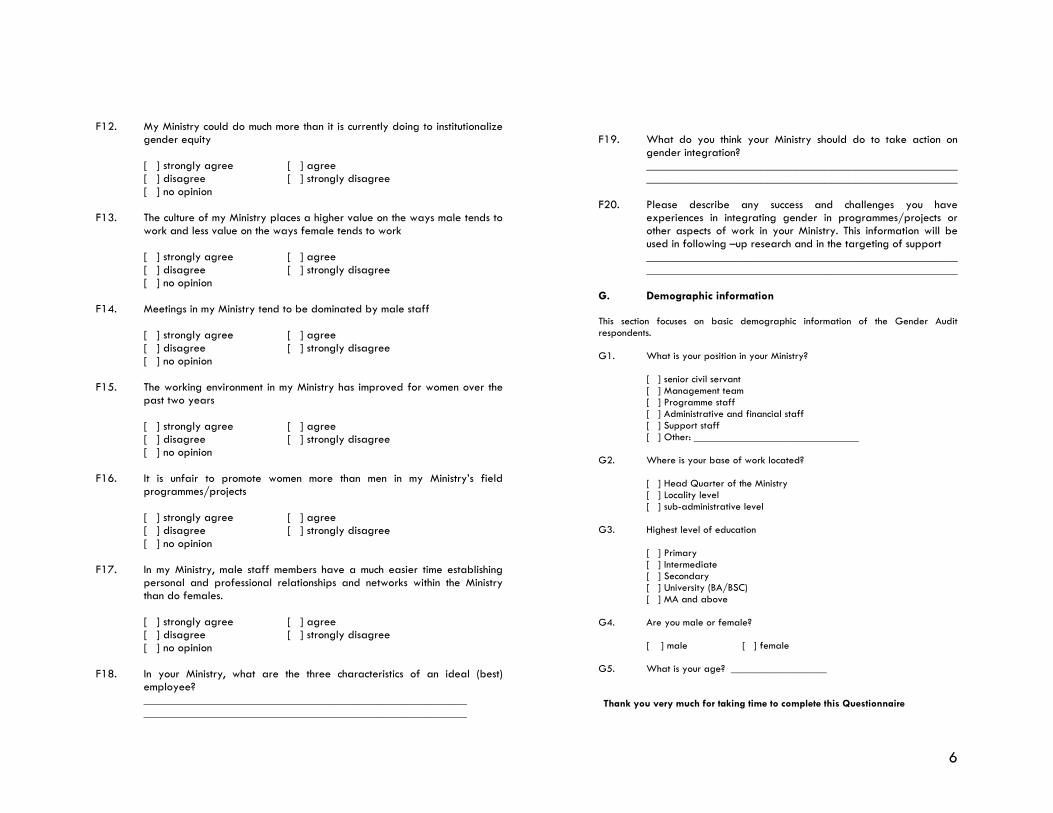
6
F12. My Ministry could do much more than it is currently doing to institutionalize gender equity [ ] strongly agree [ ] agree
[ ] disagree [ ] strongly disagree [ ] no opinion
F19. What do you think your Ministry should do to take action on
gender integration? ____________________________________________________
____________________________________________________
F13. The culture of my Ministry places a higher value on the ways male tends to
work and less value on the ways female tends to work
[ ] strongly agree [ ] agree [ ] disagree [ ] strongly disagree [ ] no opinion F14. Meetings in my Ministry tend to be dominated by male staff
[ ] strongly agree [ ] agree [ ] disagree [ ] strongly disagree [ ] no opinion F15. The working environment in my Ministry has improved for women over the
past two years
[ ] strongly agree [ ] agree [ ] disagree [ ] strongly disagree [ ] no opinion F16. It is unfair to promote women more than men in my Ministry’s field
programmes/projects
[ ] strongly agree [ ] agree [ ] disagree [ ] strongly disagree [ ] no opinion F17. In my Ministry, male staff members have a much easier time establishing
personal and professional relationships and networks within the Ministry than do females.
[ ] strongly agree [ ] agree
[ ] disagree [ ] strongly disagree [ ] no opinion F18. In your Ministry, what are the three characteristics of an ideal (best)
employee? ______________________________________________________
______________________________________________________
F20. Please describe any success and challenges you have experiences in integrating gender in programmes/projects or other aspects of work in your Ministry. This information will be used in following –up research and in the targeting of support ________________________________________________________________________________________________________
G. Demographic information This section focuses on basic demographic information of the Gender Audit
respondents. G1. What is your position in your Ministry? [ ] senior civil servant [ ] Management team [ ] Programme staff [ ] Administrative and financial staff [ ] Support staff [ ] Other: _______________________________
G2. Where is your base of work located?
[ ] Head Quarter of the Ministry [ ] Locality level [ ] sub-administrative level
G3. Highest level of education [ ] Primary [ ] Intermediate [ ] Secondary [ ] University (BA/BSC) [ ] MA and above
G4. Are you male or female? [ ] male [ ] female
G5. What is your age? __________________
Thank you very much for taking time to complete this Questionnaire