Gender and Preferences for Malaria Prevention in Tigray...
29
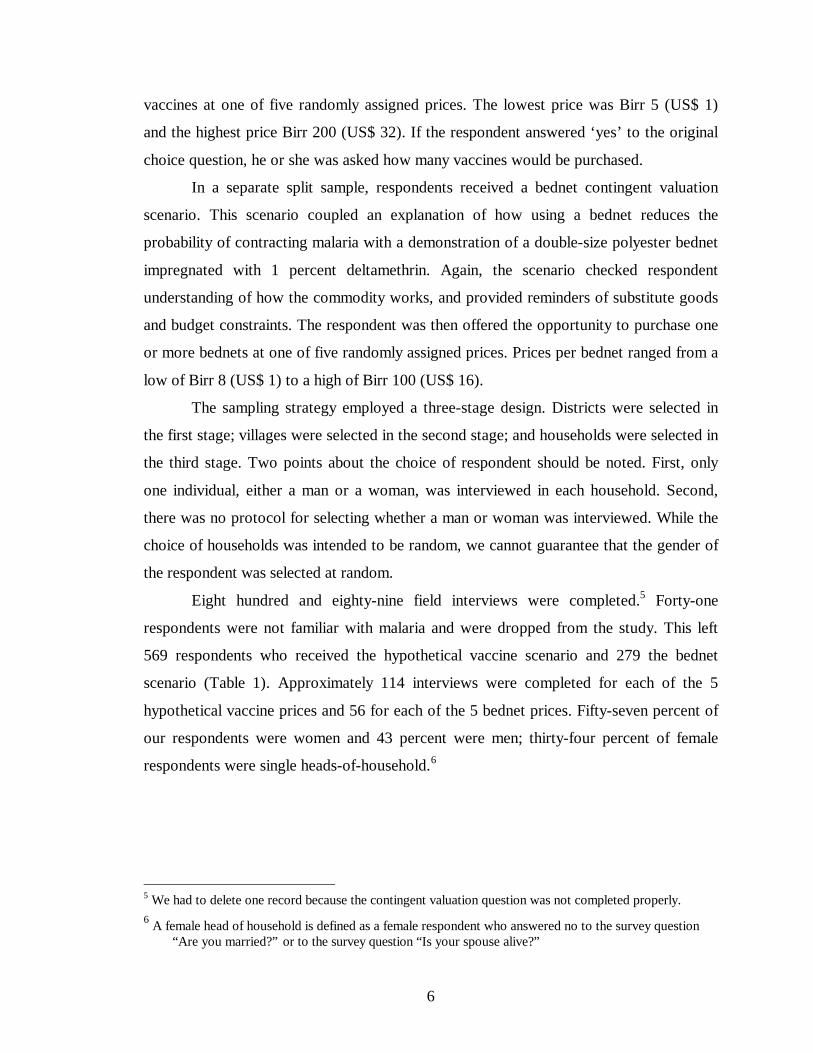
Gender and Preferences for Malaria Prevention in Tigray, Ethiopia Julian A. Lampietti Christine Poulos Maureen L. Cropper Haile Mitiku Dale Whittington October 1999 The World Bank Development Research Group/ Poverty Reduction and Economic Management Network POLICY RESEARCH REPORT ON GENDER AND DEVELOPMENT Working Paper Series, No. 3 The PRR on Gender and Development Working Paper Series disseminates the findings of work in progress to encourage the exchange of ideas about the Policy Research Report. The papers carry the names of the authors and should be cited accordingly. The findings, interpretations, and conclusions are the author’s own and do not necessarily represent the view of the World Bank, its Board of Directors, or any of its member countries. Copies are available online at http: //www.worldbank.org/gender/prr. This paper examines how demand for preventive health care differs depending on whose preferences in the household are assessed. The analysis indicates that married women are willing to pay more to prevent malaria in their household malaria than married men. There are, however, no significant differences in the rate at which male and female respondents substitute teenagers and children for adults when choosing an optimal amount of malaria prevention for their household. A new test of the ‘common preference’ hypothesis is presented.
Transcript of Gender and Preferences for Malaria Prevention in Tigray...

Gender and Preferences forMalaria Prevention inTigray, Ethiopia
Julian A. LampiettiChristine PoulosMaureen L. CropperHaile MitikuDale Whittington
October 1999The World BankDevelopment Research Group/Poverty Reduction and Economic Management Network
POLICY RESEARCH REPORT ONGENDER AND DEVELOPMENTWorking Paper Series, No. 3
The PRR on Gender and Development Working Paper Series disseminates the findings of work in progress to encourage theexchange of ideas about the Policy Research Report. The papers carry the names of the authors and should be cited accordingly.The findings, interpretations, and conclusions are the author’s own and do not necessarily represent the view of the World Bank, itsBoard of Directors, or any of its member countries.Copies are available online at http: //www.worldbank.org/gender/prr.
This paper examines how demandfor preventive health care differsdepending on whose preferences inthe household are assessed. Theanalysis indicates that marriedwomen are willing to pay more toprevent malaria in their householdmalaria than married men. Thereare, however, no significantdifferences in the rate at which maleand female respondents substituteteenagers and children for adultswhen choosing an optimal amountof malaria prevention for theirhousehold. A new test of the‘common preference’ hypothesis ispresented.

Gender and Preferences for MalariaPrevention in Tigray, Ethiopia
Julian A. Lampiettia, Christine Poulosb, Maureen L. Croppera,
Haile Mitikuc, and Dale Whittingtonb
Abstract: This paper examines how demand for preventive health care differs
depending on whose preferences in the household are assessed. The analysis
indicates that married women are willing to pay more to prevent malaria in their
household malaria than married men. There are, however, no significant
differences in the rate at which male and female respondents substitute teenagers
and children for adults when choosing an optimal amount of malaria prevention
for their household. A new test of the ‘common preference’ hypothesis is
presented.
Keywords: Intrahousehold Allocation; Malaria; Gender Analysis, Non-market
valuation, Health Economics
a The World Bankb University of North Carolina, Chapel Hillc Mekele University College, Mekele, Ethiopia
This article is based on Julian A. Lampietti’s Ph.D. dissertation “Assessing Preferences for Health Care: Willingness toPay for Malaria Prevention in Northern Ethiopia” (University of North Carolina at Chapel Hill, 1999). The researchreceived financial support from the UNDP/World Bank/WHO Special Programme for Research and Training inTropical Disease (TDR). Thanks are due to V. K. Smith for inspiring the ideas presented here and to Bill Evans forproviding the SAS code used to estimate the model. The field work would not have been possible without the help ofK. Komives and T. Ghebreyesus. Earlier drafts of this paper benefited from comments by Robert Conrad, Mike Luger,John Villani, Andrew Mason, Hanan Jacoby, Lant Pritchett, Francois Bourginion, Shahidur Khandker, and Nobu Fuwa.

1
Introduction1
One of the goals of the literature on intrahousehold allocation is to determine
whether husbands and wives would make the same choices when confronted with
decisions regarding family welfare. The literature to date suggests that they would not, a
finding that has important policy implications. For example, if wives purchase more
health care for their families than husbands, policies that place more resources in the
hands of women would have significantly different impacts on household welfare than
policies to increase the incomes of men. This depends, of course, on women having the
opportunity and resources to make these purchase decisions.
This paper examines whether husbands and wives in northern Ethiopia make the
same choices with regard to an important form of health care -- malaria prevention.2
Specifically, we compare husbands' and wives' demand functions for two different goods
that prevent malaria. Our interest lies not only in seeing whether the demand functions of
husbands and wives differ, but also in how these demand functions are affected by family
composition. Holding family size constant, will households with more children buy more
bednets or fewer bednets, and will this decision differ between husbands and wives?
While the policy implications of these decisions are important in their own right,
this research also contributes to the growing literature on intra-household allocation
decisions. As noted by Thomas (1997), tests of the hypothesis that families maximize a
common utility function (the common preference hypothesis) rely on the maintained
assumption that purchase decisions depend only on the sum of non-earned incomes in the
family. Rejection of the hypothesis rests on showing that the distribution of non-earned
incomes within the family affects spending. Measuring non-earned income is, however,
fraught with difficulty.
We present a new approach to testing the common preference hypothesis. If one is
willing to accept that stated choices reflect preferences, then confronting husbands and
1 The findings, interpretations, and conclusions expressed in this paper are entirely those of the authors and
should not in any way be attributed to the World Health Organization or the World Bank.2 This paper builds on a paper by Lampietti (1999).

2
wives with such choices provides an alternative method of testing whether they have the
same preferences. If preferences differ between husbands and wives, then the common
preference model cannot hold.
We illustrate this approach using data collected in the Tembien region of Tigray,
Ethiopia, in January 1997. Heads of household or their spouses were asked how many
hypothetical malaria vaccines or bednets they would purchase for their household at a
given price. These data are used to estimate household demand functions for malaria
vaccines and bednets for male and female respondents. While the choice of who in the
household was interviewed was not random, the demand function for husbands should
reflect mean preferences of married men and the demand function for wives should
reflect mean preferences of married women.
Whether husbands and wives in Ethiopia have the same demands for malaria
prevention depends in part on the form that prevention takes. In the case of a hypothetical
malaria vaccine--a private good that, by assumption, would protect each person
inoculated with the vaccine for one year -- wives would purchase more vaccines for their
families at each price than would husbands. There is however, no difference in the impact
of family composition on vaccine demand between husbands and wives. In both cases,
families with more children purchase fewer vaccines, holding family size constant.
For bednets--a private good that within households has some of the properties of a
public good -- we cannot reject the null hypothesis that the demand functions are the
same. This may be because of the quasi-public nature of the good or because the bednet
scenario was administered to about half as many respondents as the vaccine scenario,
making it more difficult to reject the null hypothesis of common preferences.
Theoretical Model
This section develops a theoretical model that combines Becker’s (1981)
benevolent dictator model and Grossman’s (1972) health production model. Becker
assumes that a single individual, such as a head of household or their spouse, makes the
consumption choices for the entire household. Let us call this person the decision-maker
and assume he or she is benevolent. Each family member i enters the decision-maker’s

3
utility function. Utility is a function of consumption of a numeraire (Xi), leisure time (Li),
the amount of time spent ill with malaria (Si), and a vector of decision-maker
characteristics (Z) such as education, age, and gender. Assuming n family members,
utility is given by
U= u(X1,… ,Xn, L1,… ,Ln, S1,… ,Sn, Z).3 (1)
Grossman’s model relates the individual’s choice of health inputs to health
outcomes. The time spent ill (Si) with malaria by each individual is a function of
preventive care such as vaccines or bednets (Ai) and treatment such as chloroquine (Mi).
How effective these inputs are depends on individual health characteristics (Hi) and, in
the case of malaria, on the prevalence of the mosquitoes (which transmit malaria), E.
Si = s(Ai, Mi, Hi, E). (2)
The decision-maker maximizes utility subject to the household budget constraint,
∑∑∑ ∑∑=== ==
++=−−+n
iim
n
iia
n
i
n
iiiiii MpApXSLTwI
111 1
n
1i
)( . (3)
where ∑=
n
iiI
1
is the sum of each individual’s non-earned income (I) and ∑ −−=
n
iiii SLTw
1)( is
earned income, which is equal to the sum of each individual’s wages (w) times the total
time available for work (T) minus leisure time (L) and time spent sick (S) with malaria.
The sum of these equals total household consumption. This budget constraint indicates
household expenditures on consumption, prevention, and treatment cannot exceed
household income. The decision-maker selects values of vectors X, L, A, and M to
maximize household utility subject to the budget constraint and to the health production
functions. This yields a household demand function for preventive care, where A* is the
number of vaccines chosen by the decision-maker:
3 This model is observationally equivalent to the common preference model in which members of the
household have identical preferences over the vectors X, L, and S.

4
),,,,,,(g * EppIA ma HZw= (4)
This function indicates that demand for malaria prevention depends on household
non-earned income, a vector of wages for each household member, as well as the prices
of preventive and mitigating health care, a vector of decision-maker characteristics, a
vector of baseline health for each individual, and the prevalence of mosquitoes.
The demand function can be used to examine how the quantity of preventive care
purchased changes with the gender of the respondent and the composition of the
household. For example, the literature on intrahousehold allocation suggests that
improvements in child health have also been associated with a mother’s control over
family resources. If true, then we would expect women to purchase more preventive care
for their children than men do. Holding household size constant, do households with a
large number of children purchase more or less vaccines? How is the answer to this
question affected by the gender of the respondent? Answering these questions begins to
provide insights into the intrahousehold allocation of preventive health care.
The value of protecting n household members with hypothetical vaccines is the
maximum amount of income that can be taken away from the decision-maker while
giving him or her A* vaccines and keeping utility constant. Formally, this is the area
under the decision-maker’s income-compensated (Hicksian) demand curve for vaccines.
This can be approximated using equation (4). The total value the decision-maker places
on preventing malaria in themselves and members of their household or Willingness To
Pay (WTP) for prevention is the area under the demand curve and to the left of household
size. This can be written as:
dAEppIgWTPn
ba∫=0
),,,,,,( HZw (5)
Study Site, Research Design, and Sampling
The data were collected in 1997 in the Tembien sector of Tigray province,
northern Ethiopia as part of a project to assess the demand for malaria prevention and to

5
compute the medical costs and productivity losses associated with the disease.4 The value
people place on preventing malaria is a function of their economic circumstances and the
severity of the disease. In Tigray, the primary activity is subsistence cultivation. Given
the relatively small size of their land holdings, the low productivity of their land, and
difficulties in gaining access to inputs and technology, many households are unable to
produce enough food (Relief Society of Tigray, 1995).
These problems are compounded by the incidence of malaria, which reaches its
peak during the harvest each year (Figure 1). Government control activities include
spraying in the early part of the transmission season, encouraging environmental control
by communities, and training health workers to recognize and treat malaria with
chloroquine.
The research design was tailored to the study area. Two-thirds of the households
sampled were presented with the hypothetical vaccine scenario and one third with the
bednet scenario. Each household was randomly assigned one of five prices for either the
hypothetical vaccine or the bednet.
A three-part survey instrument was administered. The first part asked questions
about a household’s current health status, knowledge of malaria, and expenditures on
malaria prevention and treatment. The second part presented the respondent with one of
two contingent valuation scenarios. The third part requested information on the
socioeconomic characteristics of the household members.
The hypothetical vaccine scenario started by explaining to the respondent that
such a vaccine was not currently and might never become available. Then the enumerator
described a vaccine that would prevent the recipient from contracting malaria for one
year. The scenario included a detailed description of the commodity, checked respondent
understanding of how it worked, and provided reminders of substitute goods and the
budget constraint. It was also emphasized that a separate vaccine would need to be
purchased for each member of the household in order to protect them from getting
malaria for one year.
The respondent was then asked whether he or she would purchase one or more
4 A detailed description of the project and its results may be found in The Value of Preventing Malaria in
Tigray, Ethiopia (Cropper et al. 1999).
6
vaccines at one of five randomly assigned prices. The lowest price was Birr 5 (US$ 1)
and the highest price Birr 200 (US$ 32). If the respondent answered ‘yes’ to the original
choice question, he or she was asked how many vaccines would be purchased.
In a separate split sample, respondents received a bednet contingent valuation
scenario. This scenario coupled an explanation of how using a bednet reduces the
probability of contracting malaria with a demonstration of a double-size polyester bednet
impregnated with 1 percent deltamethrin. Again, the scenario checked respondent
understanding of how the commodity works, and provided reminders of substitute goods
and budget constraints. The respondent was then offered the opportunity to purchase one
or more bednets at one of five randomly assigned prices. Prices per bednet ranged from a
low of Birr 8 (US$ 1) to a high of Birr 100 (US$ 16).
The sampling strategy employed a three-stage design. Districts were selected in
the first stage; villages were selected in the second stage; and households were selected in
the third stage. Two points about the choice of respondent should be noted. First, only
one individual, either a man or a woman, was interviewed in each household. Second,
there was no protocol for selecting whether a man or woman was interviewed. While the
choice of households was intended to be random, we cannot guarantee that the gender of
the respondent was selected at random.
Eight hundred and eighty-nine field interviews were completed.5 Forty-one
respondents were not familiar with malaria and were dropped from the study. This left
569 respondents who received the hypothetical vaccine scenario and 279 the bednet
scenario (Table 1). Approximately 114 interviews were completed for each of the 5
hypothetical vaccine prices and 56 for each of the 5 bednet prices. Fifty-seven percent of
our respondents were women and 43 percent were men; thirty-four percent of female
respondents were single heads-of-household.6
5 We had to delete one record because the contingent valuation question was not completed properly.6 A female head of household is defined as a female respondent who answered no to the survey question
“Are you married?” or to the survey question “Is your spouse alive?”

7
Household Demographic Characteristics
The average household interviewed consisted of five members: two adults, one
teenager (12-19 years of age), and two children (0-11 years of age). The mean age of
respondents in our sample is 42, with men being slightly above the mean and women
being slightly below it. Literacy is low, with only 13 percent of those interviewed
claiming they can read a newspaper with ease. There is a considerable disparity in
literacy by gender, with 22 percent of the men in our sample responding that they could
read a newspaper with ease, while only 7 percent of women responded in this manner.
Labor markets in Tembien are not well developed, making it difficult to measure
wages, (w), in the theoretical model. It is possible to use an agricultural production
function – in which output depends on the time input of each family member – to impute
wages for each household member. However, obtaining measures of time input for each
family member remains a difficult empirical task that we chose not to undertake. Instead,
we estimate household income and use this as a proxy for w.
Adding together crop production, annualized livestock holdings, and off-farm
income provides a measure of annual household income. Mean household income is Birr
1,387 (US$ 220) and the median is Birr 1,157 (US$ 183). There are a number of
households with very low incomes. One explanation for this is that these households do
not produce enough food to support themselves but have coping mechanisms, such as
participating in local ‘food for work’ programs, not captured in the survey.
There are significant gender-based differences in reported agricultural income,
with men reporting larger figures than women do. This suggests either a systematic
difference in households in which men and women were interviewed (non-equivalence of
test groups) or gender-based recall error (measurement error). Separating households by
respondent gender and marital status reveals that female-headed households are
significantly worse off than all others. This may be because of the absence of adult males
to undertake plowing at the onset of the rainy season.
There is also a difference in the incomes reported by married men and women
(jointly headed households). Examination of non-agricultural measures of wealth in these
households, such as off-farm income, housing characteristics, and household assets
(lanterns, beds, radios, shoes, and jerricans) reveals that there are no other significant

8
economic differences between these groups (Table 2). This suggests that there are no
systematic differences in economic status between married households with male
respondents and those with female respondents.
A possible explanation for differences in the reporting of income can be found in
the traditional division of household responsibilities. In northern Ethiopia, while both
sexes are equally involved in agricultural production, men are responsible for marketing
agricultural surplus (livestock and grain) and women for minding the granary. This could
explain why men report higher agricultural income than women: men recall production
while women recall consumption.
Malaria in Study Area
Malaria is endemic in Tembien, with peak transmission coinciding with the
beginning of the harvest. Both Plasmodium falciparum and Plasmodium vivax are
present, with Plasmodium falciparum predominating (Ghebreyesus et al., 1996).7 There
appear to be gender-based differences in the respondents’ perception of whether malaria
is more serious for adults or for children (Table 3). Forty-eight percent of men believe
that malaria is more serious for children, while 48 percent believe that it is equally
serious for adults and children. Thirty-seven percent of women believe that malaria is
more serious for children and 59 percent believe that it is equally serious for both adults
and children. That male respondents perceive malaria to be more serious for children than
female respondents counters the conventional wisdom that females are more sensitive to
the health of children than males.
Malaria is widespread, with 78 percent of respondents reporting that they have
had malaria at least once in their lifetime. Incidence is evenly distributed across
household members. Fifty-eight percent of respondents had malaria at least once in the
last two years. Fifty-three percent report that at least one other adult in their household
had the disease in the last two years. Forty-nine percent report that at least one teenager
or child in their household had malaria in the last two years.
A number of factors might contribute to a disparity in reported malaria incidence
7 Plasmodium falciparum is the more virulent of the two species.

9
between the sexes in their lifetime (86 percent for men and 72 percent for women). First,
men are generally more mobile than women and children, and thus may be more exposed
to infection. Second, 98 percent of the community health workers are men carrying out
their duties from their homes (Ghebreyesus et al. 1996). Focus group discussions have
revealed that women are reluctant to see male health workers for cultural reasons, thus
they may under-report the occurrence of malaria (Ghebreyesus et al. 1996). Finally,
males may receive treatment more often and report a higher incidence than females
because their health is given priority by the household. This is because males perform
critical strenuous agricultural activities, such as plowing, that support the household’s
agricultural production.
Analysis of Contingent Valuation Responses
The principal choice question asked respondents how many vaccines or bednets
they would purchase at one of five randomly assigned prices. Thirty-nine percent of
respondents agreed to purchase one or more vaccines. Conditional on buying any, the
mean quantity purchased was four and the median three. Sixty-two percent of
respondents agreed to purchase one or more bednets, the mean and median quantity
purchased were both one.
Cross tabulations reveal that for both vaccines and bednets the quantity purchased
decreases with an increase in price (Table 4 and Table 5). The null hypothesis that
number purchased does not vary systematically with price is rejected for both goods.8
This suggests that respondents seriously considered the price information in the scenario
and that their responses depended upon the price they received.
This is valuable information for the design of malaria prevention programs.
Figure 2, which is based on a sub-sample of Table 4, simulates the purchasing behavior
of married men and women in a hypothetical 200-household village. At prices above Birr
20 (US$ 3) per vaccine, married females’ demand lies to the right of married males’
demand.
The figure suggests that at prices over Birr 20 (US$ 3), demand is systematically
8 For hypothetical vaccines χ2
(12) = 136.33 and for bednets χ2(12) = 52.04

10
higher for married females than for married males. Both revenue and population
coverage can be increased by targeting married women. For example, at a price of Birr 40
(US$ 6) per vaccine, an additional Birr 3,160 (US$500) in revenue could be collected by
targeting. Not only are revenues increased but coverage also goes up, with seven percent
more of the population receiving the vaccine at this price. Of course, this kind of
targeting depends on two conditions. The first is that women have some level of decision
making power in the household and the second is that the cost of targeting women over
targeting households does not outweigh the benefits.
Empirical Specification
The theoretical model relates the number of hypothetical vaccines a respondent
agrees to purchase to a vector of explanatory variables. These variables include
household non-earned income, wages, and the prices of preventive and mitigating health
care. The discrete nature of the dependent variable and the large number of zeroes and
small values suggests that a count regression model is appropriate. The probability
density function, however, is modified so that household size is an upper bound for each
observation. In the case of the Poisson model this implies,
i*** n to1 where
]Pr[!
]|[ =≤
=≤= iii
iki
i
iiiik
nAke
nAkAPλλ
. (6)
We refer to this as the Truncated Poisson model. This model yields convenient
expressions for WTP for prevention, which is the area under the household demand curve
between zero and n. More formally:
otherwise,
and 0 if
iinp
ii
inp
i
i
npn
WTP
pe
WTP
+−
=
≤−=
β
β
BX
(7)
where pni is the price at which the decision-maker buys vaccines for all household
members.
The Truncated Poisson model can also be used to address the issue of
intrahousehold resource allocation. The simplest approach to explaining behavioral

11
differences between men and women is to hold all coefficients in the β vector constant
across men and women, except for the intercept. This is equivalent to including a dummy
variable for gender in the model. We refer to this as the "reduced" model.
There are more general tests of behavioral differences between males and females
with respect to the decision to purchase malaria prevention. One is to specify the
statistical model so that λi = exp(X1iβ1 + X2iβ2), where X2i is a vector of explanatory
variables interacted with gender (female=1). This is similar to specifying separate
structural equations to explain the purchasing behavior of men and women but assumes a
common error variance. We call this the “full” model.
If the β coefficients of men and women are the same with regard to purchasing
malaria prevention, then their responses may be pooled and treated as identical within the
context of the statistical model λi = exp(X1iβ1). To test this hypothesis we specify the null
hypothesis as H0: β2= 0 and the alternative as H1: at least one of the parameters in β2 is
not zero. A rejection of the null hypothesis implies that two populations differ, suggesting
that we estimate separate models for men and women.
Equation (4) suggests that the number of vaccines or bednets purchased should
depend on the price of the good, household income, and size. It might also depend on
family composition – the number of adults, teenagers, and children in the family, and on
characteristics of the respondent – gender, age, marital status and education – which may
influence preferences for-health related goods. The mean and standard deviation of each
of the variables are summarized in Table 6.
Household income enters the demand function in log form. Twenty-eight percent
of the observations for off-farm wages were missing. These were replaced with zeroes
and a dummy variable for missing wages, which takes on a value of one if the wage
observation is not present, was included in the model.
The decision-maker’s demand also depends on each family member’s
susceptibility to malaria and the prevalence of the disease. Susceptibility is a household-
specific measure of direct cost of illness in the past year. It is computed as the product of
the sample mean direct cost of illness for adults, teenagers, and children times the number

12
of episodes in each age category in the household in the previous year.9 This weighted
average approach was used to avoid issues of endogeneity. A proxy for the prevalence of
malaria, altitude, is also included in the model. This is a good exogenous predictor of
incidence because the vector is more common at lower altitudes.
Household size can be included in the model as either a discrete or a continuous
variable. Both specifications were tested and the magnitude of the coefficients, the
number of significant variables, and the WTP results were virtually identical. For brevity,
the results including household size as a continuous variable are presented here.
Household composition is measured by two variables, the number of teenagers
and the number of children. Since the number of adults is the omitted category, these
variables reflect the trade-off between teenagers or children and adults.
Respondent-level parameters include marital status, gender, age, and ability to
read a newspaper. Marital status is captured by a dummy equal to one if the respondent is
married and his or her spouse is alive. Gender is a dichotomous variable in the reduced
model, equal to one if the respondent is female. Literacy is measured by whether or not
the respondent can read a newspaper with ease.
The model was estimated with both village and enumerator fixed effects. Village
effects were not significant and therefore are not included in the final specification.
Enumerator effects are significant and their inclusion in the model allows us to control
for the influence of enumerators on respondent choices.
Multivariate Results
Vaccines
The multivariate results for the vaccine scenario are presented in Table 7. Column 1 of
the table presents a model in which only the intercept term is allowed to differ by gender
(the "reduced" model). Columns 2 and 3 of the table present vaccine demand functions
estimated separately for men and for women. The reduced model for vaccines is
generally consistent with economic theory. The quantity of vaccines the respondent
9 The missing observations (less than 1 percent) for this variable were imputed using ordinary least squares
regression.

13
agrees to purchase varies inversely with price. Respondents at higher altitudes (less
exposed to the malaria vector) purchase less vaccines than respondents at lower altitudes.
The quantity purchased increases with income and with the higher the cost of treatment.
Age of respondent is significant and negative, indicating that older respondents purchase
less vaccines.10 While not presented in Table 7, the results from the model with the full
set of interaction terms (the "full" model) indicate that there are significant differences in
the effects of price, income, missing wages, household cost of illness, literacy, and age on
male and female purchasing behavior. We therefore reject the null hypothesis that men
and women have identical demand functions for vaccines and estimate separate demand
functions.
Holding income fixed, the price elasticity of females’ demand is significantly
lower than it is for males, indicating that females are less sensitive to changes in price
than males. Male demand is unit elastic at Birr 50 (US$ 8) and female demand unit
elastic at Birr 70 (US$ 11). At a price of Birr 100 (US$ 16) the price elasticity of demand
for male respondents is -2.0 and for females –1.5, implying that a 10 percent increase in
price will result in a 20 percent reduction in male demand but only a 15 percent reduction
in female demand. These results are consistent with Figure 2.
The income elasticity of demand is significantly higher for females than males. A
10 percent increase in household income produces only a 2.6 percent increase in male
demand, whereas it produces a 6.1 percent increase in female demand.11 Gertler and van
der Gagg (1990) note that in industrialized countries the income elasticity of demand for
medical care is typically between 0.2 and 0.3. In Mali, Birdsall et al. (1983) found that
the income elasticity of WTP for improvements in health services and water supply was
around 0.35.12 In Taiwan, Alberini et al. (1997) place the income elasticity of WTP to
avoid an episode of respiratory illness at 0.45. That the income elasticity of demand is
consistent with other studies increases our confidence in the validity of the results.
10 These results did not change when age and age squared were included in specification.11 In the reduced model the income elasticity of demand is 0.4, suggesting that a 10 percent increase in
income results in a 4.0 percent increase in demand.12 The income elasticity of demand is not the same as the income elasticity of WTP when quantity is fixed,
as it was in these studies.

14
We can gain insights into intrahousehold allocation by examining the coefficients
on teenagers and children in the reduced model. They are both negative and significant,
suggesting that the quantity respondents agree to purchase decreases as adults are
replaced by teenagers and children in the household. This result makes sense from a
productivity perspective, because children contribute less to the household financially
than do adults. Furthermore, the coefficient on the number of children is three times
larger than it is on teenagers. This is consistent with teenagers being better substitutes for
adult labor than younger children.
In the full model, there are no significant differences in the effect of the number
of teenagers or children on the number of vaccines purchased by male and female
decision-makers. In Table 7, the coefficient on children is of approximately the same
magnitude for men and women. This suggests males and females have the same
preferences for trading the health of adults against the health of children; it also begins to
provide an answer to one of the questions posed at the outset of this paper. In the context
of this study, both men and women appear to place the same priority on the health of
adults over the health of other demographic categories in the household.
The negative coefficient for female respondents in the reduced model suggests
that they would purchase fewer hypothetical vaccines than males; however, as noted
earlier, this is a crude measure of gender-based differences in demand. The coefficient is
negative because it is capturing the interaction between female-headed households and
income. Female headed households are systematically worse off than all other types of
households in the sample.
The large positive effect of female cost of illness is consistent with females
spending more time caring for the ill in their household. The large positive effect of
female literacy is consistent with the literature that indicates that there are large social
benefits linked to female education in developing countries (World Bank, 1995). The
larger negative effect of female age is also driven by the high percentage of older female-
headed households in the sample.
Table 8 explores the implications of the male and female demand functions in
Table 7 for willingness to pay (WTP) to prevent malaria among all household members.
The table presents estimates of the integral under the vaccine demand function by

15
respondent gender and marital status. The mean WTP of married females is about 18
percent more than it is for married males. Married males’ median WTP for vaccines is
Birr 151 (US$ 24) and for married females it is Birr 181 (US$ 29). The number of
observations in single parent households is very low, decreasing confidence in these
results.
That married females’ are, at both the mean and median, willing to pay more for
hypothetical vaccines than married males is consistent with the evidence in the literature
on intrahousehold allocation. This literature suggests that giving women greater control
over household resources will result in a more direct impact on household welfare, and in
particular child welfare, than giving it to men. In Burkina Faso, reallocating factors of
production from men’s plots to women’s plots increases overall crop yields by about ten
percent (Udry et al., 1995). In Bangladesh, women borrowing 100 additional Taka
increase household consumption by 18 Taka, men by 11 Taka (Pitt and Khandker, 1999).
In Brazil, Thomas (1997) finds that additional income leads women to increase spending
on food by about three percent and men by about one-half of a percent.
It also raises an important policy issue. Even if wives are willing to pay more to
protect their household from malaria than husbands are, they may not have the freedom
to act on this. Under such conditions, it is ambiguous how the policy analyst should treat
women’s preferences. It should also be emphasized that the role women play in
household decision making in Ethiopia differs depending on their ethnic and cultural
affiliation. Therefore, project’s design can be improved by understanding intrahousehold
resource allocation in the target population.
Bednets
The multivariate results for the bednet scenario are presented in Table 9, which is
similar in structure to Table 7. While the signs of the coefficients in the reduced model
for bednets are generally consistent with economic theory, only the coefficient of price is
statistically significant at conventional levels. This is partly due to the smaller sample
size for the bednet scenario (279 households v. 569 households for the vaccine scenario).
The smaller sample size may also explain why, when the model with the full set
of gender interaction terms is estimated, we are unable to reject the null hypothesis that

16
coefficient vector of the interaction terms is the zero vector. This result, nevertheless,
suggests observations for men and women may be pooled and treated as identical. When
this test is repeated on the sub-sample of jointly-headed households, the findings are the
same.
Conclusions
Comparing males’ and females’ responses to questions about how much
preventive health care they will purchase for their household begins to shed light on the
questions asked in the introduction. In the formal test of the common preference model,
we reject the null hypothesis that male and female behavioral characteristics can be
pooled in the context of demand for vaccines. In the case of men and women living with
their spouses, rejection of the null hypothesis suggests the common preference model will
hold only if the husband or wife is a dictator. As noted at the outset, this test rests on the
assumption that there are gender specific utility functions (e.g. all husbands have
comparable utility functions and all wives have comparable utility functions).
A more surprising result, however, is that are no significant differences in the rate
at which male and female respondents substitute children for adults when choosing the
number of vaccines to buy for their household. This suggests that both men and women
consider the health of adults a priority because they are the primary income earners. Or,
stated slightly differently, while married women are willing to pay more for vaccines than
married men are, the choice of who in the household gets the vaccines is the same.

17
References
Alberini, A., M. Cropper, T. Fu, A. Krupnick, J. Liu, D. Shaw and W. Harrington. 1997.Valuing Health Effects of Air Pollution in Developing Countries: The Case ofTaiwan, Journal of Environmental Economics and Management, 34: 107-126
Becker, G. 1981. Altruism in the Family and Selfishness in the Market Place, Economica,48(189): 1-15
Birdsall, N., F. Orivel, M. Aisnworth, and P. Chuhan. 1983. Three Studies on CostRecovery in Social Sector Projects. CDP Discussion Paper 1983-8. World Bank,Washington, D.C
Cropper, M., J. Lampietti, C. Poulos, M. Haile, and D. Whittington. 1999. The Value ofPreventing Malaria in Tigray, Ehtiopia. Draft Report submitted to WHO/TDR.
Ghebreyesus, T., T. Alemayehu, A. Bosman, K. Witten, and A. Teklehaimanot. 1996.Community Participation in Malaria Control in Tigray region Ethiopia, ActaTropica, 61: 145-156
Grossman, M. 1972. On the Concept of Health Capital and the Demand for Health,Journal of Political Economy, 80(2): 223-55
Lampietti, J. A. 1999. Do Husbands and Wives Make the Same Choices? Evidence fromNorthern Ethiopia. Economics Letters 62: 253-260
Loehman, E., and V. De. 1982. Application of Stochastic Choice Modeling to PolicyAnalysis of Public Goods: A Case Study of Air Quality Improvements, TheReview of Economics and Statistics, 64(3): 474-480
Relief Society of Tigray. 1995. Farming Systems, Resource Management and HouseholdCoping Strategies in Northern Ethiopia: Report of a Social and Agro-EcologicalBaseline Study in Central Tigray.
Thomas. D. 1997. Incomes, Expenditures, and Health Outcomes: Evidence onIntrahousehold Resource Allocation. In Haddad L., J. Hoddinot, and H.Alderman, eds. Intrahousehold Resource Allocation in Developing Countries,Baltimore: Johns Hopkins
World Bank. 1995. Toward Gender Equality: The Role of Public Policy. The WorldBank, Washington, DC

18
Table 1. Treatment and Sample Size
Hypothetical vaccine scenario bednet scenario
Price (Birr) n (percent) Price (Birr) n (percent)
5 117 (21%) 8 58 (21%)
20 120 (21%) 20 59 (21%)
40 117 (21%) 40 54 (19%)
100 118 (21%) 60 52 (19%)
200 97 (17%) 100 56 (20%)
Total 569 (100%) Total 279 (100%)
Table 2. Jointly Headed Household Income and Assets
n Mean Men N Mean Women
Annual agric. income (Birr) 342 1423 322 1207*
Annual wage income (Birr) 255 318 218 332
Number of rooms 342 1.25 321 1.21
Number of buildings 342 2.46 318 2.36
Lamp 342 1.12 322 1.10
Bed 342 0.13 322 0.14
Radio 342 0.34 322 0.18
Bicycle 342 0.02 321 0.01
Shoes 147 1.01 179 0.94
Jerrican 147 0.50 178 0.50
* indicates difference between men and women is significant at the 5 percent level

19
Table 3. Perception of Seriousness of Malaria (percent)
Total Male Female
Adults 34 4% 4%
Children 351 48% 37%*
Equally serious for adults and children 459 48% 59%*
Not serious for adults and children 2 0% 0%
* Difference is significant at 5 percent level

20
Table 4. Number of Hypothetical Vaccines Purchased by Price (n=569)
Price (Birr) 0 vaccines 1-3 vaccines 4-6 vaccines >=7 vaccines
5 24% 35% 33% 8%
20 48% 25% 22% 6%
40 68% 21% 10% 2%
100 81% 10% 6% 3%
200 90% 6% 4% 0%
Table 5. Number of Bednets Purchased by Price (n=279)
Price (Birr) 0 nets 1 net 2 nets 3 or more nets
8 19% 21% 43% 17%
20 22% 33% 32% 13%
40 41% 37% 20% 2%
60 52% 23% 19% 6%
100 63% 25% 11% 2%

21
Table 6. Means and Standard Deviations of Variables in Models
Vaccine Model Bednet Model
Variable N Mean Std.Dev. N Mean Std.Dev.
Number of vaccines purchased 569 1.45 2.19 279 1.07 1.14
Price (Birr) 569 68.30 68.22 279 44.89 32.78
Log income (Thousand Birr) 569 2.40 0.84 279 1.97 1.23
Missing wage (1 if no wage) 569 0.28 0.45 279 0.39 0.49
Number of teenagers 569 0.81 0.91 279 0.56 0.78
Number of children 569 1.95 1.35 279 1.74 1.33
Household direct COI (Birr) 569 18.25 16.48 279 22.26 16.45
Married (1 if married) 569 0.82 0.39 279 0.70 0.46
Gender (1 if female) 569 0.53 0.50 279 0.66 0.47
Read (1 if read easily) 569 0.38 0.49 279 0.53 0.50
Age (years) 569 42.56 14.25 279 41.04 15.04
Alt (hundred meters) 569 16.80 1.54 279 16.51 1.89
Household size 569 5.09 2.00 279 4.53 2.03
Enumerator_2 569 0.03 0.18 279 0.06 0.24
Enumerator_3 569 0.04 0.20 279 0.08 0.26
Enumerator_4 569 0.09 0.29 279 0.00 0.00
Enumerator_5 569 0.08 0.27 279 0.00 0.00
Enumerator_6 569 0.09 0.28 279 0.00 0.00
Enumerator_7 569 0.08 0.27 279 0.00 0.00
Enumerator_8 569 0.03 0.18 279 0.08 0.28
Enumerator_9 569 0.04 0.20 279 0.09 0.29
Enumerator_10 569 0.04 0.19 279 0.09 0.28
Enumerator_11 569 0.09 0.28 279 0.00 0.06
Enumerator_12 569 0.04 0.20 279 0.08 0.27
Enumerator_13 569 0.04 0.19 279 0.08 0.27
Enumerator_14 569 0.04 0.19 279 0.09 0.29
Enumerator_16 569 0.04 0.20 279 0.08 0.28
Enumerator_17 569 0.10 0.30 279 0.00 0.06
Enumerator_18 569 0.05 0.22 279 0.09 0.29
Enumerator_19 569 0.04 0.20 279 0.09 0.28

22
Table 7. Parameter Estimates for Hypothetical Vaccine Models (n = 569)
Variable Reduced Model Males Females
Price -0.016a -0.020a -0.015a
(Birr) 0.001 0.001 0.001
Log household income 0.391a 0.256a 0.608a
(log thousands of Birr) 0.047 0.085 0.085
Missing wage 0.062 -0.478b 0.564a
(1 if no wage) 0.100 0.251 0.127
Number of teenagers -0.087b -0.216a -0.024
(number of individuals) 0.055 0.098 0.099
Number of children -0.305a -0.221a -0.239a
(number of individuals) 0.043 0.075 0.080
Household cost of illness 0.015a -0.004 0.031a
(Birr) 0.002 0.003 0.004
Married 0.455a 0.701b 0.281
(1 if married) 0.131 0.434 0.183
Gender -0.308a
(1 if female) 0.070
Read 0.299a 0.116 0.536a
(1 if read easily) 0.069 0.118 0.121
Age -0.023a -0.008b -0.031a
(years) 0.003 0.004 0.006
Altitude -0.095a -0.098a -0.026
(hundreds of meters) 0.018 0.031 0.035
Household size -0.025 -0.098 -0.118
(number of individuals) 0.040 0.067 0.081
Intercept 2.792a 2.594a -0.104
0.410 0.840 0.806
Notes: Standard errors are below parameter estimates.a Significant at the 5% levelb Significant at the 10% level

23
Table 7 Continued.
Variable Reduced Model Males FemalesEnumerator_2 -0.252 -0.119 0.349
0.433 0.713 0.891Enumerator_3 1.765a 1.416a 0.825a
0.198 0.401 0.452Enumerator_4 -0.949a -0.339 -0.955a
0.193 0.325 0.470Enumerator_5 -0.636a -1.460 1.260a
0.217 0.405 0.463Enumerator_6 1.427a 0.855a 1.148a
0.185 0.356 0.393Enumerator_7 -0.852 -1.114
0.215 0.350Enumerator_8 0.051 -1.426 2.313a
0.246 0.710 0.744Enumerator_9 0.026 -0.726 1.413a
0.292 0.618 0.683Enumerator_10 1.032a 0.193a 1.714a
0.220 0.410 0.472Enumerator_11 -0.426a -1.043 1.079a
0.207 0.386 0.431Enumerator_12 -0.362 -0.714 1.066a
0.240 0.438 0.521Enumerator_13 1.201a 0.478a 1.557a
0.213 0.366 0.453Enumerator_14 0.865a 1.953a -1.140a
0.195 0.421 0.468Enumerator_16 -1.693a -2.151 0.418a
0.345 0.507 0.722Enumerator_17 0.131 -0.224b 0.410a
0.192 0.368 0.415Enumerator_18 0.143 -0.946 1.904a
0.214 0.385 0.471Enumerator_19 1.075a 0.267 1.393a
0.196 0.709 0.732Notes: Standard errors are below parameter estimates.a Significant at the 5% levelb Significant at the 10% level

24
Table 8. Willingness to Pay by Respondent Gender and Marital Status (Birr)
Hypothetical Vaccines
Males Females
Mean Median Mean Median
Married 219 151 267* 181
N 255 211
Single 210 123 161 95
N 11 92
* Indicates difference between mean male and female WTP is significant at 5% level

25
Table 9. Parameter Estimates for Insecticide Treated Net Models (n = 279)
Variable Reduced
Model
Males Females
Price -0.015a -0.017a -0.015a
(Birr) 0.003 0.006 0.003
Log household income 0.092 0.198 0.055
(log thousands of Birr) 0.082 0.398 0.098
Missing wage 0.047 -0.084 0.219 (1 if no wage) 0.258 0.728 0.312
Number teenagers 0.143 0.418 0.056
(number) 0.144 0.417 0.188
Number children 0.048 0.332 -0.054
(number) 0.125 0.382 0.157
Household cost of illness -0.003 0.010 -0.009
(Birr) 0.006 0.016 0.007
Married -0.020 0.670 -0.090
(1 if married) 0.237 0.903 0.282
Gender 0.067
(1 if female) 0.189
Read 0.002 0.125 -0.120
(1 if read easily) 0.200 0.506 0.285
Age -0.010 -0.018 -0.007
(years) 0.007 0.019 0.009
Altitude 0.054 -0.003 0.084
(hundreds of meters) 0.046 0.126 0.057
Household size 0.039 -0.257 0.130 (number of individuals) 0.116 0.327 0.140
Intercept -0.368 0.996 -1.190
0.882 2.557 1.140
Notes: Standard errors are below parameter estimates.a Significant at the 5% levelb Significant at the 10% level

26
Table 9 Continued.
Variable TruncatedPoisson
Males Females
Enumerator_2 -0.120 -1.437 0.1610.405 2.064 0.448
Enumerator_3 0.729 -0.114 1.215a
0.307 1.203 0.377
Enumerator_8 0.106 -0.445 0.3420.365 1.358 0.441
Enumerator_9 0.491 -0.357 0.931b
0.377 0.926 0.524
Enumerator_10 -0.056 -1.115 0.4320.414 1.098 0.513
Enumerator_12 -0.783 -0.686 -1.086b
0.383 0.814 0.606
Enumerator_13 0.027 -0.662 0.3840.438 1.106 0.578
Enumerator_14 0.511 -0.409 0.831a
0.325 0.740 0.398
Enumerator_16 -0.850 -0.712 -0.6640.446 1.068 0.583
Enumerator_18 -0.086 -0.632 0.2550.397 0.901 0.511
Enumerator_19 0.058 -0.440 0.2600.456 1.172 0.569
Notes: Standard errors are below parameter estimates.a Significant at the 5% levelb Significant at the 10% level

27
Figure 1. Malaria Incidence and Cropping Calendar in Tigray, Ethiopia
Figure 2. Simulated Demand for Malaria Vaccine in 200 Household Village
0
20
40
60
80
100
120
140
160
180
200
0 100 200 300 400 500 600 700 800
Quantity
Pric
e in
Birr
married males only married females only
-5%
0%
5%
10%
15%
20%
25%
30%
35%
june jul
yaug
ust
septem
ber
octobe
r
novem
ber
decem
ber
januar
y
februa
rymarc
hapr
ilmay
Cropping Calendar
Prob
abili
ty o
f Con
trac
ting
Mal
aria
Harvesting Planting Weeding Threshing