GemCap Investment Funds (Ireland) plc - 31.12.2017 - Signed€¦ · GemCap Investment Funds...
310
GemCap Investment Funds (Ireland) Plc (Formerly Gemini Investment Funds Plc) Annual Report and Audited Financial Statements For the financial year ended 31 st December 2017 AHFM Defined Returns Fund (AHFM) AHFM US Enhanced Equity Fund (AUEE) GSI Global Diversified Value Fund (GSI) London & Capital Global Balanced Fixed Income Fund (L&CGBFI) London & Capital Global Conservative Fixed Income Fund (L&CGCFI) London & Capital Global Defensive Equity Fund (L&CGDE) London & Capital Global Emerging Markets Equity Fund (L&CGEME) London & Capital Global Growth Fixed Income Fund (L&CGGFI) London & Capital Global Star Equity Fund (L&CGSE) London & Capital UK Star Equity Fund (L&CUSE) Principal Asset Allocation Fund (PAAF) Sabre Global Value and Income Fund (SGVIF)* Third Avenue Real Estate Value Fund (TAREVF)** Third Avenue Value Fund (TAVF)*** Registered Number: 485081 *SGVIF was closed by way of compulsory redemption on 27 th April 2017 . **TAREVF launched on 30 th May 2017. ***TAVF launched on 7 th June 2017.
Transcript of GemCap Investment Funds (Ireland) plc - 31.12.2017 - Signed€¦ · GemCap Investment Funds...

GemCap Investment Funds (Ireland) Plc (Formerly Gemini Investment Funds Plc)
Annual Report and Audited Financial Statements
For the financial year ended 31st December 2017
AHFM Defined Returns Fund (AHFM) AHFM US Enhanced Equity Fund (AUEE) GSI Global Diversified Value Fund (GSI)
London & Capital Global Balanced Fixed Income Fund (L&CGBFI) London & Capital Global Conservative Fixed Income Fund (L&CGCFI)
London & Capital Global Defensive Equity Fund (L&CGDE) London & Capital Global Emerging Markets Equity Fund (L&CGEME)
London & Capital Global Growth Fixed Income Fund (L&CGGFI) London & Capital Global Star Equity Fund (L&CGSE)
London & Capital UK Star Equity Fund (L&CUSE) Principal Asset Allocation Fund (PAAF)
Sabre Global Value and Income Fund (SGVIF)* Third Avenue Real Estate Value Fund (TAREVF)**
Third Avenue Value Fund (TAVF)***
Registered Number: 485081
*SGVIF was closed by way of compulsory redemption on 27th April 2017 . **TAREVF launched on 30th May 2017. ***TAVF launched on 7th June 2017.

GemCap Investment Funds (Ireland) Plc (Formerly Gemini Investment Funds Plc)
2
Annual Report and Audited Financial Statements For the financial year ended 31st December 2017
(Stated in US Dollars)
Pages Directors, Management and Administration 6 – 7 Statement of Directors’ Responsibilities 8 Report of the Directors 9 – 14 Report of the Depositary to the Shareholders 15 Independent Auditor’s Report 16 – 21 AHFM Defined Returns Fund 22 – 31
- Investment Manager’s Report 22 - Statement of Financial Position 23 - Statement of Comprehensive Income 24 - Statement of Changes in Net Assets attributable to Holders of Redeemable
Participating Shares 25 - Statement of Cash Flows 26 - Schedule of Investments 27 – 30 - Significant Portfolio Movements (unaudited) 31
AHFM US Enhanced Equity Fund 32 – 41
- Investment Manager’s Report 32 - Statement of Financial Position 33 - Statement of Comprehensive Income 34 - Statement of Changes in Net Assets attributable to Holders of Redeemable
Participating Shares 35 - Statement of Cash Flows 36 - Schedule of Investments 37 – 39 - Significant Portfolio Movements (unaudited) 40
GSI Global Diversified Value Fund 41 – 78
- Investment Manager’s Report 41 – 42 - Statement of Financial Position 43 - Statement of Comprehensive Income 44 - Statement of Changes in Net Assets attributable to Holders of Redeemable
Participating Shares 45 - Statement of Cash Flows 46 - Schedule of Investments 47 – 76 - Significant Portfolio Movements (unaudited) 77 – 78
GemCap Investment Funds (Ireland) Plc (Formerly Gemini Investment Funds Plc)
3
Annual Report and Audited Financial Statements For the financial year ended 31st December 2017
(Stated in US Dollars) London & Capital Global Balanced Fixed Income Fund 79 – 95
- Investment Manager’s Report 79 – 81 - Statement of Financial Position 82 - Statement of Comprehensive Income 83 - Statement of Changes in Net Assets attributable to Holders of Redeemable
Participating Shares 84 - Statement of Cash Flows 85 - Schedule of Investments 86 – 91 - Significant Portfolio Movements (unaudited) 92 – 95
London & Capital Global Conservative Fixed Income Fund 96 – 112
- Investment Manager’s Report 96 – 98 - Statement of Financial Position 99 - Statement of Comprehensive Income 100 - Statement of Changes in Net Assets attributable to Holders of Redeemable
Participating Shares 101 - Statement of Cash Flows 102 - Schedule of Investments 103 – 108 - Significant Portfolio Movements (unaudited) 109 – 112
London & Capital Global Defensive Equity Fund 113 – 123
- Investment Manager’s Report 113 – 114 - Statement of Financial Position 115 - Statement of Comprehensive Income 116 - Statement of Changes in Net Assets attributable to Holders of Redeemable
Participating Shares 117 - Statement of Cash Flows 118 - Schedule of Investments 119 – 121 - Significant Portfolio Movements (unaudited) 122 – 123
London & Capital Global Emerging Markets Equity Fund 124 – 134
- Investment Manager’s Report 124 – 125 - Statement of Financial Position 126 - Statement of Comprehensive Income 127 - Statement of Changes in Net Assets attributable to Holders of Redeemable
Participating Shares 128 - Statement of Cash Flows 129 - Schedule of Investments 130 – 132 - Significant Portfolio Movements (unaudited) 133 – 134

GemCap Investment Funds (Ireland) Plc (Formerly Gemini Investment Funds Plc)
4
Annual Report and Audited Financial Statements For the financial year ended 31st December 2017
(Stated in US Dollars)
London & Capital Global Growth Fixed Income Fund 135 – 150
- Investment Manager’s Report 135 – 136 - Statement of Financial Position 137 - Statement of Comprehensive Income 138 - Statement of Changes in Net Assets attributable to Holders of Redeemable
Participating Shares 139 - Statement of Cash Flows 140 - Schedule of Investments 141 – 145 - Significant Portfolio Movements (unaudited) 146 – 149
London & Capital Global Star Equity Fund 150 – 160
- Investment Manager’s Report 150 – 151 - Statement of Financial Position 152 - Statement of Comprehensive Income 153 - Statement of Changes in Net Assets attributable to Holders of Redeemable
Participating Shares 154 - Statement of Cash Flows 155 - Schedule of Investments 156 – 158 - Significant Portfolio Movements (unaudited) 159 – 160
London & Capital UK Star Equity Fund 161 – 170
- Investment Manager’s Report 161 – 162 - Statement of Financial Position 163 - Statement of Comprehensive Income 164 - Statement of Changes in Net Assets attributable to Holders of Redeemable
Participating Shares 165 - Statement of Cash Flows 166 - Schedule of Investments 167 – 168 - Significant Portfolio Movements (unaudited) 169 – 170
Principal Asset Allocation Fund 171 – 184
- Investment Manager’s Report 171 – 173 - Statement of Financial Position 174 - Statement of Comprehensive Income 175 - Statement of Changes in Net Assets attributable to Holders of Redeemable
Participating Shares 176 - Statement of Cash Flows 177 - Schedule of Investments 178 – 182 - Significant Portfolio Movements (unaudited) 183 – 184
GemCap Investment Funds (Ireland) Plc (Formerly Gemini Investment Funds Plc)
5
Annual Report and Audited Financial Statements For the financial year ended 31st December 2017
(Stated in US Dollars)
Sabre Global Value and Income Fund (terminated on 27th April 2017) 185 – 191
- Investment Manager’s Report 185 - Statement of Financial Position 186 - Statement of Comprehensive Income 187 - Statement of Changes in Net Assets attributable to Holders of Redeemable
Participating Shares 188 - Statement of Cash Flows 189 - Significant Portfolio movements (unaudited) 190 – 191
Third Avenue Real Estate Value Fund 192 – 206
- Investment Manager’s Report 192 – 197 - Statement of Financial Position 198 - Statement of Comprehensive Income 199 - Statement of Changes in Net Assets attributable to Holders of Redeemable
Participating Shares 200 - Statement of Cash Flows 201 - Schedule of Investments 202 – 204 - Significant Portfolio movements (unaudited) 205 – 206
Third Avenue Value Fund 207 – 217
- Investment Manager’s Report 207 - Statement of Financial Position 208 - Statement of Comprehensive Income 209 - Statement of Changes in Net Assets attributable to Holders of Redeemable
Participating Shares 210 - Statement of Cash Flows 211 - Schedule of Investments 212 – 214 - Significant Portfolio movements (unaudited) 215 – 217
Combined Statement of Financial Position 218 Combined Statement of Comprehensive Income 219 Combined Statement of Changes in Net Assets attributable to Holders of Redeemable Participating Shares 220 Combined Statement of Cash Flows 221 Notes forming part of the Financial Statements 222 – 309 Appendix 1 - Remuneration Policy & Cybersecurity Risk (unaudited) 310

GemCap Investment Funds (Ireland) Plc (Formerly Gemini Investment Funds Plc)
6
Directors, Management and Administration
DIRECTORS DEPOSITARY Adrian Waters (Chairman) (Irish)* RBC Investor Services Bank S.A., Dublin Branch Stuart Alexander (British) 4th Floor Conor Hoey (Irish) One George’s Quay Plaza Michael Hooper (British) George’s Quay
*Independent Director Dublin 2 Ireland
All Directors are non executive. REGISTERED OFFICE LEGAL ADVISERS AND LISTING AGENT* * 4th Floor Dillon Eustace 76 Baggot Street Lower 33 Sir John Rogerson’s Quay Dublin 2 Dublin 2 Ireland Ireland ADMINISTRATOR RISK MANAGEMENT CONSULTANTS RBC Investor Services Ireland Limited Maraging Funds Limited (trading as RiskSystem) 4th Floor 32 Mount Street Upper One George’s Quay Plaza Dublin 2 George’s Quay Ireland Dublin 2 Ireland INDEPENDENT AUDITORS MANAGER Deloitte Gemini Capital Management (Ireland) Limited Chartered Accountants and Statutory Audit Firm 4th Floor Deloitte and Touche House 76 Baggot Street Lower Earlsfort Terrace Dublin 2 Dublin 2 Ireland Ireland COMPANY SECRETARY GLOBAL DISTRIBUTOR AND UK Sanne Corporate Administration Services Limited FACILITIES AGENT (trading as Sanne formerly Chartered Corporate Gemini Investment Management Limited Services) 33 Turner Street 4th Floor C/O Brierley Coleman & Co 76 Baggot Street Lower Manchester M4 1DW Dublin 2 United Kingdom Ireland REPRESENTATIVE AND PAYING AGENT IN SWITZERLAND RBC Investor Services Bank S.A. Esch-sur-Alzette, Zurich Branch Bleicherweg 7 CH-8027 Zurich Switzerland
**previously this address was Maples and Calder, 75 St. Stephen’s Green, Dublin 2, Ireland.

GemCap Investment Funds (Ireland) Plc (Formerly Gemini Investment Funds Plc)
7
Directors, Management and Administration (Continued)
INVESTMENT MANAGERS AHFM Defined Returns Fund AHFM US Enhanced Equity Fund Atlantic House Fund Management LLP One Eleven Edmund Street Birmingham B3 2HJ West Midlands United Kingdom GSI Global Diversified Value Fund Global Systematic Investors LLP 45 King William Street London EC4R 9AN United Kingdom London & Capital Global Balanced Fixed Income Fund London & Capital Global Conservative Fixed Income Fund London & Capital Global Defensive Equity Fund London & Capital Global Emerging Markets Equity Fund London & Capital Global Growth Fixed Income Fund London & Capital Global Star Equity Fund London & Capital UK Star Equity Fund London and Capital Asset Management Limited 7 Triton Square, Regent’s Place London NW1 3HG United Kingdom Principal Asset Allocation Fund* Mansard Capital Management Ltd 85 St. John Street Valletta, VLT 1165 Malta Sabre Global Value and Income Fund Sabre Fund Management Limited 46-48 Grosvenor Gardens
London SW1W 0EB United Kingdom Third Avenue Real Estate Value Fund Third Avenue Value Fund Third Avenue Management LLC 622 Third Avenue 32nd Floor New York NY 1001 United States
*previously this address was Fielden House, 28 London Bridge Street, London SE1 9SG, England.
GemCap Investment Funds (Ireland) Plc (Formerly Gemini Investment Funds Plc)
8
Statement of Directors’ Responsibilities For the financial year ended 31st December 2017
The Directors are responsible for preparing the Directors’ report and the financial statements in accordance with the Companies Act 2014 and the applicable regulations. Irish company law requires the Directors to prepare financial statements for each financial year. Under the law, the Directors have elected to prepare the financial statements in accordance with International Financial Reporting Standards as adopted by the European Union (“Relevant Financial Reporting Framework”). Under company law, the Directors must not approve the financial statements unless they are satisfied that they give a true and fair view of the assets, liabilities and financial position of GemCap Investment Funds (Ireland) Plc (the “Company”) as at the financial year end date and of the profit or loss of the Company for the financial year and otherwise comply with the Companies Act 2014. In preparing these financial statements, the Directors are required to: • select suitable accounting policies for the Company financial statements and then apply them
consistently; • make judgements and estimates that are reasonable and prudent; • state whether the financial statements have been prepared in accordance with applicable accounting
standards, identify those standards, and note the effect and the reasons for any material departure from those standards; and
• prepare the financial statements on the going concern basis unless it is inappropriate to presume that the Company will continue in business.
The Directors are responsible for ensuring that the Company keeps or causes to be kept adequate accounting records which correctly explain and record the transactions of the Company, enable at any time the assets, liabilities, financial position and profit or loss of the Company to be determined with reasonable accuracy, enable them to ensure that the financial statements and Directors’ report comply with the Companies Act 2014 and with the European Communities (Undertakings for Collective Investment in Transferable Securities) Regulations, 2011 and Central Bank (Supervision and Enforcement) Act 2013 (Section 48(1)) (Undertakings for Collective Investment in Transferable Securities) Regulations, 2015 (as amended) and the Listing Rules of the Irish Stock Exchange and enable the financial statements to be audited. They are also responsible for safeguarding the assets of the Company and hence for taking reasonable steps for the prevention and detection of fraud and other irregularities. On behalf of the Directors: Director: Adrian Waters Director: Stuart Alexander Date: 19th April 2018
GemCap Investment Funds (Ireland) Plc (Formerly Gemini Investment Funds Plc)
9
Report of the Directors For the financial year ended 31st December 2017
The Directors present their annual report and the audited financial statements of the Company for the financial year ended 31st December 2017.
Principal Activity The Company is an umbrella type open-ended investment company with variable capital incorporated on 1st June 2010 with limited liability under the laws of Ireland with registered number 485081 and segregated liability between Funds. The Company is authorised in Ireland by the Central Bank of Ireland pursuant to the UCITS Regulations. Accordingly, the Company is supervised by the Central Bank.
The Directors have overall responsibility for the establishment and supervision of the Company’s investment objective and policy.
Results for the financial year and state of affairs at 31st December 2017 The Combined Statement of Financial Position as at 31st December 2017 and the Combined Statement of Comprehensive Income for the financial year ended 31st December 2017 are set out on pages 218 to 219.
Review of the Development of the Business Please see the Investment Managers’ Reports for further details.
Significant Events During the Financial Year The Third Avenue Real Estate Value Fund and Third Avenue Value Fund were both approved by the Central Bank of Ireland on 14th February 2017 and launched on 30th May 2017 and 7th June 2017 respectively.
The Third Avenue Real Estate Value Fund, a sub-fund of Third Avenue Capital Plc merged into Third Avenue Real Estate Value Fund, a sub-fund of the Company effective 30th May 2017. The investment objective of the sub-fund is to achieve long-term capital appreciation, primarily through investment in equities.
The Third Avenue Value Fund, a sub-fund of Third Avenue Capital Plc merged into Third Avenue Value Fund, a sub-fund of the Company effective 7th June 2017. The investment objective of the sub-fund is to achieve long-term capital appreciation, primarily through investment in equities.
On 28th March 2017 Gemini Investment Funds Plc changed its name to GemCap Investment Funds (Ireland) Plc.
The Sabre Global Value and Income Fund was closed by way of compulsory redemption on 27th April 2017. Shares in this sub-fund are no longer available for investment. The Company intends to apply to the Central Bank to revoke this sub-fund’s approval following preparation of the audited financial statements for the year ended 31st December 2017.
Subsequent Events
Up to the date of approval the below events took place. The following dividends per share were declared with ex-date 6th February 2018 and paid on 13th February 2018:
Sub-Fund Name Class I – GBP Class AHFM Defined Returns Fund £0.010100 Semper Total Return Fund launched on 29th March 2018.

GemCap Investment Funds (Ireland) Plc (Formerly Gemini Investment Funds Plc)
10
Report of the Directors For the financial year ended 31st December 2017
(Continued)
Subsequent Events (continued)
The following dividends per share were declared with ex-date 6th April 2018 and paid on 10th April 2018:
Sub-Fund Name Class X – GBP Class Class X – USD Class Class X – EUR Class
London & Capital Global Balanced Fixed Income Fund £2.332862 $2.420465 €1.771036
London & Capital Global Conservative Fixed Income Fund £1.674180 $1.852687 €1.261751
London & Capital Global Defensive Equity Fund £0.321475 $0.315861 €0.292651
London & Capital Global Growth Fixed Income Fund £2.493823 $2.268901 €2.369173
London & Capital Global Star Equity Fund £0.871402 $0.836926 €0.852357
London & Capital Global Emerging Markets Equity Fund £0.203870 $0.186926 €0.209855
London & Capital UK Star Equity Fund £0.368601 - - AHFM Total Return Fund is expected to launch in May 2018.
There were no other subsequent events which occurred after the financial year end.
Dividends
The following dividends per share were declared with ex-date 3rd April 2017 and paid on 7th April 2017:
Sub-Fund Name Class X – GBP Class Class X – USD Class Class X – EUR Class
London & Capital Global Balanced Fixed Income Fund £2.063230 $2.164170 €1.253582
London & Capital Global Conservative Fixed Income Fund £1.715022 $1.725168 -
London & Capital Global Defensive Equity Fund £0.547962 $0.499567 -
London & Capital Global Growth Fixed Income Fund £1.870454 $2.188106 €1.145693
London & Capital Global Star Equity Fund £0.661945 $0.712731 €0.359184
London & Capital UK Star Equity Fund £0.606385 - -
The following dividends per share were declared with ex-date 5th May 2017 and paid on 12th May 2017:
Sub-Fund Name Class I – GBP Class AHFM Defined Returns Fund £1.022300
The following dividends per share were declared with ex-date 2nd June 2017 and paid on 15th June 2017:
Sub-Fund Name Class A – GBP Class GSI Global Diversified Value Fund $1.800000
The following dividends per share was declared with ex-date 8th August 2017 and paid on 15th August 2017:
Sub-Fund Name Class I – GBP Class AHFM Defined Returns Fund £1.033300
The following dividends per share was declared with ex-date 2nd October 2017 and paid on 6th October 2017:
Sub-Fund Name Class X – GBP Class Class X – USD Class Class X – EUR Class
London & Capital Global Balanced Fixed Income Fund £2.039231 $2.217566 €1.382682
London & Capital Global Conservative Fixed Income Fund £1.638253 $1.855859 -
London & Capital Global Defensive Equity Fund £0.914035 $1.365597 -
London & Capital Global Emerging Markets Equity Fund £0.956134 $1.250034 -
London & Capital Global Growth Fixed Income Fund £2.273775 $2.556220 €4.458660
London & Capital Global Star Equity Fund £1.377862 $1.921041 €1.274060
London & Capital UK Star Equity Fund £1.900460 - -
GemCap Investment Funds (Ireland) Plc (Formerly Gemini Investment Funds Plc)
11
Report of the Directors For the financial year ended 31st December 2017
(Continued) Dividends (Continued)
The following dividends per share were declared with ex-date 7th November 2017 and paid on 14th November 2017:
Sub-Fund Name Class I – GBP Class AHFM Defined Returns Fund £0.010372
The following dividends per share were declared with ex-date 30th November 2017 and paid on 14th
December 2017:
Sub-Fund Name Class A – GBP Class GSI Global Diversified Value Fund $1.920000
Risk Management objectives and policies Descriptions of the risks associated with the Company and the policies employed for managing these risks are contained in Note 4 of these financial statements.
Directors The Directors at the date of this report are listed on page 6.
Directors’ Interests in Shares As at 31st December 2017, Adrian Waters is a Director of Aspect UCITS Funds Plc. Principal Asset Allocation Fund holds an investment of nil shares of Aspect UCITS Funds Plc – Aspect Diversified Trends, as at 31st December 2017 (31st December 2016: 7).
As at 31st December 2017, Conor Hoey held 373.51 units in GSI Global Diversified Value Fund. These units were held through a company called Universal Agencies Ltd, for which Conor Hoey is a Director of. (31st December 2016: nil).
Accounting Records The measures taken by the Directors to secure compliance with the requirements of Section 281 to 285 of the Companies Act 2014 with regard to the keeping of accounting records are the use of appropriate accounting systems and procedures and employment of competent persons. The accounting records are kept at RBC Investor Services Ireland Limited, 4th Floor, One George’s Quay Plaza, George’s Quay, Dublin 2, Ireland.
Corporate Governance Code
General Principles The European Communities (Directive 2006/46/EC) Regulations (S.I. 450 of 2009 and S.I. 83 of 2010) (the “Regulations”) requires the inclusion of a corporate governance statement in the Report of the Directors.
Although there is no specific statutory corporate governance code applicable to Irish collective investment schemes whose shares are admitted to trading on the Irish Stock Exchange, the Company is subject to corporate governance practices imposed by:
(i) The Irish Companies Act 2014 which is available for inspection at the registered office of the Company; and may also be obtained at www.irishstatutebook.ie/home.html. (ii) The Articles of Association of the Company which are available for inspection at the registered office of the Company and at the Companies Registration Office in Ireland; (iii) The Central Bank in their UCITS Regulations which can be obtained from the Central Bank’s website at: www.centralbank.ie; and (iv) The Irish Stock Exchange (“ISE”) through the ISE Code of Listing Requirements and Procedures which can be obtained from the ISE’s website at: www.ise.ie/index.asp?locID=7&docID=-1.
GemCap Investment Funds (Ireland) Plc (Formerly Gemini Investment Funds Plc)
12
Report of the Directors For the financial year ended 31st December 2017
(Continued) Corporate Governance Code (Continued) General Principles (continued) Irish Funds has published a corporate governance code, the Corporate Governance Code for Irish Domiciled Collective Investment Schemes (the “Code”) that may be adopted on a voluntary basis by Irish authorised collective investment schemes. It should be noted that the Code reflects existing corporate governance practices imposed on Irish authorised collective investment schemes, as noted above. If the Code is adopted on a voluntary basis, it can be referred to in the disclosures made in the Report of the Directors in compliance with the provisions of the European Communities (Directive 2006/46/EC) Regulations (i.e. S.I. 450 of 2009 and S.I. 83 of 2010). The Board of Directors voluntarily complies with the Code which was adopted with effect on 31st December 2012. The Board of Directors have assessed the measures included in the Code as being consistent with its corporate governance practices and procedures for the financial year. Internal Control and Risk Management Systems in Relation to Financial Reporting The Board of Directors are responsible for establishing and maintaining adequate internal control and risk management systems of the Company in relation to the financial reporting process. Such systems are designed to manage rather than eliminate the risk of error or fraud in achieving the Company’s financial reporting objectives and can only provide reasonable and not absolute assurance against material misstatement or loss.
The Board of Directors have procedures in place to ensure all relevant books of account are properly maintained and are readily available, including production of annual and half-yearly financial statements. The annual financial statements of the Company are required to be approved by the Board of Directors of the Company and the annual and half-yearly financial statements of the Company are required to be filed with the Central Bank and the Irish Stock Exchange. The statutory financial statements are required to be audited by independent auditors who report annually to the Board on their findings. The Board of Directors have appointed the Administrator to maintain the books and records of the Company. The Administrator is authorised and regulated by the Central Bank and must comply with the rules imposed by the Central Bank. The financial statements are prepared by the Administrator in compliance with International Financial Reporting Standards (“IFRS”). The Administrator uses various internal controls and checklists to ensure that the financial statements include complete and appropriate disclosures required under IFRS and relevant legislation. From time to time the Board also examines and evaluates the Administrator’s financial accounting and reporting routines. The Board of Directors monitors and evaluates the independent auditor’s performance, qualifications and independence. As part of the review procedures the Board of Directors receives reports on the audit process. The Board evaluates and discusses significant accounting and reporting issues as the need arises.
GemCap Investment Funds (Ireland) Plc (Formerly Gemini Investment Funds Plc)
13
Report of the Directors For the financial year ended 31st December 2017
(Continued) Corporate Governance Code (Continued)
Dealings with Shareholders The convening and conduct of Shareholders’ meetings are governed by the Articles of Association of the Company and the Companies Acts. Although the Directors may convene an extraordinary general meeting of the Company at any time, the Directors are required to convene an annual general meeting of the Company within fifteen months of the date of the previous annual general meeting thereafter. Shareholders representing not less than one-tenth of the paid up share capital of the Company may also request the Directors to convene a Shareholders’ meeting. Not less than twenty one days notice of every annual general meeting and any meeting convened for the passing of a special resolution must be given to Shareholders and fourteen days’ notice must be given in the case of any other general meeting unless the auditors of the Company and all the Shareholders of the Company entitled to attend and vote agree to shorter notice. Two members present either in person or by proxy constitutes a quorum at a general meeting provided that the quorum for a general meeting convened to consider any alteration to the class rights of shares is two Shareholders holding or representing by proxy at least one third of the issued shares of the relevant fund or class. Every holder of participating shares or non-participating shares present in person or by proxy who votes on a show of hands is entitled to one vote. On a poll, every holder of participating shares present in person or by proxy is entitled to one vote in respect of each share held by him and every holder of non-participating shares is entitled to one vote in respect of all non-participating shares held by him. The chairman of a general meeting of the Company or at least two holders of participating or non-participating shares present in person or by proxy. Any holder or holders of participating or non-participating shares present in person or by proxy representing at least one tenth of the shares in issue having the right to vote at such meetings may then demand a poll. Shareholders may resolve to sanction an ordinary resolution or special resolution at a Shareholders’ meeting. An ordinary resolution of the Company or of the Shareholders of a particular fund or class requires a simple majority of the votes cast by the Shareholders voting in person or by proxy at the meeting at which the resolution is proposed. A special resolution of the Company or of the Shareholders of a particular fund or class requires a majority of not less than 75% of the Shareholders present in person or by proxy and voting in general meeting in order to pass a special resolution including a resolution to amend the Articles of Association. Board composition and activities Unless otherwise determined by the Company in a general meeting, the number of Directors may not be less than two. Currently the Board of Directors of the Company is composed of four Directors, being those listed in the directory in these financial statements. The business of the Company is managed by the Directors, who exercise all such powers of the Company as are not by the Companies Acts or by the Articles of Association of the Company required to be exercised by the Company in a general meeting. A Director may, and the Company Secretary of the Company on the requisition of a Director will, at any time summon a meeting of the Directors. Questions arising at any meeting of the Directors are determined by a majority of votes. In the case of an equality of votes, the chairman has casting vote. The quorum necessary for the transaction of business at a meeting of the Directors is two.


GemCap Investment Funds (Ireland) Plc (Formerly Gemini Investment Funds Plc)
22
Investment Manager’s Report
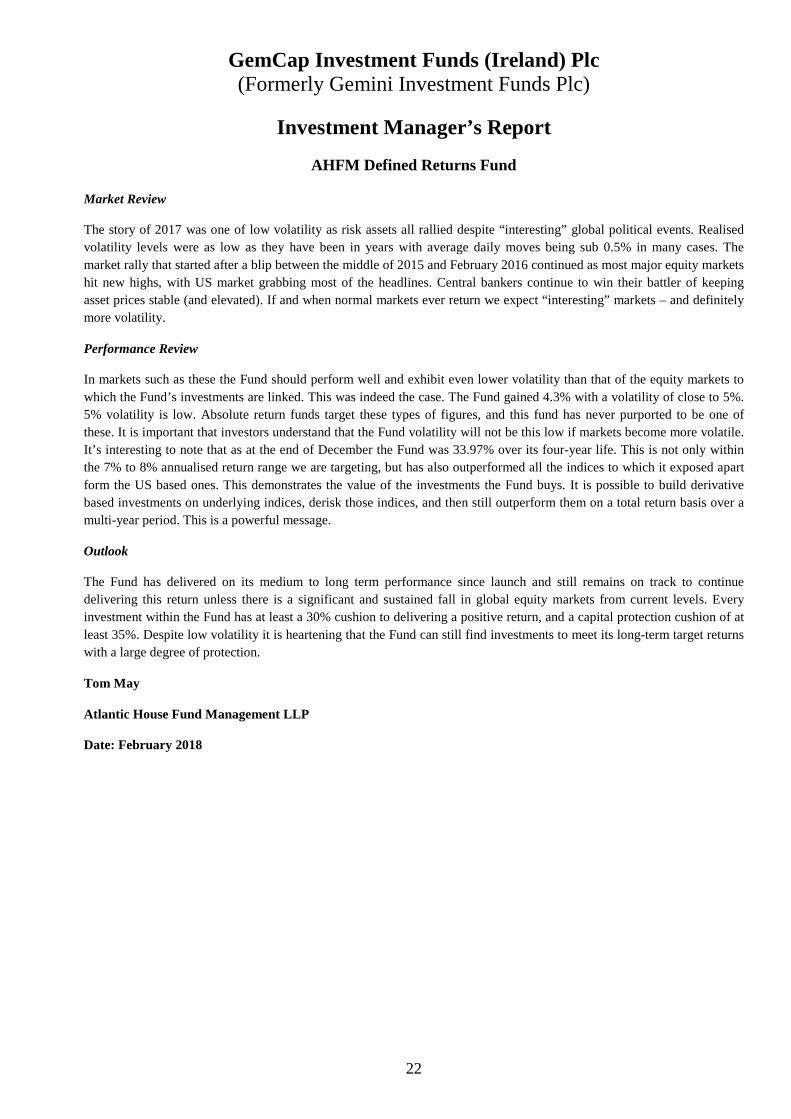
AHFM Defined Returns Fund Market Review
The story of 2017 was one of low volatility as risk assets all rallied despite “interesting” global political events. Realised volatility levels were as low as they have been in years with average daily moves being sub 0.5% in many cases. The market rally that started after a blip between the middle of 2015 and February 2016 continued as most major equity markets hit new highs, with US market grabbing most of the headlines. Central bankers continue to win their battler of keeping asset prices stable (and elevated). If and when normal markets ever return we expect “interesting” markets – and definitely more volatility.
Performance Review
In markets such as these the Fund should perform well and exhibit even lower volatility than that of the equity markets to which the Fund’s investments are linked. This was indeed the case. The Fund gained 4.3% with a volatility of close to 5%. 5% volatility is low. Absolute return funds target these types of figures, and this fund has never purported to be one of these. It is important that investors understand that the Fund volatility will not be this low if markets become more volatile. It’s interesting to note that as at the end of December the Fund was 33.97% over its four-year life. This is not only within the 7% to 8% annualised return range we are targeting, but has also outperformed all the indices to which it exposed apart form the US based ones. This demonstrates the value of the investments the Fund buys. It is possible to build derivative based investments on underlying indices, derisk those indices, and then still outperform them on a total return basis over a multi-year period. This is a powerful message.
Outlook
The Fund has delivered on its medium to long term performance since launch and still remains on track to continue delivering this return unless there is a significant and sustained fall in global equity markets from current levels. Every investment within the Fund has at least a 30% cushion to delivering a positive return, and a capital protection cushion of at least 35%. Despite low volatility it is heartening that the Fund can still find investments to meet its long-term target returns with a large degree of protection.
Tom May
Atlantic House Fund Management LLP
Date: February 2018

GemCap Investment Funds (Ireland) Plc (Formerly Gemini Investment Funds Plc)
23
Statement of Financial Position as at 31st December 2017 and 2016
AHFM AHFM 31 Dec 2017 31 Dec 2016 Note £ £
ASSETS Financial Assets at Fair Value through Profit or Loss:
Investments in Transferable Securities 3 440,340,314 165,763,987Investments in Financial Derivative Instruments 3 23,941,094 17,314,479
Cash at bank 5 14,197,942 16,855,492Dividends and interest receivable 1,168,682 473,866Amount receivable on subscriptions 2,451,210 545,604Other receivables - 112
TOTAL ASSETS 482,099,242 200,953,540
LIABILITIES Financial Liabilities at Fair Value through Profit or Loss:
Investments in Financial Derivative Instruments 3 4,946,964 5,563,546Investment management fees payable 7 202,104 85,973Manager fee payable 7 26,332 -Administration fees payable 7 13,259 5,320Transfer agency fees payable 7 716 693Directors fees payable 7 142 -Depositary and depositary oversight fees payable 7 1,404 5,565Audit fees payable 7 8,180 5,988Redemptions payable 1,624,320 429,794Other fees payable 47,921 31,018
TOTAL LIABILITIES (excluding net assets attributable to ho lders of redeemable participating shares) 6,871,342 6,127,897
NET ASSETS ATTRIBUTABLE TO HOLDERS OF REDEEMABLE PARTICIPATING SHARES 475,227,900 194,825,643 The accompanying notes and schedules form an integral part of these financial statements.
GemCap Investment Funds (Ireland) Plc (Formerly Gemini Investment Funds Plc)
24
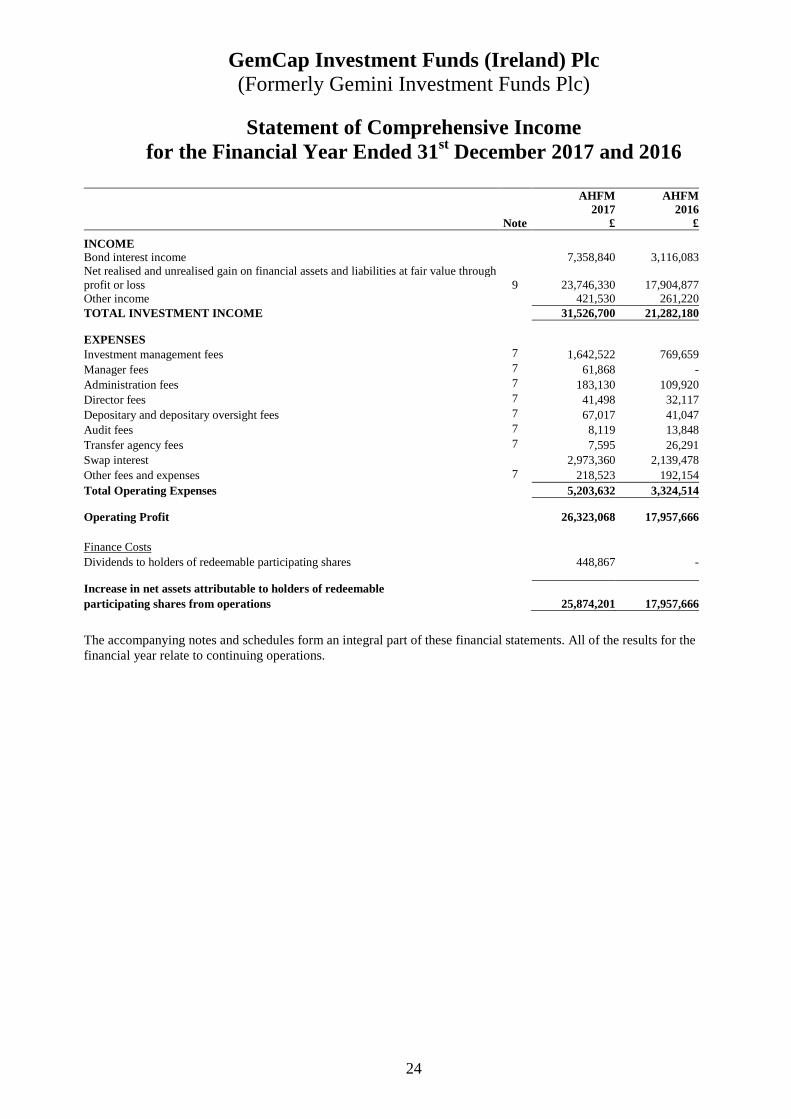
Statement of Comprehensive Income for the Financial Year Ended 31st December 2017 and 2016
AHFM AHFM
2017 2016 Note £ £
INCOME Bond interest income 7,358,840 3,116,083 Net realised and unrealised gain on financial assets and liabilities at fair value through profit or loss 9 23,746,330 17,904,877 Other income 421,530 261,220 TOTAL INVESTMENT INCOME 31,526,700 21,282,180 EXPENSES Investment management fees 7 1,642,522 769,659 Manager fees 7 61,868 - Administration fees 7 183,130 109,920 Director fees 7 41,498 32,117 Depositary and depositary oversight fees 7 67,017 41,047 Audit fees 7 8,119 13,848 Transfer agency fees 7 7,595 26,291 Swap interest 2,973,360 2,139,478 Other fees and expenses 7 218,523 192,154 Total Operating Expenses 5,203,632 3,324,514 Operating Profit 26,323,068 17,957,666 Finance Costs Dividends to holders of redeemable participating shares 448,867 - Increase in net assets attributable to holders of redeemable participating shares from operations 25,874,201 17,957,666
The accompanying notes and schedules form an integral part of these financial statements. All of the results for the financial year relate to continuing operations.

GemCap Investment Funds (Ireland) Plc (Formerly Gemini Investment Funds Plc)
25
Statement of Changes in Net Assets attributable to Holders of Redeemable Participating Shares
The accompanying notes and schedules form an integral part of these financial statements.
AHFM AHFM 2017 2016
£ £ Net Assets attributable to holders of Redeemable Participating Shares at the beginning of the financial year
194,825,643 106,880,676
Increase in Net Assets attributable to Holders of Redeemable Participating Shares from operations 25,874,201 17,957,666 Capital transactions Issue of redeemable shares during the financial year 309,688,941 90,960,546Redemption of redeemable shares during the financial year (55,160,885) (20,973,245)
Net Assets attributable to Holders of Redeemable Participating Shares at the end of the financial year
475,227,900 194,825,643
GemCap Investment Funds (Ireland) Plc (Formerly Gemini Investment Funds Plc)
26
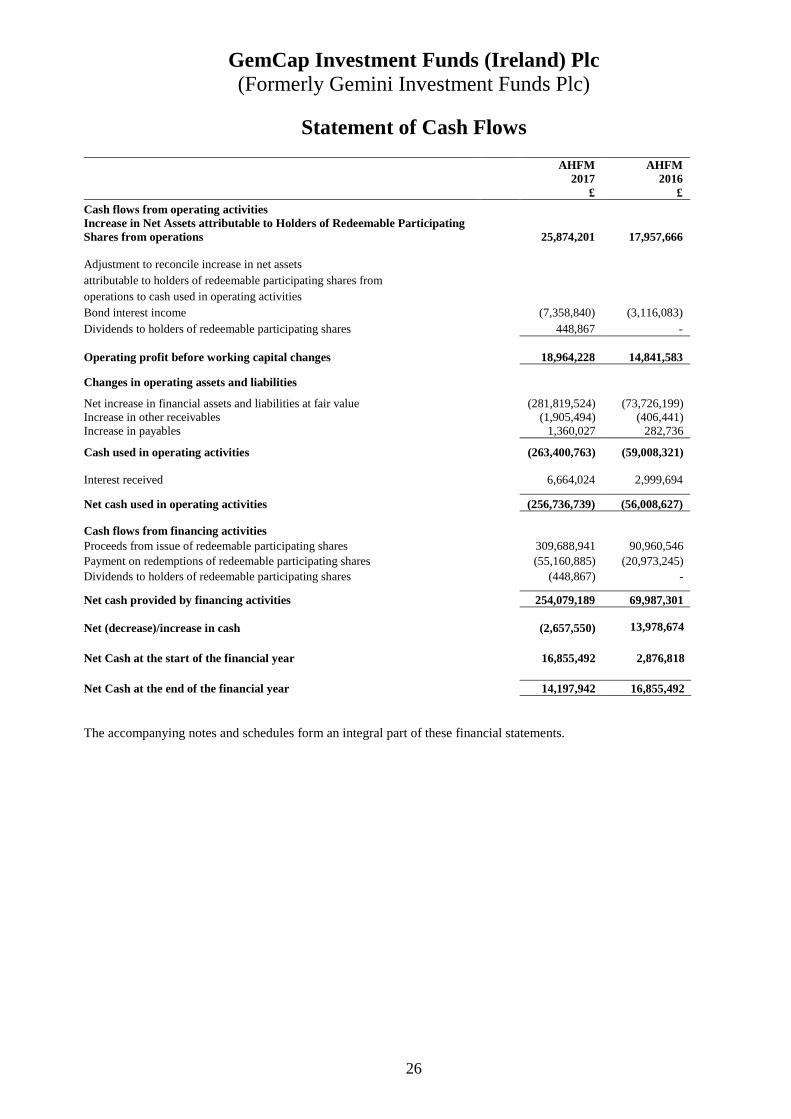
Statement of Cash Flows
AHFM AHFM 2017 2016 £ £ Cash flows from operating activities Increase in Net Assets attributable to Holders of Redeemable Participating Shares from operations 25,874,201 17,957,666 Adjustment to reconcile increase in net assets attributable to holders of redeemable participating shares from operations to cash used in operating activities Bond interest income (7,358,840) (3,116,083) Dividends to holders of redeemable participating shares 448,867 - Operating profit before working capital changes 18,964,228 14,841,583 Changes in operating assets and liabilities Net increase in financial assets and liabilities at fair value (281,819,524) (73,726,199) Increase in other receivables (1,905,494) (406,441) Increase in payables 1,360,027 282,736 Cash used in operating activities (263,400,763) (59,008,321)
Interest received 6,664,024 2,999,694 Net cash used in operating activities (256,736,739) (56,008,627) Cash flows from financing activities Proceeds from issue of redeemable participating shares 309,688,941 90,960,546 Payment on redemptions of redeemable participating shares (55,160,885) (20,973,245) Dividends to holders of redeemable participating shares (448,867) - - Net cash provided by financing activities 254,079,189 69,987,301
Net (decrease)/increase in cash (2,657,550) 13,978,674
Net Cash at the start of the financial year 16,855,492 2,876,818 Net Cash at the end of the financial year 14,197,942 16,855,492 The accompanying notes and schedules form an integral part of these financial statements.

GemCap Investment Funds (Ireland) Plc (Formerly Gemini Investment Funds Plc)
27
Schedule of Investments As at 31st December 2017
AHFM Defined Returns Fund
(expressed in GBP) Acquisition Fair % net Description Quantity Currency cost value assets
1) INVESTMENTS
A) TRANSFERABLE SECURITIES ADMITTED TO AN OFFICIAL STOCK EXCHANGE LISTING
1) LISTED SECURITIES : BONDS
GREAT BRITAIN United Kingdom Gilt 1.75% 07/09/2022 10,540,000 GBP 9,876,665 11,039,807 2.32 United Kingdom Gilt 2.25% 07/09/2023 14,050,217 GBP 13,893,595 15,154,143 3.19 United Kingdom Gilt 2.75% 07/09/2024 11,500,000 GBP 12,602,984 12,861,025 2.70 United Kingdom Gilt Inflation Linked 0.125% 22/03/2024 70,912,270 GBP 91,763,373 91,863,513 19.33 United Kingdom Gilt Inflation Linked 0.125% 22/03/2026 60,500,000 GBP 75,994,899 75,980,377 15.99
United Kingdom Gilt Inflation Linked 1.875% 22/11/2022 26,551,394 GBP 41,673,628 42,955,004 9.04 United Kingdom Gilt Inflation Linked 2.5% 16/04/2020 8,215,000 GBP 30,035,354 29,966,677 6.31 United Kingdom Gilt Inflation Linked 2.5% 17/07/2024 19,413,919 GBP 71,528,057 70,857,891 14.91
347,368,555 350,678,437 73.79
TOTAL LISTED SECURITIES : BONDS 347,368,555 350,678,437 73.79
TOTAL TRANSFERABLE SECURITIES ADMITTED TO AN OFFICIAL STOCK EXCHANGE LISTING 347,368,555 350,678,437 73.79
B) OTHER TRANSFERABLE SECURITIES DEALT ON AN OTHER REGULATED MARKET
1) OTHER ORGANISED MARKET : BONDS
GREAT BRITAIN HSBC Bank Plc 0% 04/04/2023 8,260,000 GBP 8,281,138 8,774,598 1.85
8,281,138 8,774,598 1.85
TOTAL OTHER ORGANISED MARKET : BONDS 8,281,138 8,774,598 1.85
TOTAL OTHER TRANSFERABLE SECURITIES DEALT ON AN OTHER REGULATED MARKET 8,281,138 8,774,598 1.85

GemCap Investment Funds (Ireland) Plc (Formerly Gemini Investment Funds Plc)
28
Schedule of Investments (continued) As at 31st December 2017
AHFM Defined Returns Fund
(expressed in GBP) Acquisition Fair % net Description Quantity Currency cost value assets
2) OTHER TRANSFERABLE SECURITIES : BONDS
GREAT BRITAIN Credit Suisse AG 0% 26/02/2021 4,500,000 GBP 4,687,404 5,823,901 1.22
Credit Suisse AG/London 0% 30/10/2023 11,100,000 GBP 11,106,650 11,446,320 2.41 HSBC Bank Plc 0% 15/05/2023 5,740,000 GBP 5,774,842 5,948,362 1.25 HSBC Bank Plc 0% 16/11/2022 2,800,000 GBP 2,793,000 3,212,440 0.68 Investec Bank Plc 0% 12/12/2023 16,430,000 GBP 16,435,585 16,435,585 3.45
40,797,481 42,866,608 9.01
LUXEMBOURG
Natixis Structured Issuance SA 0% 09/05/2023 EMTN 9,500,000 GBP 9,542,878 9,766,855 2.05 Natixis Structured Issuance SA 0% 17/03/2023 EMTN 15,040,000 GBP 15,183,650 16,126,038 3.39
24,726,528 25,892,893 5.44
NETHERLANDS JP Morgan Structured Products BV 0% 28/02/2023 EMTN 3,815,000 GBP 3,816,970 4,103,638 0.86 JP Morgan Structured Products BV 9% 10/03/2021 EMTN 6,420,000 GBP 6,426,531 8,024,140 1.69
10,243,501 12,127,778 2.55
TOTAL OTHER TRANSFERABLE SECURITIES : BONDS 75,767,510 80,887,279 17.00
TOTAL OTHER TRANSFERABLE SECURITIES 75,767,510 80,887,279 17.00
SWAP
AUTOCALLABLE SWAP
Underlying Index Fair % net Rate Floating Counterparties Basket Notional Currency value assets 3m GBP LIBOR Credit Suisse International UKX/SPX/SX5E 20,545,000 GBP 1,177,229 0.25 3m GBP LIBOR Credit Suisse International UKX/SPX/SX5E 20,180,000 GBP 1,115,954 0.23 3m GBP LIBOR Credit Suisse International UKX/RTY 18,945,000 GBP 992,718 0.21 3m GBP LIBOR Credit Suisse International UKX/SPX/SX5E 20,825,000 GBP 653,905 0.14
GemCap Investment Funds (Ireland) Plc (Formerly Gemini Investment Funds Plc)
29
Schedule of Investments (continued) As at 31st December 2017
AHFM Defined Returns Fund
SWAP (continued)
AUTOCALLABLE SWAP
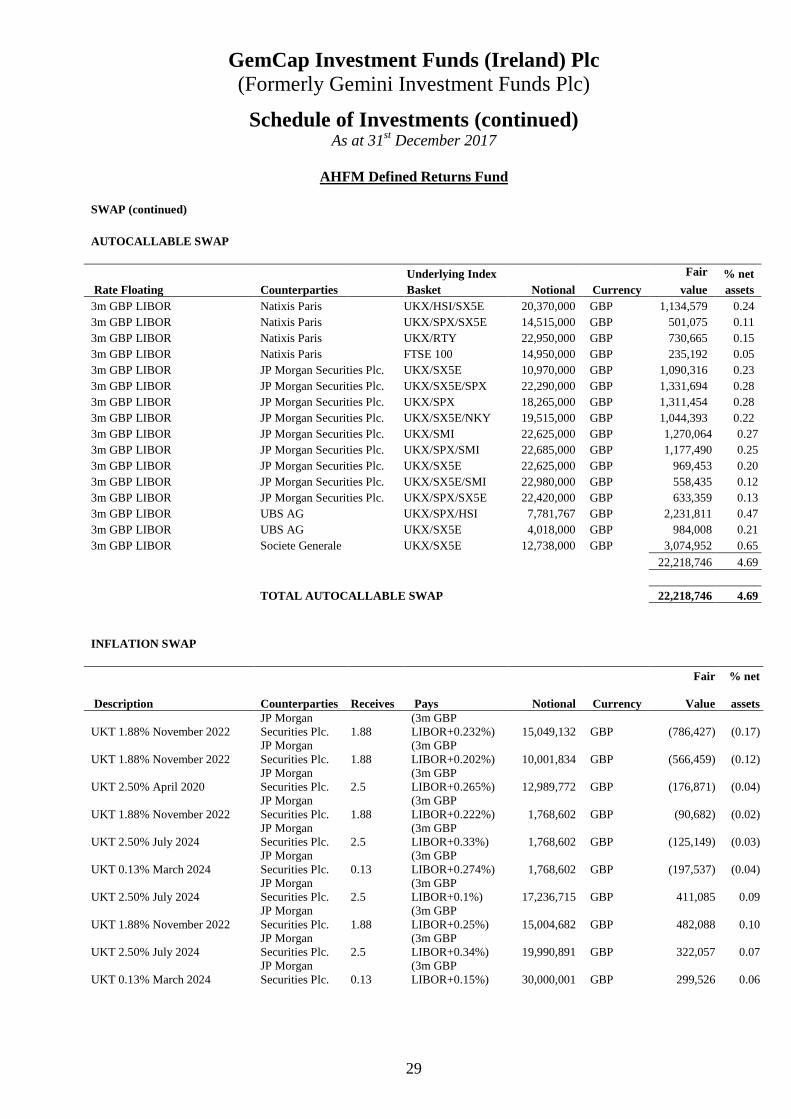
Underlying Index Fair % net Rate Floating Counterparties Basket Notional Currency value assets 3m GBP LIBOR Natixis Paris UKX/HSI/SX5E 20,370,000 GBP 1,134,579 0.24 3m GBP LIBOR Natixis Paris UKX/SPX/SX5E 14,515,000 GBP 501,075 0.11 3m GBP LIBOR Natixis Paris UKX/RTY 22,950,000 GBP 730,665 0.15 3m GBP LIBOR Natixis Paris FTSE 100 14,950,000 GBP 235,192 0.05 3m GBP LIBOR JP Morgan Securities Plc. UKX/SX5E 10,970,000 GBP 1,090,316 0.23 3m GBP LIBOR JP Morgan Securities Plc. UKX/SX5E/SPX 22,290,000 GBP 1,331,694 0.28 3m GBP LIBOR JP Morgan Securities Plc. UKX/SPX 18,265,000 GBP 1,311,454 0.28 3m GBP LIBOR JP Morgan Securities Plc. UKX/SX5E/NKY 19,515,000 GBP 1,044,393 0.22 3m GBP LIBOR JP Morgan Securities Plc. UKX/SMI 22,625,000 GBP 1,270,064 0.27 3m GBP LIBOR JP Morgan Securities Plc. UKX/SPX/SMI 22,685,000 GBP 1,177,490 0.25 3m GBP LIBOR JP Morgan Securities Plc. UKX/SX5E 22,625,000 GBP 969,453 0.20 3m GBP LIBOR JP Morgan Securities Plc. UKX/SX5E/SMI 22,980,000 GBP 558,435 0.12 3m GBP LIBOR JP Morgan Securities Plc. UKX/SPX/SX5E 22,420,000 GBP 633,359 0.13 3m GBP LIBOR UBS AG UKX/SPX/HSI 7,781,767 GBP 2,231,811 0.47 3m GBP LIBOR UBS AG UKX/SX5E 4,018,000 GBP 984,008 0.21 3m GBP LIBOR Societe Generale UKX/SX5E 12,738,000 GBP 3,074,952 0.65
22,218,746 4.69
TOTAL AUTOCALLABLE SWAP 22,218,746 4.69
INFLATION SWAP
Fair % net
Description Counterparties
Receives Pays Notional
Currency Value assets
UKT 1.88% November 2022 JP Morgan Securities Plc. 1.88
(3m GBP LIBOR+0.232%) 15,049,132 GBP (786,427) (0.17)
UKT 1.88% November 2022 JP Morgan Securities Plc. 1.88
(3m GBP LIBOR+0.202%) 10,001,834 GBP (566,459) (0.12)
UKT 2.50% April 2020 JP Morgan Securities Plc. 2.5
(3m GBP LIBOR+0.265%) 12,989,772 GBP (176,871) (0.04)
UKT 1.88% November 2022 JP Morgan Securities Plc. 1.88
(3m GBP LIBOR+0.222%) 1,768,602 GBP (90,682) (0.02)
UKT 2.50% July 2024 JP Morgan Securities Plc. 2.5
(3m GBP LIBOR+0.33%) 1,768,602 GBP (125,149) (0.03)
UKT 0.13% March 2024 JP Morgan Securities Plc. 0.13
(3m GBP LIBOR+0.274%) 1,768,602 GBP (197,537) (0.04)
UKT 2.50% July 2024 JP Morgan Securities Plc. 2.5
(3m GBP LIBOR+0.1%) 17,236,715 GBP 411,085 0.09
UKT 1.88% November 2022 JP Morgan Securities Plc. 1.88
(3m GBP LIBOR+0.25%) 15,004,682 GBP 482,088 0.10
UKT 2.50% July 2024 JP Morgan Securities Plc. 2.5
(3m GBP LIBOR+0.34%) 19,990,891 GBP 322,057 0.07
UKT 0.13% March 2024 JP Morgan Securities Plc. 0.13
(3m GBP LIBOR+0.15%) 30,000,001 GBP 299,526 0.06

GemCap Investment Funds (Ireland) Plc (Formerly Gemini Investment Funds Plc)
30
Schedule of Investments (continued) As at 31st December 2017
AHFM Defined Returns Fund
SWAP (continued)
INFLATION SWAP (continued)
Fair % net
Description Counterparties
Receives Pays Notional
Currency Value assets
UKT 2.50% July 2024 JP Morgan Securities Plc. 2.5
(3m GBP LIBOR+0.19%) 49,911,045 GBP 207,592 0.04
UKT 0.13% March 2024 JP Morgan Securities Plc. 2.5
(3m GBP LIBOR+0.083%) 60,000,085 GBP (382,098) (0.08)
UKT 0.13% March 2026 JP Morgan Securities Plc. 0.13
(3m GBP LIBOR+0.155%) 75,014,665 GBP (434,375) (0.09)
UKTI 0.125% March 2026 JP Morgan Securities Plc. 0.125
(3m GBP LIBOR+0.155%) 1,000,854 GBP (10,143) -
UKT 2.75% September 2024 JP Morgan Securities Plc. 2.75
(3m GBP LIBOR+0.015%) 12,742,905 GBP (98,265) (0.02)
(1,145,658) (0.25)
TOTAL INFLATION SWAP (1,145,658) (0.25)
INTEREST RATE SWAP
Fair % net
Description Counterparties
Receives Pays Notional
Currency Value assets
UKT 1.75% September 2022 JP Morgan Securities Plc. 1.75
(3m GBP LIBOR+0.065%) 9,923,311 GBP (1,012,684) (0.21)
UKT 2.25% September 2023 JP Morgan Securities Plc. 2.25
(3m GBP LIBOR+0.12%) 3,000,000 GBP (303,944) (0.06)
UKT 2.25% September 2023 JP Morgan Securities Plc. 2.25
(3m GBP LIBOR+0.125%) 2,699,139 GBP (235,644) (0.05)
UKT 2.25% September 2023 JP Morgan Securities Plc. 2.25
(3m GBP LIBOR+0.12%) 4,998,677 GBP (412,178) (0.09)
UKT 2.25% September 2023 JP Morgan Securities Plc. 2.25
(3m GBP LIBOR+0.0175%) 3,250,921 GBP (114,508) (0.02)
(2,078,958) (0.43)
TOTAL INTEREST RATE SWAP (2,078,958) (0.43) TOTAL SWAPS 18,994,130 4.01
TOTAL INVESTMENTS 459,334,444 96.65
OTHER ASSETS 17,817,834 3.75
OTHER LIABILITIES (1,924,378) (0.40)
NET ASSETS ATTRIBUTABLE TO HOLDERS OF REDEEMABLE PARTICIPATING SHARES 475,227,900 100.00
% of Total Assets
Assets % Investment in Transferable Securities 91.34 Investment in Financial Derivative Instruments 3.94 Cash at Bank 2.95 Other Assets and Liabilities 0.35
Total Assets 98.58
GemCap Investment Funds (Ireland) Plc (Formerly Gemini Investment Funds Plc)
31
Significant Portfolio Movements (unaudited) 31st December 2017
AHFM Defined Returns Fund
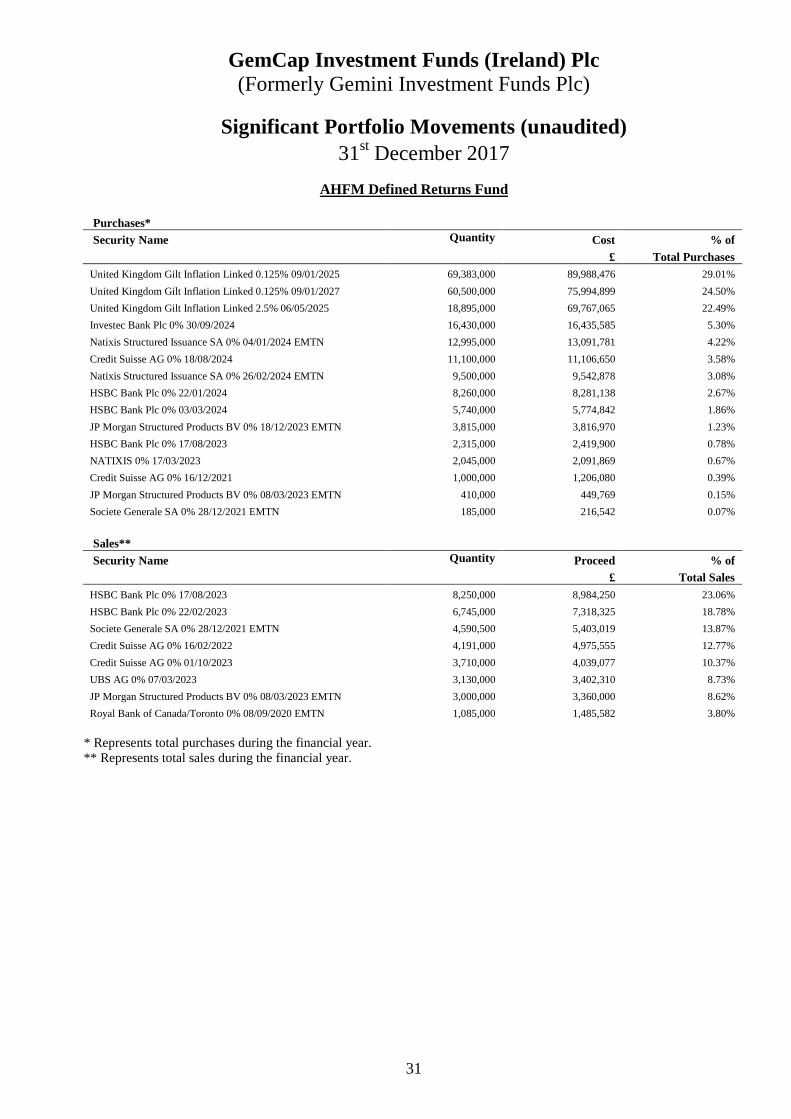
Purchases* Security Name Quantity Cost % of £ Total Purchases
United Kingdom Gilt Inflation Linked 0.125% 09/01/2025 69,383,000 89,988,476 29.01%
United Kingdom Gilt Inflation Linked 0.125% 09/01/2027 60,500,000 75,994,899 24.50%
United Kingdom Gilt Inflation Linked 2.5% 06/05/2025 18,895,000 69,767,065 22.49%
Investec Bank Plc 0% 30/09/2024 16,430,000 16,435,585 5.30%
Natixis Structured Issuance SA 0% 04/01/2024 EMTN 12,995,000 13,091,781 4.22%
Credit Suisse AG 0% 18/08/2024 11,100,000 11,106,650 3.58%
Natixis Structured Issuance SA 0% 26/02/2024 EMTN 9,500,000 9,542,878 3.08%
HSBC Bank Plc 0% 22/01/2024 8,260,000 8,281,138 2.67%
HSBC Bank Plc 0% 03/03/2024 5,740,000 5,774,842 1.86%
JP Morgan Structured Products BV 0% 18/12/2023 EMTN 3,815,000 3,816,970 1.23%
HSBC Bank Plc 0% 17/08/2023 2,315,000 2,419,900 0.78%
NATIXIS 0% 17/03/2023 2,045,000 2,091,869 0.67%
Credit Suisse AG 0% 16/12/2021 1,000,000 1,206,080 0.39%
JP Morgan Structured Products BV 0% 08/03/2023 EMTN 410,000 449,769 0.15%
Societe Generale SA 0% 28/12/2021 EMTN 185,000 216,542 0.07%
Sales** Security Name Quantity Proceed % of £ Total Sales
HSBC Bank Plc 0% 17/08/2023 8,250,000 8,984,250 23.06%
HSBC Bank Plc 0% 22/02/2023 6,745,000 7,318,325 18.78%
Societe Generale SA 0% 28/12/2021 EMTN 4,590,500 5,403,019 13.87%
Credit Suisse AG 0% 16/02/2022 4,191,000 4,975,555 12.77%
Credit Suisse AG 0% 01/10/2023 3,710,000 4,039,077 10.37%
UBS AG 0% 07/03/2023 3,130,000 3,402,310 8.73%
JP Morgan Structured Products BV 0% 08/03/2023 EMTN 3,000,000 3,360,000 8.62%
Royal Bank of Canada/Toronto 0% 08/09/2020 EMTN 1,085,000 1,485,582 3.80% * Represents total purchases during the financial year. ** Represents total sales during the financial year.
GemCap Investment Funds (Ireland) Plc (Formerly Gemini Investment Funds Plc)
32
Investment Manager’s Report
AHFM US Enhanced Equity Fund Market Review
US markets continued the bull run throughout the second half of 2017 that we reported at the interims. The S&P hit new highs on a regular basis much to Donald Trump’s delight. A large part of the rally may well be due to share buybacks. Indeed, the biggest buyer of US equities in recent years have been the corporates themselves. These share buybacks have been funded by cheap debt and perhaps the market knows that the corporates themselves create a floor price for equities which in itself creates positive feedback loop. This all works very well. Until it doesn’t. Performance Review
Over the period the Fund rose 11.3% and kept track with the S&P 500 Total Return Index. Since inception, the Fund has outperformed the index by almost 2% which is close the Fund’s aim of returning 1% to 2% per annum more than the index over the medium to long term. The dividend yield of the index has been slightly higher than that estimated at the beginning of the Fund’s life, hence the slight lag in performance relative to its aim. That said, it is notoriously difficult to outperform the S&P so the current level of outperformance is not without merit. Outlook
The Fund’s strategy is relatively passive. As such, we don’t envisage the shape of the Fund changing materially given that it is still on target to outperform the S&P over the medium to long term with its current holdings. That said, we continually monitor the existing portfolio to make sure that the instruments cannot be replaced with new ones that will better fulfil the Fund’s aims.
Tom May Atlantic House Fund Management LLP
Date: February 2018
GemCap Investment Funds (Ireland) Plc (Formerly Gemini Investment Funds Plc)
33
Statement of Financial Position as at 31st December 2017 and 2016
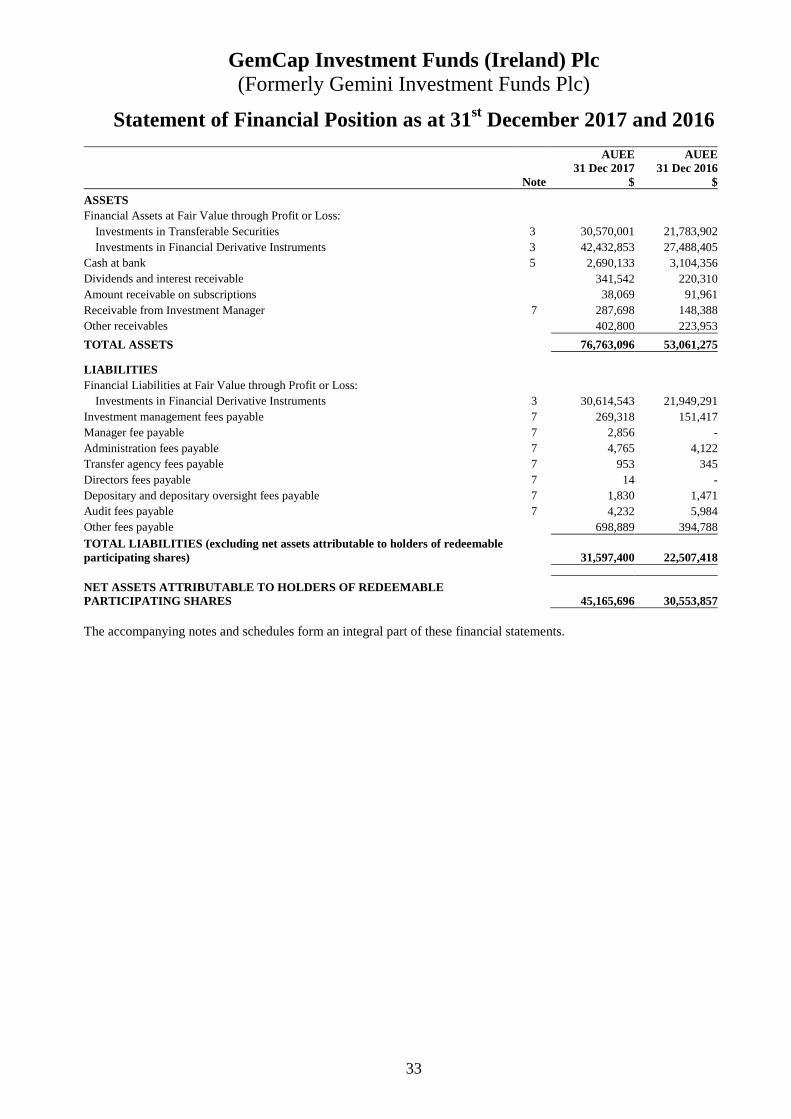
AUEE AUEE 31 Dec 2017 31 Dec 2016 Note $ $
ASSETS Financial Assets at Fair Value through Profit or Loss:
Investments in Transferable Securities 3 30,570,001 21,783,902Investments in Financial Derivative Instruments 3 42,432,853 27,488,405
Cash at bank 5 2,690,133 3,104,356Dividends and interest receivable 341,542 220,310Amount receivable on subscriptions 38,069 91,961Receivable from Investment Manager 7 287,698 148,388Other receivables 402,800 223,953
TOTAL ASSETS 76,763,096 53,061,275
LIABILITIES Financial Liabilities at Fair Value through Profit or Loss:
Investments in Financial Derivative Instruments 3 30,614,543 21,949,291Investment management fees payable 7 269,318 151,417Manager fee payable 7 2,856 -Administration fees payable 7 4,765 4,122Transfer agency fees payable 7 953 345Directors fees payable 7 14 -Depositary and depositary oversight fees payable 7 1,830 1,471Audit fees payable 7 4,232 5,984Other fees payable 698,889 394,788TOTAL LIABILITIES (excluding net assets attributable to ho lders of redeemable participating shares) 31,597,400 22,507,418
NET ASSETS ATTRIBUTABLE TO HOLDERS OF REDEEMABLE PARTICIPATING SHARES 45,165,696 30,553,857 The accompanying notes and schedules form an integral part of these financial statements.
GemCap Investment Funds (Ireland) Plc (Formerly Gemini Investment Funds Plc)
34
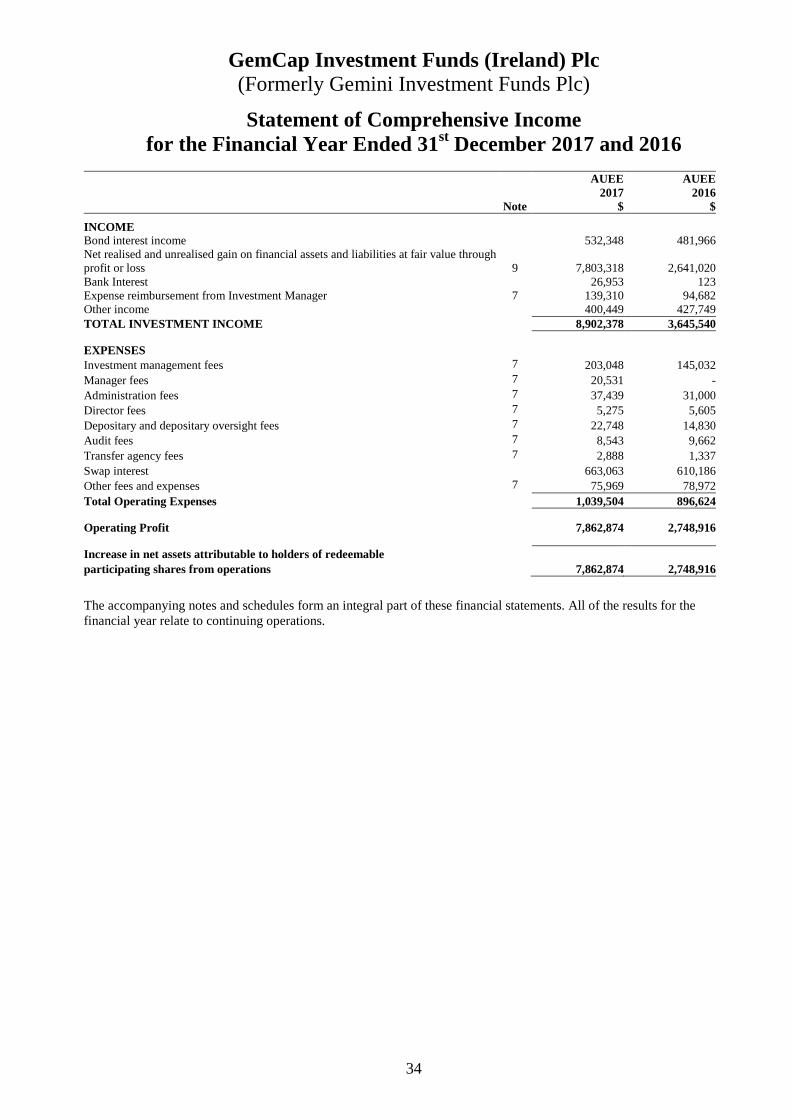
Statement of Comprehensive Income for the Financial Year Ended 31st December 2017 and 2016
AUEE AUEE
2017 2016 Note $ $
INCOME Bond interest income 532,348 481,966Net realised and unrealised gain on financial assets and liabilities at fair value through profit or loss 9 7,803,318 2,641,020Bank Interest 26,953 123Expense reimbursement from Investment Manager 7 139,310 94,682Other income 400,449 427,749TOTAL INVESTMENT INCOME 8,902,378 3,645,540 EXPENSES Investment management fees 7 203,048 145,032Manager fees 7 20,531 -Administration fees 7 37,439 31,000Director fees 7 5,275 5,605Depositary and depositary oversight fees 7 22,748 14,830Audit fees 7 8,543 9,662Transfer agency fees 7 2,888 1,337Swap interest 663,063 610,186Other fees and expenses 7 75,969 78,972Total Operating Expenses 1,039,504 896,624 Operating Profit 7,862,874 2,748,916 Increase in net assets attributable to holders of redeemable participating shares from operations 7,862,874 2,748,916
The accompanying notes and schedules form an integral part of these financial statements. All of the results for the financial year relate to continuing operations.

GemCap Investment Funds (Ireland) Plc (Formerly Gemini Investment Funds Plc)
35
Statement of Changes in Net Assets attributable to Holders of Redeemable Participating Shares
The accompanying notes and schedules form an integral part of these financial statements.
AUEE AUEE 2017 2016
$ $ Net Assets attributable to holders of Redeemable Participating Shares at the beginning of the financial year
30,553,857 29,820,991
Increase in Net Assets attributable to Holders of Redeemable Participating Shares from operations 7,862,874 2,748,916 Capital transactions Issue of redeemable shares during the financial year 9,960,460 4,823,254Redemption of redeemable shares during the financial year (3,211,495) (6,839,304)
Net Assets attributable to Holders of Redeemable Participating Shares at the end of the financial year
45,165,696 30,553,857

GemCap Investment Funds (Ireland) Plc (Formerly Gemini Investment Funds Plc)
36
Statement of Cash Flows
AUEE AUEE 2017 2016 $ $ Cash flows from operating activities Increase in Net Assets attributable to Holders of Redeemable Participating Shares from operations 7,862,874 2,748,916 Adjustment to reconcile increase in net assets attributable to holders of redeemable participating shares from operations to cash used in operating activities Bond interest income (532,348) (481,966) Operating profit before working capital changes 7,330,526 2,266,950 Changes in operating assets and liabilities Net increase in financial assets and liabilities at fair value (15,065,295) (741,615) Increase in other receivables (264,265) (289,368) Increase in payables 424,730 249,444 Cash (used in)/provided by operating activities (7,574,304) 1,485,411
Interest received 411,116 429,057 Net cash (used in)/provided by operating activities (7,163,188) 1,914,468 Cash flows from financing activities Proceeds from issue of redeemable participating shares 9,960,460 4,823,254 Payment on redemptions of redeemable participating shares (3,211,495) (6,839,304) Dividends to holders of redeemable participating shares - - Net cash provided by/(used in) financing activities 6,748,965 (2,016,050)
Net decrease in cash (414,223)
(101,582)
Net Cash at the start of the financial year 3,104,356 3,205,938 Net Cash at the end of the financial year 2,690,133 3,104,356 The accompanying notes and schedules form an integral part of these financial statements.
GemCap Investment Funds (Ireland) Plc (Formerly Gemini Investment Funds Plc)
37
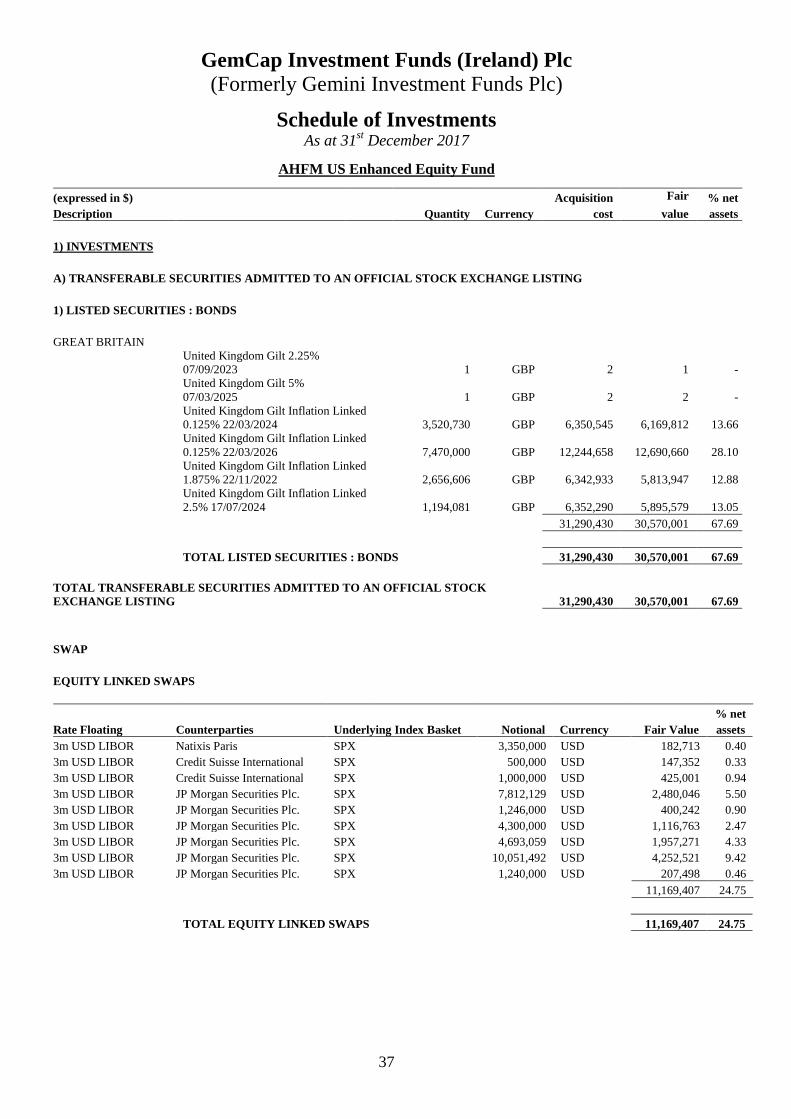
Schedule of Investments As at 31st December 2017
AHFM US Enhanced Equity Fund
(expressed in $) Acquisition Fair % net Description Quantity Currency cost value assets
1) INVESTMENTS
A) TRANSFERABLE SECURITIES ADMITTED TO AN OFFICIAL STOCK EXCHANGE LISTING
1) LISTED SECURITIES : BONDS
GREAT BRITAIN United Kingdom Gilt 2.25% 07/09/2023 1 GBP 2 1 - United Kingdom Gilt 5% 07/03/2025 1 GBP 2 2 - United Kingdom Gilt Inflation Linked 0.125% 22/03/2024 3,520,730 GBP 6,350,545 6,169,812 13.66 United Kingdom Gilt Inflation Linked 0.125% 22/03/2026 7,470,000 GBP 12,244,658 12,690,660 28.10
United Kingdom Gilt Inflation Linked 1.875% 22/11/2022 2,656,606 GBP 6,342,933 5,813,947 12.88 United Kingdom Gilt Inflation Linked 2.5% 17/07/2024 1,194,081 GBP 6,352,290 5,895,579 13.05
31,290,430 30,570,001 67.69
TOTAL LISTED SECURITIES : BONDS 31,290,430 30,570,001 67.69
TOTAL TRANSFERABLE SECURITIES ADMITTED TO AN OFFICIAL STOCK EXCHANGE LISTING 31,290,430 30,570,001 67.69
SWAP
EQUITY LINKED SWAPS
% net Rate Floating Counterparties Underlying Index Basket Notional Currency Fair Value assets 3m USD LIBOR Natixis Paris SPX 3,350,000 USD 182,713 0.40 3m USD LIBOR Credit Suisse International SPX 500,000 USD 147,352 0.33 3m USD LIBOR Credit Suisse International SPX 1,000,000 USD 425,001 0.94 3m USD LIBOR JP Morgan Securities Plc. SPX 7,812,129 USD 2,480,046 5.50 3m USD LIBOR JP Morgan Securities Plc. SPX 1,246,000 USD 400,242 0.90 3m USD LIBOR JP Morgan Securities Plc. SPX 4,300,000 USD 1,116,763 2.47 3m USD LIBOR JP Morgan Securities Plc. SPX 4,693,059 USD 1,957,271 4.33 3m USD LIBOR JP Morgan Securities Plc. SPX 10,051,492 USD 4,252,521 9.42 3m USD LIBOR JP Morgan Securities Plc. SPX 1,240,000 USD 207,498 0.46
11,169,407 24.75
TOTAL EQUITY LINKED SWAPS 11,169,407 24.75
GemCap Investment Funds (Ireland) Plc (Formerly Gemini Investment Funds Plc)
38
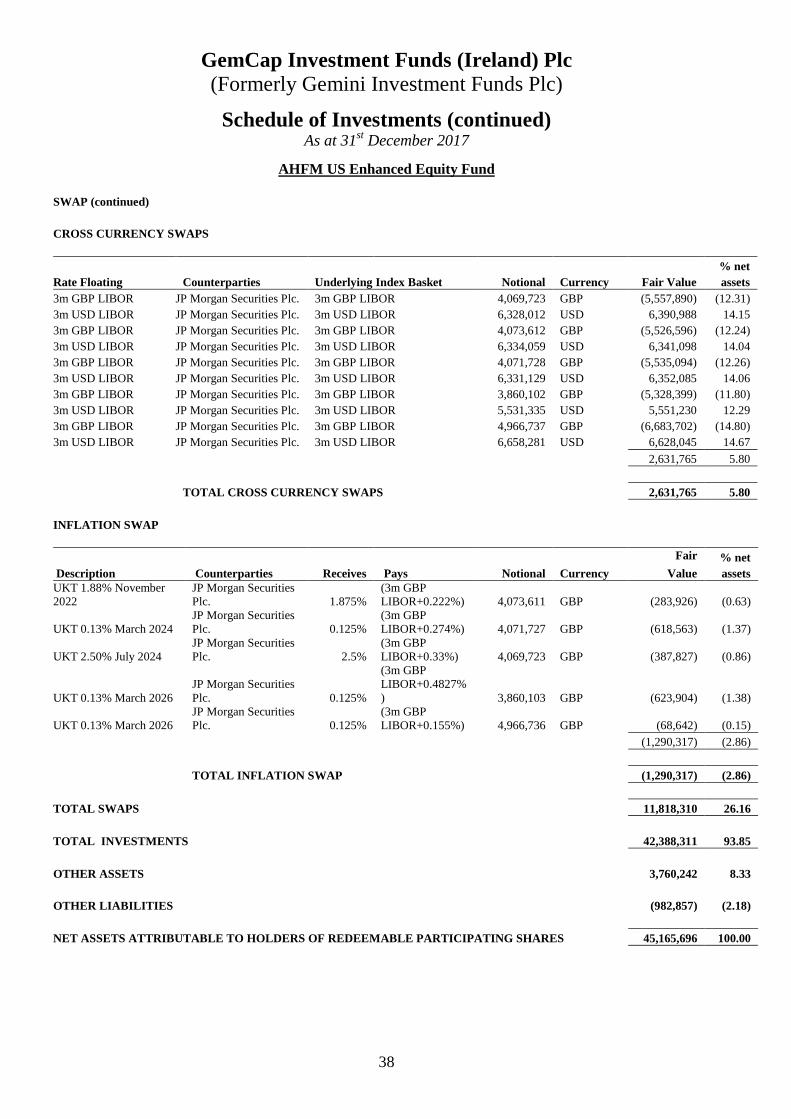
Schedule of Investments (continued) As at 31st December 2017
AHFM US Enhanced Equity Fund SWAP (continued)
CROSS CURRENCY SWAPS
% net Rate Floating Counterparties Underlying Index Basket Notional Currency Fair Value assets 3m GBP LIBOR JP Morgan Securities Plc. 3m GBP LIBOR 4,069,723 GBP (5,557,890) (12.31) 3m USD LIBOR JP Morgan Securities Plc. 3m USD LIBOR 6,328,012 USD 6,390,988 14.15 3m GBP LIBOR JP Morgan Securities Plc. 3m GBP LIBOR 4,073,612 GBP (5,526,596) (12.24) 3m USD LIBOR JP Morgan Securities Plc. 3m USD LIBOR 6,334,059 USD 6,341,098 14.04 3m GBP LIBOR JP Morgan Securities Plc. 3m GBP LIBOR 4,071,728 GBP (5,535,094) (12.26) 3m USD LIBOR JP Morgan Securities Plc. 3m USD LIBOR 6,331,129 USD 6,352,085 14.06 3m GBP LIBOR JP Morgan Securities Plc. 3m GBP LIBOR 3,860,102 GBP (5,328,399) (11.80) 3m USD LIBOR JP Morgan Securities Plc. 3m USD LIBOR 5,531,335 USD 5,551,230 12.29 3m GBP LIBOR JP Morgan Securities Plc. 3m GBP LIBOR 4,966,737 GBP (6,683,702) (14.80) 3m USD LIBOR JP Morgan Securities Plc. 3m USD LIBOR 6,658,281 USD 6,628,045 14.67
2,631,765 5.80
TOTAL CROSS CURRENCY SWAPS 2,631,765 5.80
INFLATION SWAP
Fair % net Description Counterparties Receives Pays Notional Currency Value assets UKT 1.88% November 2022
JP Morgan Securities Plc. 1.875%
(3m GBP LIBOR+0.222%) 4,073,611 GBP (283,926) (0.63)
UKT 0.13% March 2024 JP Morgan Securities Plc. 0.125%
(3m GBP LIBOR+0.274%) 4,071,727 GBP (618,563) (1.37)
UKT 2.50% July 2024 JP Morgan Securities Plc. 2.5%
(3m GBP LIBOR+0.33%) 4,069,723 GBP (387,827) (0.86)
UKT 0.13% March 2026 JP Morgan Securities Plc. 0.125%
(3m GBP LIBOR+0.4827%) 3,860,103 GBP (623,904) (1.38)
UKT 0.13% March 2026 JP Morgan Securities Plc. 0.125%
(3m GBP LIBOR+0.155%) 4,966,736 GBP (68,642) (0.15)
(1,290,317) (2.86)
TOTAL INFLATION SWAP (1,290,317) (2.86)
TOTAL SWAPS 11,818,310 26.16
TOTAL INVESTMENTS 42,388,311 93.85
OTHER ASSETS 3,760,242 8.33
OTHER LIABILITIES (982,857) (2.18)
NET ASSETS ATTRIBUTABLE TO HOLDERS OF REDEEMABLE PARTICIPATING SHARES 45,165,696 100.00
GemCap Investment Funds (Ireland) Plc (Formerly Gemini Investment Funds Plc)
39
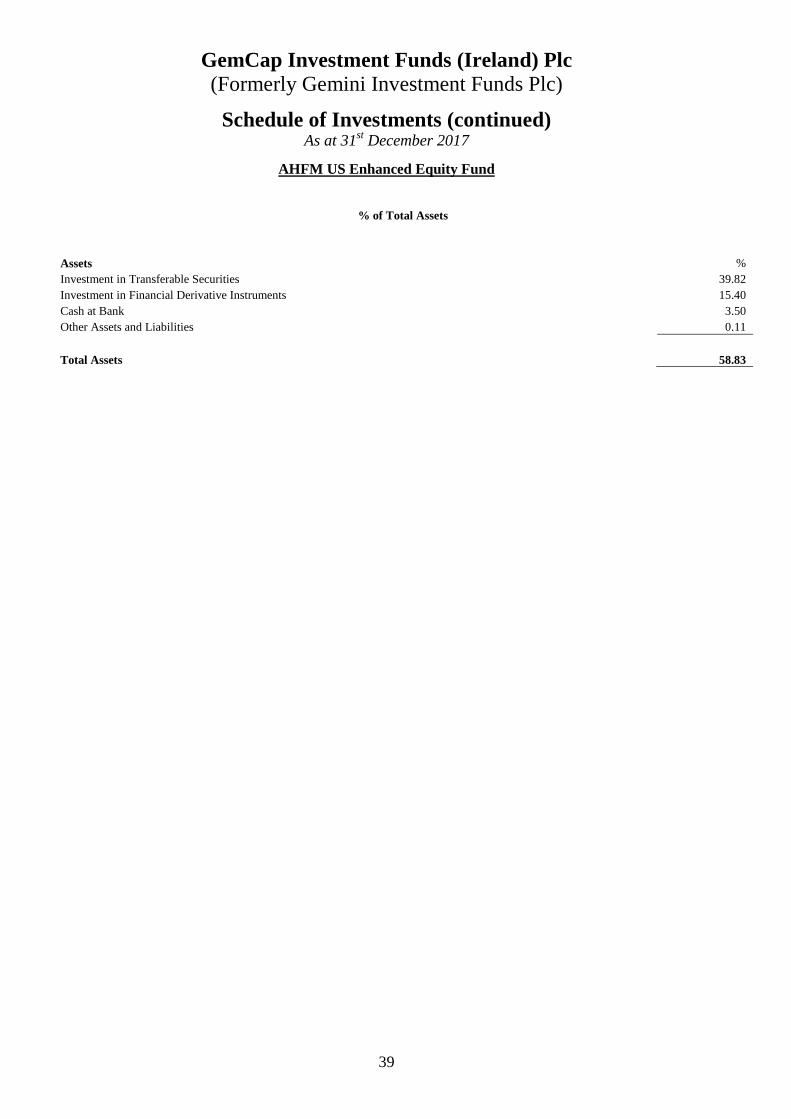
Schedule of Investments (continued) As at 31st December 2017
AHFM US Enhanced Equity Fund
% of Total Assets
Assets % Investment in Transferable Securities 39.82 Investment in Financial Derivative Instruments 15.40 Cash at Bank 3.50 Other Assets and Liabilities 0.11
Total Assets 58.83

GemCap Investment Funds (Ireland) Plc (Formerly Gemini Investment Funds Plc)
40
Significant Portfolio Movements (unaudited) 31st December 2017
AHFM US Enhanced Equity Fund
Purchases* Security Name Quantity Cost % of $ Total Purchases
United Kingdom Gilt Inflation Linked 0.125% 09/01/2027 4,770,000 8,028,816 100.00%
Sales**
Security Name Quantity Proceed % of $ Total Sales United Kingdom Gilt Inflation Linked 0.125% 09/01/2027 800,000 1,340,670 100.00% United Kingdom Gilt 1% 27/06/2018 1 1 0.00%
* Represents total purchases during the financial year. ** Represents total sales during the financial year.

GemCap Investment Funds (Ireland) Plc (Formerly Gemini Investment Funds Plc)
41
Investment Manager’s Report
GSI Global Diversified Value Fund For the 12 months to 31 December 2017.
GSI Global Diversified Value Fund: 10.76% S&P Developed Mkt Large/Mid Index (Net): 12.27%
Market highlights In the first half of 2017, economies around the world experienced a positive environment. Inflation remained low, helped by oil prices remaining low. Interest rates in the US were raised by 0.25% but held steady in other major economies. Equity markets delivered strong returns over the first 6 months of the year. Looking at returns based in USD terms, strong performers were the US and Asia/Pac, delivering returns in excess of 8% and 14%. European stocks were weaker, at 4.6%. The UK lagged all, returning just 2.4%. The main story for the second half of 2017 came in December. In that month, President Trump signed off on US tax cuts that, as reported by The Economist, would be worth 0.7% of GDP in 2018 and 1.5% of GP in 2019. Thus, the tightening of US monetary policy since 2015 was broadly offset by the loosening of its fiscal policy. As noted below, US stocks had a bumper second half. Elsewhere the economic news was generally positive. UK inflation was within expectations, though relatively high due to the imported inflation effects of Brexit. The Eurozone economies gained strength, mostly driven by Germany and France. Asia Pacific countries also experienced reasonable economic growth, although there have been concerns about the level of non-performing loans in the banking sector. Once again, equity markets delivered strong returns in the second half 2017. As in the first half of the year, in USD terms, the strong performers were the US and Asia/Pac, delivering returns in excess of 10% and 12% respectively. UK stocks were weaker at 5.1% and European stocks brought up the rear with a return of 1.8%. The GSI Global Diversified Value Fund (the Fund) has two key features that, in the longer term, we expect to generate higher returns compared to market-weighted broad global equity indices: (i) it has greater diversification at the stock and sector levels; and (ii) it tilts towards value stocks based on a blend of value metrics and small companies based on market capitalisation. From the perspective of simple indices, 2017 was a very poor year for value companies by comparison to their growth counterparts. The S&P500 large growth iShares ETF outperformed its large value equivalent by 12.7%. For the EAFE ETFs it was a similar story where growth outperformed value by 9.9%. The size premium was negative for US companies (-6.4%) but positive for EAFE small (7.7%). Similar results were experienced for the 6-month period. Over the 12 months, given the level of underperformance of value stocks against growth stocks, the Fund performed reasonably well, lagging the benchmark index by only 1.5% after fees and expenses (returns are in GBP as the currency of the A-Class shares is GBP). The results for the last 6 months of the year were even better, with the fund beating its benchmark by 0.73%.

GemCap Investment Funds (Ireland) Plc (Formerly Gemini Investment Funds Plc)
42
Investment Manager’s Report (Continued)
GSI Global Diversified Value Fund (Continued)
Market highlights (continued) The GSI Global Diversified Value Fund (the Fund) has two key features that, in the longer term, we expect to generate higher returns compared to market-weighted broad global equity indices: (i) it has greater diversification at the stock and sector levels; and (ii) it tilts towards value stocks based on a blend of value metrics and small companies based on market capitalisation. The Fund performed as would be expected from its diversified exposure to the value and smaller companies and, for the first six months of 2017, lagged the benchmark index by 1.9% after fees and expenses (returns are in GBP as the currency of the A-Class shares is GBP). The 12-month result was an underperformance of 0.98%. Outlook On the face of it, global economic growth looks set to continue as inflation remains low, employment figures are steady, and productivity improves. Firmer commodities prices tend to support this. However, the fly in the ointment is the effect of a sharp increase in the US budget deficit. The US economy has demonstrated a level of resilience to high levels of both trade and budget deficits. Nonetheless, most economists agree that someone will have to pay the bill. It is unclear how markets will react to this uncertainty. What is likely is that we will see a return to increased volatility. In a higher volatility environment, a well diversified, low-turnover approach is the best strategy for investors’ equity investments. The GSI Global Diversified Value Fund remains well diversified across markets, sectors, and stocks and we remain confident that the Fund is well positioned to perform to expectations through the next 6 months. Andrew Cain Global Systematic Investors LLP Date: February 2018
GemCap Investment Funds (Ireland) Plc (Formerly Gemini Investment Funds Plc)
43
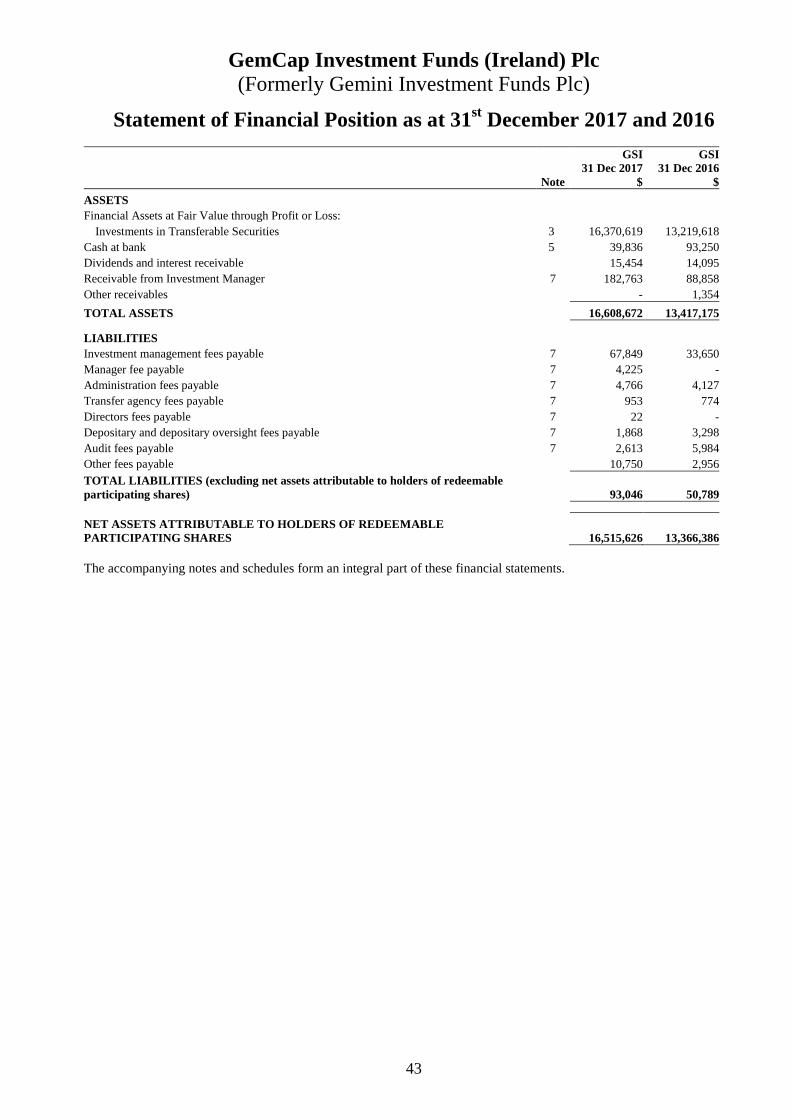
Statement of Financial Position as at 31st December 2017 and 2016
GSI GSI 31 Dec 2017 31 Dec 2016 Note $ $
ASSETS Financial Assets at Fair Value through Profit or Loss:
Investments in Transferable Securities 3 16,370,619 13,219,618Cash at bank 5 39,836 93,250Dividends and interest receivable 15,454 14,095Receivable from Investment Manager 7 182,763 88,858Other receivables - 1,354
TOTAL ASSETS 16,608,672 13,417,175
LIABILITIES Investment management fees payable 7 67,849 33,650Manager fee payable 7 4,225 -Administration fees payable 7 4,766 4,127Transfer agency fees payable 7 953 774Directors fees payable 7 22 -Depositary and depositary oversight fees payable 7 1,868 3,298Audit fees payable 7 2,613 5,984Other fees payable 10,750 2,956TOTAL LIABILITIES (excluding net assets attributable to ho lders of redeemable participating shares) 93,046 50,789
NET ASSETS ATTRIBUTABLE TO HOLDERS OF REDEEMABLE PARTICIPATING SHARES 16,515,626 13,366,386 The accompanying notes and schedules form an integral part of these financial statements.

GemCap Investment Funds (Ireland) Plc (Formerly Gemini Investment Funds Plc)
44
Statement of Comprehensive Income for the Financial Year Ended 31st December 2017 and 2016
GSI GSI
2017 2016 Note $ $
INCOME Dividend income 411,747 351,155Net realised and unrealised gain on financial assets and liabilities at fair value through profit or loss 9 2,627,359 912,962Bank Interest 302 4Expense reimbursement from Investment Manager 7 139,790 74,435Other income 3,516 5,746TOTAL INVESTMENT INCOME 3,182,714 1,344,302 EXPENSES Investment management fees 7 34,199 28,285Manager fees 7 26,153 -Administration fees 7 36,836 39,058Director fees 7 2,145 1,885Depositary and depositary oversight fees 7 24,666 16,454Audit fees 7 6,930 11,055Transfer agency fees 7 6,158 2,682Other fees and expenses 7 53,753 85,180Total Operating Expenses 190,840 184,599 Operating Profit 2,991,874 1,159,703 Finance Costs Dividends to holders of redeemable participating shares 314,073 266,999 Profit Before Tax 2,677,801 892,704 Withholding tax 80,729 69,034 Increase in net assets attributable to holders of redeemable participating shares from operations 2,597,072 823,670 The accompanying notes and schedules form an integral part of these financial statements. All of the results for the financial year relate to continuing operations.
GemCap Investment Funds (Ireland) Plc (Formerly Gemini Investment Funds Plc)
45
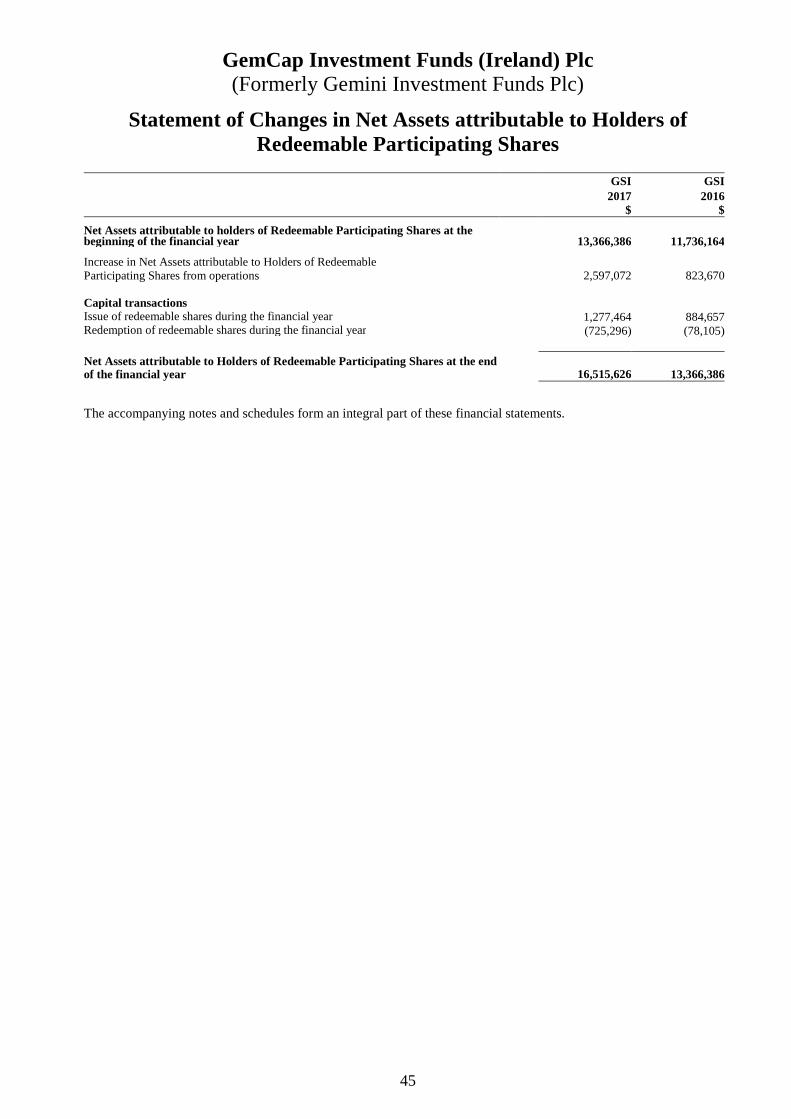
Statement of Changes in Net Assets attributable to Holders of Redeemable Participating Shares
The accompanying notes and schedules form an integral part of these financial statements.
GSI GSI 2017 2016
$ $ Net Assets attributable to holders of Redeemable Participating Shares at the beginning of the financial year
13,366,386 11,736,164
Increase in Net Assets attributable to Holders of Redeemable Participating Shares from operations 2,597,072 823,670 Capital transactions Issue of redeemable shares during the financial year 1,277,464 884,657Redemption of redeemable shares during the financial year (725,296) (78,105)
Net Assets attributable to Holders of Redeemable Participating Shares at the end of the financial year
16,515,626 13,366,386
GemCap Investment Funds (Ireland) Plc (Formerly Gemini Investment Funds Plc)
46
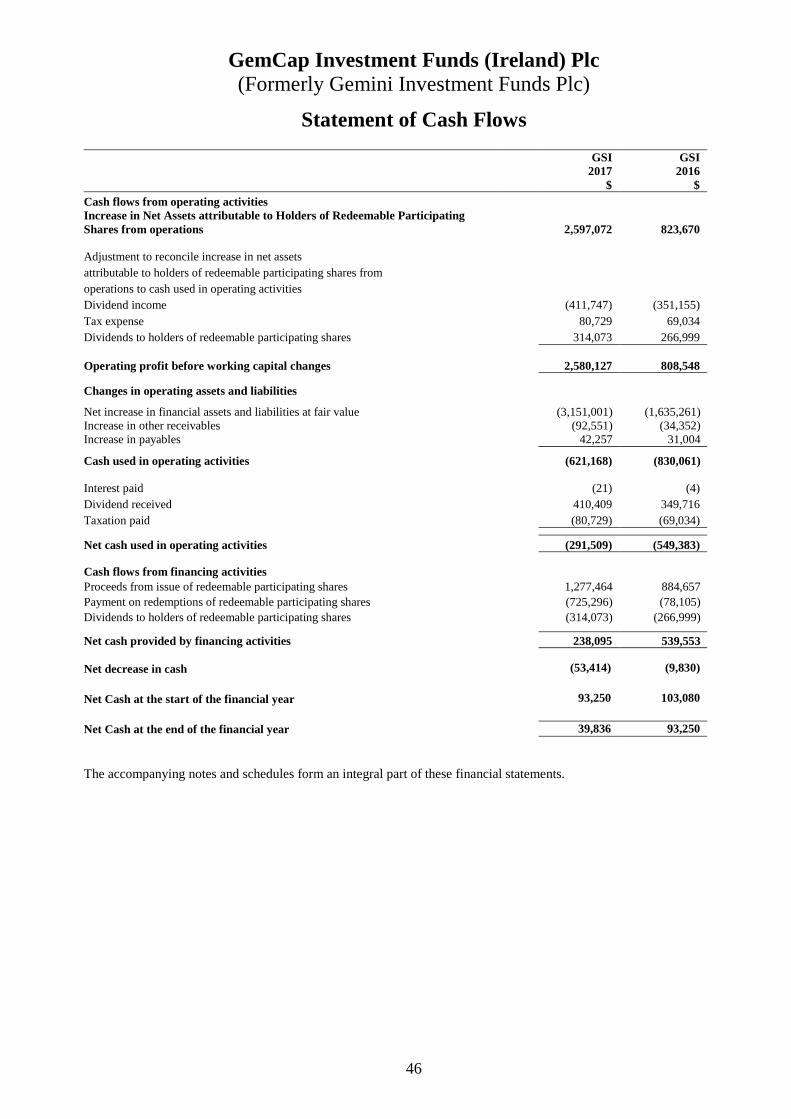
Statement of Cash Flows
GSI GSI 2017 2016 $ $ Cash flows from operating activities Increase in Net Assets attributable to Holders of Redeemable Participating Shares from operations 2,597,072 823,670 Adjustment to reconcile increase in net assets attributable to holders of redeemable participating shares from operations to cash used in operating activities Dividend income (411,747) (351,155) Tax expense 80,729 69,034 Dividends to holders of redeemable participating shares 314,073 266,999 Operating profit before working capital changes 2,580,127 808,548 Changes in operating assets and liabilities Net increase in financial assets and liabilities at fair value (3,151,001) (1,635,261) Increase in other receivables (92,551) (34,352) Increase in payables 42,257 31,004 Cash used in operating activities (621,168) (830,061)
Interest paid (21) (4) Dividend received 410,409 349,716 Taxation paid (80,729) (69,034) Net cash used in operating activities (291,509) (549,383) Cash flows from financing activities Proceeds from issue of redeemable participating shares 1,277,464 884,657 Payment on redemptions of redeemable participating shares (725,296) (78,105) Dividends to holders of redeemable participating shares (314,073) (266,999) Net cash provided by financing activities 238,095 539,553
Net decrease in cash (53,414)
(9,830)
Net Cash at the start of the financial year 93,250
103,080
Net Cash at the end of the financial year 39,836
93,250
The accompanying notes and schedules form an integral part of these financial statements.

GemCap Investment Funds (Ireland) Plc (Formerly Gemini Investment Funds Plc)
47
Schedule of Investments As at 31sh December 2017
GSI Global Diversified Value Fund
(expressed in USD) Acquisition Fair % net Description Quantity Currency cost value assets
1) INVESTMENTS
A) TRANSFERABLE SECURITIES ADMITTED TO AN OFFICIAL STOCK EXCHANGE LISTING
1) LISTED SECURITIES : SHARES
AUSTRALIA AGL Energy Ltd 285 AUD 3,735 5,417 0.03 Amcor Ltd 460 AUD 5,420 5,534 0.03 APA Group 1,047 AUD 7,274 6,805 0.04 AusNet Services 4,544 AUD 5,844 6,399 0.04 Australia & New Zealand Banking Group Ltd 722 AUD 14,894 16,189 0.10 Bendigo & Adelaide Bank Ltd 612 AUD 5,646 5,572 0.03 BHP Billiton Ltd 1,808 AUD 31,506 41,711 0.25 BlueScope Steel Ltd 1,000 AUD 9,210 11,992 0.07 Boral Ltd 774 AUD 2,970 4,704 0.03 Brambles Ltd 642 AUD 4,634 5,044 0.03 Caltex Australia Ltd 522 AUD 12,725 13,867 0.08 Challenger Ltd/Australia 541 AUD 5,713 5,922 0.04 CIMIC Group Ltd 174 AUD 3,247 6,985 0.04 Coca-Cola Amatil Ltd 973 AUD 7,497 6,460 0.04 Commonwealth Bank of Australia 296 AUD 16,283 18,554 0.11 Computershare Ltd 459 AUD 5,320 5,837 0.04 CSL Ltd 137 AUD 8,957 15,103 0.09 Fortescue Metals Group Ltd 2,282 AUD 10,954 8,688 0.05 Incitec Pivot Ltd 2,262 AUD 5,738 6,883 0.04 Macquarie Group Ltd 150 AUD 9,360 11,660 0.07 National Australia Bank Ltd 887 AUD 19,730 20,464 0.12 Newcrest Mining Ltd 610 AUD 8,553 10,861 0.07 Orica Ltd 454 AUD 5,886 6,411 0.04 Origin Energy Ltd 1,324 AUD 8,445 9,731 0.06 Qantas Airways Ltd 1,194 AUD 3,429 4,695 0.03 Rio Tinto Ltd 294 AUD 11,135 17,389 0.11 South32 Ltd 3,741 AUD 9,591 10,186 0.06 Suncorp Group Ltd 886 AUD 8,471 9,581 0.06 Sydney Airport 1,440 AUD 6,834 7,921 0.05 Telstra Corp Ltd 4,698 AUD 18,599 13,305 0.08 Wesfarmers Ltd 472 AUD 13,882 16,358 0.10 Westpac Banking Corp 634 AUD 14,207 15,507 0.09 Woodside Petroleum Ltd 682 AUD 12,923 17,602 0.11 Woolworths Group Ltd 358 AUD 5,941 7,625 0.05
324,553 376,962 2.28

GemCap Investment Funds (Ireland) Plc (Formerly Gemini Investment Funds Plc)
48
Schedule of Investments (continued) As at 31sh December 2017
GSI Global Diversified Value Fund
(expressed in USD) Acquisition Fair % net Description Quantity Currency cost value assets
A) TRANSFERABLE SECURITIES ADMITTED TO AN OFFICIAL STOCK EXCHANGE LISTING (continued)
1) LISTED SECURITIES : SHARES (continued)
BELGIUM Ageas 234 EUR 8,596 11,431 0.07 Anheuser-Busch InBev SA 133 EUR 15,448 14,861 0.09 Colruyt SA 153 EUR 7,621 7,960 0.05 Groupe Bruxelles Lambert SA 86 EUR 7,553 9,285 0.06 KBC Group NV 95 EUR 5,724 8,105 0.05 Proximus SADP 249 EUR 7,662 8,171 0.05 Solvay SA 45 EUR 6,413 6,258 0.04
59,017 66,071 0.41
BERMUDA ISLANDS Arch Capital Group Ltd 86 USD 7,853 7,806 0.05 Bunge Ltd 167 USD 13,018 11,202 0.07 Everest Re Group Ltd 37 USD 8,431 8,187 0.05 Hongkong Land Holdings Ltd 900 USD 6,674 6,336 0.04 Invesco Ltd 286 USD 9,224 10,450 0.06 Li & Fung Ltd 16,000 HKD 9,836 8,786 0.05 Marvell Technology Group Ltd 408 USD 3,766 8,760 0.05 XL Group Ltd 256 USD 9,265 9,001 0.05 Yue Yuen Industrial Holdings Ltd 1,500 HKD 5,309 5,894 0.04
73,376 76,422 0.46
CANADA Agnico Eagle Mines Ltd 167 CAD 7,646 7,713 0.05 Agrium Inc 169 CAD 16,018 19,443 0.12 Alimentation Couche-Tard Inc 220 CAD 10,354 11,482 0.07 Bank of Montreal 244 CAD 14,322 19,530 0.12 Bank of Nova Scotia 362 CAD 16,953 23,367 0.14 Barrick Gold Corp 944 CAD 13,865 13,656 0.08 BCE Inc 273 CAD 12,619 13,117 0.08 CAE Inc 402 CAD 7,067 7,469 0.05 Canadian Imperial Bank of Commerce 153 CAD 11,958 14,919 0.09 Canadian National Railway Co 330 CAD 19,990 27,218 0.16 Canadian Natural Resources Ltd 325 CAD 7,803 11,617 0.07 Canadian Pacific Railway Ltd 41 CAD 5,531 7,493 0.05 Canadian Utilities Ltd 288 CAD 9,038 8,573 0.05 CCL Industries Inc 205 CAD 7,728 9,474 0.06 Cenovus Energy Inc 503 CAD 7,633 4,595 0.03 CGI Group Inc 154 CAD 7,084 8,370 0.05 Crescent Point Energy Corp 948 CAD 16,774 7,227 0.04 Dollarama Inc 72 CAD 8,335 8,998 0.05
GemCap Investment Funds (Ireland) Plc (Formerly Gemini Investment Funds Plc)
49
Schedule of Investments (continued) As at 31sh December 2017
GSI Global Diversified Value Fund
(expressed in USD) Acquisition Fair % net Description Quantity Currency cost value assets
A) TRANSFERABLE SECURITIES ADMITTED TO AN OFFICIAL STOCK EXCHANGE LISTING (continued)
1) LISTED SECURITIES : SHARES (continued)
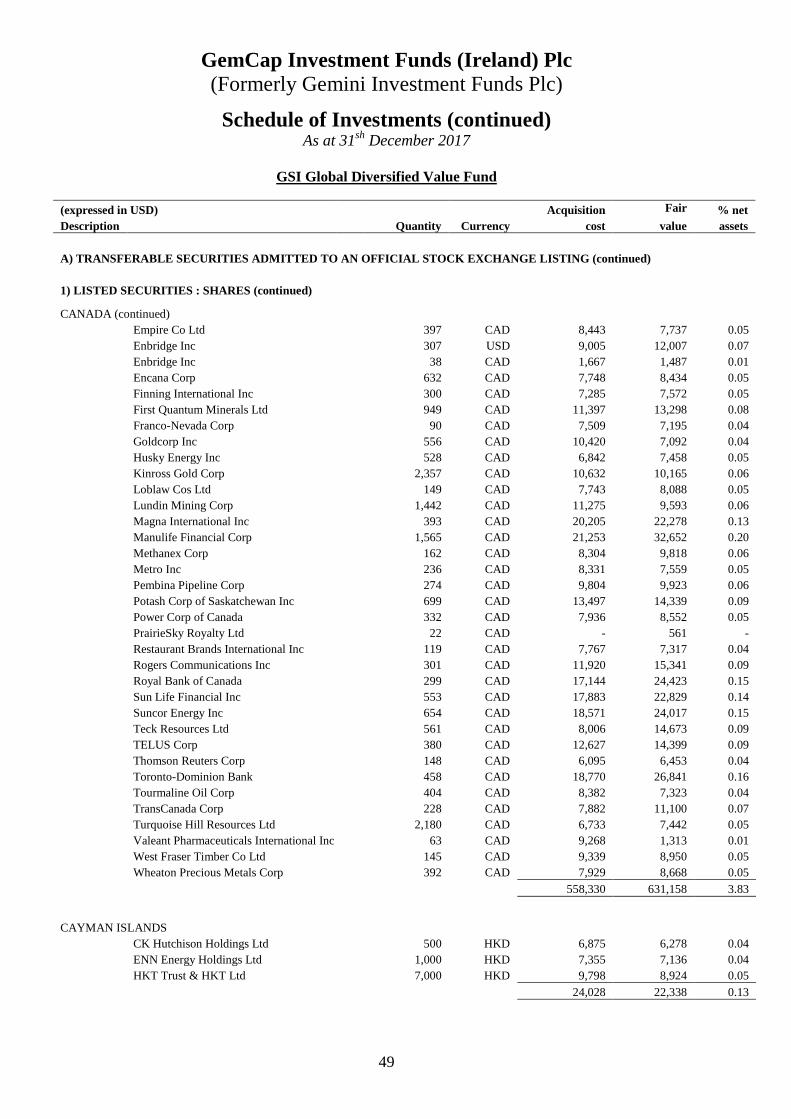
CANADA (continued) Empire Co Ltd 397 CAD 8,443 7,737 0.05
Enbridge Inc 307 USD 9,005 12,007 0.07 Enbridge Inc 38 CAD 1,667 1,487 0.01
Encana Corp 632 CAD 7,748 8,434 0.05 Finning International Inc 300 CAD 7,285 7,572 0.05 First Quantum Minerals Ltd 949 CAD 11,397 13,298 0.08 Franco-Nevada Corp 90 CAD 7,509 7,195 0.04 Goldcorp Inc 556 CAD 10,420 7,092 0.04 Husky Energy Inc 528 CAD 6,842 7,458 0.05 Kinross Gold Corp 2,357 CAD 10,632 10,165 0.06 Loblaw Cos Ltd 149 CAD 7,743 8,088 0.05 Lundin Mining Corp 1,442 CAD 11,275 9,593 0.06 Magna International Inc 393 CAD 20,205 22,278 0.13 Manulife Financial Corp 1,565 CAD 21,253 32,652 0.20 Methanex Corp 162 CAD 8,304 9,818 0.06 Metro Inc 236 CAD 8,331 7,559 0.05 Pembina Pipeline Corp 274 CAD 9,804 9,923 0.06 Potash Corp of Saskatchewan Inc 699 CAD 13,497 14,339 0.09 Power Corp of Canada 332 CAD 7,936 8,552 0.05 PrairieSky Royalty Ltd 22 CAD - 561 - Restaurant Brands International Inc 119 CAD 7,767 7,317 0.04 Rogers Communications Inc 301 CAD 11,920 15,341 0.09 Royal Bank of Canada 299 CAD 17,144 24,423 0.15 Sun Life Financial Inc 553 CAD 17,883 22,829 0.14 Suncor Energy Inc 654 CAD 18,571 24,017 0.15 Teck Resources Ltd 561 CAD 8,006 14,673 0.09 TELUS Corp 380 CAD 12,627 14,399 0.09 Thomson Reuters Corp 148 CAD 6,095 6,453 0.04 Toronto-Dominion Bank 458 CAD 18,770 26,841 0.16 Tourmaline Oil Corp 404 CAD 8,382 7,323 0.04 TransCanada Corp 228 CAD 7,882 11,100 0.07 Turquoise Hill Resources Ltd 2,180 CAD 6,733 7,442 0.05 Valeant Pharmaceuticals International Inc 63 CAD 9,268 1,313 0.01 West Fraser Timber Co Ltd 145 CAD 9,339 8,950 0.05 Wheaton Precious Metals Corp 392 CAD 7,929 8,668 0.05
558,330 631,158 3.83
CAYMAN ISLANDS CK Hutchison Holdings Ltd 500 HKD 6,875 6,278 0.04 ENN Energy Holdings Ltd 1,000 HKD 7,355 7,136 0.04 HKT Trust & HKT Ltd 7,000 HKD 9,798 8,924 0.05
24,028 22,338 0.13
GemCap Investment Funds (Ireland) Plc (Formerly Gemini Investment Funds Plc)
50
Schedule of Investments (continued) As at 31sh December 2017
GSI Global Diversified Value Fund
(expressed in USD) Acquisition Fair % net Description Quantity Currency cost value assets
A) TRANSFERABLE SECURITIES ADMITTED TO AN OFFICIAL STOCK EXCHANGE LISTING (continued)
1) LISTED SECURITIES : SHARES (continued)
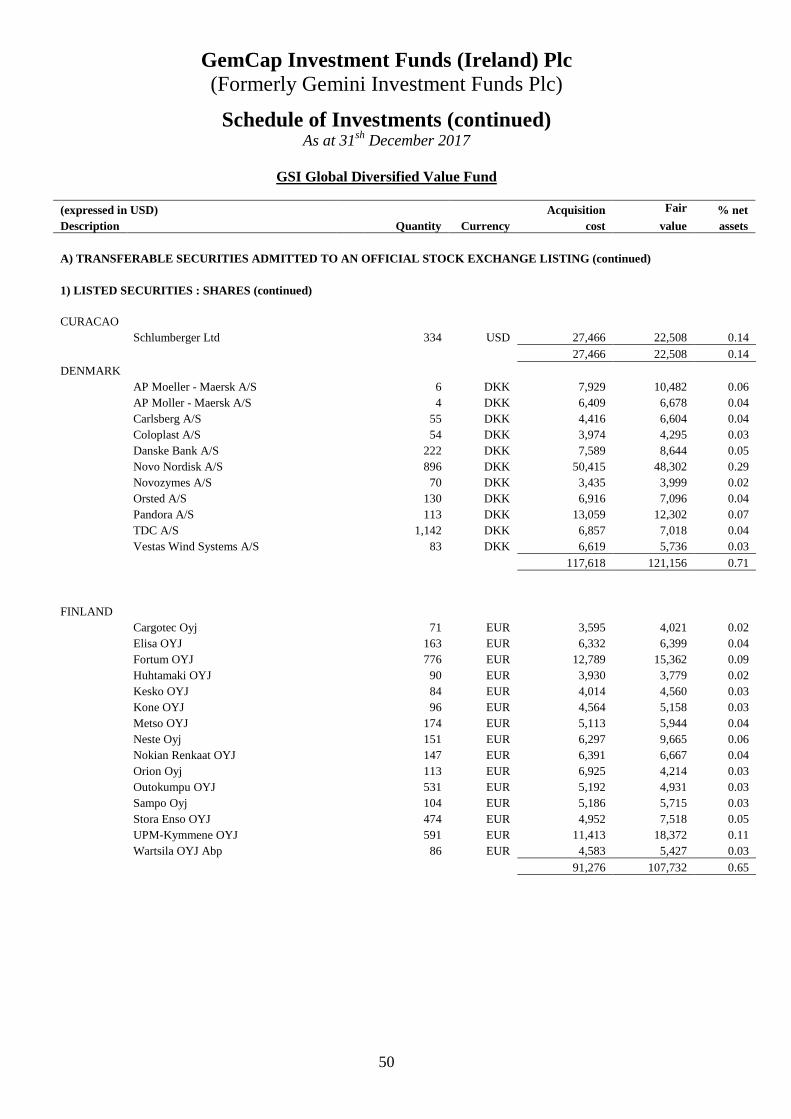
CURACAO Schlumberger Ltd 334 USD 27,466 22,508 0.14
27,466 22,508 0.14
DENMARK AP Moeller - Maersk A/S 6 DKK 7,929 10,482 0.06 AP Moller - Maersk A/S 4 DKK 6,409 6,678 0.04 Carlsberg A/S 55 DKK 4,416 6,604 0.04 Coloplast A/S 54 DKK 3,974 4,295 0.03 Danske Bank A/S 222 DKK 7,589 8,644 0.05 Novo Nordisk A/S 896 DKK 50,415 48,302 0.29 Novozymes A/S 70 DKK 3,435 3,999 0.02 Orsted A/S 130 DKK 6,916 7,096 0.04 Pandora A/S 113 DKK 13,059 12,302 0.07 TDC A/S 1,142 DKK 6,857 7,018 0.04 Vestas Wind Systems A/S 83 DKK 6,619 5,736 0.03
117,618 121,156 0.71
FINLAND Cargotec Oyj 71 EUR 3,595 4,021 0.02 Elisa OYJ 163 EUR 6,332 6,399 0.04 Fortum OYJ 776 EUR 12,789 15,362 0.09 Huhtamaki OYJ 90 EUR 3,930 3,779 0.02 Kesko OYJ 84 EUR 4,014 4,560 0.03 Kone OYJ 96 EUR 4,564 5,158 0.03 Metso OYJ 174 EUR 5,113 5,944 0.04 Neste Oyj 151 EUR 6,297 9,665 0.06 Nokian Renkaat OYJ 147 EUR 6,391 6,667 0.04 Orion Oyj 113 EUR 6,925 4,214 0.03 Outokumpu OYJ 531 EUR 5,192 4,931 0.03 Sampo Oyj 104 EUR 5,186 5,715 0.03 Stora Enso OYJ 474 EUR 4,952 7,518 0.05 UPM-Kymmene OYJ 591 EUR 11,413 18,372 0.11 Wartsila OYJ Abp 86 EUR 4,583 5,427 0.03
91,276 107,732 0.65
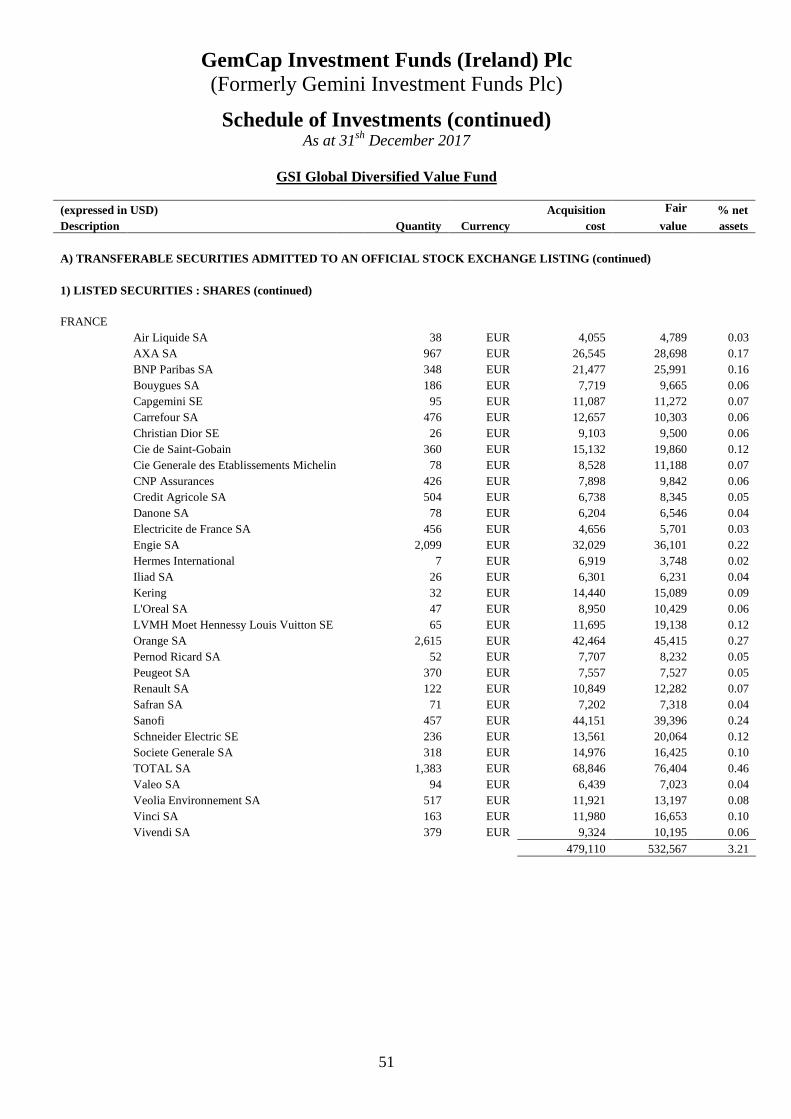
GemCap Investment Funds (Ireland) Plc (Formerly Gemini Investment Funds Plc)
51
Schedule of Investments (continued) As at 31sh December 2017
GSI Global Diversified Value Fund
(expressed in USD) Acquisition Fair % net Description Quantity Currency cost value assets
A) TRANSFERABLE SECURITIES ADMITTED TO AN OFFICIAL STOCK EXCHANGE LISTING (continued)
1) LISTED SECURITIES : SHARES (continued)
FRANCE Air Liquide SA 38 EUR 4,055 4,789 0.03 AXA SA 967 EUR 26,545 28,698 0.17 BNP Paribas SA 348 EUR 21,477 25,991 0.16 Bouygues SA 186 EUR 7,719 9,665 0.06 Capgemini SE 95 EUR 11,087 11,272 0.07 Carrefour SA 476 EUR 12,657 10,303 0.06 Christian Dior SE 26 EUR 9,103 9,500 0.06 Cie de Saint-Gobain 360 EUR 15,132 19,860 0.12 Cie Generale des Etablissements Michelin 78 EUR 8,528 11,188 0.07 CNP Assurances 426 EUR 7,898 9,842 0.06 Credit Agricole SA 504 EUR 6,738 8,345 0.05 Danone SA 78 EUR 6,204 6,546 0.04 Electricite de France SA 456 EUR 4,656 5,701 0.03 Engie SA 2,099 EUR 32,029 36,101 0.22 Hermes International 7 EUR 6,919 3,748 0.02 Iliad SA 26 EUR 6,301 6,231 0.04 Kering 32 EUR 14,440 15,089 0.09 L'Oreal SA 47 EUR 8,950 10,429 0.06 LVMH Moet Hennessy Louis Vuitton SE 65 EUR 11,695 19,138 0.12 Orange SA 2,615 EUR 42,464 45,415 0.27 Pernod Ricard SA 52 EUR 7,707 8,232 0.05 Peugeot SA 370 EUR 7,557 7,527 0.05 Renault SA 122 EUR 10,849 12,282 0.07 Safran SA 71 EUR 7,202 7,318 0.04 Sanofi 457 EUR 44,151 39,396 0.24 Schneider Electric SE 236 EUR 13,561 20,064 0.12 Societe Generale SA 318 EUR 14,976 16,425 0.10 TOTAL SA 1,383 EUR 68,846 76,404 0.46 Valeo SA 94 EUR 6,439 7,023 0.04 Veolia Environnement SA 517 EUR 11,921 13,197 0.08 Vinci SA 163 EUR 11,980 16,653 0.10 Vivendi SA 379 EUR 9,324 10,195 0.06
479,110 532,567 3.21
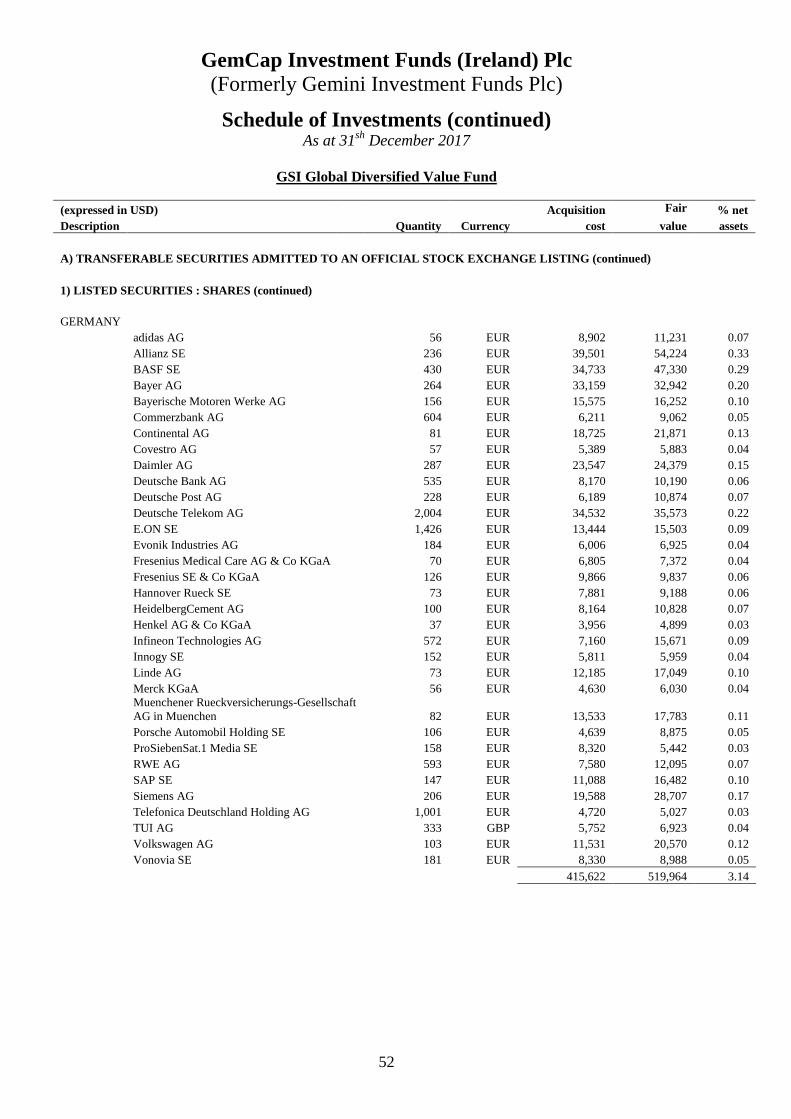
GemCap Investment Funds (Ireland) Plc (Formerly Gemini Investment Funds Plc)
52
Schedule of Investments (continued) As at 31sh December 2017
GSI Global Diversified Value Fund
(expressed in USD) Acquisition Fair % net Description Quantity Currency cost value assets
A) TRANSFERABLE SECURITIES ADMITTED TO AN OFFICIAL STOCK EXCHANGE LISTING (continued)
1) LISTED SECURITIES : SHARES (continued)
GERMANY adidas AG 56 EUR 8,902 11,231 0.07 Allianz SE 236 EUR 39,501 54,224 0.33 BASF SE 430 EUR 34,733 47,330 0.29 Bayer AG 264 EUR 33,159 32,942 0.20 Bayerische Motoren Werke AG 156 EUR 15,575 16,252 0.10 Commerzbank AG 604 EUR 6,211 9,062 0.05 Continental AG 81 EUR 18,725 21,871 0.13 Covestro AG 57 EUR 5,389 5,883 0.04 Daimler AG 287 EUR 23,547 24,379 0.15 Deutsche Bank AG 535 EUR 8,170 10,190 0.06 Deutsche Post AG 228 EUR 6,189 10,874 0.07 Deutsche Telekom AG 2,004 EUR 34,532 35,573 0.22 E.ON SE 1,426 EUR 13,444 15,503 0.09 Evonik Industries AG 184 EUR 6,006 6,925 0.04 Fresenius Medical Care AG & Co KGaA 70 EUR 6,805 7,372 0.04 Fresenius SE & Co KGaA 126 EUR 9,866 9,837 0.06 Hannover Rueck SE 73 EUR 7,881 9,188 0.06 HeidelbergCement AG 100 EUR 8,164 10,828 0.07 Henkel AG & Co KGaA 37 EUR 3,956 4,899 0.03 Infineon Technologies AG 572 EUR 7,160 15,671 0.09 Innogy SE 152 EUR 5,811 5,959 0.04 Linde AG 73 EUR 12,185 17,049 0.10 Merck KGaA 56 EUR 4,630 6,030 0.04 Muenchener Rueckversicherungs-Gesellschaft AG in Muenchen 82 EUR 13,533 17,783 0.11 Porsche Automobil Holding SE 106 EUR 4,639 8,875 0.05 ProSiebenSat.1 Media SE 158 EUR 8,320 5,442 0.03 RWE AG 593 EUR 7,580 12,095 0.07 SAP SE 147 EUR 11,088 16,482 0.10 Siemens AG 206 EUR 19,588 28,707 0.17 Telefonica Deutschland Holding AG 1,001 EUR 4,720 5,027 0.03 TUI AG 333 GBP 5,752 6,923 0.04 Volkswagen AG 103 EUR 11,531 20,570 0.12 Vonovia SE 181 EUR 8,330 8,988 0.05
415,622 519,964 3.14
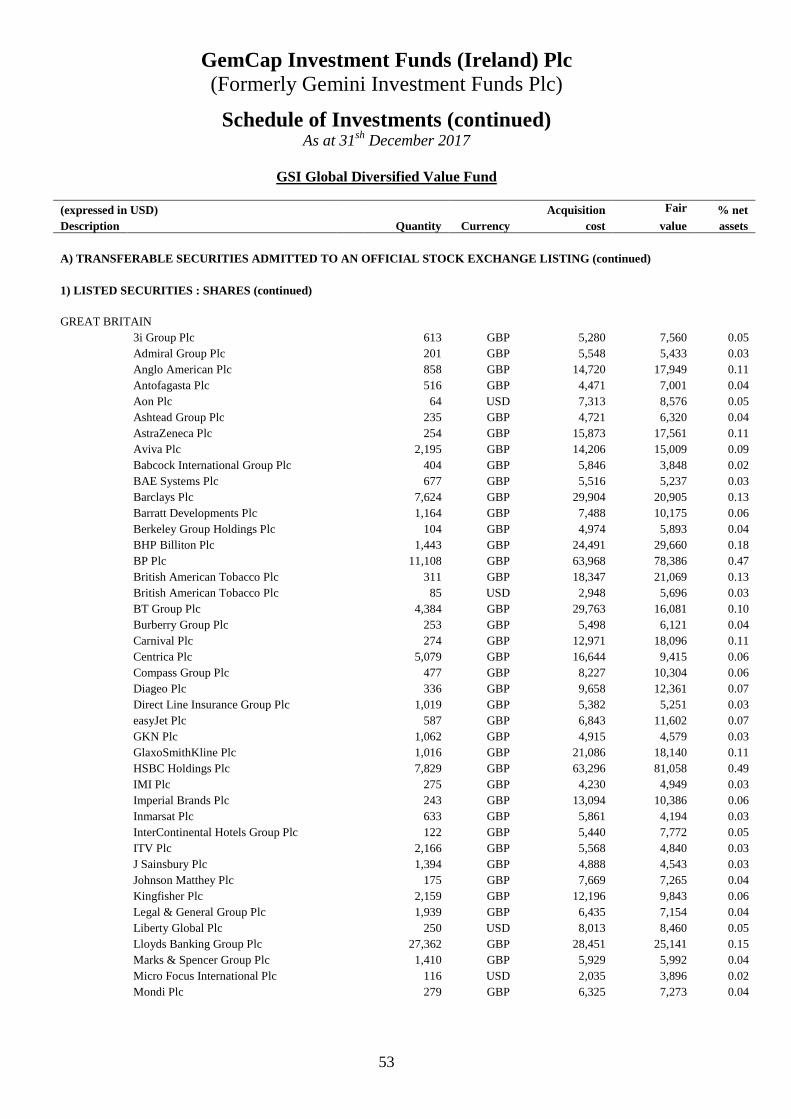
GemCap Investment Funds (Ireland) Plc (Formerly Gemini Investment Funds Plc)
53
Schedule of Investments (continued) As at 31sh December 2017
GSI Global Diversified Value Fund
(expressed in USD) Acquisition Fair % net Description Quantity Currency cost value assets
A) TRANSFERABLE SECURITIES ADMITTED TO AN OFFICIAL STOCK EXCHANGE LISTING (continued)
1) LISTED SECURITIES : SHARES (continued)
GREAT BRITAIN 3i Group Plc 613 GBP 5,280 7,560 0.05 Admiral Group Plc 201 GBP 5,548 5,433 0.03 Anglo American Plc 858 GBP 14,720 17,949 0.11 Antofagasta Plc 516 GBP 4,471 7,001 0.04 Aon Plc 64 USD 7,313 8,576 0.05 Ashtead Group Plc 235 GBP 4,721 6,320 0.04 AstraZeneca Plc 254 GBP 15,873 17,561 0.11 Aviva Plc 2,195 GBP 14,206 15,009 0.09 Babcock International Group Plc 404 GBP 5,846 3,848 0.02 BAE Systems Plc 677 GBP 5,516 5,237 0.03 Barclays Plc 7,624 GBP 29,904 20,905 0.13 Barratt Developments Plc 1,164 GBP 7,488 10,175 0.06 Berkeley Group Holdings Plc 104 GBP 4,974 5,893 0.04 BHP Billiton Plc 1,443 GBP 24,491 29,660 0.18 BP Plc 11,108 GBP 63,968 78,386 0.47 British American Tobacco Plc 311 GBP 18,347 21,069 0.13 British American Tobacco Plc 85 USD 2,948 5,696 0.03 BT Group Plc 4,384 GBP 29,763 16,081 0.10 Burberry Group Plc 253 GBP 5,498 6,121 0.04 Carnival Plc 274 GBP 12,971 18,096 0.11 Centrica Plc 5,079 GBP 16,644 9,415 0.06 Compass Group Plc 477 GBP 8,227 10,304 0.06 Diageo Plc 336 GBP 9,658 12,361 0.07 Direct Line Insurance Group Plc 1,019 GBP 5,382 5,251 0.03 easyJet Plc 587 GBP 6,843 11,602 0.07 GKN Plc 1,062 GBP 4,915 4,579 0.03 GlaxoSmithKline Plc 1,016 GBP 21,086 18,140 0.11 HSBC Holdings Plc 7,829 GBP 63,296 81,058 0.49 IMI Plc 275 GBP 4,230 4,949 0.03 Imperial Brands Plc 243 GBP 13,094 10,386 0.06 Inmarsat Plc 633 GBP 5,861 4,194 0.03 InterContinental Hotels Group Plc 122 GBP 5,440 7,772 0.05 ITV Plc 2,166 GBP 5,568 4,840 0.03 J Sainsbury Plc 1,394 GBP 4,888 4,543 0.03 Johnson Matthey Plc 175 GBP 7,669 7,265 0.04 Kingfisher Plc 2,159 GBP 12,196 9,843 0.06 Legal & General Group Plc 1,939 GBP 6,435 7,154 0.04 Liberty Global Plc 250 USD 8,013 8,460 0.05 Lloyds Banking Group Plc 27,362 GBP 28,451 25,141 0.15 Marks & Spencer Group Plc 1,410 GBP 5,929 5,992 0.04 Micro Focus International Plc 116 USD 2,035 3,896 0.02 Mondi Plc 279 GBP 6,325 7,273 0.04
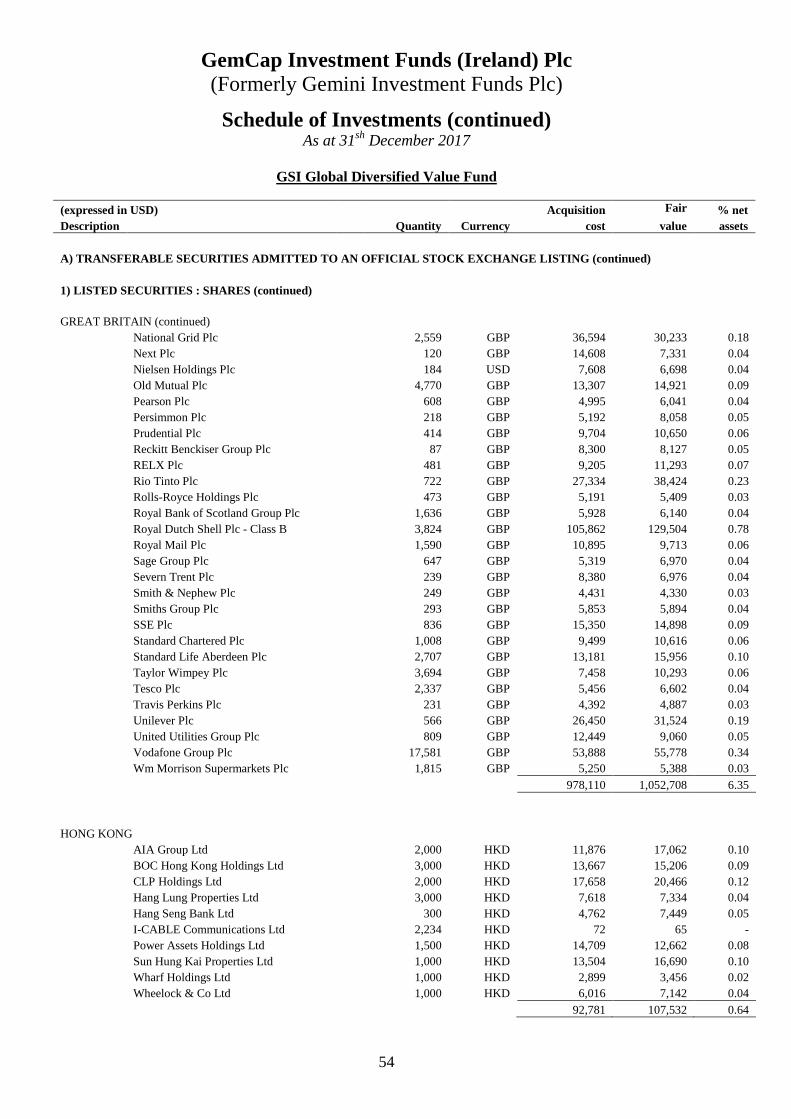
GemCap Investment Funds (Ireland) Plc (Formerly Gemini Investment Funds Plc)
54
Schedule of Investments (continued) As at 31sh December 2017
GSI Global Diversified Value Fund
(expressed in USD) Acquisition Fair % net Description Quantity Currency cost value assets
A) TRANSFERABLE SECURITIES ADMITTED TO AN OFFICIAL STOCK EXCHANGE LISTING (continued)
1) LISTED SECURITIES : SHARES (continued)
GREAT BRITAIN (continued) National Grid Plc 2,559 GBP 36,594 30,233 0.18 Next Plc 120 GBP 14,608 7,331 0.04 Nielsen Holdings Plc 184 USD 7,608 6,698 0.04 Old Mutual Plc 4,770 GBP 13,307 14,921 0.09 Pearson Plc 608 GBP 4,995 6,041 0.04 Persimmon Plc 218 GBP 5,192 8,058 0.05 Prudential Plc 414 GBP 9,704 10,650 0.06 Reckitt Benckiser Group Plc 87 GBP 8,300 8,127 0.05 RELX Plc 481 GBP 9,205 11,293 0.07 Rio Tinto Plc 722 GBP 27,334 38,424 0.23 Rolls-Royce Holdings Plc 473 GBP 5,191 5,409 0.03 Royal Bank of Scotland Group Plc 1,636 GBP 5,928 6,140 0.04 Royal Dutch Shell Plc - Class B 3,824 GBP 105,862 129,504 0.78 Royal Mail Plc 1,590 GBP 10,895 9,713 0.06 Sage Group Plc 647 GBP 5,319 6,970 0.04 Severn Trent Plc 239 GBP 8,380 6,976 0.04 Smith & Nephew Plc 249 GBP 4,431 4,330 0.03 Smiths Group Plc 293 GBP 5,853 5,894 0.04 SSE Plc 836 GBP 15,350 14,898 0.09 Standard Chartered Plc 1,008 GBP 9,499 10,616 0.06 Standard Life Aberdeen Plc 2,707 GBP 13,181 15,956 0.10 Taylor Wimpey Plc 3,694 GBP 7,458 10,293 0.06 Tesco Plc 2,337 GBP 5,456 6,602 0.04 Travis Perkins Plc 231 GBP 4,392 4,887 0.03 Unilever Plc 566 GBP 26,450 31,524 0.19 United Utilities Group Plc 809 GBP 12,449 9,060 0.05 Vodafone Group Plc 17,581 GBP 53,888 55,778 0.34 Wm Morrison Supermarkets Plc 1,815 GBP 5,250 5,388 0.03
978,110 1,052,708 6.35
HONG KONG AIA Group Ltd 2,000 HKD 11,876 17,062 0.10 BOC Hong Kong Holdings Ltd 3,000 HKD 13,667 15,206 0.09 CLP Holdings Ltd 2,000 HKD 17,658 20,466 0.12 Hang Lung Properties Ltd 3,000 HKD 7,618 7,334 0.04 Hang Seng Bank Ltd 300 HKD 4,762 7,449 0.05 I-CABLE Communications Ltd 2,234 HKD 72 65 - Power Assets Holdings Ltd 1,500 HKD 14,709 12,662 0.08 Sun Hung Kai Properties Ltd 1,000 HKD 13,504 16,690 0.10 Wharf Holdings Ltd 1,000 HKD 2,899 3,456 0.02 Wheelock & Co Ltd 1,000 HKD 6,016 7,142 0.04
92,781 107,532 0.64

GemCap Investment Funds (Ireland) Plc (Formerly Gemini Investment Funds Plc)
55
Schedule of Investments (continued) As at 31sh December 2017
GSI Global Diversified Value Fund
(expressed in USD) Acquisition Fair % net Description Quantity Currency cost value assets
A) TRANSFERABLE SECURITIES ADMITTED TO AN OFFICIAL STOCK EXCHANGE LISTING (continued)
1) LISTED SECURITIES : SHARES (continued)
IRELAND Accenture Plc 150 USD 15,522 22,964 0.14 Allergan Plc 111 USD 24,701 18,157 0.11 Bank of Ireland Group Plc 960 EUR 7,210 8,172 0.05 CRH Plc 442 EUR 15,658 15,885 0.10 Eaton Corp Plc 255 USD 16,254 20,148 0.12 Ingersoll-Rand Plc 114 USD 9,664 10,168 0.06 James Hardie Industries Plc 487 AUD 7,770 8,595 0.05 Mallinckrodt Plc 182 USD 8,314 4,106 0.02 Medtronic Plc 454 USD 35,066 36,661 0.22 Paddy Power Betfair Plc 42 GBP 4,935 5,004 0.03 Ryanair Holdings Plc 357 EUR 6,957 6,446 0.04 Seagate Technology Plc 231 USD 8,478 9,665 0.06
160,529 165,971 1.00
ISRAEL Bank Hapoalim BM 1,426 ILS 9,487 10,486 0.06 Bank Leumi Le-Israel BM 1,823 ILS 9,648 10,985 0.07 Bezeq The Israeli Telecommunication Corp Ltd 6,391 ILS 9,682 9,660 0.06 Check Point Software Technologies Ltd 46 USD 3,491 4,767 0.03 Taro Pharmaceutical Industries Ltd 63 USD 6,653 6,597 0.04 Teva Pharmaceutical Industries Ltd 821 ILS 9,675 15,488 0.09
48,636 57,983 0.35
ITALY A2A SpA 4,268 EUR 7,196 7,896 0.05 Assicurazioni Generali SpA 670 EUR 10,023 12,219 0.07 Atlantia SpA 171 EUR 5,424 5,400 0.03 Enel SpA 4,989 EUR 23,276 30,707 0.19 Eni SpA 2,211 EUR 36,634 36,608 0.22 Intesa Sanpaolo SpA 6,694 EUR 24,793 22,247 0.13 Luxottica Group SpA 75 EUR 4,222 4,603 0.03 Mediaset SpA 1,041 EUR 5,293 4,034 0.02 Mediobanca Banca di Credito Finanziario SpA 689 EUR 4,879 7,820 0.05 Poste Italiane SpA 585 EUR 4,159 4,404 0.03 Prysmian SpA 209 EUR 5,513 6,818 0.04 Recordati SpA 86 EUR 3,880 3,824 0.02 Snam SpA 1,776 EUR 8,258 8,694 0.05
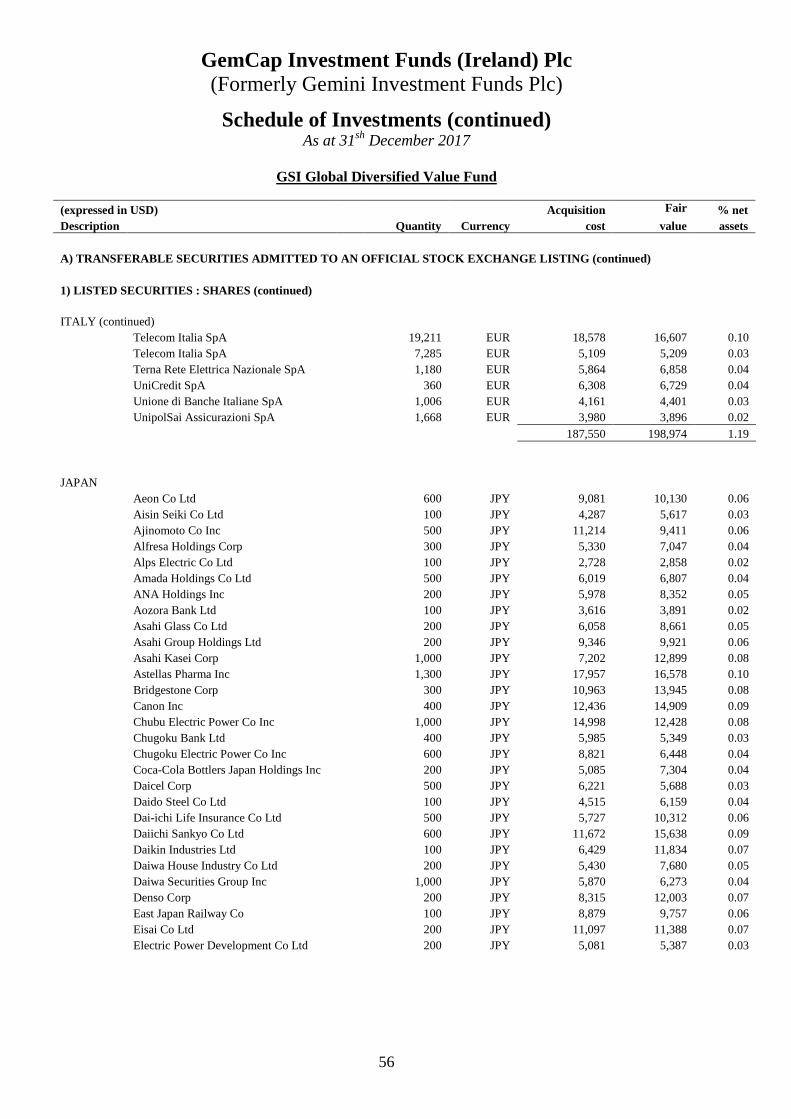
GemCap Investment Funds (Ireland) Plc (Formerly Gemini Investment Funds Plc)
56
Schedule of Investments (continued) As at 31sh December 2017
GSI Global Diversified Value Fund
(expressed in USD) Acquisition Fair % net Description Quantity Currency cost value assets
A) TRANSFERABLE SECURITIES ADMITTED TO AN OFFICIAL STOCK EXCHANGE LISTING (continued)
1) LISTED SECURITIES : SHARES (continued)
ITALY (continued) Telecom Italia SpA 19,211 EUR 18,578 16,607 0.10 Telecom Italia SpA 7,285 EUR 5,109 5,209 0.03
Terna Rete Elettrica Nazionale SpA 1,180 EUR 5,864 6,858 0.04 UniCredit SpA 360 EUR 6,308 6,729 0.04 Unione di Banche Italiane SpA 1,006 EUR 4,161 4,401 0.03 UnipolSai Assicurazioni SpA 1,668 EUR 3,980 3,896 0.02
187,550 198,974 1.19
JAPAN Aeon Co Ltd 600 JPY 9,081 10,130 0.06 Aisin Seiki Co Ltd 100 JPY 4,287 5,617 0.03 Ajinomoto Co Inc 500 JPY 11,214 9,411 0.06 Alfresa Holdings Corp 300 JPY 5,330 7,047 0.04 Alps Electric Co Ltd 100 JPY 2,728 2,858 0.02 Amada Holdings Co Ltd 500 JPY 6,019 6,807 0.04 ANA Holdings Inc 200 JPY 5,978 8,352 0.05 Aozora Bank Ltd 100 JPY 3,616 3,891 0.02 Asahi Glass Co Ltd 200 JPY 6,058 8,661 0.05 Asahi Group Holdings Ltd 200 JPY 9,346 9,921 0.06 Asahi Kasei Corp 1,000 JPY 7,202 12,899 0.08 Astellas Pharma Inc 1,300 JPY 17,957 16,578 0.10 Bridgestone Corp 300 JPY 10,963 13,945 0.08 Canon Inc 400 JPY 12,436 14,909 0.09 Chubu Electric Power Co Inc 1,000 JPY 14,998 12,428 0.08 Chugoku Bank Ltd 400 JPY 5,985 5,349 0.03 Chugoku Electric Power Co Inc 600 JPY 8,821 6,448 0.04 Coca-Cola Bottlers Japan Holdings Inc 200 JPY 5,085 7,304 0.04 Daicel Corp 500 JPY 6,221 5,688 0.03 Daido Steel Co Ltd 100 JPY 4,515 6,159 0.04 Dai-ichi Life Insurance Co Ltd 500 JPY 5,727 10,312 0.06 Daiichi Sankyo Co Ltd 600 JPY 11,672 15,638 0.09 Daikin Industries Ltd 100 JPY 6,429 11,834 0.07 Daiwa House Industry Co Ltd 200 JPY 5,430 7,680 0.05 Daiwa Securities Group Inc 1,000 JPY 5,870 6,273 0.04 Denso Corp 200 JPY 8,315 12,003 0.07 East Japan Railway Co 100 JPY 8,879 9,757 0.06 Eisai Co Ltd 200 JPY 11,097 11,388 0.07 Electric Power Development Co Ltd 200 JPY 5,081 5,387 0.03
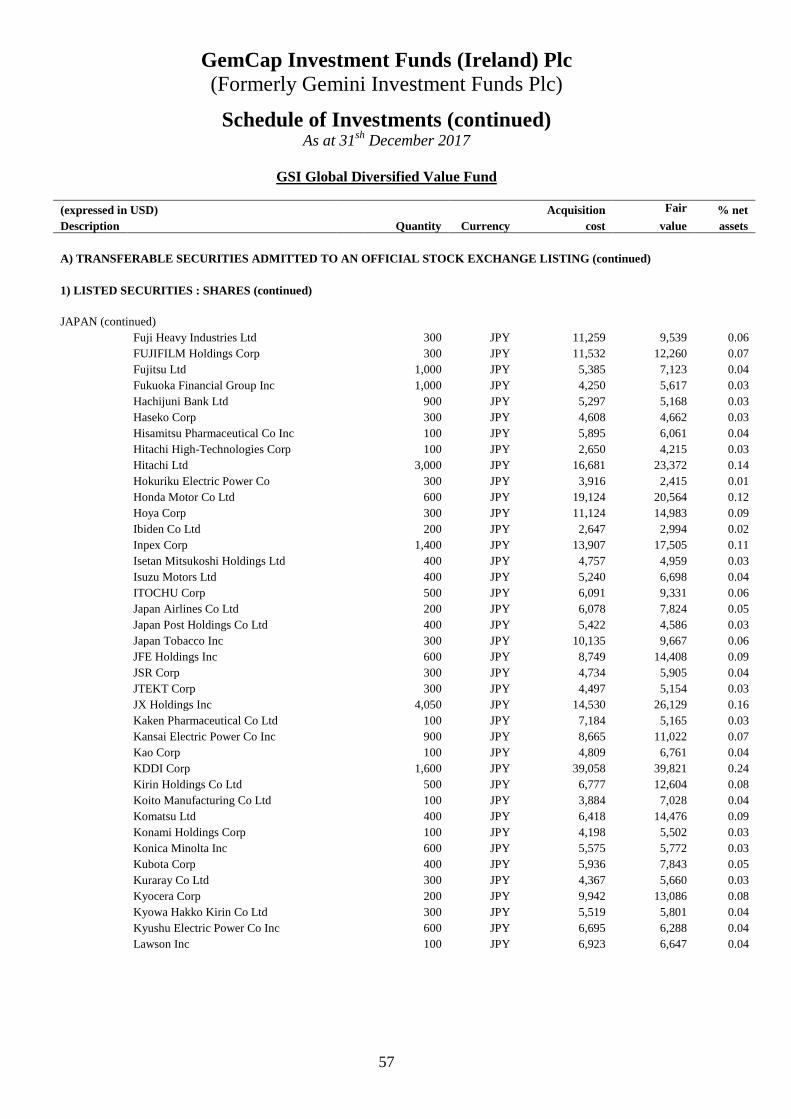
GemCap Investment Funds (Ireland) Plc (Formerly Gemini Investment Funds Plc)
57
Schedule of Investments (continued) As at 31sh December 2017
GSI Global Diversified Value Fund
(expressed in USD) Acquisition Fair % net Description Quantity Currency cost value assets
A) TRANSFERABLE SECURITIES ADMITTED TO AN OFFICIAL STOCK EXCHANGE LISTING (continued)
1) LISTED SECURITIES : SHARES (continued)
JAPAN (continued) Fuji Heavy Industries Ltd 300 JPY 11,259 9,539 0.06 FUJIFILM Holdings Corp 300 JPY 11,532 12,260 0.07 Fujitsu Ltd 1,000 JPY 5,385 7,123 0.04 Fukuoka Financial Group Inc 1,000 JPY 4,250 5,617 0.03 Hachijuni Bank Ltd 900 JPY 5,297 5,168 0.03 Haseko Corp 300 JPY 4,608 4,662 0.03 Hisamitsu Pharmaceutical Co Inc 100 JPY 5,895 6,061 0.04 Hitachi High-Technologies Corp 100 JPY 2,650 4,215 0.03 Hitachi Ltd 3,000 JPY 16,681 23,372 0.14 Hokuriku Electric Power Co 300 JPY 3,916 2,415 0.01 Honda Motor Co Ltd 600 JPY 19,124 20,564 0.12 Hoya Corp 300 JPY 11,124 14,983 0.09 Ibiden Co Ltd 200 JPY 2,647 2,994 0.02 Inpex Corp 1,400 JPY 13,907 17,505 0.11 Isetan Mitsukoshi Holdings Ltd 400 JPY 4,757 4,959 0.03 Isuzu Motors Ltd 400 JPY 5,240 6,698 0.04 ITOCHU Corp 500 JPY 6,091 9,331 0.06 Japan Airlines Co Ltd 200 JPY 6,078 7,824 0.05 Japan Post Holdings Co Ltd 400 JPY 5,422 4,586 0.03 Japan Tobacco Inc 300 JPY 10,135 9,667 0.06 JFE Holdings Inc 600 JPY 8,749 14,408 0.09 JSR Corp 300 JPY 4,734 5,905 0.04 JTEKT Corp 300 JPY 4,497 5,154 0.03 JX Holdings Inc 4,050 JPY 14,530 26,129 0.16 Kaken Pharmaceutical Co Ltd 100 JPY 7,184 5,165 0.03 Kansai Electric Power Co Inc 900 JPY 8,665 11,022 0.07 Kao Corp 100 JPY 4,809 6,761 0.04 KDDI Corp 1,600 JPY 39,058 39,821 0.24 Kirin Holdings Co Ltd 500 JPY 6,777 12,604 0.08 Koito Manufacturing Co Ltd 100 JPY 3,884 7,028 0.04 Komatsu Ltd 400 JPY 6,418 14,476 0.09 Konami Holdings Corp 100 JPY 4,198 5,502 0.03 Konica Minolta Inc 600 JPY 5,575 5,772 0.03 Kubota Corp 400 JPY 5,936 7,843 0.05 Kuraray Co Ltd 300 JPY 4,367 5,660 0.03 Kyocera Corp 200 JPY 9,942 13,086 0.08 Kyowa Hakko Kirin Co Ltd 300 JPY 5,519 5,801 0.04 Kyushu Electric Power Co Inc 600 JPY 6,695 6,288 0.04 Lawson Inc 100 JPY 6,923 6,647 0.04
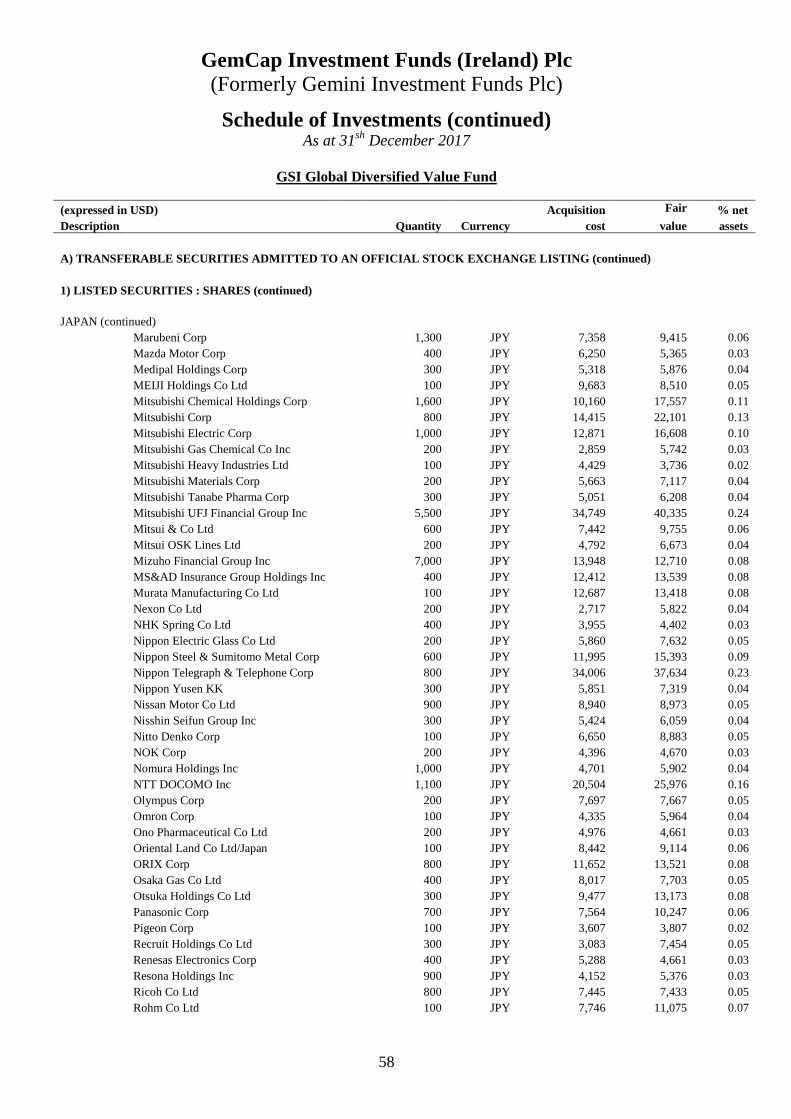
GemCap Investment Funds (Ireland) Plc (Formerly Gemini Investment Funds Plc)
58
Schedule of Investments (continued) As at 31sh December 2017
GSI Global Diversified Value Fund
(expressed in USD) Acquisition Fair % net Description Quantity Currency cost value assets
A) TRANSFERABLE SECURITIES ADMITTED TO AN OFFICIAL STOCK EXCHANGE LISTING (continued)
1) LISTED SECURITIES : SHARES (continued)
JAPAN (continued) Marubeni Corp 1,300 JPY 7,358 9,415 0.06 Mazda Motor Corp 400 JPY 6,250 5,365 0.03 Medipal Holdings Corp 300 JPY 5,318 5,876 0.04 MEIJI Holdings Co Ltd 100 JPY 9,683 8,510 0.05 Mitsubishi Chemical Holdings Corp 1,600 JPY 10,160 17,557 0.11 Mitsubishi Corp 800 JPY 14,415 22,101 0.13 Mitsubishi Electric Corp 1,000 JPY 12,871 16,608 0.10 Mitsubishi Gas Chemical Co Inc 200 JPY 2,859 5,742 0.03 Mitsubishi Heavy Industries Ltd 100 JPY 4,429 3,736 0.02 Mitsubishi Materials Corp 200 JPY 5,663 7,117 0.04 Mitsubishi Tanabe Pharma Corp 300 JPY 5,051 6,208 0.04 Mitsubishi UFJ Financial Group Inc 5,500 JPY 34,749 40,335 0.24 Mitsui & Co Ltd 600 JPY 7,442 9,755 0.06 Mitsui OSK Lines Ltd 200 JPY 4,792 6,673 0.04 Mizuho Financial Group Inc 7,000 JPY 13,948 12,710 0.08 MS&AD Insurance Group Holdings Inc 400 JPY 12,412 13,539 0.08 Murata Manufacturing Co Ltd 100 JPY 12,687 13,418 0.08 Nexon Co Ltd 200 JPY 2,717 5,822 0.04 NHK Spring Co Ltd 400 JPY 3,955 4,402 0.03 Nippon Electric Glass Co Ltd 200 JPY 5,860 7,632 0.05 Nippon Steel & Sumitomo Metal Corp 600 JPY 11,995 15,393 0.09 Nippon Telegraph & Telephone Corp 800 JPY 34,006 37,634 0.23 Nippon Yusen KK 300 JPY 5,851 7,319 0.04 Nissan Motor Co Ltd 900 JPY 8,940 8,973 0.05 Nisshin Seifun Group Inc 300 JPY 5,424 6,059 0.04 Nitto Denko Corp 100 JPY 6,650 8,883 0.05 NOK Corp 200 JPY 4,396 4,670 0.03 Nomura Holdings Inc 1,000 JPY 4,701 5,902 0.04 NTT DOCOMO Inc 1,100 JPY 20,504 25,976 0.16 Olympus Corp 200 JPY 7,697 7,667 0.05 Omron Corp 100 JPY 4,335 5,964 0.04 Ono Pharmaceutical Co Ltd 200 JPY 4,976 4,661 0.03 Oriental Land Co Ltd/Japan 100 JPY 8,442 9,114 0.06 ORIX Corp 800 JPY 11,652 13,521 0.08 Osaka Gas Co Ltd 400 JPY 8,017 7,703 0.05 Otsuka Holdings Co Ltd 300 JPY 9,477 13,173 0.08 Panasonic Corp 700 JPY 7,564 10,247 0.06 Pigeon Corp 100 JPY 3,607 3,807 0.02 Recruit Holdings Co Ltd 300 JPY 3,083 7,454 0.05 Renesas Electronics Corp 400 JPY 5,288 4,661 0.03 Resona Holdings Inc 900 JPY 4,152 5,376 0.03 Ricoh Co Ltd 800 JPY 7,445 7,433 0.05 Rohm Co Ltd 100 JPY 7,746 11,075 0.07

GemCap Investment Funds (Ireland) Plc (Formerly Gemini Investment Funds Plc)
59
Schedule of Investments (continued) As at 31sh December 2017
GSI Global Diversified Value Fund
(expressed in USD) Acquisition Fair % net Description Quantity Currency cost value assets
A) TRANSFERABLE SECURITIES ADMITTED TO AN OFFICIAL STOCK EXCHANGE LISTING (continued)
1) LISTED SECURITIES : SHARES (continued)
JAPAN (continued) SBI Holdings Inc/Japan 400 JPY 5,693 8,363 0.05 Secom Co Ltd 100 JPY 6,369 7,549 0.05 Seiko Epson Corp 200 JPY 4,699 4,719 0.03 Sekisui Chemical Co Ltd 400 JPY 6,250 8,029 0.05 Sekisui House Ltd 600 JPY 9,421 10,838 0.07 Seven & i Holdings Co Ltd 400 JPY 18,083 16,623 0.10 Shikoku Electric Power Co Inc 300 JPY 3,241 3,269 0.02 Shin-Etsu Chemical Co Ltd 100 JPY 5,569 10,161 0.06 Shionogi & Co Ltd 100 JPY 4,654 5,411 0.03 Shiseido Co Ltd 200 JPY 8,959 9,666 0.06 SoftBank Group Corp 400 JPY 21,451 31,664 0.19 Sojitz Corp 2,000 JPY 5,197 6,141 0.04 Sompo Japan Nipponkoa Holdings Inc 300 JPY 8,127 11,618 0.07 Sony Corp 300 JPY 10,016 13,532 0.08 Sony Financial Holdings Inc 300 JPY 4,935 5,314 0.03 SUMCO Corp 200 JPY 4,974 5,126 0.03 Sumitomo Chemical Co Ltd 1,000 JPY 5,127 7,188 0.04 Sumitomo Corp 700 JPY 7,453 11,896 0.07 Sumitomo Electric Industries Ltd 400 JPY 5,403 6,762 0.04 Sumitomo Heavy Industries Ltd 200 JPY 6,763 8,466 0.05 Sumitomo Metal Mining Co Ltd 200 JPY 8,185 9,190 0.06 Sumitomo Mitsui Financial Group Inc 500 JPY 19,646 21,600 0.13 Sumitomo Mitsui Trust Holdings Inc 200 JPY 7,629 7,939 0.05 Sumitomo Rubber Industries Ltd 300 JPY 5,135 5,580 0.03 Suzuken Co Ltd 200 JPY 6,569 8,226 0.05 Suzuki Motor Corp 300 JPY 10,288 17,395 0.11 T&D Holdings Inc 300 JPY 3,776 5,130 0.03 Taiheiyo Cement Corp 200 JPY 8,393 8,635 0.05 Taisei Corp 100 JPY 5,364 4,978 0.03 Taisho Pharmaceutical Holdings Co Ltd 100 JPY 8,446 7,987 0.05 Takeda Pharmaceutical Co Ltd 200 JPY 9,494 11,361 0.07 TDK Corp 100 JPY 7,059 7,978 0.05 Terumo Corp 100 JPY 4,263 4,739 0.03 Toho Gas Co Ltd 200 JPY 9,475 5,484 0.03 Tohoku Electric Power Co Inc 700 JPY 10,029 8,952 0.05 Tokio Marine Holdings Inc 200 JPY 7,528 9,125 0.06 Tokyo Electric Power Co Holdings Inc 1,600 JPY 11,107 6,333 0.04 Tokyo Electron Ltd 100 JPY 8,362 18,104 0.11 Tokyo Gas Co Ltd 600 JPY 12,585 13,729 0.08 Toppan Printing Co Ltd 1,000 JPY 8,519 9,043 0.05 Toray Industries Inc 1,000 JPY 9,751 9,429 0.06
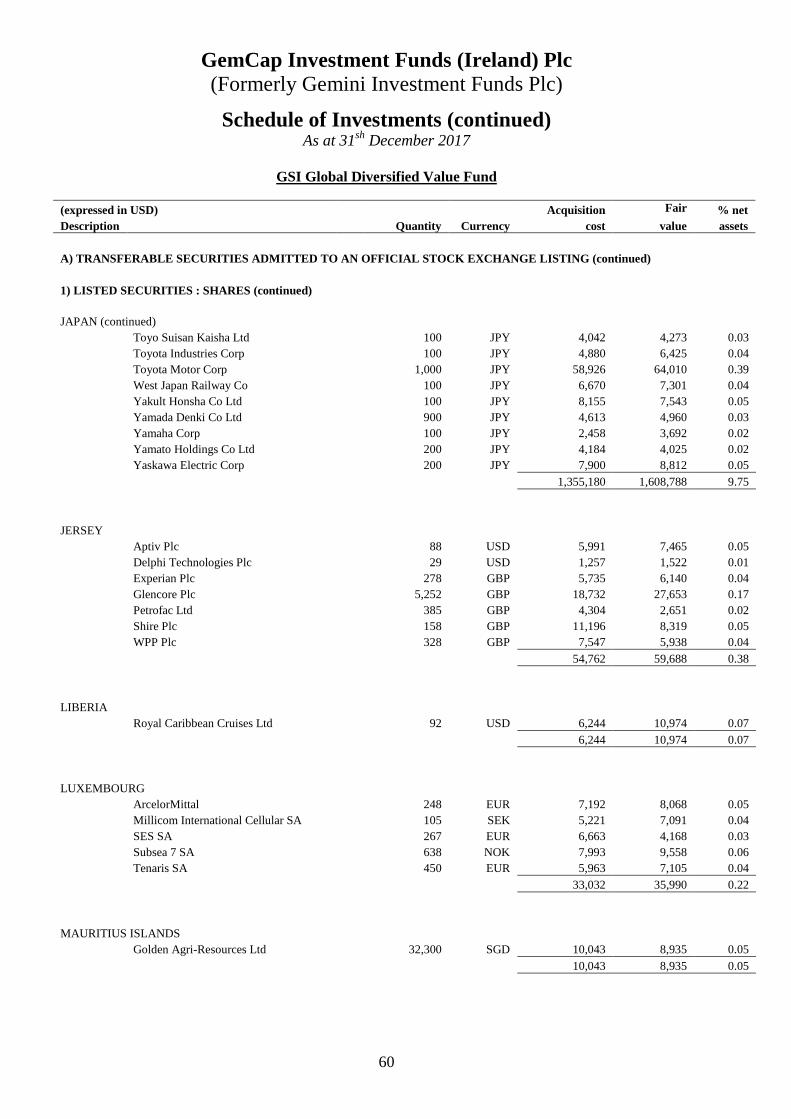
GemCap Investment Funds (Ireland) Plc (Formerly Gemini Investment Funds Plc)
60
Schedule of Investments (continued) As at 31sh December 2017
GSI Global Diversified Value Fund
(expressed in USD) Acquisition Fair % net Description Quantity Currency cost value assets
A) TRANSFERABLE SECURITIES ADMITTED TO AN OFFICIAL STOCK EXCHANGE LISTING (continued)
1) LISTED SECURITIES : SHARES (continued)
JAPAN (continued) Toyo Suisan Kaisha Ltd 100 JPY 4,042 4,273 0.03 Toyota Industries Corp 100 JPY 4,880 6,425 0.04 Toyota Motor Corp 1,000 JPY 58,926 64,010 0.39 West Japan Railway Co 100 JPY 6,670 7,301 0.04 Yakult Honsha Co Ltd 100 JPY 8,155 7,543 0.05 Yamada Denki Co Ltd 900 JPY 4,613 4,960 0.03 Yamaha Corp 100 JPY 2,458 3,692 0.02 Yamato Holdings Co Ltd 200 JPY 4,184 4,025 0.02 Yaskawa Electric Corp 200 JPY 7,900 8,812 0.05
1,355,180 1,608,788 9.75
JERSEY Aptiv Plc 88 USD 5,991 7,465 0.05 Delphi Technologies Plc 29 USD 1,257 1,522 0.01 Experian Plc 278 GBP 5,735 6,140 0.04 Glencore Plc 5,252 GBP 18,732 27,653 0.17 Petrofac Ltd 385 GBP 4,304 2,651 0.02 Shire Plc 158 GBP 11,196 8,319 0.05 WPP Plc 328 GBP 7,547 5,938 0.04
54,762 59,688 0.38
LIBERIA Royal Caribbean Cruises Ltd 92 USD 6,244 10,974 0.07
6,244 10,974 0.07
LUXEMBOURG ArcelorMittal 248 EUR 7,192 8,068 0.05 Millicom International Cellular SA 105 SEK 5,221 7,091 0.04 SES SA 267 EUR 6,663 4,168 0.03 Subsea 7 SA 638 NOK 7,993 9,558 0.06 Tenaris SA 450 EUR 5,963 7,105 0.04
33,032 35,990 0.22
MAURITIUS ISLANDS Golden Agri-Resources Ltd 32,300 SGD 10,043 8,935 0.05
10,043 8,935 0.05

GemCap Investment Funds (Ireland) Plc (Formerly Gemini Investment Funds Plc)
61
Schedule of Investments (continued) As at 31sh December 2017
GSI Global Diversified Value Fund
(expressed in USD) Acquisition Fair % net Description Quantity Currency cost value assets
A) TRANSFERABLE SECURITIES ADMITTED TO AN OFFICIAL STOCK EXCHANGE LISTING (continued)
1) LISTED SECURITIES : SHARES (continued)
NETHERLANDS ABN AMRO Group NV 147 EUR 4,034 4,744 0.03 Aegon NV 927 EUR 3,646 5,911 0.04 AerCap Holdings NV 237 USD 10,715 12,469 0.08 Airbus SE 85 EUR 5,306 8,465 0.05 Akzo Nobel NV 79 EUR 5,358 6,921 0.04 ASML Holding NV 127 EUR 12,826 22,117 0.13 CNH Industrial NV 586 USD 5,661 7,852 0.05 EXOR NV 84 EUR 4,909 5,150 0.03 Ferrari NV 48 USD 5,302 5,032 0.03 Fiat Chrysler Automobiles NV 933 USD 7,725 16,645 0.10 Gemalto NV 68 EUR 3,688 4,039 0.02 Heineken Holding NV 74 EUR 5,596 7,324 0.04 Heineken NV 76 EUR 6,804 7,927 0.05 ING Groep NV 1,316 EUR 19,204 24,197 0.15 Koninklijke Ahold Delhaize NV 20 EUR 380 440 - Koninklijke DSM NV 76 EUR 5,091 7,265 0.04 Koninklijke KPN NV 5,356 EUR 17,621 18,687 0.11 Koninklijke Philips NV 287 EUR 7,328 10,861 0.07 Koninklijke Vopak NV 138 EUR 5,917 6,055 0.04 LyondellBasell Industries NV 393 USD 36,687 43,356 0.26 NN Group NV 258 EUR 9,227 11,181 0.07 QIAGEN NV 150 USD 4,617 4,640 0.03 Randstad Holding NV 91 EUR 5,357 5,594 0.03 RELX NV 713 EUR 12,174 16,395 0.10 STMicroelectronics NV 1,087 EUR 11,283 23,743 0.14 Unilever NV 435 EUR 19,754 24,506 0.15 Wolters Kluwer NV 94 EUR 4,637 4,904 0.03
240,847 316,420 1.91
NEW ZEALAND Contact Energy Ltd 2,303 NZD 8,608 9,075 0.05 Spark New Zealand Ltd 4,543 NZD 12,166 11,687 0.07
20,774 20,762 0.12
NORWAY DNB ASA 392 NOK 7,901 7,262 0.04 Norsk Hydro ASA 1,550 NOK 6,671 11,771 0.07 Statoil ASA 940 NOK 16,078 20,059 0.12 Telenor ASA 827 NOK 15,401 17,718 0.11 TGS NOPEC Geophysical Co ASA 245 NOK 5,248 5,795 0.04 Yara International ASA 222 NOK 9,216 10,186 0.06
60,515 72,791 0.44
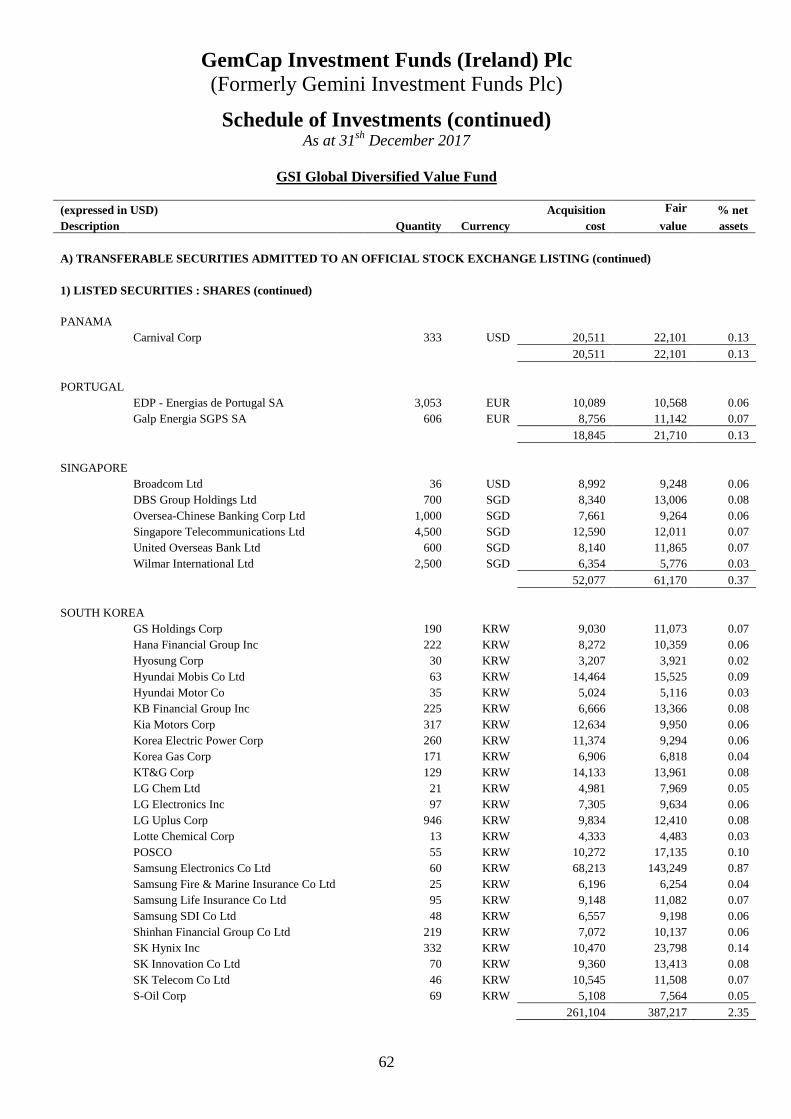
GemCap Investment Funds (Ireland) Plc (Formerly Gemini Investment Funds Plc)
62
Schedule of Investments (continued) As at 31sh December 2017
GSI Global Diversified Value Fund
(expressed in USD) Acquisition Fair % net Description Quantity Currency cost value assets
A) TRANSFERABLE SECURITIES ADMITTED TO AN OFFICIAL STOCK EXCHANGE LISTING (continued)
1) LISTED SECURITIES : SHARES (continued)
PANAMA Carnival Corp 333 USD 20,511 22,101 0.13
20,511 22,101 0.13
PORTUGAL EDP - Energias de Portugal SA 3,053 EUR 10,089 10,568 0.06 Galp Energia SGPS SA 606 EUR 8,756 11,142 0.07
18,845 21,710 0.13
SINGAPORE Broadcom Ltd 36 USD 8,992 9,248 0.06 DBS Group Holdings Ltd 700 SGD 8,340 13,006 0.08 Oversea-Chinese Banking Corp Ltd 1,000 SGD 7,661 9,264 0.06 Singapore Telecommunications Ltd 4,500 SGD 12,590 12,011 0.07 United Overseas Bank Ltd 600 SGD 8,140 11,865 0.07 Wilmar International Ltd 2,500 SGD 6,354 5,776 0.03
52,077 61,170 0.37
SOUTH KOREA GS Holdings Corp 190 KRW 9,030 11,073 0.07 Hana Financial Group Inc 222 KRW 8,272 10,359 0.06 Hyosung Corp 30 KRW 3,207 3,921 0.02 Hyundai Mobis Co Ltd 63 KRW 14,464 15,525 0.09 Hyundai Motor Co 35 KRW 5,024 5,116 0.03 KB Financial Group Inc 225 KRW 6,666 13,366 0.08 Kia Motors Corp 317 KRW 12,634 9,950 0.06 Korea Electric Power Corp 260 KRW 11,374 9,294 0.06 Korea Gas Corp 171 KRW 6,906 6,818 0.04 KT&G Corp 129 KRW 14,133 13,961 0.08 LG Chem Ltd 21 KRW 4,981 7,969 0.05 LG Electronics Inc 97 KRW 7,305 9,634 0.06 LG Uplus Corp 946 KRW 9,834 12,410 0.08 Lotte Chemical Corp 13 KRW 4,333 4,483 0.03 POSCO 55 KRW 10,272 17,135 0.10 Samsung Electronics Co Ltd 60 KRW 68,213 143,249 0.87 Samsung Fire & Marine Insurance Co Ltd 25 KRW 6,196 6,254 0.04 Samsung Life Insurance Co Ltd 95 KRW 9,148 11,082 0.07 Samsung SDI Co Ltd 48 KRW 6,557 9,198 0.06 Shinhan Financial Group Co Ltd 219 KRW 7,072 10,137 0.06 SK Hynix Inc 332 KRW 10,470 23,798 0.14 SK Innovation Co Ltd 70 KRW 9,360 13,413 0.08 SK Telecom Co Ltd 46 KRW 10,545 11,508 0.07 S-Oil Corp 69 KRW 5,108 7,564 0.05
261,104 387,217 2.35
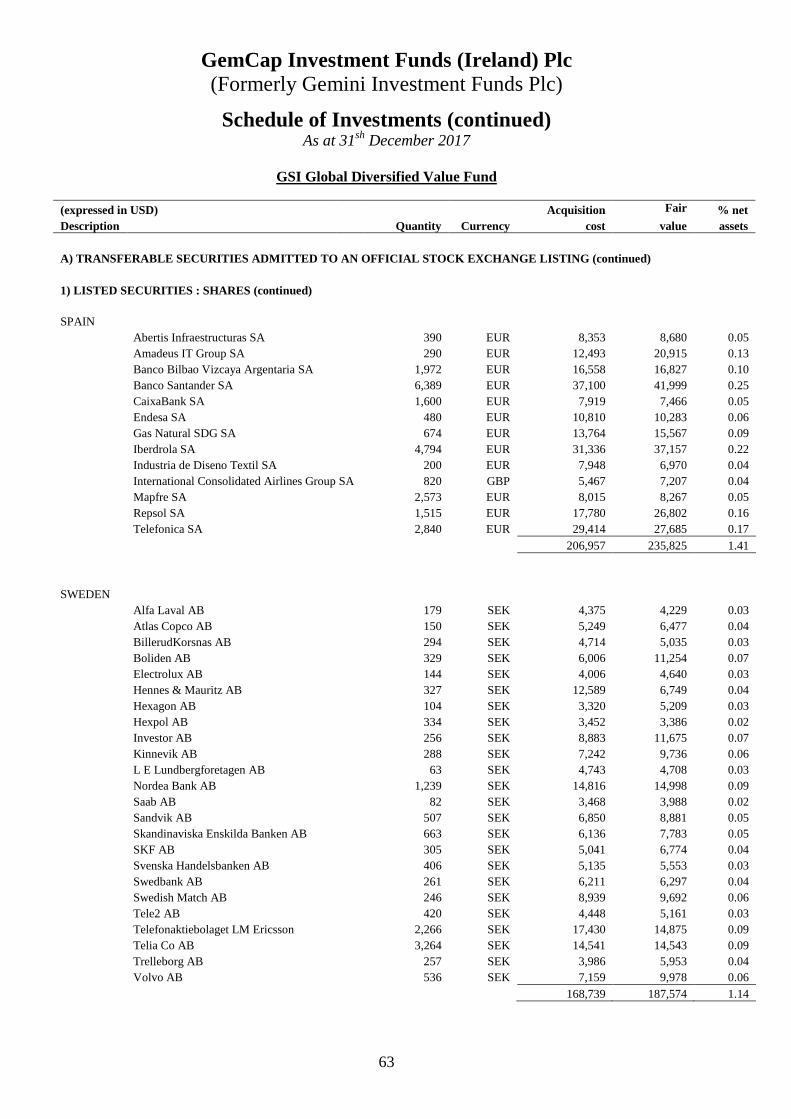
GemCap Investment Funds (Ireland) Plc (Formerly Gemini Investment Funds Plc)
63
Schedule of Investments (continued) As at 31sh December 2017
GSI Global Diversified Value Fund
(expressed in USD) Acquisition Fair % net Description Quantity Currency cost value assets
A) TRANSFERABLE SECURITIES ADMITTED TO AN OFFICIAL STOCK EXCHANGE LISTING (continued)
1) LISTED SECURITIES : SHARES (continued)
SPAIN Abertis Infraestructuras SA 390 EUR 8,353 8,680 0.05 Amadeus IT Group SA 290 EUR 12,493 20,915 0.13 Banco Bilbao Vizcaya Argentaria SA 1,972 EUR 16,558 16,827 0.10 Banco Santander SA 6,389 EUR 37,100 41,999 0.25 CaixaBank SA 1,600 EUR 7,919 7,466 0.05 Endesa SA 480 EUR 10,810 10,283 0.06 Gas Natural SDG SA 674 EUR 13,764 15,567 0.09 Iberdrola SA 4,794 EUR 31,336 37,157 0.22 Industria de Diseno Textil SA 200 EUR 7,948 6,970 0.04 International Consolidated Airlines Group SA 820 GBP 5,467 7,207 0.04 Mapfre SA 2,573 EUR 8,015 8,267 0.05 Repsol SA 1,515 EUR 17,780 26,802 0.16 Telefonica SA 2,840 EUR 29,414 27,685 0.17
206,957 235,825 1.41
SWEDEN Alfa Laval AB 179 SEK 4,375 4,229 0.03 Atlas Copco AB 150 SEK 5,249 6,477 0.04 BillerudKorsnas AB 294 SEK 4,714 5,035 0.03 Boliden AB 329 SEK 6,006 11,254 0.07 Electrolux AB 144 SEK 4,006 4,640 0.03 Hennes & Mauritz AB 327 SEK 12,589 6,749 0.04 Hexagon AB 104 SEK 3,320 5,209 0.03 Hexpol AB 334 SEK 3,452 3,386 0.02 Investor AB 256 SEK 8,883 11,675 0.07 Kinnevik AB 288 SEK 7,242 9,736 0.06 L E Lundbergforetagen AB 63 SEK 4,743 4,708 0.03 Nordea Bank AB 1,239 SEK 14,816 14,998 0.09 Saab AB 82 SEK 3,468 3,988 0.02 Sandvik AB 507 SEK 6,850 8,881 0.05 Skandinaviska Enskilda Banken AB 663 SEK 6,136 7,783 0.05 SKF AB 305 SEK 5,041 6,774 0.04 Svenska Handelsbanken AB 406 SEK 5,135 5,553 0.03 Swedbank AB 261 SEK 6,211 6,297 0.04 Swedish Match AB 246 SEK 8,939 9,692 0.06 Tele2 AB 420 SEK 4,448 5,161 0.03 Telefonaktiebolaget LM Ericsson 2,266 SEK 17,430 14,875 0.09 Telia Co AB 3,264 SEK 14,541 14,543 0.09 Trelleborg AB 257 SEK 3,986 5,953 0.04 Volvo AB 536 SEK 7,159 9,978 0.06
168,739 187,574 1.14
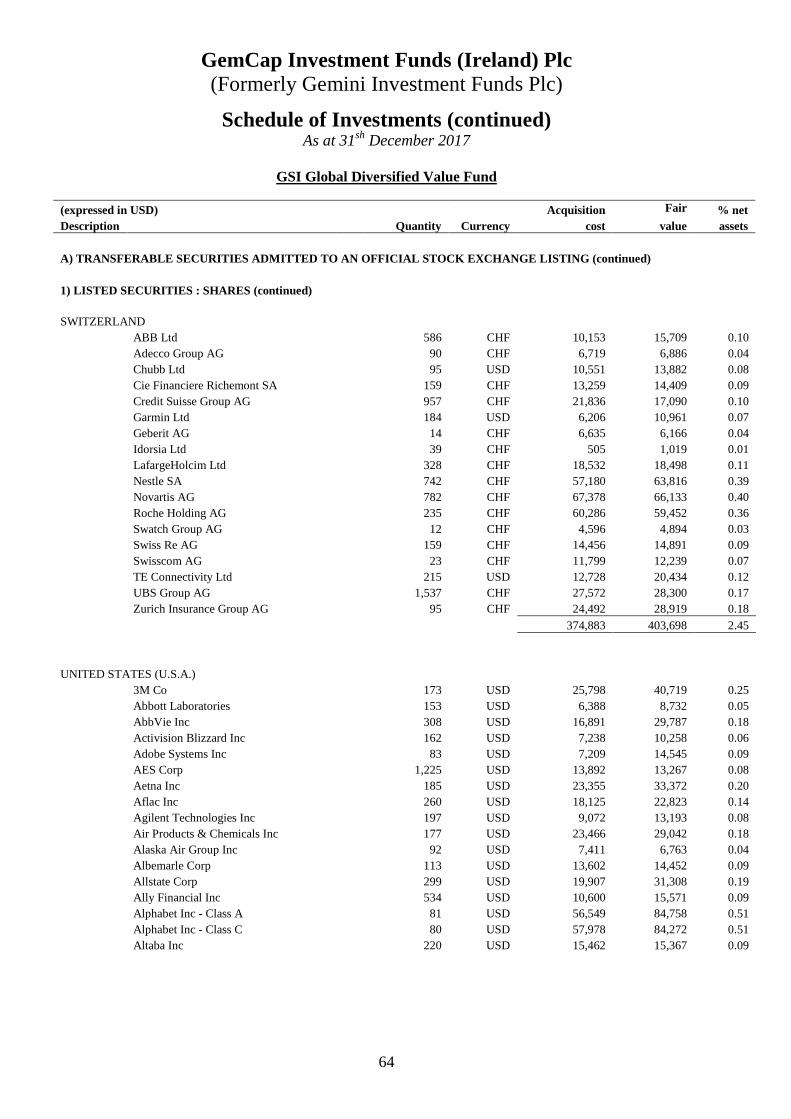
GemCap Investment Funds (Ireland) Plc (Formerly Gemini Investment Funds Plc)
64
Schedule of Investments (continued) As at 31sh December 2017
GSI Global Diversified Value Fund
(expressed in USD) Acquisition Fair % net Description Quantity Currency cost value assets
A) TRANSFERABLE SECURITIES ADMITTED TO AN OFFICIAL STOCK EXCHANGE LISTING (continued)
1) LISTED SECURITIES : SHARES (continued)
SWITZERLAND ABB Ltd 586 CHF 10,153 15,709 0.10 Adecco Group AG 90 CHF 6,719 6,886 0.04 Chubb Ltd 95 USD 10,551 13,882 0.08 Cie Financiere Richemont SA 159 CHF 13,259 14,409 0.09 Credit Suisse Group AG 957 CHF 21,836 17,090 0.10 Garmin Ltd 184 USD 6,206 10,961 0.07 Geberit AG 14 CHF 6,635 6,166 0.04 Idorsia Ltd 39 CHF 505 1,019 0.01 LafargeHolcim Ltd 328 CHF 18,532 18,498 0.11 Nestle SA 742 CHF 57,180 63,816 0.39 Novartis AG 782 CHF 67,378 66,133 0.40 Roche Holding AG 235 CHF 60,286 59,452 0.36 Swatch Group AG 12 CHF 4,596 4,894 0.03 Swiss Re AG 159 CHF 14,456 14,891 0.09 Swisscom AG 23 CHF 11,799 12,239 0.07 TE Connectivity Ltd 215 USD 12,728 20,434 0.12 UBS Group AG 1,537 CHF 27,572 28,300 0.17 Zurich Insurance Group AG 95 CHF 24,492 28,919 0.18
374,883 403,698 2.45
UNITED STATES (U.S.A.) 3M Co 173 USD 25,798 40,719 0.25 Abbott Laboratories 153 USD 6,388 8,732 0.05 AbbVie Inc 308 USD 16,891 29,787 0.18 Activision Blizzard Inc 162 USD 7,238 10,258 0.06 Adobe Systems Inc 83 USD 7,209 14,545 0.09 AES Corp 1,225 USD 13,892 13,267 0.08 Aetna Inc 185 USD 23,355 33,372 0.20 Aflac Inc 260 USD 18,125 22,823 0.14 Agilent Technologies Inc 197 USD 9,072 13,193 0.08 Air Products & Chemicals Inc 177 USD 23,466 29,042 0.18 Alaska Air Group Inc 92 USD 7,411 6,763 0.04 Albemarle Corp 113 USD 13,602 14,452 0.09 Allstate Corp 299 USD 19,907 31,308 0.19 Ally Financial Inc 534 USD 10,600 15,571 0.09 Alphabet Inc - Class A 81 USD 56,549 84,758 0.51 Alphabet Inc - Class C 80 USD 57,978 84,272 0.51 Altaba Inc 220 USD 15,462 15,367 0.09
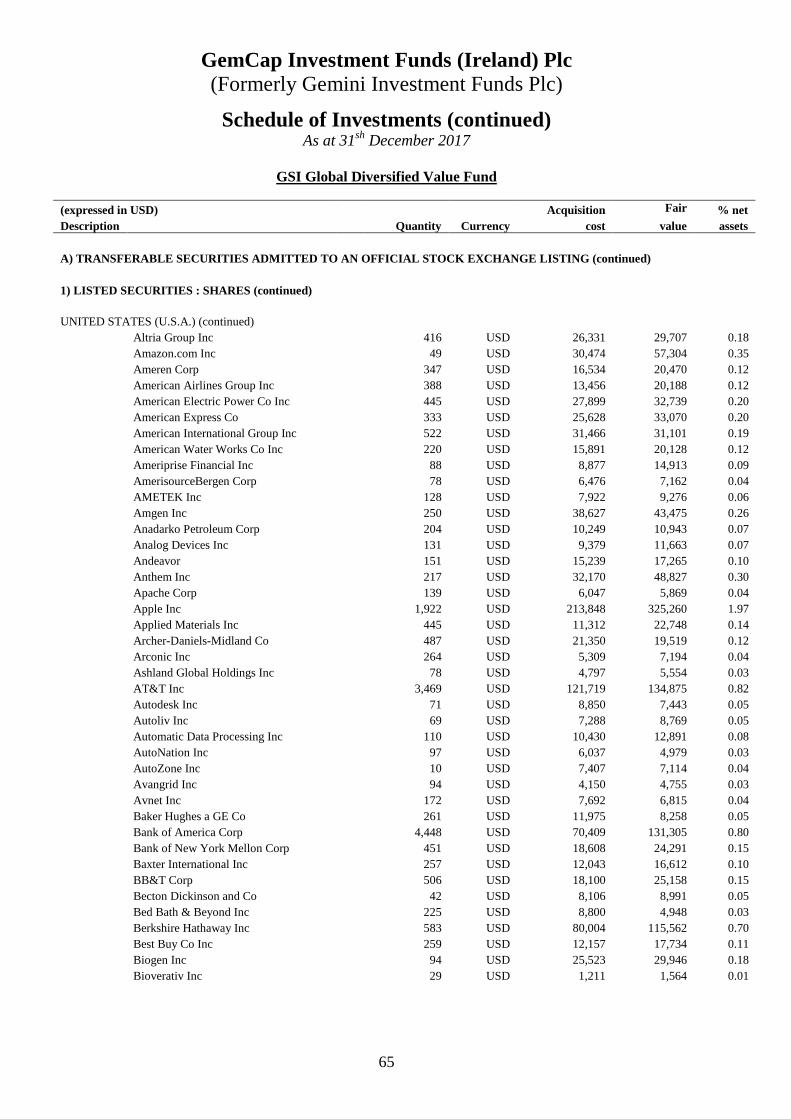
GemCap Investment Funds (Ireland) Plc (Formerly Gemini Investment Funds Plc)
65
Schedule of Investments (continued) As at 31sh December 2017
GSI Global Diversified Value Fund
(expressed in USD) Acquisition Fair % net Description Quantity Currency cost value assets
A) TRANSFERABLE SECURITIES ADMITTED TO AN OFFICIAL STOCK EXCHANGE LISTING (continued)
1) LISTED SECURITIES : SHARES (continued)
UNITED STATES (U.S.A.) (continued) Altria Group Inc 416 USD 26,331 29,707 0.18 Amazon.com Inc 49 USD 30,474 57,304 0.35 Ameren Corp 347 USD 16,534 20,470 0.12 American Airlines Group Inc 388 USD 13,456 20,188 0.12 American Electric Power Co Inc 445 USD 27,899 32,739 0.20 American Express Co 333 USD 25,628 33,070 0.20 American International Group Inc 522 USD 31,466 31,101 0.19 American Water Works Co Inc 220 USD 15,891 20,128 0.12 Ameriprise Financial Inc 88 USD 8,877 14,913 0.09 AmerisourceBergen Corp 78 USD 6,476 7,162 0.04 AMETEK Inc 128 USD 7,922 9,276 0.06 Amgen Inc 250 USD 38,627 43,475 0.26 Anadarko Petroleum Corp 204 USD 10,249 10,943 0.07 Analog Devices Inc 131 USD 9,379 11,663 0.07 Andeavor 151 USD 15,239 17,265 0.10 Anthem Inc 217 USD 32,170 48,827 0.30 Apache Corp 139 USD 6,047 5,869 0.04 Apple Inc 1,922 USD 213,848 325,260 1.97 Applied Materials Inc 445 USD 11,312 22,748 0.14 Archer-Daniels-Midland Co 487 USD 21,350 19,519 0.12 Arconic Inc 264 USD 5,309 7,194 0.04 Ashland Global Holdings Inc 78 USD 4,797 5,554 0.03 AT&T Inc 3,469 USD 121,719 134,875 0.82 Autodesk Inc 71 USD 8,850 7,443 0.05 Autoliv Inc 69 USD 7,288 8,769 0.05 Automatic Data Processing Inc 110 USD 10,430 12,891 0.08 AutoNation Inc 97 USD 6,037 4,979 0.03 AutoZone Inc 10 USD 7,407 7,114 0.04 Avangrid Inc 94 USD 4,150 4,755 0.03 Avnet Inc 172 USD 7,692 6,815 0.04 Baker Hughes a GE Co 261 USD 11,975 8,258 0.05 Bank of America Corp 4,448 USD 70,409 131,305 0.80 Bank of New York Mellon Corp 451 USD 18,608 24,291 0.15 Baxter International Inc 257 USD 12,043 16,612 0.10 BB&T Corp 506 USD 18,100 25,158 0.15 Becton Dickinson and Co 42 USD 8,106 8,991 0.05 Bed Bath & Beyond Inc 225 USD 8,800 4,948 0.03 Berkshire Hathaway Inc 583 USD 80,004 115,562 0.70 Best Buy Co Inc 259 USD 12,157 17,734 0.11 Biogen Inc 94 USD 25,523 29,946 0.18 Bioverativ Inc 29 USD 1,211 1,564 0.01

GemCap Investment Funds (Ireland) Plc (Formerly Gemini Investment Funds Plc)
66
Schedule of Investments (continued) As at 31sh December 2017
GSI Global Diversified Value Fund
(expressed in USD) Acquisition Fair % net Description Quantity Currency cost value assets
A) TRANSFERABLE SECURITIES ADMITTED TO AN OFFICIAL STOCK EXCHANG E LISTING (continued)
1) LISTED SECURITIES : SHARES (continued)
UNITED STATES (U.S.A.) (continued) Black Knight Inc 67 USD 2,321 2,958 0.02 BlackRock Inc 65 USD 21,265 33,391 0.20 Boeing Co 239 USD 32,364 70,483 0.43 BorgWarner Inc 210 USD 8,020 10,729 0.06 Brighthouse Financial Inc 44 USD 2,478 2,580 0.02 Bristol-Myers Squibb Co 178 USD 11,374 10,908 0.07 CA Inc 242 USD 7,921 8,054 0.05 Capital One Financial Corp 307 USD 22,899 30,571 0.19 Cardinal Health Inc 132 USD 10,146 8,088 0.05 Caterpillar Inc 232 USD 16,305 36,559 0.22 CBS Corp 127 USD 8,189 7,493 0.05 Celanese Corp 151 USD 9,806 16,169 0.10 Celgene Corp 99 USD 11,509 10,332 0.06 Centene Corp 140 USD 14,454 14,123 0.09 CenterPoint Energy Inc 599 USD 14,250 16,988 0.10 CenturyLink Inc 1,493 USD 37,905 24,903 0.15 Cerner Corp 125 USD 8,079 8,424 0.05 CF Industries Holdings Inc 216 USD 11,184 9,189 0.06 Charles Schwab Corp 259 USD 11,554 13,305 0.08 Charter Communications Inc 26 USD 4,703 8,735 0.05 Cheniere Energy Inc 115 USD 5,668 6,192 0.04 Chevron Corp 1,076 USD 104,474 134,704 0.82 Church & Dwight Co Inc 143 USD 7,242 7,174 0.04 Cigna Corp 96 USD 12,385 19,497 0.12 Cincinnati Financial Corp 116 USD 8,411 8,697 0.05 Cisco Systems Inc 1,833 USD 52,588 70,204 0.43 CIT Group Inc 204 USD 8,572 10,043 0.06 Citigroup Inc 1,223 USD 65,122 91,003 0.55 Citizens Financial Group Inc 335 USD 8,147 14,063 0.09 Citrix Systems Inc 78 USD 6,573 6,864 0.04 Clorox Co 50 USD 6,755 7,437 0.05 CME Group Inc 127 USD 12,070 18,548 0.11 CMS Energy Corp 364 USD 14,535 17,217 0.10 Coca-Cola Co 626 USD 26,480 28,721 0.17 Cognizant Technology Solutions Corp 134 USD 7,693 9,517 0.06 Colgate-Palmolive Co 344 USD 24,650 25,955 0.16 Comcast Corp 1,881 USD 59,586 75,334 0.46 Comerica Inc 144 USD 9,829 12,501 0.08 Conagra Brands Inc 302 USD 12,143 11,376 0.07 Concho Resources Inc 50 USD 7,121 7,511 0.05 Conduent Inc 181 USD 2,567 2,925 0.02

GemCap Investment Funds (Ireland) Plc (Formerly Gemini Investment Funds Plc)
67
Schedule of Investments (continued) As at 31sh December 2017
GSI Global Diversified Value Fund
(expressed in USD) Acquisition Fair % net Description Quantity Currency cost value assets
A) TRANSFERABLE SECURITIES ADMITTED TO AN OFFICIAL STOCK EXCHANG E LISTING (continued)
1) LISTED SECURITIES : SHARES (continued)
UNITED STATES (U.S.A.) (continued) ConocoPhillips 785 USD 41,758 43,089 0.26 Consolidated Edison Inc 480 USD 35,816 40,776 0.25 Constellation Brands Inc 62 USD 10,152 14,171 0.09 Corning Inc 670 USD 12,650 21,433 0.13 Costco Wholesale Corp 73 USD 11,284 13,587 0.08 CSX Corp 603 USD 16,317 33,171 0.20 Cummins Inc 107 USD 12,940 18,900 0.11 CVS Health Corp 598 USD 51,980 43,355 0.26 Danaher Corp 456 USD 33,900 42,326 0.26 Darden Restaurants Inc 114 USD 8,192 10,946 0.07 DaVita Inc 131 USD 8,824 9,465 0.06 Deere & Co 156 USD 12,957 24,416 0.15 Dell Technologies Inc Class V 140 USD 4,354 11,379 0.07 Delta Air Lines Inc 461 USD 19,551 25,816 0.16 Devon Energy Corp 164 USD 6,504 6,790 0.04 Discover Financial Services 229 USD 13,009 17,615 0.11 Discovery Communications Inc 322 USD 8,762 6,817 0.04 DISH Network Corp 107 USD 5,699 5,109 0.03 Dollar General Corp 114 USD 7,816 10,603 0.06 Dollar Tree Inc 90 USD 8,433 9,658 0.06 Dominion Resources Inc 150 USD 11,055 12,159 0.07 Dover Corp 107 USD 8,310 10,806 0.07 DowDuPont Inc 1,103 USD 51,334 78,556 0.48 DR Horton Inc 245 USD 8,007 12,512 0.08 Dr Pepper Snapple Group Inc 91 USD 7,711 8,832 0.05 DTE Energy Co 191 USD 17,363 20,907 0.13 Duke Energy Corp 715 USD 57,206 60,139 0.36 DXC Technology Co 125 USD 7,504 11,863 0.07 Eastman Chemical Co 164 USD 11,472 15,193 0.09 eBay Inc 489 USD 11,946 18,455 0.11 Ecolab Inc 86 USD 10,191 11,539 0.07 Edison International 378 USD 26,891 23,905 0.14 Edwards Lifesciences Corp 89 USD 10,523 10,031 0.06 Electronic Arts Inc 120 USD 8,677 12,607 0.08 Eli Lilly & Co 206 USD 16,027 17,399 0.11 Emerson Electric Co 223 USD 12,274 15,541 0.09 Entergy Corp 223 USD 15,543 18,150 0.11 EOG Resources Inc 149 USD 12,647 16,079 0.10 EQT Corp 78 USD 4,663 4,440 0.03 Estee Lauder Cos Inc 87 USD 7,286 11,070 0.07 Eversource Energy 330 USD 17,229 20,849 0.13
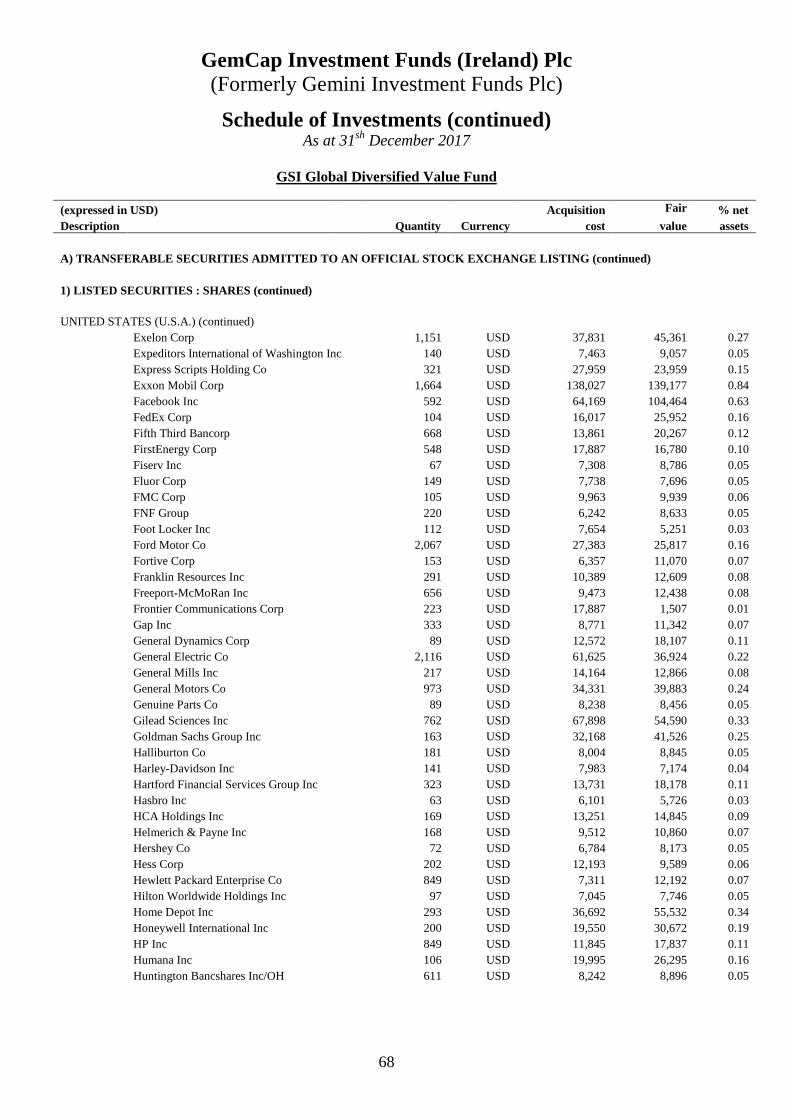
GemCap Investment Funds (Ireland) Plc (Formerly Gemini Investment Funds Plc)
68
Schedule of Investments (continued) As at 31sh December 2017
GSI Global Diversified Value Fund
(expressed in USD) Acquisition Fair % net Description Quantity Currency cost value assets
A) TRANSFERABLE SECURITIES ADMITTED TO AN OFFICIAL STOCK EXCHANGE LISTING (continued)
1) LISTED SECURITIES : SHARES (continued)
UNITED STATES (U.S.A.) (continued) Exelon Corp 1,151 USD 37,831 45,361 0.27 Expeditors International of Washington Inc 140 USD 7,463 9,057 0.05 Express Scripts Holding Co 321 USD 27,959 23,959 0.15 Exxon Mobil Corp 1,664 USD 138,027 139,177 0.84 Facebook Inc 592 USD 64,169 104,464 0.63 FedEx Corp 104 USD 16,017 25,952 0.16 Fifth Third Bancorp 668 USD 13,861 20,267 0.12 FirstEnergy Corp 548 USD 17,887 16,780 0.10 Fiserv Inc 67 USD 7,308 8,786 0.05 Fluor Corp 149 USD 7,738 7,696 0.05 FMC Corp 105 USD 9,963 9,939 0.06 FNF Group 220 USD 6,242 8,633 0.05 Foot Locker Inc 112 USD 7,654 5,251 0.03 Ford Motor Co 2,067 USD 27,383 25,817 0.16 Fortive Corp 153 USD 6,357 11,070 0.07 Franklin Resources Inc 291 USD 10,389 12,609 0.08 Freeport-McMoRan Inc 656 USD 9,473 12,438 0.08 Frontier Communications Corp 223 USD 17,887 1,507 0.01 Gap Inc 333 USD 8,771 11,342 0.07 General Dynamics Corp 89 USD 12,572 18,107 0.11 General Electric Co 2,116 USD 61,625 36,924 0.22 General Mills Inc 217 USD 14,164 12,866 0.08 General Motors Co 973 USD 34,331 39,883 0.24 Genuine Parts Co 89 USD 8,238 8,456 0.05 Gilead Sciences Inc 762 USD 67,898 54,590 0.33 Goldman Sachs Group Inc 163 USD 32,168 41,526 0.25 Halliburton Co 181 USD 8,004 8,845 0.05 Harley-Davidson Inc 141 USD 7,983 7,174 0.04 Hartford Financial Services Group Inc 323 USD 13,731 18,178 0.11 Hasbro Inc 63 USD 6,101 5,726 0.03 HCA Holdings Inc 169 USD 13,251 14,845 0.09 Helmerich & Payne Inc 168 USD 9,512 10,860 0.07 Hershey Co 72 USD 6,784 8,173 0.05 Hess Corp 202 USD 12,193 9,589 0.06 Hewlett Packard Enterprise Co 849 USD 7,311 12,192 0.07 Hilton Worldwide Holdings Inc 97 USD 7,045 7,746 0.05 Home Depot Inc 293 USD 36,692 55,532 0.34 Honeywell International Inc 200 USD 19,550 30,672 0.19 HP Inc 849 USD 11,845 17,837 0.11 Humana Inc 106 USD 19,995 26,295 0.16 Huntington Bancshares Inc/OH 611 USD 8,242 8,896 0.05
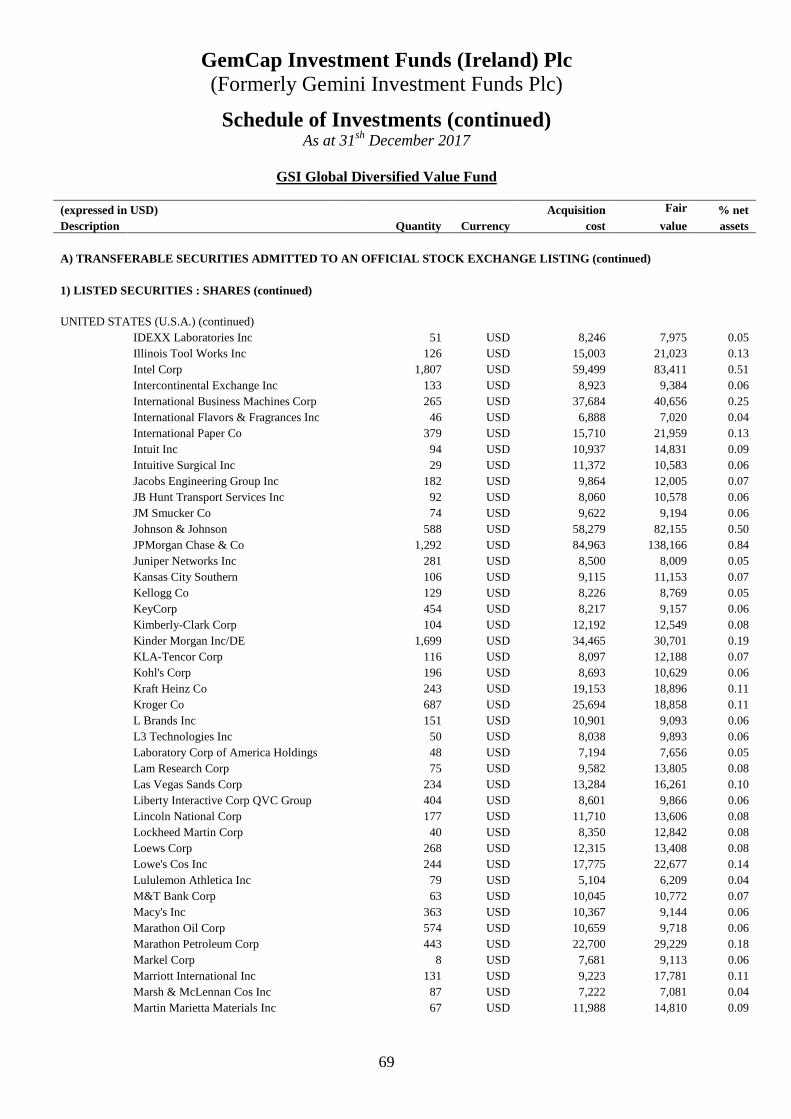
GemCap Investment Funds (Ireland) Plc (Formerly Gemini Investment Funds Plc)
69
Schedule of Investments (continued) As at 31sh December 2017
GSI Global Diversified Value Fund
(expressed in USD) Acquisition Fair % net Description Quantity Currency cost value assets
A) TRANSFERABLE SECURITIES ADMITTED TO AN OFFICIAL STOCK EXCHANGE LISTING (continued)
1) LISTED SECURITIES : SHARES (continued)
UNITED STATES (U.S.A.) (continued) IDEXX Laboratories Inc 51 USD 8,246 7,975 0.05 Illinois Tool Works Inc 126 USD 15,003 21,023 0.13 Intel Corp 1,807 USD 59,499 83,411 0.51 Intercontinental Exchange Inc 133 USD 8,923 9,384 0.06 International Business Machines Corp 265 USD 37,684 40,656 0.25 International Flavors & Fragrances Inc 46 USD 6,888 7,020 0.04 International Paper Co 379 USD 15,710 21,959 0.13 Intuit Inc 94 USD 10,937 14,831 0.09 Intuitive Surgical Inc 29 USD 11,372 10,583 0.06 Jacobs Engineering Group Inc 182 USD 9,864 12,005 0.07 JB Hunt Transport Services Inc 92 USD 8,060 10,578 0.06 JM Smucker Co 74 USD 9,622 9,194 0.06 Johnson & Johnson 588 USD 58,279 82,155 0.50 JPMorgan Chase & Co 1,292 USD 84,963 138,166 0.84 Juniper Networks Inc 281 USD 8,500 8,009 0.05 Kansas City Southern 106 USD 9,115 11,153 0.07 Kellogg Co 129 USD 8,226 8,769 0.05 KeyCorp 454 USD 8,217 9,157 0.06 Kimberly-Clark Corp 104 USD 12,192 12,549 0.08 Kinder Morgan Inc/DE 1,699 USD 34,465 30,701 0.19 KLA-Tencor Corp 116 USD 8,097 12,188 0.07 Kohl's Corp 196 USD 8,693 10,629 0.06 Kraft Heinz Co 243 USD 19,153 18,896 0.11 Kroger Co 687 USD 25,694 18,858 0.11 L Brands Inc 151 USD 10,901 9,093 0.06 L3 Technologies Inc 50 USD 8,038 9,893 0.06 Laboratory Corp of America Holdings 48 USD 7,194 7,656 0.05 Lam Research Corp 75 USD 9,582 13,805 0.08 Las Vegas Sands Corp 234 USD 13,284 16,261 0.10 Liberty Interactive Corp QVC Group 404 USD 8,601 9,866 0.06 Lincoln National Corp 177 USD 11,710 13,606 0.08 Lockheed Martin Corp 40 USD 8,350 12,842 0.08 Loews Corp 268 USD 12,315 13,408 0.08 Lowe's Cos Inc 244 USD 17,775 22,677 0.14 Lululemon Athletica Inc 79 USD 5,104 6,209 0.04 M&T Bank Corp 63 USD 10,045 10,772 0.07 Macy's Inc 363 USD 10,367 9,144 0.06 Marathon Oil Corp 574 USD 10,659 9,718 0.06 Marathon Petroleum Corp 443 USD 22,700 29,229 0.18 Markel Corp 8 USD 7,681 9,113 0.06 Marriott International Inc 131 USD 9,223 17,781 0.11 Marsh & McLennan Cos Inc 87 USD 7,222 7,081 0.04 Martin Marietta Materials Inc 67 USD 11,988 14,810 0.09
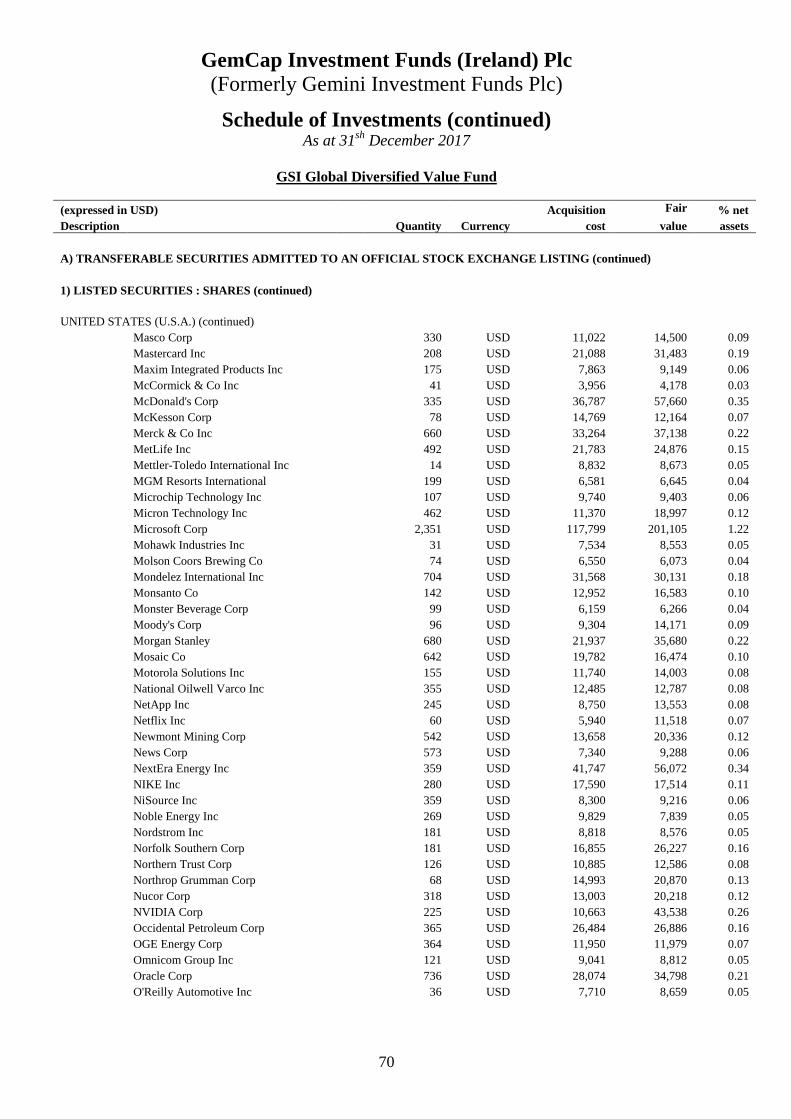
GemCap Investment Funds (Ireland) Plc (Formerly Gemini Investment Funds Plc)
70
Schedule of Investments (continued) As at 31sh December 2017
GSI Global Diversified Value Fund
(expressed in USD) Acquisition Fair % net Description Quantity Currency cost value assets
A) TRANSFERABLE SECURITIES ADMITTED TO AN OFFICIAL STOCK EXCHANGE LISTING (continued)
1) LISTED SECURITIES : SHARES (continued)
UNITED STATES (U.S.A.) (continued) Masco Corp 330 USD 11,022 14,500 0.09 Mastercard Inc 208 USD 21,088 31,483 0.19 Maxim Integrated Products Inc 175 USD 7,863 9,149 0.06 McCormick & Co Inc 41 USD 3,956 4,178 0.03 McDonald's Corp 335 USD 36,787 57,660 0.35 McKesson Corp 78 USD 14,769 12,164 0.07 Merck & Co Inc 660 USD 33,264 37,138 0.22 MetLife Inc 492 USD 21,783 24,876 0.15 Mettler-Toledo International Inc 14 USD 8,832 8,673 0.05 MGM Resorts International 199 USD 6,581 6,645 0.04 Microchip Technology Inc 107 USD 9,740 9,403 0.06 Micron Technology Inc 462 USD 11,370 18,997 0.12 Microsoft Corp 2,351 USD 117,799 201,105 1.22 Mohawk Industries Inc 31 USD 7,534 8,553 0.05 Molson Coors Brewing Co 74 USD 6,550 6,073 0.04 Mondelez International Inc 704 USD 31,568 30,131 0.18 Monsanto Co 142 USD 12,952 16,583 0.10 Monster Beverage Corp 99 USD 6,159 6,266 0.04 Moody's Corp 96 USD 9,304 14,171 0.09 Morgan Stanley 680 USD 21,937 35,680 0.22 Mosaic Co 642 USD 19,782 16,474 0.10 Motorola Solutions Inc 155 USD 11,740 14,003 0.08 National Oilwell Varco Inc 355 USD 12,485 12,787 0.08 NetApp Inc 245 USD 8,750 13,553 0.08 Netflix Inc 60 USD 5,940 11,518 0.07 Newmont Mining Corp 542 USD 13,658 20,336 0.12 News Corp 573 USD 7,340 9,288 0.06 NextEra Energy Inc 359 USD 41,747 56,072 0.34 NIKE Inc 280 USD 17,590 17,514 0.11 NiSource Inc 359 USD 8,300 9,216 0.06 Noble Energy Inc 269 USD 9,829 7,839 0.05 Nordstrom Inc 181 USD 8,818 8,576 0.05 Norfolk Southern Corp 181 USD 16,855 26,227 0.16 Northern Trust Corp 126 USD 10,885 12,586 0.08 Northrop Grumman Corp 68 USD 14,993 20,870 0.13 Nucor Corp 318 USD 13,003 20,218 0.12 NVIDIA Corp 225 USD 10,663 43,538 0.26 Occidental Petroleum Corp 365 USD 26,484 26,886 0.16 OGE Energy Corp 364 USD 11,950 11,979 0.07 Omnicom Group Inc 121 USD 9,041 8,812 0.05 Oracle Corp 736 USD 28,074 34,798 0.21 O'Reilly Automotive Inc 36 USD 7,710 8,659 0.05
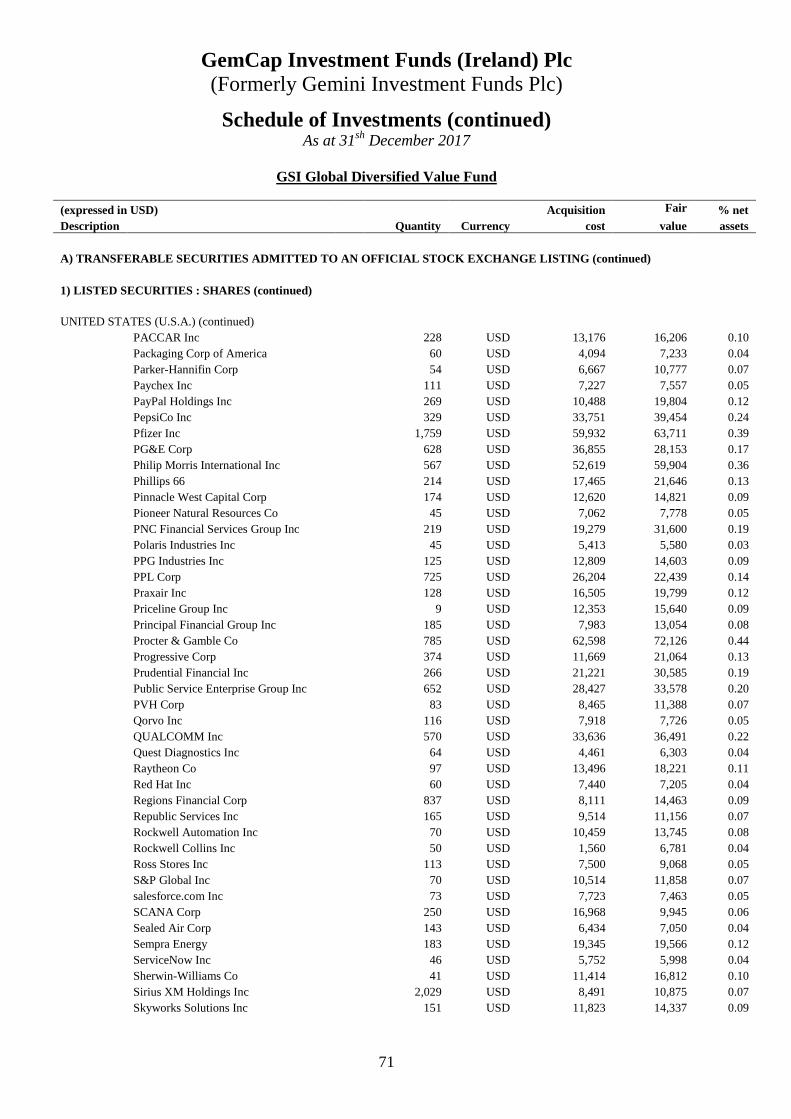
GemCap Investment Funds (Ireland) Plc (Formerly Gemini Investment Funds Plc)
71
Schedule of Investments (continued) As at 31sh December 2017
GSI Global Diversified Value Fund
(expressed in USD) Acquisition Fair % net Description Quantity Currency cost value assets
A) TRANSFERABLE SECURITIES ADMITTED TO AN OFFICIAL STOCK EXCHANGE LISTING (continued)
1) LISTED SECURITIES : SHARES (continued)
UNITED STATES (U.S.A.) (continued) PACCAR Inc 228 USD 13,176 16,206 0.10 Packaging Corp of America 60 USD 4,094 7,233 0.04 Parker-Hannifin Corp 54 USD 6,667 10,777 0.07 Paychex Inc 111 USD 7,227 7,557 0.05 PayPal Holdings Inc 269 USD 10,488 19,804 0.12 PepsiCo Inc 329 USD 33,751 39,454 0.24 Pfizer Inc 1,759 USD 59,932 63,711 0.39 PG&E Corp 628 USD 36,855 28,153 0.17 Philip Morris International Inc 567 USD 52,619 59,904 0.36 Phillips 66 214 USD 17,465 21,646 0.13 Pinnacle West Capital Corp 174 USD 12,620 14,821 0.09 Pioneer Natural Resources Co 45 USD 7,062 7,778 0.05 PNC Financial Services Group Inc 219 USD 19,279 31,600 0.19 Polaris Industries Inc 45 USD 5,413 5,580 0.03 PPG Industries Inc 125 USD 12,809 14,603 0.09 PPL Corp 725 USD 26,204 22,439 0.14 Praxair Inc 128 USD 16,505 19,799 0.12 Priceline Group Inc 9 USD 12,353 15,640 0.09 Principal Financial Group Inc 185 USD 7,983 13,054 0.08 Procter & Gamble Co 785 USD 62,598 72,126 0.44 Progressive Corp 374 USD 11,669 21,064 0.13 Prudential Financial Inc 266 USD 21,221 30,585 0.19 Public Service Enterprise Group Inc 652 USD 28,427 33,578 0.20 PVH Corp 83 USD 8,465 11,388 0.07 Qorvo Inc 116 USD 7,918 7,726 0.05 QUALCOMM Inc 570 USD 33,636 36,491 0.22 Quest Diagnostics Inc 64 USD 4,461 6,303 0.04 Raytheon Co 97 USD 13,496 18,221 0.11 Red Hat Inc 60 USD 7,440 7,205 0.04 Regions Financial Corp 837 USD 8,111 14,463 0.09 Republic Services Inc 165 USD 9,514 11,156 0.07 Rockwell Automation Inc 70 USD 10,459 13,745 0.08 Rockwell Collins Inc 50 USD 1,560 6,781 0.04 Ross Stores Inc 113 USD 7,500 9,068 0.05 S&P Global Inc 70 USD 10,514 11,858 0.07 salesforce.com Inc 73 USD 7,723 7,463 0.05 SCANA Corp 250 USD 16,968 9,945 0.06 Sealed Air Corp 143 USD 6,434 7,050 0.04 Sempra Energy 183 USD 19,345 19,566 0.12 ServiceNow Inc 46 USD 5,752 5,998 0.04 Sherwin-Williams Co 41 USD 11,414 16,812 0.10 Sirius XM Holdings Inc 2,029 USD 8,491 10,875 0.07 Skyworks Solutions Inc 151 USD 11,823 14,337 0.09

GemCap Investment Funds (Ireland) Plc (Formerly Gemini Investment Funds Plc)
72
Schedule of Investments (continued) As at 31sh December 2017
GSI Global Diversified Value Fund
(expressed in USD) Acquisition Fair % net Description Quantity Currency cost value assets
A) TRANSFERABLE SECURITIES ADMITTED TO AN OFFICIAL STOCK EXCHANGE LISTING (continued)
1) LISTED SECURITIES : SHARES (continued)
UNITED STATES (U.S.A.) (continued) Southern Co 580 USD 28,207 27,892 0.17 Southwest Airlines Co 390 USD 17,238 25,526 0.15 Sprint Corp 1,469 USD 12,266 8,652 0.05 Stanley Black & Decker Inc 67 USD 8,182 11,369 0.07 Starbucks Corp 365 USD 22,092 20,962 0.13 State Street Corp 271 USD 15,897 26,452 0.16 Stryker Corp 61 USD 8,003 9,445 0.06 SunTrust Banks Inc 442 USD 18,409 28,549 0.17 Symantec Corp 255 USD 5,363 7,154 0.04 Synchrony Financial 411 USD 11,126 15,869 0.10 Sysco Corp 156 USD 8,387 9,474 0.06 T Rowe Price Group Inc 96 USD 6,417 10,073 0.06 Tapestry Inc 159 USD 5,476 7,033 0.04 Target Corp 393 USD 29,243 25,643 0.16 TD Ameritrade Holding Corp 173 USD 7,327 8,845 0.05 Texas Instruments Inc 345 USD 18,092 36,032 0.22 Textron Inc 169 USD 8,149 9,564 0.06 Thermo Fisher Scientific Inc 73 USD 9,390 13,861 0.08 Tiffany & Co 97 USD 9,318 10,083 0.06 Time Warner Inc 326 USD 23,387 29,819 0.18 TJX Cos Inc 317 USD 23,147 24,238 0.15 T-Mobile US Inc 467 USD 22,353 29,659 0.18 Torchmark Corp 97 USD 7,462 8,799 0.05 Total System Services Inc 78 USD 5,677 6,169 0.04 TransDigm Group Inc 45 USD 9,791 12,358 0.06 Travelers Cos Inc 143 USD 15,581 19,397 0.12 Twenty-First Century Fox Inc 590 USD 17,452 20,373 0.12 Tyson Foods Inc 206 USD 9,497 16,700 0.10 Union Pacific Corp 362 USD 35,673 48,544 0.29 United Continental Holdings Inc 287 USD 12,459 19,344 0.12 United Parcel Service Inc 126 USD 13,478 15,013 0.09 United Rentals Inc 65 USD 4,304 11,174 0.07 United Technologies Corp 302 USD 28,880 38,526 0.23 UnitedHealth Group Inc 210 USD 25,290 46,297 0.28 Universal Health Services Inc 66 USD 7,507 7,481 0.04 Unum Group 210 USD 9,001 11,527 0.07 US Bancorp 584 USD 24,096 31,291 0.19 Valero Energy Corp 415 USD 24,220 38,143 0.23 Varex Imaging Corp 48 USD 1,114 1,928 0.01 Varian Medical Systems Inc 61 USD 4,032 6,780 0.04 VeriSign Inc 65 USD 4,927 7,439 0.04 Verizon Communications Inc 2,394 USD 117,674 126,714 0.77 Versum Materials Inc 62 USD 1,528 2,347 0.01

GemCap Investment Funds (Ireland) Plc (Formerly Gemini Investment Funds Plc)
73
Schedule of Investments (continued) As at 31sh December 2017
GSI Global Diversified Value Fund
(expressed in USD) Acquisition Fair % net Description Quantity Currency cost value assets
A) TRANSFERABLE SECURITIES ADMITTED TO AN OFFICIAL STOCK EXCHANGE LISTING (continued)
1) LISTED SECURITIES : SHARES (continued)
UNITED STATES (U.S.A.) (continued)
VF Corp 151 USD 8,131 11,174 0.07 Viacom Inc 247 USD 8,907 7,610 0.05 Visa Inc 435 USD 33,713 49,599 0.30 VMware Inc 69 USD 6,358 8,647 0.05 Voya Financial Inc 182 USD 7,462 9,004 0.04 Vulcan Materials Co 101 USD 11,107 12,965 0.08 Walgreens Boots Alliance Inc 387 USD 30,682 28,104 0.17 Walmart Inc 945 USD 63,901 93,319 0.57 Walt Disney Co 472 USD 52,032 50,745 0.31 Waste Management Inc 206 USD 13,186 17,778 0.11 Waters Corp 44 USD 8,109 8,500 0.05 WEC Energy Group Inc 274 USD 17,770 18,202 0.11 Wells Fargo & Co 1,596 USD 83,612 96,829 0.59 Western Digital Corp 75 USD 3,461 5,965 0.04 Western Union Co 385 USD 7,777 7,318 0.04 WestRock Co 167 USD 8,066 10,556 0.06 Whirlpool Corp 45 USD 7,803 7,589 0.05 Williams Cos Inc 277 USD 8,587 8,446 0.05 Workday Inc 31 USD 2,806 3,154 0.02 WW Grainger Inc 34 USD 8,616 8,033 0.05 Wyndham Worldwide Corp 87 USD 8,351 10,081 0.06 Xcel Energy Inc 542 USD 19,859 26,076 0.16 Xerox Corp 262 USD 7,590 7,637 0.05 Xilinx Inc 109 USD 5,805 7,349 0.04 Yum China Holdings Inc 139 USD 3,614 5,563 0.03 Yum! Brands Inc 252 USD 16,728 20,566 0.11
6,863,663 8,614,450 52.25
VIRGIN ISLANDS (UK) Michael Kors Holdings Ltd 259 USD 12,911 16,304 0.10
12,911 16,304 0.10
TOTAL LISTED SECURITIES : EQUITIES 13,399,089 16,144,443 97.76
TOTAL TRANSFERABLE SECURITIES ADMITTED TO AN OFFICIAL STOCK EXCHANGE LISTING 13,399,089 16,144,443 97.76
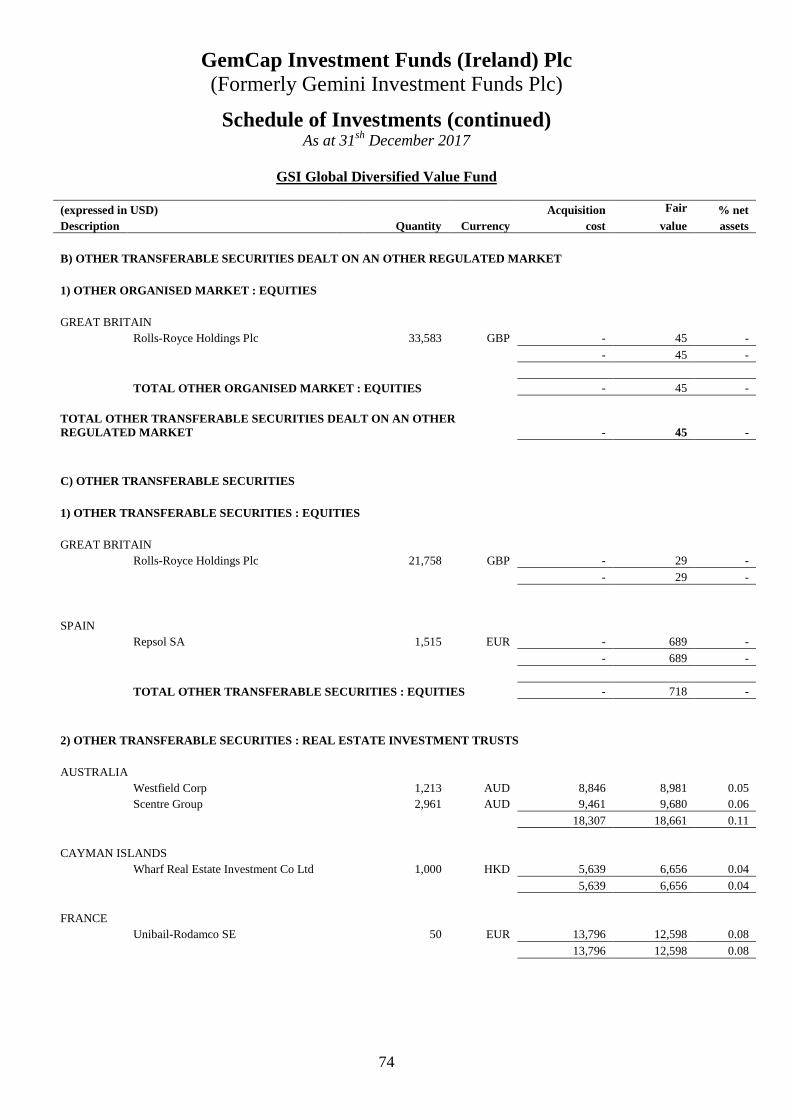
GemCap Investment Funds (Ireland) Plc (Formerly Gemini Investment Funds Plc)
74
Schedule of Investments (continued) As at 31sh December 2017
GSI Global Diversified Value Fund
(expressed in USD) Acquisition Fair % net Description Quantity Currency cost value assets
B) OTHER TRANSFERABLE SECURITIES DEALT ON AN OTHER REGULATED MARKET
1) OTHER ORGANISED MARKET : EQUITIES
GREAT BRITAIN Rolls-Royce Holdings Plc 33,583 GBP - 45 -
- 45 -
TOTAL OTHER ORGANISED MARKET : EQUITIES - 45 -
TOTAL OTHER TRANSFERABLE SECURITIES DEALT ON AN OTHER REGULATED MARKET - 45 -
C) OTHER TRANSFERABLE SECURITIES
1) OTHER TRANSFERABLE SECURITIES : EQUITIES
GREAT BRITAIN Rolls-Royce Holdings Plc 21,758 GBP - 29 -
- 29 -
SPAIN Repsol SA 1,515 EUR - 689 -
- 689 -
TOTAL OTHER TRANSFERABLE SECURITIES : EQUITIES - 718 -
2) OTHER TRANSFERABLE SECURITIES : REAL ESTATE INVESTMENT TRUSTS
AUSTRALIA Westfield Corp 1,213 AUD 8,846 8,981 0.05 Scentre Group 2,961 AUD 9,461 9,680 0.06
18,307 18,661 0.11
CAYMAN ISLANDS Wharf Real Estate Investment Co Ltd 1,000 HKD 5,639 6,656 0.04
5,639 6,656 0.04
FRANCE Unibail-Rodamco SE 50 EUR 13,796 12,598 0.08
13,796 12,598 0.08
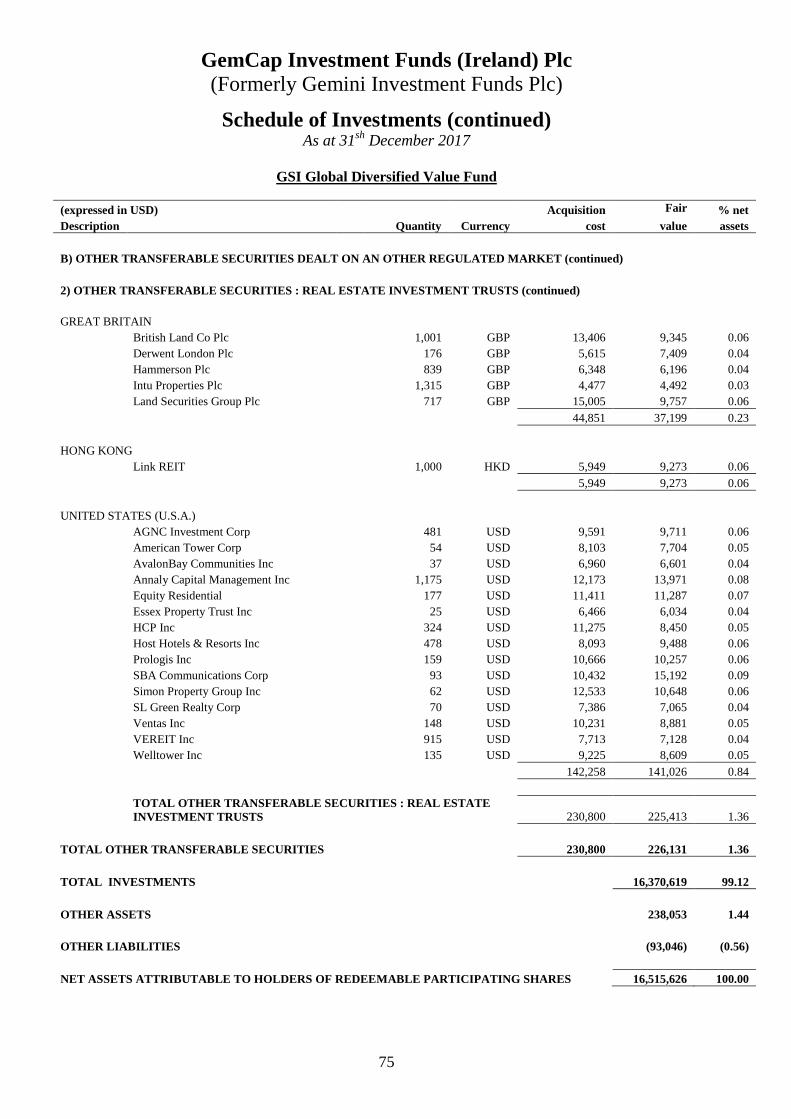
GemCap Investment Funds (Ireland) Plc (Formerly Gemini Investment Funds Plc)
75
Schedule of Investments (continued) As at 31sh December 2017
GSI Global Diversified Value Fund
(expressed in USD) Acquisition Fair % net Description Quantity Currency cost value assets
B) OTHER TRANSFERABLE SECURITIES DEALT ON AN OTHER REGULATED MARKET ( continued)
2) OTHER TRANSFERABLE SECURITIES : REAL ESTATE INVESTMENT TRUSTS (contin ued)
GREAT BRITAIN British Land Co Plc 1,001 GBP 13,406 9,345 0.06 Derwent London Plc 176 GBP 5,615 7,409 0.04 Hammerson Plc 839 GBP 6,348 6,196 0.04 Intu Properties Plc 1,315 GBP 4,477 4,492 0.03 Land Securities Group Plc 717 GBP 15,005 9,757 0.06
44,851 37,199 0.23
HONG KONG Link REIT 1,000 HKD 5,949 9,273 0.06
5,949 9,273 0.06
UNITED STATES (U.S.A.) AGNC Investment Corp 481 USD 9,591 9,711 0.06 American Tower Corp 54 USD 8,103 7,704 0.05 AvalonBay Communities Inc 37 USD 6,960 6,601 0.04 Annaly Capital Management Inc 1,175 USD 12,173 13,971 0.08 Equity Residential 177 USD 11,411 11,287 0.07 Essex Property Trust Inc 25 USD 6,466 6,034 0.04 HCP Inc 324 USD 11,275 8,450 0.05 Host Hotels & Resorts Inc 478 USD 8,093 9,488 0.06 Prologis Inc 159 USD 10,666 10,257 0.06 SBA Communications Corp 93 USD 10,432 15,192 0.09 Simon Property Group Inc 62 USD 12,533 10,648 0.06 SL Green Realty Corp 70 USD 7,386 7,065 0.04 Ventas Inc 148 USD 10,231 8,881 0.05 VEREIT Inc 915 USD 7,713 7,128 0.04 Welltower Inc 135 USD 9,225 8,609 0.05
142,258 141,026 0.84
TOTAL OTHER TRANSFERABLE SECURITIES : REAL ESTATE INVESTMENT TRUSTS 230,800 225,413 1.36
TOTAL OTHER TRANSFERABLE SECURITIES 230,800 226,131 1.36
TOTAL INVESTMENTS 16,370,619 99.12
OTHER ASSETS 238,053 1.44
OTHER LIABILITIES (93,046) (0.56)
NET ASSETS ATTRIBUTABLE TO HOLDERS OF REDEEMABLE PARTICIPATING SHARES 16,515,626 100.00

GemCap Investment Funds (Ireland) Plc (Formerly Gemini Investment Funds Plc)
76
Schedule of Investments (continued) As at 31st December 2017
GSI Global Diversified Value Fund
% of Total Assets
Assets % Investment in Transferable Securities 98.57 Investment in Financial Derivative Instruments 0.24 Cash at Bank 0.63 Other Assets and Liabilities
Total Assets 99.44

GemCap Investment Funds (Ireland) Plc (Formerly Gemini Investment Funds Plc)
77
Significant Portfolio Movements (unaudited) 31st December 2017
GSI Global Diversified Value Fund
Purchases Security Name Quantity Cost % of $ Total Purchases
AT&T Inc 1,083 41,392 1.14%
National Grid Plc 2,559 36,594 1.00%
Kinder Morgan Inc 1,699 34,465 0.95%
Exxon Mobil Corp 392 32,497 0.89%
Royal Dutch Shell Plc - Class B 956 31,243 0.86%
CVS Health Corp 333 24,524 0.67%
Medtronic Plc 293 23,209 0.64%
PG&E Corp 364 22,509 0.62%
Novartis AG 286 21,272 0.58%
Carnival Corp 333 20,511 0.56%
Walgreens Boots Alliance Inc 262 19,589 0.54%
Walmart Inc 250 19,546 0.54%
Nestle SA 247 19,193 0.53%
Orange SA 1,165 18,872 0.52%
Walt Disney Co 168 18,638 0.51%
LafargeHolcim Ltd 328 18,532 0.51%
Chevron Corp 154 18,055 0.50%
WEC Energy Group Inc 274 17,770 0.49%
Wharf Holdings Ltd 2,000 17,129 0.47%
Banco Santander SA 2,825 16,998 0.47%
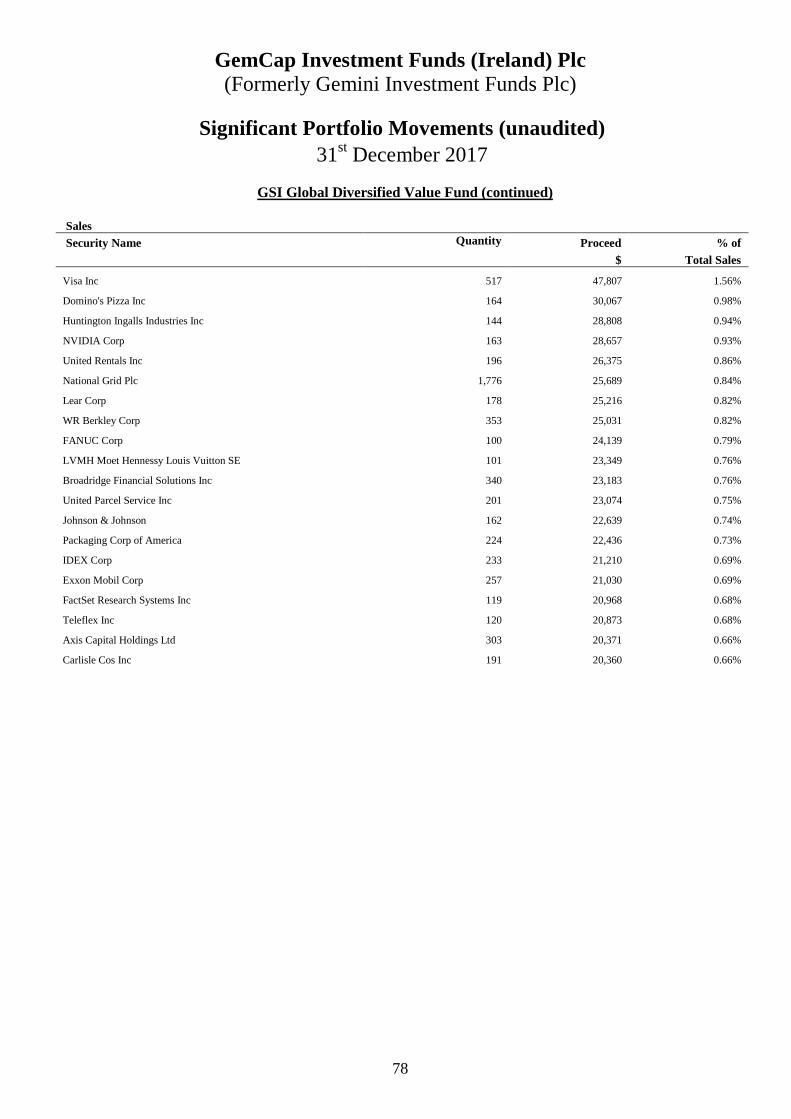
GemCap Investment Funds (Ireland) Plc (Formerly Gemini Investment Funds Plc)
78
Significant Portfolio Movements (unaudited) 31st December 2017
GSI Global Diversified Value Fund (continued)
Sales
Security Name Quantity Proceed % of $ Total Sales
Visa Inc 517 47,807 1.56%
Domino's Pizza Inc 164 30,067 0.98%
Huntington Ingalls Industries Inc 144 28,808 0.94%
NVIDIA Corp 163 28,657 0.93%
United Rentals Inc 196 26,375 0.86%
National Grid Plc 1,776 25,689 0.84%
Lear Corp 178 25,216 0.82%
WR Berkley Corp 353 25,031 0.82%
FANUC Corp 100 24,139 0.79%
LVMH Moet Hennessy Louis Vuitton SE 101 23,349 0.76%
Broadridge Financial Solutions Inc 340 23,183 0.76%
United Parcel Service Inc 201 23,074 0.75%
Johnson & Johnson 162 22,639 0.74%
Packaging Corp of America 224 22,436 0.73%
IDEX Corp 233 21,210 0.69%
Exxon Mobil Corp 257 21,030 0.69%
FactSet Research Systems Inc 119 20,968 0.68%
Teleflex Inc 120 20,873 0.68%
Axis Capital Holdings Ltd 303 20,371 0.66%
Carlisle Cos Inc 191 20,360 0.66%
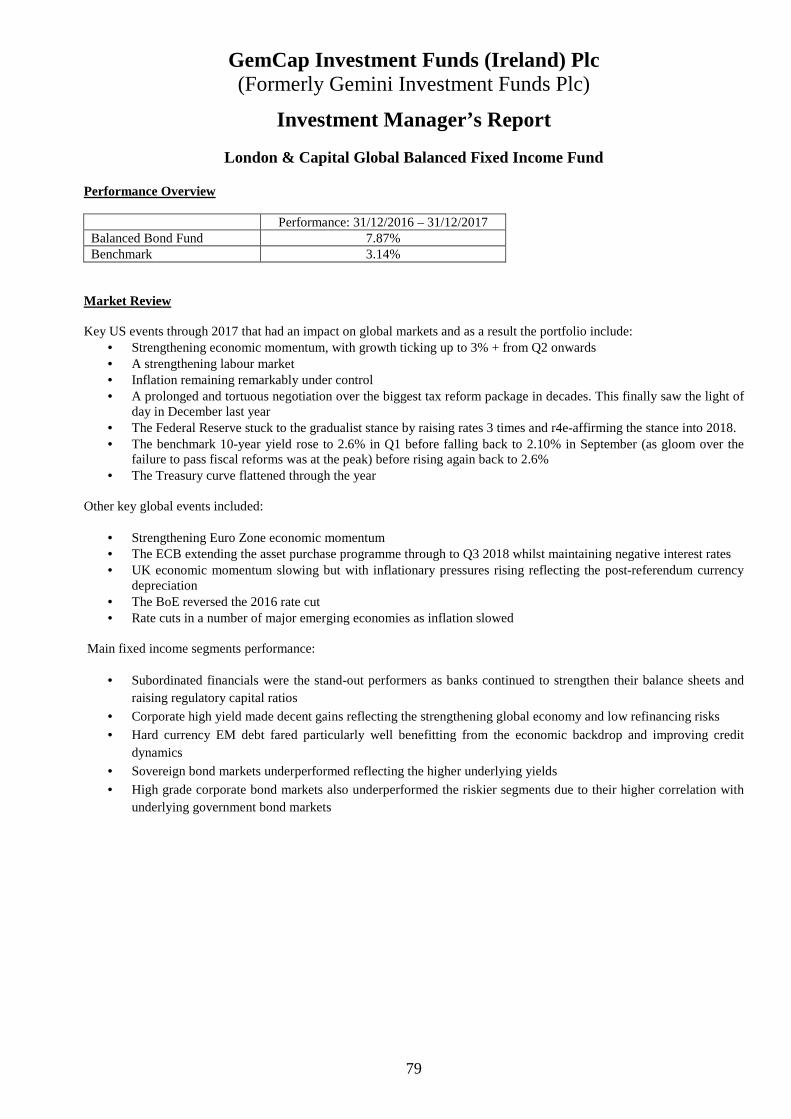
GemCap Investment Funds (Ireland) Plc (Formerly Gemini Investment Funds Plc)
79
Investment Manager’s Report
London & Capital Global Balanced Fixed Income Fund Performance Overview Performance: 31/12/2016 – 31/12/2017 Balanced Bond Fund 7.87% Benchmark 3.14%
Market Review Key US events through 2017 that had an impact on global markets and as a result the portfolio include:
• Strengthening economic momentum, with growth ticking up to 3% + from Q2 onwards • A strengthening labour market • Inflation remaining remarkably under control • A prolonged and tortuous negotiation over the biggest tax reform package in decades. This finally saw the light of
day in December last year • The Federal Reserve stuck to the gradualist stance by raising rates 3 times and r4e-affirming the stance into 2018. • The benchmark 10-year yield rose to 2.6% in Q1 before falling back to 2.10% in September (as gloom over the
failure to pass fiscal reforms was at the peak) before rising again back to 2.6% • The Treasury curve flattened through the year
Other key global events included:
• Strengthening Euro Zone economic momentum • The ECB extending the asset purchase programme through to Q3 2018 whilst maintaining negative interest rates • UK economic momentum slowing but with inflationary pressures rising reflecting the post-referendum currency
depreciation • The BoE reversed the 2016 rate cut • Rate cuts in a number of major emerging economies as inflation slowed
Main fixed income segments performance:
• Subordinated financials were the stand-out performers as banks continued to strengthen their balance sheets and raising regulatory capital ratios
• Corporate high yield made decent gains reflecting the strengthening global economy and low refinancing risks
• Hard currency EM debt fared particularly well benefitting from the economic backdrop and improving credit dynamics
• Sovereign bond markets underperformed reflecting the higher underlying yields
• High grade corporate bond markets also underperformed the riskier segments due to their higher correlation with underlying government bond markets

GemCap Investment Funds (Ireland) Plc (Formerly Gemini Investment Funds Plc)
80
Investment Manager’s Report (Continued)
London & Capital Global Balanced Fixed Income Fund (Continued)
Performance Review The USD X share class was up by 7.87% well ahead of the stated benchmark and the wider global bond indicies. The portfolio was positioned appropriately to benefit from the improving economic backdrop and the resultant rally in risk markets. The out-performance was from 3 key areas: (1) The exposure to financials and in particular AT1 debt. This is primarily focussed upon the G-SIFIs’. Credit spreads
narrowed throughout the year as balance sheets were strengthened across the US and Europe. Legacy debt also performed well. Stand-out names included HSBC, Nordea, Svenska and BNP.
(2) The exposure to hard currency and local currency EM debt payed off as Brazil and India in particular rallied. In India corporates such as Vedanta, Jaguar Land Rover (Tata Motors), Axis Bank and State Bank of India stood out. In Brazil the holdings in Banco do Brasil, Petrobras and Vale benefitted from the improving credit backdrop. Exposure to Argentina and Greece also performed well.
(3) Corporate hybrid exposure to utilities performed well, with names such as EDF, RWE, Orange and VW standing out. (4) Duration management through both security selection and the use of derivative overlays clearly played a part in the
overall performance of the fund. Outlook As we enter 2018, global economic prospects seem the rosiest for over a decade with synchronised expansion across all major regions. Additionally, in the US the fiscal package has finally been implemented and at least the early signs are positive for growth and markets. The on-going political, monetary and valuation concerns continue to be outweighed by the underlying shift in economic momentum. Following on from the last quarter when we focussed on the risk of Central bank tightening this quarter we flesh this out further examining what this means in reality and examine the likely path for major Central banks. On balance, we do not expect the gradual erosion of the Fed’s balance sheet to materially disrupt markets particularly as the ECB and the Bank of Japan will continue to expand their balance sheets through this year. However, we do acknowledge the fact that over time Central Banks will be less accommodative, as they either reduce their balance sheets or buy assets at a slower pace will pose a challenge for all markets and will inevitably reduce the projected returns over the medium-term. In contrast, as inflationary pressures have remained in check even with the economic upturn it has given the Central Banks an opportunity to keep policy extremely accommodative, however, the risk is that inflation may drift higher this year. Overall, we retain our view that the cyclical upturn has gained strength but also note that key structural undercurrents are increasingly being ignored. This document will cover our main views and the implications for asset classes. Looking ahead into 2018 and early 2019, the outlook will be more challenging for the major sovereign bond markets and as a result duration management will be critical in protecting the potential positive returns from credit markets. In essence interest rate management will take centre stage due to two potential risks; higher inflation and faster monetary tightening. However, faster economic growth and rising equity markets should be supportive of credit markets. Overall, we remain constructive towards credit markets albeit with the likelihood of a greater dispersion in expected returns. A more bearish credit view from our perspective requires a turn in the default cycle (driven by a deterioration in state of the economy and underlying leverage). This is not on the cards over the next year or so.
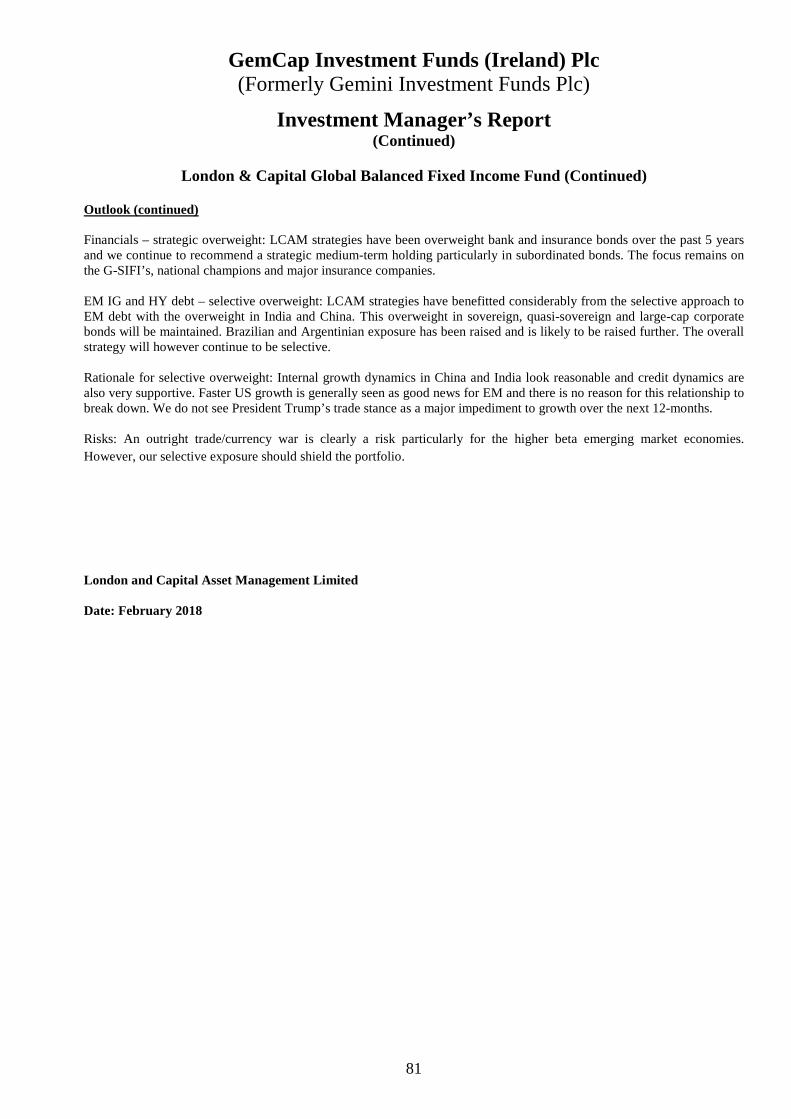
GemCap Investment Funds (Ireland) Plc (Formerly Gemini Investment Funds Plc)
81
Investment Manager’s Report (Continued)
London & Capital Global Balanced Fixed Income Fund (Continued)
Outlook (continued) Financials – strategic overweight: LCAM strategies have been overweight bank and insurance bonds over the past 5 years and we continue to recommend a strategic medium-term holding particularly in subordinated bonds. The focus remains on the G-SIFI’s, national champions and major insurance companies. EM IG and HY debt – selective overweight: LCAM strategies have benefitted considerably from the selective approach to EM debt with the overweight in India and China. This overweight in sovereign, quasi-sovereign and large-cap corporate bonds will be maintained. Brazilian and Argentinian exposure has been raised and is likely to be raised further. The overall strategy will however continue to be selective. Rationale for selective overweight: Internal growth dynamics in China and India look reasonable and credit dynamics are also very supportive. Faster US growth is generally seen as good news for EM and there is no reason for this relationship to break down. We do not see President Trump’s trade stance as a major impediment to growth over the next 12-months. Risks: An outright trade/currency war is clearly a risk particularly for the higher beta emerging market economies. However, our selective exposure should shield the portfolio.
London and Capital Asset Management Limited Date: February 2018

GemCap Investment Funds (Ireland) Plc (Formerly Gemini Investment Funds Plc)
82
Statement of Financial Position as at 31st December 2017 and 2016
L&CGBFI L&CGBFI 31 Dec 2017 31 Dec 2016 Note $ $
ASSETS Financial Assets at Fair Value through Profit or Loss:
Investments in Transferable Securities 3 89,174,550 74,741,117 Investments in Financial Derivative Instruments 3 690,905 1,020,128
Cash at bank 5 2,197,582 6,289,153 Dividends and interest receivable 1,225,494 1,132,419 Amount receivable on subscriptions 150,163 128,701 Other receivables 27 8,932
TOTAL ASSETS 93,438,721 83,320,450 LIABILITIES Financial Liabilities at Fair Value through Profit or Loss:
Investments in Financial Derivative Instruments 57,616 - Bank overdraft 3 - 1 Investment management fees payable 5 17,382 19,968 Manager fee payable 7 5,879 - Administration fees payable 7 4,762 7,957 Transfer agency fees payable 7 1,400 10,197 Directors fees payable 7 884 547 Depositary and depositary oversight fees payable 7 1,867 11,060 Audit fees payable 6,334 4,613 Redemptions payable 2,372 1,235,351 Other fees payable 35,335 14,546 TOTAL LIABILITIES (excluding net assets attributable to ho lders of redeemable participating shares) 133,831 1,304,240
NET ASSETS ATTRIBUTABLE TO HOLDERS OF REDEEMABLE PARTICIPATING SHARES 93,304,890 82,016,210 The accompanying notes and schedules form an integral part of these financial statements.

GemCap Investment Funds (Ireland) Plc (Formerly Gemini Investment Funds Plc)
83
Statement of Comprehensive Income for the Financial Year Ended 31st December 2017 and 2016
L&CGBFI L&CGBFI
2017 2016 Note $ $
INCOME Bond interest income 3,638,176 4,479,074 Net realised and unrealised gain/(loss) on financial assets and liabilities at fair value through profit or loss 9 8,439,145 (15,408,275) Bank Interest 9,668 11 Other income 19,081 27 TOTAL INVESTMENT INCOME/(LOSS) 12,106,070 (10,929,163) EXPENSES Investment management fees 7 219,373 291,330 Manager fees 7 29,648 - Administration fees 7 78,951 121,161 Director fees 7 12,128 22,047 Depositary and depositary oversight fees 7 40,979 38,484 Audit fees 7 8,562 14,612 Transfer agency fees 7 15,905 27,189 Swap interest 526 - Other fees and expenses 7 81,365 141,249 Total Operating Expenses 487,437 656,072 Operating Profit/(Loss) 11,618,633 (11,585,235) Finance Costs Dividends to holders of redeemable participating shares 2,449,279 1,781,805 Profit/(Loss) Before Tax 9,169,354 (13,367,040) Withholding tax 18,733 91,273 Increase/(Decrease) in net assets attributable to holders of redeemable participating shares from operations 9,150,621 (13,458,313) The accompanying notes and schedules form an integral part of these financial statements. All of the results for the financial year relate to continuing operations.
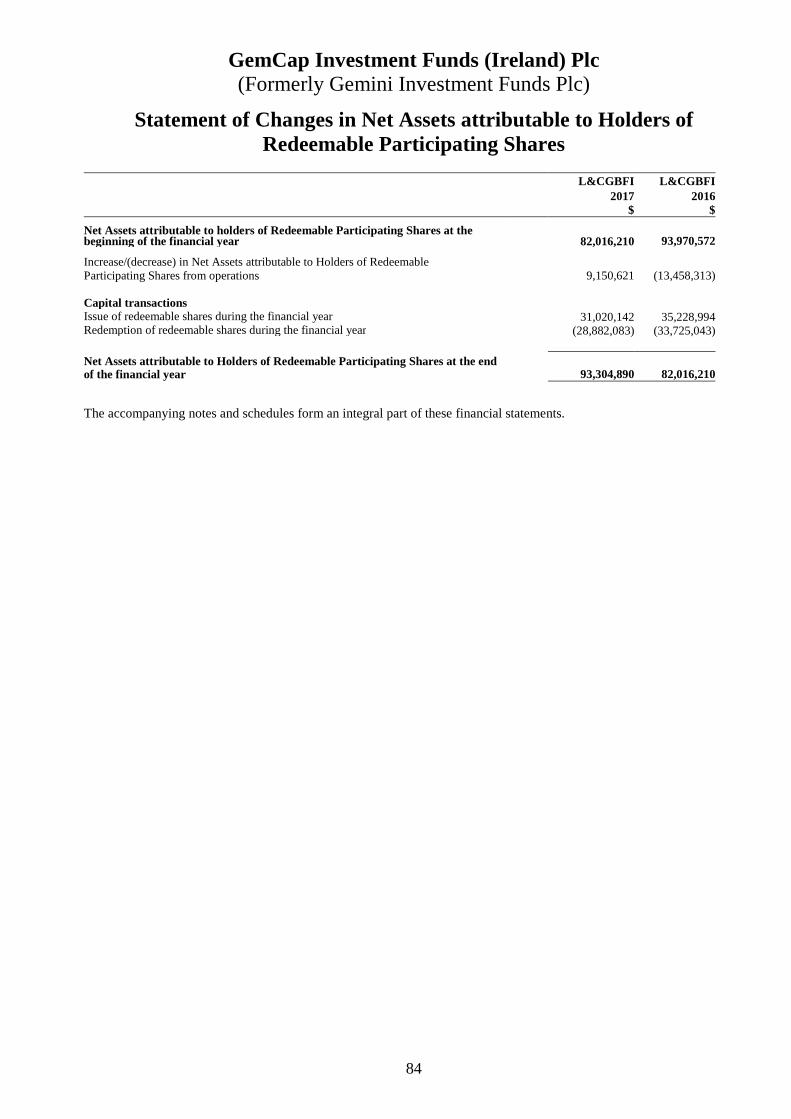
GemCap Investment Funds (Ireland) Plc (Formerly Gemini Investment Funds Plc)
84
Statement of Changes in Net Assets attributable to Holders of Redeemable Participating Shares
The accompanying notes and schedules form an integral part of these financial statements.
L&CGBFI L&CGBFI 2017 2016
$ $ Net Assets attributable to holders of Redeemable Participating Shares at the beginning of the financial year
82,016,210 93,970,572
Increase/(decrease) in Net Assets attributable to Holders of Redeemable Participating Shares from operations 9,150,621 (13,458,313) Capital transactions Issue of redeemable shares during the financial year 31,020,142 35,228,994Redemption of redeemable shares during the financial year (28,882,083) (33,725,043)
Net Assets attributable to Holders of Redeemable Participating Shares at the end of the financial year
93,304,890 82,016,210

GemCap Investment Funds (Ireland) Plc (Formerly Gemini Investment Funds Plc)
85
Statement of Cash Flows
L&CGBFI L&CGBFI 2017 2016 $ $ Cash flows from operating activities Increase/(Decrease) in Net Assets attributable to Holders of Redeemable Participating Shares from operations 9,150,621 (13,458,313) Adjustment to reconcile increase/(decrease) in net assets attributable to holders of redeemable participating shares from operations to cash (used in)/provided by operating activities Bond interest income (3,638,176) (4,479,074) Tax expense 18,733 91,273 Dividends to holders of redeemable participating shares 2,449,279 1,781,805 Operating profit/(loss) before working capital changes 7,980,457 (16,064,309) Changes in operating assets and liabilities Net (increase)/decrease in financial assets and liabilities at fair value (14,046,594) 16,184,804 (Increase)/decrease in other receivables (12,557) 901,691 (Decrease)/Increase in payables (1,228,024) 987,807 Cash (used in)/provided by operating activities (7,306,718) 2,009,993
Interest received 3,545,101 4,715,096 Taxation paid (18,733) (91,273) Net cash (used in)/provided by operating activities (3,780,350) 6,633,816 Cash flows from financing activities Proceeds from issue of redeemable participating shares 31,020,142 35,228,994 Payment on redemptions of redeemable participating shares (28,882,083) (33,725,043) Dividends to holders of redeemable participating shares (2,449,279) (1,781,805) Net cash used in financing activities (311,220) (277,854)
Net (decrease)/increase in cash (4,091,570) 6,355,962
Net Cash at the start of the financial year 6,289,152 (66,810)
Net Cash at the end of the financial year 2,197,582 6,289,152
Analysis of Cash Cash at the start of the financial year 6,289,153 596,347 Overdraft at the start of the financial year (1) (663,157) Cash at the end of the financial year 2,197,582 6,289,153 Overdraft at the end of the financial year - (1) The accompanying notes and schedules form an integral part of these financial statements.
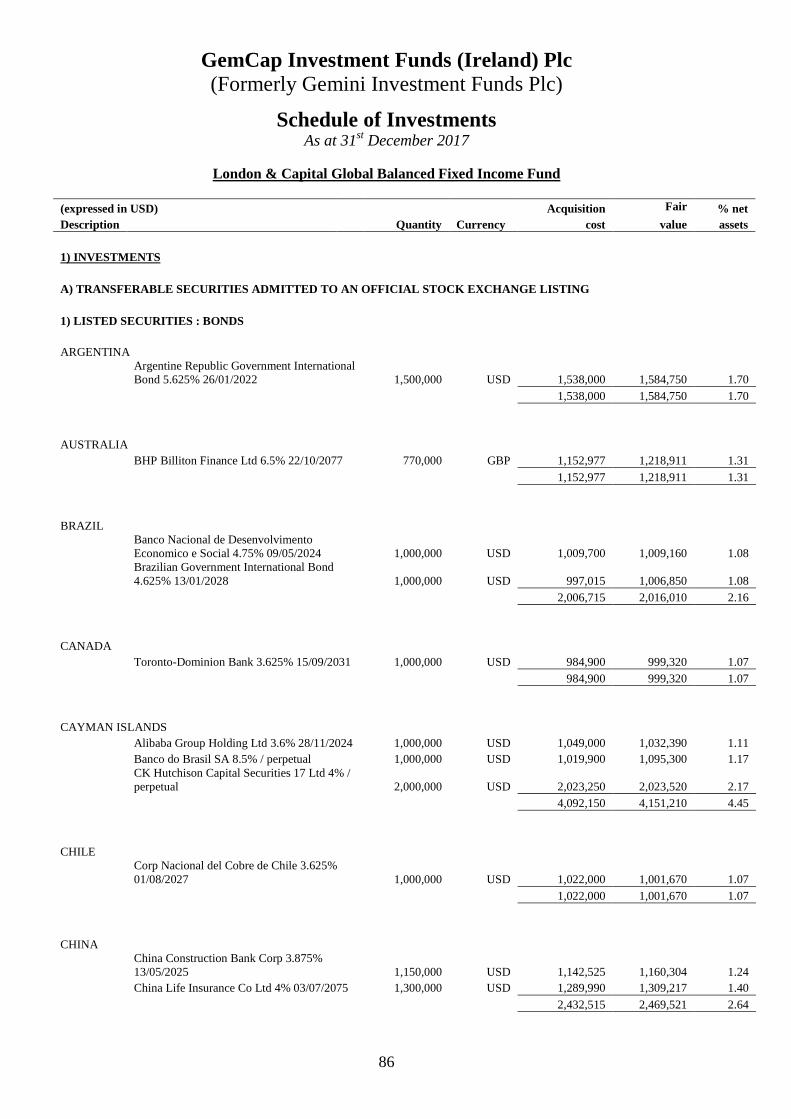
GemCap Investment Funds (Ireland) Plc (Formerly Gemini Investment Funds Plc)
86
Schedule of Investments As at 31st December 2017
London & Capital Global Balanced Fixed Income Fund
(expressed in USD) Acquisition Fair % net Description Quantity Currency cost value assets
1) INVESTMENTS
A) TRANSFERABLE SECURITIES ADMITTED TO AN OFFICIAL STOCK EXCHANGE LISTING
1) LISTED SECURITIES : BONDS
ARGENTINA Argentine Republic Government International Bond 5.625% 26/01/2022 1,500,000 USD 1,538,000 1,584,750 1.70
1,538,000 1,584,750 1.70
AUSTRALIA BHP Billiton Finance Ltd 6.5% 22/10/2077 770,000 GBP 1,152,977 1,218,911 1.31
1,152,977 1,218,911 1.31
BRAZIL Banco Nacional de Desenvolvimento Economico e Social 4.75% 09/05/2024 1,000,000 USD 1,009,700 1,009,160 1.08 Brazilian Government International Bond 4.625% 13/01/2028 1,000,000 USD 997,015 1,006,850 1.08
2,006,715 2,016,010 2.16
CANADA Toronto-Dominion Bank 3.625% 15/09/2031 1,000,000 USD 984,900 999,320 1.07
984,900 999,320 1.07
CAYMAN ISLANDS Alibaba Group Holding Ltd 3.6% 28/11/2024 1,000,000 USD 1,049,000 1,032,390 1.11 Banco do Brasil SA 8.5% / perpetual 1,000,000 USD 1,019,900 1,095,300 1.17 CK Hutchison Capital Securities 17 Ltd 4% / perpetual 2,000,000 USD 2,023,250 2,023,520 2.17
4,092,150 4,151,210 4.45
CHILE Corp Nacional del Cobre de Chile 3.625% 01/08/2027 1,000,000 USD 1,022,000 1,001,670 1.07
1,022,000 1,001,670 1.07
CHINA China Construction Bank Corp 3.875% 13/05/2025 1,150,000 USD 1,142,525 1,160,304 1.24 China Life Insurance Co Ltd 4% 03/07/2075 1,300,000 USD 1,289,990 1,309,217 1.40
2,432,515 2,469,521 2.64
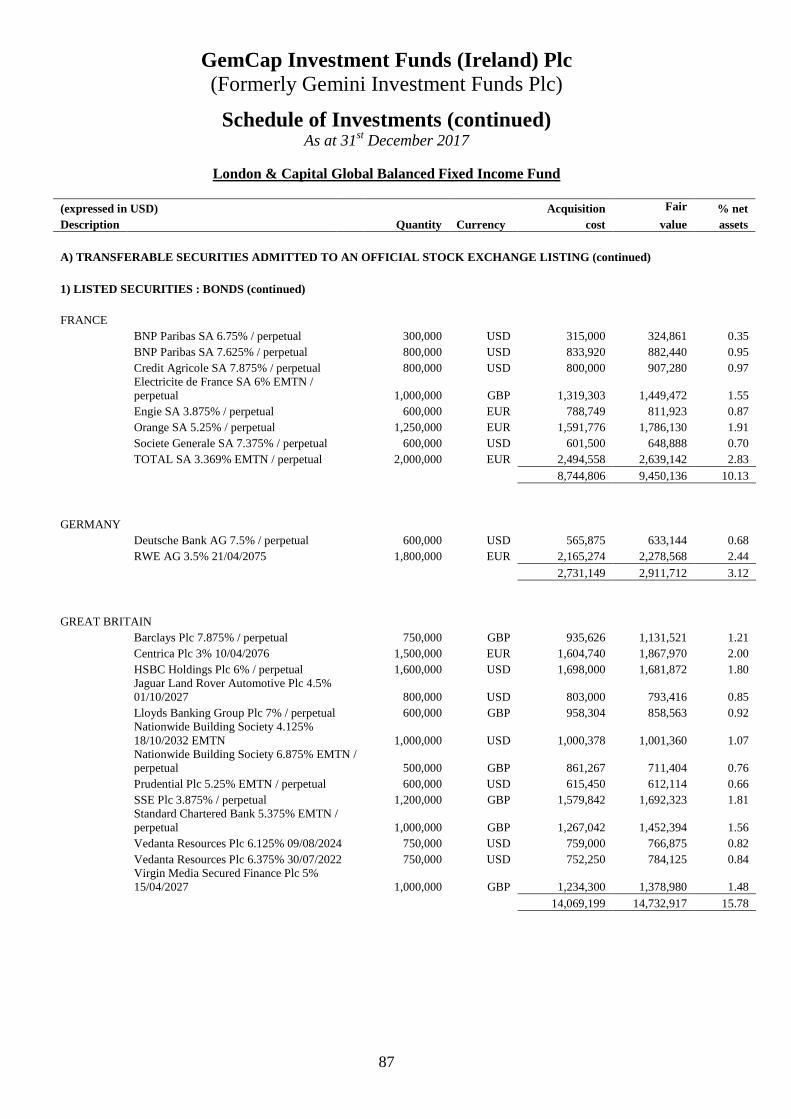
GemCap Investment Funds (Ireland) Plc (Formerly Gemini Investment Funds Plc)
87
Schedule of Investments (continued) As at 31st December 2017
London & Capital Global Balanced Fixed Income Fund
(expressed in USD) Acquisition Fair % net Description Quantity Currency cost value assets
A) TRANSFERABLE SECURITIES ADMITTED TO AN OFFICIAL STOCK EXCHANGE LISTING (continued)
1) LISTED SECURITIES : BONDS (continued)
FRANCE BNP Paribas SA 6.75% / perpetual 300,000 USD 315,000 324,861 0.35 BNP Paribas SA 7.625% / perpetual 800,000 USD 833,920 882,440 0.95 Credit Agricole SA 7.875% / perpetual 800,000 USD 800,000 907,280 0.97 Electricite de France SA 6% EMTN / perpetual 1,000,000 GBP 1,319,303 1,449,472 1.55 Engie SA 3.875% / perpetual 600,000 EUR 788,749 811,923 0.87 Orange SA 5.25% / perpetual 1,250,000 EUR 1,591,776 1,786,130 1.91 Societe Generale SA 7.375% / perpetual 600,000 USD 601,500 648,888 0.70 TOTAL SA 3.369% EMTN / perpetual 2,000,000 EUR 2,494,558 2,639,142 2.83
8,744,806 9,450,136 10.13
GERMANY Deutsche Bank AG 7.5% / perpetual 600,000 USD 565,875 633,144 0.68 RWE AG 3.5% 21/04/2075 1,800,000 EUR 2,165,274 2,278,568 2.44
2,731,149 2,911,712 3.12
GREAT BRITAIN Barclays Plc 7.875% / perpetual 750,000 GBP 935,626 1,131,521 1.21 Centrica Plc 3% 10/04/2076 1,500,000 EUR 1,604,740 1,867,970 2.00 HSBC Holdings Plc 6% / perpetual 1,600,000 USD 1,698,000 1,681,872 1.80 Jaguar Land Rover Automotive Plc 4.5% 01/10/2027 800,000 USD 803,000 793,416 0.85 Lloyds Banking Group Plc 7% / perpetual 600,000 GBP 958,304 858,563 0.92 Nationwide Building Society 4.125% 18/10/2032 EMTN 1,000,000 USD 1,000,378 1,001,360 1.07 Nationwide Building Society 6.875% EMTN / perpetual 500,000 GBP 861,267 711,404 0.76 Prudential Plc 5.25% EMTN / perpetual 600,000 USD 615,450 612,114 0.66 SSE Plc 3.875% / perpetual 1,200,000 GBP 1,579,842 1,692,323 1.81 Standard Chartered Bank 5.375% EMTN / perpetual 1,000,000 GBP 1,267,042 1,452,394 1.56 Vedanta Resources Plc 6.125% 09/08/2024 750,000 USD 759,000 766,875 0.82 Vedanta Resources Plc 6.375% 30/07/2022 750,000 USD 752,250 784,125 0.84 Virgin Media Secured Finance Plc 5% 15/04/2027 1,000,000 GBP 1,234,300 1,378,980 1.48
14,069,199 14,732,917 15.78

GemCap Investment Funds (Ireland) Plc (Formerly Gemini Investment Funds Plc)
88
Schedule of Investments (continued) As at 31st December 2017
London & Capital Global Balanced Fixed Income Fund
(expressed in USD) Acquisition Fair % net Description Quantity Currency cost value assets
A) TRANSFERABLE SECURITIES ADMITTED TO AN OFFICIAL STOCK EXCHANGE LISTING (continued)
1) LISTED SECURITIES : BONDS (continued)
INDIA Bharti Airtel Ltd 4.375% 10/06/2025 1,500,000 USD 1,531,350 1,525,890 1.64 Canara Bank/London 3.25% 10/08/2022 EMTN 1,000,000 USD 997,300 995,640 1.07 ICICI Bank Ltd 4% 18/03/2026 EMTN 1,000,000 USD 1,032,000 1,012,140 1.08 NTPC Ltd 7.375% 10/08/2021 EMTN 150,000,000 INR 2,346,375 2,389,216 2.56 Oil India Ltd 5.375% 17/04/2024 1,250,000 USD 1,374,000 1,383,950 1.48 Reliance Industries Ltd 4.125% 28/01/2025 1,000,000 USD 1,056,780 1,037,030 1.11
8,337,805 8,343,866 8.94
IRELAND Bank of Ireland 7.375% / perpetual 300,000 EUR 331,984 404,658 0.43
331,984 404,658 0.43
ITALY Enel SpA 6.625% 15/09/2076 800,000 GBP 1,152,747 1,247,409 1.34
1,152,747 1,247,409 1.34
JAPAN SoftBank Group Corp 6% / perpetual 500,000 USD 504,950 495,205 0.53
504,950 495,205 0.53
MEXICO Petroleos Mexicanos 1.875% 21/04/2022 EMTN 600,000 EUR 646,722 741,388 0.79 Petroleos Mexicanos 4.5% 23/01/2026 900,000 USD 867,270 900,351 0.96 Petroleos Mexicanos 5.375% 13/03/2022 1,000,000 USD 1,012,000 1,063,330 1.14
2,525,992 2,705,069 2.89
NETHERLANDS Cooperatieve Rabobank UA 5.5% / perpetual 1,100,000 EUR 1,231,893 1,434,581 1.54 Petrobras Global Finance BV 6.125% 17/01/2022 1,500,000 USD 1,560,000 1,594,590 1.71 Volkswagen International Finance NV 2.7% / perpetual 1,600,000 EUR 1,800,620 1,982,934 2.13
4,592,513 5,012,105 5.38
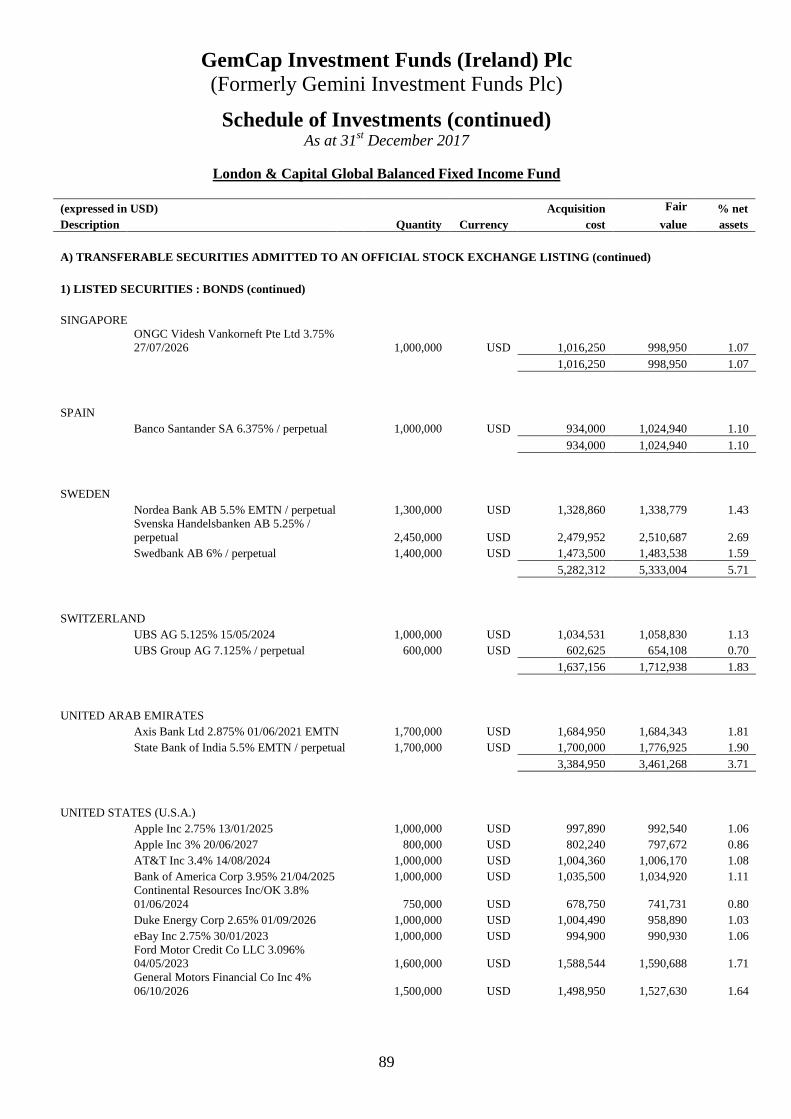
GemCap Investment Funds (Ireland) Plc (Formerly Gemini Investment Funds Plc)
89
Schedule of Investments (continued) As at 31st December 2017
London & Capital Global Balanced Fixed Income Fund
(expressed in USD) Acquisition Fair % net Description Quantity Currency cost value assets
A) TRANSFERABLE SECURITIES ADMITTED TO AN OFFICIAL STOCK EXCHANGE LISTING (continued)
1) LISTED SECURITIES : BONDS (continued)
SINGAPORE ONGC Videsh Vankorneft Pte Ltd 3.75% 27/07/2026 1,000,000 USD 1,016,250 998,950 1.07
1,016,250 998,950 1.07
SPAIN Banco Santander SA 6.375% / perpetual 1,000,000 USD 934,000 1,024,940 1.10
934,000 1,024,940 1.10
SWEDEN Nordea Bank AB 5.5% EMTN / perpetual 1,300,000 USD 1,328,860 1,338,779 1.43 Svenska Handelsbanken AB 5.25% / perpetual 2,450,000 USD 2,479,952 2,510,687 2.69 Swedbank AB 6% / perpetual 1,400,000 USD 1,473,500 1,483,538 1.59
5,282,312 5,333,004 5.71
SWITZERLAND UBS AG 5.125% 15/05/2024 1,000,000 USD 1,034,531 1,058,830 1.13 UBS Group AG 7.125% / perpetual 600,000 USD 602,625 654,108 0.70
1,637,156 1,712,938 1.83
UNITED ARAB EMIRATES Axis Bank Ltd 2.875% 01/06/2021 EMTN 1,700,000 USD 1,684,950 1,684,343 1.81 State Bank of India 5.5% EMTN / perpetual 1,700,000 USD 1,700,000 1,776,925 1.90
3,384,950 3,461,268 3.71
UNITED STATES (U.S.A.) Apple Inc 2.75% 13/01/2025 1,000,000 USD 997,890 992,540 1.06 Apple Inc 3% 20/06/2027 800,000 USD 802,240 797,672 0.86 AT&T Inc 3.4% 14/08/2024 1,000,000 USD 1,004,360 1,006,170 1.08 Bank of America Corp 3.95% 21/04/2025 1,000,000 USD 1,035,500 1,034,920 1.11 Continental Resources Inc/OK 3.8% 01/06/2024 750,000 USD 678,750 741,731 0.80 Duke Energy Corp 2.65% 01/09/2026 1,000,000 USD 1,004,490 958,890 1.03 eBay Inc 2.75% 30/01/2023 1,000,000 USD 994,900 990,930 1.06 Ford Motor Credit Co LLC 3.096% 04/05/2023 1,600,000 USD 1,588,544 1,590,688 1.71 General Motors Financial Co Inc 4% 06/10/2026 1,500,000 USD 1,498,950 1,527,630 1.64

GemCap Investment Funds (Ireland) Plc (Formerly Gemini Investment Funds Plc)
90
Schedule of Investments (continued) As at 31st December 2017
London & Capital Global Balanced Fixed Income Fund
(expressed in USD) Acquisition Fair % net Description Quantity Currency cost value assets
A) TRANSFERABLE SECURITIES ADMITTED TO AN OFFICIAL STOCK EXCHANGE LISTING (continued)
1) LISTED SECURITIES : BONDS (continued)
UNITED STATES (U.S.A.) (continued) JPMorgan Chase & Co 3.375% 01/05/2023 500,000 USD 498,820 508,940 0.55 Morgan Stanley 4.1% 22/05/2023 1,400,000 USD 1,462,830 1,460,592 1.57 Prudential Financial Inc 5.875% 15/09/2042 1,200,000 USD 1,290,000 1,312,500 1.41 T-Mobile USA Inc 6.5% 15/01/2026 1,000,000 USD 1,097,500 1,094,090 1.17 United States Treasury Note/Bond 1% 15/10/2019 1,700,000 USD 1,680,875 1,674,302 1.79
15,635,649 15,691,595 16.84
TOTAL LISTED SECURITIES : BONDS 84,110,719 86,967,164 93.20
TOTAL TRANSFERABLE SECURITIES ADMITTED TO AN OFFICIAL STOCK EXCHANGE LISTING 84,110,719 86,967,164 93.20
B) OTHER TRANSFERABLE SECURITIES DEALT ON AN OTHER REGULATED MARKET
1) OTHER ORGANISED MARKET : BONDS
CANADA Transcanada Trust 4.65% 18/05/2077 1,250,000 CAD 942,291 995,590 1.07
942,291 995,590 1.07
CAYMAN ISLANDS Itau Unibanco Holding SA/Cayman Island 6.125% EMTN 1,200,000 USD 1,208,330 1,211,796 1.30
1,208,330 1,211,796 1.30
TOTAL OTHER ORGANISED MARKET : BONDS 2,150,621 2,207,386 2.37
TOTAL OTHER TRANSFERABLE SECURITIES DEALT ON AN OTHER REGULATED MARKET 2,150,621 2,207,386 2.37
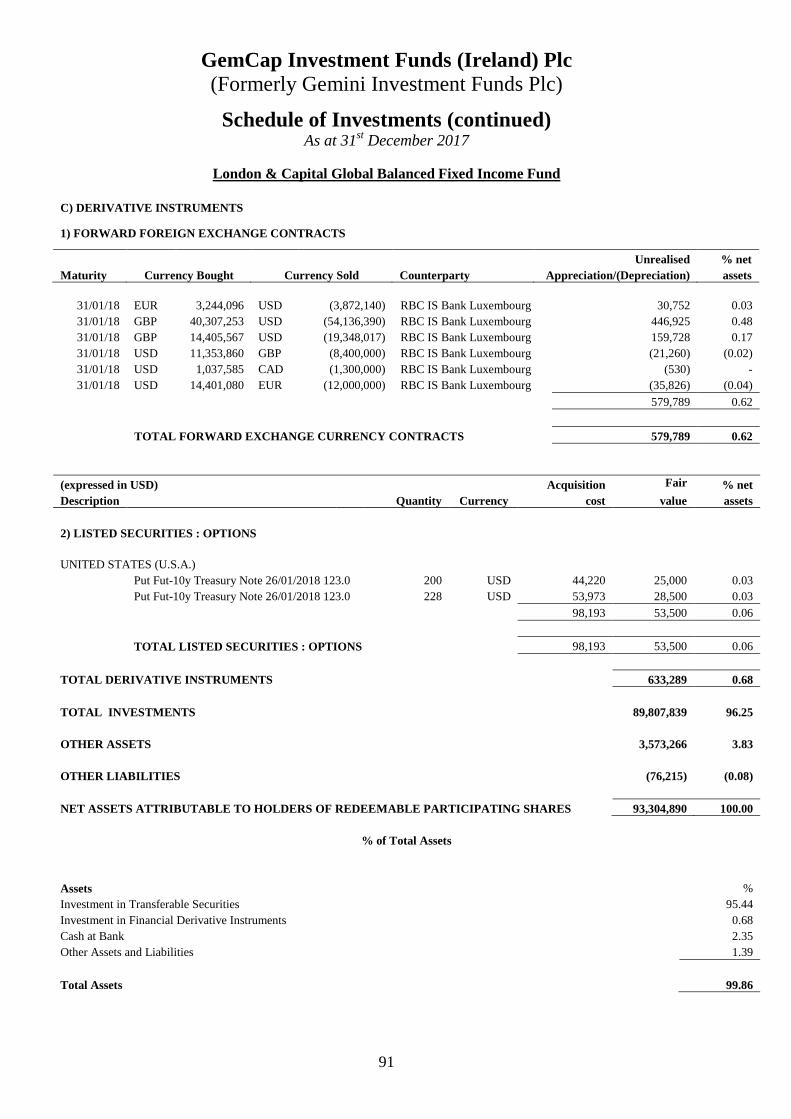
GemCap Investment Funds (Ireland) Plc (Formerly Gemini Investment Funds Plc)
91
Schedule of Investments (continued) As at 31st December 2017
London & Capital Global Balanced Fixed Income Fund
C) DERIVATIVE INSTRUMENTS
1) FORWARD FOREIGN EXCHANGE CONTRACTS
Unrealised % net Maturity Currency Bought Currency Sold Counterparty Appreciation/(Depreciation) assets
31/01/18 EUR 3,244,096 USD (3,872,140) RBC IS Bank Luxembourg 30,752 0.03 31/01/18 GBP 40,307,253 USD (54,136,390) RBC IS Bank Luxembourg 446,925 0.48 31/01/18 GBP 14,405,567 USD (19,348,017) RBC IS Bank Luxembourg 159,728 0.17 31/01/18 USD 11,353,860 GBP (8,400,000) RBC IS Bank Luxembourg (21,260) (0.02) 31/01/18 USD 1,037,585 CAD (1,300,000) RBC IS Bank Luxembourg (530) - 31/01/18 USD 14,401,080 EUR (12,000,000) RBC IS Bank Luxembourg (35,826) (0.04)
579,789 0.62
TOTAL FORWARD EXCHANGE CURRENCY CONTRACTS 579,789 0.62
(expressed in USD) Acquisition Fair % net Description Quantity Currency cost value assets
2) LISTED SECURITIES : OPTIONS
UNITED STATES (U.S.A.) Put Fut-10y Treasury Note 26/01/2018 123.0 200 USD 44,220 25,000 0.03 Put Fut-10y Treasury Note 26/01/2018 123.0 228 USD 53,973 28,500 0.03
98,193 53,500 0.06
TOTAL LISTED SECURITIES : OPTIONS 98,193 53,500 0.06
TOTAL DERIVATIVE INSTRUMENTS 633,289 0.68
TOTAL INVESTMENTS 89,807,839 96.25
OTHER ASSETS 3,573,266 3.83
OTHER LIABILITIES (76,215) (0.08)
NET ASSETS ATTRIBUTABLE TO HOLDERS OF REDEEMABLE PARTICIPATING SHARES 93,304,890 100.00
% of Total Assets
Assets % Investment in Transferable Securities 95.44 Investment in Financial Derivative Instruments 0.68 Cash at Bank 2.35 Other Assets and Liabilities 1.39
Total Assets 99.86

GemCap Investment Funds (Ireland) Plc (Formerly Gemini Investment Funds Plc)
92
Significant Portfolio Movements (unaudited) 31st December 2017
London & Capital Global Balanced Fixed Income Fund
Purchases Security Name Quantity Cost % of $ Total Purchases
Continental Resources Inc/OK 3.8% 21/03/2025 3,000,000 2,769,375 3.25%
TOTAL SA 3.369% EMTN / perpetual 2,000,000 2,494,558 2.92%
NTPC Ltd 7.375% 30/05/2022 EMTN 150,000,000 2,346,375 2.74%
TOTAL SA 3.875% EMTN / perpetual 2,000,000 2,268,123 2.65%
Morgan Stanley 4.1% 10/03/2024 2,100,000 2,186,910 2.56%
RWE AG 3.5% 08/02/2076 1,800,000 2,165,274 2.53%
CK Hutchison Capital Securities 17 Ltd 4% / perpetual 2,000,000 2,023,250 2.37%
RWE AG 2.75% 08/02/2076 1,800,000 1,988,316 2.33%
Volkswagen International Finance NV 2.7% / perpetual 1,600,000 1,800,620 2.11%
HSBC Holdings Plc 6.875% / perpetual 1,600,000 1,721,750 2.01%
United States Treasury Note/Bond 2.125% 20/05/2025 1,700,000 1,713,879 2.00%
HSBC Holdings Plc 6% / perpetual 1,600,000 1,698,000 1.99%
Svenska Handelsbanken AB 5.25% / perpetual 1,650,000 1,688,510 1.98%
United States Treasury Note/Bond 1% 03/08/2020 1,700,000 1,680,875 1.97%
Reckitt Benckiser Treasury Services Plc 3% 14/04/2028 1,700,000 1,679,855 1.97%
Ford Motor Credit Co LLC 3.096% 21/02/2024 1,600,000 1,588,544 1.86%
Orange SA 5.25% / perpetual 1,250,000 1,591,776 1.86%
Petrobras Global Finance BV 6.125% 06/11/2022 1,500,000 1,560,000 1.82%
Bharti Airtel Ltd 4.375% 30/03/2026 1,500,000 1,531,350 1.79%
General Motors Financial Co Inc 4% 26/07/2027 1,500,000 1,498,950 1.75%
Swedbank AB 6% / perpetual 1,400,000 1,473,500 1.72%
Nordea Bank AB 5.5% EMTN / perpetual 1,300,000 1,328,860 1.55%
Prudential Financial Inc 5.875% 05/07/2043 1,200,000 1,290,000 1.51%
Solvay Finance SA 5.118% / perpetual 1,000,000 1,271,847 1.49%
Standard Chartered Bank 5.375% EMTN / perpetual 1,000,000 1,267,042 1.48%
Societe Generale SA 7.375% / perpetual 1,250,000 1,253,125 1.47%
Virgin Media Secured Finance Plc 5% 02/02/2028 1,000,000 1,234,300 1.44%
ITAUUNI 6,125% / perpetual 1,200,000 1,208,330 1.41%
Enel SpA 6.625% 05/07/2077 800,000 1,152,747 1.35%
BHP Billiton Finance Ltd 6.5% 11/08/2078 770,000 1,152,977 1.35%
Deutsche Bank AG 7.5% / perpetual 1,200,000 1,131,750 1.32%
T-Mobile USA Inc 6.5% 04/11/2026 1,000,000 1,097,500 1.28%
AXA SA 6.772% EMTN / perpetual 800,000 1,084,002 1.27%

GemCap Investment Funds (Ireland) Plc (Formerly Gemini Investment Funds Plc)
93
Significant Portfolio Movements (unaudited) 31st December 2017
London & Capital Global Balanced Fixed Income Fund (Continued)
Purchases Security Name Quantity Cost % of $ Total Purchases
European Bank for Reconstruction & Development 7.5% 04/10/2020 3,500,000 1,089,659 1.27%
Bombardier Inc 8.75% 20/09/2022 1,000,000 1,074,375 1.26%
Reliance Industries Ltd 4.125% 17/11/2025 1,000,000 1,056,780 1.24%
Alibaba Group Holding Ltd 3.6% 17/09/2025 1,000,000 1,049,000 1.23%
Bank of America Corp 3.95% 08/02/2026 1,000,000 1,035,500 1.21%
ICICI Bank Ltd 4% 05/01/2027 EMTN 1,000,000 1,032,000 1.21%
Corp Nacional del Cobre de Chile 3.625% 20/05/2028 1,000,000 1,022,000 1.20% Argentine Republic Government International Bond 5.625% 15/11/2022 1,000,000 1,016,000 1.19%
ONGC Videsh Vankorneft Pte Ltd 3.75% 16/05/2027 1,000,000 1,016,250 1.19% Banco Nacional de Desenvolvimento Economico e Social 4.75% 26/02/2025 1,000,000 1,009,700 1.18%
AT&T Inc 3.4% 03/06/2025 1,000,000 1,004,360 1.17%
Apple Inc 2.75% 02/11/2025 1,000,000 997,890 1.17%
Brazilian Government International Bond 4.625% 01/11/2028 1,000,000 997,015 1.17%
Nationwide Building Society 4.125% 07/08/2033 EMTN 1,000,000 1,000,378 1.17%
Canara Bank 3.25% 30/05/2023 EMTN 1,000,000 997,300 1.17%
eBay Inc 2.75% 19/11/2023 1,000,000 994,900 1.16%
Toronto-Dominion Bank 3.625% 04/07/2032 1,000,000 984,900 1.15%
Transcanada Trust 4.65% 07/03/2078 1,250,000 942,291 1.10%
Banco Santander SA 6.375% / perpetual 1,000,000 934,000 1.09%
Barclays Plc 7.875% / perpetual 750,000 935,626 1.09%
Petroleos Mexicanos 4.5% 12/11/2026 900,000 867,270 1.01%

GemCap Investment Funds (Ireland) Plc (Formerly Gemini Investment Funds Plc)
94
Significant Portfolio Movements (unaudited) 31st December 2017
London & Capital Global Balanced Fixed Income Fund (Continued)
Sales
Security Name Quantity Proceed % of $ Total Sales
TOTAL SA 3.875% EMTN / perpetual 2,000,000 2,638,204 3.39%
Solvay Finance SA 5.118% / perpetual 2,000,000 2,552,993 3.28%
RWE AG 2.75% 08/02/2076 1,800,000 2,237,606 2.87%
TOTAL SA 2.25% EMTN / perpetual 2,000,000 2,180,520 2.80%
Continental Resources Inc/OK 3.8% 21/03/2025 2,250,000 2,045,988 2.63%
HSBC Holdings Plc 6.875% / perpetual 1,600,000 1,778,567 2.28%
European Investment Bank 1.625% 04/04/2022 1,750,000 1,713,915 2.20%
Petrobras Global Finance BV 8.375% 12/03/2022 1,500,000 1,718,401 2.20%
United States Treasury Note/Bond 2.125% 20/05/2025 1,700,000 1,696,489 2.18%
Reckitt Benckiser Treasury Services Plc 3% 14/04/2028 1,700,000 1,673,083 2.15%
Qatar Government International Bond 2.375% 22/03/2022 1,650,000 1,631,982 2.09%
Ford Motor Credit Co LLC 2.597% 23/08/2020 1,600,000 1,622,941 2.08% Bharti Airtel International Netherlands BV 5.125% 29/12/2023 1,500,000 1,592,610 2.04%
BG Energy Capital Plc 6.5% 19/09/2073 1,500,000 1,570,813 2.02%
JPMorgan Chase & Co 5.3% / perpetual 1,500,000 1,556,050 2.00%
Vedanta Resources Plc 6% 20/11/2019 1,500,000 1,561,688 2.00%
Vale Overseas Ltd 5.875% 30/03/2022 1,400,000 1,549,585 1.99%
Wells Fargo & Co 3.45% 03/12/2023 1,500,000 1,553,150 1.99%
Reliance Industries Ltd 5.875% / perpetual 1,500,000 1,548,496 1.99%
SFR Group SA 5.625% 04/03/2025 1,250,000 1,550,944 1.99%
Old Mutual Plc 6.376% 1,000,000 1,394,837 1.79%
RWE AG 7% / perpetual 1,000,000 1,381,541 1.77% Credit Suisse Group Funding Guernsey Ltd 2.75% 28/05/2026 1,100,000 1,365,005 1.75%
Society of Lloyd's 7.421% / perpetual 1,000,000 1,331,171 1.71%
RSA Insurance Group Plc 6.701% / perpetual 950,000 1,279,575 1.64%
American Express Co 5.2% / perpetual 1,200,000 1,222,187 1.57%
State Grid Overseas Investment 2016 Ltd 1.25% 08/03/2023 1,000,000 1,225,392 1.57%
AXA SA 6.772% EMTN / perpetual 800,000 1,188,339 1.52%
Societe Generale SA 6% / perpetual 1,250,000 1,175,938 1.51% Cloverie Plc for Zurich Insurance Co Ltd 4.75% EMTN / perpetual 1,200,000 1,179,600 1.51%
Koninklijke KPN NV 6.125% / perpetual 1,000,000 1,165,215 1.50%
Barclays Plc 6.625% / perpetual 1,200,000 1,159,413 1.49%
Sinochem Global Capital Co Ltd 5% / perpetual 1,100,000 1,153,399 1.48% Hutchison Whampoa Europe Finance 13 Ltd 3.75% / perpetual 1,000,000 1,125,349 1.44%
Bombardier Inc 8.75% 20/09/2022 1,000,000 1,109,583 1.42%
Bharat Petroleum Corp Ltd 4.625% 14/08/2023 1,000,000 1,096,201 1.41%
Veolia Environnement SA 4.85% / perpetual 800,000 1,079,713 1.39%

GemCap Investment Funds (Ireland) Plc (Formerly Gemini Investment Funds Plc)
95
Significant Portfolio Movements (unaudited) 31st December 2017
London & Capital Global Balanced Fixed Income Fund (Continued)
Sales
Security Name Quantity Proceed % of $ Total Sales
European Bank for Reconstruction & Development 7.5% 04/10/2020 3,500,000 1,053,611 1.35%
Ally Financial Inc 3.6% 10/03/2019 1,000,000 1,024,850 1.31%
AT&T Inc 2.8% 07/12/2021 1,000,000 1,011,654 1.30%
eBay Inc 2.2% 20/05/2020 1,000,000 1,015,266 1.30%
General Motors Financial Co Inc 3.2% 25/04/2022 1,000,000 1,008,450 1.29%
United States Treasury Note/Bond 1.375% 20/11/2021 1,000,000 989,784 1.27%
Friends Life Holdings Plc 7.875% / perpetual 800,000 867,415 1.11%
Province of Ontario Canada 0.875% 10/11/2025 EMTN 700,000 864,411 1.11%
Teck Resources Ltd 4.75% 04/11/2022 800,000 852,972 1.09%
Union Bank of India 4.5% 16/08/2020 EMTN 800,000 824,400 1.06%
Engie SA 4.75% / perpetual 600,000 816,269 1.05%
African Export-Import Bank 3.875% 24/03/2019 800,000 817,511 1.05%
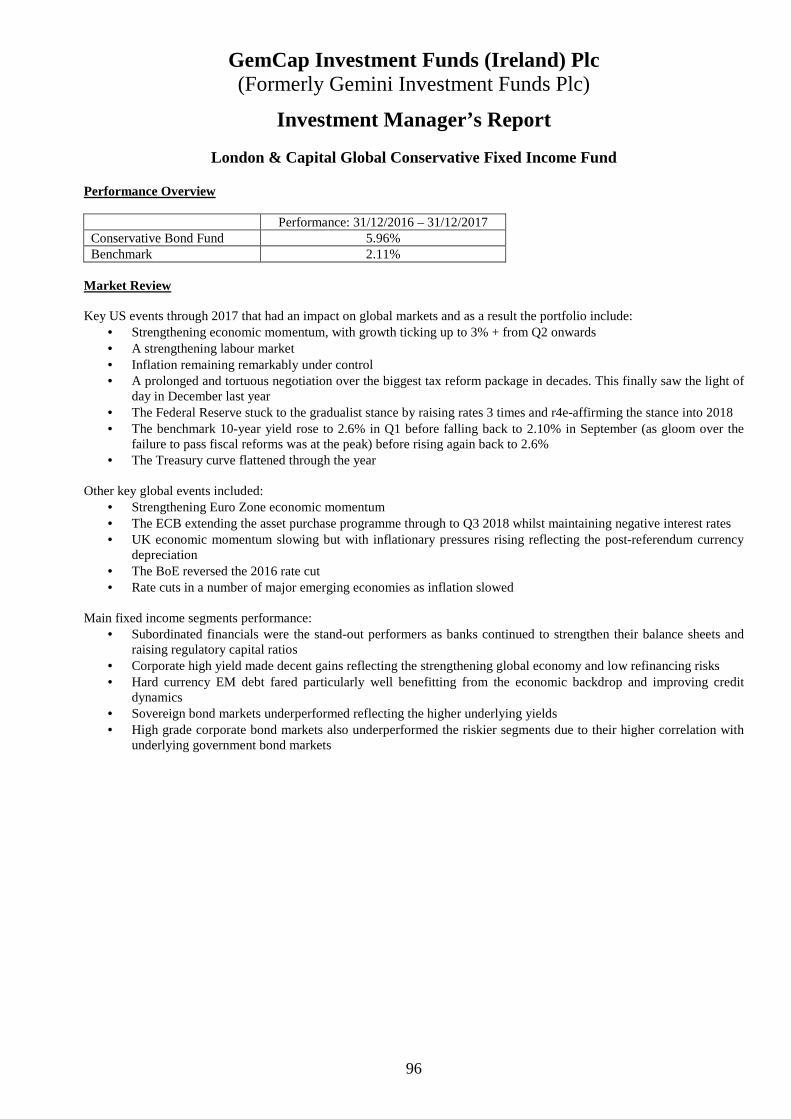
GemCap Investment Funds (Ireland) Plc (Formerly Gemini Investment Funds Plc)
96
Investment Manager’s Report
London & Capital Global Conservative Fixed Income Fund
Performance Overview Performance: 31/12/2016 – 31/12/2017 Conservative Bond Fund 5.96% Benchmark 2.11%
Market Review Key US events through 2017 that had an impact on global markets and as a result the portfolio include:
• Strengthening economic momentum, with growth ticking up to 3% + from Q2 onwards • A strengthening labour market • Inflation remaining remarkably under control • A prolonged and tortuous negotiation over the biggest tax reform package in decades. This finally saw the light of
day in December last year • The Federal Reserve stuck to the gradualist stance by raising rates 3 times and r4e-affirming the stance into 2018 • The benchmark 10-year yield rose to 2.6% in Q1 before falling back to 2.10% in September (as gloom over the
failure to pass fiscal reforms was at the peak) before rising again back to 2.6% • The Treasury curve flattened through the year
Other key global events included:
• Strengthening Euro Zone economic momentum • The ECB extending the asset purchase programme through to Q3 2018 whilst maintaining negative interest rates • UK economic momentum slowing but with inflationary pressures rising reflecting the post-referendum currency
depreciation • The BoE reversed the 2016 rate cut • Rate cuts in a number of major emerging economies as inflation slowed
Main fixed income segments performance:
• Subordinated financials were the stand-out performers as banks continued to strengthen their balance sheets and raising regulatory capital ratios
• Corporate high yield made decent gains reflecting the strengthening global economy and low refinancing risks • Hard currency EM debt fared particularly well benefitting from the economic backdrop and improving credit
dynamics • Sovereign bond markets underperformed reflecting the higher underlying yields • High grade corporate bond markets also underperformed the riskier segments due to their higher correlation with
underlying government bond markets
GemCap Investment Funds (Ireland) Plc (Formerly Gemini Investment Funds Plc)
97
Investment Manager’s Report (Continued)
London & Capital Global Conservative Fixed Income Fund (continued)
Performance Review The USD x-share class was up by 5.96% well ahead of the stated benchmark and the wider global bond indicies. The portfolio was positioned appropriately to benefit from the improving economic backdrop and the resultant rally in risk markets. The out-performance was from these key areas:
(1) Duration management through both security selection and the use of derivative overlays clearly played a part in the overall performance of the fund.
(2) Exposure to cyclical high grade corporate bonds such as autos and energy and a lower exposure to the highly correlated defensive sectors such as utilities, pharma and sovereigns.
(3) The exposure to financials and in particular legacy, subordinated and new style TLAC debt. This is primarily focussed upon the G-SIFIs’. Credit spreads narrowed throughout the year as balance sheets were strengthened across the US and Europe.
(4) Corporate hybrid exposure to utilities performed well, with names such as ENBW, VW, Total, NGG and EDF all contributing positively.
Outlook As we enter 2018, global economic prospects seem the rosiest for over a decade with synchronised expansion across all major regions. Additionally, in the US the fiscal package has finally been implemented and at least the early signs are positive for growth and markets. The on-going political, monetary and valuation concerns continue to be outweighed by the underlying shift in economic momentum. Following on from the last quarter when we focussed on the risk of Central bank tightening this quarter we flesh this out further examining what this means in reality and examine the likely path for major Central banks.
On balance, we do not expect the gradual erosion of the Fed’s balance sheet to materially disrupt markets particularly as the ECB and the Bank of Japan will continue to expand their balance sheets through this year. However, we do acknowledge the fact that over time Central Banks will be less accommodative, as they either reduce their balance sheets or buy assets at a slower pace will pose a challenge for all markets and will inevitably reduce the projected returns over the medium-term. In contrast, as inflationary pressures have remained in check even with the economic upturn it has given the Central Banks an opportunity to keep policy extremely accommodative, however, the risk is that inflation may drift higher this year.
Overall, we retain our view that the cyclical upturn has gained strength but also note that key structural undercurrents are increasingly being ignored. This document will cover our main views and the implications for asset classes.
Looking ahead into 2018 and early 2019, the outlook will be more challenging for the major sovereign bond markets and as a result duration management will be critical in protecting the potential positive returns from credit markets. In essence interest rate management will take centre stage due to two potential risks; higher inflation and faster monetary tightening. However, faster economic growth and rising equity markets should be supportive of credit markets. Overall, we remain constructive towards credit markets albeit with the likelihood of a greater dispersion in expected returns. A more bearish credit view from our perspective requires a turn in the default cycle (driven by a deterioration in state of the economy and underlying leverage). This is not on the cards over the next year or so.

GemCap Investment Funds (Ireland) Plc (Formerly Gemini Investment Funds Plc)
98
Investment Manager’s Report (Continued)
London & Capital Global Conservative Fixed Income Fund (continued)
Outlook (continued) Government bonds - tactical underweight: One of the key event markets had been waiting for, namely a successful passage through Congress for President Trump’s fiscal expansion plans finally came to fruition. The package is largely unfunded and it will significantly increase the budget deficit and the debt levels over the next decade. However, the negative impact on Treasuries is being muted by continuing low inflation and expectations that the Federal Reserve will stick to its gradualist approach. However, the underlying economic growth momentum should limit any substantial rally in Treasuries. As the Fed has begun to unwind its massive $4.2tr balance sheet, the outlook for Treasuries and global sovereign markets will become more volatile. The bellwether 10-year yield should trend higher in the short-term but a breach of 2.75-3% seems unlikely unless the low inflation backdrop changes which will push yields higher to a more normal 3.5% territory.
Fundamentally the Euro Zone sovereign markets face the biggest threats from faster economic growth, a more stable political backdrop and the risk of the ECB unable to maintain its stance on QE and negative interest rates. The ECB has already slowed the pace of asset purchases although it did expand the programme through to 2019. Fortunately, the impact of ECB bond purchase tapering should be comfortably offset by lower bond issuance this year reflecting an improvement in underling fiscal policy. However, any upward drift in inflation could put increasing pressure on the governing council to tighten policy this year.
Investment Grade – tactical overall underweight: The overall allocation to IG will be an underweight but there will be a skew towards cyclical name and sectors in the US that should benefit in the medium-term from the supportive fiscal stance.
Rationale for selective overweight: The stronger growth momentum reasonable leverage & interest cover, high cash balances and relatively low refinancing risks are all supportive.
Risks: A sharp rise in sovereign bond yields would overwhelm relative spread compensation and would risk an abrupt end to the economic expansion, in turn threatening corporate prospects.
Financials – strategic overweight: LCAM strategies have been overweight bank and insurance bonds over the past 5 years and we continue to recommend a strategic medium-term holding particularly in subordinated bonds. The focus remains on the G-SIFI’s, national champions and major insurance companies.
EM IG and HY debt – selective overweight: LCAM strategies have benefitted considerably from the selective approach to EM debt with the overweight in India and China. This overweight in sovereign, quasi-sovereign and large-cap corporate bonds will be maintained. Brazilian and Argentinian exposure has been raised and is likely to be raised further. The overall strategy will however continue to be selective.
Rationale for selective overweight: Internal growth dynamics in China and India look reasonable and credit dynamics are also very supportive. Faster US growth is generally seen as good news for EM and there is no reason for this relationship to break down. We do not see President Trump’s trade stance as a major impediment to growth over the next 12-months.
Risks: An outright trade/currency war is clearly a risk particularly for the higher beta emerging market economies. However, our selective exposure should shield the portfolio. London and Capital Asset Management Limited Date: February 2018
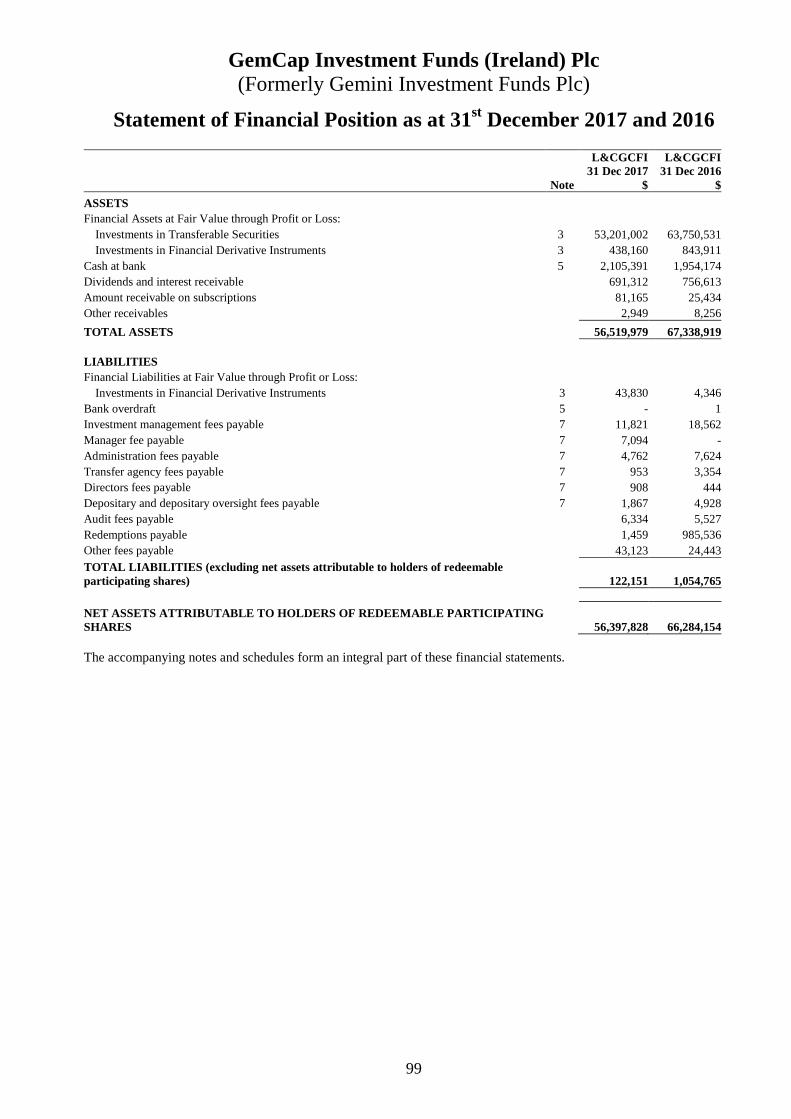
GemCap Investment Funds (Ireland) Plc (Formerly Gemini Investment Funds Plc)
99
Statement of Financial Position as at 31st December 2017 and 2016
L&CGCFI L&CGCFI 31 Dec 2017 31 Dec 2016 Note $ $
ASSETS Financial Assets at Fair Value through Profit or Loss:
Investments in Transferable Securities 3 53,201,002 63,750,531 Investments in Financial Derivative Instruments 3 438,160 843,911
Cash at bank 5 2,105,391 1,954,174 Dividends and interest receivable 691,312 756,613 Amount receivable on subscriptions 81,165 25,434 Other receivables 2,949 8,256
TOTAL ASSETS 56,519,979 67,338,919 LIABILITIES Financial Liabilities at Fair Value through Profit or Loss:
Investments in Financial Derivative Instruments 3 43,830 4,346 Bank overdraft 5 - 1 Investment management fees payable 7 11,821 18,562 Manager fee payable 7 7,094 - Administration fees payable 7 4,762 7,624 Transfer agency fees payable 7 953 3,354 Directors fees payable 7 908 444 Depositary and depositary oversight fees payable 7 1,867 4,928 Audit fees payable 6,334 5,527 Redemptions payable 1,459 985,536 Other fees payable 43,123 24,443 TOTAL LIABILITIES (excluding net assets attributable to ho lders of redeemable participating shares) 122,151 1,054,765
NET ASSETS ATTRIBUTABLE TO HOLDERS OF REDEEMABLE PARTICIPATING SHARES 56,397,828 66,284,154 The accompanying notes and schedules form an integral part of these financial statements.
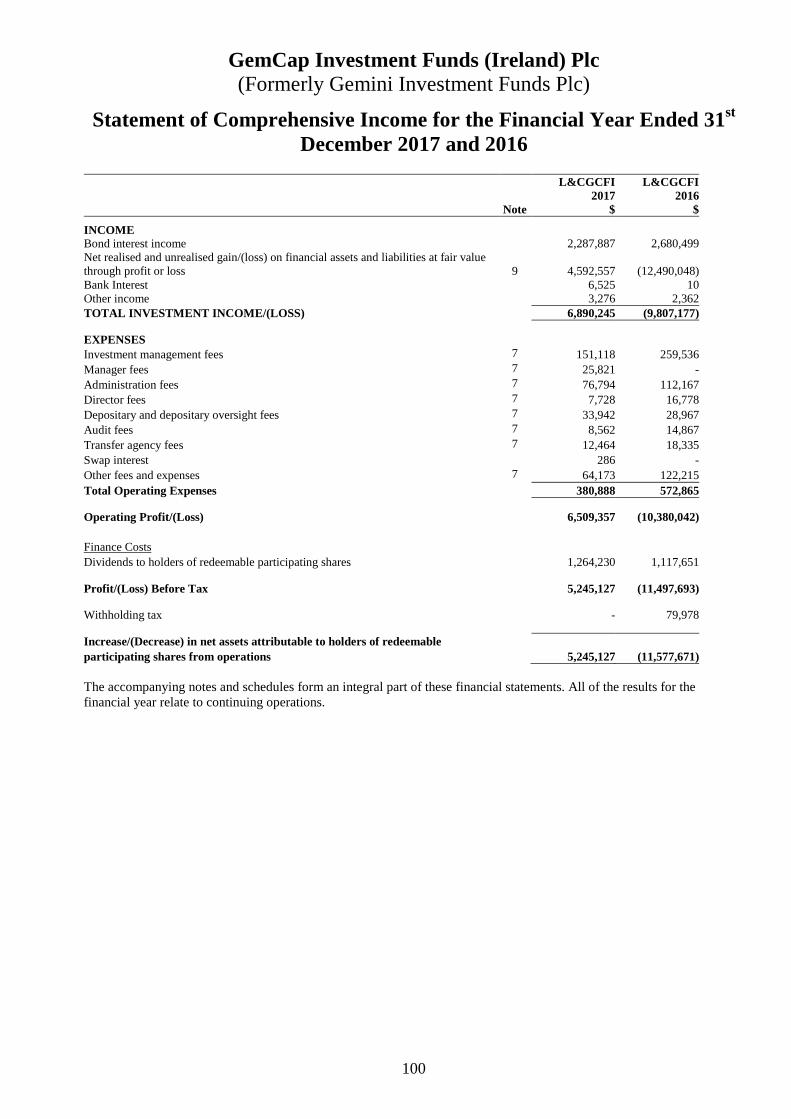
GemCap Investment Funds (Ireland) Plc (Formerly Gemini Investment Funds Plc)
100
Statement of Comprehensive Income for the Financial Year Ended 31st December 2017 and 2016
L&CGCFI L&CGCFI
2017 2016 Note $ $
INCOME Bond interest income 2,287,887 2,680,499 Net realised and unrealised gain/(loss) on financial assets and liabilities at fair value through profit or loss 9 4,592,557 (12,490,048) Bank Interest 6,525 10 Other income 3,276 2,362 TOTAL INVESTMENT INCOME/(LOSS) 6,890,245 (9,807,177) EXPENSES Investment management fees 7 151,118 259,536 Manager fees 7 25,821 - Administration fees 7 76,794 112,167 Director fees 7 7,728 16,778 Depositary and depositary oversight fees 7 33,942 28,967 Audit fees 7 8,562 14,867 Transfer agency fees 7 12,464 18,335 Swap interest 286 - Other fees and expenses 7 64,173 122,215 Total Operating Expenses 380,888 572,865 Operating Profit/(Loss) 6,509,357 (10,380,042) Finance Costs Dividends to holders of redeemable participating shares 1,264,230 1,117,651 Profit/(Loss) Before Tax 5,245,127 (11,497,693) Withholding tax - 79,978 Increase/(Decrease) in net assets attributable to holders of redeemable participating shares from operations 5,245,127 (11,577,671) The accompanying notes and schedules form an integral part of these financial statements. All of the results for the financial year relate to continuing operations.

GemCap Investment Funds (Ireland) Plc (Formerly Gemini Investment Funds Plc)
101
Statement of Changes in Net Assets attributable to Holders of Redeemable Participating Shares
The accompanying notes and schedules form an integral part of these financial statements.
L&CGCFI L&CGCFI 2017 2016
$ $ Net Assets attributable to holders of Redeemable Participating Shares at the beginning of the financial year
66,284,154 68,433,301
Increase/(decrease) in Net Assets attributable to Holders of Redeemable Participating Shares from operations 5,245,127 (11,577,671) Capital transactions Issue of redeemable shares during the financial year 13,717,249 39,254,669Redemption of redeemable shares during the financial year (28,848,702) (29,826,145)
Net Assets attributable to Holders of Redeemable Participating Shares at the end of the financial year
56,397,828 66,284,154
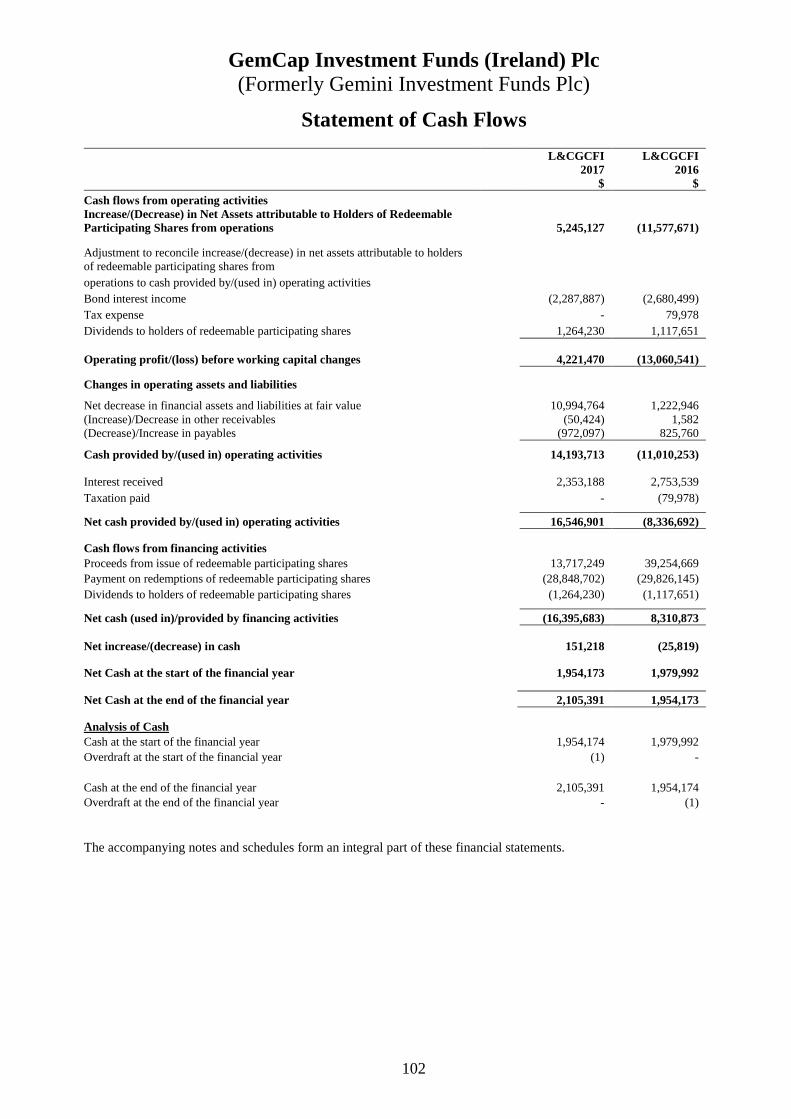
GemCap Investment Funds (Ireland) Plc (Formerly Gemini Investment Funds Plc)
102
Statement of Cash Flows
L&CGCFI L&CGCFI 2017 2016 $ $ Cash flows from operating activities Increase/(Decrease) in Net Assets attributable to Holders of Redeemable Participating Shares from operations 5,245,127 (11,577,671) Adjustment to reconcile increase/(decrease) in net assets attributable to holders of redeemable participating shares from operations to cash provided by/(used in) operating activities Bond interest income (2,287,887) (2,680,499) Tax expense - 79,978 Dividends to holders of redeemable participating shares 1,264,230 1,117,651 Operating profit/(loss) before working capital changes 4,221,470 (13,060,541) Changes in operating assets and liabilities Net decrease in financial assets and liabilities at fair value 10,994,764 1,222,946 (Increase)/Decrease in other receivables (50,424) 1,582 (Decrease)/Increase in payables (972,097) 825,760 Cash provided by/(used in) operating activities 14,193,713 (11,010,253)
Interest received 2,353,188 2,753,539 Taxation paid - (79,978) Net cash provided by/(used in) operating activities 16,546,901 (8,336,692) Cash flows from financing activities Proceeds from issue of redeemable participating shares 13,717,249 39,254,669 Payment on redemptions of redeemable participating shares (28,848,702) (29,826,145) Dividends to holders of redeemable participating shares (1,264,230) (1,117,651) Net cash (used in)/provided by financing activities (16,395,683) 8,310,873
Net increase/(decrease) in cash 151,218 (25,819) Net Cash at the start of the financial year 1,954,173 1,979,992 Net Cash at the end of the financial year 2,105,391 1,954,173 Analysis of Cash Cash at the start of the financial year 1,954,174 1,979,992 Overdraft at the start of the financial year (1) - Cash at the end of the financial year 2,105,391 1,954,174 Overdraft at the end of the financial year - (1) The accompanying notes and schedules form an integral part of these financial statements.
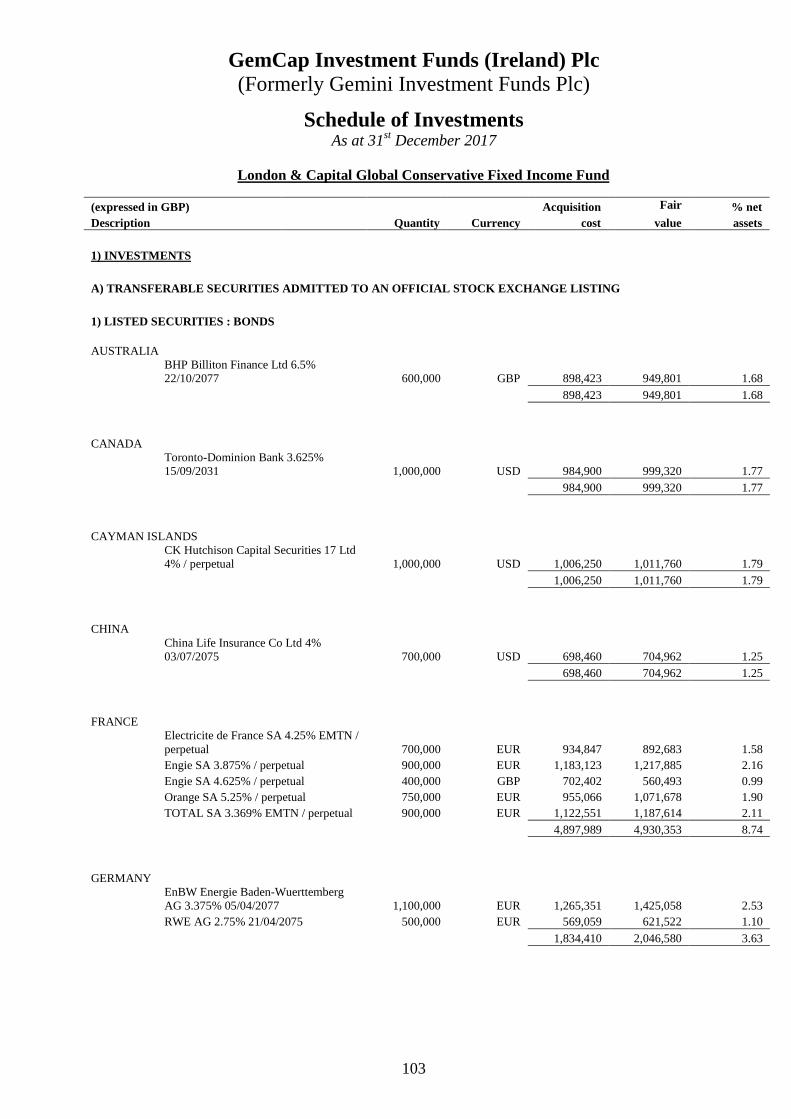
GemCap Investment Funds (Ireland) Plc (Formerly Gemini Investment Funds Plc)
103
Schedule of Investments As at 31st December 2017
London & Capital Global Conservative Fixed Income Fund
(expressed in GBP) Acquisition Fair % net Description Quantity Currency cost value assets
1) INVESTMENTS
A) TRANSFERABLE SECURITIES ADMITTED TO AN OFFICIAL STOCK EXCHANGE LISTING
1) LISTED SECURITIES : BONDS
AUSTRALIA BHP Billiton Finance Ltd 6.5% 22/10/2077 600,000 GBP 898,423 949,801 1.68
898,423 949,801 1.68
CANADA Toronto-Dominion Bank 3.625% 15/09/2031 1,000,000 USD 984,900 999,320 1.77
984,900 999,320 1.77
CAYMAN ISLANDS CK Hutchison Capital Securities 17 Ltd 4% / perpetual 1,000,000 USD 1,006,250 1,011,760 1.79
1,006,250 1,011,760 1.79
CHINA China Life Insurance Co Ltd 4% 03/07/2075 700,000 USD 698,460 704,962 1.25
698,460 704,962 1.25
FRANCE Electricite de France SA 4.25% EMTN / perpetual 700,000 EUR 934,847 892,683 1.58 Engie SA 3.875% / perpetual 900,000 EUR 1,183,123 1,217,885 2.16 Engie SA 4.625% / perpetual 400,000 GBP 702,402 560,493 0.99 Orange SA 5.25% / perpetual 750,000 EUR 955,066 1,071,678 1.90 TOTAL SA 3.369% EMTN / perpetual 900,000 EUR 1,122,551 1,187,614 2.11
4,897,989 4,930,353 8.74
GERMANY EnBW Energie Baden-Wuerttemberg AG 3.375% 05/04/2077 1,100,000 EUR 1,265,351 1,425,058 2.53 RWE AG 2.75% 21/04/2075 500,000 EUR 569,059 621,522 1.10
1,834,410 2,046,580 3.63
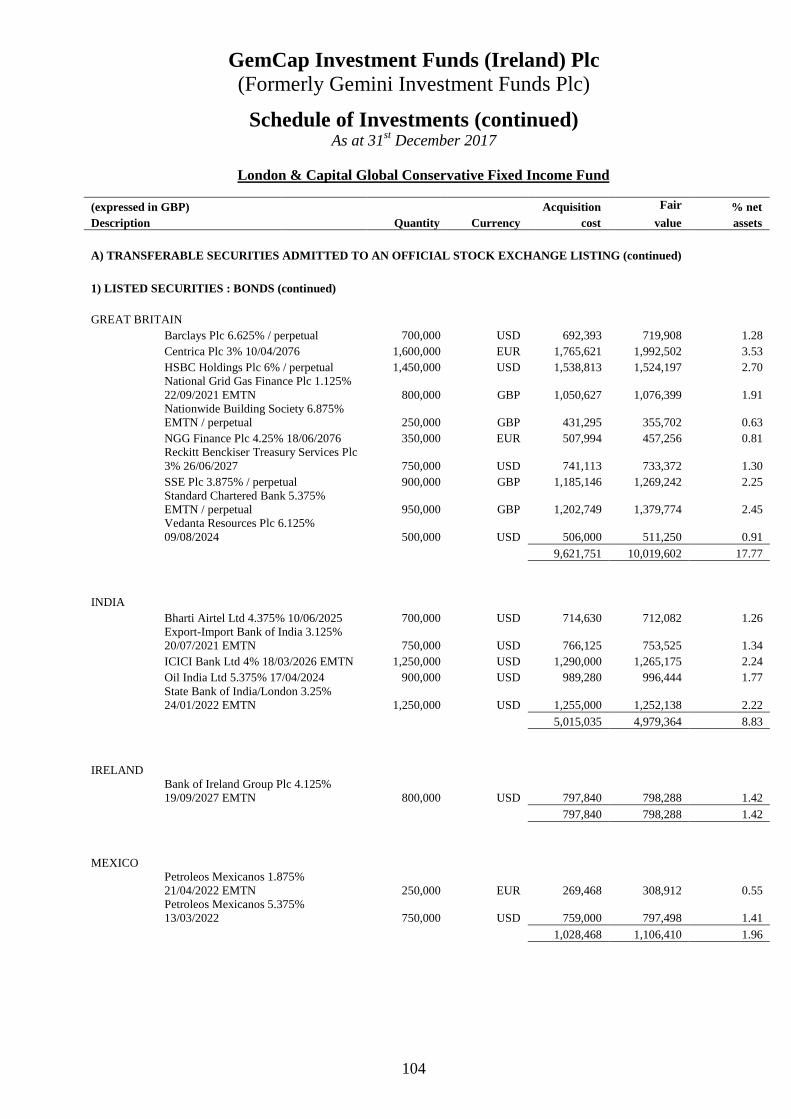
GemCap Investment Funds (Ireland) Plc (Formerly Gemini Investment Funds Plc)
104
Schedule of Investments (continued) As at 31st December 2017
London & Capital Global Conservative Fixed Income Fund
(expressed in GBP) Acquisition Fair % net Description Quantity Currency cost value assets
A) TRANSFERABLE SECURITIES ADMITTED TO AN OFFICIAL STOCK EXCHANGE LISTING (continued)
1) LISTED SECURITIES : BONDS (continued)
GREAT BRITAIN Barclays Plc 6.625% / perpetual 700,000 USD 692,393 719,908 1.28 Centrica Plc 3% 10/04/2076 1,600,000 EUR 1,765,621 1,992,502 3.53 HSBC Holdings Plc 6% / perpetual 1,450,000 USD 1,538,813 1,524,197 2.70 National Grid Gas Finance Plc 1.125% 22/09/2021 EMTN 800,000 GBP 1,050,627 1,076,399 1.91 Nationwide Building Society 6.875% EMTN / perpetual 250,000 GBP 431,295 355,702 0.63 NGG Finance Plc 4.25% 18/06/2076 350,000 EUR 507,994 457,256 0.81 Reckitt Benckiser Treasury Services Plc 3% 26/06/2027 750,000 USD 741,113 733,372 1.30 SSE Plc 3.875% / perpetual 900,000 GBP 1,185,146 1,269,242 2.25 Standard Chartered Bank 5.375% EMTN / perpetual 950,000 GBP 1,202,749 1,379,774 2.45 Vedanta Resources Plc 6.125% 09/08/2024 500,000 USD 506,000 511,250 0.91
9,621,751 10,019,602 17.77
INDIA Bharti Airtel Ltd 4.375% 10/06/2025 700,000 USD 714,630 712,082 1.26 Export-Import Bank of India 3.125% 20/07/2021 EMTN 750,000 USD 766,125 753,525 1.34 ICICI Bank Ltd 4% 18/03/2026 EMTN 1,250,000 USD 1,290,000 1,265,175 2.24 Oil India Ltd 5.375% 17/04/2024 900,000 USD 989,280 996,444 1.77 State Bank of India/London 3.25% 24/01/2022 EMTN 1,250,000 USD 1,255,000 1,252,138 2.22
5,015,035 4,979,364 8.83
IRELAND Bank of Ireland Group Plc 4.125% 19/09/2027 EMTN 800,000 USD 797,840 798,288 1.42
797,840 798,288 1.42
MEXICO Petroleos Mexicanos 1.875% 21/04/2022 EMTN 250,000 EUR 269,468 308,912 0.55 Petroleos Mexicanos 5.375% 13/03/2022 750,000 USD 759,000 797,498 1.41
1,028,468 1,106,410 1.96

GemCap Investment Funds (Ireland) Plc (Formerly Gemini Investment Funds Plc)
105
Schedule of Investments (continued) As at 31st December 2017
London & Capital Global Conservative Fixed Income Fund
(expressed in GBP) Acquisition Fair % net Description Quantity Currency cost value assets
A) TRANSFERABLE SECURITIES ADMITTED TO AN OFFICIAL STOCK EXCHANGE LISTING (continued)
1) LISTED SECURITIES : BONDS (continued)
NETHERLANDS
Cooperatieve Rabobank UA 4% 10/04/2029 EMTN 400,000 USD 397,396 405,975 0.72 Cooperatieve Rabobank UA 5.5% / perpetual 650,000 EUR 753,188 847,707 1.50 ELM BV for Swiss Reinsurance Co Ltd 6.3024% EMTN / perpetual 500,000 GBP 662,079 721,029 1.28 Volkswagen International Finance NV 2.7% / perpetual 700,000 EUR 790,795 867,534 1.54
2,603,458 2,842,245 5.04
SINGAPORE ONGC Videsh Vankorneft Pte Ltd 3.75% 27/07/2026 1,000,000 USD 1,016,250 998,950 1.77
1,016,250 998,950 1.77
SWEDEN Nordea Bank AB 5.5% EMTN / perpetual 1,000,000 USD 1,026,000 1,029,830 1.83 Svenska Handelsbanken AB 5.25% / perpetual 1,400,000 USD 1,408,360 1,434,678 2.54 Swedbank AB 6% / perpetual 1,000,000 USD 1,010,100 1,059,670 1.88
3,444,460 3,524,178 6.25
SWITZERLAND UBS AG 5.125% 15/05/2024 1,000,000 USD 1,062,400 1,058,830 1.88
1,062,400 1,058,830 1.88
UNITED ARAB EMIRATES Axis Bank Ltd 2.875% 01/06/2021 EMTN 750,000 USD 748,125 743,093 1.32
748,125 743,093 1.32
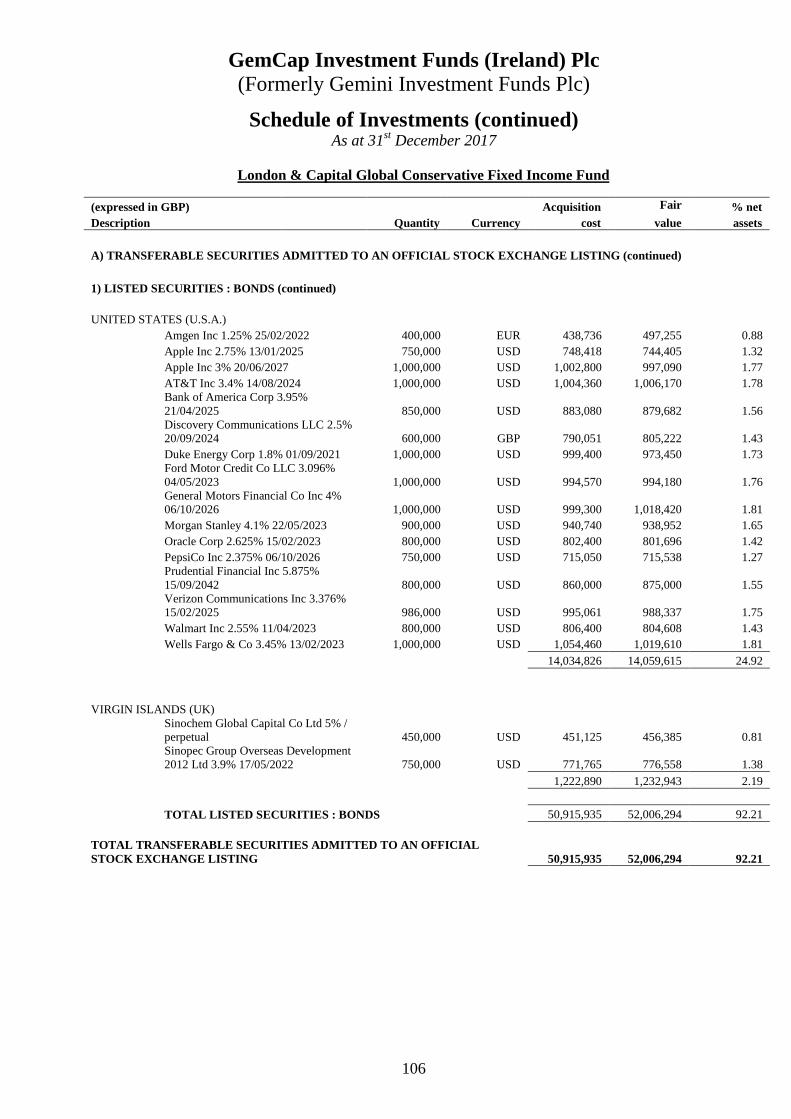
GemCap Investment Funds (Ireland) Plc (Formerly Gemini Investment Funds Plc)
106
Schedule of Investments (continued) As at 31st December 2017
London & Capital Global Conservative Fixed Income Fund
(expressed in GBP) Acquisition Fair % net Description Quantity Currency cost value assets
A) TRANSFERABLE SECURITIES ADMITTED TO AN OFFICIAL STOCK EXCHANGE LISTING (continued)
1) LISTED SECURITIES : BONDS (continued)
UNITED STATES (U.S.A.) Amgen Inc 1.25% 25/02/2022 400,000 EUR 438,736 497,255 0.88 Apple Inc 2.75% 13/01/2025 750,000 USD 748,418 744,405 1.32 Apple Inc 3% 20/06/2027 1,000,000 USD 1,002,800 997,090 1.77 AT&T Inc 3.4% 14/08/2024 1,000,000 USD 1,004,360 1,006,170 1.78 Bank of America Corp 3.95% 21/04/2025 850,000 USD 883,080 879,682 1.56 Discovery Communications LLC 2.5% 20/09/2024 600,000 GBP 790,051 805,222 1.43 Duke Energy Corp 1.8% 01/09/2021 1,000,000 USD 999,400 973,450 1.73 Ford Motor Credit Co LLC 3.096% 04/05/2023 1,000,000 USD 994,570 994,180 1.76 General Motors Financial Co Inc 4% 06/10/2026 1,000,000 USD 999,300 1,018,420 1.81 Morgan Stanley 4.1% 22/05/2023 900,000 USD 940,740 938,952 1.65 Oracle Corp 2.625% 15/02/2023 800,000 USD 802,400 801,696 1.42 PepsiCo Inc 2.375% 06/10/2026 750,000 USD 715,050 715,538 1.27 Prudential Financial Inc 5.875% 15/09/2042 800,000 USD 860,000 875,000 1.55 Verizon Communications Inc 3.376% 15/02/2025 986,000 USD 995,061 988,337 1.75 Walmart Inc 2.55% 11/04/2023 800,000 USD 806,400 804,608 1.43 Wells Fargo & Co 3.45% 13/02/2023 1,000,000 USD 1,054,460 1,019,610 1.81
14,034,826 14,059,615 24.92
VIRGIN ISLANDS (UK) Sinochem Global Capital Co Ltd 5% / perpetual 450,000 USD 451,125 456,385 0.81 Sinopec Group Overseas Development 2012 Ltd 3.9% 17/05/2022 750,000 USD 771,765 776,558 1.38
1,222,890 1,232,943 2.19
TOTAL LISTED SECURITIES : BONDS 50,915,935 52,006,294 92.21
TOTAL TRANSFERABLE SECURITIES ADMITTED TO AN OFFICIAL STOCK EXCHANGE LISTING 50,915,935 52,006,294 92.21
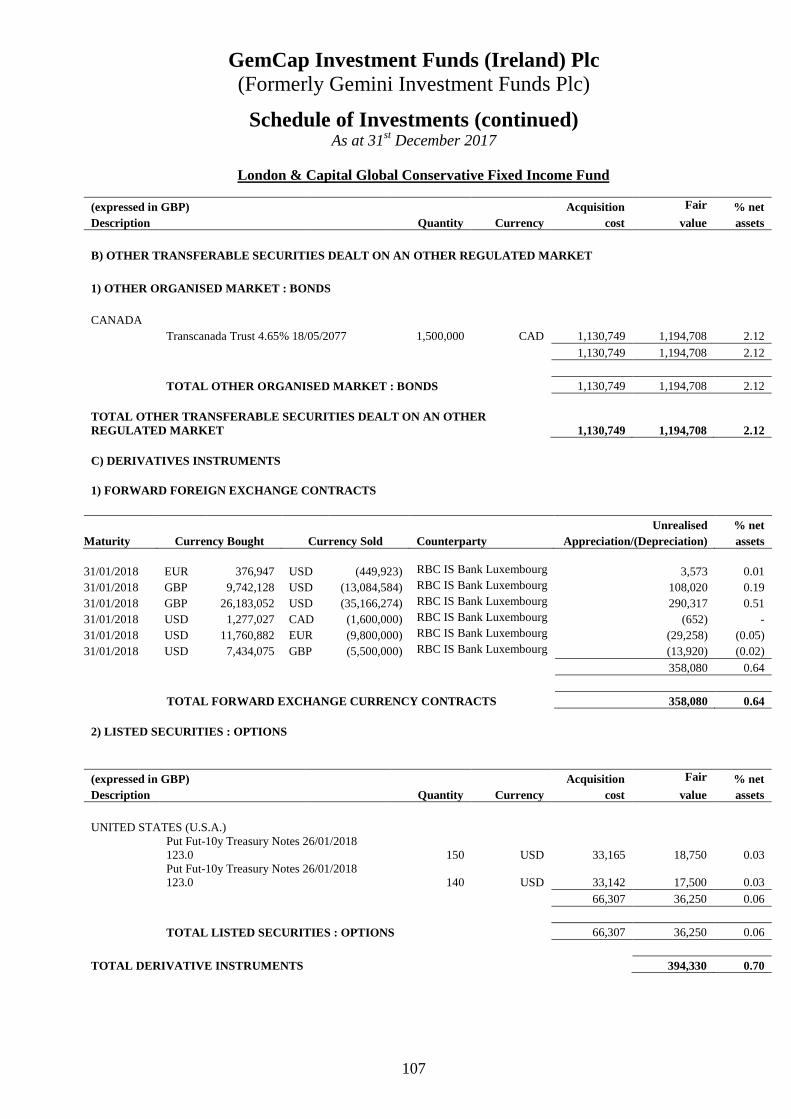
GemCap Investment Funds (Ireland) Plc (Formerly Gemini Investment Funds Plc)
107
Schedule of Investments (continued) As at 31st December 2017
London & Capital Global Conservative Fixed Income Fund
(expressed in GBP) Acquisition Fair % net Description Quantity Currency cost value assets
B) OTHER TRANSFERABLE SECURITIES DEALT ON AN OTHER REGULATED MARKET
1) OTHER ORGANISED MARKET : BONDS
CANADA Transcanada Trust 4.65% 18/05/2077 1,500,000 CAD 1,130,749 1,194,708 2.12
1,130,749 1,194,708 2.12
TOTAL OTHER ORGANISED MARKET : BONDS 1,130,749 1,194,708 2.12
TOTAL OTHER TRANSFERABLE SECURITIES DEALT ON AN OTHER REGULATED MARKET 1,130,749 1,194,708 2.12
C) DERIVATIVES INSTRUMENTS 1) FORWARD FOREIGN EXCHANGE CONTRACTS
Unrealised % net Maturity Currency Bought Currency Sold Counterparty Appreciation/(Depreciation) assets
31/01/2018 EUR 376,947 USD (449,923) RBC IS Bank Luxembourg 3,573 0.01 31/01/2018 GBP 9,742,128 USD (13,084,584) RBC IS Bank Luxembourg 108,020 0.19 31/01/2018 GBP 26,183,052 USD (35,166,274) RBC IS Bank Luxembourg 290,317 0.51 31/01/2018 USD 1,277,027 CAD (1,600,000) RBC IS Bank Luxembourg (652) - 31/01/2018 USD 11,760,882 EUR (9,800,000) RBC IS Bank Luxembourg (29,258) (0.05) 31/01/2018 USD 7,434,075 GBP (5,500,000) RBC IS Bank Luxembourg (13,920) (0.02)
358,080 0.64
TOTAL FORWARD EXCHANGE CURRENCY CONTRACTS 358,080 0.64
2) LISTED SECURITIES : OPTIONS
(expressed in GBP) Acquisition Fair % net Description Quantity Currency cost value assets
UNITED STATES (U.S.A.) Put Fut-10y Treasury Notes 26/01/2018 123.0 150 USD 33,165 18,750 0.03 Put Fut-10y Treasury Notes 26/01/2018 123.0 140 USD 33,142 17,500 0.03
66,307 36,250 0.06
TOTAL LISTED SECURITIES : OPTIONS 66,307 36,250 0.06
TOTAL DERIVATIVE INSTRUMENTS 394,330 0.70
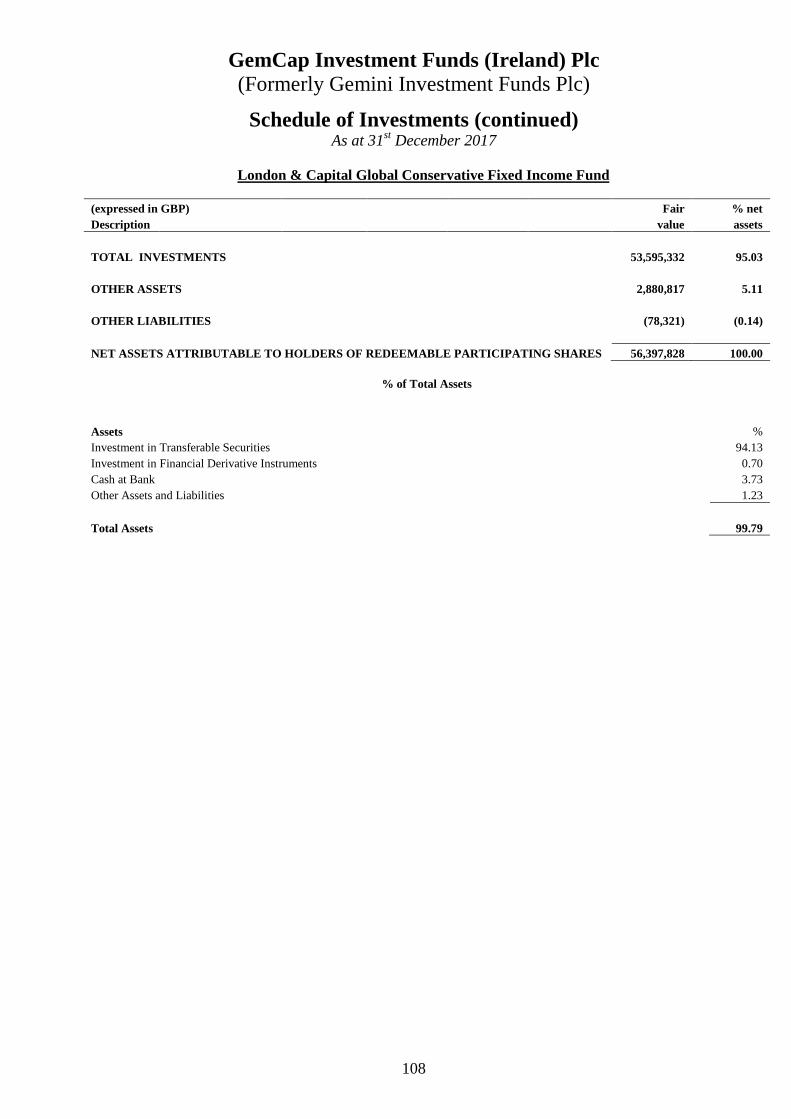
GemCap Investment Funds (Ireland) Plc (Formerly Gemini Investment Funds Plc)
108
Schedule of Investments (continued) As at 31st December 2017
London & Capital Global Conservative Fixed Income Fund
(expressed in GBP) Fair % net Description value assets
TOTAL INVESTMENTS 53,595,332 95.03
OTHER ASSETS 2,880,817 5.11
OTHER LIABILITIES (78,321) (0.14)
NET ASSETS ATTRIBUTABLE TO HOLDERS OF REDEEMABLE PARTICIPATING SHARES 56,397,828 100.00
% of Total Assets
Assets % Investment in Transferable Securities 94.13 Investment in Financial Derivative Instruments 0.70 Cash at Bank 3.73 Other Assets and Liabilities 1.23
Total Assets 99.79

GemCap Investment Funds (Ireland) Plc (Formerly Gemini Investment Funds Plc)
109
Significant Portfolio Movements (unaudited) 31st December 2017
London & Capital Global Conservative Fixed Income Fund
Purchases Security Name Quantity Cost % of
$ Total Purchases
TOTAL SA 3.875% EMTN / perpetual 1,400,000 1,587,685 3.66%
HSBC Holdings Plc 6.875% / perpetual 1,450,000 1,539,813 3.55%
HSBC Holdings Plc 6% / perpetual 1,450,000 1,538,813 3.54%
Morgan Stanley 4.1% 10/03/2024 1,400,000 1,457,940 3.36%
ICICI Bank Ltd 4.8% 10/03/2020 EMTN 1,250,000 1,312,500 3.02%
ICICI Bank Ltd 4% 05/01/2027 EMTN 1,250,000 1,290,000 2.97%
EnBW Energie Baden-Wuerttemberg AG 3.375% 23/01/2078 1,100,000 1,265,351 2.91%
State Bank of India 3.25% 13/11/2022 EMTN 1,250,000 1,255,000 2.89%
ICICI Bank Ltd 3.25% 29/06/2023 EMTN 1,250,000 1,243,088 2.86%
Engie SA 3.875% / perpetual 900,000 1,183,123 2.72%
Engie SA 4.75% / perpetual 900,000 1,131,203 2.60%
Transcanada Trust 4.65% 07/03/2078 1,500,000 1,130,749 2.60%
TOTAL SA 3.369% EMTN / perpetual 900,000 1,122,551 2.59%
UBS AG 5.125% 04/03/2025 1,000,000 1,062,400 2.45%
Nordea Bank AB 5.5% EMTN / perpetual 1,000,000 1,026,000 2.36%
ONGC Videsh Vankorneft Pte Ltd 3.75% 16/05/2027 1,000,000 1,016,250 2.34%
CK Hutchison Capital Securities 17 Ltd 4% / perpetual 1,000,000 1,006,250 2.32%
AT&T Inc 3.4% 03/06/2025 1,000,000 1,004,360 2.31%
Apple Inc 3% 08/04/2028 1,000,000 1,002,800 2.31%
General Motors Financial Co Inc 4% 26/07/2027 1,000,000 999,300 2.30%
Ford Motor Credit Co LLC 3.096% 21/02/2024 1,000,000 994,570 2.29%
Toronto-Dominion Bank 3.625% 04/07/2032 1,000,000 984,900 2.27%
Orange SA 5.25% / perpetual 750,000 955,066 2.20%
BHP Billiton Finance Ltd 6.5% 11/08/2078 600,000 898,423 2.07%
Prudential Financial Inc 5.875% 05/07/2043 800,000 860,000 1.98%
AXA SA 6.772% EMTN / perpetual 600,000 813,001 1.87%
Walmart Inc 2.55% 29/01/2024 800,000 806,400 1.86%
Fresenius Finance Ireland Plc 0.875% 20/11/2022 750,000 803,535 1.85%
Oracle Corp 2.625% 05/12/2023 800,000 802,400 1.85%
Bank of Ireland Group Plc 4.125% 08/07/2028 EMTN 800,000 797,840 1.84%
Volkswagen International Finance NV 2.7% / perpetual 700,000 790,795 1.82%
Bank of Baroda 4.875% 11/05/2020 750,000 790,125 1.82%
Discovery Communications LLC 2.5% 10/07/2025 600,000 790,051 1.82%
Standard Chartered Bank 5.375% EMTN / perpetual 600,000 760,225 1.75%
Apple Inc 2.75% 02/11/2025 750,000 748,418 1.72%
Reckitt Benckiser Treasury Services Plc 3% 14/04/2028 750,000 741,113 1.71%
PepsiCo Inc 2.375% 26/07/2027 750,000 715,050 1.65%
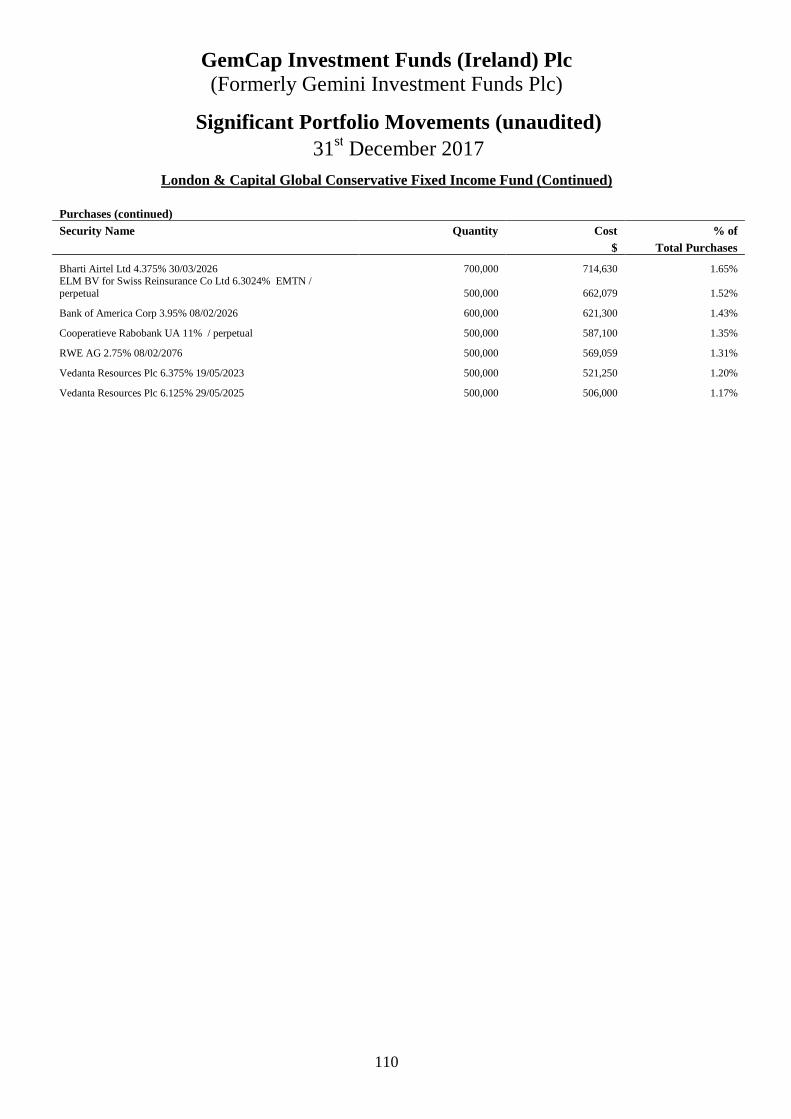
GemCap Investment Funds (Ireland) Plc (Formerly Gemini Investment Funds Plc)
110
Significant Portfolio Movements (unaudited) 31st December 2017
London & Capital Global Conservative Fixed Income Fund (Continued) Purchases (continued) Security Name Quantity Cost % of $ Total Purchases
Bharti Airtel Ltd 4.375% 30/03/2026 700,000 714,630 1.65% ELM BV for Swiss Reinsurance Co Ltd 6.3024% EMTN / perpetual 500,000 662,079 1.52%
Bank of America Corp 3.95% 08/02/2026 600,000 621,300 1.43%
Cooperatieve Rabobank UA 11% / perpetual 500,000 587,100 1.35%
RWE AG 2.75% 08/02/2076 500,000 569,059 1.31%
Vedanta Resources Plc 6.375% 19/05/2023 500,000 521,250 1.20%
Vedanta Resources Plc 6.125% 29/05/2025 500,000 506,000 1.17%

GemCap Investment Funds (Ireland) Plc (Formerly Gemini Investment Funds Plc)
111
Significant Portfolio Movements (unaudited) 31st December 2017
London & Capital Global Conservative Fixed Income Fund (Continued)
Sales
Security Name Quantity Proceed % of $ Total Sales
TOTAL SA 3.875% EMTN / perpetual 1,400,000 1,790,935 3.09%
HSBC Holdings Plc 6.875% / perpetual 1,450,000 1,611,825 2.78%
TOTAL SA 2.25% EMTN / perpetual 1,400,000 1,526,363 2.64%
American Express Co 5.2% / perpetual 1,500,000 1,522,782 2.63%
Qatar Government International Bond 2.375% 22/03/2022 1,500,000 1,482,549 2.55%
European Investment Bank 1.625% 04/04/2022 1,500,000 1,470,917 2.53%
ICICI Bank Ltd 4.8% 10/03/2020 EMTN 1,250,000 1,325,892 2.28%
Ford Motor Credit Co LLC 2.597% 23/08/2020 1,300,000 1,319,484 2.27%
ICICI Bank Ltd 3.25% 29/06/2023 EMTN 1,250,000 1,270,339 2.19%
Hutchison Whampoa Europe Finance 13 Ltd 3.75% / perpetual 1,100,000 1,259,863 2.17%
ICICI Bank Ltd 4% 05/01/2027 EMTN 1,250,000 1,252,431 2.15%
Engie SA 4.75% / perpetual 900,000 1,224,403 2.11%
Vodafone Group Plc 1.25% 14/06/2022 EMTN 1,000,000 1,161,180 2.00%
State Grid Overseas Investment 2016 Ltd 1.25% 08/03/2023 1,000,000 1,101,701 1.90%
Carnival Corp 1.125% 25/08/2020 1,000,000 1,088,926 1.87%
Engie SA 3.875% / perpetual 900,000 1,075,949 1.85%
BG Energy Capital Plc 6.5% 19/09/2073 1,000,000 1,047,208 1.80%
Reliance Industries Ltd 5.875% / perpetual 1,000,000 1,037,867 1.79%
JPMorgan Chase & Co 5.3% / perpetual 1,000,000 1,037,367 1.78%
Syndicate Bank 3.875% 22/09/2020 EMTN 1,000,000 1,036,014 1.78%
Target Corp 2.3% 14/04/2020 1,000,000 1,019,854 1.75%
Eastman Chemical Co 2.7% 03/11/2020 1,000,000 1,013,818 1.74%
General Motors Financial Co Inc 3.2% 25/04/2022 1,000,000 1,013,178 1.74%
AT&T Inc 2.8% 07/12/2021 1,000,000 1,011,654 1.74%
Walt Disney Co 1.85% 18/03/2020 1,000,000 1,008,603 1.74%
Walgreens Boots Alliance Inc 3.1% 20/03/2024 1,000,000 1,008,356 1.73%
General Dynamics Corp 2.125% 04/06/2027 1,000,000 931,573 1.60%
SFR Group SA 5.625% 04/03/2025 750,000 930,566 1.60%
AXA SA 6.772% EMTN / perpetual 600,000 891,254 1.53%
Standard Chartered Plc 5.7% 14/11/2022 800,000 873,187 1.50%
HSBC Holdings Plc 5.625% / perpetual 850,000 847,397 1.46%
National Capital Trust I 5.62% / perpetual 600,000 846,817 1.46%
Union Bank of India 4.5% 16/08/2020 EMTN 800,000 838,400 1.44% Banco Nacional de Desenvolvimento Economico e Social 4% 01/02/2020 800,000 824,916 1.42%
Bharat Petroleum Corp Ltd 4.625% 14/08/2023 750,000 822,151 1.41%
Fresenius Finance Ireland Plc 0.875% 20/11/2022 750,000 804,282 1.38%
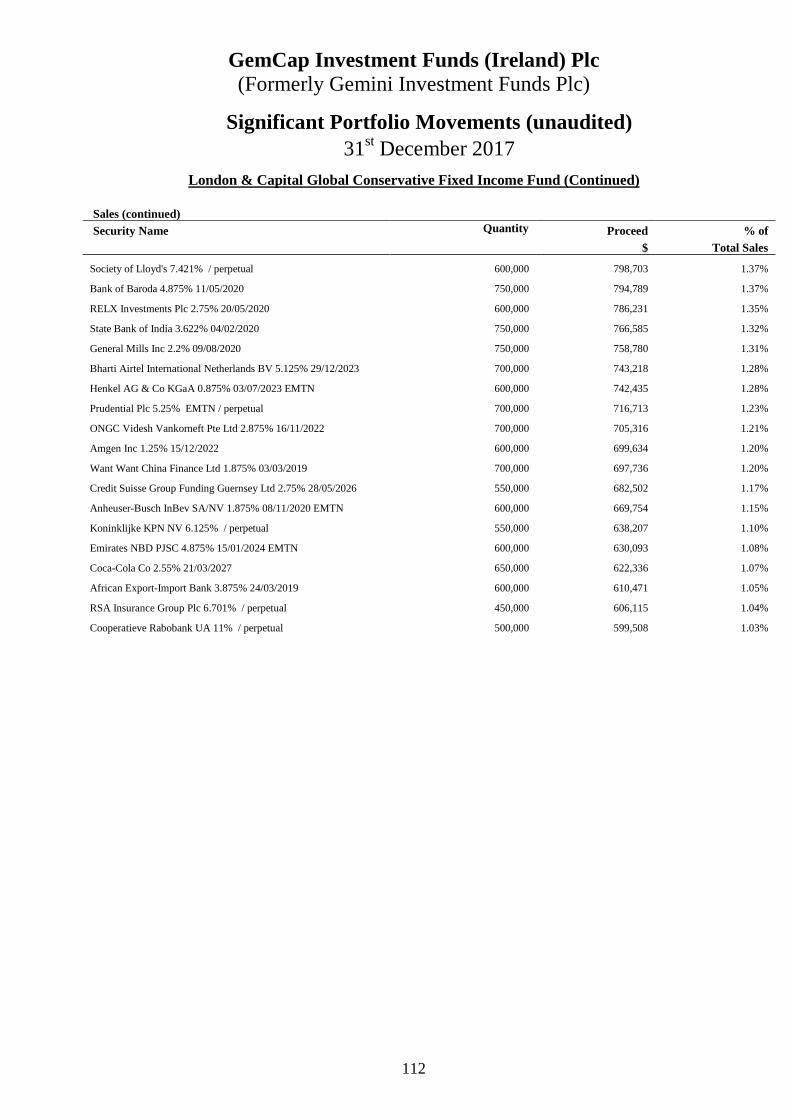
GemCap Investment Funds (Ireland) Plc (Formerly Gemini Investment Funds Plc)
112
Significant Portfolio Movements (unaudited) 31st December 2017
London & Capital Global Conservative Fixed Income Fund (Continued)
Sales (continued)
Security Name Quantity Proceed % of $ Total Sales
Society of Lloyd's 7.421% / perpetual 600,000 798,703 1.37%
Bank of Baroda 4.875% 11/05/2020 750,000 794,789 1.37%
RELX Investments Plc 2.75% 20/05/2020 600,000 786,231 1.35%
State Bank of India 3.622% 04/02/2020 750,000 766,585 1.32%
General Mills Inc 2.2% 09/08/2020 750,000 758,780 1.31%
Bharti Airtel International Netherlands BV 5.125% 29/12/2023 700,000 743,218 1.28%
Henkel AG & Co KGaA 0.875% 03/07/2023 EMTN 600,000 742,435 1.28%
Prudential Plc 5.25% EMTN / perpetual 700,000 716,713 1.23%
ONGC Videsh Vankorneft Pte Ltd 2.875% 16/11/2022 700,000 705,316 1.21%
Amgen Inc 1.25% 15/12/2022 600,000 699,634 1.20%
Want Want China Finance Ltd 1.875% 03/03/2019 700,000 697,736 1.20%
Credit Suisse Group Funding Guernsey Ltd 2.75% 28/05/2026 550,000 682,502 1.17%
Anheuser-Busch InBev SA/NV 1.875% 08/11/2020 EMTN 600,000 669,754 1.15%
Koninklijke KPN NV 6.125% / perpetual 550,000 638,207 1.10%
Emirates NBD PJSC 4.875% 15/01/2024 EMTN 600,000 630,093 1.08%
Coca-Cola Co 2.55% 21/03/2027 650,000 622,336 1.07%
African Export-Import Bank 3.875% 24/03/2019 600,000 610,471 1.05%
RSA Insurance Group Plc 6.701% / perpetual 450,000 606,115 1.04%
Cooperatieve Rabobank UA 11% / perpetual 500,000 599,508 1.03%
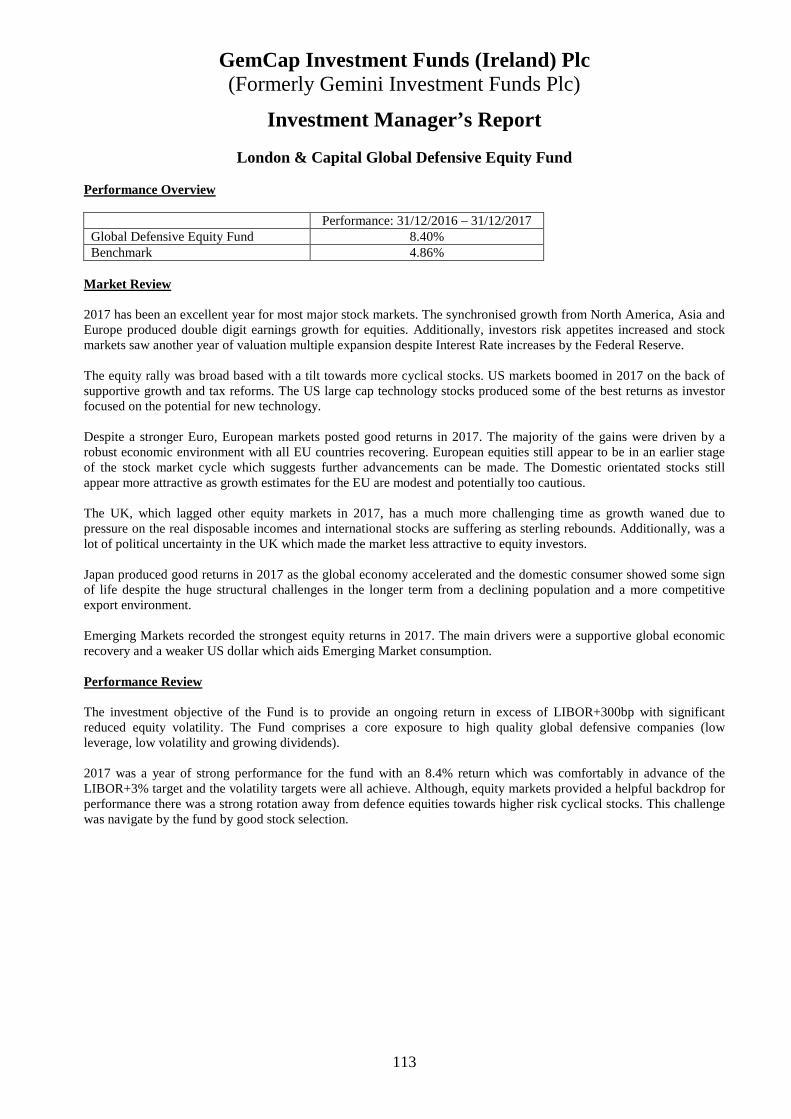
GemCap Investment Funds (Ireland) Plc (Formerly Gemini Investment Funds Plc)
113
Investment Manager’s Report
London & Capital Global Defensive Equity Fund Performance Overview Performance: 31/12/2016 – 31/12/2017 Global Defensive Equity Fund 8.40% Benchmark 4.86%
Market Review 2017 has been an excellent year for most major stock markets. The synchronised growth from North America, Asia and Europe produced double digit earnings growth for equities. Additionally, investors risk appetites increased and stock markets saw another year of valuation multiple expansion despite Interest Rate increases by the Federal Reserve. The equity rally was broad based with a tilt towards more cyclical stocks. US markets boomed in 2017 on the back of supportive growth and tax reforms. The US large cap technology stocks produced some of the best returns as investor focused on the potential for new technology. Despite a stronger Euro, European markets posted good returns in 2017. The majority of the gains were driven by a robust economic environment with all EU countries recovering. European equities still appear to be in an earlier stage of the stock market cycle which suggests further advancements can be made. The Domestic orientated stocks still appear more attractive as growth estimates for the EU are modest and potentially too cautious. The UK, which lagged other equity markets in 2017, has a much more challenging time as growth waned due to pressure on the real disposable incomes and international stocks are suffering as sterling rebounds. Additionally, was a lot of political uncertainty in the UK which made the market less attractive to equity investors. Japan produced good returns in 2017 as the global economy accelerated and the domestic consumer showed some sign of life despite the huge structural challenges in the longer term from a declining population and a more competitive export environment. Emerging Markets recorded the strongest equity returns in 2017. The main drivers were a supportive global economic recovery and a weaker US dollar which aids Emerging Market consumption. Performance Review The investment objective of the Fund is to provide an ongoing return in excess of LIBOR+300bp with significant reduced equity volatility. The Fund comprises a core exposure to high quality global defensive companies (low leverage, low volatility and growing dividends). 2017 was a year of strong performance for the fund with an 8.4% return which was comfortably in advance of the LIBOR+3% target and the volatility targets were all achieve. Although, equity markets provided a helpful backdrop for performance there was a strong rotation away from defence equities towards higher risk cyclical stocks. This challenge was navigate by the fund by good stock selection.

GemCap Investment Funds (Ireland) Plc (Formerly Gemini Investment Funds Plc)
114
Investment Manager’s Report (Continued)
London & Capital Global Defensive Equity Fund (Continued)
Outlook Equity markets now have high valuations and high earnings expectations for 2018. For equity markets to advance further with these two headwinds, there has to strong growth momentum to drive earnings higher. At present, the growth outlook is supportive, however this need to be carefully monitored to ensure there is no deterioration as this could have major consequences for equity markets given the high investor sentiment. Overall, 2018 is likely to show much more modest equity market returns given the high valuation starting point and a correction is possible but a bear market still seems unlikely given the constructive growth backdrop. The fund continues to become more defensive in preparation for more challenging conditions in 2018 due to high valuations and expectations. This increased defensive slant is achieved by resilient stock selection and market protection. Roger Jones London and Capital Asset Management Limited Date: February 2018
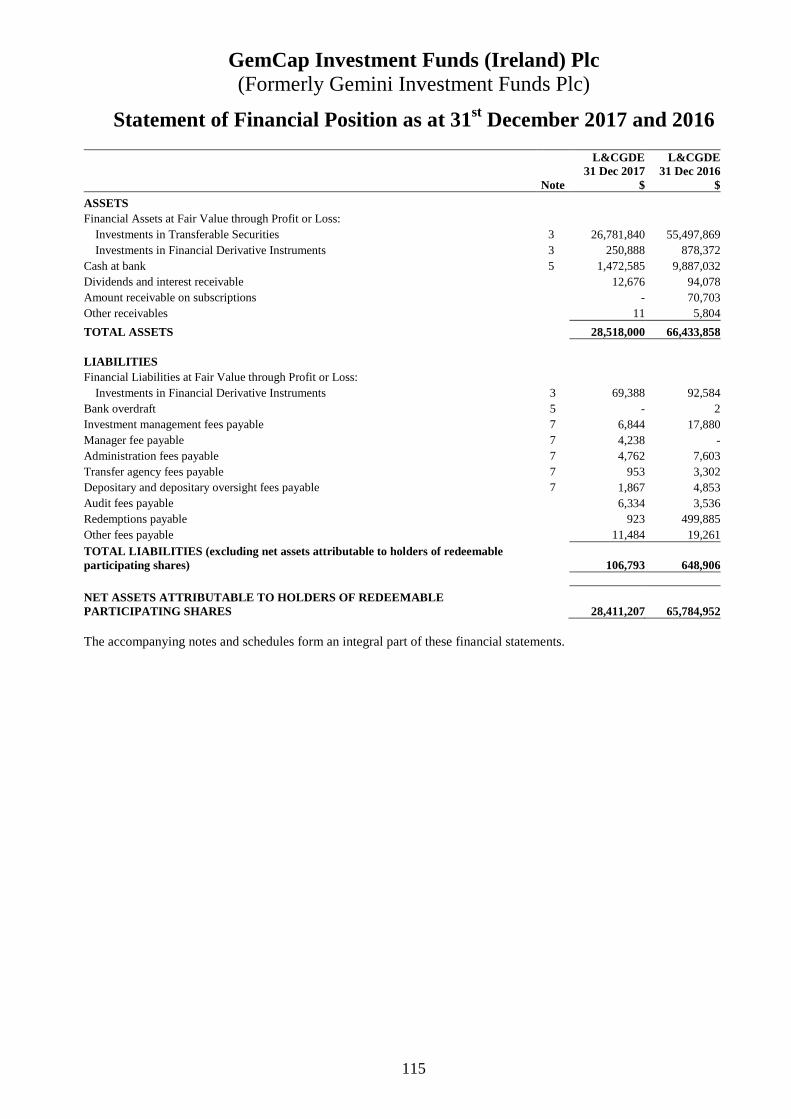
GemCap Investment Funds (Ireland) Plc (Formerly Gemini Investment Funds Plc)
115
Statement of Financial Position as at 31st December 2017 and 2016
L&CGDE L&CGDE 31 Dec 2017 31 Dec 2016 Note $ $
ASSETS Financial Assets at Fair Value through Profit or Loss:
Investments in Transferable Securities 3 26,781,840 55,497,869 Investments in Financial Derivative Instruments 3 250,888 878,372
Cash at bank 5 1,472,585 9,887,032 Dividends and interest receivable 12,676 94,078 Amount receivable on subscriptions - 70,703 Other receivables 11 5,804
TOTAL ASSETS 28,518,000 66,433,858 LIABILITIES Financial Liabilities at Fair Value through Profit or Loss:
Investments in Financial Derivative Instruments 3 69,388 92,584 Bank overdraft 5 - 2 Investment management fees payable 7 6,844 17,880 Manager fee payable 7 4,238 - Administration fees payable 7 4,762 7,603 Transfer agency fees payable 7 953 3,302 Depositary and depositary oversight fees payable 7 1,867 4,853 Audit fees payable 6,334 3,536 Redemptions payable 923 499,885 Other fees payable 11,484 19,261 TOTAL LIABILITIES (excluding net assets attributable to ho lders of redeemable participating shares) 106,793 648,906
NET ASSETS ATTRIBUTABLE TO HOLDERS OF REDEEMABLE PARTICIPATING SHARES 28,411,207 65,784,952 The accompanying notes and schedules form an integral part of these financial statements.
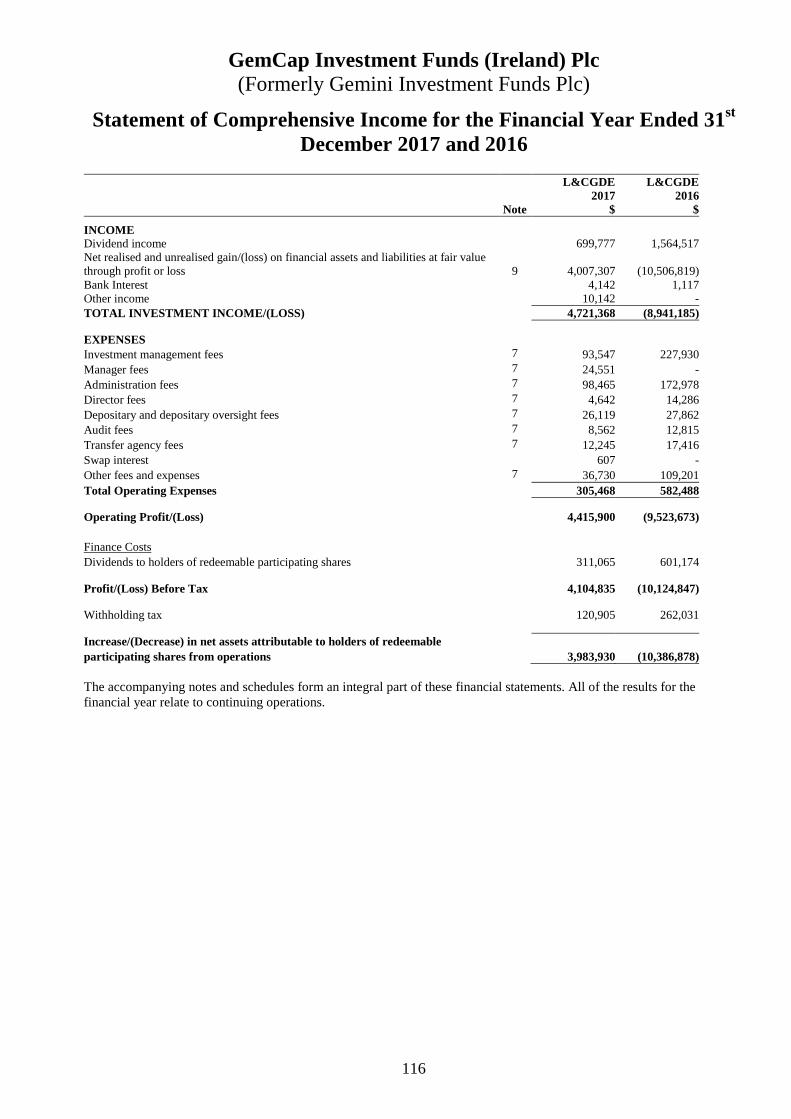
GemCap Investment Funds (Ireland) Plc (Formerly Gemini Investment Funds Plc)
116
Statement of Comprehensive Income for the Financial Year Ended 31st December 2017 and 2016
L&CGDE L&CGDE
2017 2016 Note $ $
INCOME Dividend income 699,777 1,564,517 Net realised and unrealised gain/(loss) on financial assets and liabilities at fair value through profit or loss 9 4,007,307 (10,506,819) Bank Interest 4,142 1,117 Other income 10,142 - TOTAL INVESTMENT INCOME/(LOSS) 4,721,368 (8,941,185) EXPENSES Investment management fees 7 93,547 227,930 Manager fees 7 24,551 - Administration fees 7 98,465 172,978 Director fees 7 4,642 14,286 Depositary and depositary oversight fees 7 26,119 27,862 Audit fees 7 8,562 12,815 Transfer agency fees 7 12,245 17,416 Swap interest 607 - Other fees and expenses 7 36,730 109,201 Total Operating Expenses 305,468 582,488 Operating Profit/(Loss) 4,415,900 (9,523,673) Finance Costs Dividends to holders of redeemable participating shares 311,065 601,174 Profit/(Loss) Before Tax 4,104,835 (10,124,847) Withholding tax 120,905 262,031 Increase/(Decrease) in net assets attributable to holders of redeemable participating shares from operations 3,983,930 (10,386,878) The accompanying notes and schedules form an integral part of these financial statements. All of the results for the financial year relate to continuing operations.
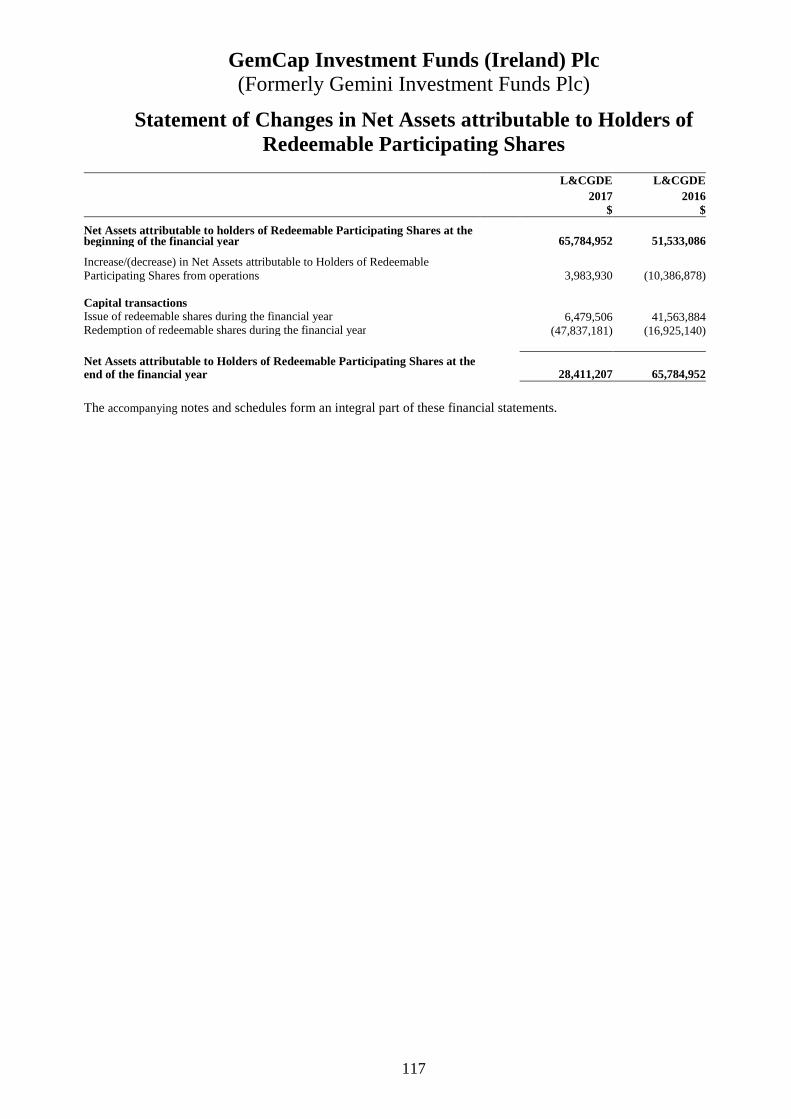
GemCap Investment Funds (Ireland) Plc (Formerly Gemini Investment Funds Plc)
117
Statement of Changes in Net Assets attributable to Holders of Redeemable Participating Shares
The accompanying notes and schedules form an integral part of these financial statements.
L&CGDE L&CGDE 2017 2016
$ $ Net Assets attributable to holders of Redeemable Participating Shares at the beginning of the financial year
65,784,952 51,533,086
Increase/(decrease) in Net Assets attributable to Holders of Redeemable Participating Shares from operations 3,983,930 (10,386,878) Capital transactions Issue of redeemable shares during the financial year 6,479,506 41,563,884Redemption of redeemable shares during the financial year (47,837,181) (16,925,140)
Net Assets attributable to Holders of Redeemable Participating Shares at the end of the financial year
28,411,207 65,784,952
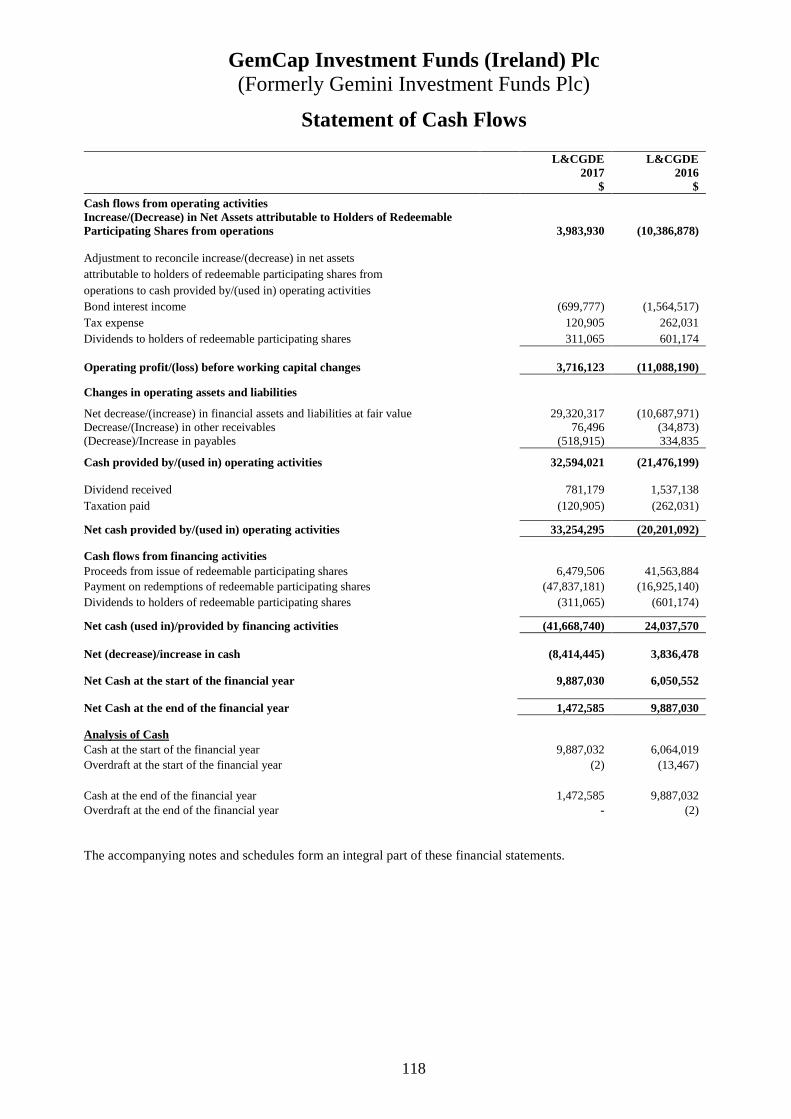
GemCap Investment Funds (Ireland) Plc (Formerly Gemini Investment Funds Plc)
118
Statement of Cash Flows
L&CGDE L&CGDE 2017 2016 $ $ Cash flows from operating activities Increase/(Decrease) in Net Assets attributable to Holders of Redeemable Participating Shares from operations 3,983,930 (10,386,878) Adjustment to reconcile increase/(decrease) in net assets attributable to holders of redeemable participating shares from operations to cash provided by/(used in) operating activities Bond interest income (699,777) (1,564,517) Tax expense 120,905 262,031 Dividends to holders of redeemable participating shares 311,065 601,174 Operating profit/(loss) before working capital changes 3,716,123 (11,088,190) Changes in operating assets and liabilities Net decrease/(increase) in financial assets and liabilities at fair value 29,320,317 (10,687,971) Decrease/(Increase) in other receivables 76,496 (34,873) (Decrease)/Increase in payables (518,915) 334,835 Cash provided by/(used in) operating activities 32,594,021 (21,476,199)
Dividend received 781,179 1,537,138 Taxation paid (120,905) (262,031) Net cash provided by/(used in) operating activities 33,254,295 (20,201,092) Cash flows from financing activities Proceeds from issue of redeemable participating shares 6,479,506 41,563,884 Payment on redemptions of redeemable participating shares (47,837,181) (16,925,140) Dividends to holders of redeemable participating shares (311,065) (601,174) Net cash (used in)/provided by financing activities (41,668,740) 24,037,570
Net (decrease)/increase in cash (8,414,445) 3,836,478 Net Cash at the start of the financial year 9,887,030 6,050,552 Net Cash at the end of the financial year 1,472,585 9,887,030 Analysis of Cash Cash at the start of the financial year 9,887,032 6,064,019 Overdraft at the start of the financial year (2) (13,467) Cash at the end of the financial year 1,472,585 9,887,032 Overdraft at the end of the financial year - (2) The accompanying notes and schedules form an integral part of these financial statements.

GemCap Investment Funds (Ireland) Plc (Formerly Gemini Investment Funds Plc)
119
Schedule of Investments As at 31st December 2017
London & Capital Global Defensive Equity Fund
(expressed in USD) Acquisition Fair % net Description Quantity Currency cost value assets
1) INVESTMENTS
A) TRANSFERABLE SECURITIES ADMITTED TO AN OFFICIAL STOCK EXCHANGE LISTING
1) LISTED SECURITIES : EQUITIES
FRANCE Bouygues SA 8,633 EUR 418,583 448,973 1.58 Danone SA 11,291 EUR 841,325 948,398 3.34 Vinci SA 9,515 EUR 905,845 972,891 3.42
2,165,753 2,370,262 8.34
GERMANY BASF SE 5,050 EUR 559,132 556,315 1.96
559,132 556,315 1.96
GREAT BRITAIN Cineworld Group Plc 52,275 GBP 477,655 424,997 1.49 Imperial Brands Plc 10,598 GBP 555,796 453,892 1.60 1,033,451 878,889 3.09
IRELAND Accenture Plc 7,717 USD 807,077 1,181,396 4.16
807,077 1,181,396 4.16
NETHERLANDS PostNL NV 119,413 EUR 604,481 584,462 2.06
604,481 584,462 2.06
SWITZERLAND Nestle SA 9,715 CHF 722,840 835,420 2.94
722,840 835,420 2.94
UNITED STATES (U.S.A.) Booz Allen Hamilton Holding Corp 17,035 USD 576,642 649,545 2.29 International Business Machines Corp 7,378 USD 1,080,492 1,131,933 3.98 Kellogg Co 18,439 USD 1,365,990 1,253,483 4.41 PepsiCo Inc 10,321 USD 1,027,562 1,237,694 4.36 Procter & Gamble Co 12,641 USD 1,004,434 1,161,455 4.09 Quest Diagnostics Inc 6,124 USD 560,803 603,153 2.12 Union Pacific Corp 9,917 USD 1,107,512 1,329,870 4.68 United Parcel Service Inc 9,577 USD 1,107,625 1,141,100 4.02 United Technologies Corp 9,907 USD 1,201,437 1,263,836 4.45 Walt Disney Co 11,667 USD 1,159,493 1,254,319 4.41
10,191,990 11,026,388 38.81
TOTAL LISTED SECURITIES : EQUITIES 16,084,724 17,433,132 61.36
TOTAL TRANSFERABLE SECURITIES ADMITTED TO AN OFFICIAL STOCK EXCHANGE LISTING 16,084,724 17,433,132 61.36
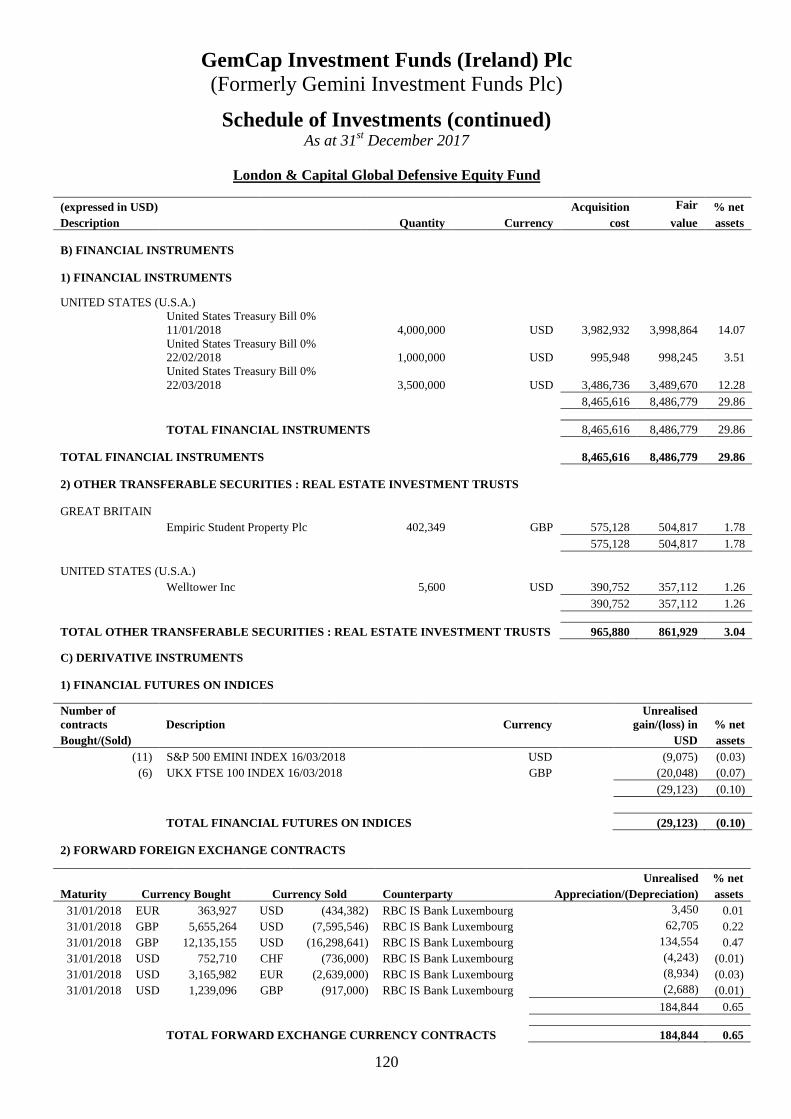
GemCap Investment Funds (Ireland) Plc (Formerly Gemini Investment Funds Plc)
120
Schedule of Investments (continued) As at 31st December 2017
London & Capital Global Defensive Equity Fund
(expressed in USD) Acquisition Fair % net Description Quantity Currency cost value assets
B) FINANCIAL INSTRUMENTS
1) FINANCIAL INSTRUMENTS
UNITED STATES (U.S.A.) United States Treasury Bill 0% 11/01/2018 4,000,000 USD 3,982,932 3,998,864 14.07 United States Treasury Bill 0% 22/02/2018 1,000,000 USD 995,948 998,245 3.51 United States Treasury Bill 0% 22/03/2018 3,500,000 USD 3,486,736 3,489,670 12.28
8,465,616 8,486,779 29.86
TOTAL FINANCIAL INSTRUMENTS 8,465,616 8,486,779 29.86
TOTAL FINANCIAL INSTRUMENTS 8,465,616 8,486,779 29.86
2) OTHER TRANSFERABLE SECURITIES : REAL ESTATE INVESTMENT TRUSTS
GREAT BRITAIN Empiric Student Property Plc 402,349 GBP 575,128 504,817 1.78
575,128 504,817 1.78 UNITED STATES (U.S.A.)
Welltower Inc 5,600 USD 390,752 357,112 1.26 390,752 357,112 1.26
TOTAL OTHER TRANSFERABLE SECURITIES : REAL ESTATE INVESTMENT TRUSTS 965,88 0 861,929 3.04
C) DERIVATIVE INSTRUMENTS
1) FINANCIAL FUTURES ON INDICES
Number of contracts Description Currency
Unrealised gain/(loss) in % net
Bought/(Sold) USD assets (11) S&P 500 EMINI INDEX 16/03/2018 USD (9,075) (0.03) (6) UKX FTSE 100 INDEX 16/03/2018 GBP (20,048) (0.07)
(29,123) (0.10)
TOTAL FINANCIAL FUTURES ON INDICES (29,123) (0.10)
2) FORWARD FOREIGN EXCHANGE CONTRACTS
Unrealised % net Maturity Currency Bought Currency Sold Counterparty Appreciation/(Depreciation) assets 31/01/2018 EUR 363,927 USD (434,382) RBC IS Bank Luxembourg 3,450 0.01 31/01/2018 GBP 5,655,264 USD (7,595,546) RBC IS Bank Luxembourg 62,705 0.22 31/01/2018 GBP 12,135,155 USD (16,298,641) RBC IS Bank Luxembourg 134,554 0.47 31/01/2018 USD 752,710 CHF (736,000) RBC IS Bank Luxembourg (4,243) (0.01) 31/01/2018 USD 3,165,982 EUR (2,639,000) RBC IS Bank Luxembourg (8,934) (0.03) 31/01/2018 USD 1,239,096 GBP (917,000) RBC IS Bank Luxembourg (2,688) (0.01)
184,844 0.65
TOTAL FORWARD EXCHANGE CURRENCY CONTRACTS 184,844 0.65

GemCap Investment Funds (Ireland) Plc (Formerly Gemini Investment Funds Plc)
121
Schedule of Investments (continued) As at 31st December 2017
London & Capital Global Defensive Equity Fund
C) DERIVATIVE INSTRUMENTS (continued)
3) LISTED SECURITIES : OPTIONS
(expressed in USD) Acquisition Fair % net Description Quantity Currency cost value assets
GREAT BRITAIN
Put Ukx Ftse 100 Index 16/03/2018 7050.0 7 GBP 4,825 2,509 0.01 Put Ukx Ftse 100 Index 16/03/2018 7050.0 20 GBP 15,402 7,170 0.03
20,227 9,679 0.04
UNITED STATES (U.S.A.) Put S&p 500 Indices 16/03/2018 2475.0 (20) USD (36,348) (24,400) (0.09) Put S&p 500 Indices 16/03/2018 2565.0 20 USD 58,052 40,500 0.14
21,704 16,100 0.05
TOTAL LISTED SECURITIES : OPTIONS 41,931 25,779 0.09
TOTAL DERIVATIVE INSTRUMENTS 181,500 0.64
TOTAL INVESTMENTS 26,963,340 94.90
OTHER ASSETS 1,485,272 5.23
OTHER LIABILITIES (37,405) (0.13)
NET ASSETS ATTRIBUTABLE TO HOLDERS OF REDEEMABLE PARTICIPATING SHARES 28,411,207 100.00
% of Total Assets
Assets % Investment in Transferable Securities 93.91 Investment in Financial Derivative Instruments 0.64 Cash at Bank 5.16 Other Assets and Liabilities (0.09)
Total Assets 99.62
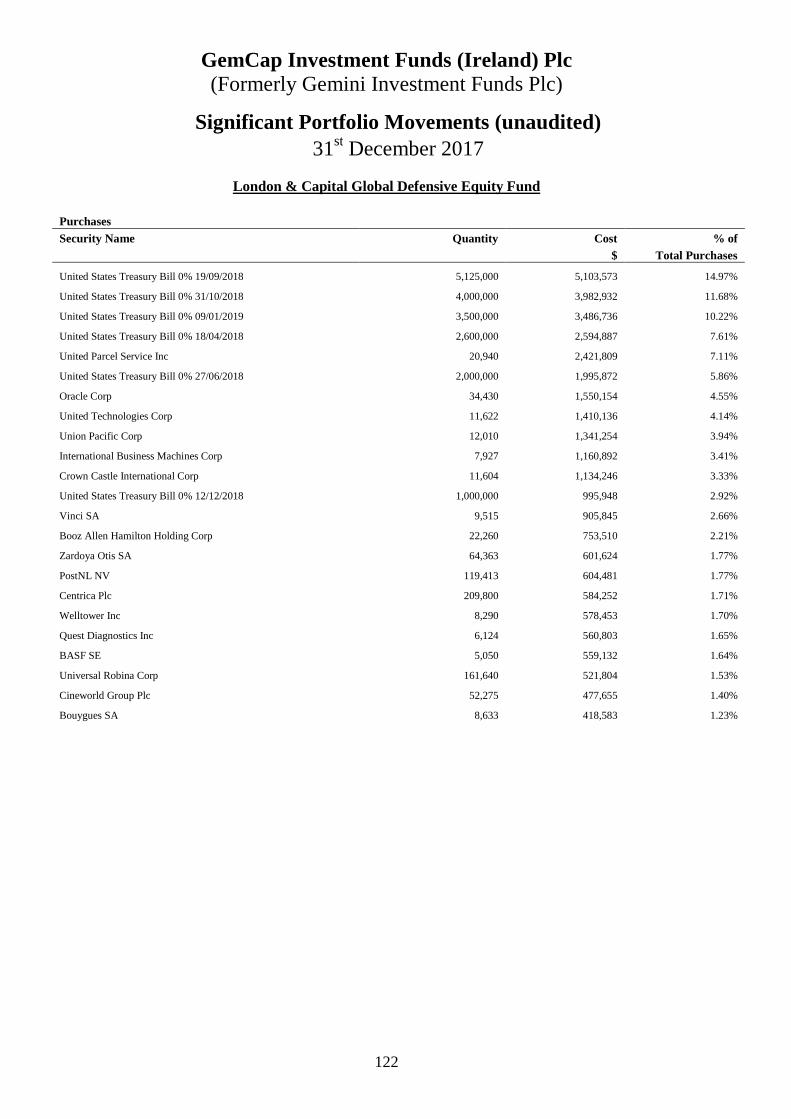
GemCap Investment Funds (Ireland) Plc (Formerly Gemini Investment Funds Plc)
122
Significant Portfolio Movements (unaudited) 31st December 2017
London & Capital Global Defensive Equity Fund
Purchases Security Name Quantity Cost % of $ Total Purchases
United States Treasury Bill 0% 19/09/2018 5,125,000 5,103,573 14.97%
United States Treasury Bill 0% 31/10/2018 4,000,000 3,982,932 11.68%
United States Treasury Bill 0% 09/01/2019 3,500,000 3,486,736 10.22%
United States Treasury Bill 0% 18/04/2018 2,600,000 2,594,887 7.61%
United Parcel Service Inc 20,940 2,421,809 7.11%
United States Treasury Bill 0% 27/06/2018 2,000,000 1,995,872 5.86%
Oracle Corp 34,430 1,550,154 4.55%
United Technologies Corp 11,622 1,410,136 4.14%
Union Pacific Corp 12,010 1,341,254 3.94%
International Business Machines Corp 7,927 1,160,892 3.41%
Crown Castle International Corp 11,604 1,134,246 3.33%
United States Treasury Bill 0% 12/12/2018 1,000,000 995,948 2.92%
Vinci SA 9,515 905,845 2.66%
Booz Allen Hamilton Holding Corp 22,260 753,510 2.21%
Zardoya Otis SA 64,363 601,624 1.77%
PostNL NV 119,413 604,481 1.77%
Centrica Plc 209,800 584,252 1.71%
Welltower Inc 8,290 578,453 1.70%
Quest Diagnostics Inc 6,124 560,803 1.65%
BASF SE 5,050 559,132 1.64%
Universal Robina Corp 161,640 521,804 1.53%
Cineworld Group Plc 52,275 477,655 1.40%
Bouygues SA 8,633 418,583 1.23%
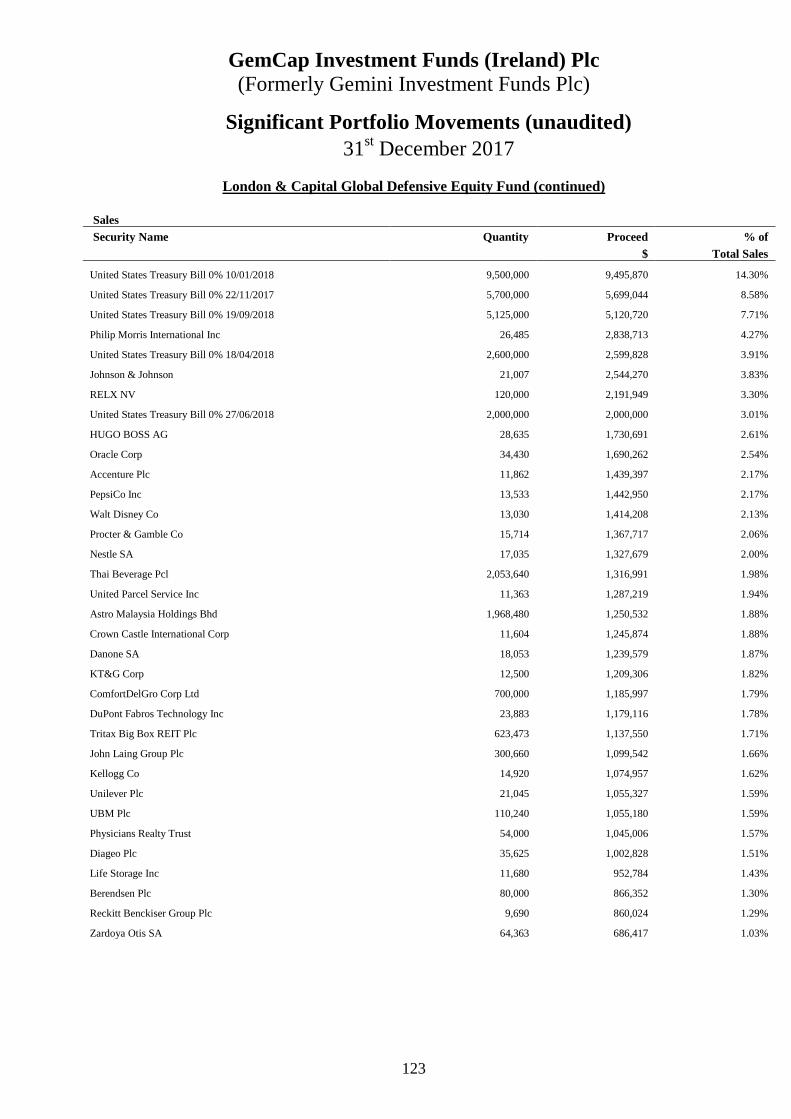
GemCap Investment Funds (Ireland) Plc (Formerly Gemini Investment Funds Plc)
123
Significant Portfolio Movements (unaudited) 31st December 2017
London & Capital Global Defensive Equity Fund (continued)
Sales
Security Name Quantity Proceed % of $ Total Sales
United States Treasury Bill 0% 10/01/2018 9,500,000 9,495,870 14.30%
United States Treasury Bill 0% 22/11/2017 5,700,000 5,699,044 8.58%
United States Treasury Bill 0% 19/09/2018 5,125,000 5,120,720 7.71%
Philip Morris International Inc 26,485 2,838,713 4.27%
United States Treasury Bill 0% 18/04/2018 2,600,000 2,599,828 3.91%
Johnson & Johnson 21,007 2,544,270 3.83%
RELX NV 120,000 2,191,949 3.30%
United States Treasury Bill 0% 27/06/2018 2,000,000 2,000,000 3.01%
HUGO BOSS AG 28,635 1,730,691 2.61%
Oracle Corp 34,430 1,690,262 2.54%
Accenture Plc 11,862 1,439,397 2.17%
PepsiCo Inc 13,533 1,442,950 2.17%
Walt Disney Co 13,030 1,414,208 2.13%
Procter & Gamble Co 15,714 1,367,717 2.06%
Nestle SA 17,035 1,327,679 2.00%
Thai Beverage Pcl 2,053,640 1,316,991 1.98%
United Parcel Service Inc 11,363 1,287,219 1.94%
Astro Malaysia Holdings Bhd 1,968,480 1,250,532 1.88%
Crown Castle International Corp 11,604 1,245,874 1.88%
Danone SA 18,053 1,239,579 1.87%
KT&G Corp 12,500 1,209,306 1.82%
ComfortDelGro Corp Ltd 700,000 1,185,997 1.79%
DuPont Fabros Technology Inc 23,883 1,179,116 1.78%
Tritax Big Box REIT Plc 623,473 1,137,550 1.71%
John Laing Group Plc 300,660 1,099,542 1.66%
Kellogg Co 14,920 1,074,957 1.62%
Unilever Plc 21,045 1,055,327 1.59%
UBM Plc 110,240 1,055,180 1.59%
Physicians Realty Trust 54,000 1,045,006 1.57%
Diageo Plc 35,625 1,002,828 1.51%
Life Storage Inc 11,680 952,784 1.43%
Berendsen Plc 80,000 866,352 1.30%
Reckitt Benckiser Group Plc 9,690 860,024 1.29%
Zardoya Otis SA 64,363 686,417 1.03%
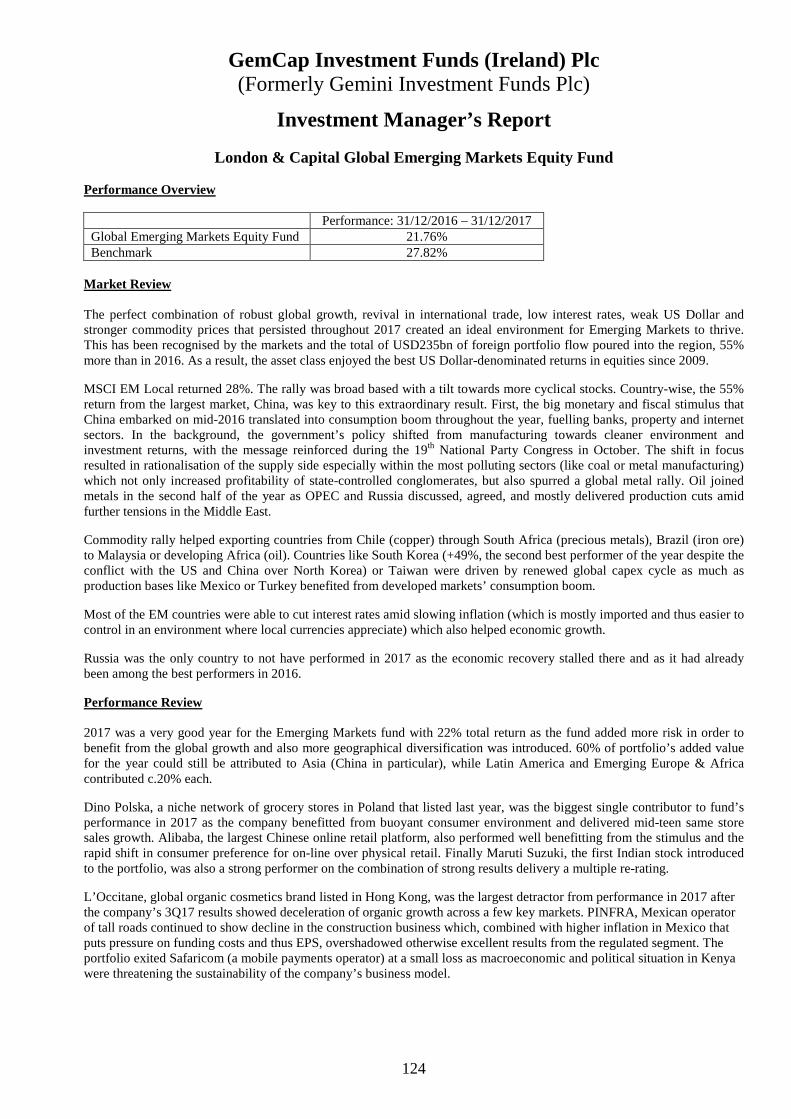
GemCap Investment Funds (Ireland) Plc (Formerly Gemini Investment Funds Plc)
124
Investment Manager’s Report
London & Capital Global Emerging Markets Equity Fund Performance Overview Performance: 31/12/2016 – 31/12/2017 Global Emerging Markets Equity Fund 21.76% Benchmark 27.82%
Market Review The perfect combination of robust global growth, revival in international trade, low interest rates, weak US Dollar and stronger commodity prices that persisted throughout 2017 created an ideal environment for Emerging Markets to thrive. This has been recognised by the markets and the total of USD235bn of foreign portfolio flow poured into the region, 55% more than in 2016. As a result, the asset class enjoyed the best US Dollar-denominated returns in equities since 2009.
MSCI EM Local returned 28%. The rally was broad based with a tilt towards more cyclical stocks. Country-wise, the 55% return from the largest market, China, was key to this extraordinary result. First, the big monetary and fiscal stimulus that China embarked on mid-2016 translated into consumption boom throughout the year, fuelling banks, property and internet sectors. In the background, the government’s policy shifted from manufacturing towards cleaner environment and investment returns, with the message reinforced during the 19th National Party Congress in October. The shift in focus resulted in rationalisation of the supply side especially within the most polluting sectors (like coal or metal manufacturing) which not only increased profitability of state-controlled conglomerates, but also spurred a global metal rally. Oil joined metals in the second half of the year as OPEC and Russia discussed, agreed, and mostly delivered production cuts amid further tensions in the Middle East.
Commodity rally helped exporting countries from Chile (copper) through South Africa (precious metals), Brazil (iron ore) to Malaysia or developing Africa (oil). Countries like South Korea (+49%, the second best performer of the year despite the conflict with the US and China over North Korea) or Taiwan were driven by renewed global capex cycle as much as production bases like Mexico or Turkey benefited from developed markets’ consumption boom.
Most of the EM countries were able to cut interest rates amid slowing inflation (which is mostly imported and thus easier to control in an environment where local currencies appreciate) which also helped economic growth.
Russia was the only country to not have performed in 2017 as the economic recovery stalled there and as it had already been among the best performers in 2016.
Performance Review 2017 was a very good year for the Emerging Markets fund with 22% total return as the fund added more risk in order to benefit from the global growth and also more geographical diversification was introduced. 60% of portfolio’s added value for the year could still be attributed to Asia (China in particular), while Latin America and Emerging Europe & Africa contributed c.20% each.
Dino Polska, a niche network of grocery stores in Poland that listed last year, was the biggest single contributor to fund’s performance in 2017 as the company benefitted from buoyant consumer environment and delivered mid-teen same store sales growth. Alibaba, the largest Chinese online retail platform, also performed well benefitting from the stimulus and the rapid shift in consumer preference for on-line over physical retail. Finally Maruti Suzuki, the first Indian stock introduced to the portfolio, was also a strong performer on the combination of strong results delivery a multiple re-rating.
L’Occitane, global organic cosmetics brand listed in Hong Kong, was the largest detractor from performance in 2017 after the company’s 3Q17 results showed deceleration of organic growth across a few key markets. PINFRA, Mexican operator of tall roads continued to show decline in the construction business which, combined with higher inflation in Mexico that puts pressure on funding costs and thus EPS, overshadowed otherwise excellent results from the regulated segment. The portfolio exited Safaricom (a mobile payments operator) at a small loss as macroeconomic and political situation in Kenya were threatening the sustainability of the company’s business model.

GemCap Investment Funds (Ireland) Plc (Formerly Gemini Investment Funds Plc)
125
Investment Manager’s Report (Continued)
London & Capital Global Emerging Markets Equity Fund (Continued)
Outlook
2018 has the good growth momentum and thus portfolio flows continue into Emerging Markets and thus could experience another good year, especially in relation to developed world, as the valuations are still not stretched and the confluence of positive factors has only started translating into strong profit growth. This would be particularly true if the US Dollar weakness persisted in 2018.
However, we can see a number of risks mounting as we go throughout the year. First of all, the return of volatility and the first sign of higher bond yields. This is unlikely to leave peripheral asset classes unaffected.
Second, 2018 shapes up to be a very busy year on the political front in Emerging Markets. Nafta negotiations critical to Mexico and China-US-Europe import duty threats to tensions in North Korea (would affect Asia disproportionately) all seem ignored for now and the risk does not seem priced in. Conversely, 8 general elections and 5 presidential elections (with 4 of them in Latin America) seem to receive more attention, but could still yield temporary volatility, especially in Mexico, Brazil and Thailand.
The portfolio decreased exposure to Hong Kong towards the end of the year as Chinese government has been increasing measures to curb asset bubbles and capital outflow which might lead to negative growth surprises going forward (in contrast to the positive impulse in the last few quarters). Even though we do not see a reason to rotate out of cyclicals as valuations of defensive sectors do not look attractive enough yet (maybe except for selective sectors like telecommunications and media), we feel corporate leverage of the former will attract increasing scrutiny as interest rate raise. For the same reason, we will also focus more on external macroeconomic vulnerabilities of specific countries in case the risk of too rapid monetary tightening increases significantly.
Renata Klita London and Capital Asset Management Limited Date: February 2018
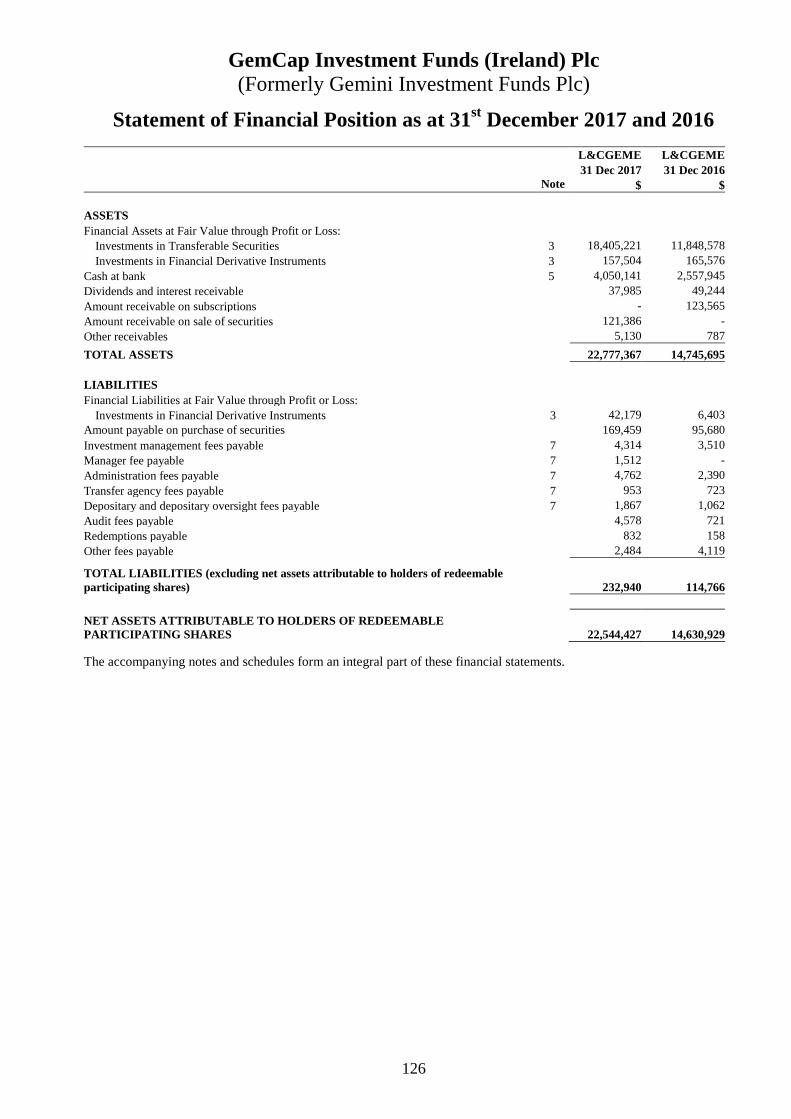
GemCap Investment Funds (Ireland) Plc (Formerly Gemini Investment Funds Plc)
126
Statement of Financial Position as at 31st December 2017 and 2016
L&CGEME L&CGEME 31 Dec 2017 31 Dec 2016 Note $ $
ASSETS Financial Assets at Fair Value through Profit or Loss:
Investments in Transferable Securities 3 18,405,221 11,848,578Investments in Financial Derivative Instruments 3 157,504 165,576
Cash at bank 5 4,050,141 2,557,945Dividends and interest receivable 37,985 49,244Amount receivable on subscriptions - 123,565Amount receivable on sale of securities 121,386 -Other receivables 5,130 787
TOTAL ASSETS 22,777,367 14,745,695 LIABILITIES Financial Liabilities at Fair Value through Profit or Loss:
Investments in Financial Derivative Instruments 3 42,179 6,403Amount payable on purchase of securities 169,459 95,680Investment management fees payable 7 4,314 3,510Manager fee payable 7 1,512 -Administration fees payable 7 4,762 2,390Transfer agency fees payable 7 953 723Depositary and depositary oversight fees payable 7 1,867 1,062Audit fees payable 4,578 721Redemptions payable 832 158Other fees payable 2,484 4,119
TOTAL LIABILITIES (excluding net assets attributable to ho lders of redeemable participating shares) 232,940 114,766
NET ASSETS ATTRIBUTABLE TO HOLDERS OF REDEEMABLE PARTICIPATING SHARES 22,544,427 14,630,929 The accompanying notes and schedules form an integral part of these financial statements.
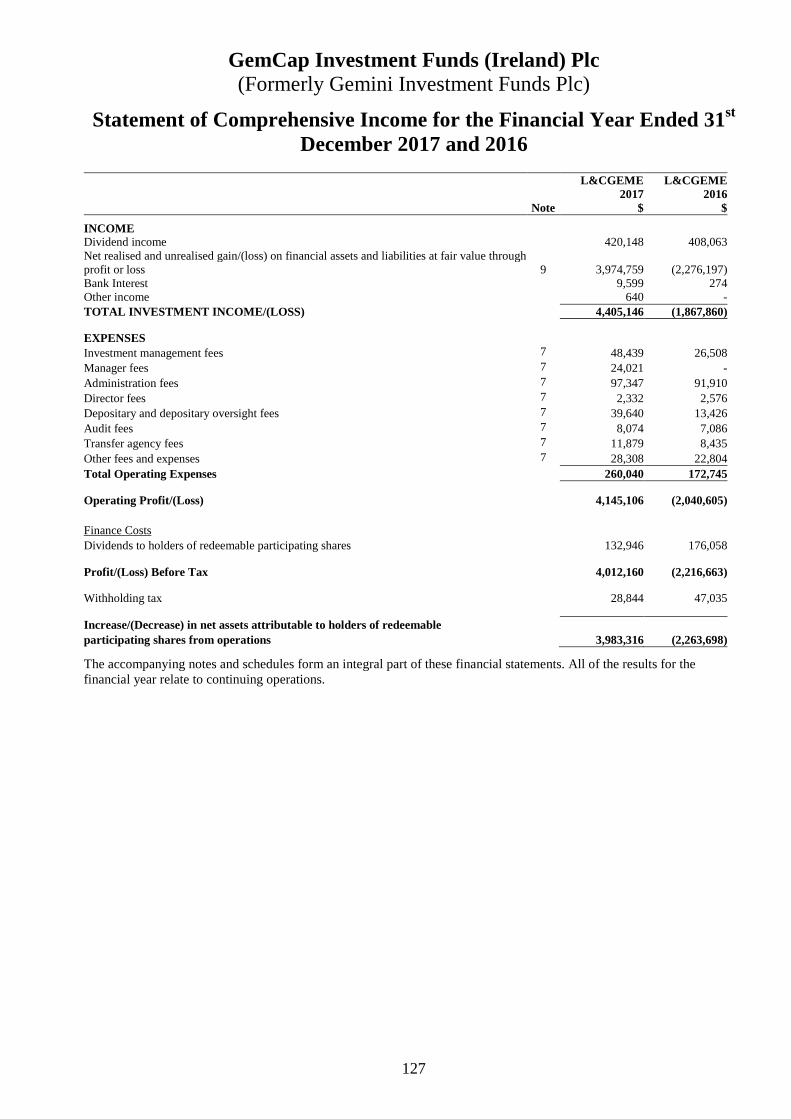
GemCap Investment Funds (Ireland) Plc (Formerly Gemini Investment Funds Plc)
127
Statement of Comprehensive Income for the Financial Year Ended 31st December 2017 and 2016
L&CGEME L&CGEME
2017 2016 Note $ $
INCOME Dividend income 420,148 408,063Net realised and unrealised gain/(loss) on financial assets and liabilities at fair value through profit or loss 9 3,974,759 (2,276,197)Bank Interest 9,599 274Other income 640 -TOTAL INVESTMENT INCOME/(LOSS) 4,405,146 (1,867,860) EXPENSES Investment management fees 7 48,439 26,508Manager fees 7 24,021 -Administration fees 7 97,347 91,910Director fees 7 2,332 2,576Depositary and depositary oversight fees 7 39,640 13,426Audit fees 7 8,074 7,086Transfer agency fees 7 11,879 8,435Other fees and expenses 7 28,308 22,804Total Operating Expenses 260,040 172,745 Operating Profit/(Loss) 4,145,106 (2,040,605) Finance Costs Dividends to holders of redeemable participating shares 132,946 176,058 Profit/(Loss) Before Tax 4,012,160 (2,216,663) Withholding tax 28,844 47,035 Increase/(Decrease) in net assets attributable to holders of redeemable participating shares from operations 3,983,316 (2,263,698)
The accompanying notes and schedules form an integral part of these financial statements. All of the results for the financial year relate to continuing operations.

GemCap Investment Funds (Ireland) Plc (Formerly Gemini Investment Funds Plc)
128
Statement of Changes in Net Assets attributable to Holders of Redeemable Participating Shares
The accompanying notes and schedules form an integral part of these financial statements.
L&CGEME L&CGEM E 2017 2016 $ $ Net Assets attributable to holders of Redeemable Participating Shares at the beginning of the financial year
14,630,929 16,111,828
Increase/(decrease) in Net Assets attributable to Holders of Redeemable Participating Shares from operations 3,983,316 (2,263,698) Capital transactions Issue of redeemable shares during the financial year 10,336,727 10,979,932Redemption of redeemable shares during the financial year (6,406,545) (10,197,133) Net Assets attributable to Holders of Redeemable Participating Shares at the end of the financial year
22,544,427 14,630,929
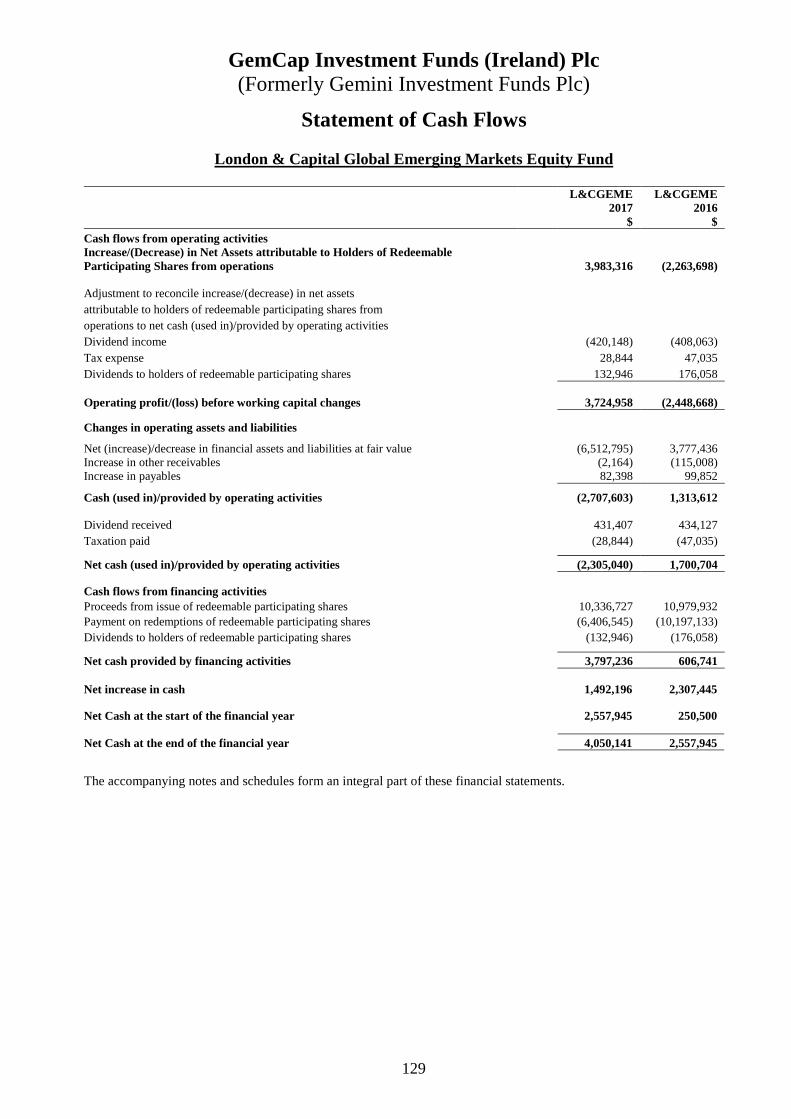
GemCap Investment Funds (Ireland) Plc (Formerly Gemini Investment Funds Plc)
129
Statement of Cash Flows
London & Capital Global Emerging Markets Equity Fund
L&CGEME L&CGEME 2017 2016 $ $ Cash flows from operating activities Increase/(Decrease) in Net Assets attributable to Holders of Redeemable Participating Shares from operations 3,983,316 (2,263,698) Adjustment to reconcile increase/(decrease) in net assets attributable to holders of redeemable participating shares from operations to net cash (used in)/provided by operating activities Dividend income (420,148) (408,063) Tax expense 28,844 47,035 Dividends to holders of redeemable participating shares 132,946 176,058 Operating profit/(loss) before working capital changes 3,724,958 (2,448,668) Changes in operating assets and liabilities Net (increase)/decrease in financial assets and liabilities at fair value (6,512,795) 3,777,436 Increase in other receivables (2,164) (115,008) Increase in payables 82,398 99,852 Cash (used in)/provided by operating activities (2,707,603) 1,313,612
Dividend received 431,407 434,127 Taxation paid (28,844) (47,035) Net cash (used in)/provided by operating activities (2,305,040) 1,700,704 Cash flows from financing activities Proceeds from issue of redeemable participating shares 10,336,727 10,979,932 Payment on redemptions of redeemable participating shares (6,406,545) (10,197,133) Dividends to holders of redeemable participating shares (132,946) (176,058) Net cash provided by financing activities 3,797,236 606,741
Net increase in cash 1,492,196 2,307,445 Net Cash at the start of the financial year 2,557,945 250,500 Net Cash at the end of the financial year 4,050,141 2,557,945 The accompanying notes and schedules form an integral part of these financial statements.
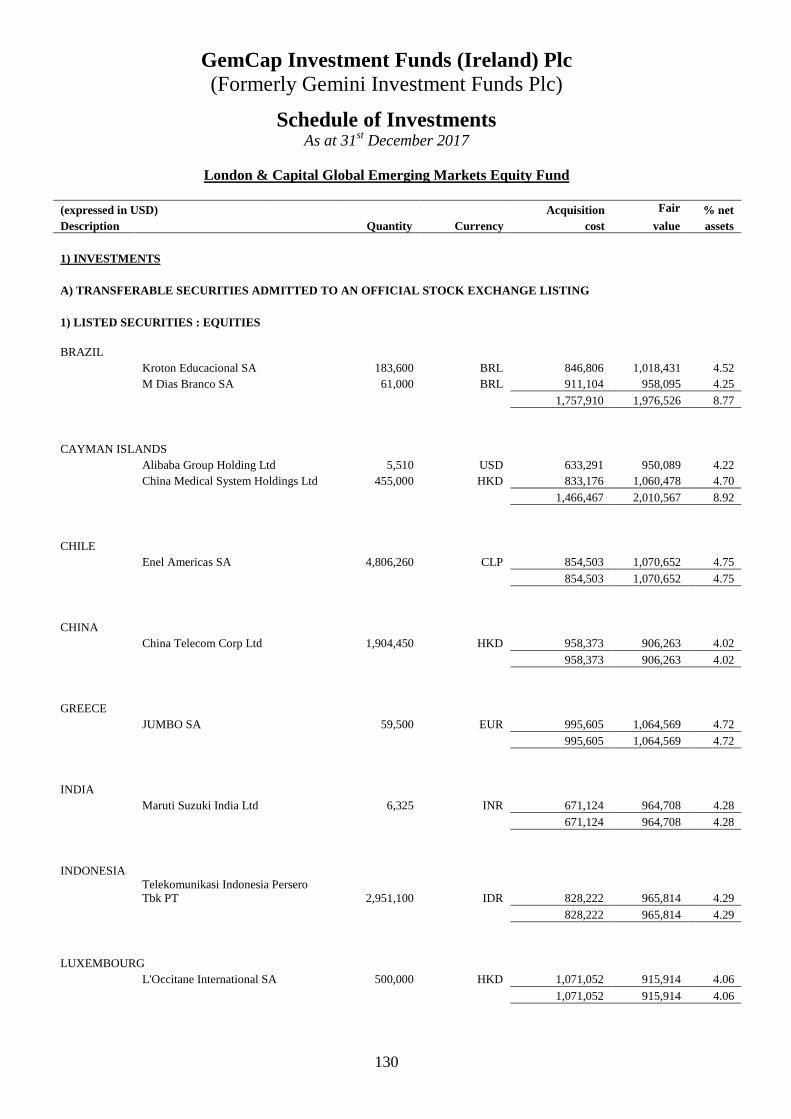
GemCap Investment Funds (Ireland) Plc (Formerly Gemini Investment Funds Plc)
130
Schedule of Investments As at 31st December 2017
London & Capital Global Emerging Markets Equity Fund
(expressed in USD) Acquisition Fair % net Description Quantity Currency cost value assets
1) INVESTMENTS
A) TRANSFERABLE SECURITIES ADMITTED TO AN OFFICIAL STOCK EXCHANGE LISTING
1) LISTED SECURITIES : EQUITIES
BRAZIL Kroton Educacional SA 183,600 BRL 846,806 1,018,431 4.52 M Dias Branco SA 61,000 BRL 911,104 958,095 4.25
1,757,910 1,976,526 8.77
CAYMAN ISLANDS Alibaba Group Holding Ltd 5,510 USD 633,291 950,089 4.22 China Medical System Holdings Ltd 455,000 HKD 833,176 1,060,478 4.70
1,466,467 2,010,567 8.92
CHILE Enel Americas SA 4,806,260 CLP 854,503 1,070,652 4.75
854,503 1,070,652 4.75
CHINA China Telecom Corp Ltd 1,904,450 HKD 958,373 906,263 4.02
958,373 906,263 4.02
GREECE JUMBO SA 59,500 EUR 995,605 1,064,569 4.72
995,605 1,064,569 4.72
INDIA Maruti Suzuki India Ltd 6,325 INR 671,124 964,708 4.28
671,124 964,708 4.28
INDONESIA Telekomunikasi Indonesia Persero Tbk PT 2,951,100 IDR 828,222 965,814 4.29
828,222 965,814 4.29
LUXEMBOURG L'Occitane International SA 500,000 HKD 1,071,052 915,914 4.06
1,071,052 915,914 4.06

GemCap Investment Funds (Ireland) Plc (Formerly Gemini Investment Funds Plc)
131
Schedule of Investments (continued) As at 31st December 2017
London & Capital Global Emerging Markets Equity Fund
(expressed in USD) Acquisition Fair % net Description Quantity Currency cost value assets
A) TRANSFERABLE SECURITIES ADMITTED TO AN OFFICIAL STOCK EXCHANGE LISTING (continued)
1) LISTED SECURITIES : EQUITIES (continued)
MALAYSIA Astro Malaysia Holdings Bhd 1,455,500 MYR 980,445 953,072 4.23
980,445 953,072 4.23
MEXICO Arca Continental SAB de CV 135,402 MXN 806,401 942,212 4.18 Grupo Aeroportuario del Sureste SAB de CV 51,500 MXN 945,085 944,052 4.19 Promotora y Operadora de Infraestructura SAB de CV 93,250 MXN 979,279 925,892 4.11
2,730,765 2,812,156 12.48
PHILIPPINES Universal Robina Corp 314,900 PHP 953,429 952,520 4.23
953,429 952,520 4.23
POLAND Dino Polska SA 47,700 PLN 614,723 1,081,719 4.80
614,723 1,081,719 4.80
SOUTH KOREA KT&G Corp 8,325 KRW 793,024 898,076 3.98
793,024 898,076 3.98
TAIWAN Taiwan Semiconductor Manufacturing Co Ltd 23,400 USD 775,261 927,810 4.12
775,261 927,810 4.12
THAILAND Thai Beverage PCL 1,314,400 SGD 798,513 904,855 4.01
798,513 904,855 4.01
TOTAL LISTED SECURITIES : EQUITIES 16,249,416 18,405,221 81.66
TOTAL TRANSFERABLE SECURITIES ADMITTED TO AN OFFICIAL STOCK EXCHANGE LISTING 16,249,416 18,405,221 81.66
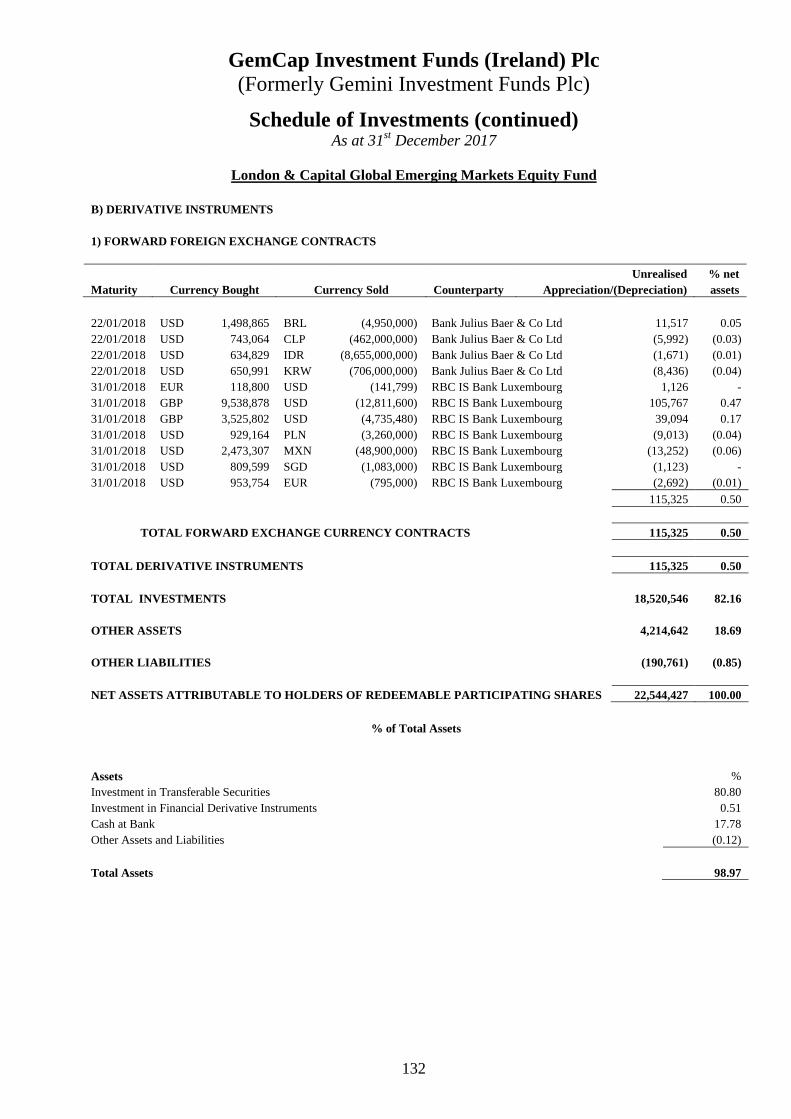
GemCap Investment Funds (Ireland) Plc (Formerly Gemini Investment Funds Plc)
132
Schedule of Investments (continued) As at 31st December 2017
London & Capital Global Emerging Markets Equity Fund
B) DERIVATIVE INSTRUMENTS
1) FORWARD FOREIGN EXCHANGE CONTRACTS
Unrealised % net Maturity Currency Bought Currency Sold Counterparty Appreciation/(Depreciation) assets
22/01/2018 USD 1,498,865 BRL (4,950,000) Bank Julius Baer & Co Ltd 11,517 0.05 22/01/2018 USD 743,064 CLP (462,000,000) Bank Julius Baer & Co Ltd (5,992) (0.03) 22/01/2018 USD 634,829 IDR (8,655,000,000) Bank Julius Baer & Co Ltd (1,671) (0.01) 22/01/2018 USD 650,991 KRW (706,000,000) Bank Julius Baer & Co Ltd (8,436) (0.04) 31/01/2018 EUR 118,800 USD (141,799) RBC IS Bank Luxembourg 1,126 - 31/01/2018 GBP 9,538,878 USD (12,811,600) RBC IS Bank Luxembourg 105,767 0.47 31/01/2018 GBP 3,525,802 USD (4,735,480) RBC IS Bank Luxembourg 39,094 0.17 31/01/2018 USD 929,164 PLN (3,260,000) RBC IS Bank Luxembourg (9,013) (0.04) 31/01/2018 USD 2,473,307 MXN (48,900,000) RBC IS Bank Luxembourg (13,252) (0.06) 31/01/2018 USD 809,599 SGD (1,083,000) RBC IS Bank Luxembourg (1,123) - 31/01/2018 USD 953,754 EUR (795,000) RBC IS Bank Luxembourg (2,692) (0.01)
115,325 0.50
TOTAL FORWARD EXCHANGE CURRENCY CONTRACTS 115,325 0.50
TOTAL DERIVATIVE INSTRUMENTS 115,325 0.50
TOTAL INVESTMENTS 18,520,546 82.16
OTHER ASSETS 4,214,642 18.69
OTHER LIABILITIES (190,761) (0.85)
NET ASSETS ATTRIBUTABLE TO HOLDERS OF REDEEMABLE PARTICIPATING SHARES 22,544,427 100.00
% of Total Assets
Assets % Investment in Transferable Securities 80.80 Investment in Financial Derivative Instruments 0.51 Cash at Bank 17.78 Other Assets and Liabilities (0.12)
Total Assets 98.97
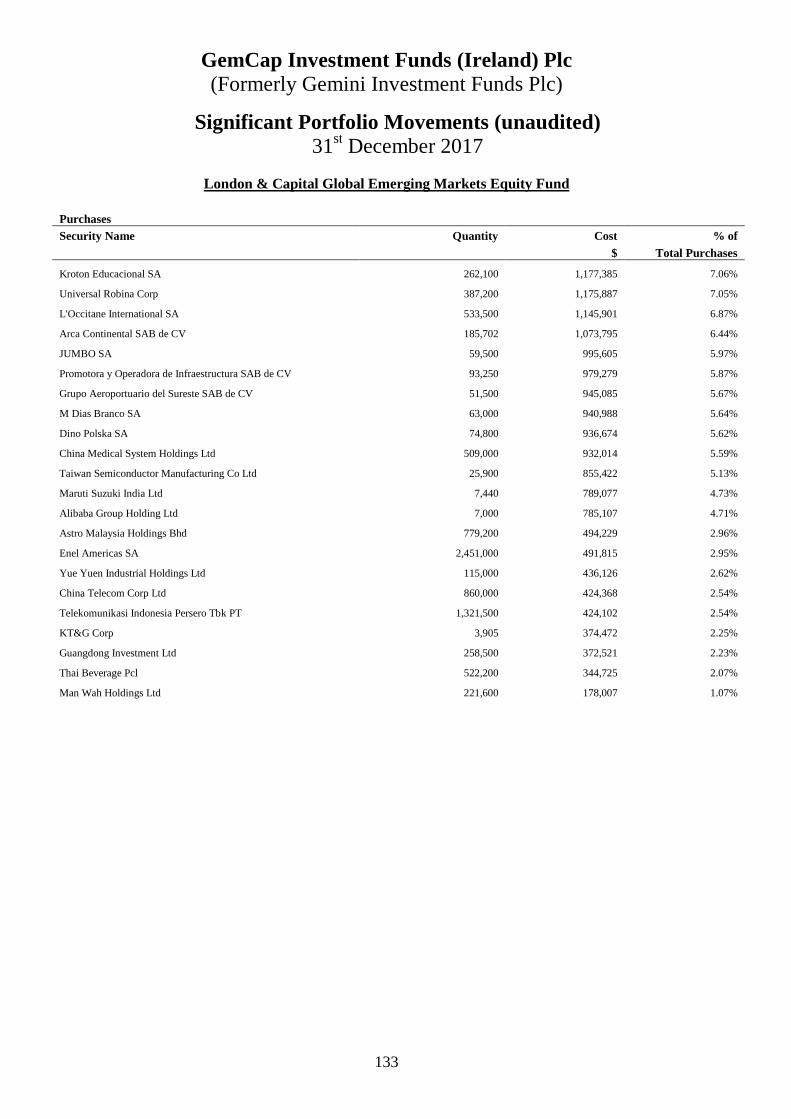
GemCap Investment Funds (Ireland) Plc (Formerly Gemini Investment Funds Plc)
133
Significant Portfolio Movements (unaudited) 31st December 2017
London & Capital Global Emerging Markets Equity Fund
Purchases Security Name Quantity Cost % of $ Total Purchases
Kroton Educacional SA 262,100 1,177,385 7.06%
Universal Robina Corp 387,200 1,175,887 7.05%
L'Occitane International SA 533,500 1,145,901 6.87%
Arca Continental SAB de CV 185,702 1,073,795 6.44%
JUMBO SA 59,500 995,605 5.97%
Promotora y Operadora de Infraestructura SAB de CV 93,250 979,279 5.87%
Grupo Aeroportuario del Sureste SAB de CV 51,500 945,085 5.67%
M Dias Branco SA 63,000 940,988 5.64%
Dino Polska SA 74,800 936,674 5.62%
China Medical System Holdings Ltd 509,000 932,014 5.59%
Taiwan Semiconductor Manufacturing Co Ltd 25,900 855,422 5.13%
Maruti Suzuki India Ltd 7,440 789,077 4.73%
Alibaba Group Holding Ltd 7,000 785,107 4.71%
Astro Malaysia Holdings Bhd 779,200 494,229 2.96%
Enel Americas SA 2,451,000 491,815 2.95%
Yue Yuen Industrial Holdings Ltd 115,000 436,126 2.62%
China Telecom Corp Ltd 860,000 424,368 2.54%
Telekomunikasi Indonesia Persero Tbk PT 1,321,500 424,102 2.54%
KT&G Corp 3,905 374,472 2.25%
Guangdong Investment Ltd 258,500 372,521 2.23%
Thai Beverage Pcl 522,200 344,725 2.07%
Man Wah Holdings Ltd 221,600 178,007 1.07%

GemCap Investment Funds (Ireland) Plc (Formerly Gemini Investment Funds Plc)
134
Significant Portfolio Movements (unaudited) 31st December 2017
London & Capital Global Emerging Markets Equity Fund (continued)
Sales
Security Name Quantity Proceed % of $ Total Sales
Yue Yuen Industrial Holdings Ltd 292,050 1,064,487 7.88%
Guangdong Investment Ltd 767,540 1,061,609 7.86%
Man Wah Holdings Ltd 1,188,800 1,030,811 7.63%
Japan Tobacco Inc 22,220 826,520 6.12%
Kinsus Interconnect Technology Corp 298,860 782,601 5.80%
ComfortDelGro Corp Ltd 459,759 764,658 5.65%
Mondi Ltd 32,850 759,614 5.62%
Great Wall Motor Co Ltd 721,000 759,037 5.61%
Kangwon Land Inc 24,600 756,182 5.59%
Safaricom Ltd 4,149,300 728,175 5.38%
Taiwan Semiconductor Manufacturing Co Ltd 119,500 715,856 5.29%
Chunghwa Telecom Co Ltd 201,200 644,021 4.76%
Dino Polska SA 27,100 449,136 3.32%
Kroton Educacional SA 78,500 407,371 3.01%
Arca Continental SAB de CV 50,300 334,335 2.47%
Enel Americas SA 1,706,700 327,311 2.42%
KT&G Corp 2,980 290,858 2.15%
Astro Malaysia Holdings Bhd 444,800 283,043 2.09%
Telekomunikasi Indonesia Persero Tbk PT 749,000 233,881 1.73%
Alibaba Group Holding Ltd 1,490 217,942 1.61%
Universal Robina Corp 72,300 217,035 1.60%
Thai Beverage Pcl 331,400 213,212 1.58%
China Telecom Corp Ltd 414,000 204,455 1.51%
Maruti Suzuki India Ltd 1,115 159,231 1.18%
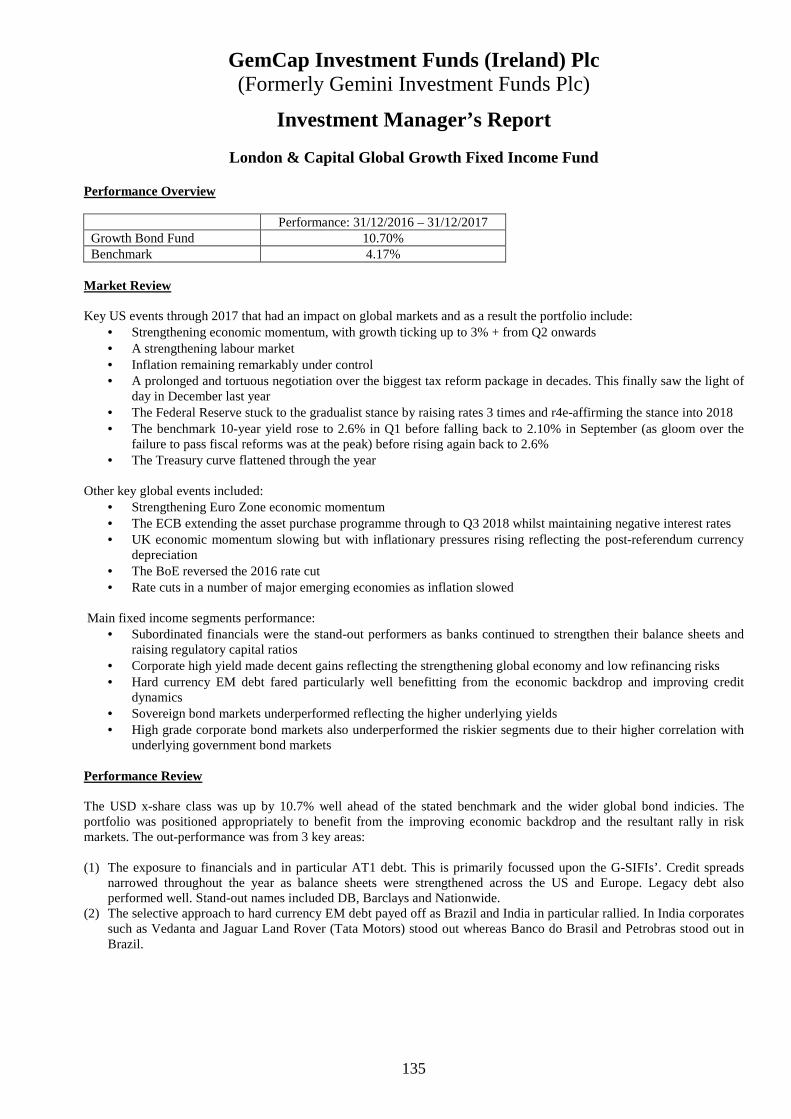
GemCap Investment Funds (Ireland) Plc (Formerly Gemini Investment Funds Plc)
135
Investment Manager’s Report
London & Capital Global Growth Fixed Income Fund Performance Overview Performance: 31/12/2016 – 31/12/2017 Growth Bond Fund 10.70% Benchmark 4.17%
Market Review Key US events through 2017 that had an impact on global markets and as a result the portfolio include:
• Strengthening economic momentum, with growth ticking up to 3% + from Q2 onwards • A strengthening labour market • Inflation remaining remarkably under control • A prolonged and tortuous negotiation over the biggest tax reform package in decades. This finally saw the light of
day in December last year • The Federal Reserve stuck to the gradualist stance by raising rates 3 times and r4e-affirming the stance into 2018 • The benchmark 10-year yield rose to 2.6% in Q1 before falling back to 2.10% in September (as gloom over the
failure to pass fiscal reforms was at the peak) before rising again back to 2.6% • The Treasury curve flattened through the year
Other key global events included:
• Strengthening Euro Zone economic momentum • The ECB extending the asset purchase programme through to Q3 2018 whilst maintaining negative interest rates • UK economic momentum slowing but with inflationary pressures rising reflecting the post-referendum currency
depreciation • The BoE reversed the 2016 rate cut • Rate cuts in a number of major emerging economies as inflation slowed
Main fixed income segments performance:
• Subordinated financials were the stand-out performers as banks continued to strengthen their balance sheets and raising regulatory capital ratios
• Corporate high yield made decent gains reflecting the strengthening global economy and low refinancing risks • Hard currency EM debt fared particularly well benefitting from the economic backdrop and improving credit
dynamics • Sovereign bond markets underperformed reflecting the higher underlying yields • High grade corporate bond markets also underperformed the riskier segments due to their higher correlation with
underlying government bond markets Performance Review The USD x-share class was up by 10.7% well ahead of the stated benchmark and the wider global bond indicies. The portfolio was positioned appropriately to benefit from the improving economic backdrop and the resultant rally in risk markets. The out-performance was from 3 key areas: (1) The exposure to financials and in particular AT1 debt. This is primarily focussed upon the G-SIFIs’. Credit spreads
narrowed throughout the year as balance sheets were strengthened across the US and Europe. Legacy debt also performed well. Stand-out names included DB, Barclays and Nationwide.
(2) The selective approach to hard currency EM debt payed off as Brazil and India in particular rallied. In India corporates such as Vedanta and Jaguar Land Rover (Tata Motors) stood out whereas Banco do Brasil and Petrobras stood out in Brazil.
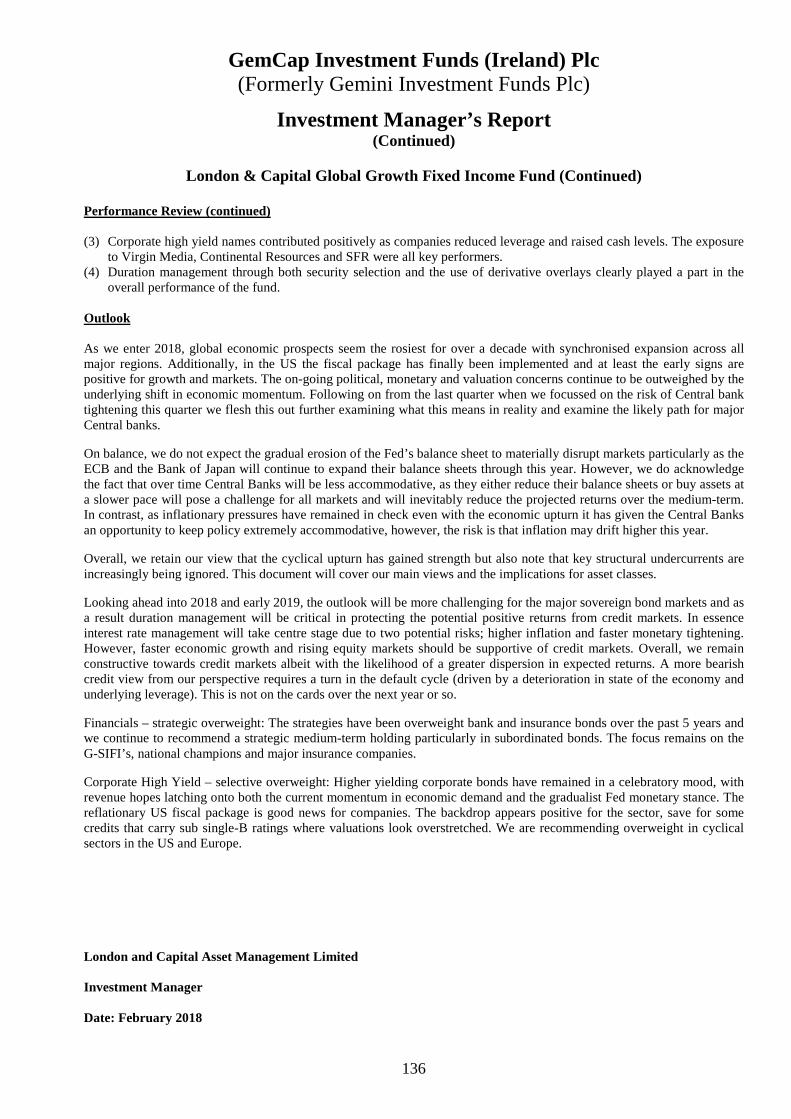
GemCap Investment Funds (Ireland) Plc (Formerly Gemini Investment Funds Plc)
136
Investment Manager’s Report (Continued)
London & Capital Global Growth Fixed Income Fund (Continued)
Performance Review (continued) (3) Corporate high yield names contributed positively as companies reduced leverage and raised cash levels. The exposure
to Virgin Media, Continental Resources and SFR were all key performers. (4) Duration management through both security selection and the use of derivative overlays clearly played a part in the
overall performance of the fund. Outlook As we enter 2018, global economic prospects seem the rosiest for over a decade with synchronised expansion across all major regions. Additionally, in the US the fiscal package has finally been implemented and at least the early signs are positive for growth and markets. The on-going political, monetary and valuation concerns continue to be outweighed by the underlying shift in economic momentum. Following on from the last quarter when we focussed on the risk of Central bank tightening this quarter we flesh this out further examining what this means in reality and examine the likely path for major Central banks.
On balance, we do not expect the gradual erosion of the Fed’s balance sheet to materially disrupt markets particularly as the ECB and the Bank of Japan will continue to expand their balance sheets through this year. However, we do acknowledge the fact that over time Central Banks will be less accommodative, as they either reduce their balance sheets or buy assets at a slower pace will pose a challenge for all markets and will inevitably reduce the projected returns over the medium-term. In contrast, as inflationary pressures have remained in check even with the economic upturn it has given the Central Banks an opportunity to keep policy extremely accommodative, however, the risk is that inflation may drift higher this year.
Overall, we retain our view that the cyclical upturn has gained strength but also note that key structural undercurrents are increasingly being ignored. This document will cover our main views and the implications for asset classes.
Looking ahead into 2018 and early 2019, the outlook will be more challenging for the major sovereign bond markets and as a result duration management will be critical in protecting the potential positive returns from credit markets. In essence interest rate management will take centre stage due to two potential risks; higher inflation and faster monetary tightening. However, faster economic growth and rising equity markets should be supportive of credit markets. Overall, we remain constructive towards credit markets albeit with the likelihood of a greater dispersion in expected returns. A more bearish credit view from our perspective requires a turn in the default cycle (driven by a deterioration in state of the economy and underlying leverage). This is not on the cards over the next year or so.
Financials – strategic overweight: The strategies have been overweight bank and insurance bonds over the past 5 years and we continue to recommend a strategic medium-term holding particularly in subordinated bonds. The focus remains on the G-SIFI’s, national champions and major insurance companies.
Corporate High Yield – selective overweight: Higher yielding corporate bonds have remained in a celebratory mood, with revenue hopes latching onto both the current momentum in economic demand and the gradualist Fed monetary stance. The reflationary US fiscal package is good news for companies. The backdrop appears positive for the sector, save for some credits that carry sub single-B ratings where valuations look overstretched. We are recommending overweight in cyclical sectors in the US and Europe.
London and Capital Asset Management Limited Investment Manager Date: February 2018
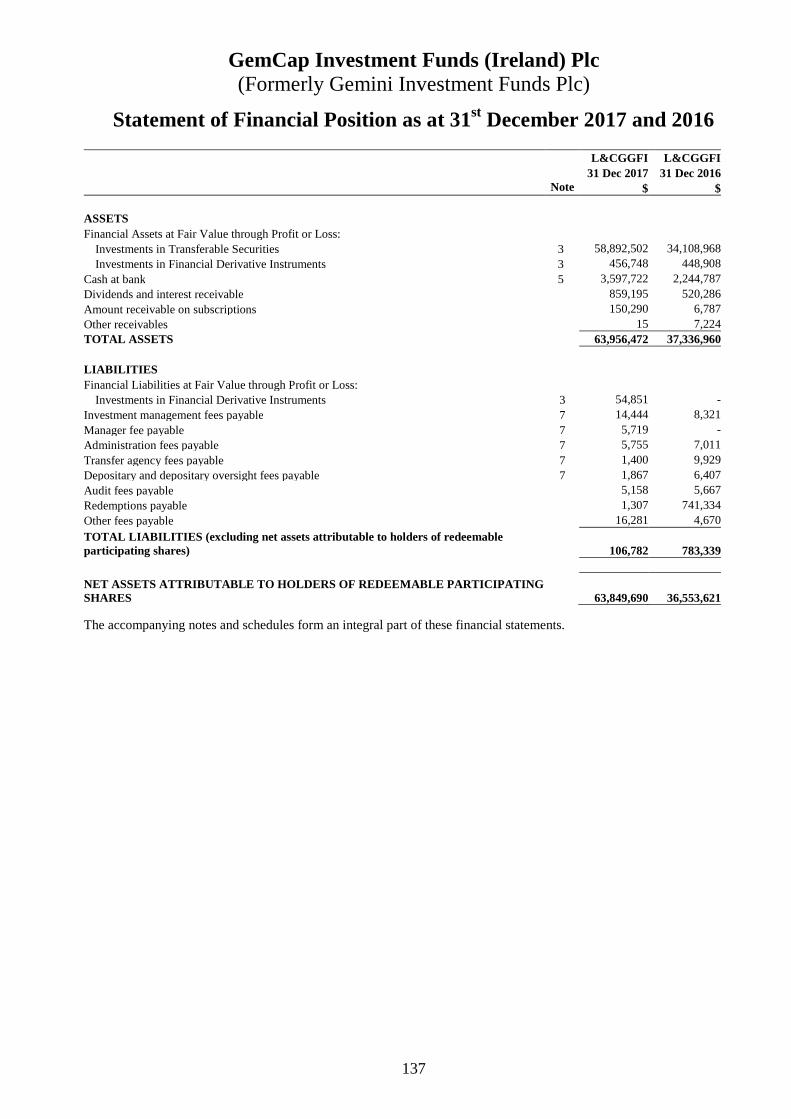
GemCap Investment Funds (Ireland) Plc (Formerly Gemini Investment Funds Plc)
137
Statement of Financial Position as at 31st December 2017 and 2016
L&CGGFI L&CGGFI 31 Dec 2017 31 Dec 2016 Note $ $
ASSETS Financial Assets at Fair Value through Profit or Loss:
Investments in Transferable Securities 3 58,892,502 34,108,968Investments in Financial Derivative Instruments 3 456,748 448,908
Cash at bank 5 3,597,722 2,244,787Dividends and interest receivable 859,195 520,286Amount receivable on subscriptions 150,290 6,787Other receivables 15 7,224TOTAL ASSETS 63,956,472 37,336,960 LIABILITIES Financial Liabilities at Fair Value through Profit or Loss:
Investments in Financial Derivative Instruments 3 54,851 -Investment management fees payable 7 14,444 8,321Manager fee payable 7 5,719 -Administration fees payable 7 5,755 7,011Transfer agency fees payable 7 1,400 9,929Depositary and depositary oversight fees payable 7 1,867 6,407Audit fees payable 5,158 5,667Redemptions payable 1,307 741,334Other fees payable 16,281 4,670
TOTAL LIABILITIES (excluding net assets attributable to ho lders of redeemable participating shares) 106,782 783,339
NET ASSETS ATTRIBUTABLE TO HOLDERS OF REDEEMABLE PARTICIPATING SHARES 63,849,690 36,553,621 The accompanying notes and schedules form an integral part of these financial statements.

GemCap Investment Funds (Ireland) Plc (Formerly Gemini Investment Funds Plc)
138
Statement of Comprehensive Income for the Financial Year Ended 31st December 2017 and 2016
L&CGGFI L&CGGFI
2017 2016 Note $ $
INCOME Dividend income - 78,406 Bond interest income 1,958,469 2,346,630 Net realised and unrealised gain/(loss) on financial assets and liabilities at fair value through profit or loss 9 6,614,901 (5,422,908) Bank Interest 8,333 6 Other income 13,424 10 TOTAL INVESTMENT INCOME/(LOSS) 8,595,127 (2,997,856) EXPENSES Investment management fees 7 137,241 108,010 Manager fees 7 27,299 - Administration fees 7 68,422 70,170 Director fees 7 7,250 6,913 Depositary and depositary oversight fees 7 28,169 16,721 Audit fees 7 7,204 13,726 Transfer agency fees 7 16,213 21,361 Swap interest 332 - Other fees and expenses 7 56,299 94,235 Total Operating Expenses 348,429 331,136 Operating Profit/(Loss) 8,246,698 (3,328,992) Finance Costs Dividends to holders of redeemable participating shares 1,565,794 1,174,485 Profit/(Loss) Before Tax 6,680,904 (4,503,477) Withholding tax 26,530 65,503 Increase/(Decrease) in net assets attributable to holders of redeemable participating shares from operations 6,654,374 (4,568,980)
The accompanying notes and schedules form an integral part of these financial statements. All of the results for the financial year relate to continuing operations.

GemCap Investment Funds (Ireland) Plc (Formerly Gemini Investment Funds Plc)
139
Statement of Changes in Net Assets attributable to Holders of Redeemable Participating Shares
The accompanying notes and schedules form an integral part of these financial statements.
L&CGGFI L&CGGFI 2017 2016 $ $ Net Assets attributable to holders of Redeemable Participating Shares at the beginning of the financial year
36,553,621 46,818,934
Increase/(decrease) in Net Assets attributable to Holders of Redeemable Participating Shares from operations 6,654,374 (4,568,980) Capital transactions Issue of redeemable shares during the financial year 39,639,861 17,655,517Redemption of redeemable shares during the financial year (18,998,166) (23,351,850) Net Assets attributable to Holders of Redeemable Participating Shares at the end of the financial year
63,849,690 36,553,621

GemCap Investment Funds (Ireland) Plc (Formerly Gemini Investment Funds Plc)
140
Statement of Cash Flows
L&CGGFI L&CGGFI 2017 2016 $ $ Cash flows from operating activities Increase/(Decrease) in Net Assets attributable to Holders of Redeemable Participating Shares from operations 6,654,374 (4,568,980) Adjustment to reconcile increase/(decrease) in net assets attributable to holders of redeemable participating shares from operations to net cash (used in)/provided by operating activities Bond interest income (1,958,469) (2,346,630) Dividend income - (78,406) Tax expense 26,530 65,503 Dividends to holders of redeemable participating shares 1,565,794 1,174,485 Operating profit/(loss) before working capital changes 6,288,229 (5,754,028) Changes in operating assets and liabilities Net (increase)/decrease in financial assets and liabilities at fair value (24,736,523) 10,438,584 (Increase)/Decrease in other receivables (136,294) 43,578 (Decrease)/Increase in payables (731,408) 592,872 Cash (used in)/provided by operating activities (19,315,996) 5,321,006
Interest received 1,619,560 2,515,863 Dividend received - 78,406 Taxation paid (26,530) (65,503) Net cash (used in)/provided by operating activities (17,722,966) 7,849,772 Cash flows from financing activities Proceeds from issue of redeemable participating shares 39,639,861 17,655,517 Payment on redemptions of redeemable participating shares (18,998,166) (23,351,850) Dividends to holders of redeemable participating shares (1,565,794) (1,174,485) Net cash provided by/(used in) financing activities 19,075,901 (6,870,818)
Net increase in cash 1,352,935 978,954 Net Cash at the start of the financial year 2,244,787 1,265,833 Net Cash at the end of the financial year 3,597,722 2,244,787 The accompanying notes and schedules form an integral part of these financial statements.
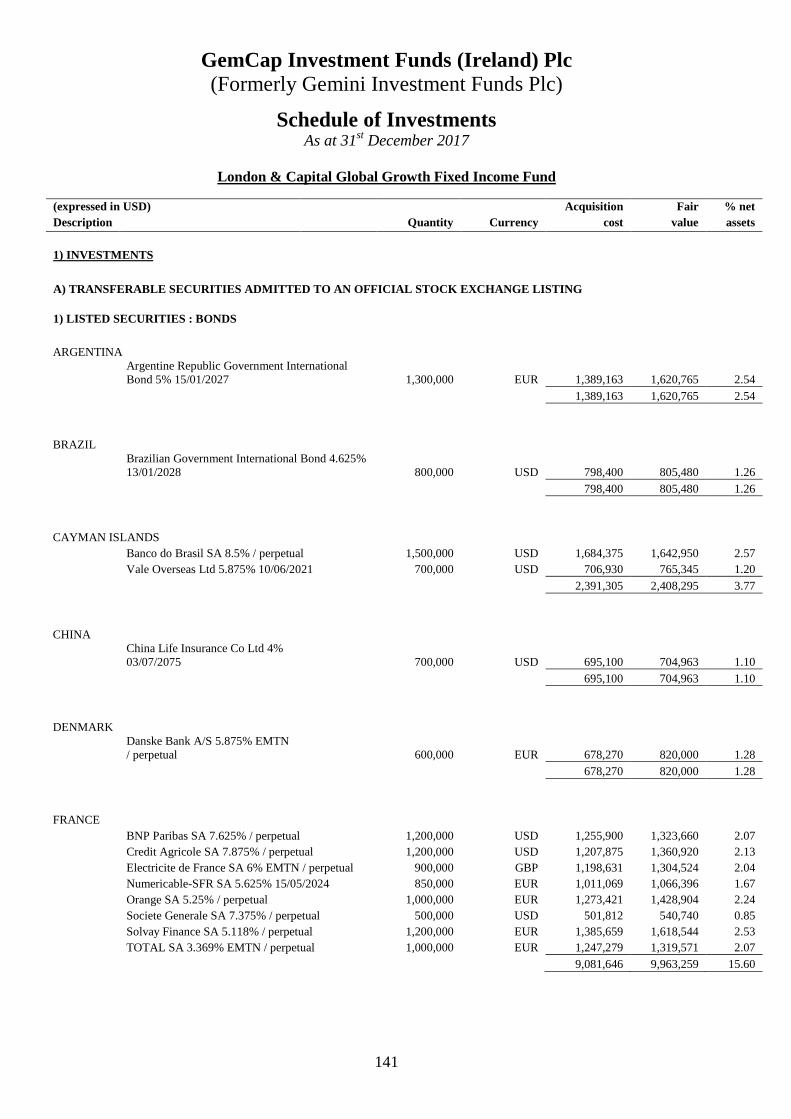
GemCap Investment Funds (Ireland) Plc (Formerly Gemini Investment Funds Plc)
141
Schedule of Investments As at 31st December 2017
London & Capital Global Growth Fixed Income Fund
(expressed in USD) Acquisition Fair % net Description Quantity Currency cost value assets 1) INVESTMENTS
A) TRANSFERABLE SECURITIES ADMITTED TO AN OFFICIAL STOCK EXCHANGE LISTING 1) LISTED SECURITIES : BONDS ARGENTINA
Argentine Republic Government International Bond 5% 15/01/2027 1,300,000 EUR 1,389,163 1,620,765 2.54
1,389,163 1,620,765 2.54
BRAZIL Brazilian Government International Bond 4.625% 13/01/2028 800,000 USD 798,400 805,480 1.26
798,400 805,480 1.26
CAYMAN ISLANDS Banco do Brasil SA 8.5% / perpetual 1,500,000 USD 1,684,375 1,642,950 2.57 Vale Overseas Ltd 5.875% 10/06/2021 700,000 USD 706,930 765,345 1.20
2,391,305 2,408,295 3.77
CHINA China Life Insurance Co Ltd 4% 03/07/2075 700,000 USD 695,100 704,963 1.10
695,100 704,963 1.10
DENMARK Danske Bank A/S 5.875% EMTN / perpetual 600,000 EUR 678,270 820,000 1.28
678,270 820,000 1.28
FRANCE BNP Paribas SA 7.625% / perpetual 1,200,000 USD 1,255,900 1,323,660 2.07 Credit Agricole SA 7.875% / perpetual 1,200,000 USD 1,207,875 1,360,920 2.13 Electricite de France SA 6% EMTN / perpetual 900,000 GBP 1,198,631 1,304,524 2.04 Numericable-SFR SA 5.625% 15/05/2024 850,000 EUR 1,011,069 1,066,396 1.67 Orange SA 5.25% / perpetual 1,000,000 EUR 1,273,421 1,428,904 2.24 Societe Generale SA 7.375% / perpetual 500,000 USD 501,812 540,740 0.85 Solvay Finance SA 5.118% / perpetual 1,200,000 EUR 1,385,659 1,618,544 2.53 TOTAL SA 3.369% EMTN / perpetual 1,000,000 EUR 1,247,279 1,319,571 2.07
9,081,646 9,963,259 15.60
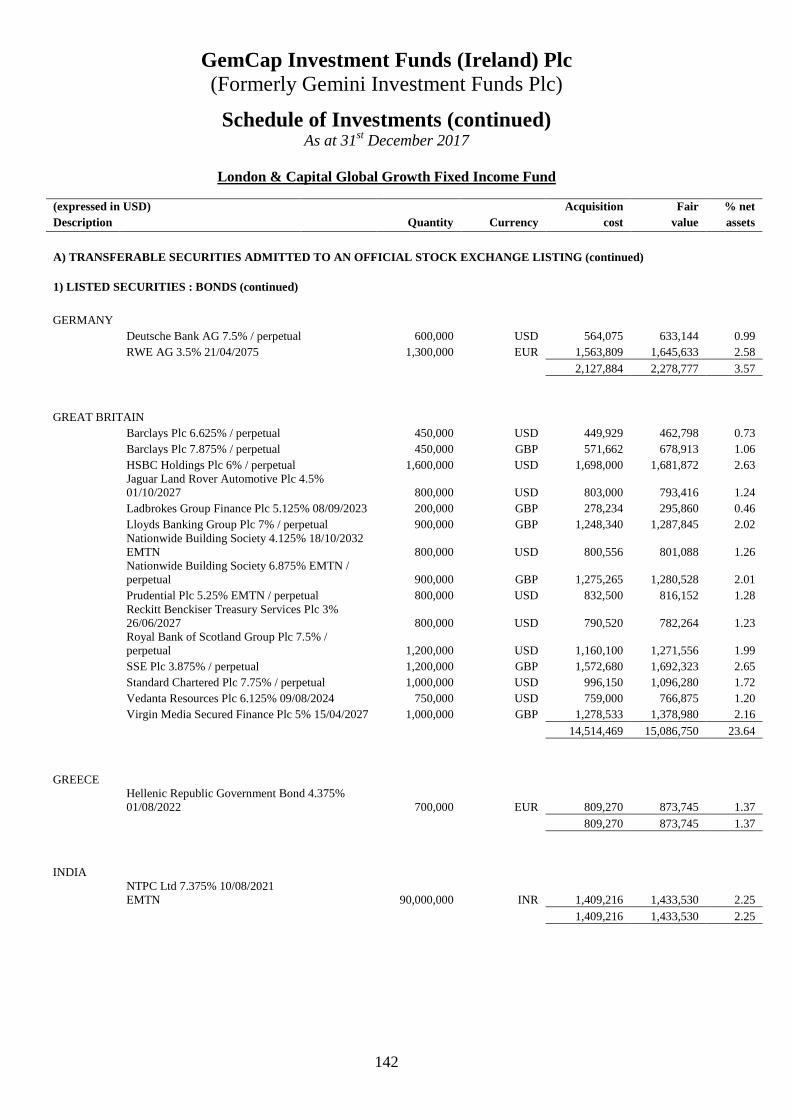
GemCap Investment Funds (Ireland) Plc (Formerly Gemini Investment Funds Plc)
142
Schedule of Investments (continued) As at 31st December 2017
London & Capital Global Growth Fixed Income Fund
(expressed in USD) Acquisition Fair % net Description Quantity Currency cost value assets
A) TRANSFERABLE SECURITIES ADMITTED TO AN OFFICIAL STOCK EXCHANGE LISTING (continued) 1) LISTED SECURITIES : BONDS (continued) GERMANY
Deutsche Bank AG 7.5% / perpetual 600,000 USD 564,075 633,144 0.99 RWE AG 3.5% 21/04/2075 1,300,000 EUR 1,563,809 1,645,633 2.58
2,127,884 2,278,777 3.57
GREAT BRITAIN Barclays Plc 6.625% / perpetual 450,000 USD 449,929 462,798 0.73 Barclays Plc 7.875% / perpetual 450,000 GBP 571,662 678,913 1.06 HSBC Holdings Plc 6% / perpetual 1,600,000 USD 1,698,000 1,681,872 2.63 Jaguar Land Rover Automotive Plc 4.5% 01/10/2027 800,000 USD 803,000 793,416 1.24 Ladbrokes Group Finance Plc 5.125% 08/09/2023 200,000 GBP 278,234 295,860 0.46 Lloyds Banking Group Plc 7% / perpetual 900,000 GBP 1,248,340 1,287,845 2.02 Nationwide Building Society 4.125% 18/10/2032 EMTN 800,000 USD 800,556 801,088 1.26 Nationwide Building Society 6.875% EMTN / perpetual 900,000 GBP 1,275,265 1,280,528 2.01 Prudential Plc 5.25% EMTN / perpetual 800,000 USD 832,500 816,152 1.28 Reckitt Benckiser Treasury Services Plc 3% 26/06/2027 800,000 USD 790,520 782,264 1.23 Royal Bank of Scotland Group Plc 7.5% / perpetual 1,200,000 USD 1,160,100 1,271,556 1.99 SSE Plc 3.875% / perpetual 1,200,000 GBP 1,572,680 1,692,323 2.65 Standard Chartered Plc 7.75% / perpetual 1,000,000 USD 996,150 1,096,280 1.72 Vedanta Resources Plc 6.125% 09/08/2024 750,000 USD 759,000 766,875 1.20 Virgin Media Secured Finance Plc 5% 15/04/2027 1,000,000 GBP 1,278,533 1,378,980 2.16
14,514,469 15,086,750 23.64
GREECE Hellenic Republic Government Bond 4.375% 01/08/2022 700,000 EUR 809,270 873,745 1.37
809,270 873,745 1.37
INDIA NTPC Ltd 7.375% 10/08/2021 EMTN 90,000,000 INR 1,409,216 1,433,530 2.25
1,409,216 1,433,530 2.25

GemCap Investment Funds (Ireland) Plc (Formerly Gemini Investment Funds Plc)
143
Schedule of Investments (continued) As at 31st December 2017
London & Capital Global Growth Fixed Income Fund
(expressed in USD) Acquisition Fair % net Description Quantity Currency cost value assets
A) TRANSFERABLE SECURITIES ADMITTED TO AN OFFICIAL STOCK EXCHANGE LISTING (continued) 1) LISTED SECURITIES : BONDS (continued) IRELAND
Bank of Ireland 7.375% / perpetual 350,000 EUR 387,314 472,101 0.74 387,314 472,101 0.74
ITALY Enel SpA 6.625% 15/09/2076 600,000 GBP 864,561 935,556 1.47 UniCredit SpA 8% / perpetual 400,000 USD 407,000 439,100 0.69
1,271,561 1,374,656 2.16
JAPAN SoftBank Group Corp 6% / perpetual 750,000 USD 757,425 742,808 1.16
757,425 742,808 1.16
MEXICO Petroleos Mexicanos 4.5% 23/01/2026 1,700,000 USD 1,589,465 1,700,663 2.66
1,589,465 1,700,663 2.66
NETHERLANDS Cooperatieve Rabobank UA 5.5% / perpetual 400,000 EUR 463,500 521,666 0.82 Petrobras Global Finance BV 6.125% 17/01/2022 1,100,000 USD 1,145,750 1,169,366 1.83 Volkswagen International Finance NV 2.7% / perpetual 1,000,000 EUR 1,112,427 1,239,334 1.94
2,721,677 2,930,366 4.59
SPAIN Banco Bilbao Vizcaya Argentaria SA 7% / perpetual 400,000 EUR 554,946 506,396 0.79 Banco Santander SA 6.375% / perpetual 800,000 USD 772,700 819,952 1.28
1,327,646 1,326,348 2.07
SWEDEN Nordea Bank AB 5.5% EMTN / perpetual 1,100,000 USD 1,124,420 1,132,813 1.77 Skandinaviska Enskilda Banken AB 5.625% / perpetual 1,600,000 USD 1,620,250 1,659,392 2.60 Svenska Handelsbanken AB 5.25% / perpetual 1,000,000 USD 979,800 1,024,770 1.61
3,724,470 3,816,975 5.98
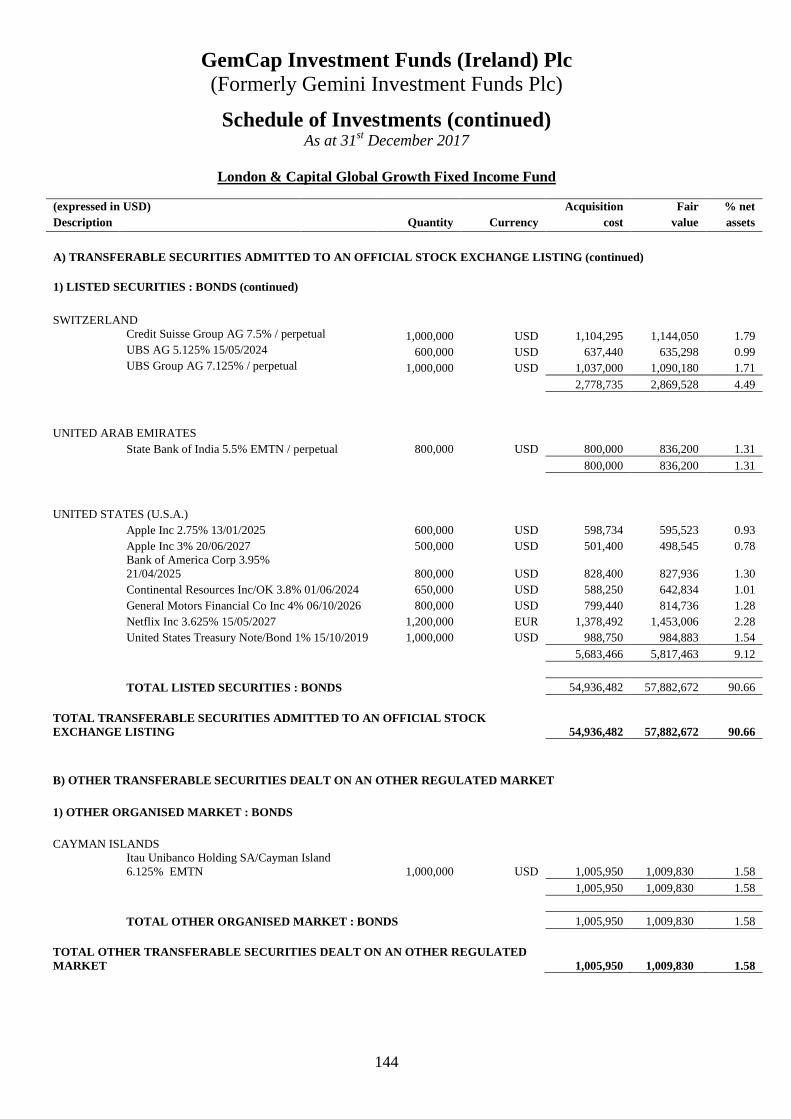
GemCap Investment Funds (Ireland) Plc (Formerly Gemini Investment Funds Plc)
144
Schedule of Investments (continued) As at 31st December 2017
London & Capital Global Growth Fixed Income Fund
(expressed in USD) Acquisition Fair % net Description Quantity Currency cost value assets
A) TRANSFERABLE SECURITIES ADMITTED TO AN OFFICIAL STOCK EXCHANGE LISTING (continued) 1) LISTED SECURITIES : BONDS (continued) SWITZERLAND
Credit Suisse Group AG 7.5% / perpetual 1,000,000 USD 1,104,295 1,144,050 1.79 UBS AG 5.125% 15/05/2024 600,000 USD 637,440 635,298 0.99 UBS Group AG 7.125% / perpetual 1,000,000 USD 1,037,000 1,090,180 1.71
2,778,735 2,869,528 4.49
UNITED ARAB EMIRATES State Bank of India 5.5% EMTN / perpetual 800,000 USD 800,000 836,200 1.31
800,000 836,200 1.31
UNITED STATES (U.S.A.) Apple Inc 2.75% 13/01/2025 600,000 USD 598,734 595,523 0.93 Apple Inc 3% 20/06/2027 500,000 USD 501,400 498,545 0.78 Bank of America Corp 3.95% 21/04/2025 800,000 USD 828,400 827,936 1.30 Continental Resources Inc/OK 3.8% 01/06/2024 650,000 USD 588,250 642,834 1.01 General Motors Financial Co Inc 4% 06/10/2026 800,000 USD 799,440 814,736 1.28 Netflix Inc 3.625% 15/05/2027 1,200,000 EUR 1,378,492 1,453,006 2.28 United States Treasury Note/Bond 1% 15/10/2019 1,000,000 USD 988,750 984,883 1.54
5,683,466 5,817,463 9.12
TOTAL LISTED SECURITIES : BONDS 54,936,482 57,882,672 90.66
TOTAL TRANSFERABLE SECURITIES ADMITTED TO AN OFFICIAL STOCK EXCHANGE LISTING 54,936,482 57,882,672 90.66
B) OTHER TRANSFERABLE SECURITIES DEALT ON AN OTHER REGULATED MARKET
1) OTHER ORGANISED MARKET : BONDS
CAYMAN ISLANDS Itau Unibanco Holding SA/Cayman Island 6.125% EMTN 1,000,000 USD 1,005,950 1,009,830 1.58
1,005,950 1,009,830 1.58
TOTAL OTHER ORGANISED MARKET : BONDS 1,005,950 1,009,830 1.58
TOTAL OTHER TRANSFERABLE SECURITIES DEALT ON AN OTHER REGULATED MARKET 1,005,950 1,009,830 1.58
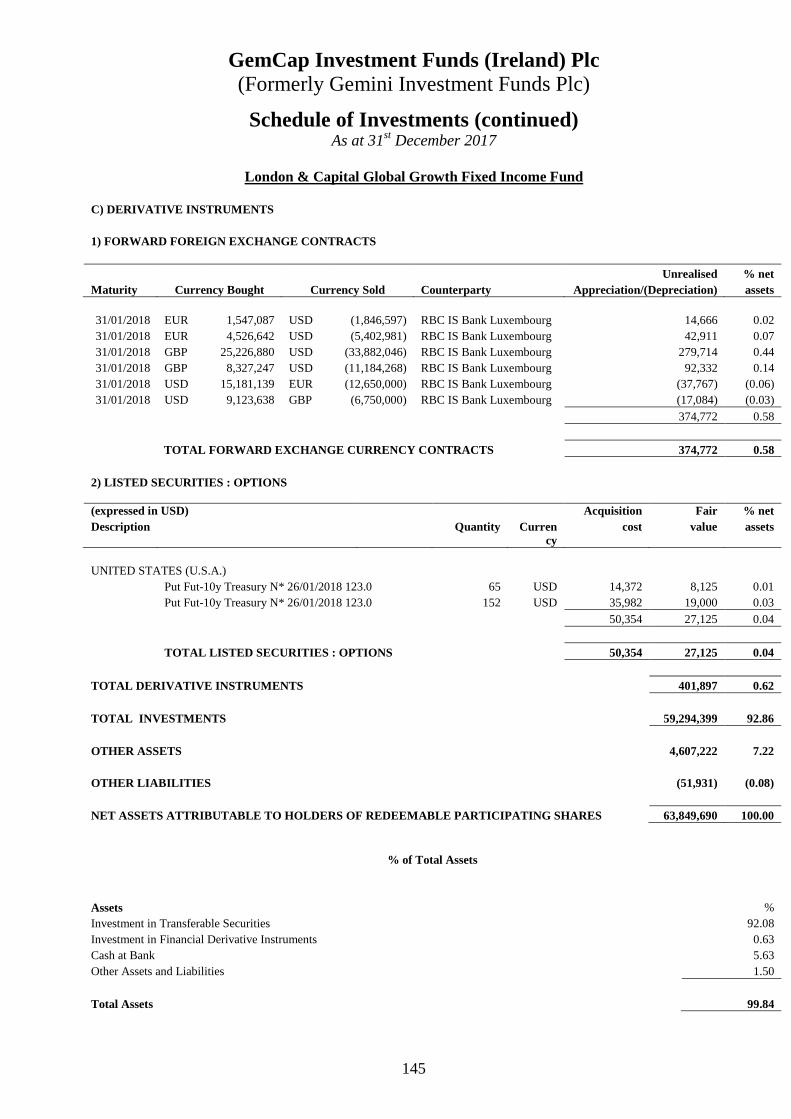
GemCap Investment Funds (Ireland) Plc (Formerly Gemini Investment Funds Plc)
145
Schedule of Investments (continued) As at 31st December 2017
London & Capital Global Growth Fixed Income Fund
C) DERIVATIVE INSTRUMENTS 1) FORWARD FOREIGN EXCHANGE CONTRACTS
Unrealised % net Maturity Currency Bought Currency Sold Counterparty Appreciation/(Depreciation) assets
31/01/2018 EUR 1,547,087 USD (1,846,597) RBC IS Bank Luxembourg 14,666 0.02 31/01/2018 EUR 4,526,642 USD (5,402,981) RBC IS Bank Luxembourg 42,911 0.07 31/01/2018 GBP 25,226,880 USD (33,882,046) RBC IS Bank Luxembourg 279,714 0.44 31/01/2018 GBP 8,327,247 USD (11,184,268) RBC IS Bank Luxembourg 92,332 0.14 31/01/2018 USD 15,181,139 EUR (12,650,000) RBC IS Bank Luxembourg (37,767) (0.06) 31/01/2018 USD 9,123,638 GBP (6,750,000) RBC IS Bank Luxembourg (17,084) (0.03)
374,772 0.58
TOTAL FORWARD EXCHANGE CURRENCY CONTRACTS 374,772 0.58
2) LISTED SECURITIES : OPTIONS
(expressed in USD) Acquisition Fair % net Description Quantity Curren
cy cost value assets
UNITED STATES (U.S.A.)
Put Fut-10y Treasury N* 26/01/2018 123.0 65 USD 14,372 8,125 0.01 Put Fut-10y Treasury N* 26/01/2018 123.0 152 USD 35,982 19,000 0.03
50,354 27,125 0.04
TOTAL LISTED SECURITIES : OPTIONS 50,354 27,125 0.04
TOTAL DERIVATIVE INSTRUMENTS 401,897 0.62
TOTAL INVESTMENTS 59,294,399 92.86
OTHER ASSETS 4,607,222 7.22
OTHER LIABILITIES (51,931) (0.08)
NET ASSETS ATTRIBUTABLE TO HOLDERS OF REDEEMABLE PARTICIPATING SHARES 63,849,690 100.00
% of Total Assets
Assets % Investment in Transferable Securities 92.08 Investment in Financial Derivative Instruments 0.63 Cash at Bank 5.63 Other Assets and Liabilities 1.50
Total Assets 99.84

GemCap Investment Funds (Ireland) Plc (Formerly Gemini Investment Funds Plc)
146
Significant Portfolio Movements (unaudited) 31st December 2017
London & Capital Global Growth Fixed Income Fund
Purchases Security Name Quantity Cost % of $ Total Purchases
Continental Resources Inc/OK 3.8% 21/03/2025 2,600,000 2,400,625 4.16%
Nordea Bank AB 5.5% EMTN / perpetual 1,900,000 1,945,220 3.36%
HSBC Holdings Plc 6.875% / perpetual 1,600,000 1,708,000 2.95%
HSBC Holdings Plc 6% / perpetual 1,600,000 1,698,000 2.93%
Credit Suisse Group AG 7.5% / perpetual 1,500,000 1,656,443 2.86%
Skandinaviska Enskilda Banken AB 5.625% / perpetual / perpetual 1,600,000 1,620,250 2.80%
Petroleos Mexicanos 4.5% 12/11/2026 1,700,000 1,589,465 2.75%
RWE AG 3.5% 08/02/2076 1,300,000 1,563,809 2.70%
RWE AG 2.75% 08/02/2076 1,300,000 1,429,429 2.47%
NTPC Ltd 7.375% 30/05/2022 EMTN 90,000,000 1,409,216 2.43%
Netflix Inc 3.625% 03/03/2028 1,200,000 1,378,492 2.38%
Virgin Media Secured Finance Plc 5% 02/02/2028 1,000,000 1,278,533 2.21%
Orange SA 5.25% / perpetual 1,000,000 1,273,421 2.20%
BNP Paribas SA 7.625% / perpetual 1,200,000 1,255,900 2.17%
TOTAL SA 3.369% EMTN / perpetual 1,000,000 1,247,279 2.16%
Credit Agricole SA 7.875% / perpetual 1,200,000 1,207,875 2.09%
Petrobras Global Finance BV 6.125% 06/11/2022 1,100,000 1,145,750 1.98%
TOTAL SA 3.875% EMTN / perpetual 1,000,000 1,134,061 1.96%
Deutsche Bank AG 7.5% / perpetual 1,200,000 1,128,150 1.95%
Volkswagen International Finance NV 2.7% / perpetual 1,000,000 1,112,427 1.92%
Societe Generale SA 7.375% / perpetual 1,050,000 1,053,805 1.82%
UBS Group AG 7.125% / perpetual 1,000,000 1,037,000 1.79%
ITAUUNI 6,125% / perpetual 1,000,000 1,005,950 1.74%
United States Treasury Note/Bond 2.125% 20/05/2025 1,000,000 1,008,164 1.74%
Vedanta Resources Plc 6.375% 19/05/2023 1,000,000 1,003,000 1.73%
Standard Chartered Plc 7.75% / perpetual 1,000,000 996,150 1.72%
United States Treasury Note/Bond 1% 03/08/2020 1,000,000 988,750 1.71%
Sprint Corp 7.875% 04/07/2024 800,000 877,000 1.52%
Enel SpA 6.625% 05/07/2077 600,000 864,561 1.49%
Nationwide Building Society 6.875% EMTN / perpetual 650,000 838,096 1.45%
Bank of America Corp 3.95% 08/02/2026 800,000 828,400 1.43%
JPMorgan Chase & Co 4.25% 20/07/2028 800,000 824,000 1.42%
UniCredit SpA 8% / perpetual 800,000 814,000 1.41%
Goldman Sachs Group Inc 4.25% 10/08/2026 800,000 817,360 1.41%
Hellenic Republic Government Bond 4.375% 21/05/2023 700,000 809,270 1.40% European Bank for Reconstruction & Development 7.5% 04/10/2020 2,600,000 809,461 1.40%
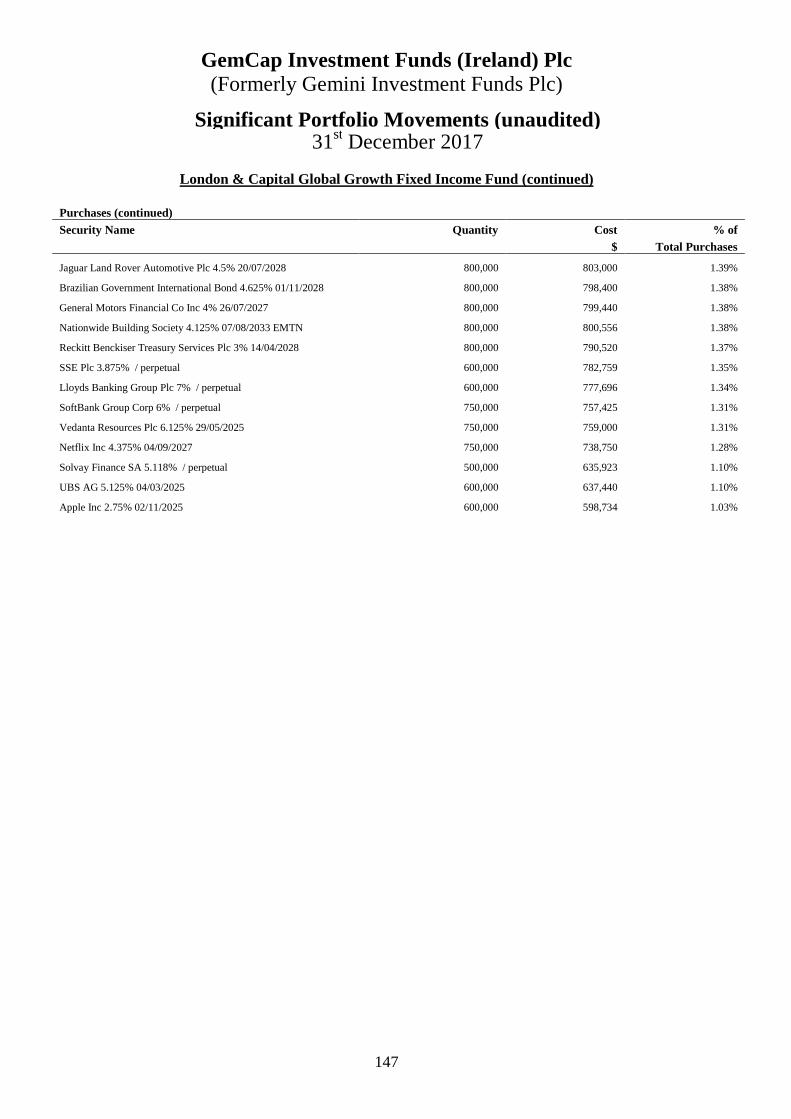
GemCap Investment Funds (Ireland) Plc (Formerly Gemini Investment Funds Plc)
147
Significant Portfolio Movements (unaudited) 31st December 2017
London & Capital Global Growth Fixed Income Fund (continued) Purchases (continued) Security Name Quantity Cost % of $ Total Purchases
Jaguar Land Rover Automotive Plc 4.5% 20/07/2028 800,000 803,000 1.39%
Brazilian Government International Bond 4.625% 01/11/2028 800,000 798,400 1.38%
General Motors Financial Co Inc 4% 26/07/2027 800,000 799,440 1.38%
Nationwide Building Society 4.125% 07/08/2033 EMTN 800,000 800,556 1.38%
Reckitt Benckiser Treasury Services Plc 3% 14/04/2028 800,000 790,520 1.37%
SSE Plc 3.875% / perpetual 600,000 782,759 1.35%
Lloyds Banking Group Plc 7% / perpetual 600,000 777,696 1.34%
SoftBank Group Corp 6% / perpetual 750,000 757,425 1.31%
Vedanta Resources Plc 6.125% 29/05/2025 750,000 759,000 1.31%
Netflix Inc 4.375% 04/09/2027 750,000 738,750 1.28%
Solvay Finance SA 5.118% / perpetual 500,000 635,923 1.10%
UBS AG 5.125% 04/03/2025 600,000 637,440 1.10%
Apple Inc 2.75% 02/11/2025 600,000 598,734 1.03%

GemCap Investment Funds (Ireland) Plc (Formerly Gemini Investment Funds Plc)
148
Significant Portfolio Movements (unaudited) 31st December 2017
London & Capital Global Growth Fixed Income Fund (continued)
Sales
Security Name Quantity Proceed % of $ Total Sales
European Investment Bank 1.625% 04/04/2022 2,000,000 1,958,760 5.13%
HSBC Holdings Plc 6.875% / perpetual 1,600,000 1,778,567 4.65%
Continental Resources Inc/OK 3.8% 21/03/2025 1,950,000 1,773,189 4.63%
RWE AG 2.75% 08/02/2076 1,300,000 1,616,048 4.22%
TOTAL SA 3.875% EMTN / perpetual 1,000,000 1,319,102 3.45%
Delhi International Airport Ltd 6.125% 20/08/2027 1,100,000 1,163,899 3.04%
TOTAL SA 2.25% EMTN / perpetual 1,000,000 1,090,260 2.85%
Vedanta Resources Plc 6.375% 19/05/2023 1,000,000 1,048,229 2.74%
Vedanta Resources Plc 6% 20/11/2019 1,000,000 1,034,500 2.70%
Reliance Industries Ltd 5.875% / perpetual 1,000,000 1,029,965 2.69%
eBay Inc 2.2% 20/05/2020 1,000,000 1,006,799 2.63%
United States Treasury Note/Bond 2.125% 20/05/2025 1,000,000 997,935 2.61%
Credit Suisse Group Funding Guernsey Ltd 2.75% 28/05/2026 800,000 989,819 2.59%
United States Treasury Note/Bond 1.375% 20/11/2021 1,000,000 989,784 2.59%
Microsoft Corp 2% 27/05/2024 1,000,000 968,000 2.53%
Koninklijke KPN NV 6.125% / perpetual 800,000 936,768 2.45%
Bombardier Inc 6.125% 04/03/2022 EMTN 700,000 892,700 2.33%
Sprint Corp 7.875% 04/07/2024 800,000 875,825 2.29%
Petrobras Global Finance BV 8.375% 12/03/2022 750,000 859,201 2.24%
Goldman Sachs Group Inc 4.25% 10/08/2026 800,000 836,157 2.18%
Continental Resources Inc/OK 5% 05/07/2023 800,000 835,000 2.18%
JPMorgan Chase & Co 4.25% 20/07/2028 800,000 833,917 2.18%
Nordea Bank AB 5.5% EMTN / perpetual 800,000 824,600 2.15% European Bank for Reconstruction & Development 7.5% 04/10/2020 2,600,000 782,585 2.04%
Old Mutual Plc 7.875% 23/08/2026 450,000 751,537 1.96%
Netflix Inc 4.375% 04/09/2027 750,000 749,128 1.96%
Citigroup Inc 5.95% / perpetual 700,000 741,247 1.94% Windstream Services LLC / Windstream Finance Corp 6.375% 20/05/2024 800,000 736,383 1.92%
RWE AG 7% / perpetual 500,000 690,770 1.80%
Teck Resources Ltd 4.75% 04/11/2022 600,000 639,729 1.67%
Deutsche Bank AG 7.5% / perpetual 600,000 621,432 1.62%
Wells Fargo & Co 3.45% 03/12/2023 600,000 614,279 1.60%
Societe Generale SA 7.375% / perpetual 550,000 600,252 1.57%
Credit Suisse Group AG 7.5% / perpetual 500,000 567,309 1.48%
Veolia Environnement SA 4.85% / perpetual 400,000 535,476 1.40%
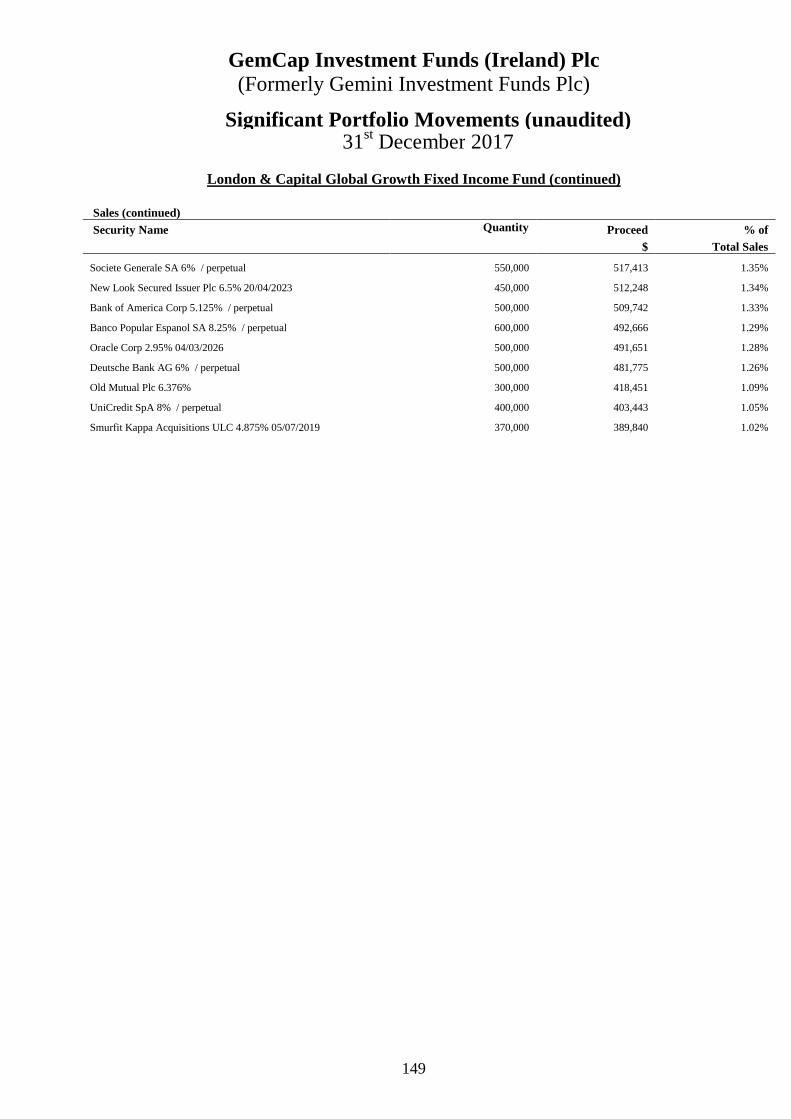
GemCap Investment Funds (Ireland) Plc (Formerly Gemini Investment Funds Plc)
149
Significant Portfolio Movements (unaudited) 31st December 2017
London & Capital Global Growth Fixed Income Fund (continued)
Sales (continued)
Security Name Quantity Proceed % of $ Total Sales
Societe Generale SA 6% / perpetual 550,000 517,413 1.35%
New Look Secured Issuer Plc 6.5% 20/04/2023 450,000 512,248 1.34%
Bank of America Corp 5.125% / perpetual 500,000 509,742 1.33%
Banco Popular Espanol SA 8.25% / perpetual 600,000 492,666 1.29%
Oracle Corp 2.95% 04/03/2026 500,000 491,651 1.28%
Deutsche Bank AG 6% / perpetual 500,000 481,775 1.26%
Old Mutual Plc 6.376% 300,000 418,451 1.09%
UniCredit SpA 8% / perpetual 400,000 403,443 1.05%
Smurfit Kappa Acquisitions ULC 4.875% 05/07/2019 370,000 389,840 1.02%

GemCap Investment Funds (Ireland) Plc (Formerly Gemini Investment Funds Plc)
150
Investment Manager’s Report
London & Capital Global Star Equity Fund Section 1 – Performance Overview Performance: 31/12/2016 – 31/12/2017 Global Star Equity Fund 14.53% Benchmark 19.99% Section 2 – Market Review 2017 has been an excellent year for most major stock markets. The synchronised growth from North America, Asia and Europe produced double digit earnings growth for equities. Additionally, investors risk appetites increased and stock markets saw another year of valuation multiple expansion despite Interest Rate increases by the Federal Reserve. The equity rally was broad based with a tilt towards more cyclical stocks. US markets boomed in 2017 on the back of supportive growth and tax reforms. The US large cap technology stocks produced some of the best returns as investor focused on the potential for new technology. Despite a stronger Euro, European markets posted good returns in 2017. The majority of the gains were driven by a robust economic environment with all EU countries recovering. European equities still appear to be in an earlier stage of the stock market cycle which suggests further advancements can be made. The Domestic orientated stocks still appear more attractive as growth estimates for the EU are modest and potentially too cautious. The UK, which lagged other equity markets in 2017, has a much more challenging time as growth waned due to pressure on the real disposable incomes and international stocks are suffering as sterling rebounds. Additionally, was a lot of political uncertainty in the UK which made the market less attractive to equity investors. Japan produced good returns in 2017 as the global economy accelerated and the domestic consumer showed some sign of life despite the huge structural challenges in the longer term from a declining population and a more competitive export environment. Emerging Markets recorded the strongest equity returns in 2017. The main drivers were a supportive global economic recovery and a weaker US dollar which aids Emerging Market consumption. Section 3 – Performance Review
The Fund aims to provide income and capital returns by choosing an optimal mix of top tier stocks using a rigorous proprietary process. The portfolio consists of less volatile global large cap stocks with strong franchises, stable earnings, growing dividends, solid balance sheets and financial flexibility. Its geographical focus is US, UK and European stocks. 2017 was a year of strong absolute performance for the fund with a 14.5% return and although this lagged the benchmark, it was very consistent with the focus on risk adjusted returns. In buoyant market environments the fund aims to keep pace and produce solid returns. However, in time of market stress, the fund’s objective is to be resilient and preserve capital.
GemCap Investment Funds (Ireland) Plc (Formerly Gemini Investment Funds Plc)
151
Investment Manager’s Report (Continued)
London & Capital Global Star Equity Fund (Continued)
Section 4 – Outlook
Equity markets now have high valuations and high earnings expectations for 2018. For equity markets to advance further with these two headwinds, there has to be good growth momentum to drive earnings higher. At present, the growth outlook is supportive, however this need to be carefully monitored to ensure there is no deterioration as this could have major consequences for equity markets given the high investor sentiment. Overall, 2018 is likely to show much more modest equity market returns given the high valuation starting point and a correction is possible but a bear market still seems unlikely given the constructive growth backdrop. The environment should warrant more caution as volatility is likely to increase. Accordingly, the fund continues to select resilient investments which have a lower risk profile and are less volatile.
Roger Jones London and Capital Asset Management Limited Date: February 2018
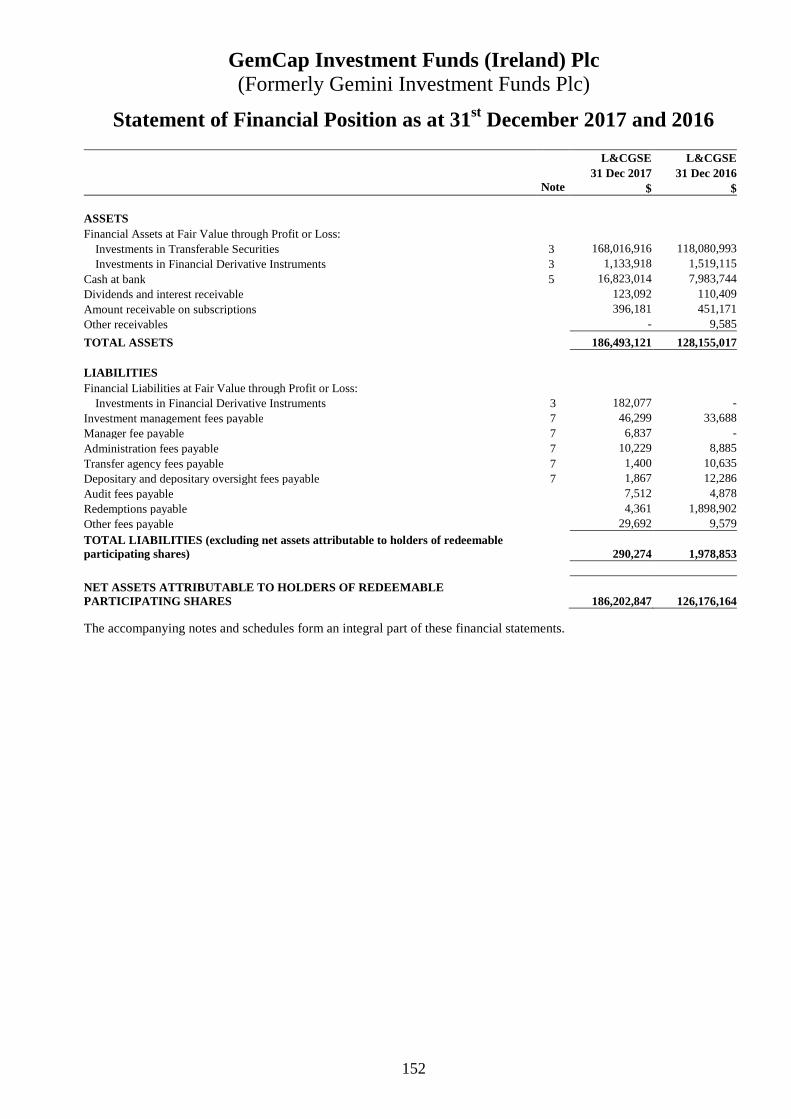
GemCap Investment Funds (Ireland) Plc (Formerly Gemini Investment Funds Plc)
152
Statement of Financial Position as at 31st December 2017 and 2016
L&CGSE L&CGSE 31 Dec 2017 31 Dec 2016 Note $ $
ASSETS Financial Assets at Fair Value through Profit or Loss:
Investments in Transferable Securities 3 168,016,916 118,080,993Investments in Financial Derivative Instruments 3 1,133,918 1,519,115
Cash at bank 5 16,823,014 7,983,744Dividends and interest receivable 123,092 110,409Amount receivable on subscriptions 396,181 451,171Other receivables - 9,585
TOTAL ASSETS 186,493,121 128,155,017 LIABILITIES Financial Liabilities at Fair Value through Profit or Loss:
Investments in Financial Derivative Instruments 3 182,077 -Investment management fees payable 7 46,299 33,688Manager fee payable 7 6,837 -Administration fees payable 7 10,229 8,885Transfer agency fees payable 7 1,400 10,635Depositary and depositary oversight fees payable 7 1,867 12,286Audit fees payable 7,512 4,878Redemptions payable 4,361 1,898,902Other fees payable 29,692 9,579
TOTAL LIABILITIES (excluding net assets attributable to ho lders of redeemable participating shares) 290,274 1,978,853
NET ASSETS ATTRIBUTABLE TO HOLDERS OF REDEEMABLE PARTICIPATING SHARES 186,202,847 126,176,164 The accompanying notes and schedules form an integral part of these financial statements.
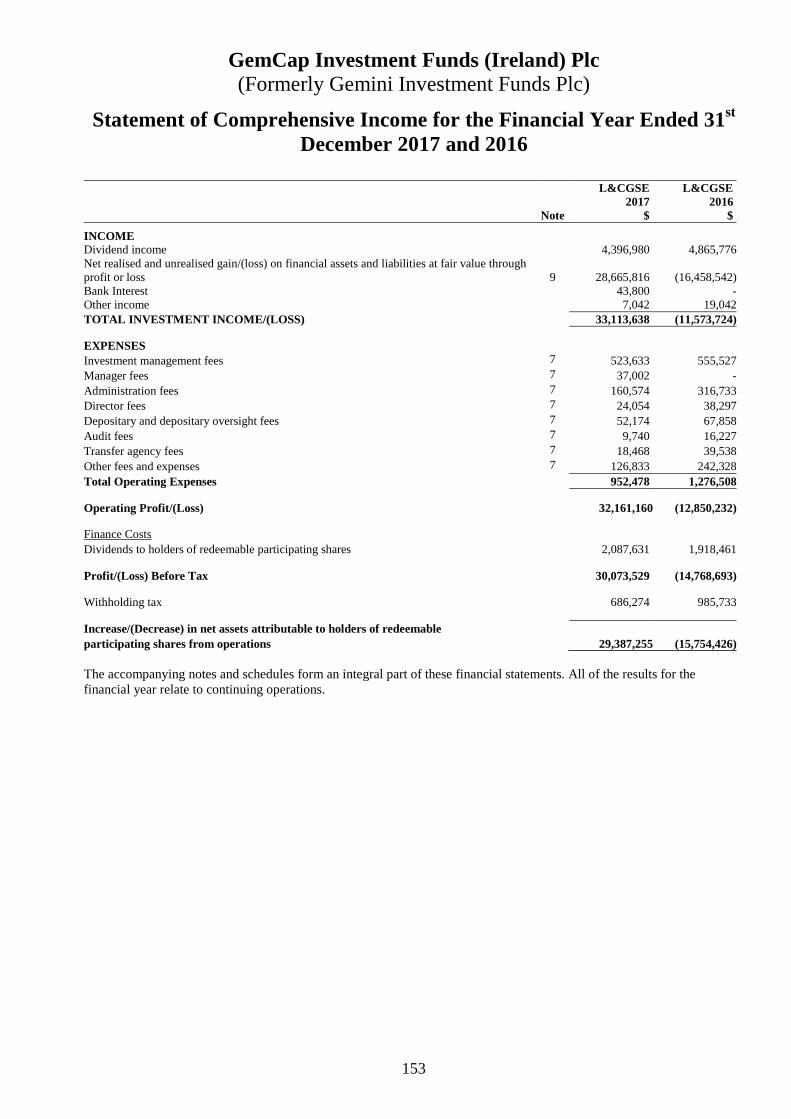
GemCap Investment Funds (Ireland) Plc (Formerly Gemini Investment Funds Plc)
153
Statement of Comprehensive Income for the Financial Year Ended 31st December 2017 and 2016
L&CGSE L&CGSE
2017 2016 Note $ $
INCOME Dividend income 4,396,980 4,865,776Net realised and unrealised gain/(loss) on financial assets and liabilities at fair value through profit or loss 9 28,665,816 (16,458,542)Bank Interest 43,800 -Other income 7,042 19,042TOTAL INVESTMENT INCOME/(LOSS) 33,113,638 (11,573,724) EXPENSES Investment management fees 7 523,633 555,527Manager fees 7 37,002 -Administration fees 7 160,574 316,733Director fees 7 24,054 38,297Depositary and depositary oversight fees 7 52,174 67,858Audit fees 7 9,740 16,227Transfer agency fees 7 18,468 39,538Other fees and expenses 7 126,833 242,328Total Operating Expenses 952,478 1,276,508 Operating Profit/(Loss) 32,161,160 (12,850,232) Finance Costs Dividends to holders of redeemable participating shares 2,087,631 1,918,461 Profit/(Loss) Before Tax 30,073,529 (14,768,693) Withholding tax 686,274 985,733 Increase/(Decrease) in net assets attributable to holders of redeemable participating shares from operations 29,387,255 (15,754,426) The accompanying notes and schedules form an integral part of these financial statements. All of the results for the financial year relate to continuing operations.

GemCap Investment Funds (Ireland) Plc (Formerly Gemini Investment Funds Plc)
154
Statement of Changes in Net Assets attributable to Holders of Redeemable Participating Shares
The accompanying notes and schedules form an integral part of these financial statements.
L&CGSE L&CGSE 2017 2016 $ $ Net Assets attributable to holders of Redeemable Participating Shares at the beginning of the financial year
126,176,164 229,402,157
Increase/(decrease) in Net Assets attributable to Holders of Redeemable Participating Shares from operations 29,387,255 (15,754,426) Capital transactions Issue of redeemable shares during the financial year 94,168,100 38,554,652 Redemption of redeemable shares during the financial year (63,528,672) (126,026,219) Net Assets attributable to Holders of Redeemable Participating Shares at the end of the financial year
186,202,847 126,176,164
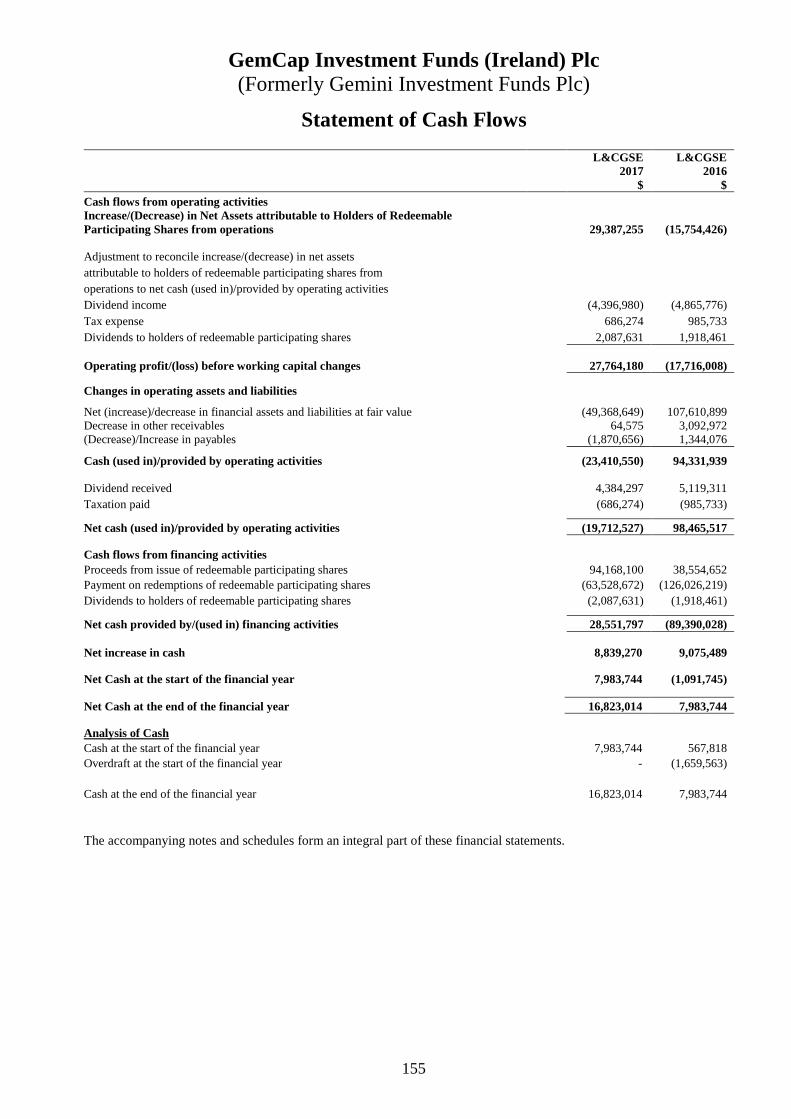
GemCap Investment Funds (Ireland) Plc (Formerly Gemini Investment Funds Plc)
155
Statement of Cash Flows
L&CGSE L&CGSE 2017 2016 $ $ Cash flows from operating activities Increase/(Decrease) in Net Assets attributable to Holders of Redeemable Participating Shares from operations 29,387,255 (15,754,426) Adjustment to reconcile increase/(decrease) in net assets attributable to holders of redeemable participating shares from operations to net cash (used in)/provided by operating activities Dividend income (4,396,980) (4,865,776) Tax expense 686,274 985,733 Dividends to holders of redeemable participating shares 2,087,631 1,918,461 Operating profit/(loss) before working capital changes 27,764,180 (17,716,008) Changes in operating assets and liabilities Net (increase)/decrease in financial assets and liabilities at fair value (49,368,649) 107,610,899 Decrease in other receivables 64,575 3,092,972 (Decrease)/Increase in payables (1,870,656) 1,344,076 Cash (used in)/provided by operating activities (23,410,550) 94,331,939
Dividend received 4,384,297 5,119,311 Taxation paid (686,274) (985,733) Net cash (used in)/provided by operating activities (19,712,527) 98,465,517 Cash flows from financing activities Proceeds from issue of redeemable participating shares 94,168,100 38,554,652 Payment on redemptions of redeemable participating shares (63,528,672) (126,026,219) Dividends to holders of redeemable participating shares (2,087,631) (1,918,461) Net cash provided by/(used in) financing activities 28,551,797 (89,390,028)
Net increase in cash 8,839,270 9,075,489 Net Cash at the start of the financial year 7,983,744 (1,091,745) Net Cash at the end of the financial year 16,823,014 7,983,744 Analysis of Cash Cash at the start of the financial year 7,983,744 567,818 Overdraft at the start of the financial year - (1,659,563) Cash at the end of the financial year 16,823,014 7,983,744 The accompanying notes and schedules form an integral part of these financial statements.
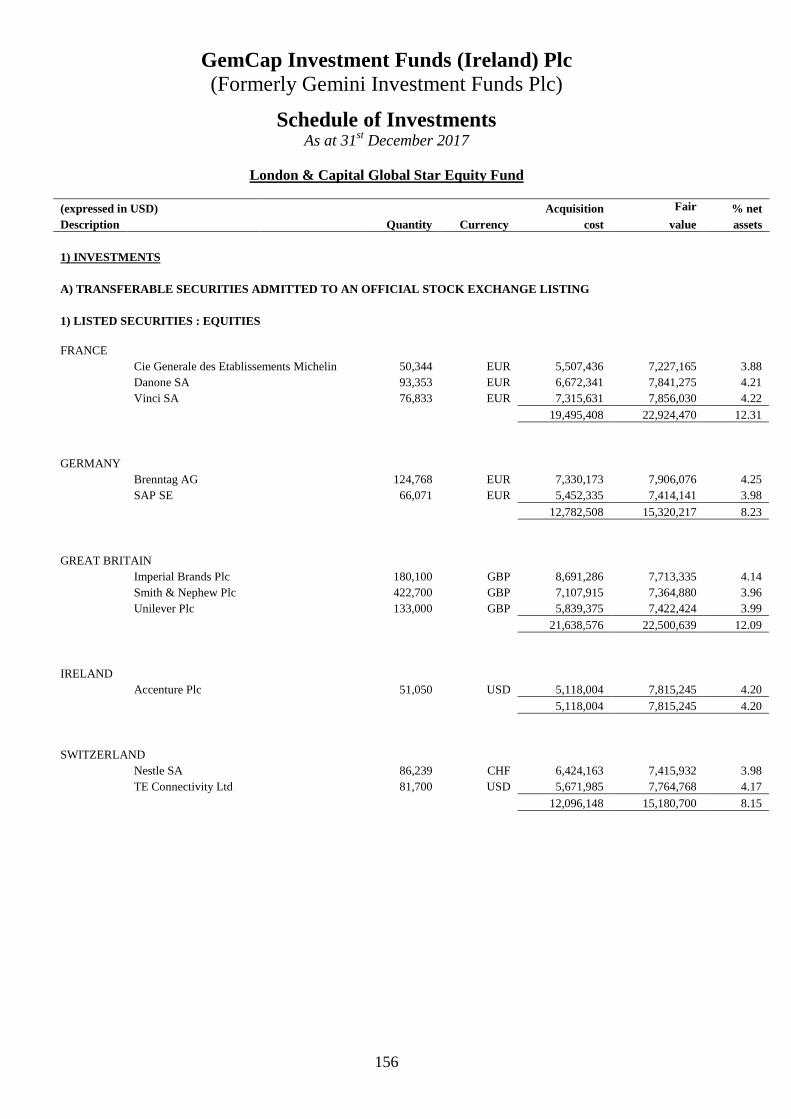
GemCap Investment Funds (Ireland) Plc (Formerly Gemini Investment Funds Plc)
156
Schedule of Investments As at 31st December 2017
London & Capital Global Star Equity Fund
(expressed in USD) Acquisition Fair % net Description Quantity Currency cost value assets
1) INVESTMENTS
A) TRANSFERABLE SECURITIES ADMITTED TO AN OFFICIAL STOCK EXCHANGE LISTING
1) LISTED SECURITIES : EQUITIES
FRANCE Cie Generale des Etablissements Michelin 50,344 EUR 5,507,436 7,227,165 3.88 Danone SA 93,353 EUR 6,672,341 7,841,275 4.21 Vinci SA 76,833 EUR 7,315,631 7,856,030 4.22
19,495,408 22,924,470 12.31
GERMANY Brenntag AG 124,768 EUR 7,330,173 7,906,076 4.25 SAP SE 66,071 EUR 5,452,335 7,414,141 3.98
12,782,508 15,320,217 8.23
GREAT BRITAIN Imperial Brands Plc 180,100 GBP 8,691,286 7,713,335 4.14 Smith & Nephew Plc 422,700 GBP 7,107,915 7,364,880 3.96 Unilever Plc 133,000 GBP 5,839,375 7,422,424 3.99
21,638,576 22,500,639 12.09
IRELAND Accenture Plc 51,050 USD 5,118,004 7,815,245 4.20
5,118,004 7,815,245 4.20
SWITZERLAND Nestle SA 86,239 CHF 6,424,163 7,415,932 3.98 TE Connectivity Ltd 81,700 USD 5,671,985 7,764,768 4.17
12,096,148 15,180,700 8.15

GemCap Investment Funds (Ireland) Plc (Formerly Gemini Investment Funds Plc)
157
Schedule of Investments (continued) As at 31st December 2017
London & Capital Global Star Equity Fund
(expressed in USD) Acquisition Fair % net Description Quantity Currency cost value assets
A) TRANSFERABLE SECURITIES ADMITTED TO AN OFFICIAL STOCK EXCHANGE LISTING (continued)
1) LISTED SECURITIES : EQUITIES (continued)
UNITED STATES (U.S.A.) International Business Machines Corp 49,949 USD 7,314,921 7,663,176 4.12 Kellogg Co 116,186 USD 8,432,867 7,898,324 4.24 Omnicom Group Inc 102,900 USD 8,004,832 7,494,207 4.02 Oracle Corp 149,877 USD 6,768,421 7,086,185 3.81 PepsiCo Inc 65,032 USD 6,523,683 7,798,637 4.19 Procter & Gamble Co 83,700 USD 6,900,780 7,690,356 4.13 Quest Diagnostics Inc 77,387 USD 6,319,874 7,621,846 4.09 Union Pacific Corp 59,400 USD 6,606,305 7,965,540 4.28 United Parcel Service Inc 60,342 USD 6,786,506 7,189,749 3.86 United Technologies Corp 62,427 USD 7,531,416 7,963,812 4.27 Walt Disney Co 73,517 USD 7,585,377 7,903,813 4.24
78,774,982 84,275,645 45.25
TOTAL LISTED SECURITIES : EQUITIES 149,905,626 168,016,916 90.23
TOTAL TRANSFERABLE SECURITIES ADMITTED TO AN OFFICIAL STOCK EXCHANGE LISTING 149,905,626 168,016,916 90.23
B) DERIVATIVE INSTRUMENTS
1) FORWARD FOREIGN EXCHANGE CONTRACTS
Unrealised % net Maturity Currency Bought Currency Sold Counterparty Appreciation/(Depreciation) assets 31/01/2018 EUR 5,123,867 USD (6,115,828) RBC IS Bank Luxembourg 48,572 0.03 31/01/2018 GBP 31,834,015 USD (42,756,042) RBC IS Bank Luxembourg 352,974 0.19 31/01/2018 GBP 66,051,193 USD (88,712,895) RBC IS Bank Luxembourg 732,372 0.39 31/01/2018 USD 6,678,257 CHF (6,530,000) RBC IS Bank Luxembourg (37,642) (0.02) 31/01/2018 USD 20,144,435 GBP (14,908,000) RBC IS Bank Luxembourg (43,695) (0.02) 31/01/2018 USD 35,697,976 EUR (29,756,000) RBC IS Bank Luxembourg (100,740) (0.05)
951,841 0.52
TOTAL FORWARD FOREIGN EXCHANGE CONTRACTS 951,841 0.52
TOTAL DERIVATIVE INSTRUMENTS 951,841 0.52
TOTAL INVESTMENTS 168,968,757 90.75
OTHER ASSETS 17,342,287 9.31
OTHER LIABILITIES (108,197) (0.06)
NET ASSETS ATTRIBUTABLE TO HOLDERS OF REDEEMABLE PARTICIPATING SHARES 186,202,847 100.00
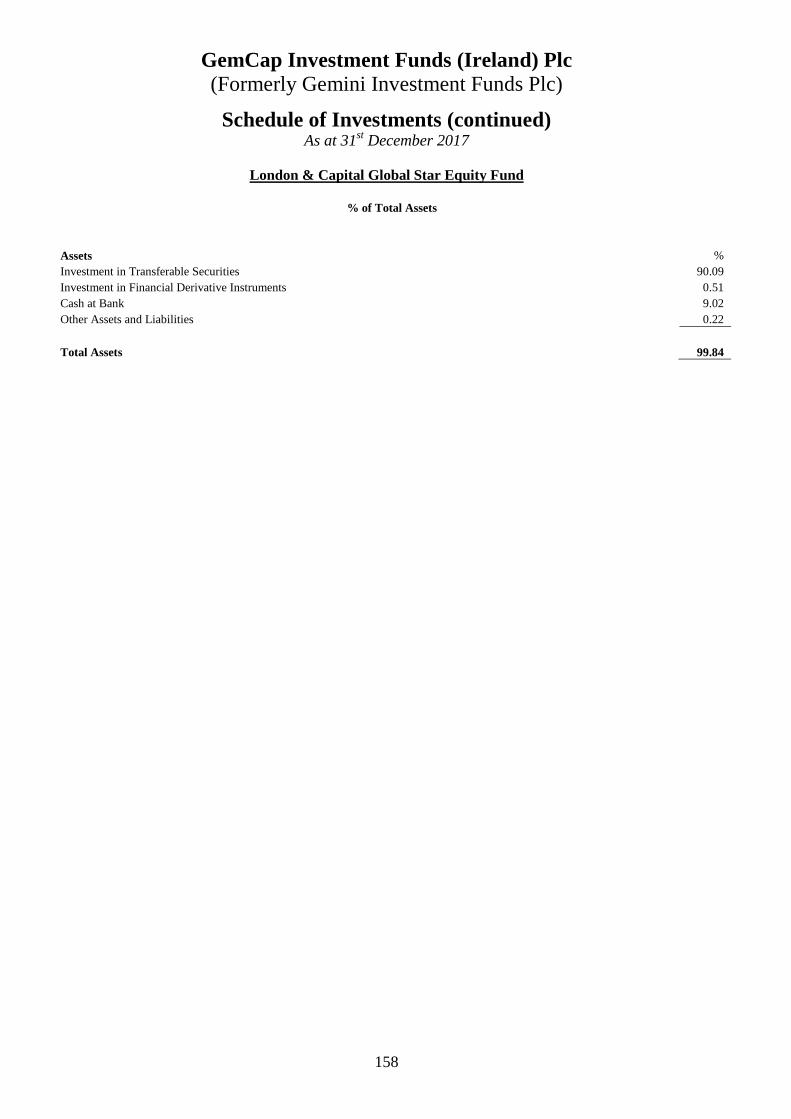
GemCap Investment Funds (Ireland) Plc (Formerly Gemini Investment Funds Plc)
158
Schedule of Investments (continued) As at 31st December 2017
London & Capital Global Star Equity Fund
% of Total Assets
Assets % Investment in Transferable Securities 90.09 Investment in Financial Derivative Instruments 0.51 Cash at Bank 9.02 Other Assets and Liabilities 0.22
Total Assets 99.84
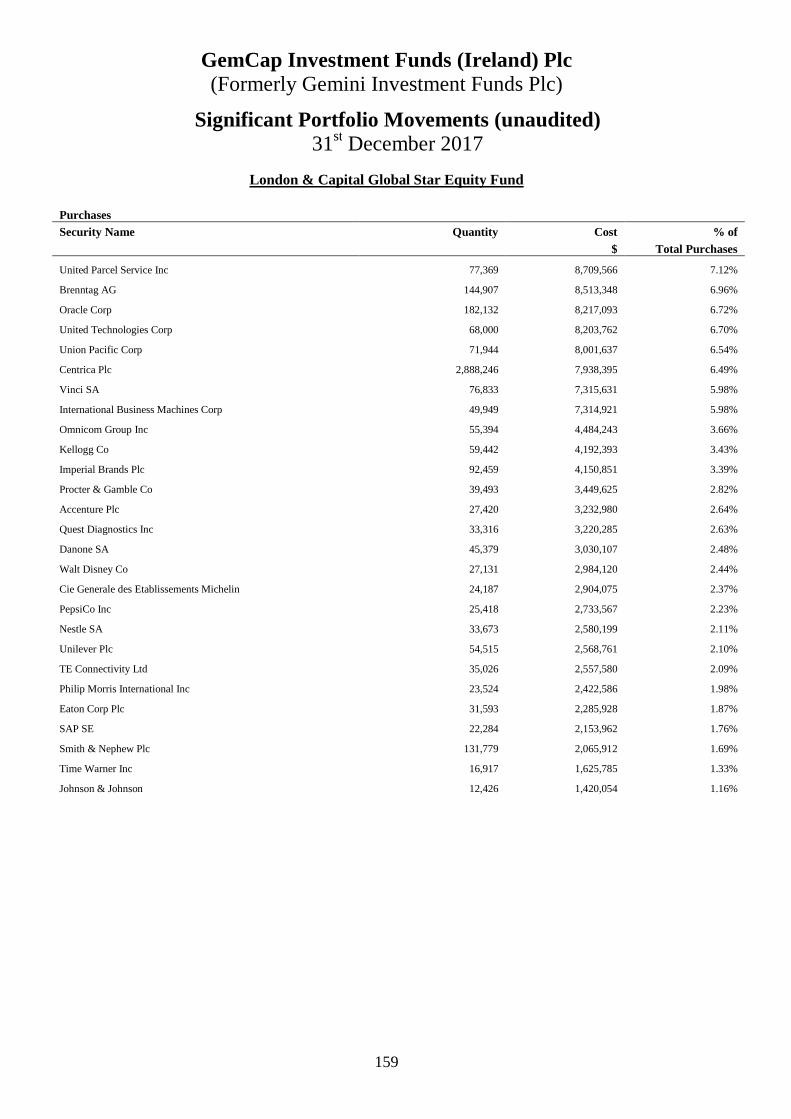
GemCap Investment Funds (Ireland) Plc (Formerly Gemini Investment Funds Plc)
159
Significant Portfolio Movements (unaudited) 31st December 2017
London & Capital Global Star Equity Fund
Purchases Security Name Quantity Cost % of $ Total Purchases
United Parcel Service Inc 77,369 8,709,566 7.12%
Brenntag AG 144,907 8,513,348 6.96%
Oracle Corp 182,132 8,217,093 6.72%
United Technologies Corp 68,000 8,203,762 6.70%
Union Pacific Corp 71,944 8,001,637 6.54%
Centrica Plc 2,888,246 7,938,395 6.49%
Vinci SA 76,833 7,315,631 5.98%
International Business Machines Corp 49,949 7,314,921 5.98%
Omnicom Group Inc 55,394 4,484,243 3.66%
Kellogg Co 59,442 4,192,393 3.43%
Imperial Brands Plc 92,459 4,150,851 3.39%
Procter & Gamble Co 39,493 3,449,625 2.82%
Accenture Plc 27,420 3,232,980 2.64%
Quest Diagnostics Inc 33,316 3,220,285 2.63%
Danone SA 45,379 3,030,107 2.48%
Walt Disney Co 27,131 2,984,120 2.44%
Cie Generale des Etablissements Michelin 24,187 2,904,075 2.37%
PepsiCo Inc 25,418 2,733,567 2.23%
Nestle SA 33,673 2,580,199 2.11%
Unilever Plc 54,515 2,568,761 2.10%
TE Connectivity Ltd 35,026 2,557,580 2.09%
Philip Morris International Inc 23,524 2,422,586 1.98%
Eaton Corp Plc 31,593 2,285,928 1.87%
SAP SE 22,284 2,153,962 1.76%
Smith & Nephew Plc 131,779 2,065,912 1.69%
Time Warner Inc 16,917 1,625,785 1.33%
Johnson & Johnson 12,426 1,420,054 1.16%
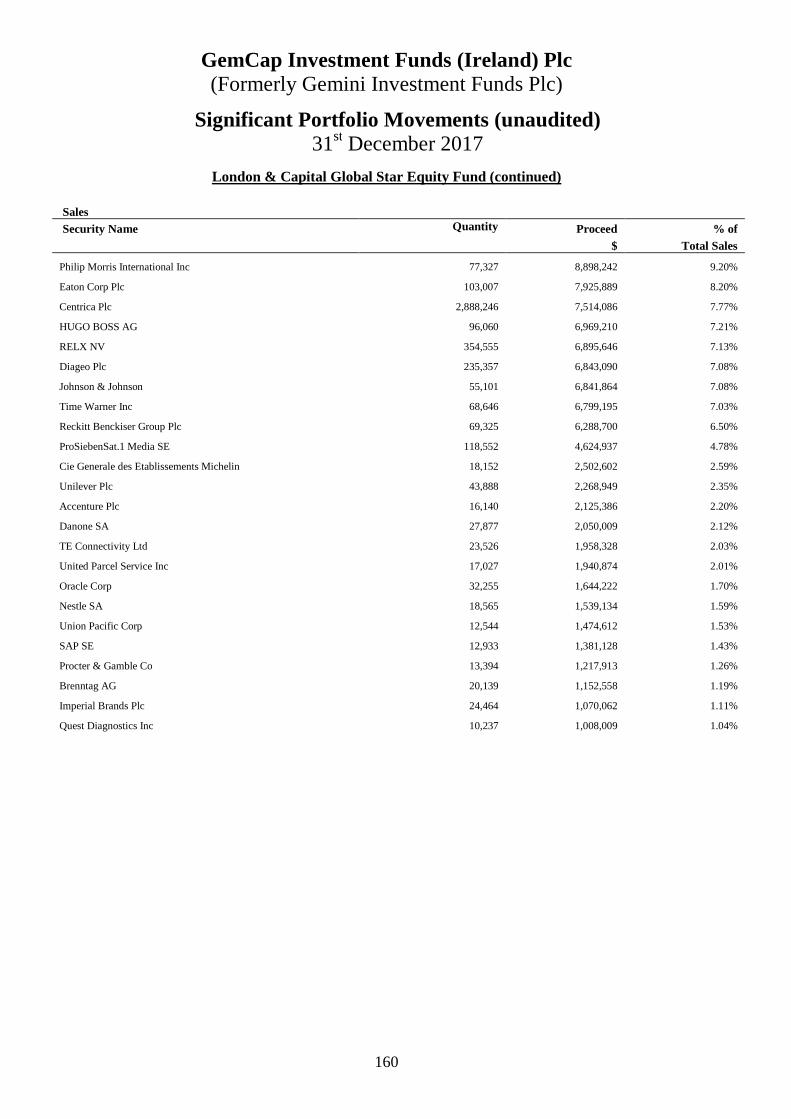
GemCap Investment Funds (Ireland) Plc (Formerly Gemini Investment Funds Plc)
160
Significant Portfolio Movements (unaudited) 31st December 2017
London & Capital Global Star Equity Fund (continued)
Sales
Security Name Quantity Proceed % of $ Total Sales
Philip Morris International Inc 77,327 8,898,242 9.20%
Eaton Corp Plc 103,007 7,925,889 8.20%
Centrica Plc 2,888,246 7,514,086 7.77%
HUGO BOSS AG 96,060 6,969,210 7.21%
RELX NV 354,555 6,895,646 7.13%
Diageo Plc 235,357 6,843,090 7.08%
Johnson & Johnson 55,101 6,841,864 7.08%
Time Warner Inc 68,646 6,799,195 7.03%
Reckitt Benckiser Group Plc 69,325 6,288,700 6.50%
ProSiebenSat.1 Media SE 118,552 4,624,937 4.78%
Cie Generale des Etablissements Michelin 18,152 2,502,602 2.59%
Unilever Plc 43,888 2,268,949 2.35%
Accenture Plc 16,140 2,125,386 2.20%
Danone SA 27,877 2,050,009 2.12%
TE Connectivity Ltd 23,526 1,958,328 2.03%
United Parcel Service Inc 17,027 1,940,874 2.01%
Oracle Corp 32,255 1,644,222 1.70%
Nestle SA 18,565 1,539,134 1.59%
Union Pacific Corp 12,544 1,474,612 1.53%
SAP SE 12,933 1,381,128 1.43%
Procter & Gamble Co 13,394 1,217,913 1.26%
Brenntag AG 20,139 1,152,558 1.19%
Imperial Brands Plc 24,464 1,070,062 1.11%
Quest Diagnostics Inc 10,237 1,008,009 1.04%
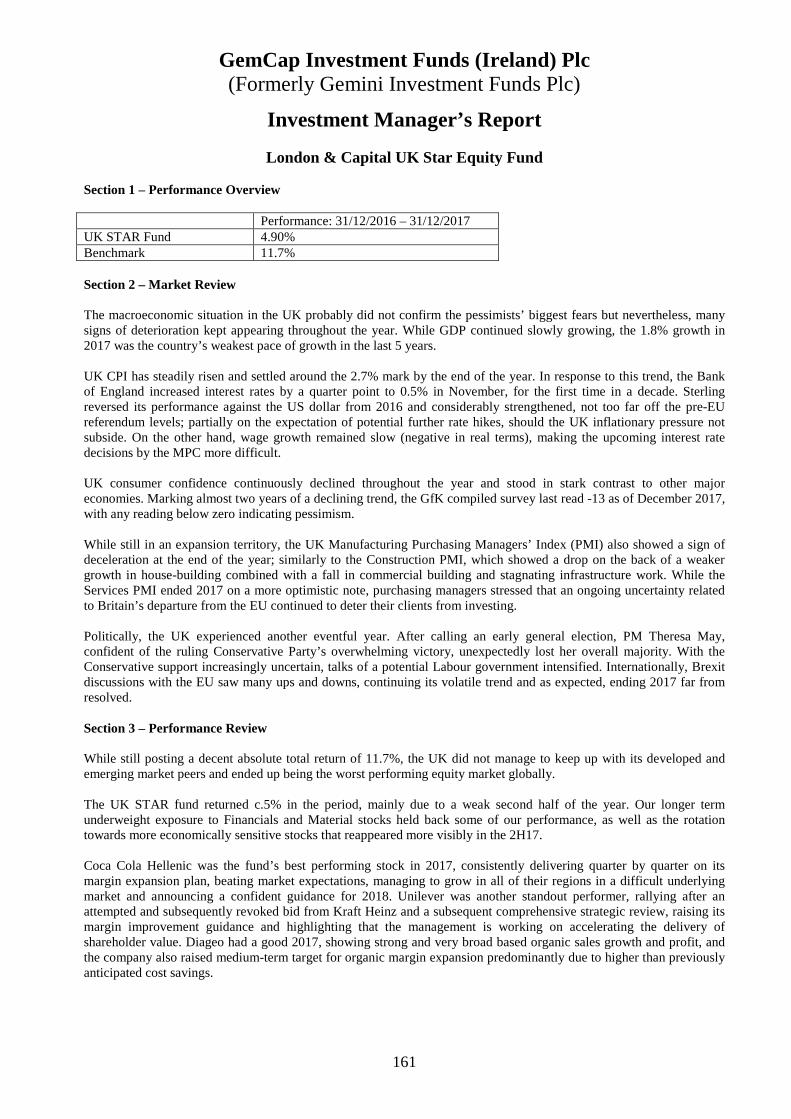
GemCap Investment Funds (Ireland) Plc (Formerly Gemini Investment Funds Plc)
161
Investment Manager’s Report
London & Capital UK Star Equity Fund Section 1 – Performance Overview
Performance: 31/12/2016 – 31/12/2017 UK STAR Fund 4.90% Benchmark 11.7% Section 2 – Market Review
The macroeconomic situation in the UK probably did not confirm the pessimists’ biggest fears but nevertheless, many signs of deterioration kept appearing throughout the year. While GDP continued slowly growing, the 1.8% growth in 2017 was the country’s weakest pace of growth in the last 5 years. UK CPI has steadily risen and settled around the 2.7% mark by the end of the year. In response to this trend, the Bank of England increased interest rates by a quarter point to 0.5% in November, for the first time in a decade. Sterling reversed its performance against the US dollar from 2016 and considerably strengthened, not too far off the pre-EU referendum levels; partially on the expectation of potential further rate hikes, should the UK inflationary pressure not subside. On the other hand, wage growth remained slow (negative in real terms), making the upcoming interest rate decisions by the MPC more difficult. UK consumer confidence continuously declined throughout the year and stood in stark contrast to other major economies. Marking almost two years of a declining trend, the GfK compiled survey last read -13 as of December 2017, with any reading below zero indicating pessimism. While still in an expansion territory, the UK Manufacturing Purchasing Managers’ Index (PMI) also showed a sign of deceleration at the end of the year; similarly to the Construction PMI, which showed a drop on the back of a weaker growth in house-building combined with a fall in commercial building and stagnating infrastructure work. While the Services PMI ended 2017 on a more optimistic note, purchasing managers stressed that an ongoing uncertainty related to Britain’s departure from the EU continued to deter their clients from investing. Politically, the UK experienced another eventful year. After calling an early general election, PM Theresa May, confident of the ruling Conservative Party’s overwhelming victory, unexpectedly lost her overall majority. With the Conservative support increasingly uncertain, talks of a potential Labour government intensified. Internationally, Brexit discussions with the EU saw many ups and downs, continuing its volatile trend and as expected, ending 2017 far from resolved. Section 3 – Performance Review While still posting a decent absolute total return of 11.7%, the UK did not manage to keep up with its developed and emerging market peers and ended up being the worst performing equity market globally. The UK STAR fund returned c.5% in the period, mainly due to a weak second half of the year. Our longer term underweight exposure to Financials and Material stocks held back some of our performance, as well as the rotation towards more economically sensitive stocks that reappeared more visibly in the 2H17. Coca Cola Hellenic was the fund’s best performing stock in 2017, consistently delivering quarter by quarter on its margin expansion plan, beating market expectations, managing to grow in all of their regions in a difficult underlying market and announcing a confident guidance for 2018. Unilever was another standout performer, rallying after an attempted and subsequently revoked bid from Kraft Heinz and a subsequent comprehensive strategic review, raising its margin improvement guidance and highlighting that the management is working on accelerating the delivery of shareholder value. Diageo had a good 2017, showing strong and very broad based organic sales growth and profit, and the company also raised medium-term target for organic margin expansion predominantly due to higher than previously anticipated cost savings.

GemCap Investment Funds (Ireland) Plc (Formerly Gemini Investment Funds Plc)
162
Investment Manager’s Report (Continued)
London & Capital UK Star Equity Fund (Continued)
Section 3 – Performance Review (continued)
WPP performance (as well as the performance of its Advertising peers) initially suffered on the back of its disappointing FY17 guidance for lower than previously announced organic growth and generally weakening trends in certain segments of the advertising industry but ultimately the market got worried that some of the challenges the sector is facing were more structural than cyclical in nature; however, our analysis suggests that there is currently little evidence in support of this view. Babcock underperformed due to the UK domestic political risk and delays/cancellations in certain government contracts impacting not only Babcock but also its peers. Despite this, the company reported a relatively decent operational momentum and a stable pipeline and order book. Section 4 – Outlook
The UK continues facing political uncertainties both domestically, as well as internationally. The situation is even more challenging when macroeconomic deterioration is taken into account. At 1.45% consensus GDP growth estimate for 2018, the UK is expected to be the slowest growing country in Europe and in G10. As the above economic picture may suggest, investing in the UK equity market may prove challenging. However, the currency seems to have stabilized and is more like to weaken that to strengthen further, the more internationally exposed companies continue to deliver solid revenue and earnings growth and valuations of a few selected stocks/areas of the market are now starting to look less stretched; a combination of factors that may provide a few interesting opportunities on a stock specific level. We continue to prefer high quality companies exposed to international growth and/or defensively oriented UK businesses. Petra Posnikova London and Capital Asset Management Limited Date: February 2018

GemCap Investment Funds (Ireland) Plc (Formerly Gemini Investment Funds Plc)
163
Statement of Financial Position as at 31st December 2017 and 2016
L&CUSE L&CUSE 31 Dec 2017 31 Dec 2016 Note £ £
ASSETS Financial Assets at Fair Value through Profit or Loss:
Investments in Transferable Securities 3 12,018,051 16,803,984Cash at bank 5 1,717,858 2,269,420Dividends and interest receivable 11,826 18,238Amount receivable on subscriptions - 175,443Amount receivable on sale of securities - 188,099Other receivables 53 3,229
TOTAL ASSETS 13,747,788 19,458,413 LIABILITIES Investment management fees payable 7 3,050 4,952Manager fee payable 7 3,232 -Administration fees payable 7 4,813 3,437Transfer agency fees payable 7 716 957Depositary and depositary oversight fees payable 7 1,403 1,407Audit fees payable 6,154 -Redemptions payable 535 379,654Other fees payable 4,345 4,564TOTAL LIABILITIES (excluding net assets attributable to ho lders of redeemable participating shares) 24,248 394,971
NET ASSETS ATTRIBUTABLE TO HOLDERS OF REDEEMABLE PARTICIPATING SHARES 13,723,540 19,063,442 The accompanying notes and schedules form an integral part of these financial statements.

GemCap Investment Funds (Ireland) Plc (Formerly Gemini Investment Funds Plc)
164
Statement of Comprehensive Income for the Financial Year Ended 31st
December 2017 and 2016
L&CUSE L&CUSE 2017 2016
Note £ £ INCOME
Dividend income 430,713 643,049 Net realised and unrealised gain on financial assets and liabilities at fair value through profit or loss 9 613,007 1,990,565 Bank Interest 41 - Other income 1,109 - TOTAL INVESTMENT INCOME 1,044,870 2,633,614 EXPENSES Investment management fees 7 48,066 51,970 Manager fees 7 17,492 - Administration fees 7 52,672 48,582 Director fees 7 2,452 3,272 Depositary and depositary oversight fees 7 20,775 7,983 Audit fees 7 9,364 1,865 Transfer agency fees 7 5,211 5,629 Other fees and expenses 7 23,545 30,582 Total Operating Expenses 179,577 149,883 Operating Profit 865,293 2,483,731 Finance Costs Dividends to holders of redeemable participating shares 248,600 260,911 Profit Before Tax 616,693 2,222,820 Withholding tax - 10,826 Increase in net assets attributable to holders of redeemable participating shares from operations 616,693 2,211,994 The accompanying notes and schedules form an integral part of these financial statements. All of the results for the financial year relate to continuing operations.

GemCap Investment Funds (Ireland) Plc (Formerly Gemini Investment Funds Plc)
165
Statement of Changes in Net Assets attributable to Holders of Redeemable Participating Shares
The accompanying notes and schedules form an integral part of these financial statements.
L&CUSE L&CUSE 2017 2016
£ £ Net Assets attributable to holders of Redeemable Participating Shares at the beginning of the financial year
19,063,442 11,510,449
Increase in Net Assets attributable to Holders of Redeemable Participating Shares from operations 616,693 2,211,994 Capital transactions Issue of redeemable shares during the financial year 3,737,617 16,645,011Redemption of redeemable shares during the financial year (9,694,212) (11,304,012)
Net Assets attributable to Holders of Redeemable Participating Shares at the end of the financial year
13,723,540 19,063,442
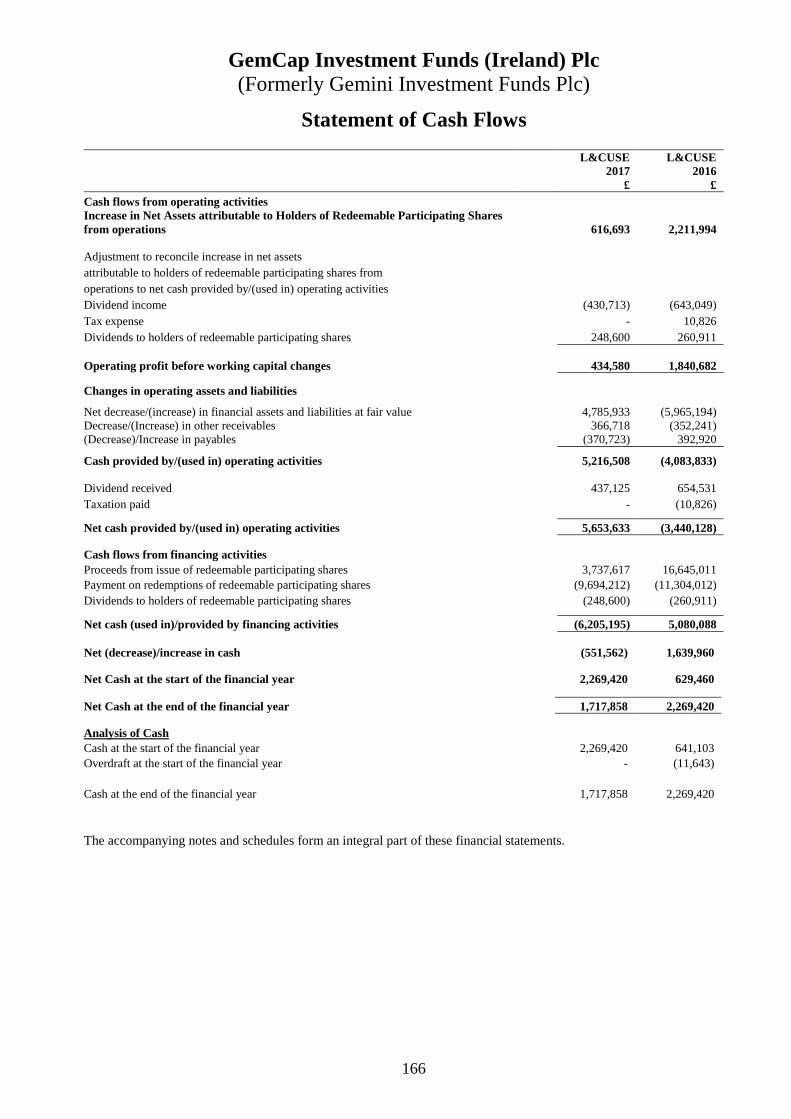
GemCap Investment Funds (Ireland) Plc (Formerly Gemini Investment Funds Plc)
166
Statement of Cash Flows
L&CUSE L&CUSE 2017 2016 £ £ Cash flows from operating activities Increase in Net Assets attributable to Holders of Redeemable Participating Shares from operations 616,693 2,211,994 Adjustment to reconcile increase in net assets attributable to holders of redeemable participating shares from operations to net cash provided by/(used in) operating activities Dividend income (430,713) (643,049) Tax expense - 10,826 Dividends to holders of redeemable participating shares 248,600 260,911 Operating profit before working capital changes 434,580 1,840,682 Changes in operating assets and liabilities Net decrease/(increase) in financial assets and liabilities at fair value 4,785,933 (5,965,194) Decrease/(Increase) in other receivables 366,718 (352,241) (Decrease)/Increase in payables (370,723) 392,920 Cash provided by/(used in) operating activities 5,216,508 (4,083,833)
Dividend received 437,125 654,531 Taxation paid - (10,826) Net cash provided by/(used in) operating activities 5,653,633 (3,440,128) Cash flows from financing activities Proceeds from issue of redeemable participating shares 3,737,617 16,645,011 Payment on redemptions of redeemable participating shares (9,694,212) (11,304,012) Dividends to holders of redeemable participating shares (248,600) (260,911) Net cash (used in)/provided by financing activities (6,205,195) 5,080,088
Net (decrease)/increase in cash (551,562) 1,639,960 Net Cash at the start of the financial year 2,269,420 629,460 Net Cash at the end of the financial year 1,717,858 2,269,420 Analysis of Cash Cash at the start of the financial year 2,269,420 641,103 Overdraft at the start of the financial year - (11,643) Cash at the end of the financial year 1,717,858 2,269,420 The accompanying notes and schedules form an integral part of these financial statements.

GemCap Investment Funds (Ireland) Plc (Formerly Gemini Investment Funds Plc)
167
Schedule of Investments As at 31st December 2017
London & Capital UK Star Equity Fund
(expressed in GBP) Acquisition Fair % net Description Quantity Currency cost value assets
1) INVESTMENTS
A) TRANSFERABLE SECURITIES ADMITTED TO AN OFFICIAL STOCK EXCHANGE LISTING
1) LISTED SECURITIES : EQUITIES GREAT BRITAIN
Babcock International Group Plc 91,495 GBP 828,101 645,497 4.70 British American Tobacco Plc 12,748 GBP 511,139 639,695 4.66 Cineworld Group Plc 103,540 GBP 713,864 622,275 4.53 Computacenter Plc 55,111 GBP 549,930 635,430 4.63 Diageo Plc 24,302 GBP 450,503 662,230 4.83 Imperial Brands Plc 19,687 GBP 701,308 623,290 4.54 Inchcape Plc 81,120 GBP 601,796 634,764 4.63 Kingfisher Plc 181,600 GBP 655,081 613,263 4.47 Moneysupermarket.com Group Plc 189,441 GBP 668,431 674,789 4.92 Reckitt Benckiser Group Plc 9,612 GBP 617,315 665,054 4.85 Sage Group Plc 76,483 GBP 546,908 610,334 4.45 Smith & Nephew Plc 46,421 GBP 534,575 597,902 4.36 Smiths Group Plc 39,823 GBP 476,712 593,363 4.32 Ultra Electronics Holdings Plc 49,964 GBP 805,330 673,015 4.90 Unilever Plc 14,991 GBP 455,028 618,454 4.51
9,116,021 9,509,355 69.30
JERSEY Ferguson Plc 11,826 GBP 522,954 630,326 4.59 UBM Plc 83,295 GBP 514,088 622,214 4.53 WPP Plc 47,749 GBP 719,397 640,314 4.67
1,756,439 1,892,854 13.79
SWITZERLAND Coca-Cola HBC AG 25,448 GBP 434,307 615,842 4.49
434,307 615,842 4.49
TOTAL LISTED SECURITIES : EQUITIES 11,306,767 12,018,051 87.58
TOTAL TRANSFERABLE SECURITIES ADMITTED TO AN OFFICIAL STOCK EXCHANGE LISTING 11,306,767 12,018,051 87.58
TOTAL INVESTMENTS 12,018,051 87.58
OTHER ASSETS 1,729,737 12.60
OTHER LIABILITIES (24,248) (0.18)
NET ASSETS ATTRIBUTABLE TO HOLDERS OF REDEEMABLE PARTICIPATING SHARES 13,723,540 100.00
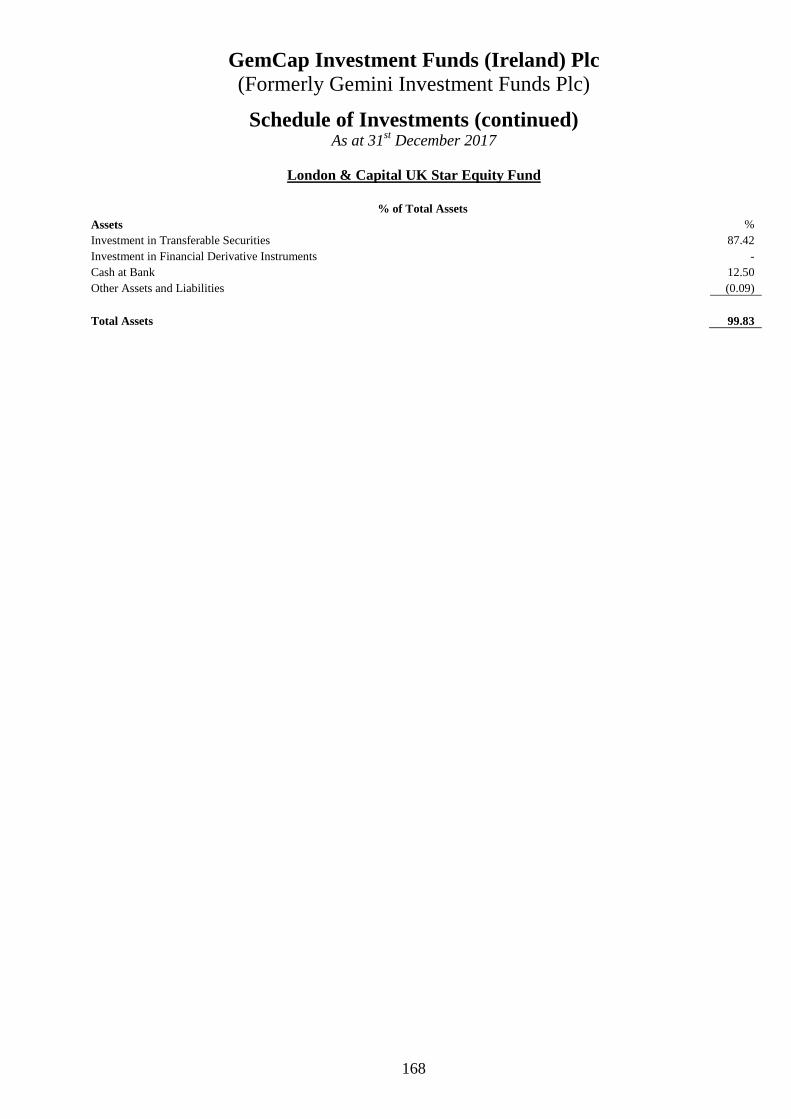
GemCap Investment Funds (Ireland) Plc (Formerly Gemini Investment Funds Plc)
168
Schedule of Investments (continued) As at 31st December 2017
London & Capital UK Star Equity Fund
% of Total Assets Assets % Investment in Transferable Securities 87.42 Investment in Financial Derivative Instruments - Cash at Bank 12.50 Other Assets and Liabilities (0.09)
Total Assets 99.83
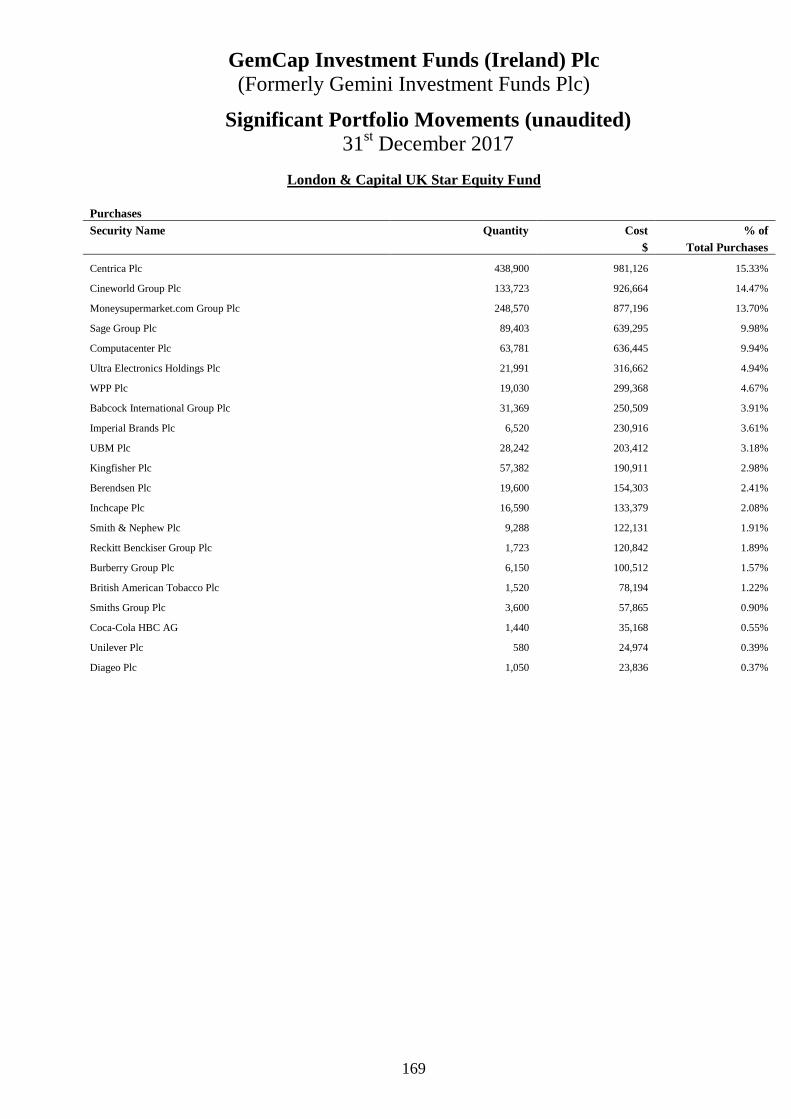
GemCap Investment Funds (Ireland) Plc (Formerly Gemini Investment Funds Plc)
169
Significant Portfolio Movements (unaudited) 31st December 2017
London & Capital UK Star Equity Fund
Purchases Security Name Quantity Cost % of $ Total Purchases
Centrica Plc 438,900 981,126 15.33%
Cineworld Group Plc 133,723 926,664 14.47%
Moneysupermarket.com Group Plc 248,570 877,196 13.70%
Sage Group Plc 89,403 639,295 9.98%
Computacenter Plc 63,781 636,445 9.94%
Ultra Electronics Holdings Plc 21,991 316,662 4.94%
WPP Plc 19,030 299,368 4.67%
Babcock International Group Plc 31,369 250,509 3.91%
Imperial Brands Plc 6,520 230,916 3.61%
UBM Plc 28,242 203,412 3.18%
Kingfisher Plc 57,382 190,911 2.98%
Berendsen Plc 19,600 154,303 2.41%
Inchcape Plc 16,590 133,379 2.08%
Smith & Nephew Plc 9,288 122,131 1.91%
Reckitt Benckiser Group Plc 1,723 120,842 1.89%
Burberry Group Plc 6,150 100,512 1.57%
British American Tobacco Plc 1,520 78,194 1.22%
Smiths Group Plc 3,600 57,865 0.90%
Coca-Cola HBC AG 1,440 35,168 0.55%
Unilever Plc 580 24,974 0.39%
Diageo Plc 1,050 23,836 0.37%
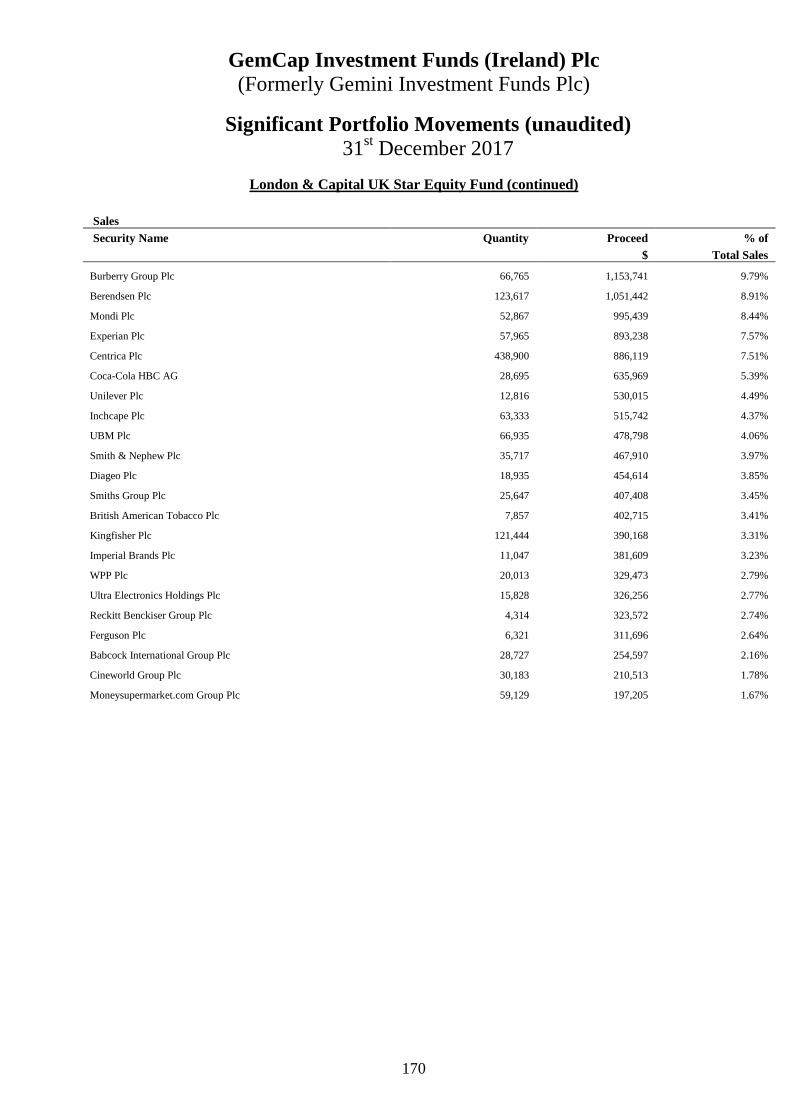
GemCap Investment Funds (Ireland) Plc (Formerly Gemini Investment Funds Plc)
170
Significant Portfolio Movements (unaudited) 31st December 2017
London & Capital UK Star Equity Fund (continued)
Sales
Security Name Quantity Proceed % of $ Total Sales
Burberry Group Plc 66,765 1,153,741 9.79%
Berendsen Plc 123,617 1,051,442 8.91%
Mondi Plc 52,867 995,439 8.44%
Experian Plc 57,965 893,238 7.57%
Centrica Plc 438,900 886,119 7.51%
Coca-Cola HBC AG 28,695 635,969 5.39%
Unilever Plc 12,816 530,015 4.49%
Inchcape Plc 63,333 515,742 4.37%
UBM Plc 66,935 478,798 4.06%
Smith & Nephew Plc 35,717 467,910 3.97%
Diageo Plc 18,935 454,614 3.85%
Smiths Group Plc 25,647 407,408 3.45%
British American Tobacco Plc 7,857 402,715 3.41%
Kingfisher Plc 121,444 390,168 3.31%
Imperial Brands Plc 11,047 381,609 3.23%
WPP Plc 20,013 329,473 2.79%
Ultra Electronics Holdings Plc 15,828 326,256 2.77%
Reckitt Benckiser Group Plc 4,314 323,572 2.74%
Ferguson Plc 6,321 311,696 2.64%
Babcock International Group Plc 28,727 254,597 2.16%
Cineworld Group Plc 30,183 210,513 1.78%
Moneysupermarket.com Group Plc 59,129 197,205 1.67%

GemCap Investment Funds (Ireland) Plc (Formerly Gemini Investment Funds Plc)
171
Investment Manager’s Report
Principal Asset Allocation Fund
During 2017 The Fund was positioned defensively with a focus on capital preservation in uncertain times. With changes in monetary policy, political uncertainty and valuations stretched we believe the fund is well positioned to offset long only funds in a client’s overall portfolio. What has this meant to the portfolio?
Firstly, it’s important to understand where we are in the economic cycle and how to position a client’s portfolio accordingly. Diversification is not just about allocating to equities and bonds, we see that PAA sits as a “core” within client portfolios and complements positions that are more long bond/equity bias, helping to smooth out the overall investment journey.
When allocating to Multi-Asset Managers it is best to understand their investment philosophy and investment mandate as no single manager in the sector is the same. It is best to identify managers that are not highly correlated to each other or any market index, creating true diversification. We typically hold between 20-30% in “alternatives” to minimise downside risk and mitigate investment losses due to a correction in bond or equity markets, or typically both as they are now more correlated to one another than ever before. In 2017 this has been to the detriment of fund performance, as markets have continued to rally to new market highs and seem resilient against “market noise”. Overall market conditions have been frustrating and this has led to disappointing performance year to date. Although many decisions made this year have gone against us, they were made with the funds primary objective of protecting investors capital and maintaining our volatility target of sub 10%, which currently sits at 6.68%. Over a 12-month basis the fund remains up 3.62% and is on track maintaining its medium-term target of Libor + 5%. What could 2018 look like? The easy, stock answer, is that PAA with its diversified approach and use of alternatives managers, should expect a rebound in ’18 behind increased volatility in the market. The reality is, rarely is it that easy to predict and 2018 is sure to be a bit more complicated than just Political Uncertainty = Unpredictable = Volatility = Positive Returns (see attached 2018 Political chart). There are plenty of things happening in the world to pay attention to, from the Chinese economy to Brexit to Syria to negative interest rates, plus there is always the potential of a true “black swan” event. There’s enough uncertainty, unknowns, and unrest to go around – and that dynamic is what will drive performance in 2018. What is going to help drive performance?
1) Unpredictability of Trump – We have seen an incredible rally in equities since the election as evidence that political uncertainty does not necessarily equal market uncertainty. There are really three camps right now, 1) those scared to death of what’s going to happen 2) those hoping Mr. Trump can make “it” happen and breathe further growth and profits into the US economy 3) those who have no idea what’s going to happen.
2) Increased Volatility - An artificially low volatility environment, generat ed by the passive flows of Central Banks (in excess of $300bn per month at present) and rule-based investing vehicles (we count almost $8trn at play today between risk-parity, vol-levers, ETFs, passive index funds), breeds market fragility. It may well represent the calm before the storm. Whether or not Trump fuels equity uncertainty or not – we expect to see volatility increase and return back to normal levels in 2018. Volatility tends to be somewhat cyclical, the past 18 months we have seen the lowest volatility expansion in the markets since 2012. Equity market volatility will begin to return to its long-term average.
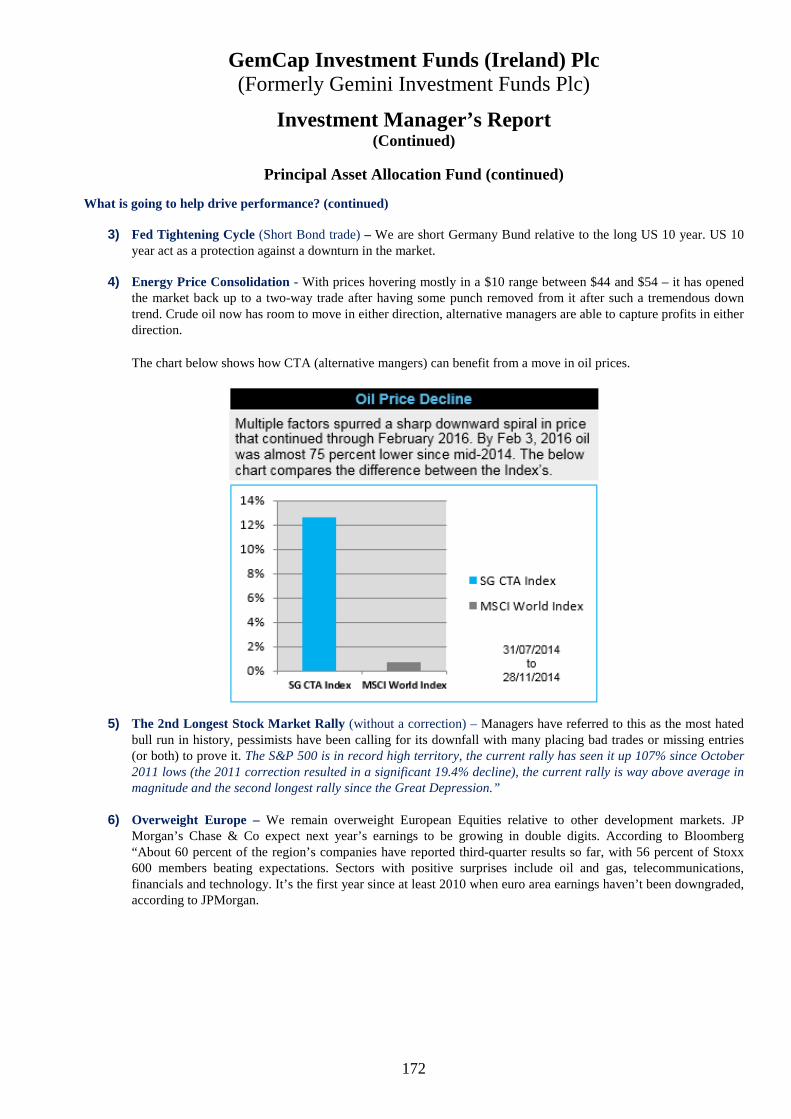
GemCap Investment Funds (Ireland) Plc (Formerly Gemini Investment Funds Plc)
172
Investment Manager’s Report (Continued)
Principal Asset Allocation Fund (continued)
What is going to help drive performance? (continued)
3) Fed Tightening Cycle (Short Bond trade) – We are short Germany Bund relative to the long US 10 year. US 10 year act as a protection against a downturn in the market.
4) Energy Price Consolidation - With prices hovering mostly in a $10 range between $44 and $54 – it has opened
the market back up to a two-way trade after having some punch removed from it after such a tremendous down trend. Crude oil now has room to move in either direction, alternative managers are able to capture profits in either direction. The chart below shows how CTA (alternative mangers) can benefit from a move in oil prices.
5) The 2nd Longest Stock Market Rally (without a correction) – Managers have referred to this as the most hated
bull run in history, pessimists have been calling for its downfall with many placing bad trades or missing entries (or both) to prove it. The S&P 500 is in record high territory, the current rally has seen it up 107% since October 2011 lows (the 2011 correction resulted in a significant 19.4% decline), the current rally is way above average in magnitude and the second longest rally since the Great Depression.”
6) Overweight Europe – We remain overweight European Equities relative to other development markets. JP Morgan’s Chase & Co expect next year’s earnings to be growing in double digits. According to Bloomberg “About 60 percent of the region’s companies have reported third-quarter results so far, with 56 percent of Stoxx 600 members beating expectations. Sectors with positive surprises include oil and gas, telecommunications, financials and technology. It’s the first year since at least 2010 when euro area earnings haven’t been downgraded, according to JPMorgan.
GemCap Investment Funds (Ireland) Plc (Formerly Gemini Investment Funds Plc)
173
Investment Manager’s Report (Continued)
Principal Asset Allocation Fund (continued)
Fine as far as it goes, but how do we know where we are in this cycle? In essence that is what we should try to monitor to avoid getting distracted by the deluge of daily drivel from the financial media circus. Our team constantly looks at investment themes, understanding where we are in an economic cycle or the cycle of an asset class. It’s not about passive or active or long or short, we believe the argument should be focused on finding the best underlying option to express our opinion. Within our portfolio we may invest into both an index and an active manager, often avoiding ETF’s or tracker funds due to the tracking error. We may be long in some sectors, whilst being short in others, as demonstrated in our government bond allocation. Our Risk Management process allows us to navigate future uncertainty by dynamically increasing and decreasing volatility combined with portfolio constructions; the fund is well positioned to weather any storm that may be ahead. Thanks for your ongoing support, please do hesitate to contact us should you have any queries. Kind Regards Leon Diamond Mansard Capital Management Limited Date: February 2018

GemCap Investment Funds (Ireland) Plc (Formerly Gemini Investment Funds Plc)
174
Statement of Financial Position as at 31st December 2017 and 2016
PAAF PAAF 31 Dec 2017 31 Dec 2016 Note £ £
ASSETS Financial Assets at Fair Value through Profit or Loss:
Investments in Transferable Securities 3 32,304,290 31,171,335Investments in Financial Derivative Instruments 3 665,004 274,197
Cash at bank 5 3,518,308 5,934,983Dividends and interest receivable 14 2Amount receivable on subscriptions 15,366 87,070Other receivables 621,037 423,485
TOTAL ASSETS 37,124,019 37,891,072 LIABILITIES Financial Liabilities at Fair Value through Profit or Loss:
Investments in Financial Derivative Instruments 3 322,857 159,310Bank Overdraft 5 350,368 194,988Investment management fees payable 7 96,988 76,874Administration fees payable 7 3,579 3,429Transfer agency fees payable 7 1,611 2,076Directors fees payable 7 311 -Depositary and depositary oversight fees payable 7 1,403 1,507Audit fees payable 3,581 5,988Redemptions payable 33,699 104,173Other fees payable 7,054 3,719TOTAL LIABILITIES (excluding net assets attributable to ho lders of redeemable participating shares) 821,451 552,064
NET ASSETS ATTRIBUTABLE TO HOLDERS OF REDEEMABLE PARTICIPATING SHARES 36,302,568 37,339,008 The accompanying notes and schedules form an integral part of these financial statements.
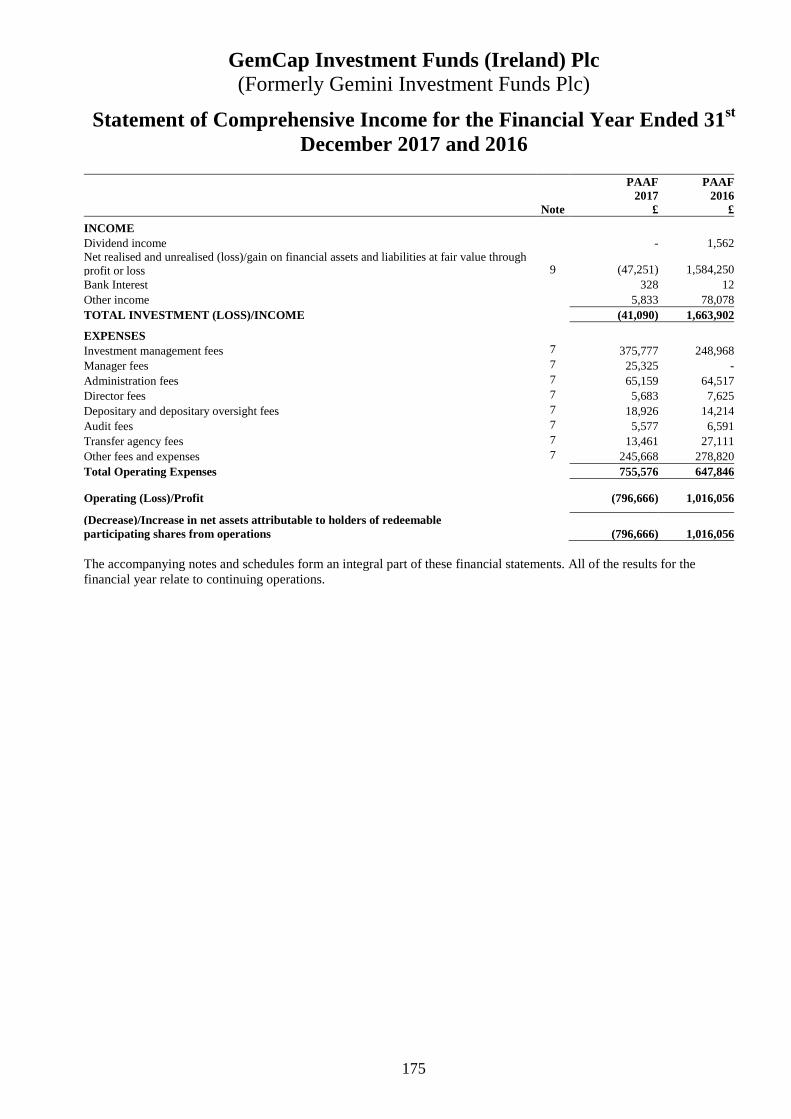
GemCap Investment Funds (Ireland) Plc (Formerly Gemini Investment Funds Plc)
175
Statement of Comprehensive Income for the Financial Year Ended 31st December 2017 and 2016
PAAF PAAF
2017 2016 Note £ £ INCOME
Dividend income - 1,562Net realised and unrealised (loss)/gain on financial assets and liabilities at fair value through profit or loss 9 (47,251) 1,584,250Bank Interest 328 12Other income 5,833 78,078TOTAL INVESTMENT (LOSS)/INCOME (41,090) 1,663,902 EXPENSES Investment management fees 7 375,777 248,968Manager fees 7 25,325 -Administration fees 7 65,159 64,517Director fees 7 5,683 7,625Depositary and depositary oversight fees 7 18,926 14,214Audit fees 7 5,577 6,591Transfer agency fees 7 13,461 27,111Other fees and expenses 7 245,668 278,820Total Operating Expenses 755,576 647,846 Operating (Loss)/Profit (796,666) 1,016,056 (Decrease)/Increase in net assets attributable to holders of redeemable participating shares from operations (796,666) 1,016,056 The accompanying notes and schedules form an integral part of these financial statements. All of the results for the financial year relate to continuing operations.
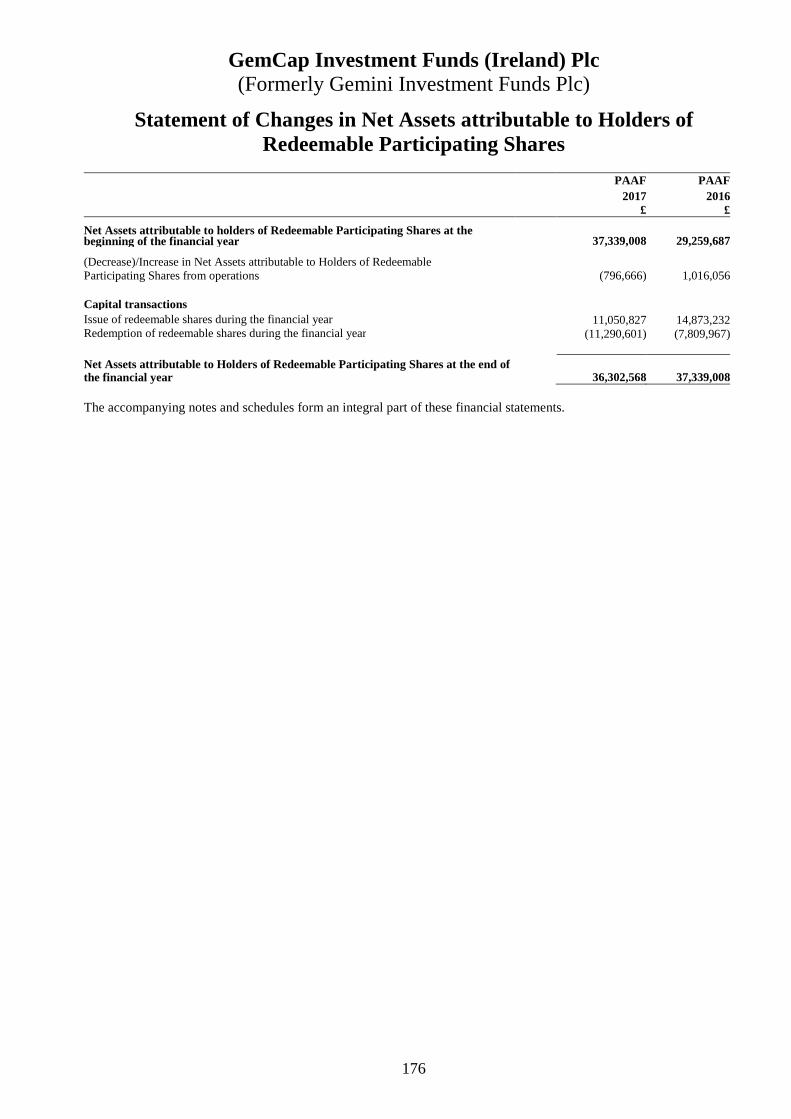
GemCap Investment Funds (Ireland) Plc (Formerly Gemini Investment Funds Plc)
176
Statement of Changes in Net Assets attributable to Holders of Redeemable Participating Shares
The accompanying notes and schedules form an integral part of these financial statements.
PAAF PAAF 2017 2016
£ £ Net Assets attributable to holders of Redeemable Participating Shares at the beginning of the financial year
37,339,008 29,259,687
(Decrease)/Increase in Net Assets attributable to Holders of Redeemable Participating Shares from operations (796,666) 1,016,056 Capital transactions Issue of redeemable shares during the financial year 11,050,827 14,873,232Redemption of redeemable shares during the financial year (11,290,601) (7,809,967)
Net Assets attributable to Holders of Redeemable Participating Shares at the end of the financial year
36,302,568 37,339,008

GemCap Investment Funds (Ireland) Plc (Formerly Gemini Investment Funds Plc)
177
Statement of Cash Flows
PAAF PAAF 2017 2016 £ £ Cash flows from operating activities (Decrease)/Increase in Net Assets attributable to Holders of Redeemable Participating Shares from operations (796,666) 1,016,056 Adjustment to reconcile (decrease)/increase in net assets attributable to holders of redeemable participating shares from operations to net cash used in operating activities Dividend income - (1,562) Operating (loss)/profit before working capital changes (796,666) 1,014,494 Changes in operating assets and liabilities Net increase in financial assets and liabilities at fair value (1,360,215) (8,198,828) Increase in other receivables (125,848) (48,795) (Decrease)/Increase in payables (49,540) 141,479 Cash used in operating activities (2,332,269) (7,091,650) Interest paid (12) (2) Dividend received - 1,562 Net cash used in operating activities (2,332,281) (7,090,090) Cash flows from financing activities Proceeds from issue of redeemable participating shares 11,050,827 14,873,232 Payment on redemptions of redeemable participating shares (11,290,601) (7,809,967) Net cash (used in)/provided by financing activities (239,774) 7,063,265
Net decrease in cash (2,572,055) (26,825) Net Cash at the start of the financial year 5,739,995 5,766,820 Net Cash at the end of the financial year 3,167,940 5,739,995 Analysis of Cash Cash at the start of the financial year 5,934,983 6,792,749 Overdraft at the start of the financial year (194,988) (1,025,929) Cash at the end of the financial year 3,518,308 5,934,983 Overdraft at the end of the financial year 350,368 (194,988) The accompanying notes and schedules form an integral part of these financial statements.
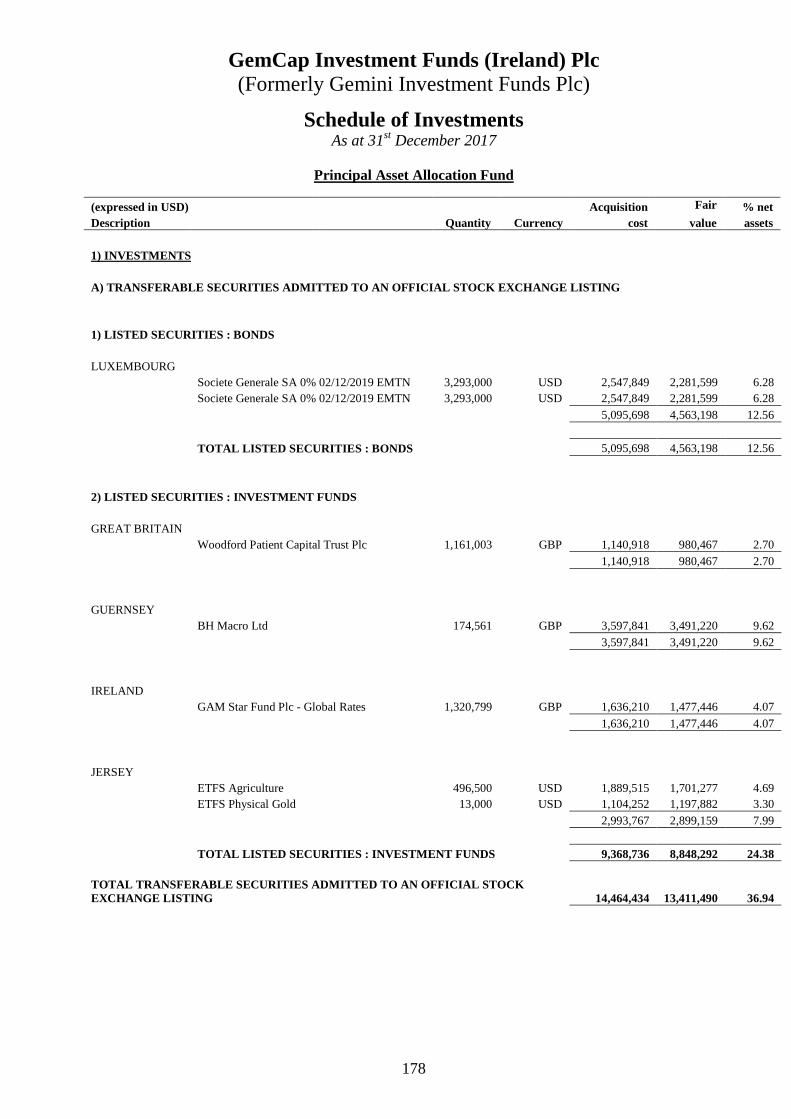
GemCap Investment Funds (Ireland) Plc (Formerly Gemini Investment Funds Plc)
178
Schedule of Investments As at 31st December 2017
Principal Asset Allocation Fund
(expressed in USD) Acquisition Fair % net Description Quantity Currency cost value assets
1) INVESTMENTS
A) TRANSFERABLE SECURITIES ADMITTED TO AN OFFICIAL STOCK EXCHANGE LISTING
1) LISTED SECURITIES : BONDS
LUXEMBOURG Societe Generale SA 0% 02/12/2019 EMTN 3,293,000 USD 2,547,849 2,281,599 6.28 Societe Generale SA 0% 02/12/2019 EMTN 3,293,000 USD 2,547,849 2,281,599 6.28
5,095,698 4,563,198 12.56
TOTAL LISTED SECURITIES : BONDS 5,095,698 4,563,198 12.56
2) LISTED SECURITIES : INVESTMENT FUNDS
GREAT BRITAIN Woodford Patient Capital Trust Plc 1,161,003 GBP 1,140,918 980,467 2.70
1,140,918 980,467 2.70
GUERNSEY BH Macro Ltd 174,561 GBP 3,597,841 3,491,220 9.62
3,597,841 3,491,220 9.62
IRELAND GAM Star Fund Plc - Global Rates 1,320,799 GBP 1,636,210 1,477,446 4.07
1,636,210 1,477,446 4.07
JERSEY ETFS Agriculture 496,500 USD 1,889,515 1,701,277 4.69
ETFS Physical Gold 13,000 USD 1,104,252 1,197,882 3.30 2,993,767 2,899,159 7.99
TOTAL LISTED SECURITIES : INVESTMENT FUNDS 9,368,736 8,848,292 24.38
TOTAL TRANSFERABLE SECURITIES ADMITTED TO AN OFFICIAL STOCK EXCHANGE LISTING 14,464,434 13,411,490 36.94

GemCap Investment Funds (Ireland) Plc (Formerly Gemini Investment Funds Plc)
179
Schedule of Investments (continued) As at 31st December 2017
Principal Asset Allocation Fund
(expressed in USD) Acquisition Fair % net Description Quantity Currency cost value assets
B) OTHER TRANSFERABLE SECURITIES
1) OTHER TRANSFERABLE SECURITIES. : WARRANTS
MALTA Commonwealth Securitisations Plc 0% / perpetual 26 EUR 2,288,243 2,310,640 6.36
2,288,243 2,310,640 6.36
TOTAL OTHER TRANSFERABLE SECURITIES : WARRANTS 2,288,243 2,310,640 6.36
2) OTHER TRANSFERABLE SECURITIES : INVESTMENT FUNDS
GREAT BRITAIN Link Financial - LF Woodford Equity Income Fund 756,254 GBP 905,030 968,911 2.67 Unicorn Investment Funds - Outstanding British Companies Fund 338,662 GBP 930,000 1,061,706 2.92
1,835,030 2,030,617 5.59
IRELAND MontLake UCITS Platform ICAV - Dunn WMA Institutional UCITS Fund 16,083 GBP 1,710,553 1,817,018 5.00
1,710,553 1,817,018 5.00
LUXEMBOURG Standard Life Investments Global SICAV - Global Focused Strategies Fund 99,900 GBP 1,034,851 1,009,080 2.78 T Rowe Price Funds SICAV - US Smaller Companies Equity Fund 34,500 GBP 667,920 801,779 2.21
1,702,771 1,810,859 4.99
TOTAL OTHER TRANSFERABLE SECURITIES : INVESTMENT FUNDS 5,248,354 5,658,494 15.58
TOTAL OTHER TRANSFERABLE SECURITIES 7,536,597 7,969,134 21.94
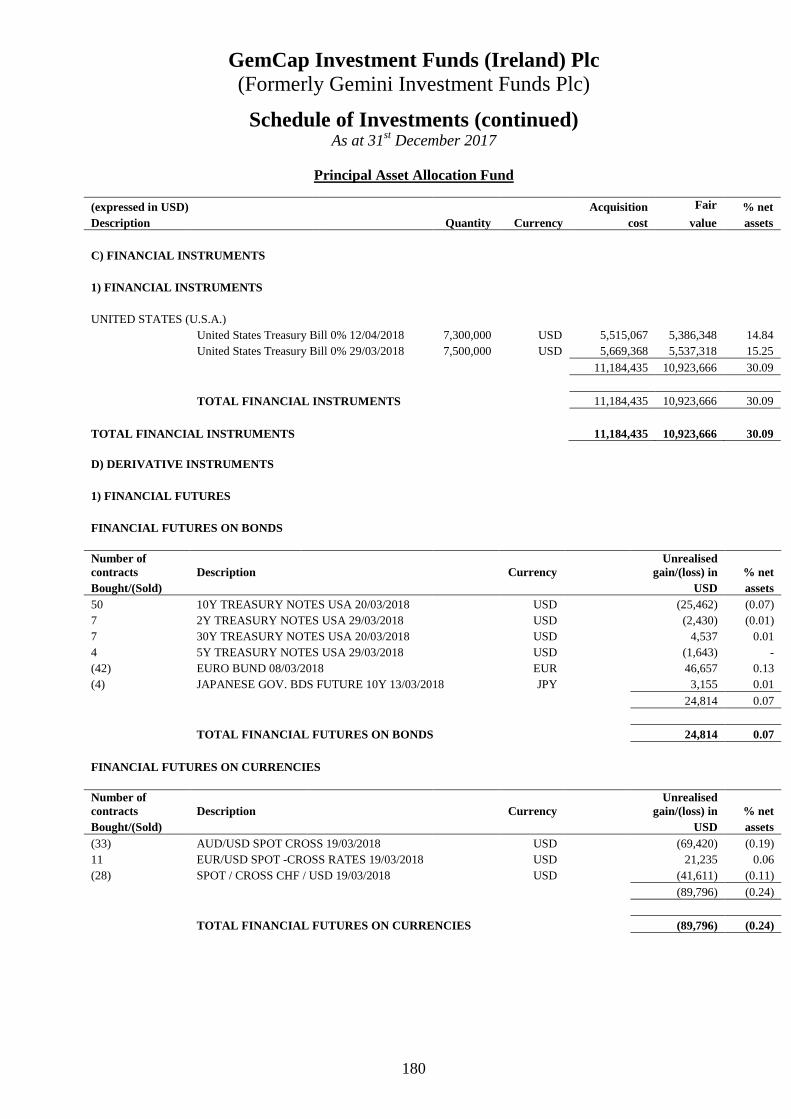
GemCap Investment Funds (Ireland) Plc (Formerly Gemini Investment Funds Plc)
180
Schedule of Investments (continued) As at 31st December 2017
Principal Asset Allocation Fund
(expressed in USD) Acquisition Fair % net Description Quantity Currency cost value assets
C) FINANCIAL INSTRUMENTS
1) FINANCIAL INSTRUMENTS
UNITED STATES (U.S.A.) United States Treasury Bill 0% 12/04/2018 7,300,000 USD 5,515,067 5,386,348 14.84 United States Treasury Bill 0% 29/03/2018 7,500,000 USD 5,669,368 5,537,318 15.25
11,184,435 10,923,666 30.09
TOTAL FINANCIAL INSTRUMENTS 11,184,435 10,923,666 30.09
TOTAL FINANCIAL INSTRUMENTS 11,184,435 10,923,666 30.09
D) DERIVATIVE INSTRUMENTS
1) FINANCIAL FUTURES
FINANCIAL FUTURES ON BONDS
Number of contracts Description Currency
Unrealised gain/(loss) in % net
Bought/(Sold) USD assets 50 10Y TREASURY NOTES USA 20/03/2018 USD (25,462) (0.07) 7 2Y TREASURY NOTES USA 29/03/2018 USD (2,430) (0.01) 7 30Y TREASURY NOTES USA 20/03/2018 USD 4,537 0.01 4 5Y TREASURY NOTES USA 29/03/2018 USD (1,643) - (42) EURO BUND 08/03/2018 EUR 46,657 0.13 (4) JAPANESE GOV. BDS FUTURE 10Y 13/03/2018 JPY 3,155 0.01
24,814 0.07
TOTAL FINANCIAL FUTURES ON BONDS 24,814 0.07
FINANCIAL FUTURES ON CURRENCIES
Number of contracts Description Currency
Unrealised gain/(loss) in % net
Bought/(Sold) USD assets (33) AUD/USD SPOT CROSS 19/03/2018 USD (69,420) (0.19) 11 EUR/USD SPOT -CROSS RATES 19/03/2018 USD 21,235 0.06 (28) SPOT / CROSS CHF / USD 19/03/2018 USD (41,611) (0.11)
(89,796) (0.24)
TOTAL FINANCIAL FUTURES ON CURRENCIES (89,796) (0.24)

GemCap Investment Funds (Ireland) Plc (Formerly Gemini Investment Funds Plc)
181
Schedule of Investments (continued) As at 31st December 2017
Principal Asset Allocation Fund
D) DERIVATIVE INSTRUMENTS (continued)
1) FINANCIAL FUTURES (continued)
FINANCIAL FUTURES ON INDICES
Number of contracts Description Currency
Unrealised gain/(loss) in % net
Bought/(Sold) USD assets 3 DAX-INDEX 16/03/2018 EUR (15,064) (0.04) 73 DJ EURO STOXX/BANKS/PRICE IND 16/03/2018 EUR (15,246) (0.04) 67 EURO STOXX 50 PR 16/03/2018 EUR (48,230) (0.13) 2 FTSE MIB INDEX 16/03/2018 EUR (8,336) (0.02) 9 IBEX-35 INDICES BOLSA ESPANOL. 19/01/201 EUR (18,292) (0.05) 38 MSCI WORL NET INDEX 16/03/2018 USD 23,925 0.07 (7) NASDAQ 100 E-MINI INDEX 16/03/2018 USD 773 - 6 NIKKEI 225 INDICES D 08/03/2018 JPY 99 - (6) RUSSELL 2000 INDEX 16/03/2018 USD 2,489 0.01 (2) RUSSELL 2000 INDEX 16/03/2018 USD 859 - (2) RUSSELL 2000 INDEX 16/03/2018 USD 867 - (5) RUSSELL 2000 INDEX 16/03/2018 USD 3,092 0.01 (2) RUSSELL 2000 INDEX 16/03/2018 USD 1,252 - (49) RUSSELL 2000 INDEX 16/03/2018 USD (17,966) (0.05) (35) S&P 500 EMINI INDEX 16/03/2018 USD (15,036) (0.04) 7 TOPIX INDEX (TOKYO) 08/03/2018 JPY 12,423 0.03 5 UKX FTSE 100 INDEX 16/03/2018 GBP 13,275 0.04
(79,116) (0.21)
TOTAL FINANCIAL FUTURES ON INDICES (79,116) (0.21)
D) DERIVATIVES INSTRUMENTS 2) FORWARD FOREIGN EXCHANGE CONTRACTS
Unrealised % net
Maturity Currency Bought Currency Sold Counterparty Appreciation/ (Depreciation) assets
02/01/2018 GBP 14,782 USD (20,000) RBC IS Bank Luxembourg (30) - 02/01/2018 USD 25,000 GBP (18,701) RBC IS Bank Luxembourg (185) - 02/01/2018 GBP 51,279 EUR (58,000) RBC IS Bank Luxembourg (271) - 31/01/2018 EUR 57,852 GBP (51,170) RBC IS Bank Luxembourg 290 - 31/01/2018 EUR 1,772,900 GBP (1,568,130) RBC IS Bank Luxembourg 8,900 0.02 31/01/2018 USD 197,990 GBP (150,391) RBC IS Bank Luxembourg (3,900) (0.01) 31/01/2018 USD 1,868,710 GBP (1,419,453) RBC IS Bank Luxembourg (36,813) (0.10) 31/01/2018 GBP 2,599,156 EUR (2,925,000) RBC IS Bank Luxembourg (2,687) (0.01) 31/01/2018 GBP 18,721,748 USD (24,600,000) RBC IS Bank Luxembourg 521,029 1.44 31/01/2018 EUR 3,545 GBP (3,146) RBC IS Bank Luxembourg 7 - 31/01/2018 USD 10,000 GBP (7,611) RBC IS Bank Luxembourg (212) - 31/01/2018 GBP 17,855 EUR (19,915) RBC IS Bank Luxembourg 140 - 31/01/2018 GBP 16,433 EUR (18,500) RBC IS Bank Luxembourg (23) -
486,245 1.34
TOTAL FORWARD EXCHANGE CURRENCY CONTRACTS 486,245 1.34
TOTAL DERIVATIVE INSTRUMENTS 342,147 0.96
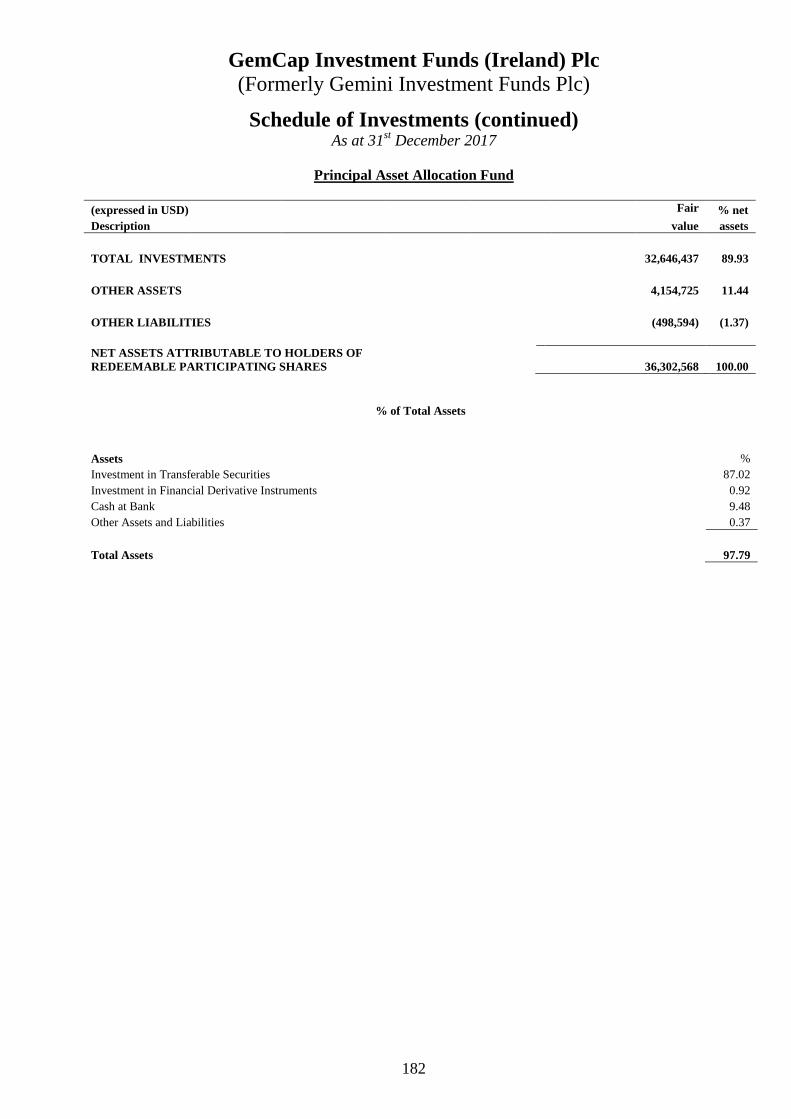
GemCap Investment Funds (Ireland) Plc (Formerly Gemini Investment Funds Plc)
182
Schedule of Investments (continued) As at 31st December 2017
Principal Asset Allocation Fund
(expressed in USD) Fair % net Description value assets
TOTAL INVESTMENTS 32,646,437 89.93 OTHER ASSETS 4,154,725 11.44
OTHER LIABILITIES (498,594) (1.37)
NET ASSETS ATTRIBUTABLE TO HOLDERS OF REDEEMABLE PARTICIPATING SHARES 36,302,568 100.00
% of Total Assets
Assets % Investment in Transferable Securities 87.02 Investment in Financial Derivative Instruments 0.92 Cash at Bank 9.48 Other Assets and Liabilities 0.37
Total Assets 97.79
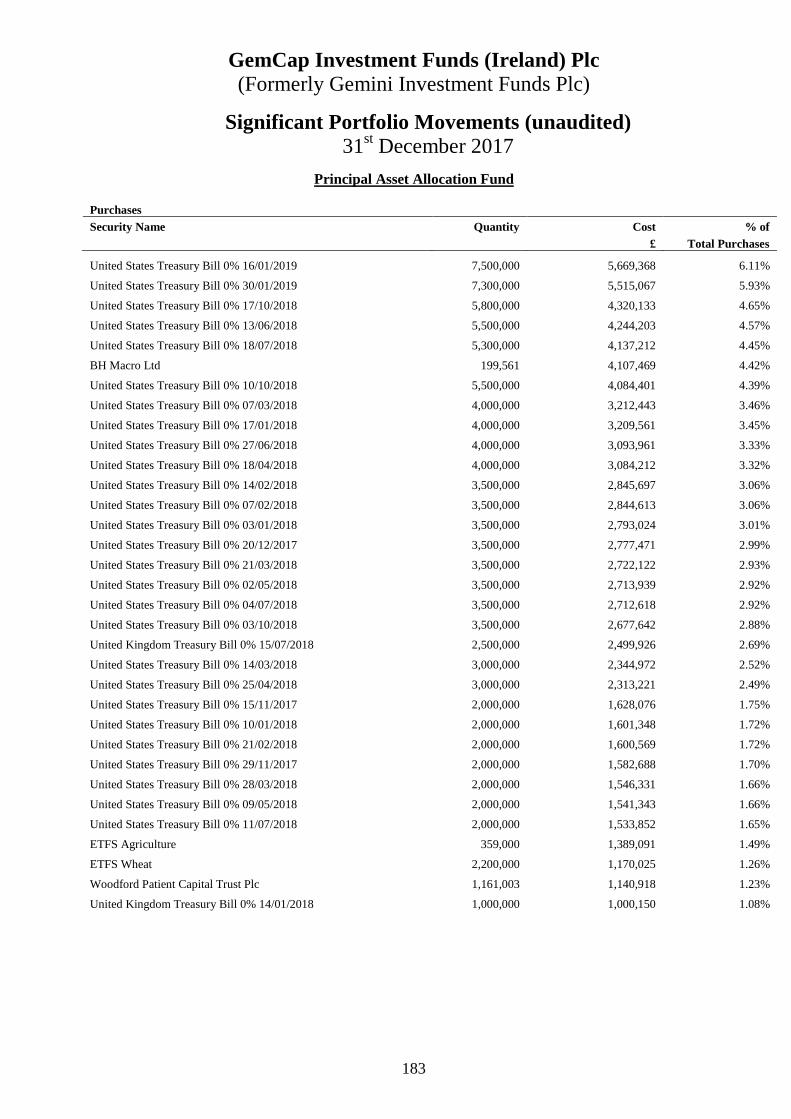
GemCap Investment Funds (Ireland) Plc (Formerly Gemini Investment Funds Plc)
183
Significant Portfolio Movements (unaudited) 31st December 2017
Principal Asset Allocation Fund
Purchases Security Name Quantity Cost % of £ Total Purchases
United States Treasury Bill 0% 16/01/2019 7,500,000 5,669,368 6.11%
United States Treasury Bill 0% 30/01/2019 7,300,000 5,515,067 5.93%
United States Treasury Bill 0% 17/10/2018 5,800,000 4,320,133 4.65%
United States Treasury Bill 0% 13/06/2018 5,500,000 4,244,203 4.57%
United States Treasury Bill 0% 18/07/2018 5,300,000 4,137,212 4.45%
BH Macro Ltd 199,561 4,107,469 4.42%
United States Treasury Bill 0% 10/10/2018 5,500,000 4,084,401 4.39%
United States Treasury Bill 0% 07/03/2018 4,000,000 3,212,443 3.46%
United States Treasury Bill 0% 17/01/2018 4,000,000 3,209,561 3.45%
United States Treasury Bill 0% 27/06/2018 4,000,000 3,093,961 3.33%
United States Treasury Bill 0% 18/04/2018 4,000,000 3,084,212 3.32%
United States Treasury Bill 0% 14/02/2018 3,500,000 2,845,697 3.06%
United States Treasury Bill 0% 07/02/2018 3,500,000 2,844,613 3.06%
United States Treasury Bill 0% 03/01/2018 3,500,000 2,793,024 3.01%
United States Treasury Bill 0% 20/12/2017 3,500,000 2,777,471 2.99%
United States Treasury Bill 0% 21/03/2018 3,500,000 2,722,122 2.93%
United States Treasury Bill 0% 02/05/2018 3,500,000 2,713,939 2.92%
United States Treasury Bill 0% 04/07/2018 3,500,000 2,712,618 2.92%
United States Treasury Bill 0% 03/10/2018 3,500,000 2,677,642 2.88%
United Kingdom Treasury Bill 0% 15/07/2018 2,500,000 2,499,926 2.69%
United States Treasury Bill 0% 14/03/2018 3,000,000 2,344,972 2.52%
United States Treasury Bill 0% 25/04/2018 3,000,000 2,313,221 2.49%
United States Treasury Bill 0% 15/11/2017 2,000,000 1,628,076 1.75%
United States Treasury Bill 0% 10/01/2018 2,000,000 1,601,348 1.72%
United States Treasury Bill 0% 21/02/2018 2,000,000 1,600,569 1.72%
United States Treasury Bill 0% 29/11/2017 2,000,000 1,582,688 1.70%
United States Treasury Bill 0% 28/03/2018 2,000,000 1,546,331 1.66%
United States Treasury Bill 0% 09/05/2018 2,000,000 1,541,343 1.66%
United States Treasury Bill 0% 11/07/2018 2,000,000 1,533,852 1.65%
ETFS Agriculture 359,000 1,389,091 1.49%
ETFS Wheat 2,200,000 1,170,025 1.26%
Woodford Patient Capital Trust Plc 1,161,003 1,140,918 1.23%
United Kingdom Treasury Bill 0% 14/01/2018 1,000,000 1,000,150 1.08%

GemCap Investment Funds (Ireland) Plc (Formerly Gemini Investment Funds Plc)
184
Significant Portfolio Movements (unaudited) 31st December 2017
Principal Asset Allocation Fund (Continued)
Sales
Security Name Quantity Proceed % of $ Total Sales
United States Treasury Bill 0% 17/10/2018 5,800,000 4,397,578 4.88%
United States Treasury Bill 0% 13/06/2018 5,500,000 4,296,036 4.77%
United States Treasury Bill 0% 10/10/2018 5,500,000 4,171,235 4.63%
United States Treasury Bill 0% 18/07/2018 5,300,000 3,945,067 4.38%
United Kingdom Treasury Bill 0% 14/01/2018 3,500,000 3,499,922 3.89%
United States Treasury Bill 0% 17/01/2018 4,000,000 3,207,313 3.56%
United States Treasury Bill 0% 07/03/2018 4,000,000 3,090,593 3.43%
United States Treasury Bill 0% 18/04/2018 4,000,000 3,077,397 3.42%
United States Treasury Bill 0% 27/06/2018 4,000,000 3,053,668 3.39%
United States Treasury Bill 0% 20/12/2017 3,500,000 2,853,765 3.17%
United States Treasury Bill 0% 03/01/2018 3,500,000 2,832,173 3.15%
United States Treasury Bill 0% 07/02/2018 3,500,000 2,731,174 3.03%
United States Treasury Bill 0% 21/03/2018 3,500,000 2,716,442 3.02%
United States Treasury Bill 0% 14/02/2018 3,500,000 2,711,497 3.01%
United States Treasury Bill 0% 02/05/2018 3,500,000 2,703,851 3.00%
United States Treasury Bill 0% 03/10/2018 3,500,000 2,655,056 2.95%
BH Macro Ltd 129,561 2,622,484 2.91%
United States Treasury Bill 0% 04/07/2018 3,500,000 2,611,551 2.90%
United Kingdom Treasury Bill 0% 15/07/2018 2,500,000 2,500,000 2.78%
United States Treasury Bill 0% 13/12/2017 3,000,000 2,391,105 2.66%
United States Treasury Bill 0% 14/03/2018 3,000,000 2,318,124 2.57%
United States Treasury Bill 0% 25/04/2018 3,000,000 2,313,922 2.57%
United States Treasury Bill 0% 29/11/2017 2,000,000 1,599,872 1.78%
United States Treasury Bill 0% 10/01/2018 2,000,000 1,597,125 1.77%
United States Treasury Bill 0% 15/11/2017 2,000,000 1,588,689 1.76%
United States Treasury Bill 0% 21/02/2018 2,000,000 1,547,030 1.72%
United States Treasury Bill 0% 28/03/2018 2,000,000 1,544,819 1.72%
United States Treasury Bill 0% 09/05/2018 2,000,000 1,541,604 1.71%
United Kingdom Treasury Bill 0% 03/12/2017 1,500,000 1,500,000 1.67%
United States Treasury Bill 0% 11/07/2018 2,000,000 1,473,242 1.64%
ETFS Wheat 2,200,000 1,238,714 1.38%
Woodford Patient Capital Trust Plc 1,161,003 1,140,918 1.27%
United Kingdom Treasury Bill 0% 10/12/2017 1,000,000 1,000,000 1.11%
United Kingdom Treasury Bill 0% 29/10/2017 1,000,000 1,000,000 1.11%
United Kingdom Treasury Bill 0% 26/11/2017 1,000,000 1,000,000 1.11%
United Kingdom Treasury Bill 0% 17/12/2017 1,000,000 1,000,000 1.11%
MontLake UCITS Platform Plc - Dunn WMA Institutional UCITS Fund 9,700 1,002,425 1.11%

GemCap Investment Funds (Ireland) Plc (Formerly Gemini Investment Funds Plc)
185
Investment Manager’s Report
Sabre Global Value and Income Fund*
Market Review
Recent market returns have been very strong. The incoming US Administration was fortunate to have inherited a strong economy, and the economic backdrop in Europe and Asia also looks more clearly positive than for some time. This backdrop has clearly been good for equities, and will likely remain so as long as momentum continues. From a UK perspective Trump’s first weeks in office have somewhat distracted attention from Brexit. UK economic data remains at least superficially strong, encouraging the rosy optimism of Brexiteers, and the precipitous fall in Sterling has undoubtedly boosted exporters very significantly. Our view is firmly that the EU divorce process will be extremely painful, economic consequences for the UK will be negative, and Prime Minister May’s dash in to the arms of Trump’s America will coincide with the rest of the world moving in the opposite direction. Equity markets have continued to rally strongly. Although this is partly justified on the back of improved economic newsflow. there is an undoubted element of froth too. We have found it very hard to keep pace with the rally, in particular in the US and in Dollar assets where valuation is of concern, and especially in Financials, where we have found very few stocks meeting our quality criteria. We continued to prefer European assets, were valuations are much more reasonable, and many investors seem to have given up hope. There is much talk of political risk in Europe over the coming months, which whilst it undoubtedly exists, seems to us relatively mild given the antics and policies of the new US administration. With expectations in Europe so low, and strong recent signs of a pick up in inflation and growth this appears to us to be a better bet, although short term momentum is against us. The strong dollar will have a negative effect on US exporters, and is just one of an array of economic realities which president Trump’s policies are likely to run up against. Performance Review Short term strategy performance relative to benchmarks has been disappointing as we were unwilling to invest more than one third of the book in the Financials sector, where we cannot find sufficient stocks meeting our quality criteria. A degree of re-rating in the sector is appropriate as the period of negative interest rates draws to a close, bolstering bank profitability. The other side of the coin, however, was a rise in longer term bond yields (steepening yield curve) which will have an impact in places. Despite the Trump administration’s suggestions of repealing some of the Banking regulation introduced post crash, we would not expect a return to pre 1998 level of Return on Equity for the banking sector. The era of what are essentially financial utilities behaving like 30x leveraged hedge funds is hopefully behind us, at least for a cycle or two. Fund Closure Unfortunately, the fund failed to attract sufficient assets to remain viable. Losing early investors due to corporate takeovers and reorganisations was not helpful. In the short term the strategy has performed relatively poorly relative to benchmarks (if not in absolute terms) making it even more difficult to attract assets. Given the high level of cost relative to the assets the fund manager feels the product does not offer value for money to investors, and therefore decided to close the fund. *Terminated on 27th April 2017.
Ross Hollyman Sabre Fund Management Limited Date: February 2018

GemCap Investment Funds (Ireland) Plc (Formerly Gemini Investment Funds Plc)
186
Statement of Financial Position as at 31st December 2017 and 2016
SGVIF* SGVIF 31 Dec 2017 31 Dec 2016 Note £ £
ASSETS Financial Assets at Fair Value through Profit or Loss:
Investments in Transferable Securities 3 - 5,007,449Cash at bank 5 17,368 95,901Dividends and interest receivable - 4,104Amount receivable on subscriptions - 42Other receivables - 17
TOTAL ASSETS 17,368 5,107,513 LIABILITIES Administration fees payable 7 - 3,435Transfer agency fees payable 7 - 1,104Depositary and depositary oversight fees payable 7 - 2,249Audit fees payable - 5,029Redemptions payable - 1,249Other fees payable 17,368 1,214TOTAL LIABILITIES (excluding net assets attributable to ho lders of redeemable participating shares) 17,368 14,280
NET ASSETS ATTRIBUTABLE TO HOLDERS OF REDEEMABLE PARTICIPATING SHARES - 5,093,233 *Terminated on 27th April 2017. The accompanying notes and schedules form an integral part of these financial statements.
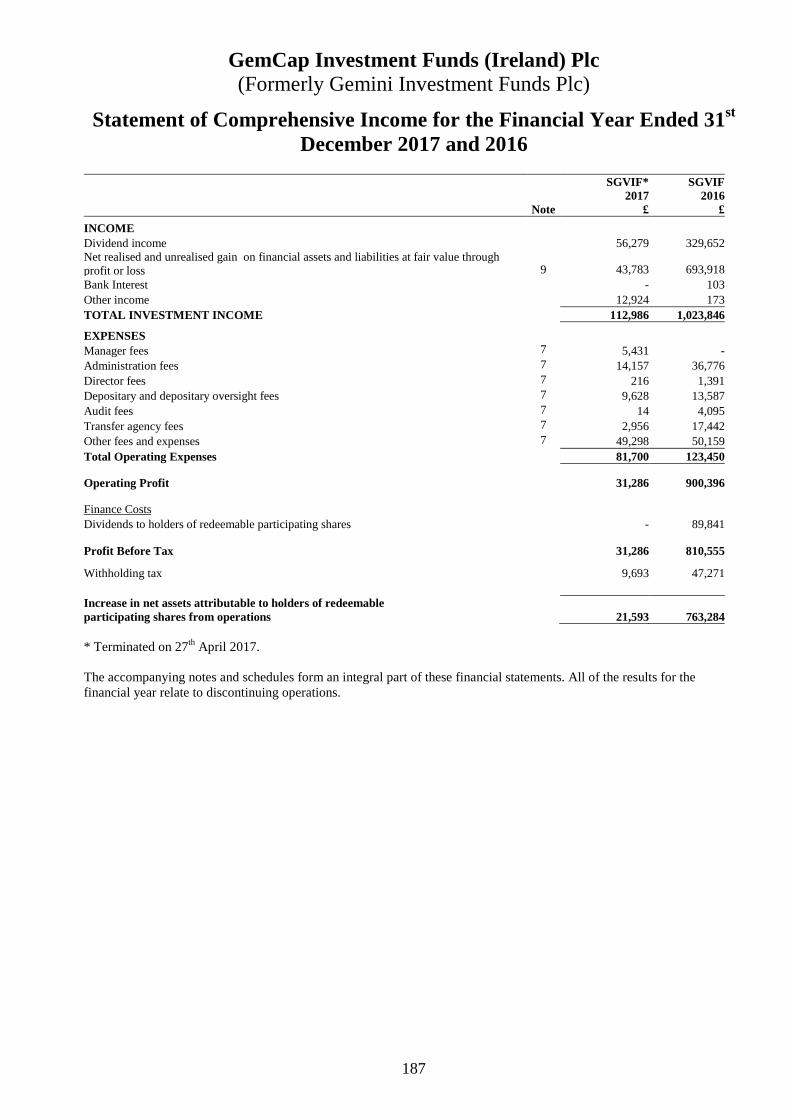
GemCap Investment Funds (Ireland) Plc (Formerly Gemini Investment Funds Plc)
187
Statement of Comprehensive Income for the Financial Year Ended 31st December 2017 and 2016
SGVIF* SGVIF
2017 2016 Note £ £ INCOME
Dividend income 56,279 329,652Net realised and unrealised gain on financial assets and liabilities at fair value through profit or loss 9 43,783 693,918Bank Interest - 103Other income 12,924 173TOTAL INVESTMENT INCOME 112,986 1,023,846 EXPENSES Manager fees 7 5,431 -Administration fees 7 14,157 36,776Director fees 7 216 1,391Depositary and depositary oversight fees 7 9,628 13,587Audit fees 7 14 4,095Transfer agency fees 7 2,956 17,442Other fees and expenses 7 49,298 50,159Total Operating Expenses 81,700 123,450 Operating Profit 31,286 900,396 Finance Costs Dividends to holders of redeemable participating shares - 89,841 Profit Before Tax 31,286 810,555 Withholding tax 9,693 47,271 Increase in net assets attributable to holders of redeemable participating shares from operations 21,593 763,284 * Terminated on 27th April 2017. The accompanying notes and schedules form an integral part of these financial statements. All of the results for the financial year relate to discontinuing operations.

GemCap Investment Funds (Ireland) Plc (Formerly Gemini Investment Funds Plc)
188
Statement of Changes in Net Assets attributable to Holders of Redeemable Participating Shares
* Terminated on 27th April 2017. The accompanying notes and schedules form an integral part of these financial statements.
SGVIF* SGVIF 2017 2016
£ £ Net Assets attributable to holders of Redeemable Participating Shares at the beginning of the financial year
5,093,233 6,127,664
Increase in Net Assets attributable to Holders of Redeemable Participating Shares from operations 21,593 763,284 Capital transactions Issue of redeemable shares during the financial year 310,346 1,508,355Redemption of redeemable shares during the financial year (5,425,172) (3,306,070)
Net Assets attributable to Holders of Redeemable Participating Shares at the end of the financial year
- 5,093,233
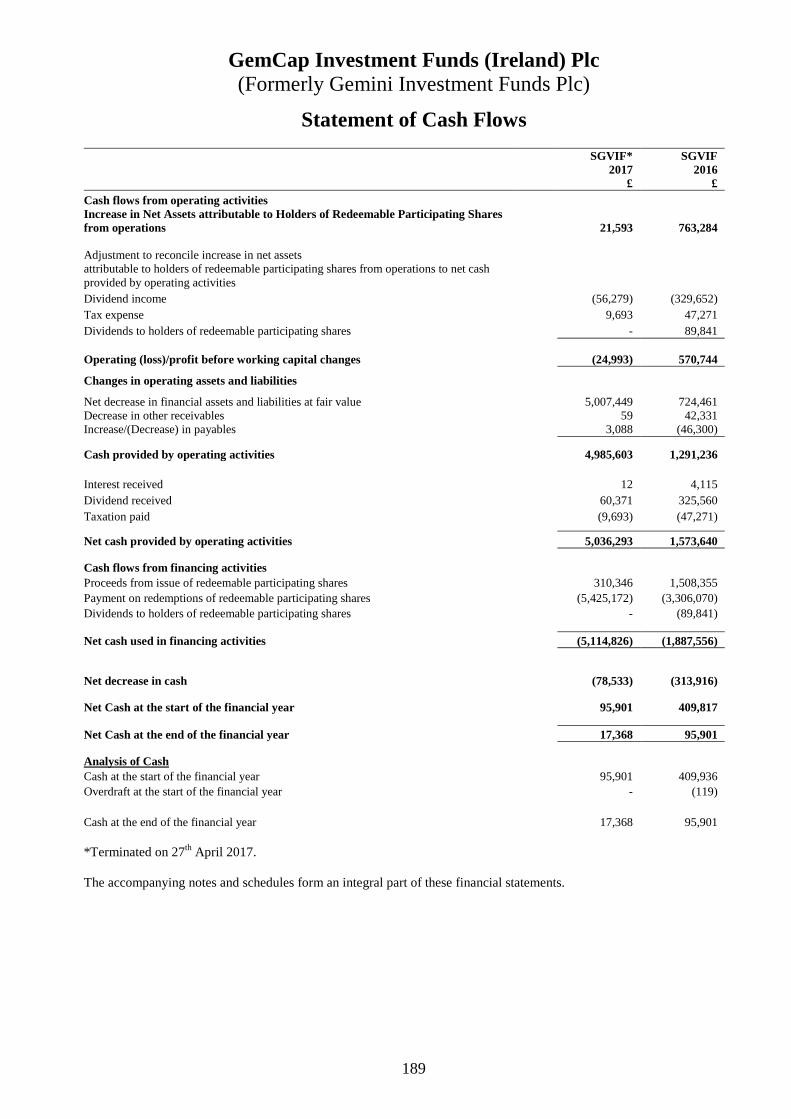
GemCap Investment Funds (Ireland) Plc (Formerly Gemini Investment Funds Plc)
189
Statement of Cash Flows
SGVIF* SGVIF 2017 2016 £ £ Cash flows from operating activities Increase in Net Assets attributable to Holders of Redeemable Participating Shares from operations 21,593 763,284 Adjustment to reconcile increase in net assets attributable to holders of redeemable participating shares from operations to net cash provided by operating activities Dividend income (56,279) (329,652) Tax expense 9,693 47,271 Dividends to holders of redeemable participating shares - 89,841 Operating (loss)/profit before working capital changes (24,993) 570,744 Changes in operating assets and liabilities Net decrease in financial assets and liabilities at fair value 5,007,449 724,461 Decrease in other receivables 59 42,331 Increase/(Decrease) in payables 3,088 (46,300) Cash provided by operating activities 4,985,603 1,291,236 Interest received 12 4,115 Dividend received 60,371 325,560 Taxation paid (9,693) (47,271) Net cash provided by operating activities 5,036,293 1,573,640 Cash flows from financing activities Proceeds from issue of redeemable participating shares 310,346 1,508,355 Payment on redemptions of redeemable participating shares (5,425,172) (3,306,070) Dividends to holders of redeemable participating shares - (89,841) Net cash used in financing activities (5,114,826) (1,887,556)
Net decrease in cash (78,533) (313,916) Net Cash at the start of the financial year 95,901 409,817 Net Cash at the end of the financial year 17,368 95,901 Analysis of Cash Cash at the start of the financial year 95,901 409,936 Overdraft at the start of the financial year - (119) Cash at the end of the financial year 17,368 95,901 *Terminated on 27th April 2017. The accompanying notes and schedules form an integral part of these financial statements.

GemCap Investment Funds (Ireland) Plc (Formerly Gemini Investment Funds Plc)
190
Significant Portfolio Movements (unaudited) 31st December 2017
Sabre Global Value and Income Fund*
Purchases Security Name Quantity Cost % of $ Total Purchases
Freenet AG 4,147 100,420 2.09%
Corbion NV 4,392 88,862 1.85%
Skanska AB 4,447 87,195 1.81%
UBM Plc 11,915 83,814 1.74%
Lear Corp 700 80,996 1.68%
General Motors Co 2,700 80,516 1.67%
Lennox International Inc 600 74,865 1.56%
China Petroleum & Chemical Corp 118,000 74,701 1.55%
Blackstone Group LP 2,800 68,561 1.42%
Ford Motor Co 6,500 67,038 1.39%
Electrolux AB 2,859 61,817 1.28%
MSG Networks Inc 3,100 58,467 1.22%
Toronto-Dominion Bank 1,300 54,331 1.13%
Fortum OYJ 4,219 53,915 1.12%
UnitedHealth Group Inc 400 53,308 1.11%
Bank of Nova Scotia 1,100 52,346 1.09%
Two Harbors Investment Corp 7,300 52,258 1.09%
Royal Bank of Canada 900 51,838 1.08%
Allianz SE 386 51,879 1.08%
Cincinnati Financial Corp 900 52,139 1.08%
Highwoods Properties Inc 1,300 52,039 1.08%
Singapore Technologies Engineering Ltd 27,000 51,695 1.07%
Hon Hai Precision Industry Co Ltd 22,000 51,598 1.07%
Sonoco Products Co 1,200 51,119 1.06%
Starwood Property Trust Inc 2,800 51,092 1.06%
3i Infrastructure Plc 25,978 50,430 1.05%
Japan Airlines Co Ltd 2,000 50,499 1.05%
Sysco Corp 1,200 50,680 1.05%
Safran SA 913 49,849 1.04%
Cardinal Health Inc 800 50,191 1.04%
Ageas 1,486 49,309 1.02%
DCT Industrial Trust Inc 1,300 48,163 1.00% * Terminated on 27th April 2017.
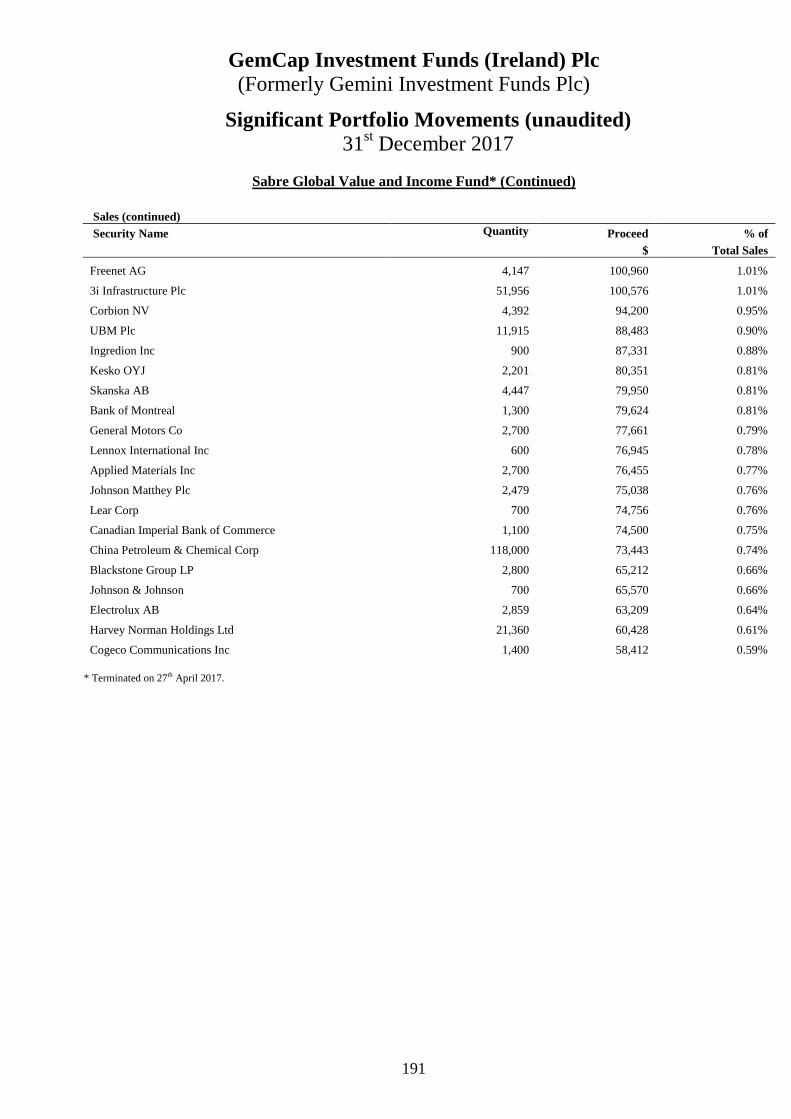
GemCap Investment Funds (Ireland) Plc (Formerly Gemini Investment Funds Plc)
191
Significant Portfolio Movements (unaudited) 31st December 2017
Sabre Global Value and Income Fund* (Continued)
Sales (continued)
Security Name Quantity Proceed % of $ Total Sales
Freenet AG 4,147 100,960 1.01%
3i Infrastructure Plc 51,956 100,576 1.01%
Corbion NV 4,392 94,200 0.95%
UBM Plc 11,915 88,483 0.90%
Ingredion Inc 900 87,331 0.88%
Kesko OYJ 2,201 80,351 0.81%
Skanska AB 4,447 79,950 0.81%
Bank of Montreal 1,300 79,624 0.81%
General Motors Co 2,700 77,661 0.79%
Lennox International Inc 600 76,945 0.78%
Applied Materials Inc 2,700 76,455 0.77%
Johnson Matthey Plc 2,479 75,038 0.76%
Lear Corp 700 74,756 0.76%
Canadian Imperial Bank of Commerce 1,100 74,500 0.75%
China Petroleum & Chemical Corp 118,000 73,443 0.74%
Blackstone Group LP 2,800 65,212 0.66%
Johnson & Johnson 700 65,570 0.66%
Electrolux AB 2,859 63,209 0.64%
Harvey Norman Holdings Ltd 21,360 60,428 0.61%
Cogeco Communications Inc 1,400 58,412 0.59% * Terminated on 27th April 2017.

GemCap Investment Funds (Ireland) Plc (Formerly Gemini Investment Funds Plc)
192
Investment Manager’s Report
Third Avenue Real Estate Value Fund
The Third Avenue Real Estate Value Fund, previously a sub-fund of Third Avenue Capital plc, merged into Third Avenue Real Estate Value Fund, a sub-fund of the Company effective 30th May 2017. Activity: In a year where resource conversion activity was abundant (resource conversion is a term that we use at Third Avenue to describe actions that control groups take to surface value and most commonly includes mergers, acquisitions, privatizations, spin-offs, share repurchases, tender offers, and special dividends), it was quite fitting that one of the most meaningful events occurred during the final weeks of the year. In early December, Westfield Corp. (a long-time holding of the Fund that controls market-dominant malls in key US & UK cities) announced that it had agreed to be acquired by Unibail-Rodamco (the largest European mall owner) in a cash-and-stock deal at a substantial premium to prevailing market prices. After the announcement, the Fund scaled back its position to realize some of the appreciation in the stock price, but Westfield common remains a top 10 holding in the Fund. Given the scarcity value of Westfield’s US and UK assets, and accelerating pace of consolidation in the class-A mall space, a competing bid cannot be ruled out. The Westfield announcement caps off a year which included: the Fund’s largest position being privatized at a substantial premium (Global Logistic Properties); one of the top five positions announcing that it was exploring strategic alternatives that could include a sale of the business (Forest City Realty Trust); two other businesses receiving take-over offers (Parkway, Inc. and Millennium & Copthorne plc); two other top five positions paying special dividends (Lennar Corp. and Land Securities plc); one top ten position undertaking an Initial Public Offering (Five Point Holdings); and two other holdings completing spin-off transactions (FNF Group and Vornado Realty Trust). These events further solidify our long-held view that arbitraging the difference between the public and private market values for property can be a profitable endeavor.
Outside of the Westfield activity, the Fund was also active this quarter in terms of re-stocking the portfolio with securities that Fund Management views as some of the likely contributors to performance in the years ahead. In fact, the Fund made additions to each one of its key allocations during the quarter including: (i) businesses involved with long-term wealth creation (i.e., long-term compounders), (ii) residential related investments, (iii) special situations holdings, and (iv) select option strategies. A long-term compounder added during the quarter was Capital and Counties plc (“Capco”), a UK based real estate operating company that owns assets in two prime London sub-markets (Covent Garden and Earl’s Court). For those not familiar, Covent Garden is a district in West London that has been transformed into a leading shopping and entertainment destination that attracts more than 40 million visitors annually. Over the past five years, Capco’s management team (which is led by CEO Ian Hawksworth) has actively repositioned its holdings in the area to capture higher rents by adding more appealing retail and dining options, as well as by opportunistically making “tuck-in” acquisitions of additional properties on the estate. As a result, the company now controls more than 1.1 million square feet of retail, office, and residential properties in the heart of London that seem well-placed with in-place leases that are nearly 40% below market-rents, thus providing additional upside as the rents are “marked-to-market” over time. Almost as valuable as Covent Garden is Capco’s stake in Earl’s Court, the largest redevelopment site in Central London. Alongside its partners, Capco has received approvals to build more than 8,000 residential units and 100,000 square feet of commercial space on this 77-acre site that is incredibly well positioned as it is bordered by the neighborhoods of Chelsea, South Kensington, and Fulham. The company is currently in the process of applying for a revised planning permission, which could see an increase in residential density and an additional affordable housing component. Should Capco finalize the revised plans, it’s not inconceivable that the company would sell stakes in the various development parcels, thus realizing the “higher-and-better-use” potential of its long-time land holdings. The proceeds from these sales could then be reinvested in Covent Garden as Capco further transitions to becoming a more focused London “specialist” such as its peer Shaftesbury plc, which has historically traded at a premium to NAV as opposed to the significant discount at which Capco common traded at the time of purchase.
GemCap Investment Funds (Ireland) Plc (Formerly Gemini Investment Funds Plc)
193
Investment Manager’s Report (Continued)
Third Avenue Real Estate Value Fund (Continued)
During the quarter, the Fund sold its position in the common stock of Kennedy Wilson Holdings (“Kennedy Wilson”), a US based real estate operating company that has a portfolio of “value-add” commercial properties, as well as a sizable fund management business with more than $15 billion of third party assets under management. The company recently completed an acquisition of its European affiliate, which changed the investment thesis. As a result, the Fund moved on for the time being. The proceeds from exiting the security were reallocated to the common stock of a real estate related business that Fund Management has followed for a number of years: Amerco. While Amerco is not a household name, its largest and most valuable subsidiary, U-Haul International, is certainly well-known as it is the leading provider of self-moving services and supplies in North America with more than 150,000 trucks, 100,000 trailers, and 40,000 towing devices. In addition, the company has aggressively expanded into the self-storage business by adding storage facilities at its key locations over the past five years. As a result, Amerco now has nearly 30 million square feet of self-storage properties and controls one of the most valuable self-storage platforms in North America, further entrenching itself as the “go-to” provider of self-moving services by being able to offer reputable storage facilities alongside its other offerings. In our view, those that follow Amerco rightly recognize the strategic merit of adding self-storage space to its offering but fail to appreciate the underlying value of the platform. The reason is simple: many of the U-Haul self-storage facilities were only recently developed or acquired and are still in the process of leasing-up and stabilizing. Consequently, the portfolio was only 73% occupied at the end of the last quarter versus industry norms in the 90-95% range. It is our expectation that as these properties stabilize over the next few years, the occupancy rate will increase, thus boosting cash flows to a level that would support more reasonable values for the portfolio ($165-185 per square foot) leaving the rest of the business priced at an incredibly modest valuation (i.e., less than 5 times EV/EBITDA). Such a value doesn’t seem representative of what is truly a market-dominant franchise that functions as a tax on goods and belongings being moved day-in and day-out. Should the public markets not respond as this situation develops, it would not surprise us to see the control group (the Schoen family, which owns nearly 60% of the company and has run day-to-day operations since its founding in 1945) take steps to surface value. Such actions could include simply improving disclosure around the real estate component of the business, selling off additional land parcels (e.g., New York City or San Francisco sites), or taking more drastic measures such as entering into some sort of resource conversion activity around the real estate portfolio or entire business. One company that has been engaged in resource conversion for years is Wheelock & Company (“Wheelock”), a Hong Kong based real estate operating company that has been a long-term holding in the Fund and highly profitable investment to date. Driving most of this appreciation has been Wheelock’s most valuable asset: its 62% stake in separately-listed Wharf Holdings (“Wharf”), a Hong Kong real estate company, which owns, manages, and develops a diversified portfolio of properties in Hong Kong and China.
GemCap Investment Funds (Ireland) Plc (Formerly Gemini Investment Funds Plc)
194
Investment Manager’s Report (Continued)
Third Avenue Real Estate Value Fund (Continued)
During the quarter, Wharf completed a major corporate restructuring that involved spinning-off its investment property business to shareholders by forming another publicly-listed entity called Wharf Real Estate Investment Company (“Wharf REIC”) and refocusing the remaining business around its development projects. Following the spin-off of Wharf REIC, the Fund purchased the Common Stock of Wharf Holdings, taking advantage of the forced-selling that often occurs with spin-off transactions (e.g., index rebalancing). Similar to Wheelock, we believe Wharf is extremely well capitalized, trading at a huge discount to NAV, with strong prospects to increase NAV by 10% or more per year once factoring in dividends. There is also a special situation element to the Wharf investment, as it is Fund Management’s view that the recent separation could have been the first step in a two-step process that will streamline the overall corporate ownership structure and ultimately lead to a privatization of Wharf Holdings by Wheelock given the substantial overlap in business activities and operations. Fund management has a historical perspective in this regard, as Wheelock & Company successfully privatized another long-time Fund holding, Wheelock Properties (Hong Kong) in 2010 at a substantial premium to market prices. Another investment that ended up in the Fund after a spin-off transaction earlier this year is JBG Smith Properties (“JBG Smith”). This US REIT was spun-out of long-time holding Vornado Realty Trust as a well-capitalized and more-focused owner of office and multifamily properties in the Washington DC area (including Crystal City and Pentagon City). The company also controls land that can accommodate more than 18 million square feet of future development. With a substantial opportunity to boost cash flows within its existing portfolio (87% occupancy in the office portfolio) as well as to profitably convert its well-located land bank to a higher-and-better-use, there are frankly few REITs that seem to have such a substantial opportunity in front of them in terms of boosting NAV over the next 3-5 years. With that being the case, Fund Management has been eager to add to its position in JBG Smith common at lower prices.
There is one scenario where our current underwriting metrics for JBG Smith may prove far too conservative. If Amazon were to select the Washington, D.C. metro area for its widely publicized “HQ2” search, JBG Smith will likely be worth a lot more than our current estimates. We haven’t been directly involved with the search process but believe that it is logical for Amazon to diversify away from it existing West Coast presence, and there are only a handful of markets in other regions that can accommodate its key requests (a metropolitan area of more than 1 million people, a site that is connected to mass transit and would have 500,000 square feet of space available by 2019 with the ability to add 8 million square feet over 10 years, an international airport within 45 minutes, and access to a highly educated labor pool with its intentions of hiring 50,000 employees over time). With these requirements in mind, Washington, D.C. seems to rank near the top of the list. Should it ultimately be selected for its second headquarters, JBG Smith is likely to be a big winner as its Crystal City and Pentagon City locations are natural candidates for Amazon to utilize as it initially relocates employees to the region. Further, JBG could be a terrific partner for Amazon to work with as it looks to build out additional space and accommodate the company’s demand for modern and well-located property.
GemCap Investment Funds (Ireland) Plc (Formerly Gemini Investment Funds Plc)
195
Investment Manager’s Report (Continued)
Third Avenue Real Estate Value Fund (Continued)
Strategy Update: The Third Avenue Real Estate Value Fund was launched in in the United States in 1998 with a unique strategy. Unlike other offerings, Third Avenue wanted to expand on its success in previous real estate and real estate related investments by dedicating a Mutual Fund to the sector that would:
1. Maintain a Deep Value Focus by concentrating its capital on well-financed real estate and real estate related businesses with securities trading at prices that were substantially below their takeover or liquidation values (i.e., private market values or NAV), as well as other bargain priced securities across the capital structure.
2. Emphasize Total Return with a bias towards capital appreciation over current income with the view that this was a more effective way to compound capital over time. As a result, the Fund intended to focus more on real estate operating companies (that could retain their cash flow and reinvest in the business) as opposed to REITs (which are required to distribute their earnings and largely depend upon raising new capital to expand their business).
3. Utilize a Flexible Mandate that allows the Fund to invest in a wider set of real estate companies than peers who
tend to only focus on companies included in relevant benchmarks. With the ability to invest in real estate operating companies, REITs, and real estate-related businesses, the Fund’s investable universe is some two to three times larger than most real estate Funds.
4. Be Actively Managed by concentrating the Fund’s capital around a select set of securities (30-40 positions)
irrespective of property type or region, as well as by holding cash when opportunities meeting Third Avenue’s strict value criteria were not available, and occasionally implementing options strategies to hedge certain exposures and enhance the risk-adjusted return profile of the Fund.
While the strategy hasn’t deviated since inception, the process used to implement the approach has improved immensely over the years. In the early days (1998 to 2000), the Fund’s original architect, Michael Winer, and the Firm’s founder, Martin Whitman, acted as co-portfolio managers. Michael Winer was the only investment professional dedicated exclusively to the strategy until 2004. Jason Wolf was then hired as Senior Analyst to spearhead the Fund’s international efforts. Approximately 50% of the Fund’s capital has been invested outside the U.S. for the better part of a decade now, playing an outsized role in the Fund’s returns. In 2006, Ryan Dobratz was hired as an Analyst, working with the rest of the team (which is now comprised of five dedicated members) to develop and implement a more robust process of screening the investable universe, underwriting new opportunities, tracking existing holdings, and recycling capital within the portfolio. The additions of Jason Wolf and Ryan Dobratz transitioned the Fund to a team-based approach that would prove more durable over the long-term (which has always been our focus) and helped develop a well-defined (and repeatable) process in order to further enhance results. The transition to a team-based approach was deliberately staged over the course of many years establishing Jason and Ryan as the ones to “carry the torch” as the Fund enters its 20th year of operations. While the current team has worked together for more than a decade now, close followers of the Fund know that Michael began delegating portfolio management responsibilities when Jason was added as co-Portfolio Manager in 2010 and handed over further roles when Ryan was added as a Portfolio Manager in 2013. Jason and Ryan have been handling most day-to-day operations of the Fund since the beginning of 2015. Michael’s role has diminished while he focused attention on corporate activities involving certain positions in the Fund.
GemCap Investment Funds (Ireland) Plc (Formerly Gemini Investment Funds Plc)
196
Investment Manager’s Report (Continued)
Third Avenue Real Estate Value Fund (Continued)
With the handoff largely being complete for the better part of two years now, Michael will formally retire from his Portfolio Management role of the Fund at the end of February. As part of the plan that we have had in place for more than ten years, Michael plans to remain a significant investor in the Fund (each portfolio manager has more than $1 million invested in the strategy) and he expects to retain his seats on the Board of Directors at Five Point Holdings and Tejon Ranch (both long-term holdings of the Fund). Portfolio management changes like this are oftentimes a reason for investors to give pause. For those that do, we believe that they will recognize that (i) the Fund has been in transition for more than a decade based on a well-defined succession plan and (ii) that the Third Avenue Real Estate Value Fund is a more compelling offering today than it was in its early years. In fact, the transition to a team-based approach, combined with the adoption of a more robust and repeatable process, has proven to enhance returns. With nearly twenty years of performance, we think that the case for Third Avenue’s unique approach to investing in real estate securities has been made. To wit, the Third Avenue Real Estate Value Fund is one of the top performing global real estate funds (i.e., top decile) over the past 1, 3, 5, 10, and 15 year periods as well as since the 1998 inception. Despite the long-term results, the differentiated performance seems to be becoming more apparent in conjunction with the process improvements that have been made in recent years. As a matter of fact, the Third Avenue Real Estate strategy has been awarded more Lipper Awards in the past five years (2014, 2015, 2016, and 2017) than the first fifteen (the Lipper Fund is awarded to Funds that have “excelled in providing consistently strong risk-adjusted performance relative to its peers” per Lipper’s parent company Thomson Reuters). For those that truly focus on results, we believe this is strong evidence that the strategy is adding even more value today than it did in its early years. With that being the case, one should not expect any material changes to the strategy or process as we enter 2018, especially when considering that Jason and Ryan have worked together for more than a decade and a number of the enhancements that they set out to implement have already been reflected in the portfolio for a number of years. These include: (i) more prudent concentration, (ii) a focus on individual securities as well as thematic opportunities, (iii) a further emphasis on real estate related businesses with strong franchises, (iv) a willingness to have the portfolio “fully invested” when opportunities are abundant (i.e., cash at less than 10%), and (v) positioning the portfolio to “protect” capital in a rising rate environment and potentially even benefit from it. There are two areas, however, where we have made further enhancements that should have an impact in 2018. One, we have continued to strengthen the “bench” of the Third Avenue Real Estate team. In that regard, we are pleased to report that Steve Bakke, CFA joined the Real Estate group in September as a Senior Analyst. Steve was previously at Surveyor Capital (a subsidiary of Citadel) and has more than a decade of experience in real estate securities, both in the US and internationally. Steve is the most experienced hire since Jason joined the team in 2004, and we are excited to have him on board as it’s a rare opportunity to find individuals who share our passion for both real estate and value investing.
GemCap Investment Funds (Ireland) Plc (Formerly Gemini Investment Funds Plc)
197
Investment Manager’s Report (Continued)
Third Avenue Real Estate Value Fund (Continued)
As we said at the onset, not all years may be as rewarding as 2017. However, by adhering to Third Avenue’s time-tested strategy of investing in undervalued real estate securities--while having an aligned portfolio management team overseeing our proven process--we believe that the odds of achieving returns similar to the Fund’s long-term results (if not better) are stacked in our favor. We thank you for your continued support and look forward to writing to you again next quarter.
Sincerely,
The Third Avenue Real Estate Team
Michael Winer
Jason Wolf
Ryan Dobratz
Third Avenue Management LLC Date: February 2018

GemCap Investment Funds (Ireland) Plc (Formerly Gemini Investment Funds Plc)
198
Statement of Financial Position as at 31st December 2017
TAREVF 31 Dec 2017* Note $
ASSETS Financial Assets at Fair Value through Profit or Loss:
Investments in Transferable Securities 3 128,782,239Investments in Financial Derivative Instruments 3 607,378
Cash at bank 5 20,680,024Dividends and interest receivable 126,598Amount receivable on sale of securities 261,326Receivable from Investment Manager 7 42,603Other receivables 10,117
TOTAL ASSETS 150,510,285 LIABILITIES Amount payable on purchase of securities 7 807,727Investment management fees payable 7 266,459Manager fee payable 7 10,951Administration fees payable 7 4,972Transfer agency fees payable 7 2,220Directors fees payable 7 1,464Depositary and depositary oversight fees payable 7 6,461Audit fees payable 7,655Stamp duty tax payable 2 45,829Other fees payable 81,723TOTAL LIABILITIES (excluding net assets attributable to ho lders of redeemable participating shares) 1,235,461 NET ASSETS ATTRIBUTABLE TO HOLDERS OF REDEEMABLE PARTICIPATING SHARES 149,274,824
* Launched on 30th May 2017. The accompanying notes and schedules form an integral part of these financial statements.
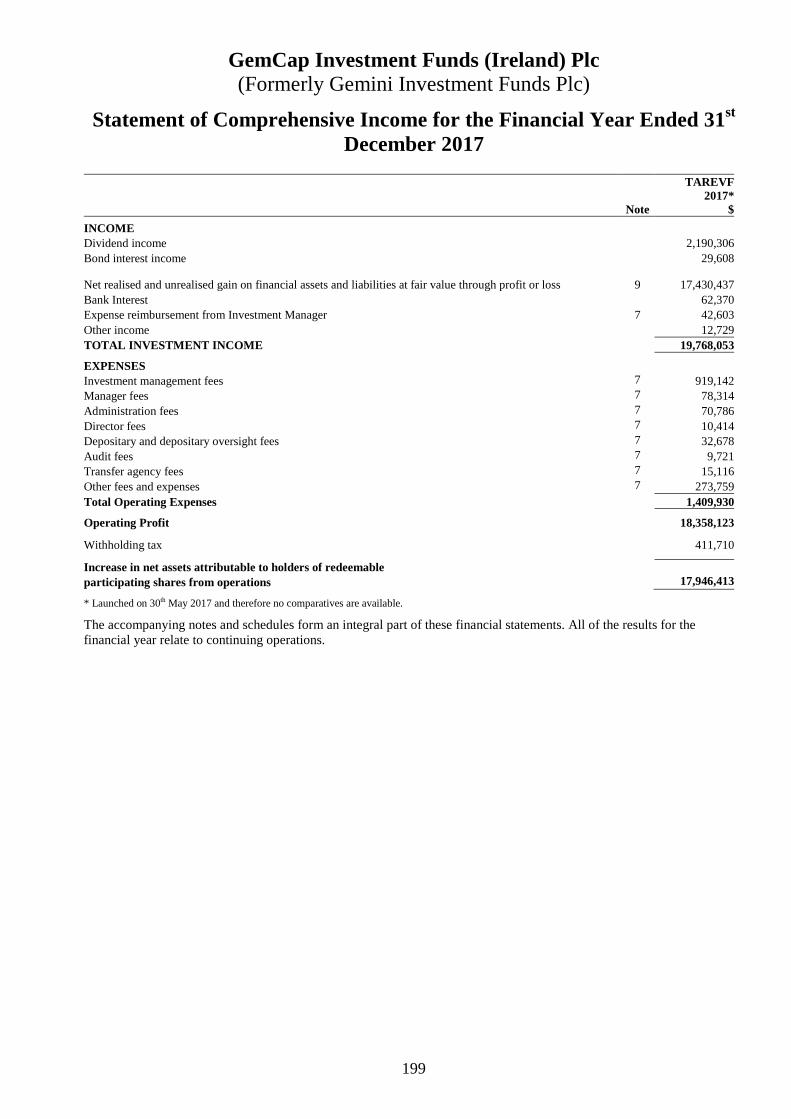
GemCap Investment Funds (Ireland) Plc (Formerly Gemini Investment Funds Plc)
199
Statement of Comprehensive Income for the Financial Year Ended 31st December 2017
TAREVF
2017* Note $ INCOME
Dividend income 2,190,306Bond interest income 29,608
Net realised and unrealised gain on financial assets and liabilities at fair value through profit or loss 9 17,430,437Bank Interest 62,370Expense reimbursement from Investment Manager 7 42,603Other income 12,729TOTAL INVESTMENT INCOME 19,768,053 EXPENSES Investment management fees 7 919,142Manager fees 7 78,314Administration fees 7 70,786Director fees 7 10,414Depositary and depositary oversight fees 7 32,678Audit fees 7 9,721Transfer agency fees 7 15,116Other fees and expenses 7 273,759Total Operating Expenses 1,409,930 Operating Profit 18,358,123 Withholding tax 411,710 Increase in net assets attributable to holders of redeemable participating shares from operations 17,946,413
2,364,507
* Launched on 30th May 2017 and therefore no comparatives are available.
The accompanying notes and schedules form an integral part of these financial statements. All of the results for the financial year relate to continuing operations.
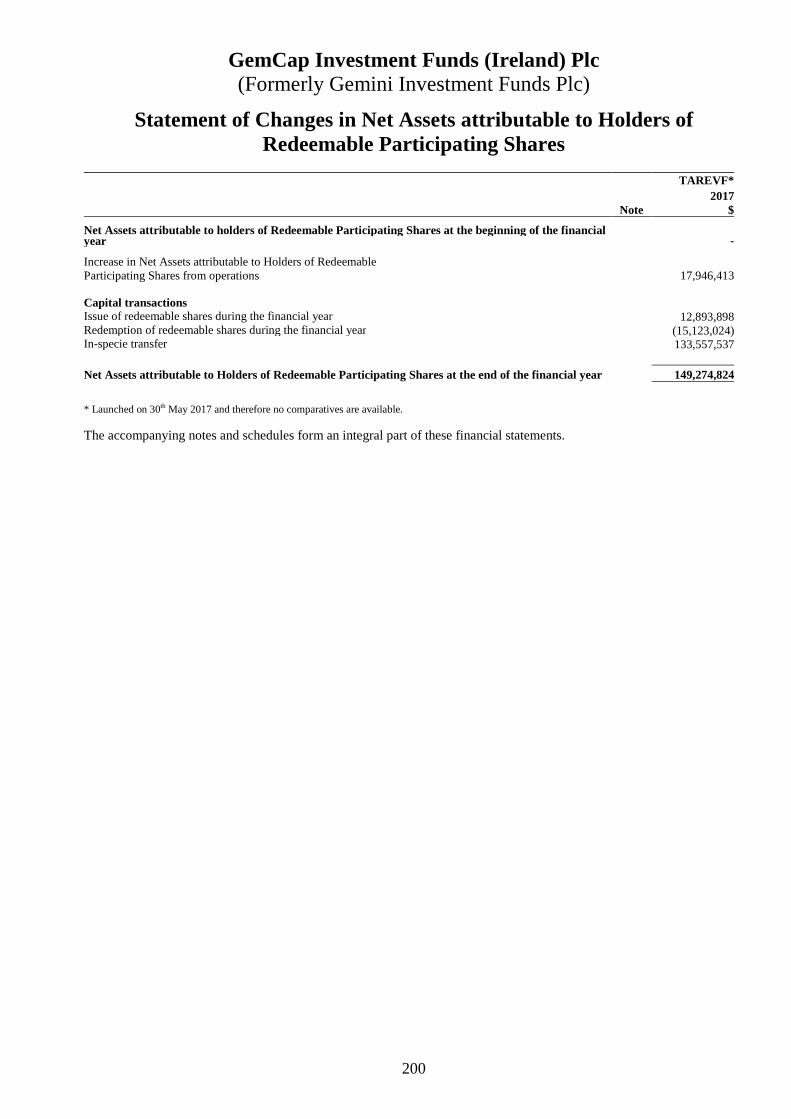
GemCap Investment Funds (Ireland) Plc (Formerly Gemini Investment Funds Plc)
200
Statement of Changes in Net Assets attributable to Holders of Redeemable Participating Shares
* Launched on 30th May 2017 and therefore no comparatives are available. The accompanying notes and schedules form an integral part of these financial statements.
TAREVF* 2017 Note $ Net Assets attributable to holders of Redeemable Participating Shares at the beginning of the financial year
-
Increase in Net Assets attributable to Holders of Redeemable Participating Shares from operations 17,946,413 Capital transactions Issue of redeemable shares during the financial year 12,893,898Redemption of redeemable shares during the financial year (15,123,024)In-specie transfer 133,557,537
Net Assets attributable to Holders of Redeemable Participating Shares at the end of the financial year 149,274,824
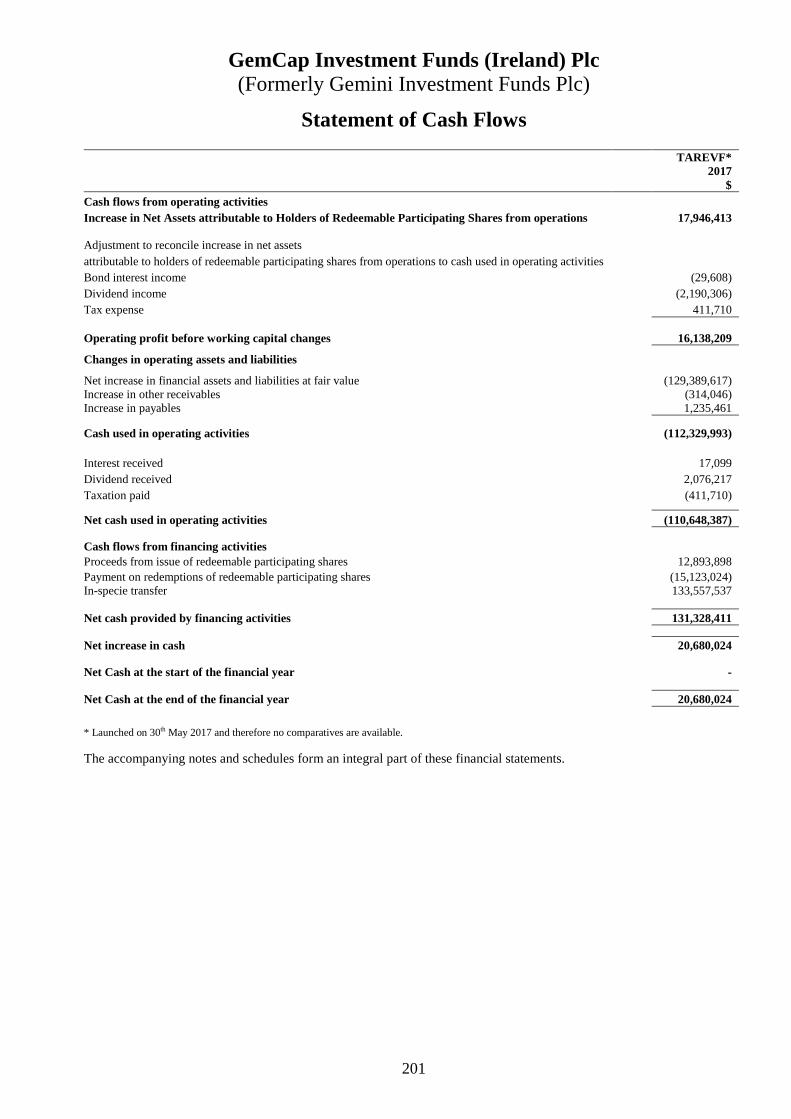
GemCap Investment Funds (Ireland) Plc (Formerly Gemini Investment Funds Plc)
201
Statement of Cash Flows
TAREVF* 2017 $ Cash flows from operating activities Increase in Net Assets attributable to Holders of Redeemable Participating Shares from operations 17,946,413 Adjustment to reconcile increase in net assets attributable to holders of redeemable participating shares from operations to cash used in operating activities Bond interest income (29,608) Dividend income (2,190,306) Tax expense 411,710 Operating profit before working capital changes 16,138,209 Changes in operating assets and liabilities Net increase in financial assets and liabilities at fair value (129,389,617) Increase in other receivables (314,046) Increase in payables 1,235,461 Cash used in operating activities (112,329,993) Interest received 17,099 Dividend received 2,076,217 Taxation paid (411,710) Net cash used in operating activities (110,648,387) Cash flows from financing activities Proceeds from issue of redeemable participating shares 12,893,898 Payment on redemptions of redeemable participating shares (15,123,024) In-specie transfer 133,557,537 Net cash provided by financing activities 131,328,411 Net increase in cash 20,680,024 Net Cash at the start of the financial year - Net Cash at the end of the financial year 20,680,024
* Launched on 30th May 2017 and therefore no comparatives are available. The accompanying notes and schedules form an integral part of these financial statements.
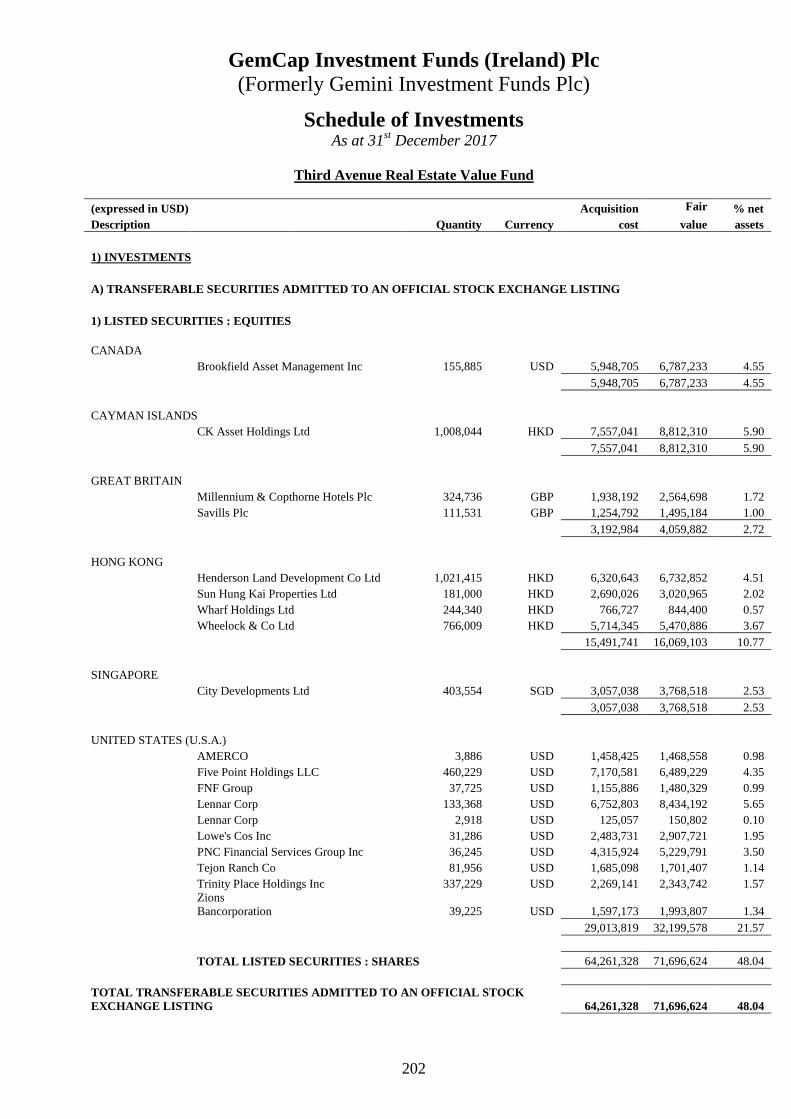
GemCap Investment Funds (Ireland) Plc (Formerly Gemini Investment Funds Plc)
202
Schedule of Investments As at 31st December 2017
Third Avenue Real Estate Value Fund
(expressed in USD) Acquisition Fair % net Description Quantity Currency cost value assets
1) INVESTMENTS
A) TRANSFERABLE SECURITIES ADMITTED TO AN OFFICIAL STOCK EXCHANGE LISTING
1) LISTED SECURITIES : EQUITIES
CANADA Brookfield Asset Management Inc 155,885 USD 5,948,705 6,787,233 4.55
5,948,705 6,787,233 4.55
CAYMAN ISLANDS CK Asset Holdings Ltd 1,008,044 HKD 7,557,041 8,812,310 5.90
7,557,041 8,812,310 5.90
GREAT BRITAIN Millennium & Copthorne Hotels Plc 324,736 GBP 1,938,192 2,564,698 1.72 Savills Plc 111,531 GBP 1,254,792 1,495,184 1.00
3,192,984 4,059,882 2.72
HONG KONG Henderson Land Development Co Ltd 1,021,415 HKD 6,320,643 6,732,852 4.51 Sun Hung Kai Properties Ltd 181,000 HKD 2,690,026 3,020,965 2.02 Wharf Holdings Ltd 244,340 HKD 766,727 844,400 0.57 Wheelock & Co Ltd 766,009 HKD 5,714,345 5,470,886 3.67
15,491,741 16,069,103 10.77
SINGAPORE City Developments Ltd 403,554 SGD 3,057,038 3,768,518 2.53
3,057,038 3,768,518 2.53
UNITED STATES (U.S.A.) AMERCO 3,886 USD 1,458,425 1,468,558 0.98 Five Point Holdings LLC 460,229 USD 7,170,581 6,489,229 4.35
FNF Group 37,725 USD 1,155,886 1,480,329 0.99 Lennar Corp 133,368 USD 6,752,803 8,434,192 5.65 Lennar Corp 2,918 USD 125,057 150,802 0.10 Lowe's Cos Inc 31,286 USD 2,483,731 2,907,721 1.95 PNC Financial Services Group Inc 36,245 USD 4,315,924 5,229,791 3.50 Tejon Ranch Co 81,956 USD 1,685,098 1,701,407 1.14 Trinity Place Holdings Inc 337,229 USD 2,269,141 2,343,742 1.57
Zions Bancorporation 39,225 USD 1,597,173 1,993,807 1.34
29,013,819 32,199,578 21.57
TOTAL LISTED SECURITIES : SHARES 64,261,328 71,696,624 48.04
TOTAL TRANSFERABLE SECURITIES ADMITTED TO AN OFFICIAL STOCK EXCHANGE LISTING 64,261,328 71,696,624 48.04

GemCap Investment Funds (Ireland) Plc (Formerly Gemini Investment Funds Plc)
203
Schedule of Investments (continued) As at 31st December 2017
Third Avenue Real Estate Value Fund
(expressed in USD) Acquisition Fair % net Description Quantity Currency cost value assets
B) OTHER TRANSFERABLE SECURITIES
1) OTHER TRANSFERABLE SECURITIES : TERM LOAN
UNITED STATES (U.S.A.) Neiman Marcus Group Ltd LLC 4.83849% 25/10/2020 1,000,000 USD 789,688 818,750 0.55
789,688 818,750 0.55
TOTAL OTHER TRANSFERABLE SECURITIES : TERM LOAN 789,688 818,750 0.55
2) OTHER TRANSFERABLE SECURITIES : REAL ESTATE INVESTMENT TRUSTS
AUSTRALIA Westfield Corp 818,748 AUD 5,166,463 6,062,091 4.06
5,166,463 6,062,091 4.06
GREAT BRITAIN Capital & Counties Properties Plc 156,328 GBP 546,532 674,727 0.45 Hammerson Plc 366,250 GBP 2,743,525 2,704,674 1.81 Land Securities Group Plc 493,701 GBP 6,832,348 6,718,532 4.50
Segro Plc 617,107 GBP 3,943,480 4,890,446 3.28 14,065,885 14,988,379 10.04
UNITED STATES (U.S.A.) First Industrial Realty Trust Inc 117,921 USD 3,383,849 3,710,974 2.49 Forest City Realty Trust Inc 307,498 USD 7,069,941 7,410,702 4.96
JBG SMITH Properties 21,610 USD 771,035 750,514 0.50 Kimco Realty Corp 74,600 USD 1,417,686 1,353,990 0.91 Macerich Co 59,167 USD 3,355,656 3,886,089 2.60 Rayonier Inc 211,584 USD 5,960,100 6,692,402 4.48 Vornado Realty Trust 48,333 USD 3,597,871 3,778,674 2.53 Weyerhaeuser Co 216,479 USD 7,180,055 7,633,050 5.11
32,736,193 35,216,395 23.58
TOTAL OTHER TRANSFERABLE SECURITIES : REAL ESTATE INVESTMENT TRUSTS 51,968,541 56,266,865 37.68
TOTAL OTHER TRANSFERABLE SECURITIES 52,758,229 57,085,615 38.23

GemCap Investment Funds (Ireland) Plc (Formerly Gemini Investment Funds Plc)
204
Schedule of Investments (continued) As at 31st December 2017
Third Avenue Real Estate Value Fund
C) DERIVATIVE INSTRUMENTS
1) FORWARD FOREIGN EXCHANGE CONTRACTS
Unrealised % net Maturity Currency Bought Currency Sold Counterparty Appreciation assets 25/01/2018 EUR 59,722,000 USD (71,167,184) RBC IS Bank Luxembourg 607,074 0.41
607,074 0.41
TOTAL FORWARD EXCHANGE CURRENCY CONTRACTS 607,074 0.41
2) LISTED SECURITIES : OPTIONS
(expressed in USD) Acquisition Fair % net Description Quantity Currency cost value assets UNITED STATES (U.S.A.)
Call USD/HKD Spot Cross 15/08/2018 8.18 24,600,000 USD 15,700 304 -
15,700 304 -
TOTAL LISTED SECURITIES : OPTIONS 304 -
TOTAL DERIVATIVE INSTRUMENTS 607,378 0.41
TOTAL INVESTMENTS 129,389,617 86.68
OTHER ASSETS 21,120,668 14.15
OTHER LIABILITIES (1,235,461) (0.83)
NET ASSETS ATTRIBUTABLE TO HOLDERS OF REDEEMABLE PARTICIPATING SHAR ES 149,274,824 100.00
% of Total Assets
Assets % Investment in Transferable Securities 85.56 Investment in Financial Derivative Instruments 0.40 Cash at Bank 13.74 Other Assets and Liabilities (0.53)
Total Assets 99.17
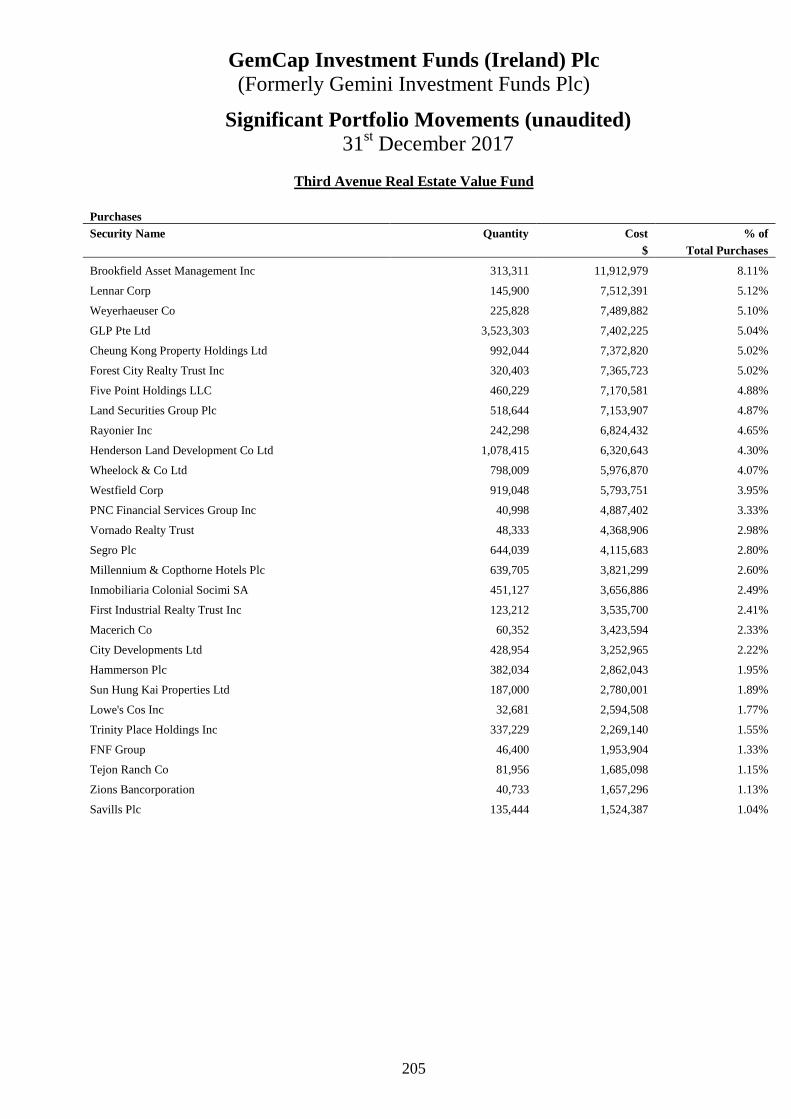
GemCap Investment Funds (Ireland) Plc (Formerly Gemini Investment Funds Plc)
205
Significant Portfolio Movements (unaudited) 31st December 2017
Third Avenue Real Estate Value Fund
Purchases Security Name Quantity Cost % of $ Total Purchases
Brookfield Asset Management Inc 313,311 11,912,979 8.11%
Lennar Corp 145,900 7,512,391 5.12%
Weyerhaeuser Co 225,828 7,489,882 5.10%
GLP Pte Ltd 3,523,303 7,402,225 5.04%
Cheung Kong Property Holdings Ltd 992,044 7,372,820 5.02%
Forest City Realty Trust Inc 320,403 7,365,723 5.02%
Five Point Holdings LLC 460,229 7,170,581 4.88%
Land Securities Group Plc 518,644 7,153,907 4.87%
Rayonier Inc 242,298 6,824,432 4.65%
Henderson Land Development Co Ltd 1,078,415 6,320,643 4.30%
Wheelock & Co Ltd 798,009 5,976,870 4.07%
Westfield Corp 919,048 5,793,751 3.95%
PNC Financial Services Group Inc 40,998 4,887,402 3.33%
Vornado Realty Trust 48,333 4,368,906 2.98%
Segro Plc 644,039 4,115,683 2.80%
Millennium & Copthorne Hotels Plc 639,705 3,821,299 2.60%
Inmobiliaria Colonial Socimi SA 451,127 3,656,886 2.49%
First Industrial Realty Trust Inc 123,212 3,535,700 2.41%
Macerich Co 60,352 3,423,594 2.33%
City Developments Ltd 428,954 3,252,965 2.22%
Hammerson Plc 382,034 2,862,043 1.95%
Sun Hung Kai Properties Ltd 187,000 2,780,001 1.89%
Lowe's Cos Inc 32,681 2,594,508 1.77%
Trinity Place Holdings Inc 337,229 2,269,140 1.55%
FNF Group 46,400 1,953,904 1.33%
Tejon Ranch Co 81,956 1,685,098 1.15%
Zions Bancorporation 40,733 1,657,296 1.13%
Savills Plc 135,444 1,524,387 1.04%
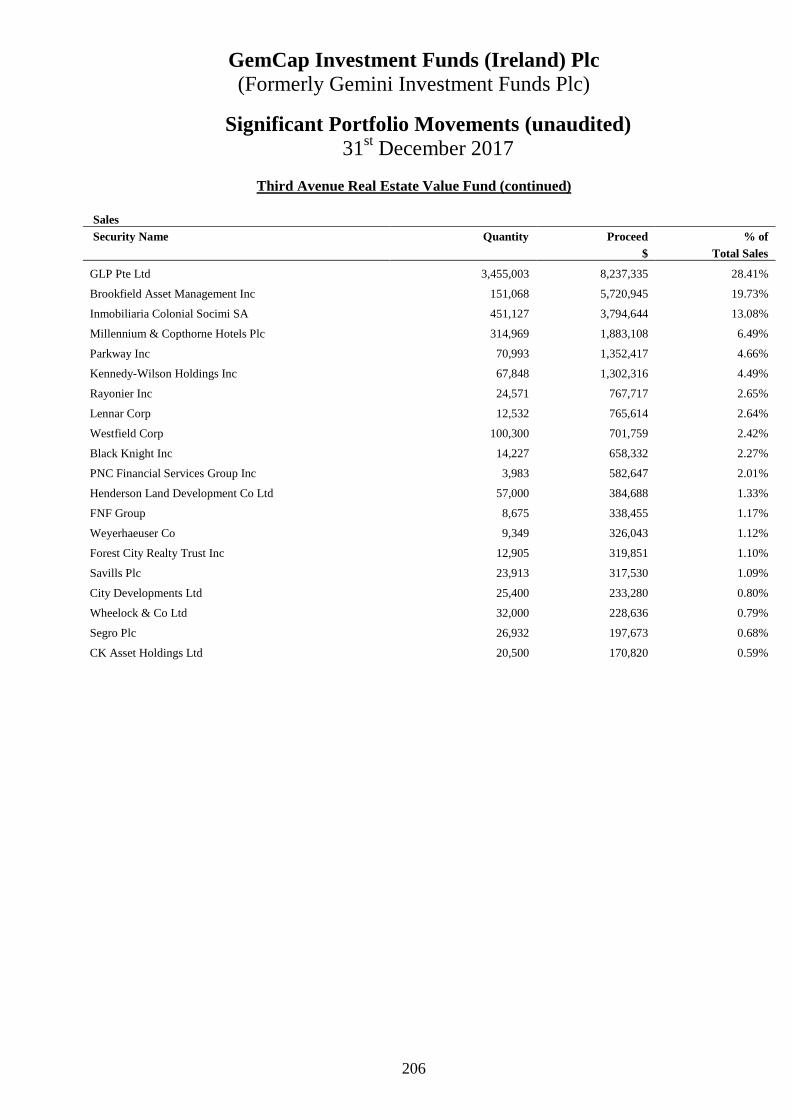
GemCap Investment Funds (Ireland) Plc (Formerly Gemini Investment Funds Plc)
206
Significant Portfolio Movements (unaudited) 31st December 2017
Third Avenue Real Estate Value Fund (continued)
Sales
Security Name Quantity Proceed % of $ Total Sales
GLP Pte Ltd 3,455,003 8,237,335 28.41%
Brookfield Asset Management Inc 151,068 5,720,945 19.73%
Inmobiliaria Colonial Socimi SA 451,127 3,794,644 13.08%
Millennium & Copthorne Hotels Plc 314,969 1,883,108 6.49%
Parkway Inc 70,993 1,352,417 4.66%
Kennedy-Wilson Holdings Inc 67,848 1,302,316 4.49%
Rayonier Inc 24,571 767,717 2.65%
Lennar Corp 12,532 765,614 2.64%
Westfield Corp 100,300 701,759 2.42%
Black Knight Inc 14,227 658,332 2.27%
PNC Financial Services Group Inc 3,983 582,647 2.01%
Henderson Land Development Co Ltd 57,000 384,688 1.33%
FNF Group 8,675 338,455 1.17%
Weyerhaeuser Co 9,349 326,043 1.12%
Forest City Realty Trust Inc 12,905 319,851 1.10%
Savills Plc 23,913 317,530 1.09%
City Developments Ltd 25,400 233,280 0.80%
Wheelock & Co Ltd 32,000 228,636 0.79%
Segro Plc 26,932 197,673 0.68%
CK Asset Holdings Ltd 20,500 170,820 0.59%
GemCap Investment Funds (Ireland) Plc (Formerly Gemini Investment Funds Plc)
207
Investment Manager’s Report
Third Avenue Value Fund The Third Avenue Value Fund, a sub-fund of Third Avenue Capital Plc merged into Third Avenue Value Fund, a sub-fund of the Company effective 7th June 2017. Market Highlights
On September 19, 2017, Third Avenue Management announced that Michael Fineman and Matthew Fine would assume portfolio management responsibilities for the Third Avenue Value Fund, bringing a total of 44 years of global investment and portfolio management experience.
For the six months ended December 31, 2017, the Third Avenue Value Fund (the “Fund”) returned 5.24% as compared to MSCI World Index, which returned 10.89%1. For the calendar year 2017, the Fund returned 12.76% as compared to 23.07% for the Index1. The Fund’s relative performance has lagged world indices over those periods largely as a result of the Fund’s large allocation to U.S. companies in a year in which the U.S. dollar was relatively weaker than many foreign currencies. Additionally, the Fund does not participate in richly-valued technology stocks that have been key drivers of U.S. and world index returns.
By year-end, the portfolio allocation
to companies headquartered in the United States was 49.9%, while non-U.S. exposure was 26.0%, and the cash weighting was 24.1%.
Activity During Period Following the Fund’s portfolio management changes, the team sold positions they believed did not align with a deep-value mandate and allocated to a number of investment opportunities, including Lundin Mining and Warrior Met Coal, which were among the Fund’s largest positive contributors to performance during the period. Other areas where the investment team is finding value includes oil services, and lumber producers. In both cases, the evolution of supply gluts into supply deficits are helping to create recovery of operating performance, while securities prices do not yet reflect those developments. Within oil services, Tidewater Inc. was added during the period. This is a name the team considers a special situation opportunity. The allocation was made shortly after the oil services provider exited bankruptcy with a net cash balance sheet and reduced cost structure. The team also sees potential opportunity in the North American lumber industry where supply constraints have been developing over a number of years while demand, driven by U.S. single-family housing construction and renovation, continues its recovery but still remains materially below normalized levels. Interfor, North America’s fourth largest lumber producer by volume, should benefit as demand in the Pacific Northwest United States has seen increasing demand for its lumber from Asian export markets. Interfor is headquartered in British Columbia and derives two thirds of its production volumes from the United States where demand is high. We suspect the lumber industry overall may be poised to enter a period of supply deficit resulting in strong lumber pricing and very attractive cash flows for well-located mills.
Market Outlook Looking ahead, we expect the U.S. allocation to be reduced as cash gets deployed into attractively valued companies globally. Fund management also expect the overall fundamental metrics to be reduced as the portfolio aligns with its deep value philosophy under new management. Looking forward to 2018 and beyond, shareholders should expect that the team will continue to view the safety of our collective capital and the avoidance of permanent impairment thereof as first priority. Shareholders should also expect portfolio management will source deep value investments in unconventional and out of favor areas, such as the post-bankruptcy special situation opportunities and cyclically depressed businesses described above as they offer great long-term value. As a result of these priorities, it should be expected that the Third Avenue Value Fund will be distinct in its portfolio composition and for this reason its returns are likely to offer reduced correlation to world indices. Third Avenue Management LLC Date: February 2018

GemCap Investment Funds (Ireland) Plc (Formerly Gemini Investment Funds Plc)
208
Statement of Financial Position as at 31st December 2017
TAVF 31 Dec 2017* Note $
ASSETS Financial Assets at Fair Value through Profit or Loss:
Investments in Transferable Securities 3 3,917,629Cash at bank 5 518,439Dividends and interest receivable 6,084Receivable from Investment Manager 7 37,485Other receivables 11,086
TOTAL ASSETS 4,490,723 LIABILITIES Investment management fees payable 7 13,859Manager fee payable 7 8,414Administration fees payable 7 161Transfer agency fees payable 7 1,887Directors fees payable 7 38Depositary and depositary oversight fees payable 7 4,381Audit fees payable 2,945Stamp duty tax payable 2 530Other fees payable 15,111TOTAL LIABILITIES (excluding net assets attributable to ho lders of redeemable participating shares) 47,326
NET ASSETS ATTRIBUTABLE TO HOLDERS OF REDEEMABLE PARTICIPATING SHARES 4,443,397 * Launched on 7th June 2017. The accompanying notes and schedules form an integral part of these financial statements.
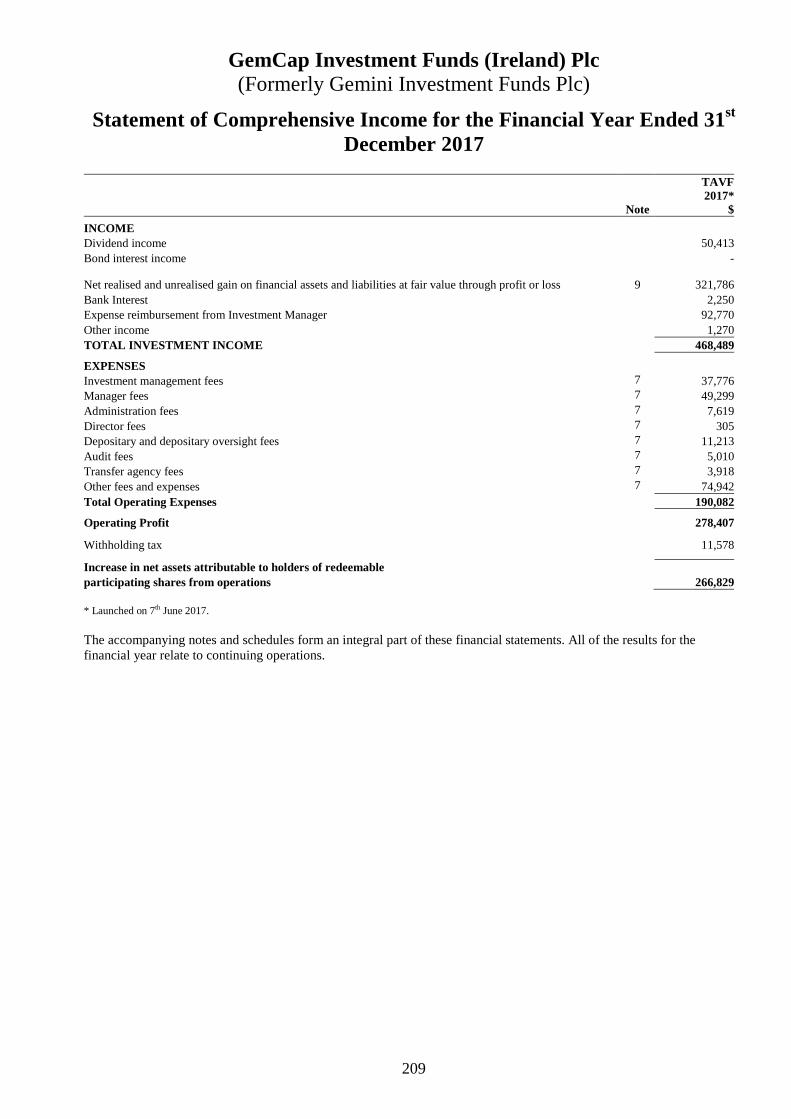
GemCap Investment Funds (Ireland) Plc (Formerly Gemini Investment Funds Plc)
209
Statement of Comprehensive Income for the Financial Year Ended 31st December 2017
TAVF
2017* Note $ INCOME
Dividend income 50,413Bond interest income -
Net realised and unrealised gain on financial assets and liabilities at fair value through profit or loss 9 321,786Bank Interest 2,250Expense reimbursement from Investment Manager 92,770Other income 1,270TOTAL INVESTMENT INCOME 468,489 EXPENSES Investment management fees 7 37,776Manager fees 7 49,299Administration fees 7 7,619Director fees 7 305Depositary and depositary oversight fees 7 11,213Audit fees 7 5,010Transfer agency fees 7 3,918Other fees and expenses 7 74,942Total Operating Expenses 190,082 Operating Profit 278,407 Withholding tax 11,578 Increase in net assets attributable to holders of redeemable participating shares from operations 266,829 * Launched on 7th June 2017.
The accompanying notes and schedules form an integral part of these financial statements. All of the results for the financial year relate to continuing operations.

GemCap Investment Funds (Ireland) Plc (Formerly Gemini Investment Funds Plc)
210
Statement of Changes in Net Assets attributable to Holders of Redeemable Participating Shares
* Launched on 7th June 2017. The accompanying notes and schedules form an integral part of these financial statements.
TAVF* 2017 Note $ Net Assets attributable to holders of Redeemable Participating Shares at the beginning of the financial year
-
Increase in Net Assets attributable to Holders of Redeemable Participating Shares from operations 266,829 Capital transactions Issue of redeemable shares during the financial year 335,000Redemption of redeemable shares during the financial year (340,787)In-specie transfer 4,182,355
Net Assets attributable to Holders of Redeemable Participating Shares at the end of the financial year 4,443,397
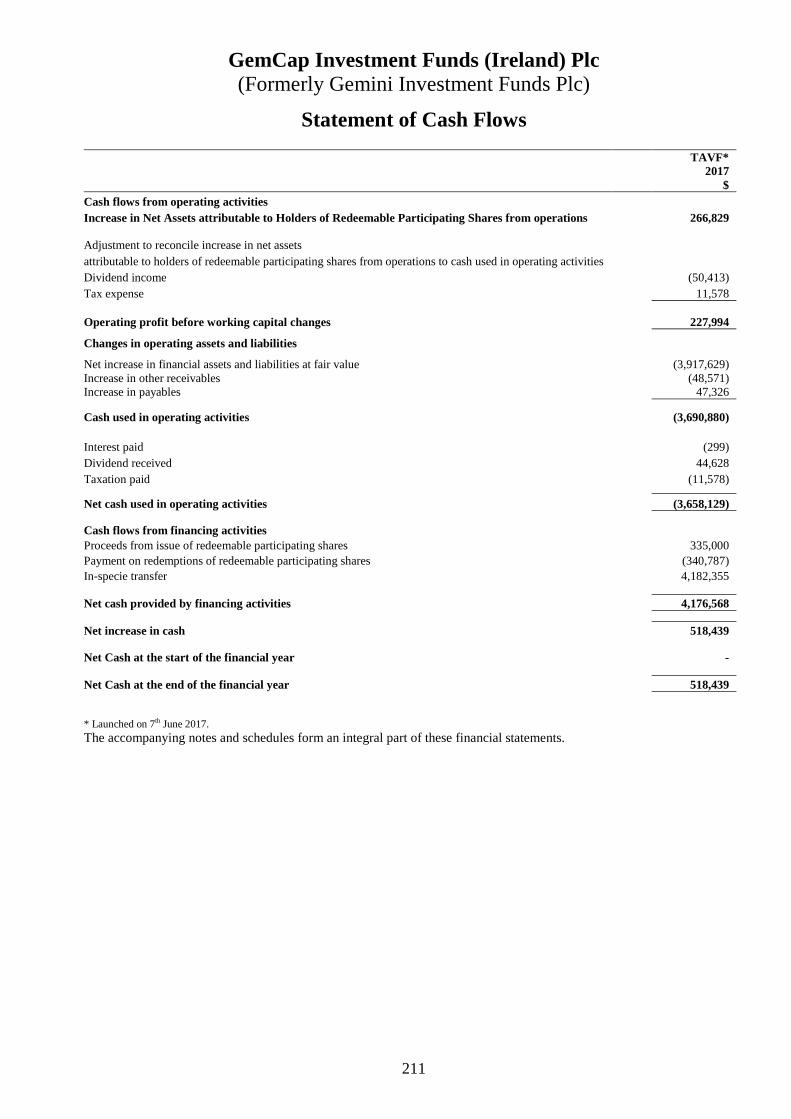
GemCap Investment Funds (Ireland) Plc (Formerly Gemini Investment Funds Plc)
211
Statement of Cash Flows
TAVF* 2017 $ Cash flows from operating activities Increase in Net Assets attributable to Holders of Redeemable Participating Shares from operations 266,829 Adjustment to reconcile increase in net assets attributable to holders of redeemable participating shares from operations to cash used in operating activities Dividend income (50,413) Tax expense 11,578 Operating profit before working capital changes 227,994 Changes in operating assets and liabilities Net increase in financial assets and liabilities at fair value (3,917,629) Increase in other receivables (48,571) Increase in payables 47,326 Cash used in operating activities (3,690,880) Interest paid (299) Dividend received 44,628 Taxation paid (11,578) Net cash used in operating activities (3,658,129) Cash flows from financing activities Proceeds from issue of redeemable participating shares 335,000 Payment on redemptions of redeemable participating shares (340,787) In-specie transfer 4,182,355 Net cash provided by financing activities 4,176,568 Net increase in cash 518,439 Net Cash at the start of the financial year - Net Cash at the end of the financial year 518,439 * Launched on 7th June 2017. The accompanying notes and schedules form an integral part of these financial statements.
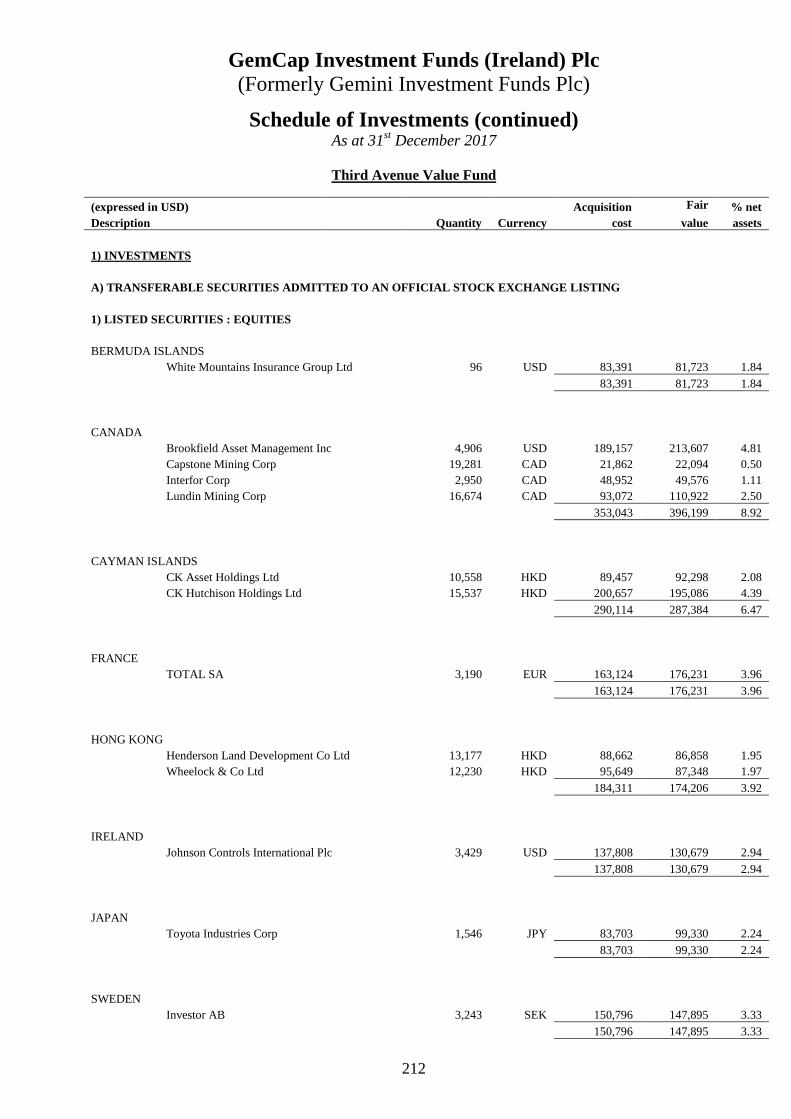
GemCap Investment Funds (Ireland) Plc (Formerly Gemini Investment Funds Plc)
212
Schedule of Investments (continued) As at 31st December 2017
Third Avenue Value Fund
(expressed in USD) Acquisition Fair % net Description Quantity Currency cost value assets
1) INVESTMENTS
A) TRANSFERABLE SECURITIES ADMITTED TO AN OFFICIAL STOCK EXCHANG E LISTING
1) LISTED SECURITIES : EQUITIES
BERMUDA ISLANDS White Mountains Insurance Group Ltd 96 USD 83,391 81,723 1.84
83,391 81,723 1.84
CANADA Brookfield Asset Management Inc 4,906 USD 189,157 213,607 4.81 Capstone Mining Corp 19,281 CAD 21,862 22,094 0.50 Interfor Corp 2,950 CAD 48,952 49,576 1.11 Lundin Mining Corp 16,674 CAD 93,072 110,922 2.50
353,043 396,199 8.92
CAYMAN ISLANDS CK Asset Holdings Ltd 10,558 HKD 89,457 92,298 2.08 CK Hutchison Holdings Ltd 15,537 HKD 200,657 195,086 4.39
290,114 287,384 6.47
FRANCE TOTAL SA 3,190 EUR 163,124 176,231 3.96
163,124 176,231 3.96
HONG KONG Henderson Land Development Co Ltd 13,177 HKD 88,662 86,858 1.95 Wheelock & Co Ltd 12,230 HKD 95,649 87,348 1.97
184,311 174,206 3.92
IRELAND Johnson Controls International Plc 3,429 USD 137,808 130,679 2.94
137,808 130,679 2.94
JAPAN Toyota Industries Corp 1,546 JPY 83,703 99,330 2.24
83,703 99,330 2.24
SWEDEN Investor AB 3,243 SEK 150,796 147,895 3.33
150,796 147,895 3.33

GemCap Investment Funds (Ireland) Plc (Formerly Gemini Investment Funds Plc)
213
Schedule of Investments (continued) As at 31st December 2017
Third Avenue Value Fund
(expressed in USD) Acquisition Fair % net Description Quantity Currency cost value assets
A) TRANSFERABLE SECURITIES ADMITTED TO AN OFFICIAL STOCK EXCHANGE LISTING (continued)
1) LISTED SECURITIES : EQUITIES (continued)
SWITZERLAND Pargesa Holding SA 995 CHF 77,269 86,291 1.94
77,269 86,291 1.94
UNITED STATES (U.S.A.) Alleghany Corp 195 USD 114,126 116,238 2.61 Amgen Inc 559 USD 90,368 97,210 2.19
Bank of New York Mellon Corp 3,340 USD 160,480 179,892 4.05 Cavco Industries Inc 952 USD 109,480 145,275 3.27
Comerica Inc 1,662 USD 114,520 144,278 3.25 EOG Resources Inc 699 USD 61,617 75,429 1.70 KeyCorp 2,457 USD 43,735 49,558 1.11
Lennar Corp 2,430 USD 125,262 153,673 3.46 Lennar Corp 48 USD 2,094 2,481 0.06
Masco Corp 1,727 USD 63,899 75,884 1.71 PNC Financial Services Group Inc 978 USD 117,457 141,116 3.17 Reliance Steel & Aluminum Co 1,130 USD 82,601 96,942 2.18 Tejon Ranch Co 4,368 USD 87,324 90,679 2.04 Tidewater Inc 3,135 USD 83,236 76,494 1.72 Warrior Met Coal Inc 1,624 USD 42,425 40,844 0.92
1,298,624 1,485,993 33.44
TOTAL LISTED SECURITIES : EQUITIES 2,822,183 3,065,931 69.00
TOTAL TRANSFERABLE SECURITIES ADMITTED TO AN OFFICIAL STOCK EXCHANGE LISTING 2,822,183 3,065,931 69.00
B) FINANCIAL INSTRUMENTS
1) FINANCIAL INSTRUMENTS
UNITED STATES (U.S.A.) United States Treasury Bill 0% 18/01/2018 250,000 USD 249,772 249,867 5.62 United States Treasury Bill 0% 25/01/2018 300,000 USD 299,744 299,726 6.75
549,516 549,593 12.37
TOTAL FINANCIAL INSTRUMENTS 549,516 549,593 12.37
TOTAL FINANCIAL INSTRUMENTS 549,516 549,593 12.37

GemCap Investment Funds (Ireland) Plc (Formerly Gemini Investment Funds Plc)
214
Schedule of Investments (continued) As at 31st December 2017
Third Avenue Value Fund
(expressed in USD) Acquisition Fair % net Description Quantity Currency cost value assets
C) OTHER TRANSFERABLE SECURITIES : REAL ESTATE INVESTMENT TRUST
UNITED STATES (U.S.A.) Forest City Realty Trust Inc 2,667 USD 66,539 64,276 1.45 Weyerhaeuser Co 6,745 USD 222,780 237,829 5.35
289,319 302,105 6.80
TOTAL OTHER TRANSFERABLE SECURITIES : REAL ESTATE INVESTMENT TRUST 289,319 302,105 6.80
TOTAL INVESTMENTS 3,917,629 88.17
OTHER ASSETS 573,094 12.90
OTHER LIABILITIES (47,326) (1.07)
NET ASSETS ATTRIBUTABLE TO HOLDERS OF REDEEMABLE PARTICIPATING SHARES 4,443,397 100.00
% of Total Assets
Assets % Investment in Transferable Securities 87.24 Investment in Financial Derivative Instruments - Cash at Bank 11.54 Other Assets and Liabilities 0.16
Total Assets 98.94

GemCap Investment Funds (Ireland) Plc (Formerly Gemini Investment Funds Plc)
215
Significant Portfolio Movements (unaudited) 31st December 2017
Third Avenue Value Fund
Purchases Security Name Quantity Cost % of $ Total Purchases
United States Treasury Bill 0% 25/07/2018 300,000 299,894 4.76%
United States Treasury Bill 0% 17/10/2018 300,000 299,739 4.75%
United States Treasury Bill 0% 14/11/2018 300,000 299,744 4.75%
Bank of New York Mellon Corp 5,517 265,669 4.21%
United States Treasury Bill 0% 10/10/2018 250,000 249,789 3.96%
United States Treasury Bill 0% 07/11/2018 250,000 249,772 3.96%
Weyerhaeuser Co 7,408 245,033 3.89%
CK Hutchison Holdings Ltd 15,537 200,656 3.18%
Comerica Inc 2,894 199,707 3.17%
United States Treasury Bill 0% 15/08/2018 200,000 199,850 3.17%
United States Treasury Bill 0% 13/09/2018 200,000 199,843 3.17%
PNC Financial Services Group Inc 1,630 196,604 3.12%
Brookfield Asset Management Inc 4,906 189,156 3.00%
TOTAL SA 3,190 163,125 2.59%
Investor AB 3,243 150,796 2.39%
Johnson Controls International plc 3,429 137,807 2.19%
Cavco Industries Inc 1,171 134,665 2.14%
Lennar Corp 2,430 127,356 2.02%
White Mountains Insurance Group Ltd 133 115,532 1.83%
Alleghany Corp 195 114,126 1.81%
Vodafone Group Plc 34,859 103,491 1.64%
Kingfisher Plc 25,479 102,856 1.63%
Wheelock & Co Ltd 12,230 95,649 1.52%
Masco Corp 2,574 95,238 1.51%
Lundin Mining Corp 16,674 93,071 1.48%
Greencore Group Plc 31,849 90,908 1.44%
Amgen Inc 559 90,368 1.43%
CK Asset Holdings Ltd 10,558 89,456 1.42%
Henderson Land Development Co Ltd 13,177 88,661 1.41%
Cerner Corp 1,307 89,098 1.41%
Tejon Ranch Co 4,368 87,324 1.39%
Toyota Industries Corp 1,546 83,703 1.33%
Tidewater Inc 3,135 83,236 1.32%
LivaNova Plc 1,446 82,740 1.31%
Reliance Steel & Aluminum Co 1,130 82,601 1.31%
Pargesa Holding SA 995 77,269 1.23%
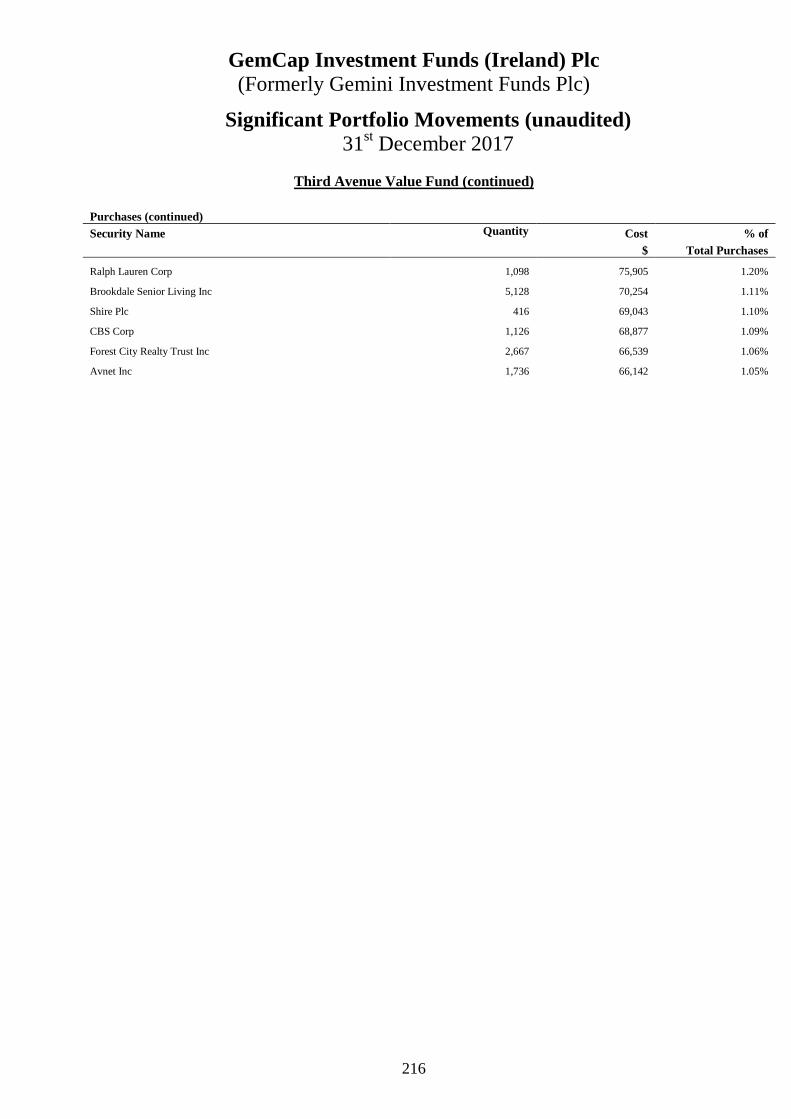
GemCap Investment Funds (Ireland) Plc (Formerly Gemini Investment Funds Plc)
216
Significant Portfolio Movements (unaudited) 31st December 2017
Third Avenue Value Fund (continued)
Purchases (continued) Security Name Quantity Cost % of $ Total Purchases
Ralph Lauren Corp 1,098 75,905 1.20%
Brookdale Senior Living Inc 5,128 70,254 1.11%
Shire Plc 416 69,043 1.10%
CBS Corp 1,126 68,877 1.09%
Forest City Realty Trust Inc 2,667 66,539 1.06%
Avnet Inc 1,736 66,142 1.05%

GemCap Investment Funds (Ireland) Plc (Formerly Gemini Investment Funds Plc)
217
Significant Portfolio Movements (unaudited) 31st December 2017
Third Avenue Value Fund (continued)
Sales
Security Name Quantity Proceed % of $ Total Sales
United States Treasury Bill 0% 25/07/2018 300,000 300,001 11.11%
United States Treasury Bill 0% 17/10/2018 300,000 300,001 11.11%
United States Treasury Bill 0% 10/10/2018 250,000 250,001 9.26%
United States Treasury Bill 0% 15/08/2018 200,000 200,000 7.41%
United States Treasury Bill 0% 13/09/2018 200,000 200,000 7.41%
Bank of New York Mellon Corp 2,177 116,202 4.30%
Kingfisher Plc 25,479 106,278 3.94%
LivaNova Plc 1,446 103,968 3.85%
Vodafone Group Plc 34,859 98,924 3.66%
Comerica Inc 1,232 98,325 3.64%
Ralph Lauren Corp 1,098 97,332 3.60%
PNC Financial Services Group Inc 652 86,267 3.19%
Cerner Corp 1,307 85,811 3.18%
Greencore Group Plc 31,849 81,874 3.03%
Devon Energy Corp 1,816 69,238 2.56%
Avnet Inc 1,736 68,731 2.55%
Shire Plc 416 64,599 2.39%
CBS Corp 1,126 63,649 2.36%
Canfor Corp 3,746 58,641 2.17%
Brookdale Senior Living Inc 5,128 57,000 2.11%
Anixter International Inc 828 53,940 2.00%
Masco Corp 847 32,560 1.21%
White Mountains Insurance Group Ltd 37 32,362 1.20%
Cavco Industries Inc 219 29,422 1.09%


GemCap Investment Funds (Ireland) Plc (Formerly Gemini Investment Funds Plc)
219
Combined Statement of Comprehensive Income for the Financial Year Ended 31st December 2017 and 2016
Company Total Company Total
2017 2016 Note $ $ INCOME
Dividend income 8,796,991 8,587,693Bond interest income 17,930,318 14,209,340Net realised and unrealised gain/(loss) on financial assets and liabilities at fair value through profit or loss 9 115,866,425 (28,971,548)Bank Interest 174,418 1,701Expense reimbursement from Investment Manager 7 414,473 169,117Other income 1,040,425 914,797TOTAL INVESTMENT INCOME/(LOSS) 144,223,050 (5,088,900) EXPENSES Investment management fees 7 5,030,579 3,092,432Manager fees 7 484,552 -Administration fees 7 1,139,347 1,307,105Director fees 7 140,516 168,539Depositary and depositary oversight fees 7 462,270 328,680Audit fees 7 110,644 135,810Transfer agency fees 7 152,916 239,887Swap interest 4,496,782 3,508,408Other fees and expenses 7 1,564,243 1,643,559Total Operating Expenses 13,581,849 10,424,420 Operating Profit/(Loss) 130,641,201 (15,513,320) Finance Costs Dividends to holders of redeemable participating shares 9,023,890 7,511,775 Profit/(Loss) Before Tax 121,617,311 (23,025,095) Withholding tax 1,397,795 1,679,287 Increase/(Decrease) in net assets attributable to holders of redeemable participating shares from operations 120,219,516 (24,704,382)
The accompanying notes and schedules form an integral part of these financial statements. All of the results for the financial year relate to continuing operations with the exception of SGVIF which terminated on 27th April 2017.
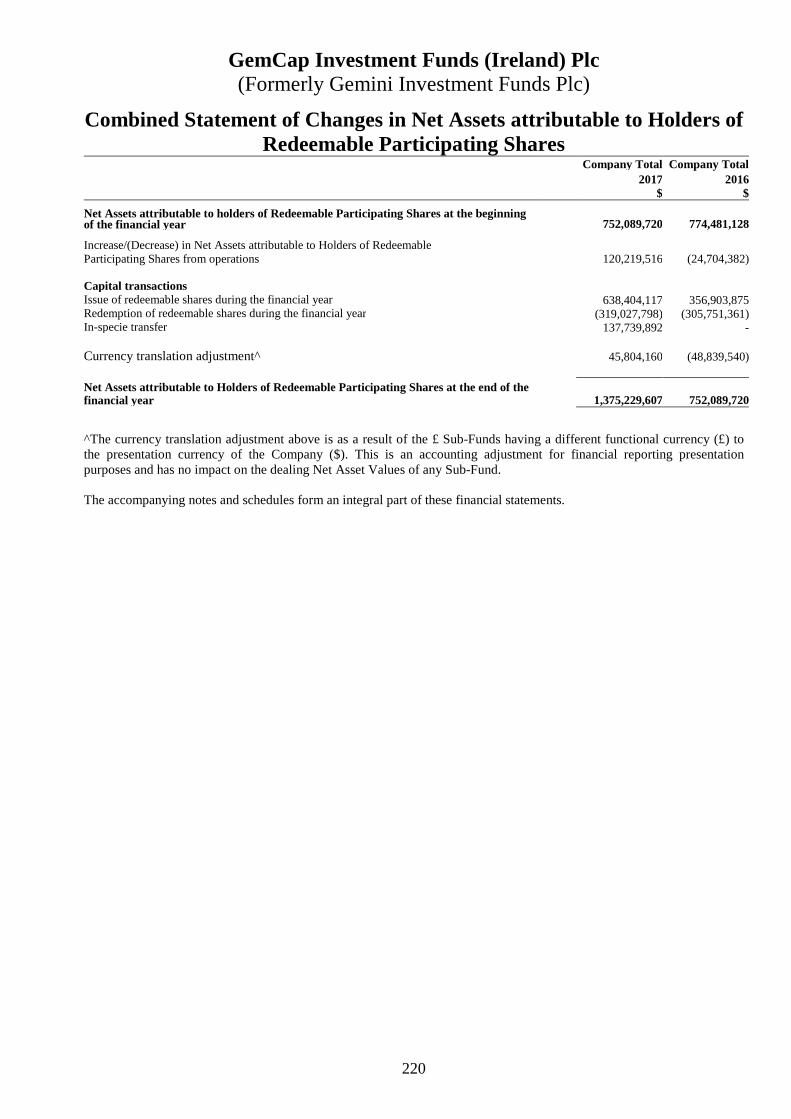
GemCap Investment Funds (Ireland) Plc (Formerly Gemini Investment Funds Plc)
220
Combined Statement of Changes in Net Assets attributable to Holders of Redeemable Participating Shares
^The currency translation adjustment above is as a result of the £ Sub-Funds having a different functional currency (£) to the presentation currency of the Company ($). This is an accounting adjustment for financial reporting presentation purposes and has no impact on the dealing Net Asset Values of any Sub-Fund. The accompanying notes and schedules form an integral part of these financial statements.
Company Total Company Total 2017 2016 $ $ Net Assets attributable to holders of Redeemable Participating Shares at the beginning of the financial year
752,089,720 774,481,128
Increase/(Decrease) in Net Assets attributable to Holders of Redeemable Participating Shares from operations 120,219,516 (24,704,382) Capital transactions Issue of redeemable shares during the financial year 638,404,117 356,903,875Redemption of redeemable shares during the financial year (319,027,798) (305,751,361)In-specie transfer 137,739,892 - Currency translation adjustment^ 45,804,160 (48,839,540)
Net Assets attributable to Holders of Redeemable Participating Shares at the end of the financial year
1,375,229,607 752,089,720
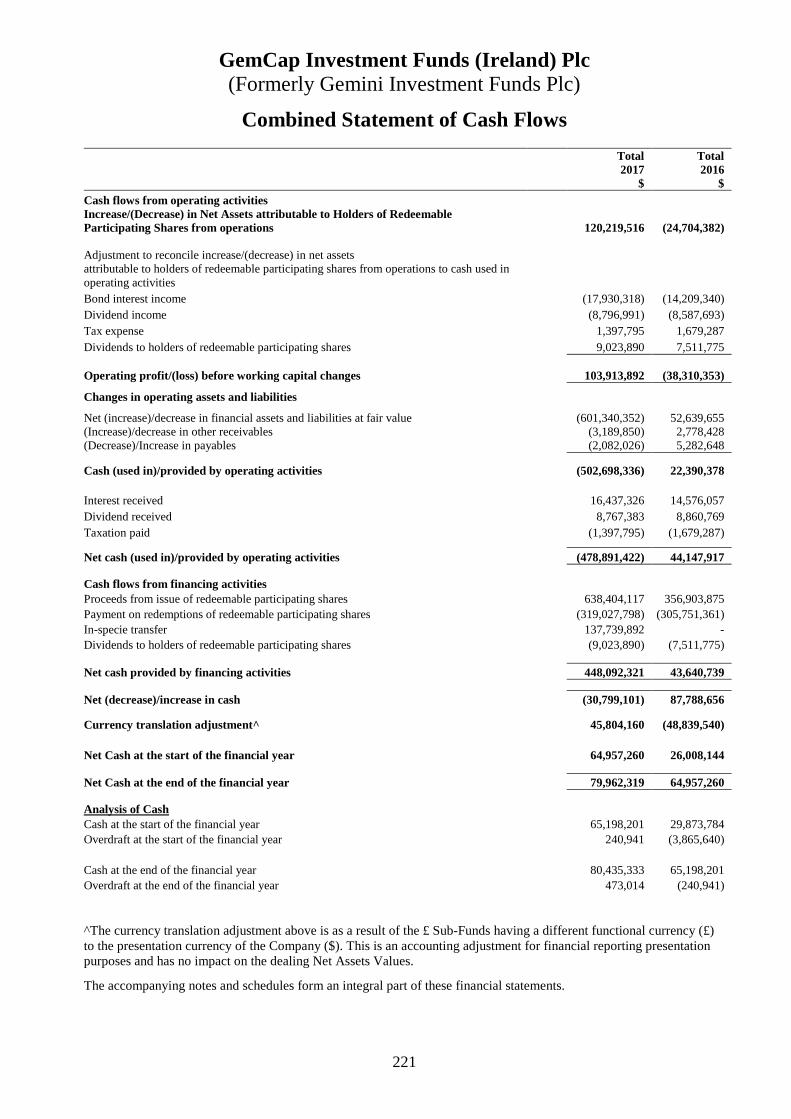
GemCap Investment Funds (Ireland) Plc (Formerly Gemini Investment Funds Plc)
221
Combined Statement of Cash Flows
Total Total 2017 2016 $ $ Cash flows from operating activities Increase/(Decrease) in Net Assets attributable to Holders of Redeemable Participating Shares from operations 120,219,516 (24,704,382) Adjustment to reconcile increase/(decrease) in net assets attributable to holders of redeemable participating shares from operations to cash used in operating activities Bond interest income (17,930,318) (14,209,340) Dividend income (8,796,991) (8,587,693) Tax expense 1,397,795 1,679,287 Dividends to holders of redeemable participating shares 9,023,890 7,511,775 Operating profit/(loss) before working capital changes 103,913,892 (38,310,353) Changes in operating assets and liabilities Net (increase)/decrease in financial assets and liabilities at fair value (601,340,352) 52,639,655 (Increase)/decrease in other receivables (3,189,850) 2,778,428 (Decrease)/Increase in payables (2,082,026) 5,282,648 Cash (used in)/provided by operating activities (502,698,336) 22,390,378 Interest received 16,437,326 14,576,057 Dividend received 8,767,383 8,860,769 Taxation paid (1,397,795) (1,679,287) Net cash (used in)/provided by operating activities (478,891,422) 44,147,917 Cash flows from financing activities Proceeds from issue of redeemable participating shares 638,404,117 356,903,875 Payment on redemptions of redeemable participating shares (319,027,798) (305,751,361) In-specie transfer 137,739,892 - Dividends to holders of redeemable participating shares (9,023,890) (7,511,775) Net cash provided by financing activities 448,092,321 43,640,739 Net (decrease)/increase in cash (30,799,101) 87,788,656 Currency translation adjustment^ 45,804,160 (48,839,540) Net Cash at the start of the financial year 64,957,260 26,008,144 Net Cash at the end of the financial year 79,962,319 64,957,260 Analysis of Cash Cash at the start of the financial year 65,198,201 29,873,784 Overdraft at the start of the financial year 240,941 (3,865,640) Cash at the end of the financial year 80,435,333 65,198,201 Overdraft at the end of the financial year 473,014 (240,941) ^The currency translation adjustment above is as a result of the £ Sub-Funds having a different functional currency (£) to the presentation currency of the Company ($). This is an accounting adjustment for financial reporting presentation purposes and has no impact on the dealing Net Assets Values.
The accompanying notes and schedules form an integral part of these financial statements.

GemCap Investment Funds (Ireland) Plc (Formerly Gemini Investment Funds Plc)
222
Notes forming part of the Financial Statements
1. GENERAL INFORMATION
GemCap Investment Funds (Ireland) Plc (the “Company”) is an umbrella type open-ended investment company with variable capital incorporated on 1st June 2010, with limited liability and segregated liability between funds, under the laws of Ireland with registered number 485081 under the Companies Act 2014. The Company is authorised in Ireland by the Central Bank of Ireland (the “Central Bank”) pursuant to the European Communities (Undertakings for Collective Investment in Transferable Securities) Regulations, 2011 (the “UCITS Regulations”) and Central Bank (Supervision and Enforcement) Act 2013 (Section 48(1)) (Undertakings for Collective Investment in Transferable Securities) Regulations 2015 (the “CBI UCITS Regulations”).
As at 31st December 2017, the Company had thirteen separate active investment portfolios (“Sub-Funds”) authorised by the Central Bank:
AHFM Defined Returns Fund (AHFM)* AHFM US Enhanced Equity Fund (AUEE)* GSI Global Diversified Value Fund (GSI) London & Capital Global Balanced Fixed Income Fund (L&CGBFI) London & Capital Global Conservative Fixed Income Fund (L&CGCFI) London & Capital Global Defensive Equity Fund (L&CGDE) London & Capital Global Emerging Markets Equity Fund (L&CGEME) London & Capital Global Growth Fixed Income Fund (L&CGGFI) London & Capital Global Star Equity Fund (L&CGSE) London & Capital UK Star Equity Fund (L&CUSE) Principal Asset Allocation Fund (PAAF)* Sabre Global Value and Income Fund (SGVIF)1 Third Avenue Real Estate Value Fund (TAREVF)*2 Third Avenue Value Fund (TAVF)*3
* Listed on the Irish Stock Exchange. 1 Terminated on 27th April 2017. 2 Launched on 30th May 2017. TAREVF, a sub-fund of Third Avenue Capital Plc merged into TAREVF, a sub-fund of the Company. 3 Launched on 7th June 2017. TAVF, a sub-fund of Third Avenue Capital Plc merged into TAVF, a sub-fund of the Company.
The Sub-Funds have the following investment objectives:
AHFM Defined Returns Fund - The investment objective is to generate capital growth over the medium to longer term.
AHFM US Enhanced Equity Fund - The investment objective is to generate capital growth over the medium to longer term.
GSI Global Diversified Value Fund - The investment objective is to achieve long-term total return.
London & Capital Global Balanced Fixed Income Fund - The investment objective is to seek to provide absolute growth through investments in a full range of global fixed income securities including government bonds and corporate bonds with the aim of producing balanced investment returns with a relatively low level of volatility (below 8% over a business cycle).
London & Capital Global Conservative Fixed Income Fund - The investment objective is to seek to provide absolute growth through a highly diversified portfolio of investments in global fixed income securities, investing in government bonds and corporate bonds with the aim of producing investment returns with a relatively low level of volatility (below 5% over a business cycle).
London & Capital Global Defensive Equity Fund - The investment objective is to seek to provide growth through investment in a full range of global equities.

GemCap Investment Funds (Ireland) Plc (Formerly Gemini Investment Funds Plc)
223
Notes forming part of the Financial Statements (Continued)
1. GENERAL INFORMATION (Continued)
London & Capital Global Emerging Markets Equity Fund - The investment objective is to seek to provide income and capital growth through investments in a full range of global emerging market related equities. London & Capital Global Growth Fixed Income Fund - The investment objective is to seek to provide absolute growth through investments in a full range of global growth fixed income securities including, higher yielding corporate bonds with the aim of producing investment returns with a relatively high level of volatility (below 10% over a business cycle). It is envisaged that an important source of potential rise in the Sub-Fund’s Net Asset Value will be through capital appreciation of the Sub-Fund, on top of the income stream generated by the coupons (or annual interest) on the bonds. "Absolute" in this context refers to the strategies' ability to use financial derivative instruments to protect the capital value of the Sub-Fund during periods of high market volatility. London & Capital Global Star Equity Fund - The investment objective is to seek to provide growth through investments in a full range of global equities. London & Capital UK Star Equity Fund - The investment objective is to seek to provide growth through investments in an optimal mix of top-tier UK equities.
Principal Asset Allocation Fund - The investment objective is to seek to provide capital appreciation over a medium to long term through the allocation of investments across three main asset classes - equities, fixed-income and alternatives. Sabre Global Value and Income Fund - The investment objective was to seek to provide income and capital appreciation over the medium to long-term through investment in global equity securities. The Sub-Fund was closed by way of compulsory redemption on 27th April 2017. Third Avenue Real Estate Value Fund - The investment objective is to achieve long-term capital appreciation, primarily through investment in equities. Third Avenue Value Fund - The investment objective is to achieve long-term capital appreciation, primarily through investment in equities.
2. PRINCIPAL ACCOUNTING POLICIES The principal accounting policies adopted by the Company are as follows: Basis of Preparation The financial statements have been prepared in accordance with the Companies Act 2014 and International Financial Reporting Standards (“IFRS”) as adopted by the European Union (the “EU”). Accounting convention The financial statements are prepared on a going concern basis and under the historical cost convention except for the inclusion of financial assets and liabilities at fair value.
Accounting estimates The preparation of financial statements in conformity with IFRS requires management to make judgements, estimates and assumptions that effect the application of policies and the reported amounts of assets and liabilities, income and expense.
GemCap Investment Funds (Ireland) Plc (Formerly Gemini Investment Funds Plc)
224
Notes forming part of the Financial Statements (Continued)
2. PRINCIPAL ACCOUNTING POLICIES (Continued)
Accounting estimates (continued)
The estimates and associated assumptions are based on historical experience and various other factors that are believed to be reasonable under the circumstances, the results of which form the basis of making judgements about the carrying values of assets and liabilities that are not readily apparent from other sources. Actual results may differ from these estimates.
The estimates and underlying assumptions are reviewed on an ongoing basis. Revisions to accounting estimates are recognised in the period in which the estimate is revised if the revision affects only that period or in the period of the revision and future years if the revision affects both current and future years.
Offsetting financial assets and liabilities
Financial assets and liabilities are offset and the net amount reported in the Statement of Financial Position when there is a legally enforceable right to set-off the recognised amounts (which are not contingent on a future event), and there is an intention to settle on a net basis, or realise the asset and settle the liability simultaneously.
New standards and amendments effective after 1 January 2018 which have not been early adopted:
IFRS 9, 'Financial instruments', addresses the classification, measurement and recognition of financial assets and financial liabilities. An updated version of IFRS 9 was issued on 10 November 2013. It replaces the parts of IAS 39 that relate to the classification and measurement of financial instruments. IFRS 9 requires financial assets to be classified into two measurement categories: those measured at fair value and those measured at amortised cost. The determination is made at initial recognition. The classification depends on the entity's business model for managing its financial instruments and the contractual cash flow characteristics of the instrument. For financial liabilities, the standard retains most of the IAS 39 requirements. The effective mandatory date in place for IFRS 9 is 1 January 2018. IFRS 9 is not expected to have a significant impact on the Company’s measurement basis, financial position or performance, as it is expected that the Company will continue to classify its financial assets and financial liabilities (both long and short) as being at fair value through profit or loss.
Cash and cash equivalents
Cash and cash equivalents include cash in hand, deposits held at call with banks and bank overdrafts.
Foreign Currencies
Securities transactions are recorded in the financial statements on the trade date of the transaction and translated into the functional currency of the Sub-Fund at the exchange rate prevailing at the close of business on the trade date. Monetary assets and liabilities denominated in foreign currencies are translated into the functional currency of the Sub-Fund at the exchange rates ruling at the financial year end date. Non-monetary foreign currency denominated assets and liabilities that are carried at fair value are translated into the functional currency of the Sub-Fund at the date the fair values are determined. Foreign exchange differences arising on translation and realised gains and losses from trading activities are recognised through profit or loss in the Statement of Comprehensive Income for the financial year. Items included in the Company’s financial statements are measured using the primary economic environment in which the respective Sub-Fund operates (“the functional currency”). The presentational currency of the Company is United States Dollar. If indicators of the primary economic environment are mixed, then management uses its judgement to determine the functional currency that most faithfully represents the economic effects of the underlying transactions, events and conditions.

GemCap Investment Funds (Ireland) Plc (Formerly Gemini Investment Funds Plc)
225
Notes forming part of the Financial Statements (Continued)
2. PRINCIPAL ACCOUNTING POLICIES (Continued)
Foreign Currencies (continued)
The functional currencies of the Sub-Funds in existence as at 31st December 2017 are as follows:
Sub-Fund Name Functional Currency AHFM Defined Returns Fund (AHFM) £ AHFM US Enhanced Equity Fund (AUEE) $ GSI Global Diversified Value Fund (GSI) $ London & Capital Global Balanced Fixed Income Fund (L&CGBFI) $ London & Capital Global Conservative Fixed Income Fund (L&CGCFI) $ London & Capital Global Defensive Equity Fund (L&CGDE) $ London & Capital Global Emerging Markets Equity Fund (L&CGEME) $ London & Capital Global Growth Fixed Income Fund (L&CGGFI) $ London & Capital Global Star Equity Fund (L&CGSE) $ London & Capital UK Star Equity Fund (L&CUSE) £ Principal Asset Allocation Fund (PAAF) £ Sabre Global Value and Income Fund (SGVIF)* £ Third Avenue Real Estate Value Fund (TAREVF)** $ Third Avenue Value Fund (TAVF)*** $ * Terminated on 27th April 2017. ** Launched on 30th May 2017. *** Launched on 7th June 2017.
The foreign currency translation adjustment arising from translation of Sterling balances relating to AHFM Defined Returns Fund, London & Capital UK Star Equity Fund, Principal Asset Allocation Fund and Sabre Global Value and Income Fund for the purposes of preparing the Company total USD amounts has been included in the Statement of Changes in Net Assets attributable to Holders of Redeemable Participating shares and the Statement of Cash Flows. The notional currency translation adjustment for the financial year ended 31st December 2017 was $ 45,804,160 (2016: $ (48,839,540)). This does not impact the NAV of any individual Sub-Fund.
Financial instruments
(i) Classification The category of financial assets and liabilities at fair value through profit or loss, in accordance with IAS 39, comprises:
• Financial instruments held-for-trading are those that the Company principally holds for the purpose of short-term profit taking. These include equities, investments in bonds and warrants, swaps, futures, forward foreign exchange contracts and swaps.
• There are no financial instruments designated at fair value through profit or loss upon initial recognition.
Financial assets that are classified as receivables consist of trade, other receivables and other assets. Financial liabilities that are not at fair value through profit or loss include trade and other payables and financial liabilities which arise on Redeemable Participating Shares. (ii) Recognition The Company recognises financial assets and financial liabilities on the trade date, being the date it commits to purchase the instruments.
From this date any gains and losses which arise from changes in fair value of the financial assets or financial liabilities are recorded in the Statement of Comprehensive Income.

GemCap Investment Funds (Ireland) Plc (Formerly Gemini Investment Funds Plc)
226
Notes forming part of the Financial Statements (Continued)
2. PRINCIPAL ACCOUNTING POLICIES (Continued)
Financial instruments (Continued)
(iii) Measurement Financial instruments categorised at fair value through profit or loss are measured initially at fair value, with transaction costs for such instruments being recognised directly in the Statement of Comprehensive Income.
Subsequent to initial recognition, all instruments classified at fair value through profit or loss are measured at fair value with fair value changes recognised in the Statement of Comprehensive Income.
Financial liabilities, other than those at fair value through profit or loss, are measured at amortised cost using the effective interest rate.
Financial liabilities which arise from the Redeemable Participating Shares issued by the Company are carried at the redemption amount which represents the shareholders right to a residual interest in the Company’s assets.
iv) Fair value measurement principles IFRS 13 defines fair value as the price that would be received to sell an asset or paid to transfer a liability in an orderly transaction between market participants at the measurement date. The fair value of financial instruments including equities, bonds, warrants, swaps and forward foreign exchange contracts are based on their quoted market prices at the year end date without any deduction for estimated future selling costs. Financial assets and liabilities are priced at their last traded prices, mid price or settlement price. Swap contracts are valued using prices as provided by the broker. IFRS 13 allows the use of mid-market pricing or other pricing conventions (including last traded price and settlement price) that are used by market participants as a practical expedient for the exit price.
If a quoted market price is not available on a recognised stock exchange or from a broker/dealer for non-exchange-traded financial instruments, the fair value of the instrument is estimated using valuation techniques, including use of recent arm’s length market transactions, reference to the current fair value of another instrument that is substantially the same, discounted cash flow techniques, option pricing models or any other valuation technique that was considered to provide a reliable estimate of prices obtained in actual market transactions.
(v) Derecognition The Company derecognises a financial asset when the contractual rights to the cash flows from the financial asset expired or it transferred the financial asset and the transfer qualified for derecognition in accordance with IAS 39.
The Company uses the ‘first in first out’ method to determine the realised gains and losses on derecognition.
A financial liability is derecognised when the obligation specified in the contract was discharged, cancelled or expired. (vi) Specific instruments
Autocall An autocall is defined as a payoff event generated by the achieved performance of an underlying investment. At the predefined autocall date the performance of the underlying index compared to the strike might trigger an autocall event where a coupon (the autocall payment) was received by the Sub-Fund in accordance with the supplement of the Sub-Fund. On the downside, if an autocall event has not happened and the relevant index or indices is below a pre-defined protection level on the maturity date, 1% capital will be lost for every 1% fall in the worse or worst index between strike and maturity.

GemCap Investment Funds (Ireland) Plc (Formerly Gemini Investment Funds Plc)
227
Notes forming part of the Financial Statements (Continued)
2. PRINCIPAL ACCOUNTING POLICIES (Continued) Financial instruments (Continued) (vi) Specific instruments (Continued) Interest Rate Swaps Swap-based derivatives are contracts in which counterparties exchange, over a period of time, one stream of cash flows for another stream of cash flows. The streams are referred to as ‘legs’ of the swap agreement. The cash flows are normally calculated with reference to a notional amount, which is often not exchanged by the counterparties. The swap settlement is the difference between the fixed interest and variable interest. The fair value of derivatives is recognised in the Statement of Financial Position.
Equity Linked Swaps Equity linked swaps represent agreements that obligate two parties to exchange a series of cash flows at specified intervals based upon or calculated by reference to changes in specified prices or rates for a specified amount of an underlying asset or otherwise determined notional amount. The payment flows are usually netted against each other, with the difference being paid by one party to the other. Therefore amounts required for the future satisfaction of the swap may be greater or less than the amount recorded. The fair value of derivatives is recognised in the Statement of Financial Position. Inflation Swaps An inflation swap is a contract used to transfer inflation risk from one party to another through an exchange of cash flows. In an inflation swap, one party pays a fixed rate cash flow on a notional principal amount, while the other party pays a floating rate linked to an inflation index, such as the Consumer Price Index (CPI). The party paying the floating rate pays the inflation adjusted rate multiplied by the notional principal amount. The fair value of derivatives is recognised in the Statement of Financial Position. Cross Currency Swaps A cross-currency swap is an over-the-counter derivative in a form of an agreement between two parties to exchange interest payments and principal on loans. In a cross-currency swap, a loan's interest payments and principal in one currency would be exchanged for an equally valued loan and interest payments in a different currency. The fair value of derivatives is recognised in the Statement of Financial Position. Forward currency contracts A forward currency contract involves an obligation to purchase or sell a specific currency at a future date at a price set at the time the contract is made. Forward currency contracts are valued by reference to the forward price at which a new forward contract of the same size and maturity could be undertaken at the valuation date. The unrealised gain or loss on open forward currency contracts is calculated as the difference between this forward price and the contract rate and is included in the Statement of Comprehensive Income. Options Options are financial derivative instruments that give the buyer, in exchange for a premium payment, the right, but not the obligation, to either purchase from (call option) or sell to (put option) the writer a specified underlying instrument at a specified price on or before a specified date. Both the realised and unrealised gain and loss in respect of options contracts are recognised in the Statement of Comprehensive Income.
GemCap Investment Funds (Ireland) Plc (Formerly Gemini Investment Funds Plc)
228
Notes forming part of the Financial Statements (Continued)
2. PRINCIPAL ACCOUNTING POLICIES (Continued)
Financial instruments (Continued)
(vi) Specific instruments (Continued)
Futures Contracts A futures contract is an agreement between two parties to buy or sell a financial instrument for a set price on a future date. Initial margin deposits are made in cash upon entering into futures contracts. During the financial year the Company traded futures contracts, changes in the value of the contracts are recognised as unrealised gains or losses by "marking to market" on a daily basis to reflect the market value of the contract at the end of each day’s trading. Variation margin payments are made or received, depending on whether unrealised losses or gains are incurred. When the contract is closed or expires, the Company records a realised gain or loss equal to the difference between the proceeds from (or cost of) the closing transaction and the company’s basis in the contract.
Income
Dividend income is recorded gross of any non-reclaimable withholding taxes suffered on an ex-date basis. Deposit interest is accounted for as it accrues on an effective interest basis. Interest income is recognised in the Statement of Comprehensive Income using the effective yield method. Other income comprises of interest income received on swaps and other miscellaneous income received.
Capital Gains Tax
Realised gains on disposals of assets of the Funds may be subject to capital gains tax imposed by the assets’ country of origin. Tax on such realised gains is recognised as a tax expense in the Statement of Comprehensive Income.
The Company may be liable to taxes (including withholding taxes) in countries other than Ireland on dividend, interest income earned and capital gains arising on its investments. The Company may not be able to benefit from a reduction in the rate of such foreign tax by virtue of the double taxation treaties between Ireland and other countries. The Company may not, therefore, be able to reclaim any foreign withholding tax suffered by it in particular countries. Income that is subject to such tax is recognised gross of the taxes and the corresponding withholding tax is recognised as tax expense.
Expenses
Expenses are accounted for on an accruals basis.
Redeemable Participating Shares
The Company classifies financial instruments issued as financial liabilities or equity instruments in accordance with the substance of the contractual terms of the instruments. The Company has several classes of shares for issue. The Redeemable Participating Shares issued by the Company provides investors with the right to require redemption for cash at a value proportionate to the investor’s share in the Company’s Net Assets at the redemption date and also in the event of the Company’s liquidation and as such are classified as financial liabilities.
The NAV per share is calculated by dividing the total Net Assets by the number of shares in issue.
GemCap Investment Funds (Ireland) Plc (Formerly Gemini Investment Funds Plc)
229
Notes forming part of the Financial Statements (Continued)
2. PRINCIPAL ACCOUNTING POLICIES (Continued)
Portfolio Transaction Costs
Transaction costs are incremental costs, which are separately identifiable and directly attributable to the acquisition, issue or disposal of a financial asset or financial liability. Transaction costs are included within the net realised and unrealised gain/(loss) on financial assets and liabilities at fair value through profit or loss. For certain instrument types, such as derivatives, transaction costs are not easily separately identifiable and in some cases these costs have not been included in the transaction costs as disclosed in Note 8. Transaction costs that are not easily identifiable will be included as part of the cost of the instrument. Deferred Subscription Charges
The PAAF shareholders of Class C GBP, Class C USD, Class C EUR, Class C PLN and Class C CZK Shares will be charged a form of subscription charge (a "Deferred Subscription Charge") of 5% of the amount which they invest in Class C Shares.
The Deferred Subscription Charge shall be payable in full to the relevant appointed distributor in respect of the Shares at the time of investment. While the Deferred Subscription Charge shall be paid out of the Fund at the time of investment, the Shareholder's subscription will not be affected and gains or losses in relation to the value of Shareholders' Shares will be accounted for as if the full amount of the Shareholder's investment remained in the Fund.
The Deferred Subscription Charge will be deducted from the relevant Shareholder's Class C subscription proceeds. The Deferred Subscription Charge will be applied over a period of five years. If a Class C Shareholder redeems their shareholding prior to the expiration of this five year period, then the balance of the 5% Deferred Subscription Charge that has not been charged, will be deducted from the relevant redemption proceeds distributed to that Shareholder. The Deferred Subscription Charge is included in other fees and expenses within the Statement of Comprehensive Income.
For the purposes of calculating the value of any deductions on Class C investments, at the point of redemption, all share transactions are evaluated on a first in, first out basis.
On the fifth anniversary of any (still active) Class C Share subscription the 5% fee initially paid on or following the original investment date, would have been fully absorbed via the amortisation process per the daily Net Asset Value calculation process for the Fund. At this point in time, the current value of the relevant Class C shareholding will be ascertained and converted on behalf of the Shareholder, into Class B Shares of the equivalent value.
3. FINANCIAL INSTRUMENTS AT FAIR VALUE THROUGH PROFIT OR LOSS
When available, the Company measures the fair value of an instrument using quoted prices in an active market for that instrument. A market is regarded as active if quoted prices are readily and regularly available and represent actual and regularly occurring market transactions on an arm’s length basis. These instruments are included within level 1 of the fair value hierarchy and include bonds admitted and actively traded on an official stock exchange listing.

GemCap Investment Funds (Ireland) Plc (Formerly Gemini Investment Funds Plc)
230
Notes forming part of the Financial Statements (Continued)
3. FINANCIAL INSTRUMENTS AT FAIR VALUE THROUGH PROF IT OR LOSS (Continued) Bonds, other than those listed and actively traded on an official stock exchange, are valued by independent pricing services based on pricing models that evaluate the mean between the most recently quoted bid and ask price. The models also take into consideration data received from active market makers and broker-dealers, yield curves, and the spread over comparable bond issues. The spreads change daily in response to market conditions and are generally obtained from the new issue market and broker dealer sources. To the extent that these inputs are observable, the values of these bonds are categorised within level 2 of the fair value hierarchy.
The fair values of forward foreign currency exchange contracts are calculated by reference to current exchange rates for contracts with similar maturity and risk profiles. The determination of fair value for financial assets and liabilities for which there is no observable market price requires valuation techniques. IFRS establishes a fair value hierarchy for inputs used in measuring fair value that maximises the use of observable inputs and minimises the use of unobservable inputs by requiring that the most observable inputs be used when available. Observable inputs are those that market participants would use in pricing the asset or liability based on market data obtained from sources independent of the Company. Unobservable inputs reflect the Company management’s assumptions, made in good faith, about the inputs market participants would use in pricing the asset or liability developed based on the best information available in the circumstances.
The fair value hierarchy is categorised into three levels based on the inputs as follows:
Level 1 - Valuations based on quoted prices in active markets for identical assets or liabilities; Level 2 - Valuations based on quoted prices in markets that are not active or for which all significant inputs are observable, either directly (as prices) or indirectly (derived from prices); and
Level 3 - Valuations based on inputs that are unobservable and significant to the overall fair value measurement.
Inputs are used in applying the various valuation techniques and broadly refer to the assumptions that market participants use to make valuation decisions, including assumptions about risk. Inputs may include price information, volatility statistics, specific and broad credit data, liquidity statistics, and other factors. A financial instrument’s level within the fair value hierarchy is based on the lowest level of any input that is significant to the fair value measurement. However, the determination of what constitutes “observable” requires significant judgement by the Company.
The Company considers observable data to be that market data which is readily available, regularly distributed or updated, reliable and verifiable, not proprietary, and provided by independent sources that are actively involved in the relevant market. The categorisation of a financial instrument within the hierarchy is based upon the pricing transparency of the instrument and does not necessarily correspond to the Company’s perceived risk of that instrument.
Fair value is a market-based measure considered from the perspective of a market participant rather than an entity-specific measure. Therefore, even when market assumptions are not readily available, the Company’s assumptions are set to reflect those that market participants would use in pricing the asset or liability at the measurement date. The Company uses prices and inputs that are current as of the measurement date, including periods of market dislocation. In periods of market dislocation, the observability of prices and inputs may be reduced for many securities. This condition could cause a security to be reclassified to a lower level within the fair value hierarchy.
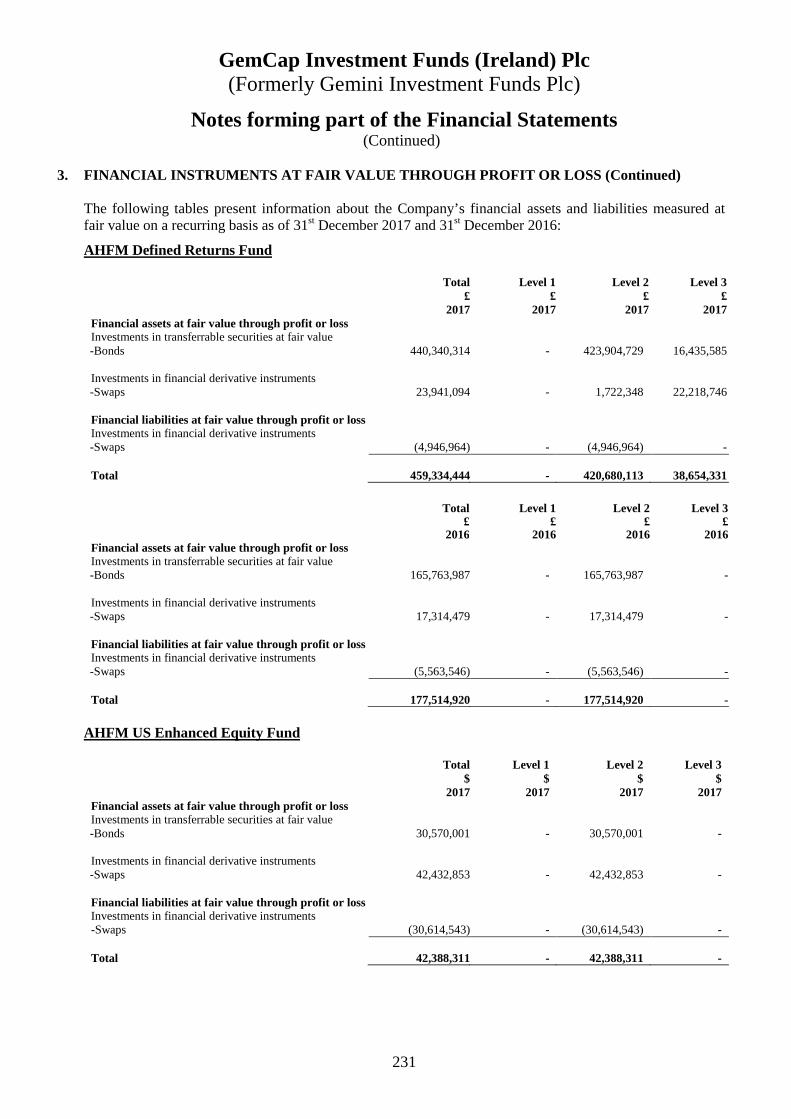
GemCap Investment Funds (Ireland) Plc (Formerly Gemini Investment Funds Plc)
231
Notes forming part of the Financial Statements (Continued)
3. FINANCIAL INSTRUMENTS AT FAIR VALUE THROUGH PROF IT OR LOSS (Continued)
The following tables present information about the Company’s financial assets and liabilities measured at fair value on a recurring basis as of 31st December 2017 and 31st December 2016:
AHFM Defined Returns Fund Total Level 1 Level 2 Level 3 £ £ £ £ 2017 2017 2017 2017
Financial assets at fair value through profit or loss Investments in transferrable securities at fair value
-Bonds 440,340,314 - 423,904,729 16,435,585 Investments in financial derivative instruments
-Swaps 23,941,094 - 1,722,348 22,218,746 Financial liabilities at fair value through profit or loss Investments in financial derivative instruments
-Swaps (4,946,964) - (4,946,964) -
Total 459,334,444 - 420,680,113 38,654,331
Total Level 1 Level 2 Level 3 £ £ £ £ 2016 2016 2016 2016 Financial assets at fair value through profit or loss Investments in transferrable securities at fair value
-Bonds 165,763,987 - 165,763,987 - Investments in financial derivative instruments
-Swaps 17,314,479 - 17,314,479 - Financial liabilities at fair value through profit or loss Investments in financial derivative instruments
-Swaps (5,563,546) - (5,563,546) -
Total 177,514,920 - 177,514,920 - AHFM US Enhanced Equity Fund Total Level 1 Level 2 Level 3 $ $ $ $ 2017 2017 2017 2017
Financial assets at fair value through profit or loss Investments in transferrable securities at fair value
-Bonds 30,570,001 - 30,570,001 -
Investments in financial derivative instruments -Swaps 42,432,853 - 42,432,853 -
Financial liabilities at fair value through profit or loss Investments in financial derivative instruments -Swaps (30,614,543) - (30,614,543) - Total 42,388,311 - 42,388,311 -
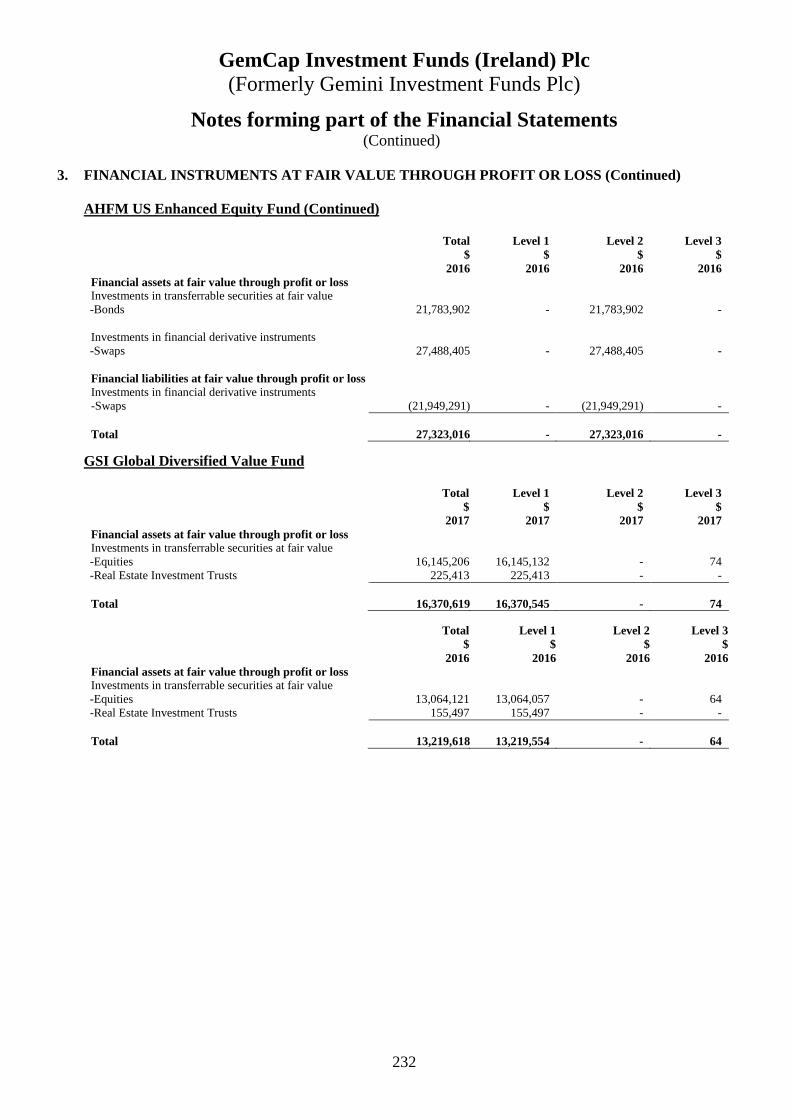
GemCap Investment Funds (Ireland) Plc (Formerly Gemini Investment Funds Plc)
232
Notes forming part of the Financial Statements (Continued)
3. FINANCIAL INSTRUMENTS AT FAIR VALUE THROUGH PROF IT OR LOSS (Continued)
AHFM US Enhanced Equity Fund (Continued) Total Level 1 Level 2 Level 3 $ $ $ $ 2016 2016 2016 2016
Financial assets at fair value through profit or loss Investments in transferrable securities at fair value
-Bonds 21,783,902 - 21,783,902 -
Investments in financial derivative instruments -Swaps 27,488,405 - 27,488,405 -
Financial liabilities at fair value through profit or loss Investments in financial derivative instruments -Swaps (21,949,291) - (21,949,291) - Total 27,323,016 - 27,323,016 -
GSI Global Diversified Value Fund Total Level 1 Level 2 Level 3 $ $ $ $ 2017 2017 2017 2017
Financial assets at fair value through profit or loss Investments in transferrable securities at fair value
-Equities 16,145,206 16,145,132 - 74 -Real Estate Investment Trusts 225,413 225,413 - -
Total 16,370,619 16,370,545 - 74
Total Level 1 Level 2 Level 3 $ $ $ $ 2016 2016 2016 2016 Financial assets at fair value through profit or loss Investments in transferrable securities at fair value
-Equities 13,064,121 13,064,057 - 64 -Real Estate Investment Trusts 155,497 155,497 - -
Total 13,219,618 13,219,554 - 64
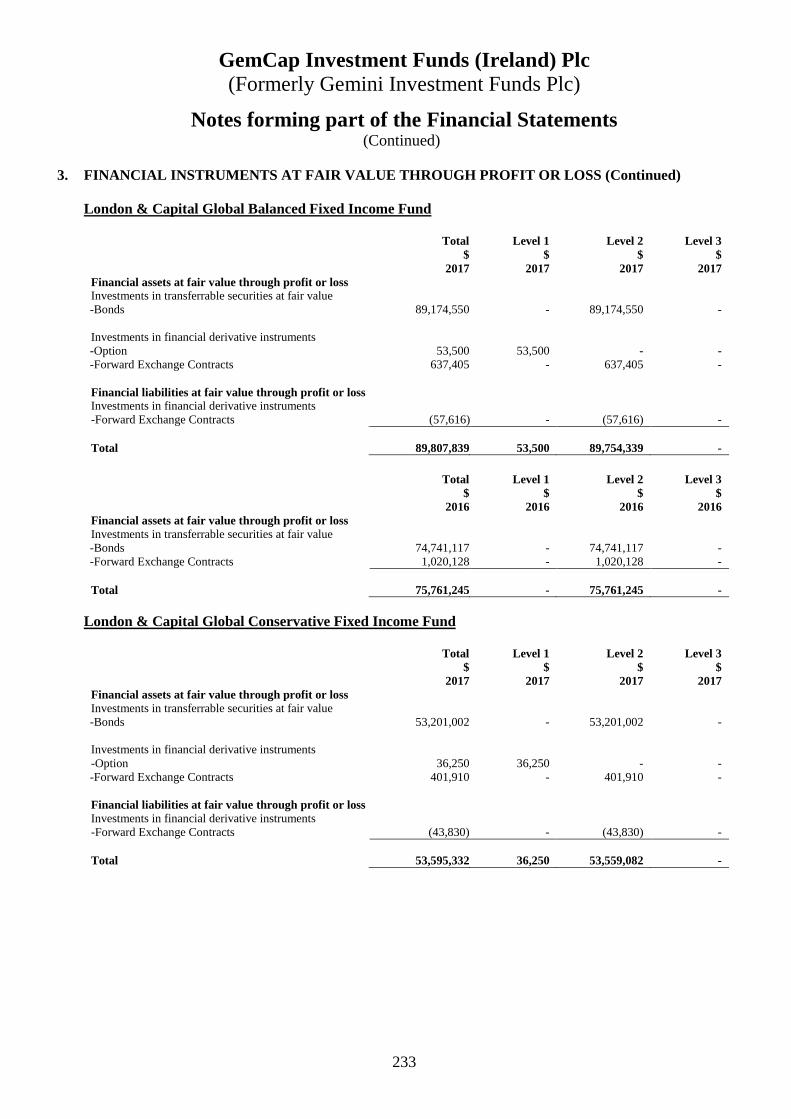
GemCap Investment Funds (Ireland) Plc (Formerly Gemini Investment Funds Plc)
233
Notes forming part of the Financial Statements (Continued)
3. FINANCIAL INSTRUMENTS AT FAIR VALUE THROUGH PROF IT OR LOSS (Continued)
London & Capital Global Balanced Fixed Income Fund Total Level 1 Level 2 Level 3 $ $ $ $ 2017 2017 2017 2017
Financial assets at fair value through profit or loss Investments in transferrable securities at fair value
-Bonds 89,174,550 - 89,174,550 -
Investments in financial derivative instruments -Option 53,500 53,500 - - -Forward Exchange Contracts 637,405 - 637,405 -
Financial liabilities at fair value through profit or loss Investments in financial derivative instruments -Forward Exchange Contracts (57,616) - (57,616) - Total 89,807,839 53,500 89,754,339 -
Total Level 1 Level 2 Level 3 $ $ $ $ 2016 2016 2016 2016
Financial assets at fair value through profit or loss Investments in transferrable securities at fair value
-Bonds 74,741,117 - 74,741,117 - -Forward Exchange Contracts 1,020,128 - 1,020,128 -
Total 75,761,245 - 75,761,245 -
London & Capital Global Conservative Fixed Income Fund Total Level 1 Level 2 Level 3 $ $ $ $ 2017 2017 2017 2017
Financial assets at fair value through profit or loss Investments in transferrable securities at fair value
-Bonds 53,201,002 - 53,201,002 -
Investments in financial derivative instruments -Option 36,250 36,250 - -
-Forward Exchange Contracts 401,910 - 401,910 - Financial liabilities at fair value through profit or loss Investments in financial derivative instruments -Forward Exchange Contracts (43,830) - (43,830) - Total 53,595,332 36,250 53,559,082 -
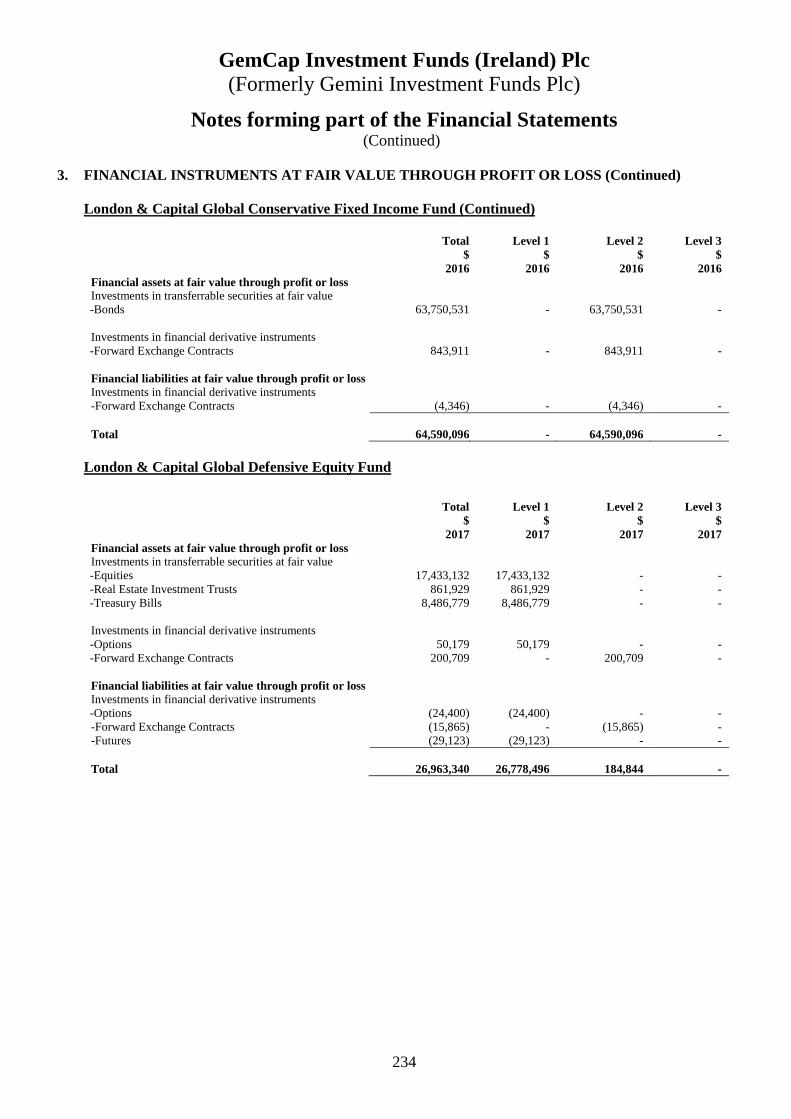
GemCap Investment Funds (Ireland) Plc (Formerly Gemini Investment Funds Plc)
234
Notes forming part of the Financial Statements (Continued)
3. FINANCIAL INSTRUMENTS AT FAIR VALUE THROUGH PROF IT OR LOSS (Continued)
London & Capital Global Conservative Fixed Income Fund (Continued) Total Level 1 Level 2 Level 3 $ $ $ $ 2016 2016 2016 2016
Financial assets at fair value through profit or loss Investments in transferrable securities at fair value
-Bonds 63,750,531 - 63,750,531 -
Investments in financial derivative instruments -Forward Exchange Contracts 843,911 - 843,911 -
Financial liabilities at fair value through profit or loss Investments in financial derivative instruments -Forward Exchange Contracts (4,346) - (4,346) - Total 64,590,096 - 64,590,096 -
London & Capital Global Defensive Equity Fund
Total Level 1 Level 2 Level 3 $ $ $ $ 2017 2017 2017 2017
Financial assets at fair value through profit or loss Investments in transferrable securities at fair value
-Equities 17,433,132 17,433,132 - - -Real Estate Investment Trusts 861,929 861,929 - - -Treasury Bills 8,486,779 8,486,779 - -
Investments in financial derivative instruments -Options 50,179 50,179 - - -Forward Exchange Contracts 200,709 - 200,709 -
Financial liabilities at fair value through profit or loss Investments in financial derivative instruments
-Options (24,400) (24,400) - - -Forward Exchange Contracts (15,865) - (15,865) - -Futures (29,123) (29,123) - - Total 26,963,340 26,778,496 184,844 -

GemCap Investment Funds (Ireland) Plc (Formerly Gemini Investment Funds Plc)
235
Notes forming part of the Financial Statements (Continued)
3. FINANCIAL INSTRUMENTS AT FAIR VALUE THROUGH PROF IT OR LOSS (Continued)
London & Capital Global Defensive Equity Fund (Continued) Total Level 1 Level 2 Level 3 $ $ $ $ 2016 2016 2016 2016
Financial assets at fair value through profit or loss Investments in transferrable securities at fair value
-Equities 35,290,211 35,290,211 - - -Real Estate Investment Trusts 5,019,563 5,019,563 - - -Treasury Bills 15,188,095 15,188,095 - -
Investments in financial derivative instruments -Options 74,263 74,263 - - -Forward Exchange Contracts 766,129 - 766,129 - -Futures 37,980 37,980 - -
Financial liabilities at fair value through profit or loss Investments in financial derivative instruments -Futures (92,584) (92,584) - - Total 56,283,657 55,517,528 766,129 -
London & Capital Global Emerging Markets Equity Fund Total Level 1 Level 2 Level 3 $ $ $ $ 2017 2017 2017 2017
Financial assets at fair value through profit or loss Investments in transferrable securities at fair value
-Equities 18,405,221 18,405,221 - -
Investments in financial derivative instruments -Forward Exchange Contracts 157,504 - 157,504 - Financial liabilities at fair value through profit or loss Investments in financial derivative instruments -Forward Exchange Contracts (42,179) - (42,179) - Total 18,520,546 18,405,221 115,325 -
Total Level 1 Level 2 Level 3 $ $ $ $ 2016 2016 2016 2016
Financial assets at fair value through profit or loss Investments in transferrable securities at fair value
-Equities 11,848,578 11,848,578 - -
Investments in financial derivative instruments -Forward Exchange Contracts 165,576 - 165,576 -
Financial liabilities at fair value through profit or loss Investments in financial derivative instruments -Forward Exchange Contracts (6,403) - (6,403) - Total 12,007,751 11,848,578 159,173 -
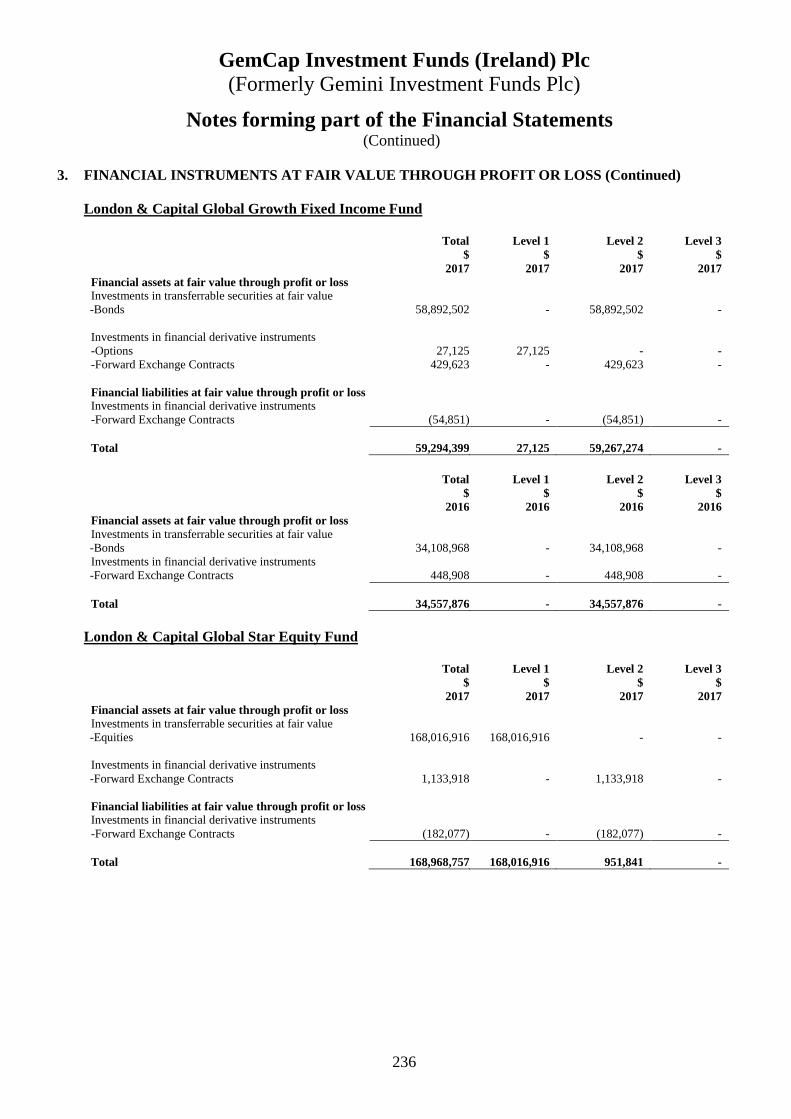
GemCap Investment Funds (Ireland) Plc (Formerly Gemini Investment Funds Plc)
236
Notes forming part of the Financial Statements (Continued)
3. FINANCIAL INSTRUMENTS AT FAIR VALUE THROUGH PROF IT OR LOSS (Continued)
London & Capital Global Growth Fixed Income Fund Total Level 1 Level 2 Level 3 $ $ $ $ 2017 2017 2017 2017
Financial assets at fair value through profit or loss Investments in transferrable securities at fair value
-Bonds 58,892,502 - 58,892,502 -
Investments in financial derivative instruments -Options 27,125 27,125 - - -Forward Exchange Contracts 429,623 - 429,623 - Financial liabilities at fair value through profit or loss Investments in financial derivative instruments -Forward Exchange Contracts (54,851) - (54,851) - Total 59,294,399 27,125 59,267,274 -
Total Level 1 Level 2 Level 3 $ $ $ $ 2016 2016 2016 2016
Financial assets at fair value through profit or loss Investments in transferrable securities at fair value
-Bonds 34,108,968 - 34,108,968 - Investments in financial derivative instruments
-Forward Exchange Contracts 448,908 - 448,908 - Total 34,557,876 - 34,557,876 -
London & Capital Global Star Equity Fund
Total Level 1 Level 2 Level 3 $ $ $ $ 2017 2017 2017 2017
Financial assets at fair value through profit or loss Investments in transferrable securities at fair value
-Equities 168,016,916 168,016,916 - -
Investments in financial derivative instruments -Forward Exchange Contracts 1,133,918 - 1,133,918 -
Financial liabilities at fair value through profit or loss Investments in financial derivative instruments -Forward Exchange Contracts (182,077) - (182,077) - Total 168,968,757 168,016,916 951,841 -

GemCap Investment Funds (Ireland) Plc (Formerly Gemini Investment Funds Plc)
237
Notes forming part of the Financial Statements (Continued)
3. FINANCIAL INSTRUMENTS AT FAIR VALUE THROUGH PROF IT OR LOSS (Continued)
London & Capital Global Star Equity Fund (Continued)
Total Level 1 Level 2 Level 3 $ $ $ $ 2016 2016 2016 2016
Financial assets at fair value through profit or loss Investments in transferrable securities at fair value
-Equities 118,080,993 118,080,993 - - Investments in financial derivative instruments
-Forward Exchange Contracts 1,519,115 - 1,519,115 - Total 119,600,108 118,080,993 1,519,115 -
London & Capital UK Star Equity Fund Total Level 1 Level 2 Level 3 £ £ £ £ 2017 2017 2017 2017
Financial assets at fair value through profit or loss Investments in transferrable securities at fair value
-Equities 12,018,051 12,018,051 - - Total 12,018,051 12,018,051 - -
Total Level 1 Level 2 Level 3 £ £ £ £ 2016 2016 2016 2016
Financial assets at fair value through profit or loss Investments in transferrable securities at fair value
-Equities 16,803,984 16,803,984 - - Total 16,803,984 16,803,984 - -
Principal Asset Allocation Fund
Total Level 1 Level 2 Level 3 £ £ £ £ 2017 2017 2017 2017
Financial assets at fair value through profit or loss Investments in transferrable securities at fair value
-Bonds 4,563,198 - 4,563,198 - -Investment Funds 14,506,786 - 14,506,786 - -Warrants 2,310,640 - - 2,310,640 -Treasury Bills 10,923,666 10,923,666 - -
Investments in financial derivative instruments -Forward Exchange Contracts 530,366 - 530,366 - -Futures 134,638 134,638 - -
Financial liabilities at fair value through profit or loss Investments in financial derivative instruments -Forward Exchange Contracts (44,121) - (44,121) - -Futures (278,736) (278,736) - - Total 32,646,437 10,779,568 19,556,229 2,310,640
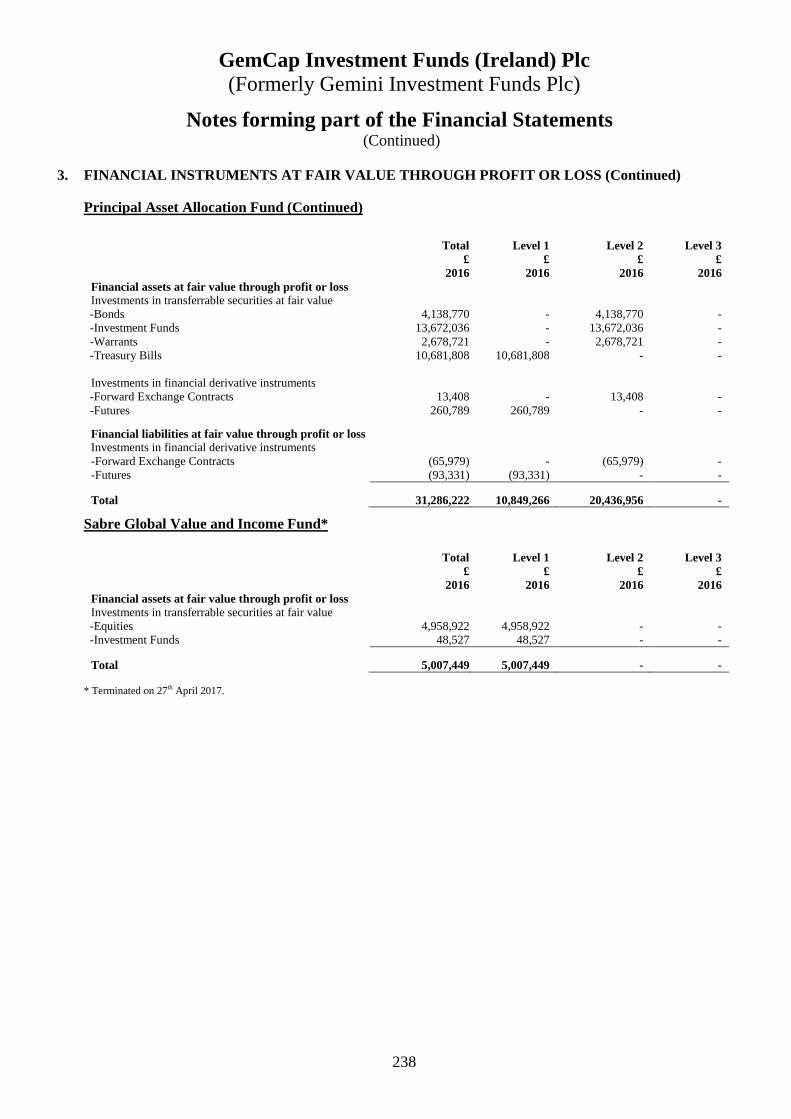
GemCap Investment Funds (Ireland) Plc (Formerly Gemini Investment Funds Plc)
238
Notes forming part of the Financial Statements (Continued)
3. FINANCIAL INSTRUMENTS AT FAIR VALUE THROUGH PROF IT OR LOSS (Continued)
Principal Asset Allocation Fund (Continued)
Total Level 1 Level 2 Level 3 £ £ £ £ 2016 2016 2016 2016
Financial assets at fair value through profit or loss Investments in transferrable securities at fair value
-Bonds 4,138,770 - 4,138,770 - -Investment Funds 13,672,036 - 13,672,036 - -Warrants 2,678,721 - 2,678,721 - -Treasury Bills 10,681,808 10,681,808 - -
Investments in financial derivative instruments
-Forward Exchange Contracts 13,408 - 13,408 - -Futures 260,789 260,789 - -
Financial liabilities at fair value through profit or loss Investments in financial derivative instruments -Forward Exchange Contracts (65,979) - (65,979) - -Futures (93,331) (93,331) - - Total 31,286,222 10,849,266 20,436,956 -
Sabre Global Value and Income Fund*
Total Level 1 Level 2 Level 3 £ £ £ £ 2016 2016 2016 2016
Financial assets at fair value through profit or loss Investments in transferrable securities at fair value
-Equities 4,958,922 4,958,922 - - -Investment Funds 48,527 48,527 - -
Total 5,007,449 5,007,449 - -
* Terminated on 27th April 2017.
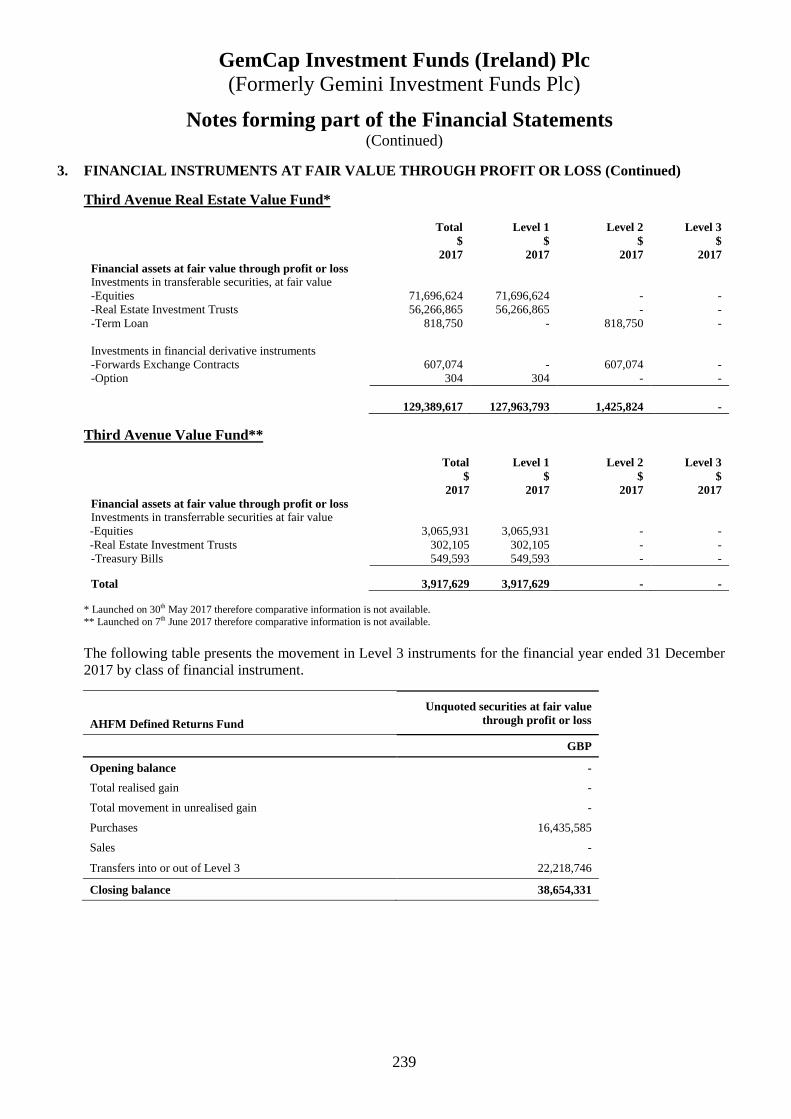
GemCap Investment Funds (Ireland) Plc (Formerly Gemini Investment Funds Plc)
239
Notes forming part of the Financial Statements (Continued)
3. FINANCIAL INSTRUMENTS AT FAIR VALUE THROUGH PROF IT OR LOSS (Continued)
Third Avenue Real Estate Value Fund*
Total Level 1 Level 2 Level 3 $ $ $ $ 2017 2017 2017 2017 Financial assets at fair value through profit or loss Investments in transferable securities, at fair value -Equities 71,696,624 71,696,624 - - -Real Estate Investment Trusts 56,266,865 56,266,865 - - -Term Loan 818,750 - 818,750 - Investments in financial derivative instruments -Forwards Exchange Contracts 607,074 - 607,074 - -Option 304 304 - - 129,389,617 127,963,793 1,425,824 -
Third Avenue Value Fund**
Total Level 1 Level 2 Level 3 $ $ $ $ 2017 2017 2017 2017
Financial assets at fair value through profit or loss Investments in transferrable securities at fair value
-Equities 3,065,931 3,065,931 - - -Real Estate Investment Trusts 302,105 302,105 - -
-Treasury Bills 549,593 549,593 - - Total 3,917,629 3,917,629 - -
* Launched on 30th May 2017 therefore comparative information is not available. ** Launched on 7th June 2017 therefore comparative information is not available.
The following table presents the movement in Level 3 instruments for the financial year ended 31 December 2017 by class of financial instrument.
Unquoted securities at fair value through profit or loss AHFM Defined Returns Fund
GBP
Opening balance -
Total realised gain -
Total movement in unrealised gain -
Purchases 16,435,585
Sales -
Transfers into or out of Level 3 22,218,746
Closing balance 38,654,331
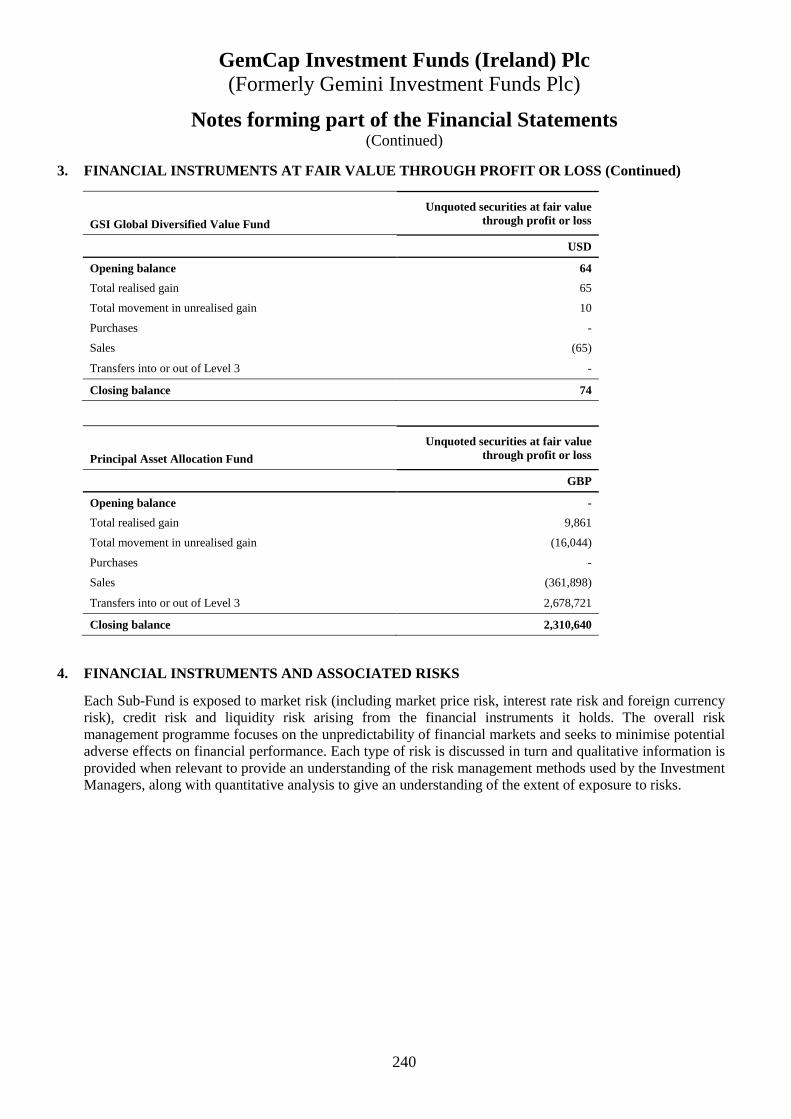
GemCap Investment Funds (Ireland) Plc (Formerly Gemini Investment Funds Plc)
240
Notes forming part of the Financial Statements (Continued)
3. FINANCIAL INSTRUMENTS AT FAIR VALUE THROUGH PROF IT OR LOSS (Continued)
Unquoted securities at fair value through profit or loss GSI Global Diversified Value Fund
USD
Opening balance 64
Total realised gain 65
Total movement in unrealised gain 10
Purchases -
Sales (65)
Transfers into or out of Level 3 -
Closing balance 74
Unquoted securities at fair value through profit or loss Principal Asset Allocation Fund
GBP
Opening balance -
Total realised gain 9,861
Total movement in unrealised gain (16,044)
Purchases -
Sales (361,898)
Transfers into or out of Level 3 2,678,721
Closing balance 2,310,640
4. FINANCIAL INSTRUMENTS AND ASSOCIATED RISKS
Each Sub-Fund is exposed to market risk (including market price risk, interest rate risk and foreign currency risk), credit risk and liquidity risk arising from the financial instruments it holds. The overall risk management programme focuses on the unpredictability of financial markets and seeks to minimise potential adverse effects on financial performance. Each type of risk is discussed in turn and qualitative information is provided when relevant to provide an understanding of the risk management methods used by the Investment Managers, along with quantitative analysis to give an understanding of the extent of exposure to risks.

GemCap Investment Funds (Ireland) Plc (Formerly Gemini Investment Funds Plc)
241
Notes forming part of the Financial Statements (Continued)
4. FINANCIAL INSTRUMENTS AND ASSOCIATED RISKS (cont inued) General Risk Management Process
The Company maintains both Value at Risk (VaR) and the commitment approach as the methods to calculate the global exposure in accordance with the UCITS regulations as different Sub-Funds may use different methods.
The Investment Risk Committee (the “Committee”) was formally dissolved by the Board of Directors (the “Board”) with effect from 1st January 2015 and all activities of the Committee were merged into the Board. Furthermore, the Company resolved to appoint a Designated Person with responsibility for risk management effective from 7th October 2015. The Designated Person is tasked with assisting the Board in providing leadership, direction and oversight of the overall Company risk appetite, risk tolerance and investment risk management framework. The Designated Person is authorised to investigate any matter within their remit, to seek any information from any of the investment managers which is necessary to enable the Designated Person to satisfactorily discharge their duties and to make recommendations to the Board where action or improvement is needed.
The Board and the Designated Person are responsible for the Investment Risk Framework; including:
1. recommending the overall risk appetite and tolerance of each Sub-Fund for approval; 2. reviewing the risk framework and approving Sub-Fund risk policies, standards and limits within the
overall appetite and tolerance for each Sub-Fund; 3. monitoring compliance with approved risk tolerance levels and policies and the resultant action in respect
of UCITS investment restrictions and individual Sub-Fund investment policy breaches; 4. reviewing each Sub-Fund’s material risk exposures; including market, credit, liquidity and regulatory risk; 5. reviewing the Sub-Fund’s stress testing and monitoring response to the results; 6. receiving notification of material breaches of investment limits and approving the proposed remedial
action where such cases are escalated to the Board and the Designated Person;
7. reviewing and providing confirmation that the disclosures made in the annual report on its activities, the risk governance and related sections are fair, balanced and understandable;
8. to produce an investment risk profile of all new potential Sub-Funds prior to approving the launch of such Sub-Funds.
Governance
The Board will receive reporting from the Designated Person to the findings of any reviews of the Sub-Fund’s investment risk and investment restrictions.
Each Sub-Fund has an individual risk management process.
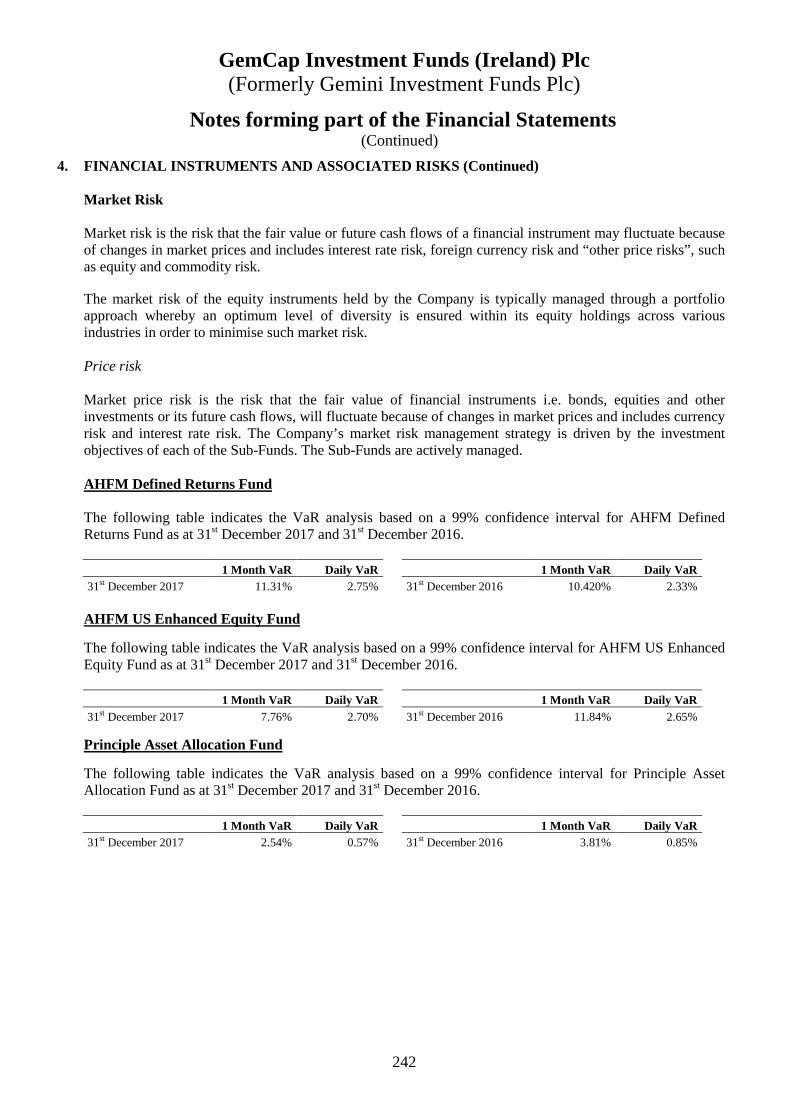
GemCap Investment Funds (Ireland) Plc (Formerly Gemini Investment Funds Plc)
242
Notes forming part of the Financial Statements (Continued)
4. FINANCIAL INSTRUMENTS AND ASSOCIATED RISKS (Cont inued) Market Risk Market risk is the risk that the fair value or future cash flows of a financial instrument may fluctuate because of changes in market prices and includes interest rate risk, foreign currency risk and “other price risks”, such as equity and commodity risk. The market risk of the equity instruments held by the Company is typically managed through a portfolio approach whereby an optimum level of diversity is ensured within its equity holdings across various industries in order to minimise such market risk. Price risk Market price risk is the risk that the fair value of financial instruments i.e. bonds, equities and other investments or its future cash flows, will fluctuate because of changes in market prices and includes currency risk and interest rate risk. The Company’s market risk management strategy is driven by the investment objectives of each of the Sub-Funds. The Sub-Funds are actively managed. AHFM Defined Returns Fund The following table indicates the VaR analysis based on a 99% confidence interval for AHFM Defined Returns Fund as at 31st December 2017 and 31st December 2016. 1 Month VaR Daily VaR 1 Month VaR Daily VaR 31st December 2017 11.31% 2.75% 31st December 2016 10.420% 2.33% AHFM US Enhanced Equity Fund
The following table indicates the VaR analysis based on a 99% confidence interval for AHFM US Enhanced Equity Fund as at 31st December 2017 and 31st December 2016. 1 Month VaR Daily VaR 1 Month VaR Daily VaR 31st December 2017 7.76% 2.70% 31st December 2016 11.84% 2.65%
Principle Asset Allocation Fund
The following table indicates the VaR analysis based on a 99% confidence interval for Principle Asset Allocation Fund as at 31st December 2017 and 31st December 2016. 1 Month VaR Daily VaR 1 Month VaR Daily VaR 31st December 2017 2.54% 0.57% 31st December 2016 3.81% 0.85%
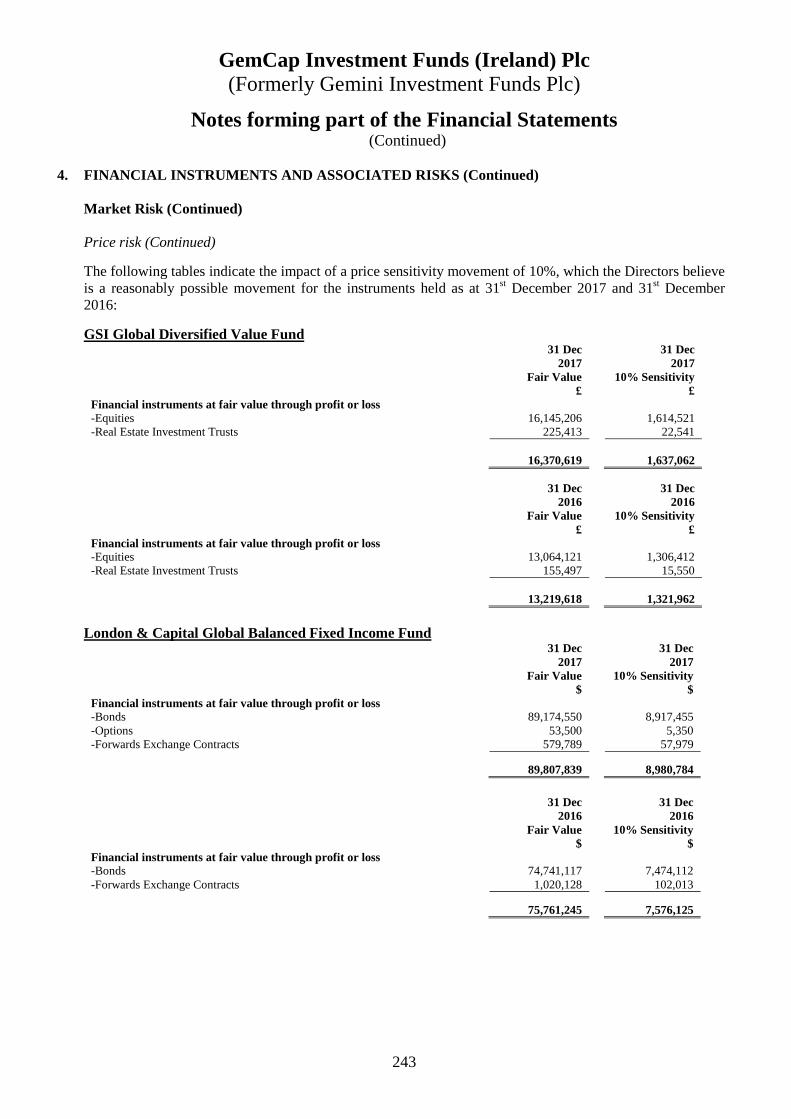
GemCap Investment Funds (Ireland) Plc (Formerly Gemini Investment Funds Plc)
243
Notes forming part of the Financial Statements (Continued)
4. FINANCIAL INSTRUMENTS AND ASSOCIATED RISKS (Cont inued)
Market Risk (Continued) Price risk (Continued)
The following tables indicate the impact of a price sensitivity movement of 10%, which the Directors believe is a reasonably possible movement for the instruments held as at 31st December 2017 and 31st December 2016:
GSI Global Diversified Value Fund 31 Dec 31 Dec 2017 2017 Fair Value 10% Sensitivity
£ £ Financial instruments at fair value through profit or loss -Equities 16,145,206 1,614,521 -Real Estate Investment Trusts 225,413 22,541 16,370,619 1,637,062
31 Dec 31 Dec 2016 2016 Fair Value 10% Sensitivity
£ £ Financial instruments at fair value through profit or loss -Equities 13,064,121 1,306,412 -Real Estate Investment Trusts 155,497 15,550 13,219,618 1,321,962
London & Capital Global Balanced Fixed Income Fund 31 Dec 31 Dec 2017 2017 Fair Value 10% Sensitivity
$ $ Financial instruments at fair value through profit or loss -Bonds 89,174,550 8,917,455 -Options 53,500 5,350 -Forwards Exchange Contracts 579,789 57,979 89,807,839 8,980,784
31 Dec 31 Dec 2016 2016 Fair Value 10% Sensitivity
$ $ Financial instruments at fair value through profit or loss -Bonds 74,741,117 7,474,112 -Forwards Exchange Contracts 1,020,128 102,013 75,761,245 7,576,125
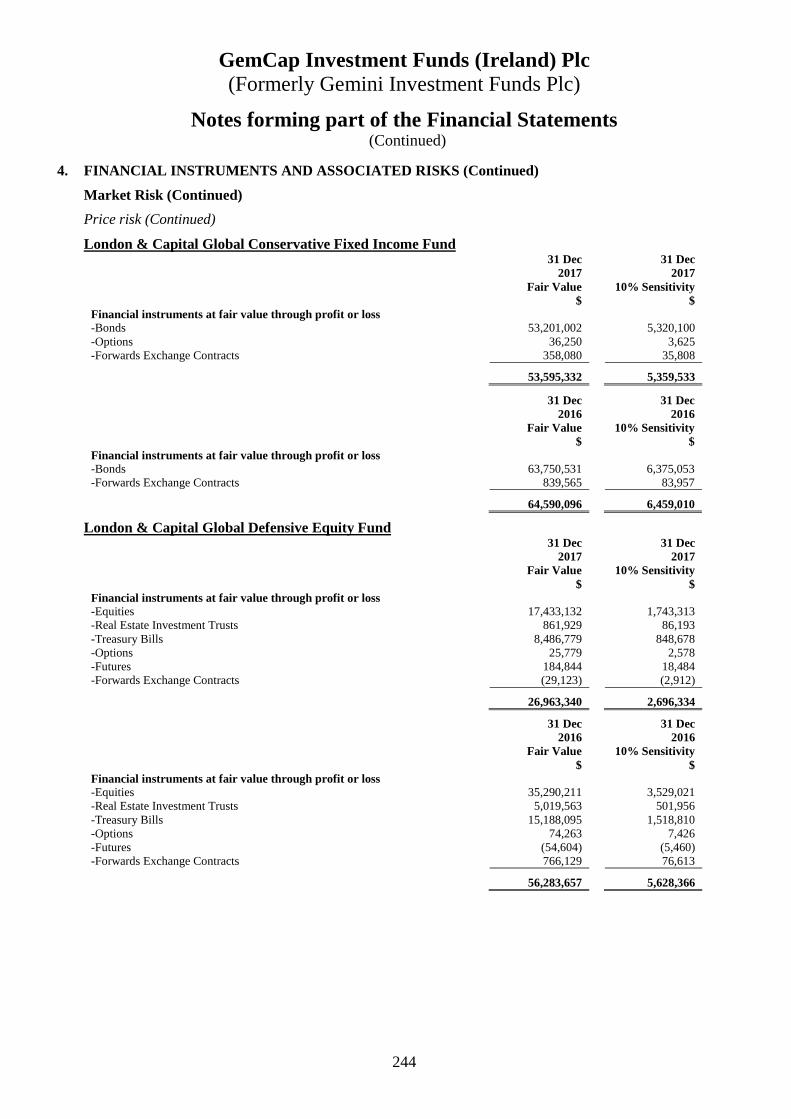
GemCap Investment Funds (Ireland) Plc (Formerly Gemini Investment Funds Plc)
244
Notes forming part of the Financial Statements (Continued)
4. FINANCIAL INSTRUMENTS AND ASSOCIATED RISKS (Cont inued)
Market Risk (Continued)
Price risk (Continued)
London & Capital Global Conservative Fixed Income Fund 31 Dec 31 Dec 2017 2017 Fair Value 10% Sensitivity
$ $ Financial instruments at fair value through profit or loss -Bonds 53,201,002 5,320,100 -Options 36,250 3,625 -Forwards Exchange Contracts 358,080 35,808 53,595,332 5,359,533
31 Dec 31 Dec 2016 2016 Fair Value 10% Sensitivity
$ $ Financial instruments at fair value through profit or loss -Bonds 63,750,531 6,375,053 -Forwards Exchange Contracts 839,565 83,957 64,590,096 6,459,010
London & Capital Global Defensive Equity Fund 31 Dec 31 Dec 2017 2017 Fair Value 10% Sensitivity
$ $ Financial instruments at fair value through profit or loss -Equities 17,433,132 1,743,313 -Real Estate Investment Trusts 861,929 86,193 -Treasury Bills 8,486,779 848,678 -Options 25,779 2,578 -Futures 184,844 18,484 -Forwards Exchange Contracts (29,123) (2,912) 26,963,340 2,696,334
31 Dec 31 Dec 2016 2016 Fair Value 10% Sensitivity $ $
Financial instruments at fair value through profit or loss -Equities 35,290,211 3,529,021 -Real Estate Investment Trusts 5,019,563 501,956 -Treasury Bills 15,188,095 1,518,810 -Options 74,263 7,426 -Futures (54,604) (5,460) -Forwards Exchange Contracts 766,129 76,613 56,283,657 5,628,366
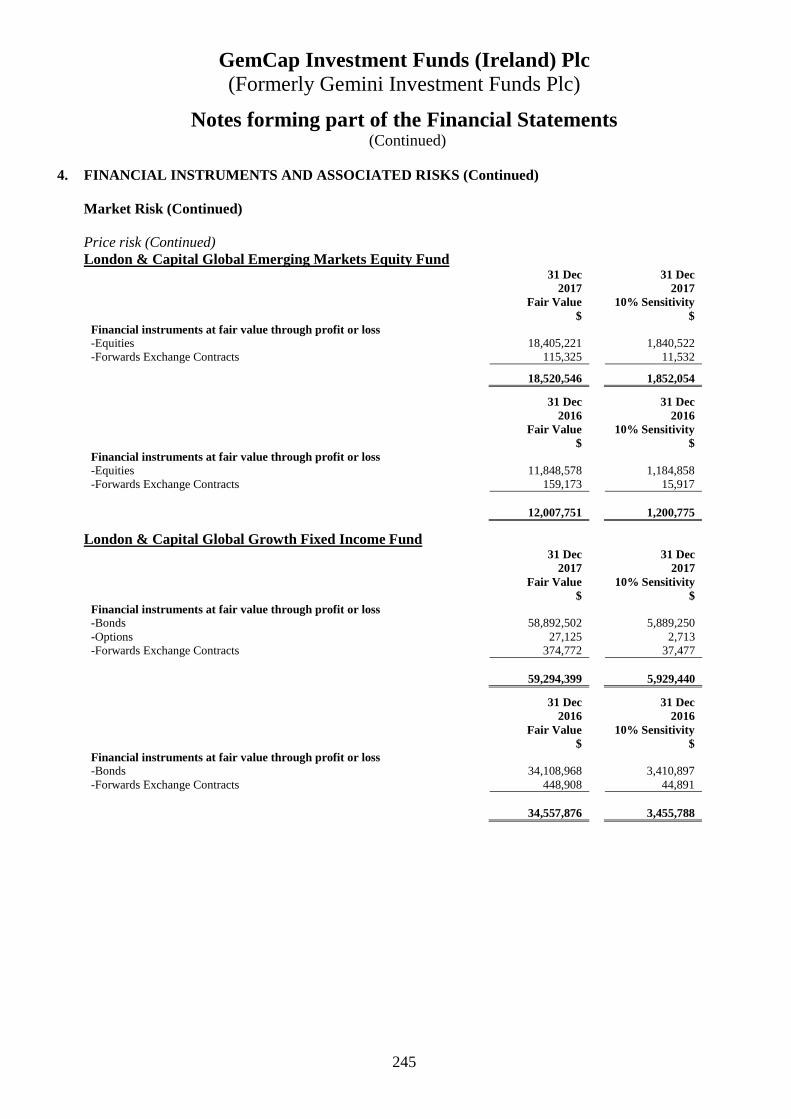
GemCap Investment Funds (Ireland) Plc (Formerly Gemini Investment Funds Plc)
245
Notes forming part of the Financial Statements (Continued)
4. FINANCIAL INSTRUMENTS AND ASSOCIATED RISKS (Cont inued)
Market Risk (Continued) Price risk (Continued) London & Capital Global Emerging Markets Equity Fund 31 Dec 31 Dec 2017 2017 Fair Value 10% Sensitivity
$ $ Financial instruments at fair value through profit or loss -Equities 18,405,221 1,840,522 -Forwards Exchange Contracts 115,325 11,532 18,520,546 1,852,054
31 Dec 31 Dec 2016 2016 Fair Value 10% Sensitivity
$ $ Financial instruments at fair value through profit or loss -Equities 11,848,578 1,184,858 -Forwards Exchange Contracts 159,173 15,917 12,007,751 1,200,775
London & Capital Global Growth Fixed Income Fund 31 Dec 31 Dec 2017 2017 Fair Value 10% Sensitivity
$ $ Financial instruments at fair value through profit or loss -Bonds 58,892,502 5,889,250 -Options 27,125 2,713 -Forwards Exchange Contracts 374,772 37,477 59,294,399 5,929,440
31 Dec 31 Dec 2016 2016 Fair Value 10% Sensitivity
$ $ Financial instruments at fair value through profit or loss -Bonds 34,108,968 3,410,897 -Forwards Exchange Contracts 448,908 44,891 34,557,876 3,455,788
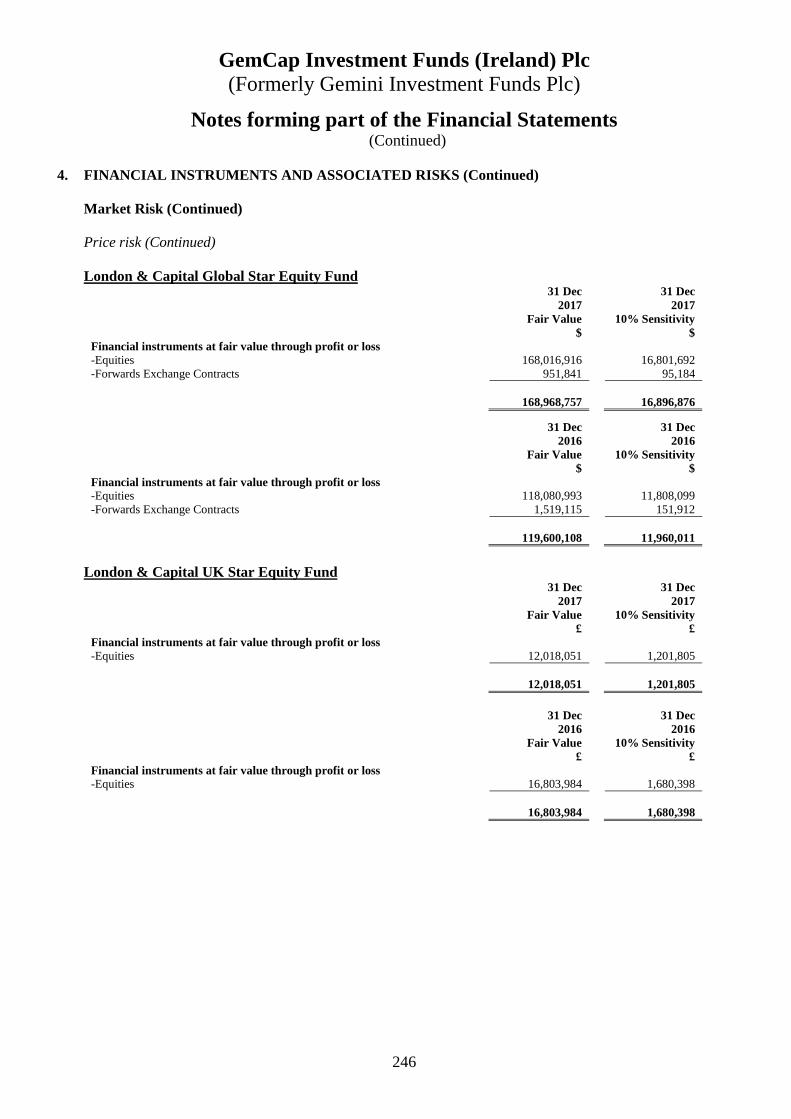
GemCap Investment Funds (Ireland) Plc (Formerly Gemini Investment Funds Plc)
246
Notes forming part of the Financial Statements (Continued)
4. FINANCIAL INSTRUMENTS AND ASSOCIATED RISKS (Cont inued)
Market Risk (Continued) Price risk (Continued) London & Capital Global Star Equity Fund 31 Dec 31 Dec 2017 2017 Fair Value 10% Sensitivity
$ $ Financial instruments at fair value through profit or loss -Equities 168,016,916 16,801,692 -Forwards Exchange Contracts 951,841 95,184 168,968,757 16,896,876
31 Dec 31 Dec 2016 2016 Fair Value 10% Sensitivity
$ $ Financial instruments at fair value through profit or loss -Equities 118,080,993 11,808,099 -Forwards Exchange Contracts 1,519,115 151,912 119,600,108 11,960,011
London & Capital UK Star Equity Fund 31 Dec 31 Dec 2017 2017 Fair Value 10% Sensitivity
£ £ Financial instruments at fair value through profit or loss -Equities 12,018,051 1,201,805 12,018,051 1,201,805
31 Dec 31 Dec 2016 2016 Fair Value 10% Sensitivity
£ £ Financial instruments at fair value through profit or loss -Equities 16,803,984 1,680,398 16,803,984 1,680,398
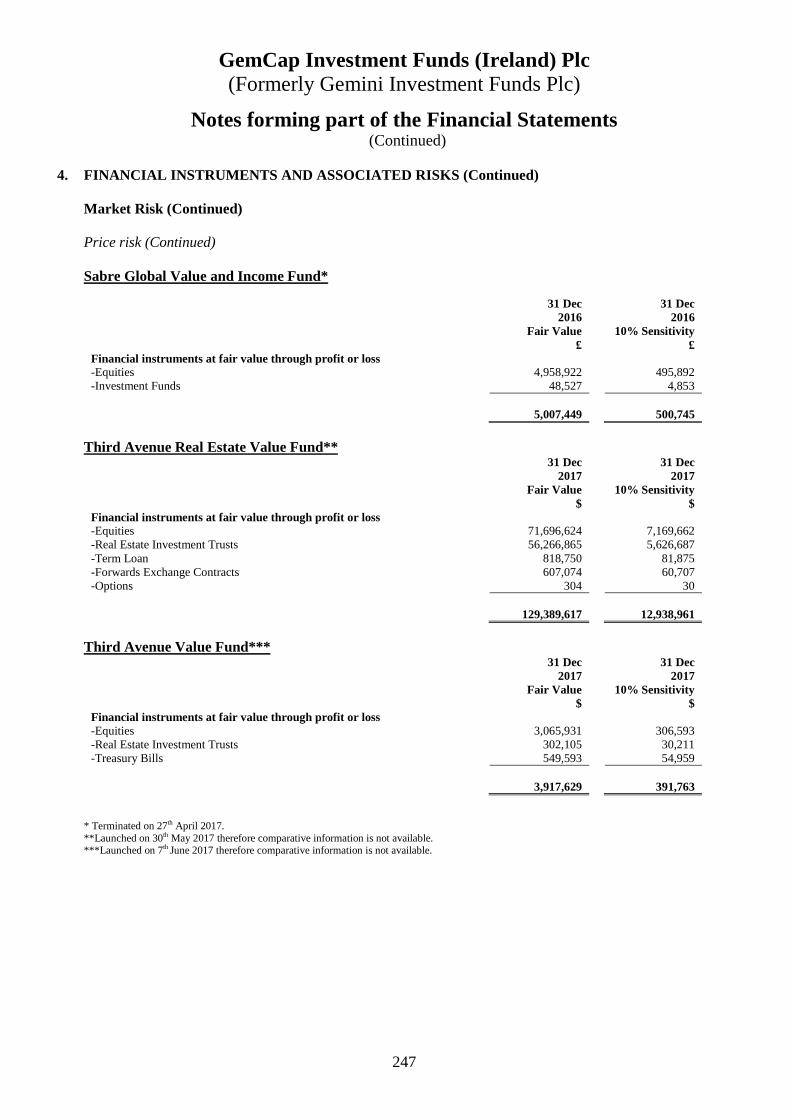
GemCap Investment Funds (Ireland) Plc (Formerly Gemini Investment Funds Plc)
247
Notes forming part of the Financial Statements (Continued)
4. FINANCIAL INSTRUMENTS AND ASSOCIATED RISKS (Cont inued)
Market Risk (Continued) Price risk (Continued) Sabre Global Value and Income Fund* 31 Dec 31 Dec 2016 2016 Fair Value 10% Sensitivity
£ £ Financial instruments at fair value through profit or loss -Equities 4,958,922 495,892 -Investment Funds 48,527 4,853 5,007,449 500,745
Third Avenue Real Estate Value Fund** 31 Dec 31 Dec 2017 2017 Fair Value 10% Sensitivity
$ $ Financial instruments at fair value through profit or loss -Equities 71,696,624 7,169,662 -Real Estate Investment Trusts 56,266,865 5,626,687 -Term Loan 818,750 81,875 -Forwards Exchange Contracts 607,074 60,707 -Options 304 30 129,389,617 12,938,961
Third Avenue Value Fund*** 31 Dec 31 Dec 2017 2017 Fair Value 10% Sensitivity
$ $ Financial instruments at fair value through profit or loss -Equities 3,065,931 306,593 -Real Estate Investment Trusts 302,105 30,211 -Treasury Bills 549,593 54,959 3,917,629 391,763
* Terminated on 27th April 2017. **Launched on 30th May 2017 therefore comparative information is not available. ***Launched on 7th June 2017 therefore comparative information is not available.

GemCap Investment Funds (Ireland) Plc (Formerly Gemini Investment Funds Plc)
248
Notes forming part of the Financial Statements (Continued)
4. FINANCIAL INSTRUMENTS AND ASSOCIATED RISKS (C ontinued)
Market Risk (Continued) Price risk (Continued) Disclosures of Limitations of the Analysis
• Sensitivity analysis was based on historical data and could not take account of the fact that future market price movements, correlations between markets and levels of market liquidity in conditions of market stress may bore no relation to historical patterns.
• The market price risk information was a relative estimate of risk rather than a precise and accurate number.
• The market price risk information represented a hypothetical outcome and was not intended to be predictive.
• Future market conditions could have varied significantly from those experienced in the past.
Interest rate risk
Interest rate risk is the risk that the fair value or future cash flows of a financial instrument will fluctuate because of changes in prevailing interest rates. The Company is exposed to interest rate risk through its investments in securities with floating rates of interest and its cash balances. High yield securities as an asset class have traditionally been less sensitive to interest rate risk relative to other asset classes such as investment grade bonds. However, when interest rates decline, the value of a Sub-Fund’s portfolio invested in fixed-rate obligations can be expected to rise. Conversely, when interest rates rise, the value of a Sub-Fund’s portfolio investments in fixed-rate obligations can be expected to decline. To mitigate the negative impact of a rising interest rate environment, the Investment Manager manages the Company’s interest rate risk on a daily basis in accordance with policies and procedures in place.
The interest rate risk in relation to cash holdings is not regarded as a material risk. Other than the Sub-Funds shown in the following tables, the Company’s other Sub-Funds are not exposed to significant interest rate risk as the majority of the Company’s financial assets are equity shares and other instruments which neither pay interest nor have a maturity date.
The interest rate profile of fixed income securities and other interest bearing instruments held by the Company for the financial year ended 31st December 2017 and 31st December 2016 is as follows:
AHFM Defined Returns Fund
Fixed Rate Floating Rate Non-interest Total Interest Interest bearing
31 Dec 2017 £ £ £ £ Assets Bonds 261,300,189 100,824,568 78,215,557 440,340,314
Swaps - 1,722,348 22,218,746 23,941,094
Cash at Bank - 14,197,942 - 14,197,942
Other receivables - - 3,619,892 3,619,892
261,300,189 116,744,858 104,054,195 482,099,242 Liabilities
Swaps - 4,946,964 - 4,946,964
Other Liabilities - - 1,924,378 1,924,378 - 4,946,964 1,924,378 6,871,342

GemCap Investment Funds (Ireland) Plc (Formerly Gemini Investment Funds Plc)
249
Notes forming part of the Financial Statements (Continued)
4. FINANCIAL INSTRUMENTS AND ASSOCIATED RISKS (C ontinued)
Market Risk (Continued) Interest rate risk (Continued) AHFM Defined Returns Fund (Continued)
Fixed Rate Floating Rate Non-interest Total Interest Interest bearing
31 Dec 2016 £ £ £ £ Assets Bonds 92,391,991 32,399,576 40,972,420 165,763,987
Swaps - 320,978 16,993,501 17,314,479
Cash at Bank - 16,855,492 - 16,855,492
Other receivables - - 1,019,582 1,019,582
92,391,991 49,576,046 58,985,503 200,953,540 Liabilities
Swaps - - 5,563,546 5,563,546
Other Liabilities - - 564,351 564,351 - - 6,127,897 6,127,897
AHFM US Enhanced Equity Fund
Fixed Rate Floating Rate Non-interest Total Interest Interest bearing 31 Dec 2017 $ $ $ $ Assets Bonds 24,674,422 5,895,579 - 30,570,001
Swaps - - 42,432,853 42,432,853
Cash at bank - 2,690,133 - 2,690,133
Other receivables - - 1,070,109 1,070,109
24,674,422 8,585,712 43,502,962 76,763,096 Liabilities Swaps - 1,982,862 28,631,681 30,614,543 Other Liabilities - 677,470 305,387 982,857 - 2,660,332 28,937,068 31,597,400
Fixed Rate Floating Rate Non-interest Total Interest Interest bearing 31 Dec 2016 $ $ $ $ Assets Bonds 16,351,898 5,432,004 - 21,783,902
Swaps - - 27,488,405 27,488,405
Cash at bank - 3,104,356 - 3,104,356
Other receivables - - 684,612 684,612
16,351,898 8,536,360 28,173,017 53,061,275 Liabilities Swaps - 1,955,801 19,993,490 21,949,291 Other Liabilities - - 558,127 558,127 - 1,955,801 20,551,617 22,507,418
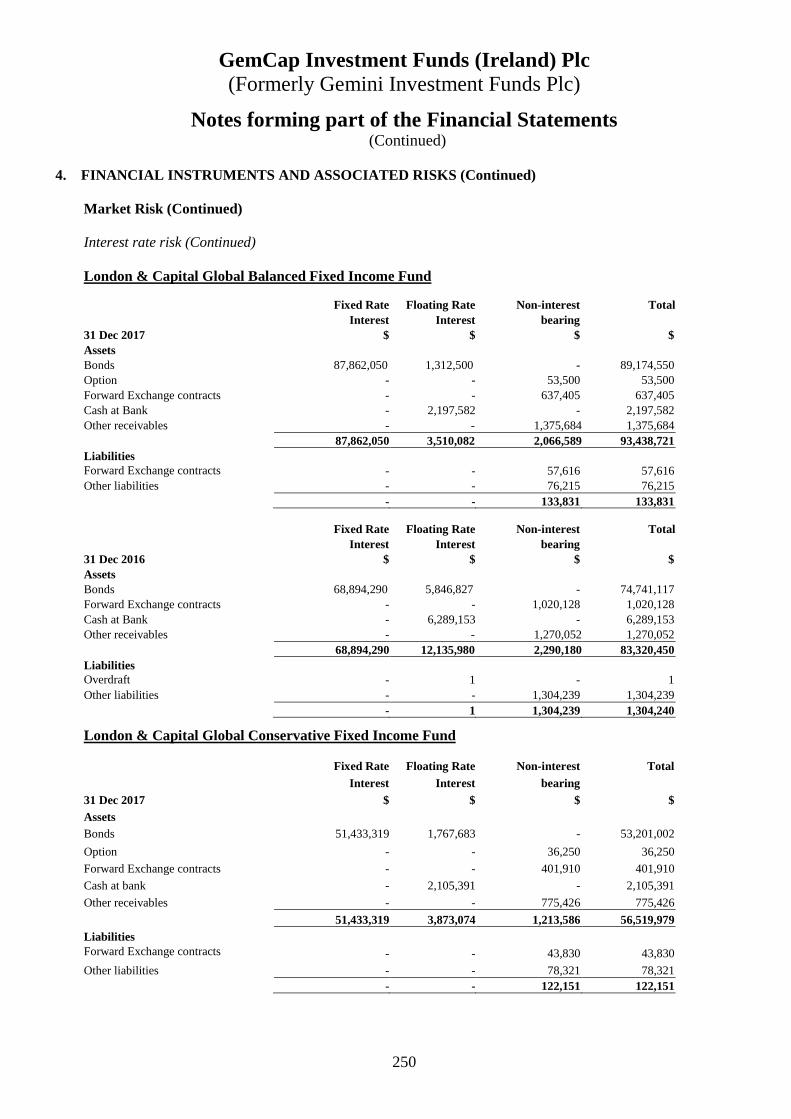
GemCap Investment Funds (Ireland) Plc (Formerly Gemini Investment Funds Plc)
250
Notes forming part of the Financial Statements (Continued)
4. FINANCIAL INSTRUMENTS AND ASSOCIATED RISKS (C ontinued)
Market Risk (Continued) Interest rate risk (Continued) London & Capital Global Balanced Fixed Income Fund Fixed Rate Floating Rate Non-interest Total Interest Interest bearing
31 Dec 2017 $ $ $ $ Assets Bonds 87,862,050 1,312,500 - 89,174,550 Option - - 53,500 53,500 Forward Exchange contracts - - 637,405 637,405 Cash at Bank - 2,197,582 - 2,197,582 Other receivables - - 1,375,684 1,375,684 87,862,050 3,510,082 2,066,589 93,438,721 Liabilities Forward Exchange contracts - - 57,616 57,616 Other liabilities - - 76,215 76,215 - - 133,831 133,831 Fixed Rate Floating Rate Non-interest Total Interest Interest bearing
31 Dec 2016 $ $ $ $ Assets Bonds 68,894,290 5,846,827 - 74,741,117 Forward Exchange contracts - - 1,020,128 1,020,128 Cash at Bank - 6,289,153 - 6,289,153 Other receivables - - 1,270,052 1,270,052 68,894,290 12,135,980 2,290,180 83,320,450 Liabilities Overdraft - 1 - 1 Other liabilities - - 1,304,239 1,304,239 - 1 1,304,239 1,304,240
London & Capital Global Conservative Fixed Income Fund
Fixed Rate Floating Rate Non-interest Total Interest Interest bearing 31 Dec 2017 $ $ $ $ Assets Bonds 51,433,319 1,767,683 - 53,201,002
Option - - 36,250 36,250
Forward Exchange contracts - - 401,910 401,910
Cash at bank - 2,105,391 - 2,105,391
Other receivables - - 775,426 775,426
51,433,319 3,873,074 1,213,586 56,519,979 Liabilities Forward Exchange contracts - - 43,830 43,830
Other liabilities - - 78,321 78,321 - - 122,151 122,151
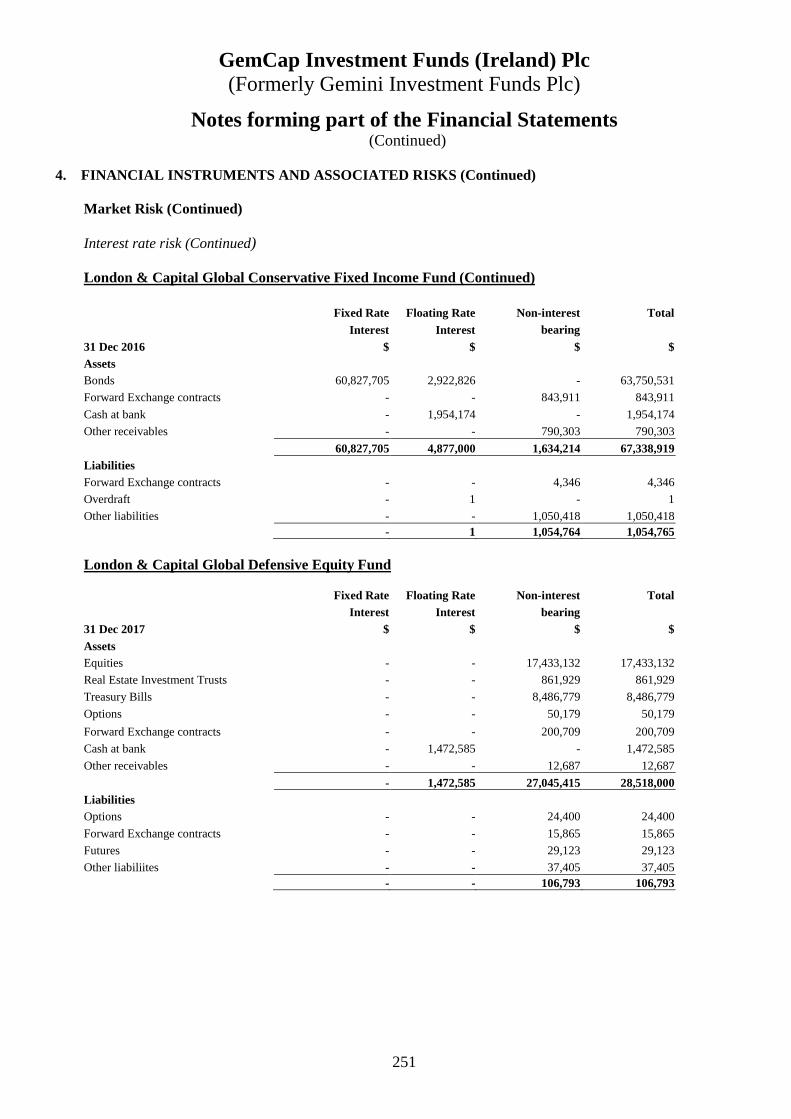
GemCap Investment Funds (Ireland) Plc (Formerly Gemini Investment Funds Plc)
251
Notes forming part of the Financial Statements (Continued)
4. FINANCIAL INSTRUMENTS AND ASSOCIATED RISKS (C ontinued)
Market Risk (Continued) Interest rate risk (Continued) London & Capital Global Conservative Fixed Income Fund (Continued)
Fixed Rate Floating Rate Non-interest Total Interest Interest bearing 31 Dec 2016 $ $ $ $ Assets Bonds 60,827,705 2,922,826 - 63,750,531
Forward Exchange contracts - - 843,911 843,911
Cash at bank - 1,954,174 - 1,954,174
Other receivables - - 790,303 790,303
60,827,705 4,877,000 1,634,214 67,338,919 Liabilities
Forward Exchange contracts - - 4,346 4,346
Overdraft - 1 - 1
Other liabilities - - 1,050,418 1,050,418 - 1 1,054,764 1,054,765 London & Capital Global Defensive Equity Fund
Fixed Rate Floating Rate Non-interest Total Interest Interest bearing 31 Dec 2017 $ $ $ $ Assets Equities - - 17,433,132 17,433,132
Real Estate Investment Trusts - - 861,929 861,929
Treasury Bills - - 8,486,779 8,486,779
Options - - 50,179 50,179
Forward Exchange contracts - - 200,709 200,709
Cash at bank - 1,472,585 - 1,472,585
Other receivables - - 12,687 12,687
- 1,472,585 27,045,415 28,518,000 Liabilities
Options - - 24,400 24,400
Forward Exchange contracts - - 15,865 15,865
Futures - - 29,123 29,123
Other liabiliites - - 37,405 37,405 - - 106,793 106,793
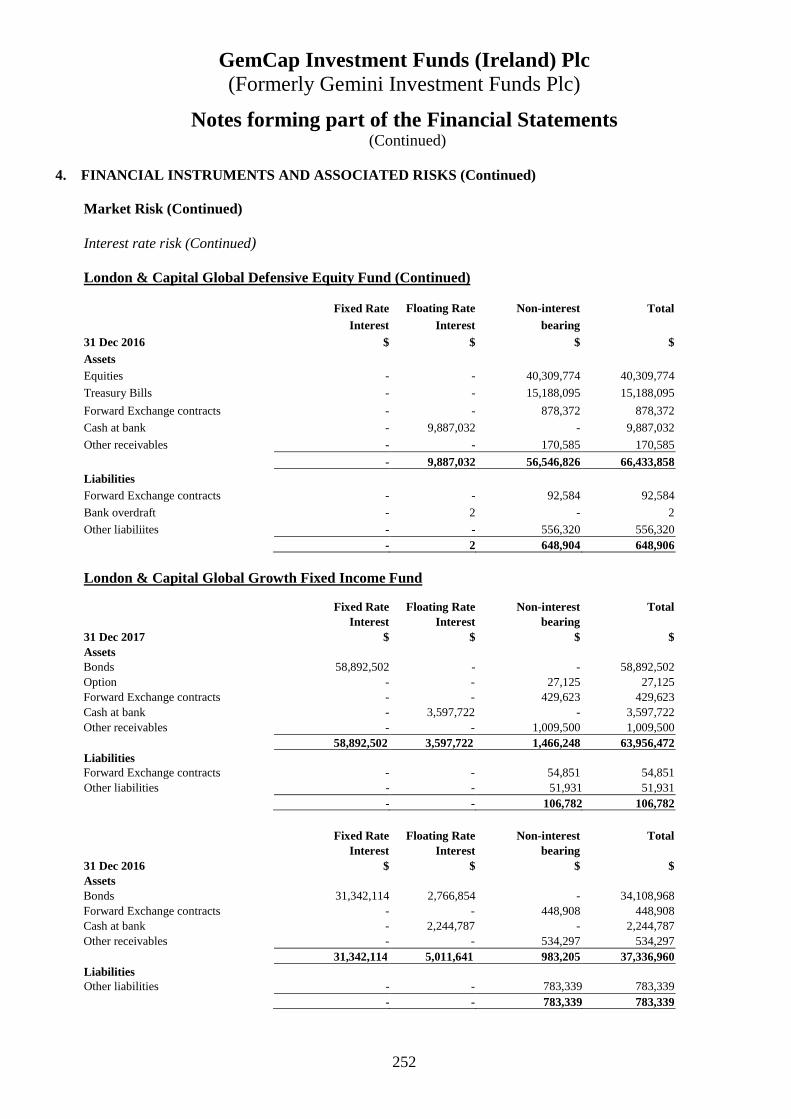
GemCap Investment Funds (Ireland) Plc (Formerly Gemini Investment Funds Plc)
252
Notes forming part of the Financial Statements (Continued)
4. FINANCIAL INSTRUMENTS AND ASSOCIATED RISKS (C ontinued)
Market Risk (Continued) Interest rate risk (Continued) London & Capital Global Defensive Equity Fund (Continued)
Fixed Rate Floating Rate Non-interest Total Interest Interest bearing 31 Dec 2016 $ $ $ $ Assets Equities - - 40,309,774 40,309,774
Treasury Bills - - 15,188,095 15,188,095
Forward Exchange contracts - - 878,372 878,372
Cash at bank - 9,887,032 - 9,887,032
Other receivables - - 170,585 170,585
- 9,887,032 56,546,826 66,433,858 Liabilities
Forward Exchange contracts - - 92,584 92,584
Bank overdraft - 2 - 2
Other liabiliites - - 556,320 556,320 - 2 648,904 648,906 London & Capital Global Growth Fixed Income Fund Fixed Rate Floating Rate Non-interest Total Interest Interest bearing 31 Dec 2017 $ $ $ $ Assets Bonds 58,892,502 - - 58,892,502 Option - - 27,125 27,125 Forward Exchange contracts - - 429,623 429,623 Cash at bank - 3,597,722 - 3,597,722 Other receivables - - 1,009,500 1,009,500 58,892,502 3,597,722 1,466,248 63,956,472 Liabilities Forward Exchange contracts - - 54,851 54,851 Other liabilities - - 51,931 51,931 - - 106,782 106,782 Fixed Rate Floating Rate Non-interest Total Interest Interest bearing 31 Dec 2016 $ $ $ $ Assets Bonds 31,342,114 2,766,854 - 34,108,968 Forward Exchange contracts - - 448,908 448,908 Cash at bank - 2,244,787 - 2,244,787 Other receivables - - 534,297 534,297 31,342,114 5,011,641 983,205 37,336,960 Liabilities Other liabilities - - 783,339 783,339 - - 783,339 783,339

GemCap Investment Funds (Ireland) Plc (Formerly Gemini Investment Funds Plc)
253
Notes forming part of the Financial Statements (Continued)
4. FINANCIAL INSTRUMENTS AND ASSOCIATED RISKS (C ontinued)
Market Risk (Continued)
Interest rate risk (Continued) Principal Asset Allocation Fund
Fixed Rate Floating Rate Non-interest Total Interest Interest bearing 31 Dec 2017 $ $ $ $ Assets Bonds - - 4,563,198 4,563,198 Investment Funds - - 14,506,786 14,506,786 Treasury Bills - - 10,923,666 10,923,666 Warrants - - 2,310,640 2,310,640 Forward Exchange contracts - - 530,366 530,366 Futures - 54,349 80,289 134,638 Cash at bank - 3,518,308 - 3,518,308 Other receivables - - 636,417 636,417 - 3,572,657 33,551,362 37,124,019 Liabilities Overdraft - 350,368 - 350,368 Forward Exchange contracts - - 44,121 44,121 Futures - 29,535 249,201 278,736 Other liabilities - - 148,226 148,226 - 379,903 441,548 821,451
Fixed Rate Floating Rate Non-interest Total Interest Interest bearing 31 Dec 2016 $ $ $ $ Assets Bonds 4,138,770 - - 4,138,770 Investment Funds - - 13,672,036 13,672,036 Treasury Bills - - 10,681,808 10,681,808 Warrants - - 2,678,721 2,678,721 Forward Exchange contracts - - 13,408 13,408 Futures - 29,535 231,254 260,789 Cash at bank - 5,934,983 - 5,934,983 Other receivables - - 510,557 510,557 4,138,770 5,964,518 27,787,784 37,891,072 Liabilities Overdraft - 194,988 - 194,988 Forward Exchange contracts - - 65,979 65,979 Futures - - 93,331 93,331 Other liabilities - - 197,766 197,766 - 194,988 357,076 552,064
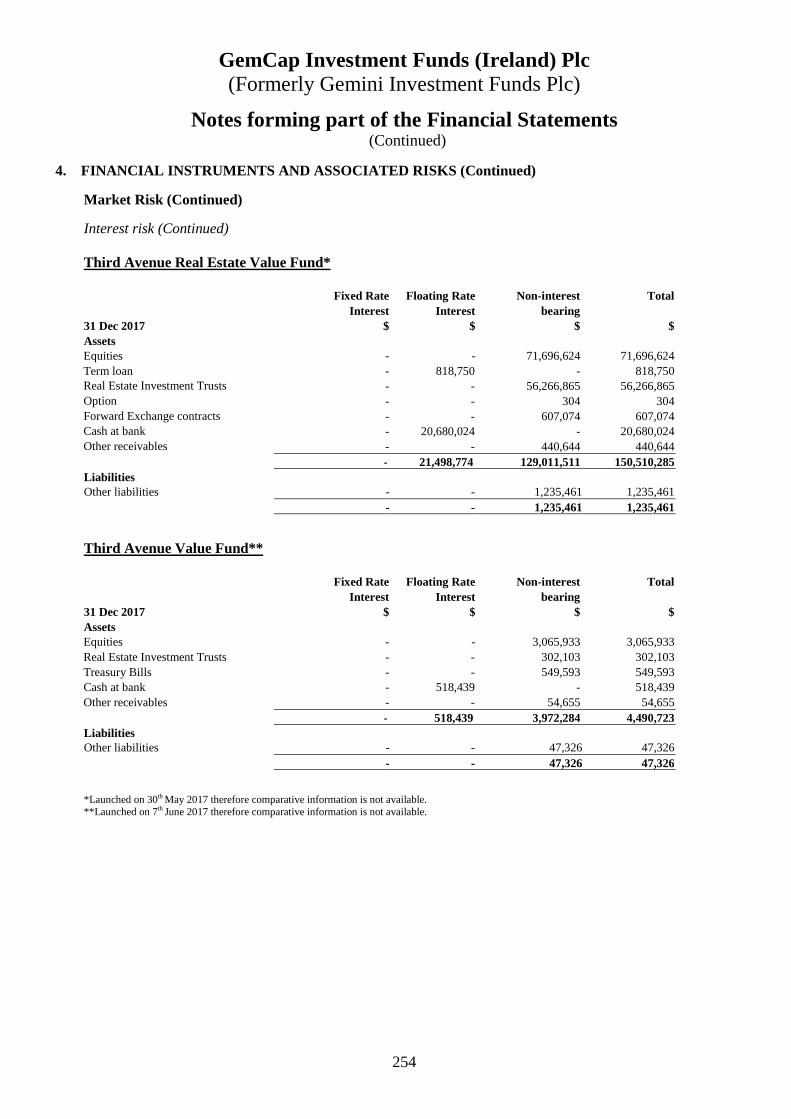
GemCap Investment Funds (Ireland) Plc (Formerly Gemini Investment Funds Plc)
254
Notes forming part of the Financial Statements (Continued)
4. FINANCIAL INSTRUMENTS AND ASSOCIATED RISKS (C ontinued)
Market Risk (Continued)
Interest risk (Continued) Third Avenue Real Estate Value Fund*
Third Avenue Value Fund**
*Launched on 30th May 2017 therefore comparative information is not available. **Launched on 7th June 2017 therefore comparative information is not available.
Fixed Rate Floating Rate Non-interest Total Interest Interest bearing 31 Dec 2017 $ $ $ $ Assets Equities - - 71,696,624 71,696,624 Term loan - 818,750 - 818,750 Real Estate Investment Trusts - - 56,266,865 56,266,865 Option - - 304 304 Forward Exchange contracts - - 607,074 607,074 Cash at bank - 20,680,024 - 20,680,024 Other receivables - - 440,644 440,644 - 21,498,774 129,011,511 150,510,285 Liabilities Other liabilities - - 1,235,461 1,235,461 - - 1,235,461 1,235,461
Fixed Rate Floating Rate Non-interest Total Interest Interest bearing 31 Dec 2017 $ $ $ $ Assets Equities - - 3,065,933 3,065,933 Real Estate Investment Trusts - - 302,103 302,103 Treasury Bills - - 549,593 549,593 Cash at bank - 518,439 - 518,439 Other receivables - - 54,655 54,655 - 518,439 3,972,284 4,490,723 Liabil ities Other liabilities - - 47,326 47,326 - - 47,326 47,326
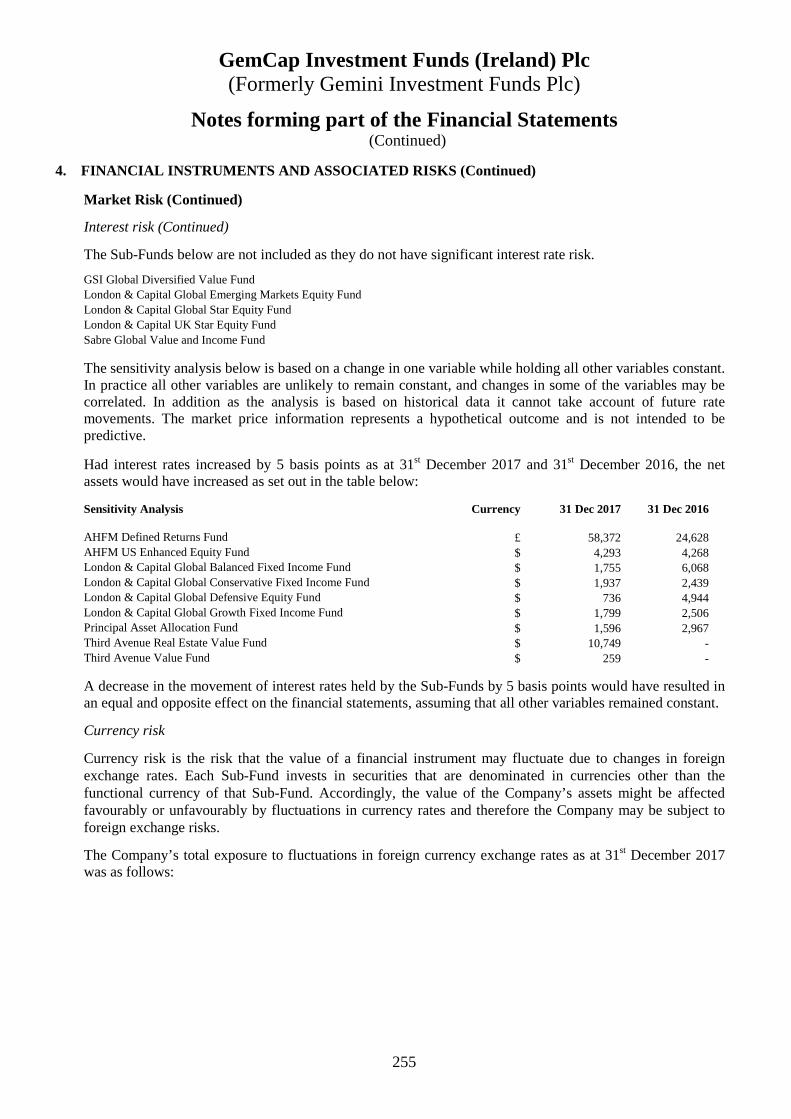
GemCap Investment Funds (Ireland) Plc (Formerly Gemini Investment Funds Plc)
255
Notes forming part of the Financial Statements (Continued)
4. FINANCIAL INSTRUMENTS AND ASSOCIATED RISKS (C ontinued)
Market Risk (Continued)
Interest risk (Continued)
The Sub-Funds below are not included as they do not have significant interest rate risk.
GSI Global Diversified Value Fund London & Capital Global Emerging Markets Equity Fund London & Capital Global Star Equity Fund London & Capital UK Star Equity Fund Sabre Global Value and Income Fund
The sensitivity analysis below is based on a change in one variable while holding all other variables constant. In practice all other variables are unlikely to remain constant, and changes in some of the variables may be correlated. In addition as the analysis is based on historical data it cannot take account of future rate movements. The market price information represents a hypothetical outcome and is not intended to be predictive.
Had interest rates increased by 5 basis points as at 31st December 2017 and 31st December 2016, the net assets would have increased as set out in the table below: Sensitivity Analysis Currency 31 Dec 2017 31 Dec 2016 AHFM Defined Returns Fund £ 58,372 24,628AHFM US Enhanced Equity Fund $ 4,293 4,268London & Capital Global Balanced Fixed Income Fund $ 1,755 6,068London & Capital Global Conservative Fixed Income Fund $ 1,937 2,439London & Capital Global Defensive Equity Fund $ 736 4,944London & Capital Global Growth Fixed Income Fund $ 1,799 2,506Principal Asset Allocation Fund $ 1,596 2,967Third Avenue Real Estate Value Fund $ 10,749 -Third Avenue Value Fund $ 259 -
A decrease in the movement of interest rates held by the Sub-Funds by 5 basis points would have resulted in an equal and opposite effect on the financial statements, assuming that all other variables remained constant.
Currency risk
Currency risk is the risk that the value of a financial instrument may fluctuate due to changes in foreign exchange rates. Each Sub-Fund invests in securities that are denominated in currencies other than the functional currency of that Sub-Fund. Accordingly, the value of the Company’s assets might be affected favourably or unfavourably by fluctuations in currency rates and therefore the Company may be subject to foreign exchange risks.
The Company’s total exposure to fluctuations in foreign currency exchange rates as at 31st December 2017 was as follows:

GemCap Investment Funds (Ireland) Plc (Formerly Gemini Investment Funds Plc)
256
Notes forming part of the Financial Statements (Continued)
4. FINANCIAL INSTRUMENTS AND ASSOCIATED RISKS (C ontinued)
Market Risk (Continued) Currency risk (continued)
AHFM US Enhanced Equity Fund
Net Other Net Foreign Sensitivity analysis Total Monetary Net Currency Net of Net Exposure Investments Assets/Liabilities Assets/Liabilities Derivatives Exposure (10% movement) 2017 2017 2017 2017 2017 2017 $ $ $ $ $ $ EUR - 7 - - 7 1
GBP (44,540) - - - (44,540) (4,454) (44,540) 7 - - (44,533) (4,453)
GSI Global Diversified Value Fund Net Other Net Foreign Sensitivity analysis Total Monetary Net Currency Net of Net Exposure Investments Assets/Liabilities Assets/Liabilities Derivatives Exposure (10% movement) 2017 2017 2017 2017 2017 2017 $ $ $ $ $ $ AU$ 404,218 - 318 - 404,536 40,454 CA$ 619,151 - 562 - 619,713 61,971 CHF 358,421 - - - 358,421 35,842 DKK 121,156 - - - 121,156 12,116 EUR 1,958,270 - 2,050 - 1,960,320 196,032 GBP 1,126,490 - 2,105 - 1,128,595 112,860 ILS 160,479 - - - 160,479 16,048 HK$ 46,619 - - - 46,619 4,662 JPY 1,608,788 - 1,434 - 1,610,222 161,022 KRW 387,217 - - - 387,217 38,722 NOK 82,349 - - - 82,349 8,235 NZD 20,762 - - - 20,762 2,076 SEK 194,665 - - - 194,665 19,467 SG$ 60,857 - 330 - 61,187 6,119 7,149,442 - 6,799 - 7,156,241 715,626

GemCap Investment Funds (Ireland) Plc (Formerly Gemini Investment Funds Plc)
257
Notes forming part of the Financial Statements (Continued)
4. FINANCIAL INSTRUMENTS AND ASSOCIATED RISKS (C ontinued)
Market Risk (Continued) Currency risk (Continued)
London & Capital Global Balanced Fixed Income Fund
Net Other Net Foreign Sensitivity analysis Total Monetary Net Currency Net of Net Exposure Investments Assets/Liabilities Assets/Liabilities Derivatives Exposure (10% movement) 2017 2017 2017 2017 2017 2017 $ $ $ $ $ $ CA$ 995,590 26,587 - (1,038,114) (15,937) (1,594) EUR 13,947,294 325,077 - (10,534,014) 3,738,357 373,836 GBP 11,140,977 221,213 - 62,715,939 74,078,129 7,407,813 INR 2,389,216 - - - 2,389,216 238,922 28,473,077 572,877 - 51,143,811 80,189,765 8,018,977
London & Capital Global Conservative Fixed Income Fund
Net Other Net Foreign Sensitivity analysis Total Monetary Net Currency Net of Net Exposure Investments Assets/Liabilities Assets/Liabilities Derivatives Exposure (10% movement) 2017 2017 2017 2017 2017 2017 $ $ $ $ $ $ CA$ 1,194,708 32,068 - (1,277,679) (50,903) (5,090) EUR 11,387,606 236,183 - (11,336,644) 287,145 28,715 GBP 7,117,662 282,334 - 41,201,199 48,601,195 4,860,120 NOK - 3 - - 3 - 19,699,976 550,588 - 28,586,876 48,837,440 4,883,745
London & Capital Global Defensive Equity Fund
Net Other Net Foreign Sensitivity analysis Total Monetary Net Currency Net of Net Exposure Investments Assets/Liabilities Assets/Liabilities Derivatives Exposure (10% movement) 2017 2017 2017 2017 2017 2017 $ $ $ $ $ $ AU$ - 296 - - 296 30 CHF 835,420 50,409 - (756,953) 128,876 12,888 EUR 3,511,039 272,815 - (2,737,085) 1,046,769 104,677 GBP 1,373,337 108,389 - 22,849,663 24,331,389 2,433,139 JPY - 1 - - 1 - SG$ - 15,111 - - 15,111 1,511 ZAR - 61 - - 61 6 5,719,796 447,082 - 19,355,625 25,522,503 2,552,251

GemCap Investment Funds (Ireland) Plc (Formerly Gemini Investment Funds Plc)
258
Notes forming part of the Financial Statements (Continued)
4. FINANCIAL INSTRUMENTS AND ASSOCIATED RISKS (C ontinued)
Market Risk (Continued)
Currency risk (Continued) London & Capital Global Emerging Markets Equity Fund Net Other Net Foreign Sensitivity analysis Total Monetary Net Currency Net of Net Exposure Investments Assets/Liabilities Assets/Liabilities Derivatives Exposure (10% movement) 2017 2017 2017 2017 2017 2017 $ $ $ $ $ $ AU$ - 30,368 - - 30,368 3,037 BRL 1,976,526 - 6,104 (1,487,347) 495,283 49,528 CLP 1,070,652 - - (749,055) 321,597 32,160 EUR 1,064,569 29,840 - (813,520) 280,889 28,089 GBP - 11,255 - 17,691,940 17,703,195 1,770,320 HK$ 2,882,655 1,619,204 - - 4,501,859 450,186 IDR 965,814 - - (636,500) 329,314 32,931 INR 964,708 - 121,386 - 1,086,094 108,609 JPY - 45,261 - - 45,261 4,526 KRW 898,076 - 21,834 (659,428) 260,482 26,048 MXN 2,812,156 130,977 - (2,486,559) 456,574 45,657 MYR 953,072 - (55,583) - 897,489 89,749 PHP 952,520 - - - 952,520 95,252 PLN 1,081,719 206,914 - (938,177) 350,456 35,046 SG$ 904,855 5,614 - (810,722) 99,747 9,975 ZAR - 32 - - 32 3 16,527,322 2,079,465 93,741 9,110,632 27,811,160 2,781,116
London & Capital Global Growth Fixed Income Fund
Net Other Net Foreign Sensitivity analysis Total Monetary Net Currency Net of Net Exposure Investments Assets/Liabilities Assets/Liabilities Derivatives Exposure (10% movement) 2017 2017 2017 2017 2017 2017 $ $ $ $ $ $ CA$ - 157,865 - - 157,865 15,787 EUR 14,586,061 393,448 - (7,911,751) 7,067,758 706,776 GBP 8,854,529 289,724 - 36,297,639 45,441,892 4,544,189 INR 1,433,530 - - - 1,433,530 143,353 24,874,120 841,037 - 28,385,888 54,101,045 5,410,105

GemCap Investment Funds (Ireland) Plc (Formerly Gemini Investment Funds Plc)
259
Notes forming part of the Financial Statements (Continued)
4. FINANCIAL INSTRUMENTS AND ASSOCIATED RISKS (C ontinued)
Market Risk (Continued)
Currency risk (Continued) London & Capital Global Star Equity Fund
Net Other Net Foreign Sensitivity analysis Total Monetary Net Currency Net of Net Exposure Investments Assets/Liabilities Assets/Liabilities Derivatives Exposure (10% movement) 2017 2017 2017 2017 2017 2017 $ $ $ $ $ $ CHF 7,415,932 74,401 - (6,715,900) 774,433 77,443 EUR 38,244,687 520,072 - (29,634,316) 9,130,443 913,044 GBP 22,500,639 1,328,511 - 112,366,154 136,195,304 13,619,530 68,161,258 1,922,984 - 76,015,938 146,100,180 14,610,017
London & Capital UK Star Equity Fund
Net Other Net Foreign Sensitivity analysis Total Monetary Net Currency Net of Net Exposure Investments Assets/Liabilities Assets/Liabilities Derivatives Exposure (10% movement) 2017 2017 2017 2017 2017 2017 £ £ £ £ £ £ EUR - 19,364 - - 19,364 1,936 USD - 8,198 - - 8,198 820 - 27,562 - - 27,562 2,756 Principal Asset Allocation Fund Net Other Net Foreign Sensitivity analysis Total Monetary Net Currency Net of Net Exposure Investments Assets/Liabilities Assets/Liabilities Derivatives Exposure (10% movement) 2017 2017 2017 2017 2017 2017 £ £ £ £ £ £ EUR 2,252,129 898,845 65,425 (1,055,920) 2,160,479 216,048 JPY 15,677 256,614 (15,579) - 256,712 25,671 USD 18,271,484 571,791 (126,563) (16,660,485) 2,056,227 205,623 20,539,290 1,727,250 (76,717) (17,716,405) 4,473,418 447,342

GemCap Investment Funds (Ireland) Plc (Formerly Gemini Investment Funds Plc)
260
Notes forming part of the Financial Statements (Continued)
4. FINANCIAL INSTRUMENTS AND ASSOCIATED RISKS (C ontinued)
Market Risk (Continued) Currency risk (Continued)
Sabre Global Value and Income Fund
Net Other Net Foreign Sensitivity analysis Total Monetary Net Currency Net of Net Exposure Investments Assets/Liabilities Assets/Liabilities Derivatives Exposure (10% movement) 2017 2017 2017 2017 2017 2017 £ £ £ £ £ £ EUR - - (4,438) - (4,438) (444) USD - - (1,257) - (1,257) (126) - - (5,695) - (5,695) (570)
Third Avenue Real Estate Value Fund* Net Other Net Foreign Sensitivity analysis Total Monetary Net Currency Net of Net Exposure Investments Assets/Liabilities Assets/Liabilities Derivatives Exposure (10% movement) 2017 2017 2017 2017 2017 2017 $ $ $ $ $ $ AU$ 6,062,091 - - - 6,062,091 606,209 EUR - 136,544 - 71,774,258 71,910,802 7,191,080 GBP 19,048,261 - (26,674) - 19,021,587 1,902,159 HK$ 24,881,413 - (41,238) - 24,840,175 2,484,018 SG$ 3,768,518 - - - 3,768,518 376,852 53,760,283 136,544 (67,912) 71,774,258 125,603,173 12,560,318
Third Avenue Value Fund** Net Other Net Foreign Sensitivity analysis Total Monetary Net Currency Net of Net Exposure Investments Assets/Liabilities Assets/Liabilities Derivatives Exposure (10% movement) 2017 2017 2017 2017 2017 2017 $ $ $ $ $ $ CA$ 182,592 - - - 182,592 18,259 CHF 86,291 - - - 86,291 8,629 EUR 176,231 - 2,373 - 178,604 17,860 GBP - - (1,007) - (1,007) (101) HK$ 461,590 - (478) - 461,112 46,111 JPY 99,330 - - - 99,330 9,933 SEK 147,895 - - - 147,895 14,790 1,153,929 - 888 - 1,154,817 115,481
*Launched on 30th May 2017 therefore comparative information is not available. **Launched on 7th June 2017 therefore comparative information is not available.
There was no currency exposure on AHFM Defined Returns Fund as at 31st December 2017.
A strengthening of 10% of the relevant Sub-Fund’s functional currency against the currencies in the above tables would have resulted in losses to the amounts shown in the Sensitivity Analysis column. A weakening of the functional currency against these currencies would have resulted in an equal but opposite effect.

GemCap Investment Funds (Ireland) Plc (Formerly Gemini Investment Funds Plc)
261
Notes forming part of the Financial Statements (Continued)
4. FINANCIAL INSTRUMENTS AND ASSOCIATED RISKS (C ontinued)
Market Risk (Continued)
Currency risk (Continued) The Company’s total exposure to fluctuations in foreign currency exchange rates as at 31st December 2016 was as follows:
AHFM Defined Returns Fund
Net Other Net Foreign Sensitivity analysis Total Monetary Net Currency Net of Net Exposure Investments Assets/Liabilities Assets/Liabilities Derivatives Exposure (10% movement) 2016 2016 2016 2016 2016 2016 £ £ £ £ £ £ EUR - 429 - - 429 43 - 429 - - 429 43
AHFM US Enhanced Equity Fund Net Other Net Foreign Sensitivity analysis Total Monetary Net Currency Net of Net Exposure Investments Assets/Liabilities Assets/Liabilities Derivatives Exposure (10% movement) 2016 2016 2016 2016 2016 2016 $ $ $ $ $ $ EUR - 298 - - 298 30
GBP 21,783,902 - - (2,765,738) 19,018,164 1,901,816 21,783,902 298 - (2,765,738) 19,018,462 1,901,846 GSI Global Diversified Value Fund Net Other Net Foreign Sensitivity analysis Total Monetary Net Currency Net of Net Exposure Investments Assets/Liabilities Assets/Liabilities Derivatives Exposure (10% movement) 2016 2016 2016 2016 2016 2016 $ $ $ $ $ $ AU$ 355,260 - 141 - 355,401 35,540 CA$ 550,039 - 648 - 550,687 55,069 CHF 255,690 - - - 255,690 25,569 DKK 108,739 - - - 108,739 10,874 EUR 1,506,643 - 2,903 - 1,509,546 150,955 GBP 857,527 - 1,481 - 859,008 85,901 HK$ 139,047 - - - 139,047 13,905 JPY 1,321,571 - 1,366 - 1,322,937 132,294 KRW 301,411 - - - 301,411 30,141 NOK 39,536 - - - 39,536 3,954 NZD 10,762 - - - 10,762 1,076 SEK 141,143 - - - 141,143 14,114 SG$ 60,489 - 418 - 60,907 6,091 5,647,857 - 6,957 - 5,654,814 565,483
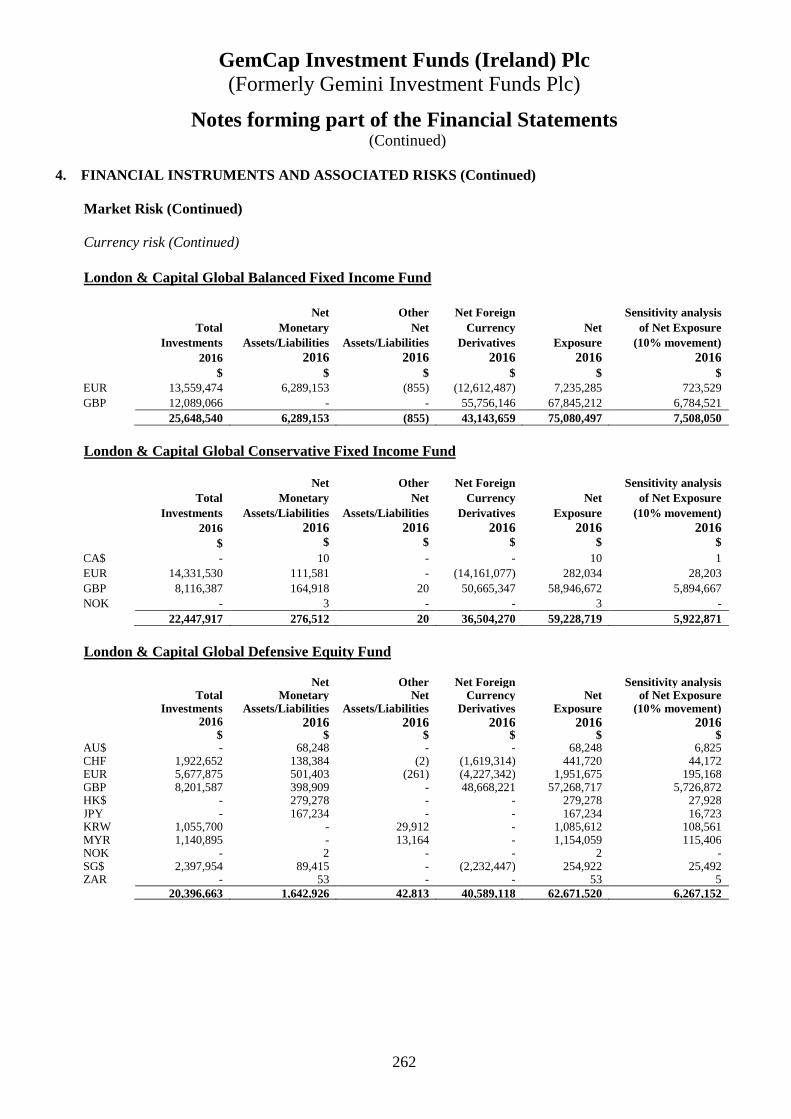
GemCap Investment Funds (Ireland) Plc (Formerly Gemini Investment Funds Plc)
262
Notes forming part of the Financial Statements (Continued)
4. FINANCIAL INSTRUMENTS AND ASSOCIATED RISKS (C ontinued)
Market Risk (Continued)
Currency risk (Continued) London & Capital Global Balanced Fixed Income Fund
Net Other Net Foreign Sensitivity analysis Total Monetary Net Currency Net of Net Exposure Investments Assets/Liabilities Assets/Liabilities Derivatives Exposure (10% movement) 2016 2016 2016 2016 2016 2016 $ $ $ $ $ $ EUR 13,559,474 6,289,153 (855) (12,612,487) 7,235,285 723,529 GBP 12,089,066 - - 55,756,146 67,845,212 6,784,521 25,648,540 6,289,153 (855) 43,143,659 75,080,497 7,508,050 London & Capital Global Conservative Fixed Income Fund
Net Other Net Foreign Sensitivity analysis Total Monetary Net Currency Net of Net Exposure Investments Assets/Liabilities Assets/Liabilities Derivatives Exposure (10% movement) 2016 2016 2016 2016 2016 2016 $ $ $ $ $ $ CA$ - 10 - - 10 1 EUR 14,331,530 111,581 - (14,161,077) 282,034 28,203 GBP 8,116,387 164,918 20 50,665,347 58,946,672 5,894,667 NOK - 3 - - 3 - 22,447,917 276,512 20 36,504,270 59,228,719 5,922,871 London & Capital Global Defensive Equity Fund
Net Other Net Foreign Sensitivity analysis Total Monetary Net Currency Net of Net Exposure Investments Assets/Liabilities Assets/Liabilities Derivatives Exposure (10% movement) 2016 2016 2016 2016 2016 2016 $ $ $ $ $ $ AU$ - 68,248 - - 68,248 6,825 CHF 1,922,652 138,384 (2) (1,619,314) 441,720 44,172 EUR 5,677,875 501,403 (261) (4,227,342) 1,951,675 195,168 GBP 8,201,587 398,909 - 48,668,221 57,268,717 5,726,872 HK$ - 279,278 - - 279,278 27,928 JPY - 167,234 - - 167,234 16,723 KRW 1,055,700 - 29,912 - 1,085,612 108,561 MYR 1,140,895 - 13,164 - 1,154,059 115,406 NOK - 2 - - 2 - SG$ 2,397,954 89,415 - (2,232,447) 254,922 25,492 ZAR - 53 - - 53 5 20,396,663 1,642,926 42,813 40,589,118 62,671,520 6,267,152
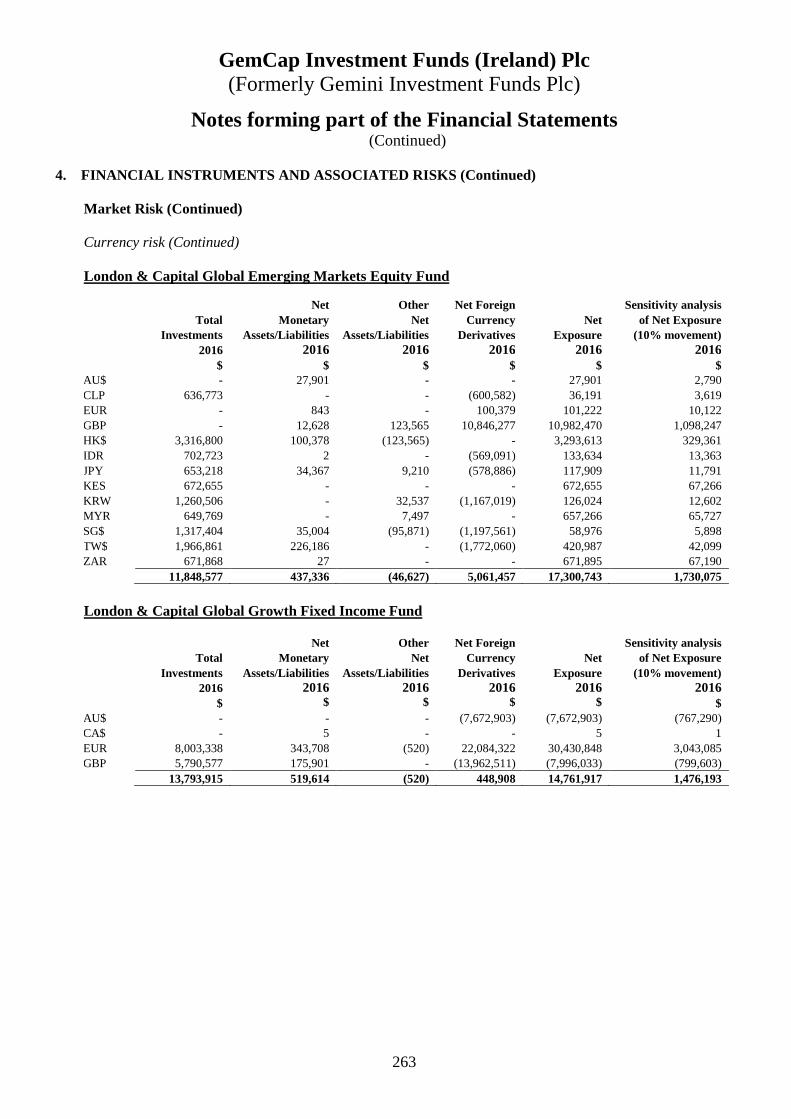
GemCap Investment Funds (Ireland) Plc (Formerly Gemini Investment Funds Plc)
263
Notes forming part of the Financial Statements (Continued)
4. FINANCIAL INSTRUMENTS AND ASSOCIATED RISKS (C ontinued)
Market Risk (Continued)
Currency risk (Continued) London & Capital Global Emerging Markets Equity Fund Net Other Net Foreign Sensitivity analysis Total Monetary Net Currency Net of Net Exposure Investments Assets/Liabilities Assets/Liabilities Derivatives Exposure (10% movement) 2016 2016 2016 2016 2016 2016 $ $ $ $ $ $ AU$ - 27,901 - - 27,901 2,790 CLP 636,773 - - (600,582) 36,191 3,619 EUR - 843 - 100,379 101,222 10,122 GBP - 12,628 123,565 10,846,277 10,982,470 1,098,247 HK$ 3,316,800 100,378 (123,565) - 3,293,613 329,361 IDR 702,723 2 - (569,091) 133,634 13,363 JPY 653,218 34,367 9,210 (578,886) 117,909 11,791 KES 672,655 - - - 672,655 67,266 KRW 1,260,506 - 32,537 (1,167,019) 126,024 12,602 MYR 649,769 - 7,497 - 657,266 65,727 SG$ 1,317,404 35,004 (95,871) (1,197,561) 58,976 5,898 TW$ 1,966,861 226,186 - (1,772,060) 420,987 42,099 ZAR 671,868 27 - - 671,895 67,190 11,848,577 437,336 (46,627) 5,061,457 17,300,743 1,730,075
London & Capital Global Growth Fixed Income Fund
Net Other Net Foreign Sensitivity analysis Total Monetary Net Currency Net of Net Exposure Investments Assets/Liabilities Assets/Liabilities Derivatives Exposure (10% movement) 2016 2016 2016 2016 2016 2016 $ $ $ $ $ $ AU$ - - - (7,672,903) (7,672,903) (767,290) CA$ - 5 - - 5 1 EUR 8,003,338 343,708 (520) 22,084,322 30,430,848 3,043,085 GBP 5,790,577 175,901 - (13,962,511) (7,996,033) (799,603) 13,793,915 519,614 (520) 448,908 14,761,917 1,476,193
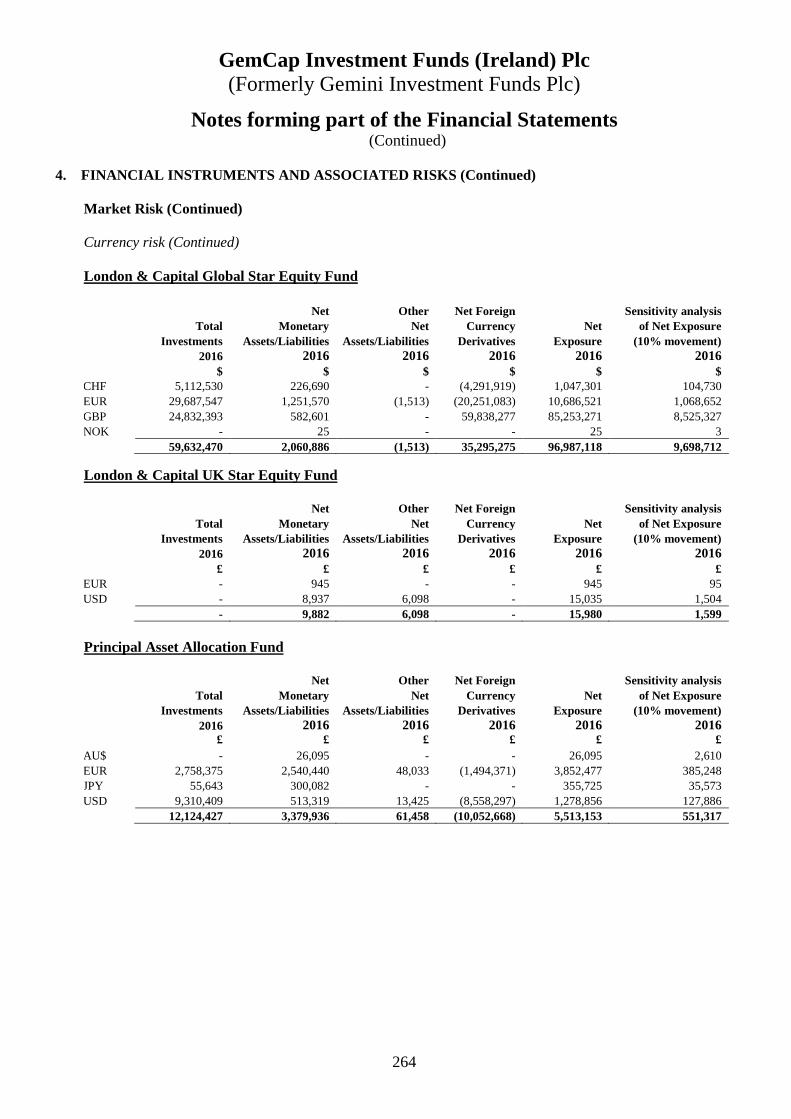
GemCap Investment Funds (Ireland) Plc (Formerly Gemini Investment Funds Plc)
264
Notes forming part of the Financial Statements (Continued)
4. FINANCIAL INSTRUMENTS AND ASSOCIATED RISKS (C ontinued)
Market Risk (Continued)
Currency risk (Continued) London & Capital Global Star Equity Fund
Net Other Net Foreign Sensitivity analysis Total Monetary Net Currency Net of Net Exposure Investments Assets/Liabilities Assets/Liabilities Derivatives Exposure (10% movement) 2016 2016 2016 2016 2016 2016 $ $ $ $ $ $ CHF 5,112,530 226,690 - (4,291,919) 1,047,301 104,730 EUR 29,687,547 1,251,570 (1,513) (20,251,083) 10,686,521 1,068,652 GBP 24,832,393 582,601 - 59,838,277 85,253,271 8,525,327 NOK - 25 - - 25 3 59,632,470 2,060,886 (1,513) 35,295,275 96,987,118 9,698,712
London & Capital UK Star Equity Fund
Net Other Net Foreign Sensitivity analysis Total Monetary Net Currency Net of Net Exposure Investments Assets/Liabilities Assets/Liabilities Derivatives Exposure (10% movement) 2016 2016 2016 2016 2016 2016 £ £ £ £ £ £ EUR - 945 - - 945 95 USD - 8,937 6,098 - 15,035 1,504 - 9,882 6,098 - 15,980 1,599 Principal Asset Allocation Fund Net Other Net Foreign Sensitivity analysis Total Monetary Net Currency Net of Net Exposure Investments Assets/Liabilities Assets/Liabilities Derivatives Exposure (10% movement) 2016 2016 2016 2016 2016 2016 £ £ £ £ £ £ AU$ - 26,095 - - 26,095 2,610 EUR 2,758,375 2,540,440 48,033 (1,494,371) 3,852,477 385,248 JPY 55,643 300,082 - - 355,725 35,573 USD 9,310,409 513,319 13,425 (8,558,297) 1,278,856 127,886 12,124,427 3,379,936 61,458 (10,052,668) 5,513,153 551,317

GemCap Investment Funds (Ireland) Plc (Formerly Gemini Investment Funds Plc)
265
Notes forming part of the Financial Statements (Continued)
4. FINANCIAL INSTRUMENTS AND ASSOCIATED RISKS (C ontinued)
Market Risk (Continued)
Currency risk (Continued) Sabre Global Value and Income Fund
Net Other Net Foreign Sensitivity analysis Total Monetary Net Currency Net of Net Exposure Investments Assets/Liabilities Assets/Liabilities Derivatives Exposure (10% movement) 2016 2016 2016 2016 2016 2016 £ £ £ £ £ £ AU$ 159,254 - 2 - 159,256 15,926 CA$ 461,181 - 1,228 - 462,409 46,241 CHF 32,300 - - - 32,300 3,230 EUR 754,138 - (553) - 753,585 75,359 HK$ 307,681 887 (887) - 307,681 30,768 IDR 25,244 9 - - 25,253 2,525 JPY 641,716 - 208 - 641,924 64,192 KRW 156,087 - - - 156,087 15,609 NOK 121,988 - - - 121,988 12,199 NZ$ 82,618 - - - 82,618 8,262 SEK 44,496 - - - 44,496 4,450 SG$ 107,293 - - - 107,293 10,729 THB 80,497 - - - 80,497 8,050 TWD 818 20,408 - - 21,226 2,123 USD 1,510,288 - 176 - 1,510,464 151,046 ZAR 112,472 - 6 - 112,478 11,248 4,598,071 21,304 180 - 4,619,555 461,957
A strengthening of 10% of the relevant Sub-Fund’s functional currency against the currencies in the above tables would have resulted in losses to the amounts shown in the Sensitivity Analysis column. A weakening of the functional currency against these currencies would have resulted in an equal but opposite effect. Liquidity Risk Liquidity risk represents the possibility that the Company may not be able to rapidly adjust the size of its investment position in times of high volatility and financial stress at a reasonable price and possible redemption restrictions from underlying investments. The main liability of the Company is the redemption of any shares that shareholders may wish to redeem. The Company is exposed to daily cash redemptions of Redeemable Participating Shares. Substantial voluntary redemptions of shares by shareholders within a limited period of time could require a Sub-Fund to liquidate interests in securities sooner than would otherwise be desirable. Regardless of the period of time in which redemptions occur, the resulting reduction in the Net Asset Value of a Sub-Fund and thus in its equity base, could make it more difficult for a Sub-Fund to diversify its holdings and achieve its investment objective. Under the Articles, if redemption requests on any Dealing Day equal or exceed 10% of the Net Asset Value of a Sub-Fund in issue on that Dealing Day, the Directors may limit redemptions to 10% of Net Asset Value on that Dealing Day as they deem necessary in their sole discretion. Any redemptions in excess of 10% of Net Asset Value may be held over to the next Dealing Day where they will be effected with priority over any new redemptions received. All the Company’s financial liabilities fall due within one month.
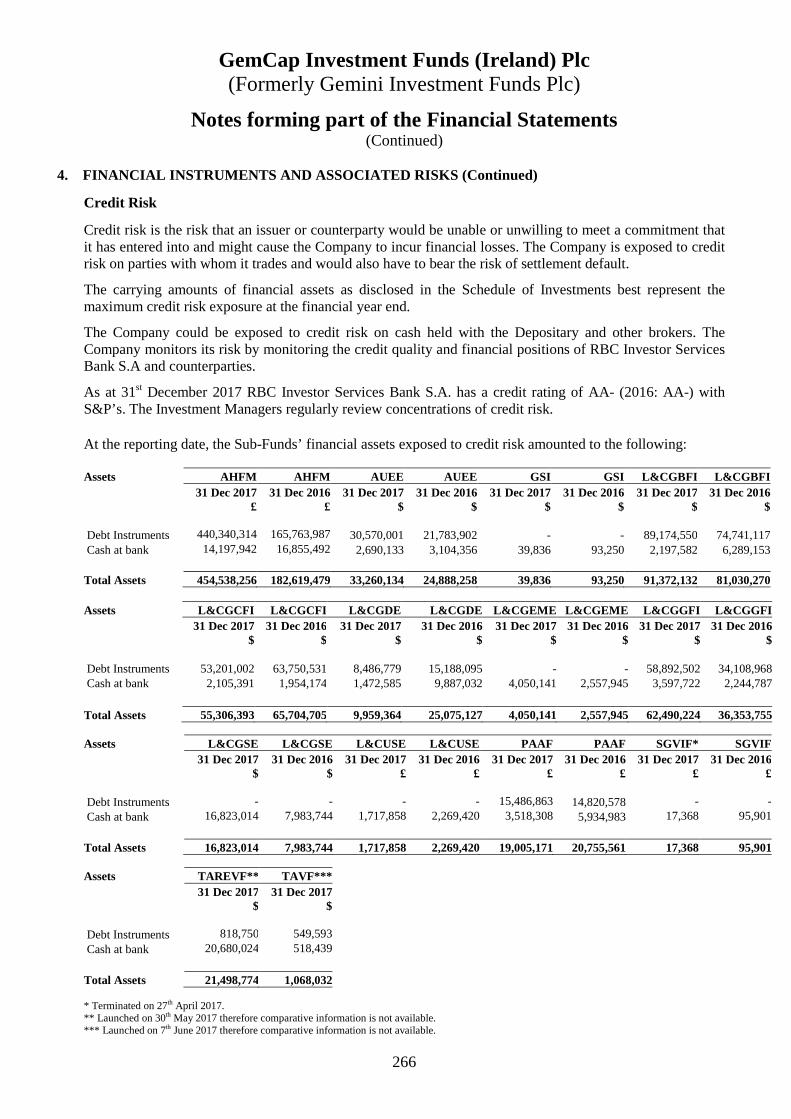
GemCap Investment Funds (Ireland) Plc (Formerly Gemini Investment Funds Plc)
266
Notes forming part of the Financial Statements (Continued)
4. FINANCIAL INSTRUMENTS AND ASSOCIATED RISKS (C ontinued)
Credit Risk
Credit risk is the risk that an issuer or counterparty would be unable or unwilling to meet a commitment that it has entered into and might cause the Company to incur financial losses. The Company is exposed to credit risk on parties with whom it trades and would also have to bear the risk of settlement default.
The carrying amounts of financial assets as disclosed in the Schedule of Investments best represent the maximum credit risk exposure at the financial year end.
The Company could be exposed to credit risk on cash held with the Depositary and other brokers. The Company monitors its risk by monitoring the credit quality and financial positions of RBC Investor Services Bank S.A and counterparties.
As at 31st December 2017 RBC Investor Services Bank S.A. has a credit rating of AA- (2016: AA-) with S&P’s. The Investment Managers regularly review concentrations of credit risk. At the reporting date, the Sub-Funds’ financial assets exposed to credit risk amounted to the following: Assets AHFM AHFM AUEE AUEE GSI GSI L&CGBFI L&CGBFI 31 Dec 2017 31 Dec 2016 31 Dec 2017 31 Dec 2016 31 Dec 2017 31 Dec 2016 31 Dec 2017 31 Dec 2016 £ £ $ $ $ $ $ $ Debt Instruments 440,340,314 165,763,987 30,570,001 21,783,902 - - 89,174,550 74,741,117 Cash at bank 14,197,942 16,855,492 2,690,133 3,104,356 39,836 93,250 2,197,582 6,289,153 Total Assets 454,538,256 182,619,479 33,260,134 24,888,258 39,836 93,250 91,372,132 81,030,270 Assets L&CGCFI L&CGCFI L&CGDE L&CGDE L&CGEME L&CGEME L&CGGFI L&CGGFI 31 Dec 2017 31 Dec 2016 31 Dec 2017 31 Dec 2016 31 Dec 2017 31 Dec 2016 31 Dec 2017 31 Dec 2016 $ $ $ $ $ $ $ $ Debt Instruments 53,201,002 63,750,531 8,486,779 15,188,095 - - 58,892,502 34,108,968 Cash at bank 2,105,391 1,954,174 1,472,585 9,887,032 4,050,141 2,557,945 3,597,722 2,244,787 Total Assets 55,306,393 65,704,705 9,959,364 25,075,127 4,050,141 2,557,945 62,490,224 36,353,755
Assets L&CGSE L&CGSE L&CUSE L&CUSE PAAF PAAF SGVIF* SGVIF 31 Dec 2017 31 Dec 2016 31 Dec 2017 31 Dec 2016 31 Dec 2017 31 Dec 2016 31 Dec 201731 Dec 2016 $ $ £ £ £ £ £ £ Debt Instruments - - - - 15,486,863 14,820,578 - - Cash at bank 16,823,014 7,983,744 1,717,858 2,269,420 3,518,308 5,934,983 17,368 95,901 Total Assets 16,823,014 7,983,744 1,717,858 2,269,42019,005,171 20,755,561 17,368 95,901
Assets TAREVF** TAVF*** 31 Dec 2017 31 Dec 2017 $ $ Debt Instruments 818,750 549,593 Cash at bank 20,680,024 518,439 Total Assets 21,498,774 1,068,032 * Terminated on 27th April 2017. ** Launched on 30th May 2017 therefore comparative information is not available. *** Launched on 7th June 2017 therefore comparative information is not available.
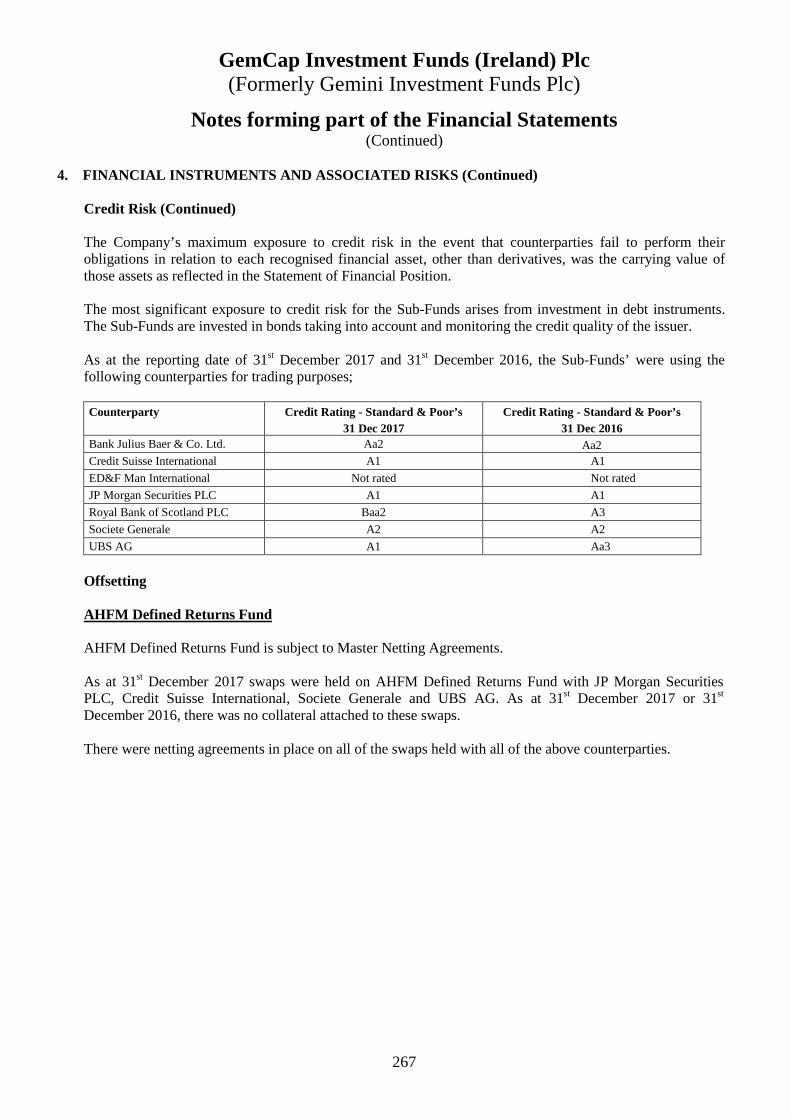
GemCap Investment Funds (Ireland) Plc (Formerly Gemini Investment Funds Plc)
267
Notes forming part of the Financial Statements (Continued)
4. FINANCIAL INSTRUMENTS AND ASSOCIATED RISKS (C ontinued)
Credit Risk (Continued) The Company’s maximum exposure to credit risk in the event that counterparties fail to perform their obligations in relation to each recognised financial asset, other than derivatives, was the carrying value of those assets as reflected in the Statement of Financial Position. The most significant exposure to credit risk for the Sub-Funds arises from investment in debt instruments. The Sub-Funds are invested in bonds taking into account and monitoring the credit quality of the issuer. As at the reporting date of 31st December 2017 and 31st December 2016, the Sub-Funds’ were using the following counterparties for trading purposes; Counterparty Credit Rating - Standard & Poor’s
31 Dec 2017 Credit Rating - Standard & Poor’s
31 Dec 2016 Bank Julius Baer & Co. Ltd. Aa2 Aa2 Credit Suisse International A1 A1
ED&F Man International Not rated Not rated
JP Morgan Securities PLC A1 A1
Royal Bank of Scotland PLC Baa2 A3
Societe Generale A2 A2
UBS AG A1 Aa3
Offsetting AHFM Defined Returns Fund AHFM Defined Returns Fund is subject to Master Netting Agreements. As at 31st December 2017 swaps were held on AHFM Defined Returns Fund with JP Morgan Securities PLC, Credit Suisse International, Societe Generale and UBS AG. As at 31st December 2017 or 31st December 2016, there was no collateral attached to these swaps. There were netting agreements in place on all of the swaps held with all of the above counterparties.
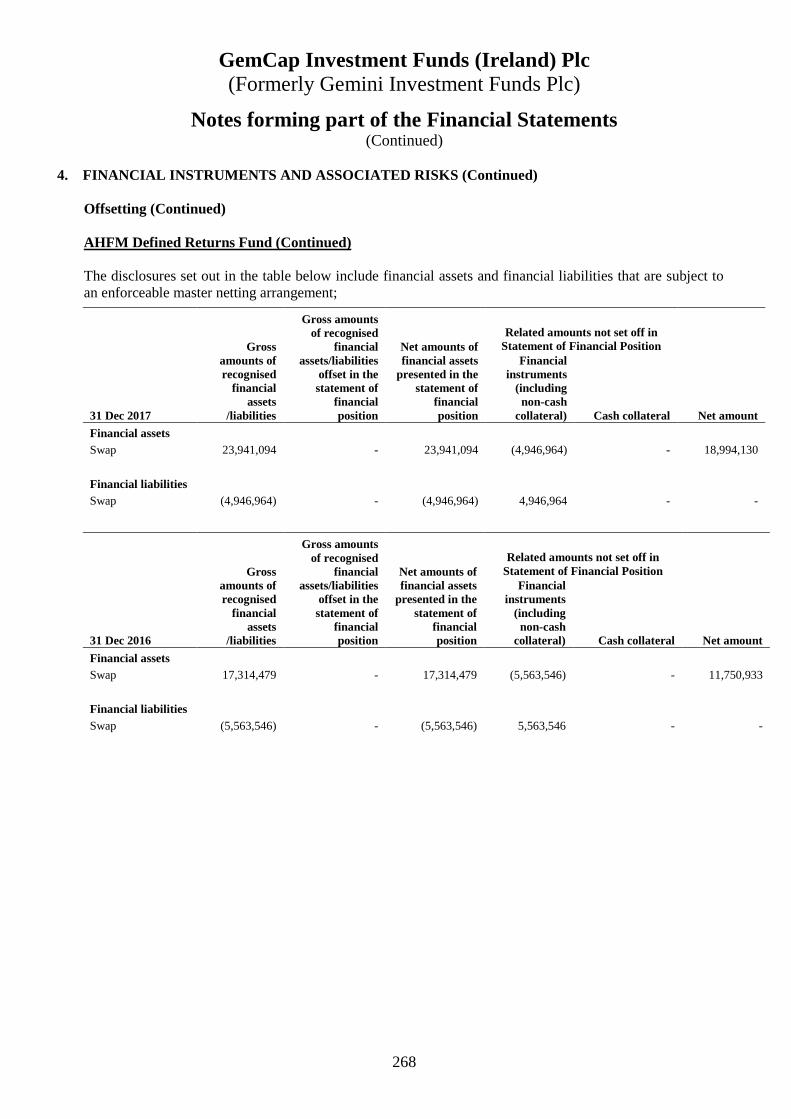
GemCap Investment Funds (Ireland) Plc (Formerly Gemini Investment Funds Plc)
268
Notes forming part of the Financial Statements (Continued)
4. FINANCIAL INSTRUMENTS AND ASSOCIATED RISKS (C ontinued)
Offsetting (Continued) AHFM Defined Returns Fund (Continued) The disclosures set out in the table below include financial assets and financial liabilities that are subject to an enforceable master netting arrangement;
Gross amounts of recognised
financial assets
/liabilities
Gross amounts of recognised
financial assets/liabilities
offset in the statement of
financial position
Net amounts of financial assets
presented in the statement of
financial position
Related amounts not set off in Statement of Financial Position
31 Dec 2017
Financial instruments
(including non-cash
collateral) Cash collateral Net amount
Financial assets
Swap 23,941,094 - 23,941,094 (4,946,964) - 18,994,130
Financial liabilities
Swap (4,946,964) - (4,946,964) 4,946,964 - -
Gross amounts of recognised
financial assets
/liabilities
Gross amounts of recognised
financial assets/liabilities
offset in the statement of
financial position
Net amounts of financial assets
presented in the statement of
financial position
Related amounts not set off in Statement of Financial Position
31 Dec 2016
Financial instruments
(including non-cash
collateral) Cash collateral Net amount
Financial assets
Swap 17,314,479 - 17,314,479 (5,563,546) - 11,750,933
Financial liabilities
Swap (5,563,546) - (5,563,546) 5,563,546 - -
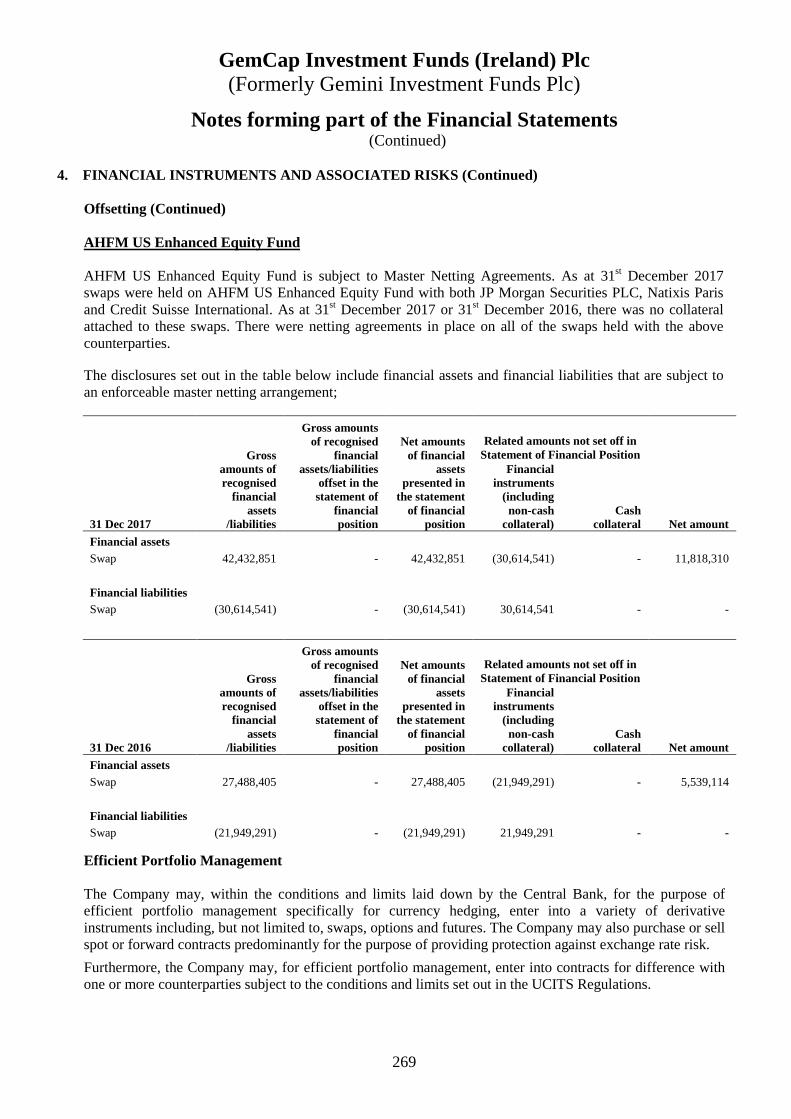
GemCap Investment Funds (Ireland) Plc (Formerly Gemini Investment Funds Plc)
269
Notes forming part of the Financial Statements (Continued)
4. FINANCIAL INSTRUMENTS AND ASSOCIATED RISKS (C ontinued)
Offsetting (Continued) AHFM US Enhanced Equity Fund
AHFM US Enhanced Equity Fund is subject to Master Netting Agreements. As at 31st December 2017 swaps were held on AHFM US Enhanced Equity Fund with both JP Morgan Securities PLC, Natixis Paris and Credit Suisse International. As at 31st December 2017 or 31st December 2016, there was no collateral attached to these swaps. There were netting agreements in place on all of the swaps held with the above counterparties. The disclosures set out in the table below include financial assets and financial liabilities that are subject to an enforceable master netting arrangement;
Gross amounts of recognised
financial assets
/liabilities
Gross amounts of recognised
financial assets/liabilities
offset in the statement of
financial position
Net amounts of financial
assets presented in
the statement of financial
position
Related amounts not set off in Statement of Financial Position
31 Dec 2017
Financial instruments
(including non-cash
collateral) Cash
collateral Net amount
Financial assets
Swap 42,432,851 - 42,432,851 (30,614,541) - 11,818,310
Financial liabilities
Swap (30,614,541) - (30,614,541) 30,614,541 - -
Gross amounts of recognised
financial assets
/liabilities
Gross amounts of recognised
financial assets/liabilities
offset in the statement of
financial position
Net amounts of financial
assets presented in
the statement of financial
position
Related amounts not set off in Statement of Financial Position
31 Dec 2016
Financial instruments
(including non-cash
collateral) Cash
collateral Net amount
Financial assets
Swap 27,488,405 - 27,488,405 (21,949,291) - 5,539,114
Financial liabilities
Swap (21,949,291) - (21,949,291) 21,949,291 - -
Efficient Portfolio Management The Company may, within the conditions and limits laid down by the Central Bank, for the purpose of efficient portfolio management specifically for currency hedging, enter into a variety of derivative instruments including, but not limited to, swaps, options and futures. The Company may also purchase or sell spot or forward contracts predominantly for the purpose of providing protection against exchange rate risk.
Furthermore, the Company may, for efficient portfolio management, enter into contracts for difference with one or more counterparties subject to the conditions and limits set out in the UCITS Regulations.
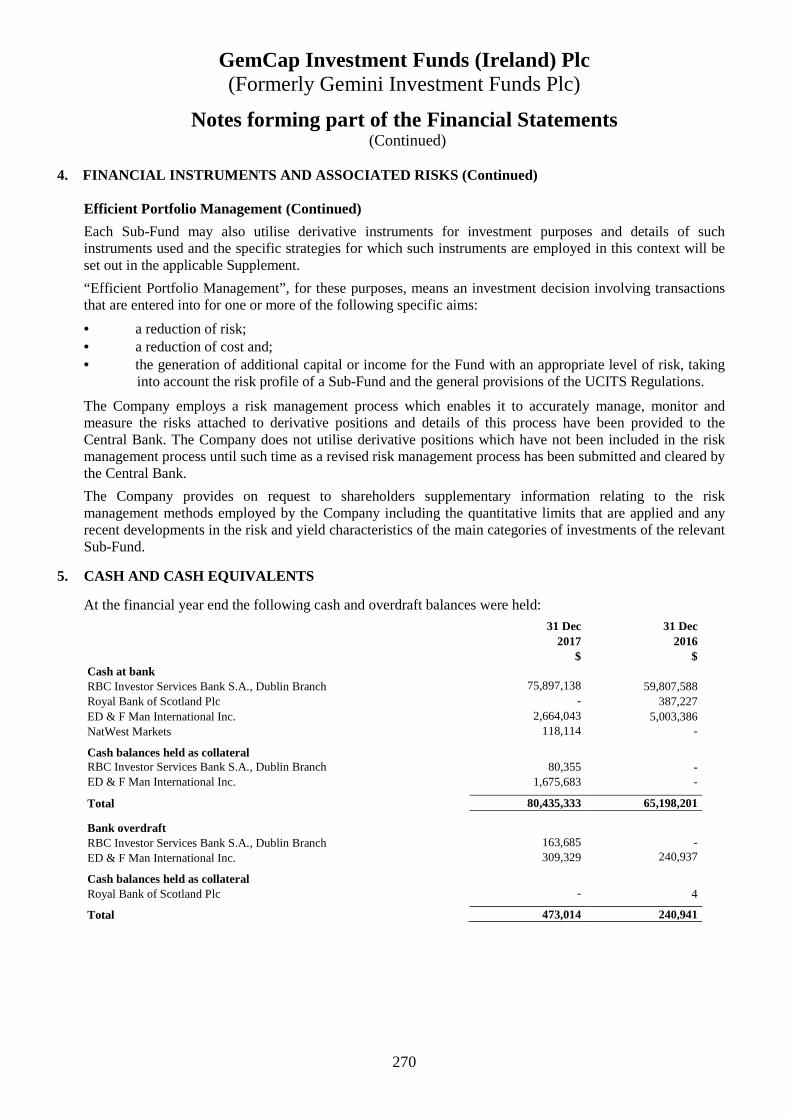
GemCap Investment Funds (Ireland) Plc (Formerly Gemini Investment Funds Plc)
270
Notes forming part of the Financial Statements (Continued)
4. FINANCIAL INSTRUMENTS AND ASSOCIATED RISKS (C ontinued)
Efficient Portfolio Management (Continued)
Each Sub-Fund may also utilise derivative instruments for investment purposes and details of such instruments used and the specific strategies for which such instruments are employed in this context will be set out in the applicable Supplement.
“Efficient Portfolio Management”, for these purposes, means an investment decision involving transactions that are entered into for one or more of the following specific aims:
• a reduction of risk; • a reduction of cost and; • the generation of additional capital or income for the Fund with an appropriate level of risk, taking
into account the risk profile of a Sub-Fund and the general provisions of the UCITS Regulations.
The Company employs a risk management process which enables it to accurately manage, monitor and measure the risks attached to derivative positions and details of this process have been provided to the Central Bank. The Company does not utilise derivative positions which have not been included in the risk management process until such time as a revised risk management process has been submitted and cleared by the Central Bank.
The Company provides on request to shareholders supplementary information relating to the risk management methods employed by the Company including the quantitative limits that are applied and any recent developments in the risk and yield characteristics of the main categories of investments of the relevant Sub-Fund.
5. CASH AND CASH EQUIVALENTS
At the financial year end the following cash and overdraft balances were held:
31 Dec 31 Dec 2017 2016 $ $ Cash at bank RBC Investor Services Bank S.A., Dublin Branch 75,897,138 59,807,588 Royal Bank of Scotland Plc - 387,227 ED & F Man International Inc. 2,664,043 5,003,386 NatWest Markets 118,114 - Cash balances held as collateral RBC Investor Services Bank S.A., Dublin Branch 80,355 - ED & F Man International Inc. 1,675,683 - Total 80,435,333 65,198,201 Bank overdraft RBC Investor Services Bank S.A., Dublin Branch 163,685 - ED & F Man International Inc. 309,329 240,937
Cash balances held as collateral Royal Bank of Scotland Plc - 4 Total 473,014 240,941

GemCap Investment Funds (Ireland) Plc (Formerly Gemini Investment Funds Plc)
271
Notes forming part of the Financial Statements (Continued)
6. SHARE CAPITAL Capital Management The authorised share capital of the Company is 2 Subscriber Shares of €1 each which are held with Stuart Alexander and Alan Jupp and 1,000,000,000,000 shares of no par value initially designated as unclassified participating shares. The minimum issued share capital of the Company is €2 or its equivalent in another currency. The maximum issued share capital of the Company is €1,000,000,000,000 or its equivalent in any other currency. The Articles provide un-issued shares are at the disposal of the Directors who may offer, allot, issue, grant options over or otherwise dispose of them to such persons, at such times, for such consideration and on such terms and conditions as the Directors see fit. The Company may by ordinary resolution increase its share capital, consolidate its shares or subdivide any of them into Shares of a smaller amount or cancel authorised but unissued shares. The holders of shares shall: (i) have the right to vote at a general meeting. On a show of hands, be entitled to one vote per holder
and, on a poll, be entitled to one vote per share; (ii) be entitled to such dividends as the Directors may from time to time declare; and (iii) in the event of a winding up or dissolution of the Company, have the entitlements referred to under
“Liquidation” ” in the section under the heading “Memorandum and Articles of Association” in the prospectus of the Company;
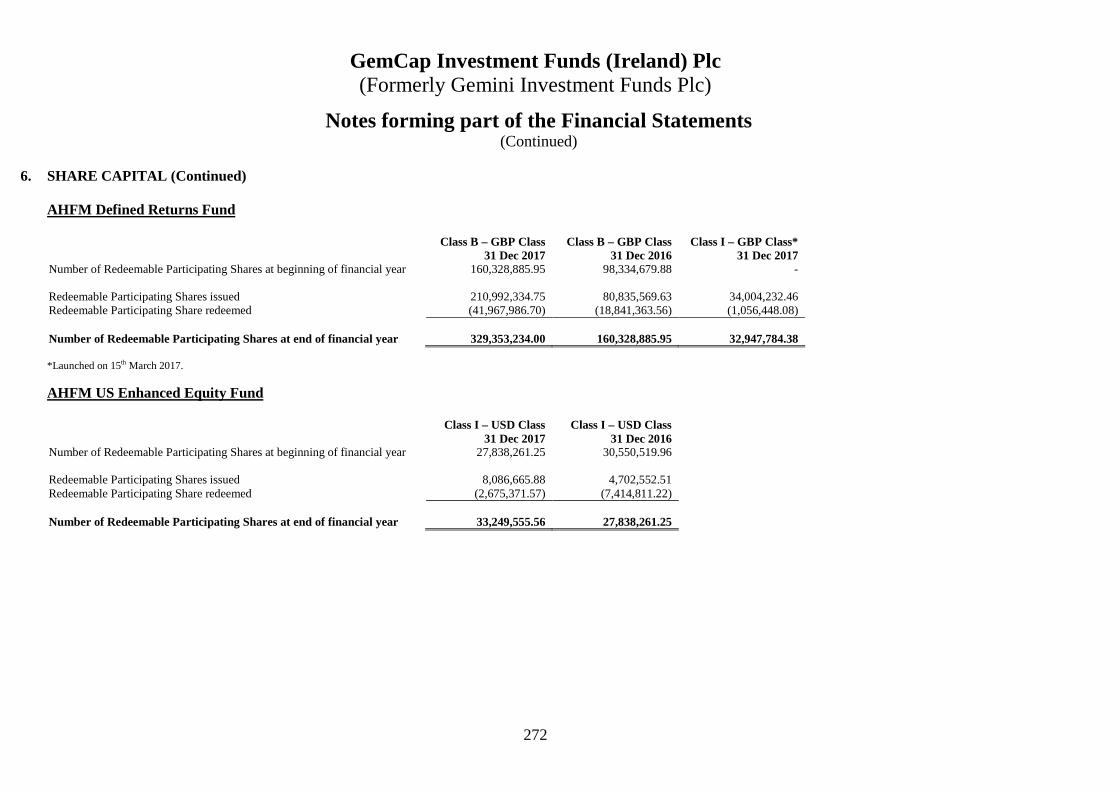
GemCap Investment Funds (Ireland) Plc (Formerly Gemini Investment Funds Plc)
272
Notes forming part of the Financial Statements (Continued)
6. SHARE CAPITAL (Continued)
AHFM Defined Returns Fund Class B – GBP Class Class B – GBP Class Class I – GBP Class* 31 Dec 2017 31 Dec 2016 31 Dec 2017 Number of Redeemable Participating Shares at beginning of financial year 160,328,885.95 98,334,679.88 - Redeemable Participating Shares issued 210,992,334.75 80,835,569.63 34,004,232.46 Redeemable Participating Share redeemed (41,967,986.70) (18,841,363.56) (1,056,448.08) Number of Redeemable Participating Shares at end of financial year 329,353,234.00 160,328,885.95 32,947,784.38 *Launched on 15th March 2017.
AHFM US Enhanced Equity Fund Class I – USD Class Class I – USD Class 31 Dec 2017 31 Dec 2016 Number of Redeemable Participating Shares at beginning of financial year 27,838,261.25 30,550,519.96 Redeemable Participating Shares issued 8,086,665.88 4,702,552.51 Redeemable Participating Share redeemed (2,675,371.57) (7,414,811.22) Number of Redeemable Participating Shares at end of financial year 33,249,555.56 27,838,261.25
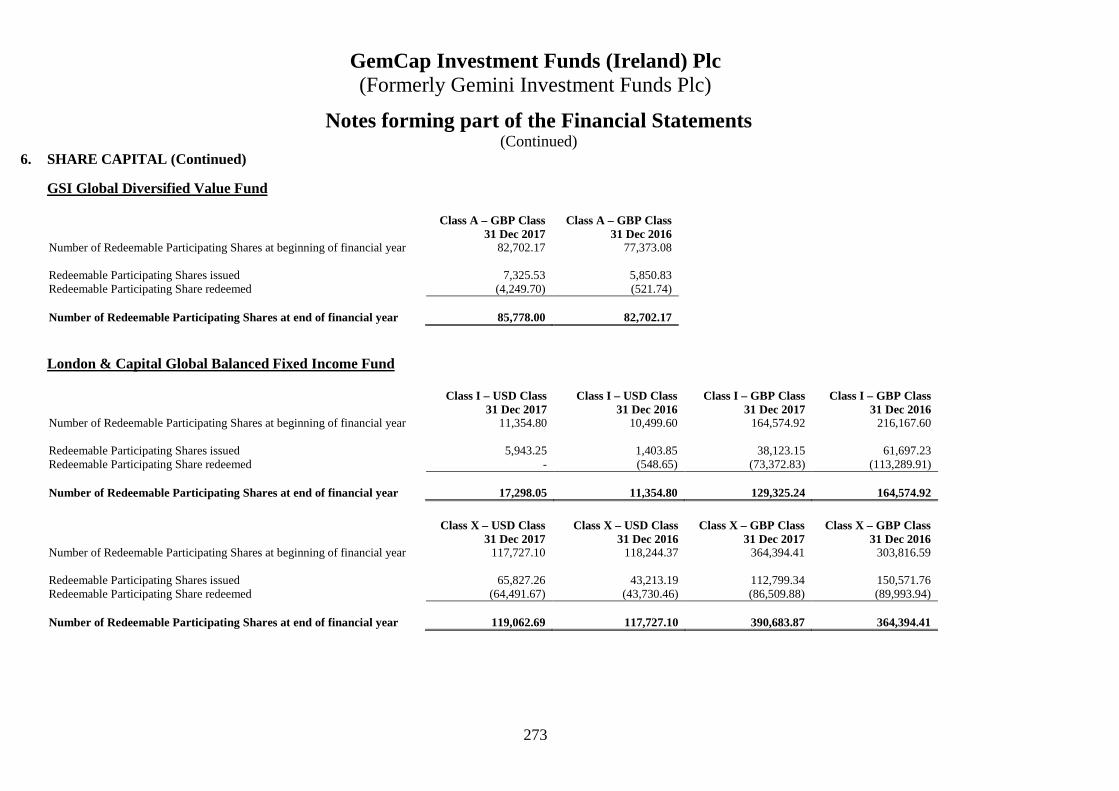
GemCap Investment Funds (Ireland) Plc (Formerly Gemini Investment Funds Plc)
273
Notes forming part of the Financial Statements (Continued)
6. SHARE CAPITAL (Continued)
GSI Global Diversified Value Fund
Class A – GBP Class Class A – GBP Class 31 Dec 2017 31 Dec 2016 Number of Redeemable Participating Shares at beginning of financial year 82,702.17 77,373.08 Redeemable Participating Shares issued 7,325.53 5,850.83 Redeemable Participating Share redeemed (4,249.70) (521.74) Number of Redeemable Participating Shares at end of financial year 85,778.00 82,702.17
London & Capital Global Balanced Fixed Income Fund Class I – USD Class Class I – USD Class Class I – GBP Class Class I – GBP Class 31 Dec 2017 31 Dec 2016 31 Dec 2017 31 Dec 2016 Number of Redeemable Participating Shares at beginning of financial year 11,354.80 10,499.60 164,574.92 216,167.60 Redeemable Participating Shares issued 5,943.25 1,403.85 38,123.15 61,697.23 Redeemable Participating Share redeemed - (548.65) (73,372.83) (113,289.91) Number of Redeemable Participating Shares at end of financial year 17,298.05 11,354.80 129,325.24 164,574.92
Class X – USD Class Class X – USD Class Class X – GBP Class Class X – GBP Class 31 Dec 2017 31 Dec 2016 31 Dec 2017 31 Dec 2016 Number of Redeemable Participating Shares at beginning of financial year 117,727.10 118,244.37 364,394.41 303,816.59 Redeemable Participating Shares issued 65,827.26 43,213.19 112,799.34 150,571.76 Redeemable Participating Share redeemed (64,491.67) (43,730.46) (86,509.88) (89,993.94) Number of Redeemable Participating Shares at end of financial year 119,062.69 117,727.10 390,683.87 364,394.41
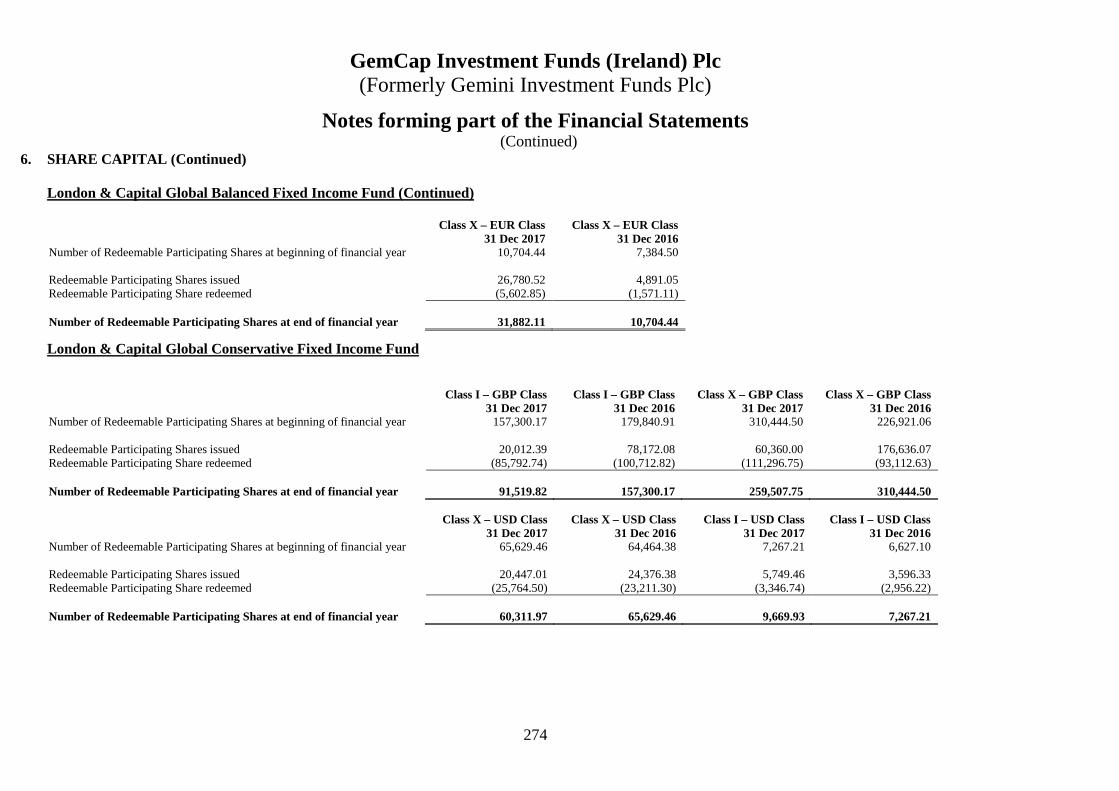
GemCap Investment Funds (Ireland) Plc (Formerly Gemini Investment Funds Plc)
274
Notes forming part of the Financial Statements (Continued)
6. SHARE CAPITAL (Continued)
London & Capital Global Balanced Fixed Income Fund (Continued)
London & Capital Global Conservative Fixed Income Fund
Class I – GBP Class Class I – GBP Class Class X – GBP Class Class X – GBP Class 31 Dec 2017 31 Dec 2016 31 Dec 2017 31 Dec 2016 Number of Redeemable Participating Shares at beginning of financial year 157,300.17 179,840.91 310,444.50 226,921.06 Redeemable Participating Shares issued 20,012.39 78,172.08 60,360.00 176,636.07 Redeemable Participating Share redeemed (85,792.74) (100,712.82) (111,296.75) (93,112.63) Number of Redeemable Participating Shares at end of financial year 91,519.82 157,300.17 259,507.75 310,444.50 Class X – USD Class Class X – USD Class Class I – USD Class Class I – USD Class
31 Dec 2017 31 Dec 2016 31 Dec 2017 31 Dec 2016 Number of Redeemable Participating Shares at beginning of financial year 65,629.46 64,464.38 7,267.21 6,627.10 Redeemable Participating Shares issued 20,447.01 24,376.38 5,749.46 3,596.33 Redeemable Participating Share redeemed (25,764.50) (23,211.30) (3,346.74) (2,956.22) Number of Redeemable Participating Shares at end of financial year 60,311.97 65,629.46 9,669.93 7,267.21
Class X – EUR Class Class X – EUR Class 31 Dec 2017 31 Dec 2016 Number of Redeemable Participating Shares at beginning of financial year 10,704.44 7,384.50 Redeemable Participating Shares issued 26,780.52 4,891.05 Redeemable Participating Share redeemed (5,602.85) (1,571.11) Number of Redeemable Participating Shares at end of financial year 31,882.11 10,704.44
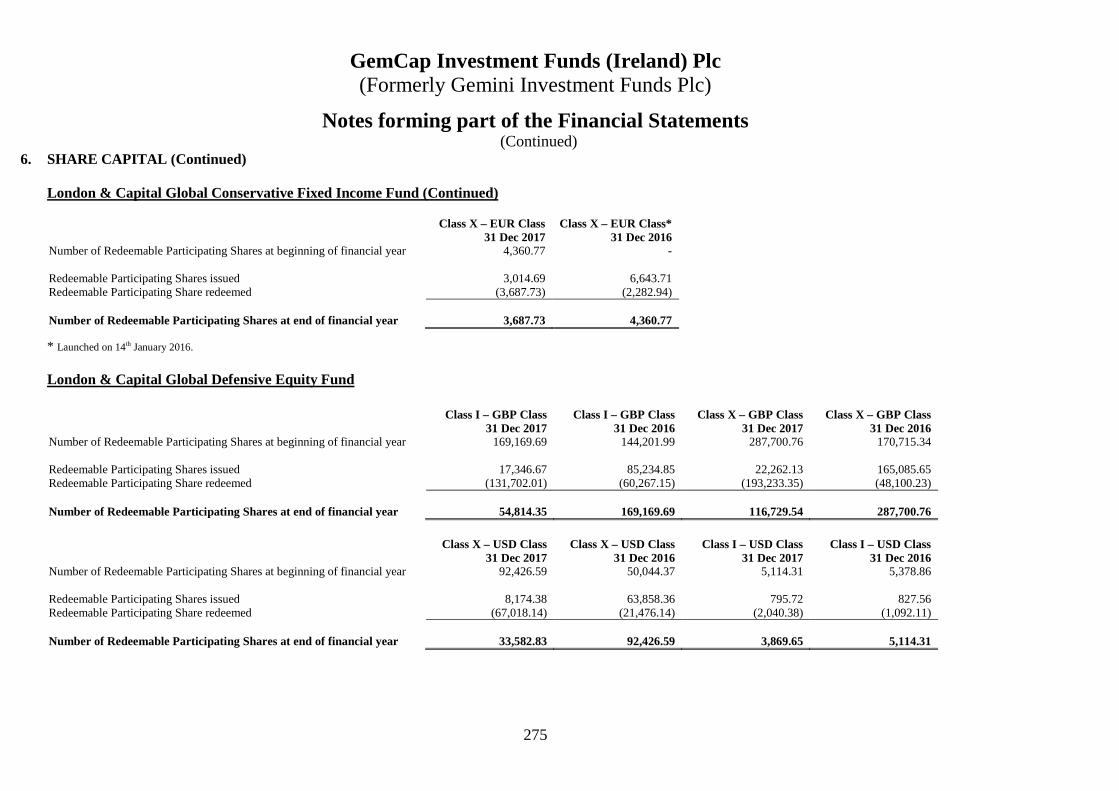
GemCap Investment Funds (Ireland) Plc (Formerly Gemini Investment Funds Plc)
275
Notes forming part of the Financial Statements (Continued)
6. SHARE CAPITAL (Continued) London & Capital Global Conservative Fixed Income Fund (Continued)
* Launched on 14th January 2016.
London & Capital Global Defensive Equity Fund
Class I – GBP Class Class I – GBP Class Class X – GBP Class Class X – GBP Class 31 Dec 2017 31 Dec 2016 31 Dec 2017 31 Dec 2016 Number of Redeemable Participating Shares at beginning of financial year 169,169.69 144,201.99 287,700.76 170,715.34 Redeemable Participating Shares issued 17,346.67 85,234.85 22,262.13 165,085.65 Redeemable Participating Share redeemed (131,702.01) (60,267.15) (193,233.35) (48,100.23) Number of Redeemable Participating Shares at end of financial year 54,814.35 169,169.69 116,729.54 287,700.76
Class X – USD Class Class X – USD Class Class I – USD Class Class I – USD Class 31 Dec 2017 31 Dec 2016 31 Dec 2017 31 Dec 2016 Number of Redeemable Participating Shares at beginning of financial year 92,426.59 50,044.37 5,114.31 5,378.86 Redeemable Participating Shares issued 8,174.38 63,858.36 795.72 827.56 Redeemable Participating Share redeemed (67,018.14) (21,476.14) (2,040.38) (1,092.11) Number of Redeemable Participating Shares at end of financial year 33,582.83 92,426.59 3,869.65 5,114.31
Class X – EUR Class Class X – EUR Class* 31 Dec 2017 31 Dec 2016 Number of Redeemable Participating Shares at beginning of financial year 4,360.77 - Redeemable Participating Shares issued 3,014.69 6,643.71 Redeemable Participating Share redeemed (3,687.73) (2,282.94) Number of Redeemable Participating Shares at end of financial year 3,687.73 4,360.77
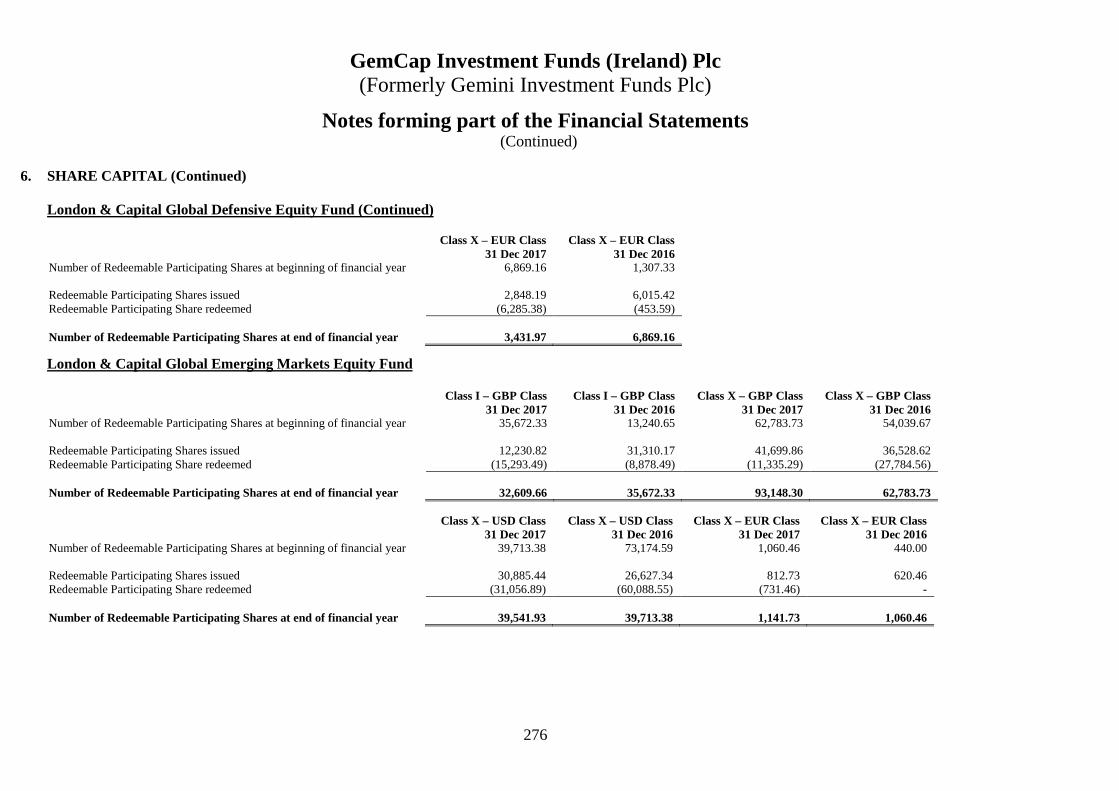
GemCap Investment Funds (Ireland) Plc (Formerly Gemini Investment Funds Plc)
276
Notes forming part of the Financial Statements (Continued)
6. SHARE CAPITAL (Continued)
London & Capital Global Defensive Equity Fund (Continued)
Class X – EUR Class Class X – EUR Class 31 Dec 2017 31 Dec 2016 Number of Redeemable Participating Shares at beginning of financial year 6,869.16 1,307.33 Redeemable Participating Shares issued 2,848.19 6,015.42 Redeemable Participating Share redeemed (6,285.38) (453.59) Number of Redeemable Participating Shares at end of financial year 3,431.97 6,869.16
London & Capital Global Emerging Markets Equity Fund
Class I – GBP Class Class I – GBP Class Class X – GBP Class Class X – GBP Class 31 Dec 2017 31 Dec 2016 31 Dec 2017 31 Dec 2016 Number of Redeemable Participating Shares at beginning of financial year 35,672.33 13,240.65 62,783.73 54,039.67 Redeemable Participating Shares issued 12,230.82 31,310.17 41,699.86 36,528.62 Redeemable Participating Share redeemed (15,293.49) (8,878.49) (11,335.29) (27,784.56) Number of Redeemable Participating Shares at end of financial year 32,609.66 35,672.33 93,148.30 62,783.73 Class X – USD Class Class X – USD Class Class X – EUR Class Class X – EUR Class 31 Dec 2017 31 Dec 2016 31 Dec 2017 31 Dec 2016 Number of Redeemable Participating Shares at beginning of financial year 39,713.38 73,174.59 1,060.46 440.00 Redeemable Participating Shares issued 30,885.44 26,627.34 812.73 620.46 Redeemable Participating Share redeemed (31,056.89) (60,088.55) (731.46) - Number of Redeemable Participating Shares at end of financial year 39,541.93 39,713.38 1,141.73 1,060.46

GemCap Investment Funds (Ireland) Plc (Formerly Gemini Investment Funds Plc)
277
Notes forming part of the Financial Statements (Continued)
6. SHARE CAPITAL (Continued)
London & Capital Global Emerging Markets Equity Fund (Continued) Class I – USD Class Class I – USD Class* 31 Dec 2017 31 Dec 2016 Number of Redeemable Participating Shares at beginning of financial year 745.52 - Redeemable Participating Shares issued - 745.52 Redeemable Participating Share redeemed - - Number of Redeemable Participating Shares at end of financial year 745.52 745.52 * Launched on 12th February 2016.
London & Capital Global Growth Fixed Income Fund
Class I – GBP Class Class I – GBP Class Class X – GBP Class Class X – GBP Class 31 Dec 2017 31 Dec 2016 31 Dec 2017 31 Dec 2016 Number of Redeemable Participating Shares at beginning of financial year 70,651.19 42,256.26 140,599.66 160,827.51 Redeemable Participating Shares issued 28,108.54 48,151.63 126,155.18 59,374.33 Redeemable Participating Share redeemed (25,932.47) (19,756.70) (33,666.45) (79,602.18) Number of Redeemable Participating Shares at end of financial year 72,827.26 70,651.19 233,088.39 140,599.66 Class I – USD Class Class I – USD Class Class X – USD Class Class X – USD Class 31 Dec 2017 31 Dec 2016 31 Dec 2017 31 Dec 2016 Number of Redeemable Participating Shares at beginning of financial year 4,986.52 4,986.52 78,892.90 152,700.57 Redeemable Participating Shares issued 2,267.60 - 56,547.76 19,824.13 Redeemable Participating Share redeemed - - (42,813.34) (93,631.80) Number of Redeemable Participating Shares at end of financial year 7,254.12 4,986.52 92,627.32 78,892.90
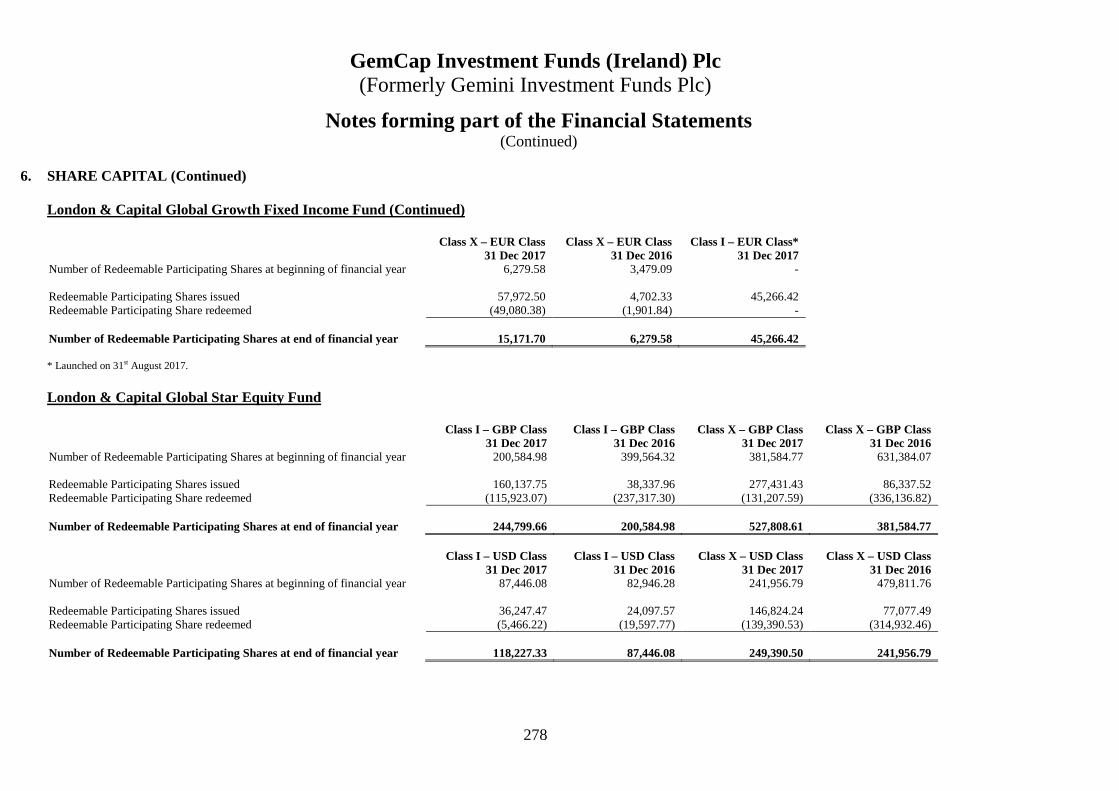
GemCap Investment Funds (Ireland) Plc (Formerly Gemini Investment Funds Plc)
278
Notes forming part of the Financial Statements (Continued)
6. SHARE CAPITAL (Continued)
London & Capital Global Growth Fixed Income Fund (Continued) Class X – EUR Class Class X – EUR Class Class I – EUR Class* 31 Dec 2017 31 Dec 2016 31 Dec 2017 Number of Redeemable Participating Shares at beginning of financial year 6,279.58 3,479.09 - Redeemable Participating Shares issued 57,972.50 4,702.33 45,266.42 Redeemable Participating Share redeemed (49,080.38) (1,901.84) - Number of Redeemable Participating Shares at end of financial year 15,171.70 6,279.58 45,266.42 * Launched on 31st August 2017.
London & Capital Global Star Equity Fund Class I – GBP Class Class I – GBP Class Class X – GBP Class Class X – GBP Class 31 Dec 2017 31 Dec 2016 31 Dec 2017 31 Dec 2016 Number of Redeemable Participating Shares at beginning of financial year 200,584.98 399,564.32 381,584.77 631,384.07 Redeemable Participating Shares issued 160,137.75 38,337.96 277,431.43 86,337.52 Redeemable Participating Share redeemed (115,923.07) (237,317.30) (131,207.59) (336,136.82) Number of Redeemable Participating Shares at end of financial year 244,799.66 200,584.98 527,808.61 381,584.77 Class I – USD Class Class I – USD Class Class X – USD Class Class X – USD Class 31 Dec 2017 31 Dec 2016 31 Dec 2017 31 Dec 2016 Number of Redeemable Participating Shares at beginning of financial year 87,446.08 82,946.28 241,956.79 479,811.76 Redeemable Participating Shares issued 36,247.47 24,097.57 146,824.24 77,077.49 Redeemable Participating Share redeemed (5,466.22) (19,597.77) (139,390.53) (314,932.46) Number of Redeemable Participating Shares at end of financial year 118,227.33 87,446.08 249,390.50 241,956.79

GemCap Investment Funds (Ireland) Plc (Formerly Gemini Investment Funds Plc)
279
Notes forming part of the Financial Statements (Continued)
6. SHARE CAPITAL (Continued)
London & Capital Global Star Equity Fund (Continued) Class X – EUR Class Class X – EUR Class 31 Dec 2017 31 Dec 2016 Number of Redeemable Participating Shares at beginning of financial year 58,684.45 6,612.68 Redeemable Participating Shares issued 44,639.82 74,396.48 Redeemable Participating Share redeemed (57,680.13) (22,324.71) Number of Redeemable Participating Shares at end of financial year 45,644.14 58,684.45
London & Capital UK Star Equity Fund Class I – GBP Class Class I – GBP Class Class X – GBP Class Class X – GBP Class 31 Dec 2017 31 Dec 2016 31 Dec 2017 31 Dec 2016 Number of Redeemable Participating Shares at beginning of financial year 46,667.35 814.66 124,074.17 112,095.35 Redeemable Participating Shares issued 9,621.06 80,440.74 22,377.31 82,303.78 Redeemable Participating Share redeemed (29,334.03) (34,588.05) (53,800.88) (70,324.96) Number of Redeemable Participating Shares at end of financial year 26,954.38 46,667.35 92,650.60 124,074.17

GemCap Investment Funds (Ireland) Plc (Formerly Gemini Investment Funds Plc)
280
Notes forming part of the Financial Statements (Continued)
6. SHARE CAPITAL (Continued)
Principal Asset Allocation Fund
Class A – GBP Class Class A – GBP Class Class B – GBP Class Class B – GBP Class 31 Dec 2017 31 Dec 2016 31 Dec 2017 31 Dec 2016 Number of Redeemable Participating Shares at beginning of financial year 281,027.27 281,650.19 4,831.29 2,830.92 Redeemable Participating Shares issued 29,945.50 62,107.34 80.27 2,200.90 Redeemable Participating Share redeemed (89,983.07) (62,730.26) (1,283.45) (200.53) Number of Redeemable Participating Shares at end of financial year 220,989.70 281,027.27 3,628.11 4,831.29
Class C – GBP Class Class C – GBP Class Class B – EUR Class Class B – EUR Class 31 Dec 2017 31 Dec 2016 31 Dec 2017 31 Dec 2016 Number of Redeemable Participating Shares at beginning of financial year 65,973.60 7,264.33 1,333.27 230.00 Redeemable Participating Shares issued 64,826.05 71,310.83 - 1,333.27 Redeemable Participating Share redeemed (15,195.05) (12,601.56) (758.74) (230.00) Number of Redeemable Participating Shares at end of financial year 115,604.60 65,973.60 574.53 1,333.27
Class C – EUR Class Class C – EUR Class Class B – USD Class Class B – USD Class 31 Dec 2017 31 Dec 2016 31 Dec 2017* 31 Dec 2016* Number of Redeemable Participating Shares at beginning of financial year 12,704.58 1,263.73 - 357.09 Redeemable Participating Shares issued 8,471.19 12,463.27 2,631.24 - Redeemable Participating Share redeemed (3,701.46) (1,022.42) (497.18) (357.09) Number of Redeemable Participating Shares at end of financial year 17,474.31 12,704.58 2,134.06 - * Terminated on 8th August 2016 and relaunched on 27th January 2017.
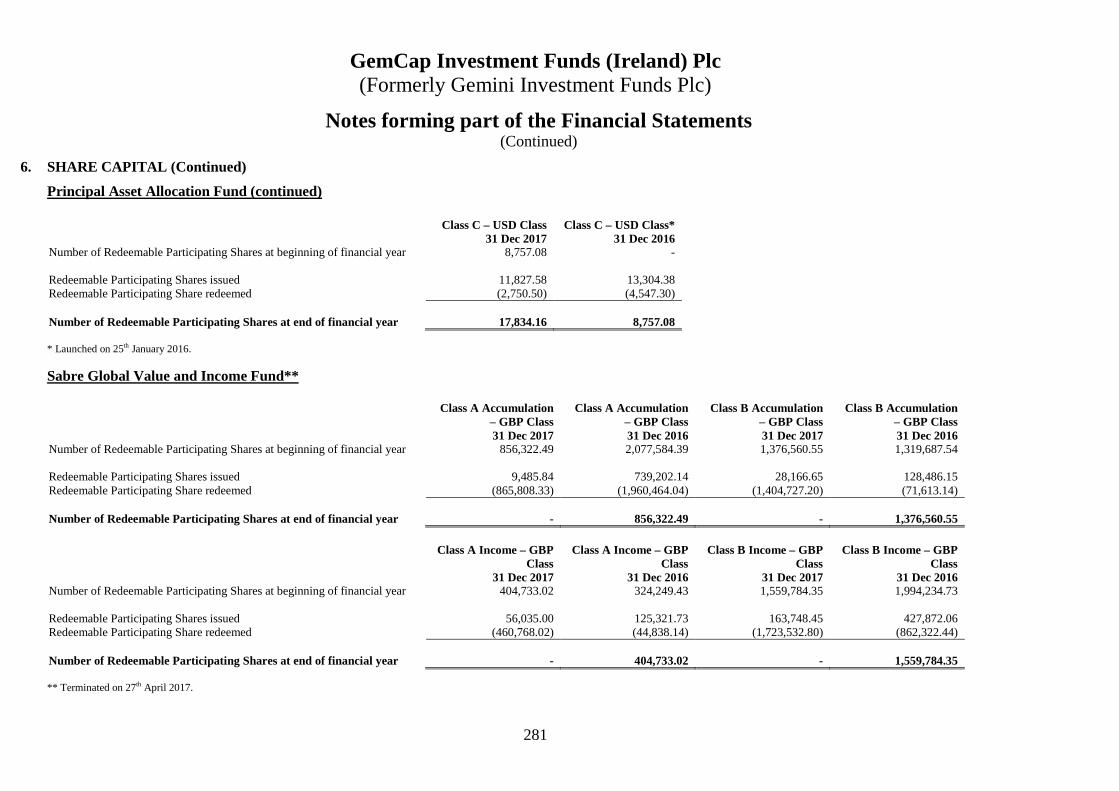
GemCap Investment Funds (Ireland) Plc (Formerly Gemini Investment Funds Plc)
281
Notes forming part of the Financial Statements (Continued)
6. SHARE CAPITAL (Continued)
Principal Asset Allocation Fund (continued)
Class C – USD Class Class C – USD Class* 31 Dec 2017 31 Dec 2016 Number of Redeemable Participating Shares at beginning of financial year 8,757.08 - Redeemable Participating Shares issued 11,827.58 13,304.38 Redeemable Participating Share redeemed (2,750.50) (4,547.30) Number of Redeemable Participating Shares at end of financial year 17,834.16 8,757.08 * Launched on 25th January 2016.
Sabre Global Value and Income Fund** Class A Accumulation
– GBP Class Class A Accumulation
– GBP Class Class B Accumulation
– GBP Class Class B Accumulation
– GBP Class 31 Dec 2017 31 Dec 2016 31 Dec 2017 31 Dec 2016 Number of Redeemable Participating Shares at beginning of financial year 856,322.49 2,077,584.39 1,376,560.55 1,319,687.54 Redeemable Participating Shares issued 9,485.84 739,202.14 28,166.65 128,486.15 Redeemable Participating Share redeemed (865,808.33) (1,960,464.04) (1,404,727.20) (71,613.14) Number of Redeemable Participating Shares at end of financial year - 856,322.49 - 1,376,560.55 Class A Income – GBP
Class Class A Income – GBP
Class Class B Income – GBP
Class Class B Income – GBP
Class 31 Dec 2017 31 Dec 2016 31 Dec 2017 31 Dec 2016 Number of Redeemable Participating Shares at beginning of financial year 404,733.02 324,249.43 1,559,784.35 1,994,234.73 Redeemable Participating Shares issued 56,035.00 125,321.73 163,748.45 427,872.06 Redeemable Participating Share redeemed (460,768.02) (44,838.14) (1,723,532.80) (862,322.44) Number of Redeemable Participating Shares at end of financial year - 404,733.02 - 1,559,784.35 ** Terminated on 27th April 2017.

GemCap Investment Funds (Ireland) Plc (Formerly Gemini Investment Funds Plc)
282
Notes forming part of the Financial Statements (Continued)
6. SHARE CAPITAL (Continued)
Third Avenue Real Estate Value Fund*
Class A1 – USD Class
Class A4 – (USD Institutional) Class
Class A5 – (EUR Institutional) Class
31 Dec 2017 31 Dec 2017 31 Dec 2017 Number of Redeemable Participating Shares at beginning of financial year - - - Redeemable Participating Shares issued 13,251.86 66,299.47 371,012.00 Redeemable Participating Share redeemed (20,181.49) (290,463.79) (96,757.00) In-specie transfer 127,650.12 1,862,475.77 2,354,641.00 Number of Redeemable Participating Shares at end of financial year 120,720.49 1,638,311.45 2,628,896.00
Third Avenue Value Fund**
Class A1 – USD Class Class A3 – EUR
Class*** Class A4 – (USD
Institutional) Class 31 Dec 2017 31 Dec 2017 31 Dec 2017 Number of Redeemable Participating Shares at beginning of financial year - - - Redeemable Participating Shares issued - - 33,500.00 Redeemable Participating Share redeemed (2,654.79) (7,271.52) - In-specie transfer 98,055.46 7,271.52 - Number of Redeemable Participating Shares at end of financial year 95,400.67 - 33,500.00 * Launched on 30th May 2017. ** Launched on 7th June 2017. *** Launched on 7th June 2017 and terminated on 13th July 2017.
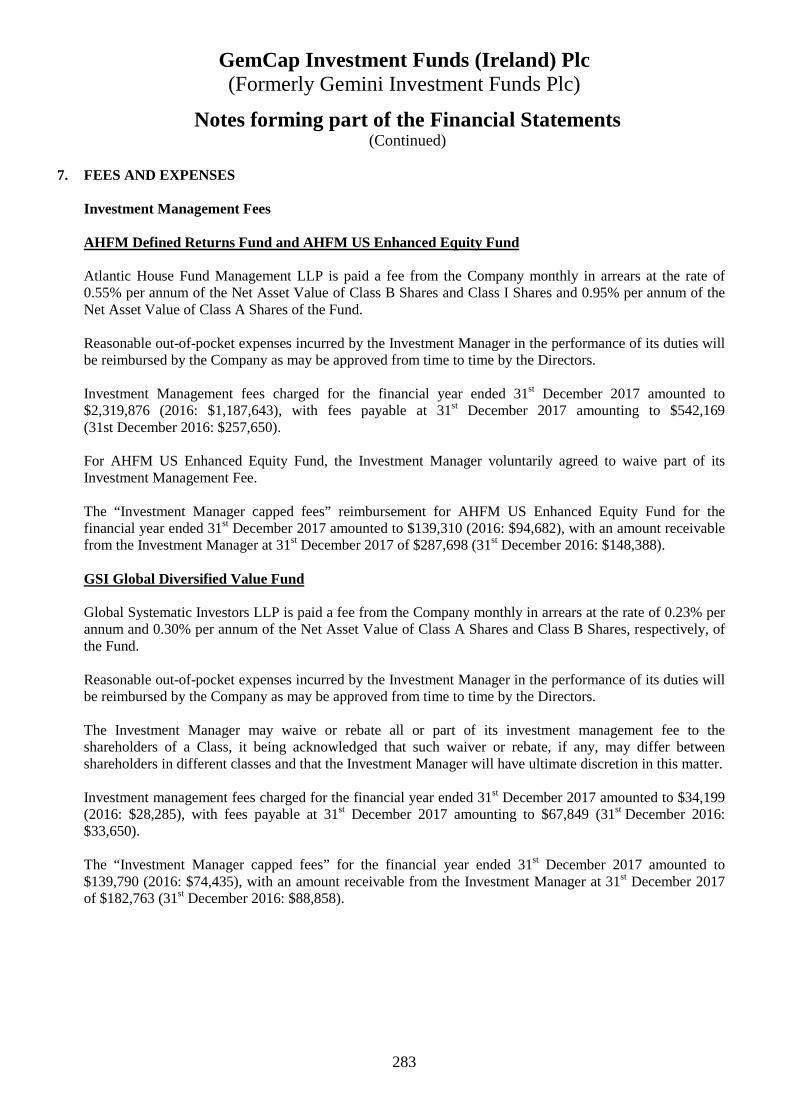
GemCap Investment Funds (Ireland) Plc (Formerly Gemini Investment Funds Plc)
283
Notes forming part of the Financial Statements (Continued)
7. FEES AND EXPENSES
Investment Management Fees AHFM Defined Returns Fund and AHFM US Enhanced Equity Fund Atlantic House Fund Management LLP is paid a fee from the Company monthly in arrears at the rate of 0.55% per annum of the Net Asset Value of Class B Shares and Class I Shares and 0.95% per annum of the Net Asset Value of Class A Shares of the Fund. Reasonable out-of-pocket expenses incurred by the Investment Manager in the performance of its duties will be reimbursed by the Company as may be approved from time to time by the Directors. Investment Management fees charged for the financial year ended 31st December 2017 amounted to $2,319,876 (2016: $1,187,643), with fees payable at 31st December 2017 amounting to $542,169 (31st December 2016: $257,650). For AHFM US Enhanced Equity Fund, the Investment Manager voluntarily agreed to waive part of its Investment Management Fee. The “Investment Manager capped fees” reimbursement for AHFM US Enhanced Equity Fund for the financial year ended 31st December 2017 amounted to $139,310 (2016: $94,682), with an amount receivable from the Investment Manager at 31st December 2017 of $287,698 (31st December 2016: $148,388). GSI Global Diversified Value Fund Global Systematic Investors LLP is paid a fee from the Company monthly in arrears at the rate of 0.23% per annum and 0.30% per annum of the Net Asset Value of Class A Shares and Class B Shares, respectively, of the Fund. Reasonable out-of-pocket expenses incurred by the Investment Manager in the performance of its duties will be reimbursed by the Company as may be approved from time to time by the Directors. The Investment Manager may waive or rebate all or part of its investment management fee to the shareholders of a Class, it being acknowledged that such waiver or rebate, if any, may differ between shareholders in different classes and that the Investment Manager will have ultimate discretion in this matter. Investment management fees charged for the financial year ended 31st December 2017 amounted to $34,199 (2016: $28,285), with fees payable at 31st December 2017 amounting to $67,849 (31st December 2016: $33,650). The “Investment Manager capped fees” for the financial year ended 31st December 2017 amounted to $139,790 (2016: $74,435), with an amount receivable from the Investment Manager at 31st December 2017 of $182,763 (31st December 2016: $88,858).
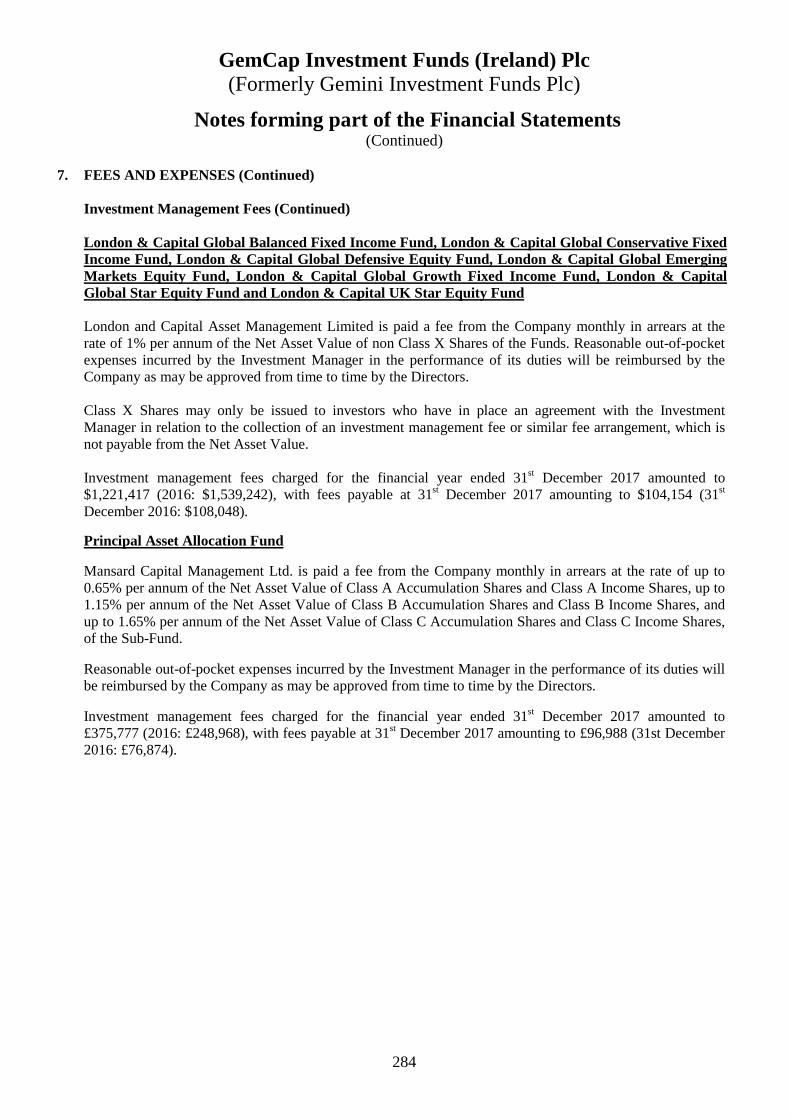
GemCap Investment Funds (Ireland) Plc (Formerly Gemini Investment Funds Plc)
284
Notes forming part of the Financial Statements (Continued)
7. FEES AND EXPENSES (Continued)
Investment Management Fees (Continued) London & Capital Global Balanced Fixed Income Fund, London & Capital Global Conservative Fixed Income Fund, London & Capital Global Defensive Equity Fund, London & Capital Global Emerging Markets Equity Fund, London & Capital Global Growth Fixed Income Fund, London & Capital Global Star Equity Fund and London & Capital UK Star Equity Fund London and Capital Asset Management Limited is paid a fee from the Company monthly in arrears at the rate of 1% per annum of the Net Asset Value of non Class X Shares of the Funds. Reasonable out-of-pocket expenses incurred by the Investment Manager in the performance of its duties will be reimbursed by the Company as may be approved from time to time by the Directors. Class X Shares may only be issued to investors who have in place an agreement with the Investment Manager in relation to the collection of an investment management fee or similar fee arrangement, which is not payable from the Net Asset Value. Investment management fees charged for the financial year ended 31st December 2017 amounted to $1,221,417 (2016: $1,539,242), with fees payable at 31st December 2017 amounting to $104,154 (31st December 2016: $108,048).
Principal Asset Allocation Fund Mansard Capital Management Ltd. is paid a fee from the Company monthly in arrears at the rate of up to 0.65% per annum of the Net Asset Value of Class A Accumulation Shares and Class A Income Shares, up to 1.15% per annum of the Net Asset Value of Class B Accumulation Shares and Class B Income Shares, and up to 1.65% per annum of the Net Asset Value of Class C Accumulation Shares and Class C Income Shares, of the Sub-Fund. Reasonable out-of-pocket expenses incurred by the Investment Manager in the performance of its duties will be reimbursed by the Company as may be approved from time to time by the Directors. Investment management fees charged for the financial year ended 31st December 2017 amounted to £375,777 (2016: £248,968), with fees payable at 31st December 2017 amounting to £96,988 (31st December 2016: £76,874).
GemCap Investment Funds (Ireland) Plc (Formerly Gemini Investment Funds Plc)
285
Notes forming part of the Financial Statements (Continued)
7. FEES AND EXPENSES (Continued)
Investment Management Fees (Continued) Sabre Global Value and Income Fund* Sabre Fund Management Limited was entitled to a fee from the Company monthly in arrears at the rate of up to 0.75% per annum of the Net Asset Value of Class A Accumulation Shares and Class A Income Shares, and up to 0.50% per annum of the Net Asset Value of Class B Accumulation Shares and Class B Income Shares, of the Fund. Reasonable out-of-pocket expenses incurred by the Investment Manager in the performance of its duties will be reimbursed by the Company as may be approved from time to time by the Directors. Investment management fees charged for the financial year ended 31st December 2017 amounted to £nil (2016: £nil), with fees payable at 31st December 2017 amounting to £nil (31st December 2016: £nil). Investment management out of pocket expenses charged for the financial year ended 31st December 2017 amounted to £nil (2016: £nil). * Terminated on 27th April 2017. Third Avenue Real Estate Value Fund* & Third Avenue Value Fund** Third Avenue Management LLC Fund is entitled to a fee from the Company monthly in arrears at the rate of up to 1.60% per annum of the Net Asset Value of Class A1 Shares and A3 Shares, and up to 1.10% per annum of the Net Asset Value of Class A4 Institutional Shares and A5 Institutional Income Shares, of the Fund. The Investment Manager has agreed to waive its fee until the Fund is of a sufficient size to justify the charging of an investment management fee. Investment management fees charged for the financial year ended 31st December 2017 amounted to $956,918 (2016: $nil), with fees payable at 31st December 2017 amounting to $280,318 (31st December 2016: $nil). The Investment Manager shall be entitled to be reimbursed out of the assets of the Fund for the reasonable out-of-pocket costs and expenses incurred by the Investment Manager in the performance of its duties. Where in an accounting period, the fees and expenses payable by the Fund in respect of the Class A1 Shares exceed 1.95% of the Net Asset Value of the Fund or in respect of Class A4 and Class A5 exceed 1.45% of the Net Asset Value of the Fund, the Investment Manager will waive its fees and/or reimburse the Fund for any fees paid to it so as to ensure that the Fund's annual fees and expenses do not exceed the relevant threshold. If subsequently, the annual fees and expenses payable by the Fund fall below 1.95% of the Net Asset Value of the Fund in respect of the Class A1 or fall below 1.45% of the Net Asset Value of the Fund in respect of Class A4 and Class A5 the Fund will pay to the Investment Manager, subject to the relevant threshold, the fees waived and/or amounts reimbursed by the Investment Manager to the Fund. This repayment may continue for up to three years after the end of the financial year in which an expense is waived or reimbursed by the Investment Manager, until the Investment Manager has been paid for the entire amount waived or reimbursed or such three year period expires. * Launched on 30th May 2017. ** Launched on 7th June 2017.
GemCap Investment Funds (Ireland) Plc (Formerly Gemini Investment Funds Plc)
286
Notes forming part of the Financial Statements (Continued)
7. FEES AND EXPENSES (Continued)
Investment Management Fees (Continued) Third Avenue Real Estate Value Fund & Third Avenue Value Fund (Continued) The “Investment Manager capped fees” reimbursement for Third Avenue Real Estate Fund and Third Avenue Value Fund for the financial year ended 31st December 2017 amounted to $135,373 (2016: $nil), with an amount receivable from the Investment Manager at 31st December 2017 of $80,088 (31st December 2016: $nil). Manager Fees The Manager shall be entitled to receive out of the assets of each Fund a fee of 0.10% per annum of the Net Asset Value of the Fund payable monthly in arrears subject to a minimum annual fee of €75,000. The Manager will also be entitled to be reimbursed out of the assets of the Fund for all reasonable, vouched out-of-pocket expenses incurred by it on behalf of the Fund. Manager’s fees charged for the financial year ended 31st December 2017 amounted to $484,552 (2016: $nil), with fees payable at 31st December 2017 amounting to $97,638 (31st December 2016: $nil). Global Distributor and UK Facilities Agent Fee The Company will discharge the fees and expenses of the Global Distributor and UK Facilities Agent, Gemini Investment Management Limited. Distribution fees charged for the financial year ended 31st December 2017 amounted to $542,748 (2016: $473,004), with fees payable at 31st December 2017 amounting to $42,962 (31st December 2016: $38,301).
Formation and Organisation Costs
The costs of forming the Company including the fees and expenses of legal advisers, product development fees and expenses, regulatory and listing fees and expenses and any other fees and expenses arising on the formation and launch of the Company have been expensed by the Company. In the event that new funds are created within the Company, the formation and organisation costs relating to each new fund, as determined by the Directors, will be charged to the new fund and amortised over a period of five financial years in the NAV calculations. However in accordance with IFRS these costs will be written off as charged in the financial statements.

GemCap Investment Funds (Ireland) Plc (Formerly Gemini Investment Funds Plc)
287
Notes forming part of the Financial Statements (Continued)
7. FEES AND EXPENSES (Continued)
Administration Fees
Up to 1st August 2016
The Administrator, in relation to the provision of its services is entitled to a fee payable out of the assets of each Sub-Fund accruing daily and payable monthly in arrears at the end of each calendar month at the following rates:
AHFM Sub-Funds GSI L&C Sub-Funds PAAF SGVIF Fee Description Fee Rate Fee Rate Fee Rate Fee Rate Fee Rate
Fund Accounting fee
0.016% per Sub-Fund per annum subject to a minimum annual fee for each Sub-Fund of €30,600, reduced by 50%
for the first 6 months following a Sub-Fund launch
€0.016% per Sub-Fund per annum subject to a
minimum annual fee for each Sub-Fund of €30,600,
reduced by 50% for the first 6 months following a Sub-
Fund launch
an aggregate fee across the Sub-Funds of 0.016% per
annum of the combined net asset value of all the L&C Sub-
Funds. This is subject to an aggregate minimum annual fee of €30,600 for each L&C Sub-
Fund. The aggregate fee will be pro-rated across the L&C Sub-Funds according to each Sub-
Fund’s net asset value and applied to each L&C Sub-Fund
0.016% per Sub-Fund per annum subject to a
minimum annual fee for each Sub-Fund of
€30,600, reduced by 50% for the first 6 months
following a Sub-Fund launch
0.016% per Sub-Fund per annum subject to a
minimum annual fee for each Sub-Fund of
€30,600, reduced by 50% for the first 6 months
following a Sub-Fund launch
Transfer Agent Fee- per annum €6,000 €6,000
an aggregate fee across the Company’s London & Capital
share classes of up to €2,500 per annum for each London &
Capital share class €6,000 N/a
Transfer Agent Fee- per share class
€2,350 per share class per annum subject to a minimum
monthly fee of €2,000
€2,350 subject to a minimum monthly fee of
€2,000 €2,500
€2,350 subject to a minimum monthly fee of
up to €2,000
€2,500 subject to a minimum monthly fee of
up to €2,000 Transfer Agent Fee-other Account maintenance and servicing fees will be charged at normal commercial rates Out-of-Pocket Administrator expenses
The Administrator is also entitled to reimbursement of all reasonable out-of-pocket expenses incurred for the benefit of the Sub-Fund out of the assets of the Sub-Fund in respect of which such charges and expenses were incurred
Financial statements fee
The Administrator shall also be entitled to receive a fee of up to €7,000 for each Sub-Fund for the preparation of financial statements
Trade order management fee N/a N/a 0.02% per annum of the net asset value of the Sub-Fund N/a N/a

GemCap Investment Funds (Ireland) Plc (Formerly Gemini Investment Funds Plc)
288
Notes forming part of the Financial Statements (Continued)
7. FEES AND EXPENSES (Continued)
Administration Fees (Continued)
From 1st August 2016 The Administrator, in relation to the provision of its services is entitled to a fee payable out of the assets of each Sub-Fund accruing daily and payable monthly in arrears at the end of each calendar month, at an annual rate of up to 0.0225% of the Net Asset Value per Sub-Fund for the first €100,000,000, up to 0.0175% of the Net Asset Value per Sub-Fund for the next €400,000,000 and up to 0.01% of the Net Asset Value per Sub-Fund in excess of €500,000,000. The charges are subject to a minimum annual fee of €25,000 per Sub-Fund. The Administrator is also entitled in respect of its registrar and transfer agent services, to a fee of €1,250 per share class per annum subject to a minimum annual fee of €5,000 per Sub-Fund, exclusive of out-of-pocket expenses. Below is the breakdown for administration and transfer agency fees charged and payable during and as at financial year ended 31st December 2017 and 31st December 2016: 31 December 2017 Admin fees Admin fees Transfer agency Transfer agency charged to payable at fees charged to fees payable at Sub-Fund Name 31 Dec 2017 31 Dec 2017 31 Dec 2017 31 Dec 2017 AHFM GBP 183,130 13,259 7,595 716
AUEE USD 37,439 4,765 2,888 953
GSI USD 36,836 4,766 6,158 953
L&CGBFI USD 78,951 4,762 15,905 1,400
L&CGCFI USD 76,794 4,762 12,464 953
L&CGDE USD 98,465 4,762 12,245 953
L&CGEME USD 97,347 4,762 11,879 953
L&CGGFI USD 68,422 5,755 16,213 1,400
L&CGSE USD 160,574 10,229 18,468 1,400
L&CUSE GBP 52,672 4,813 5,211 716
PAAF GBP 65,159 3,579 13,461 1,611
SGVIF* GBP 14,157 - 2,956 -
TAREVF** USD 70,786 4,972 15,116 2,220
TAVF*** USD 7,619 161 3,918 1,887 * Terminated on 27th April 2017. ** Launched on 30th May 2017. *** Launched on 7th June 2017.
GemCap Investment Funds (Ireland) Plc (Formerly Gemini Investment Funds Plc)
289
Notes forming part of the Financial Statements (Continued)
7. FEES AND EXPENSES (Continued)
Administration Fees (Continued)
31 December 2016 Admin fees Admin fees Transfer agency Transfer agency charged to payable at fees charged to fees payable at Sub-Fund Name 31 Dec 2016 31 Dec 2016 31 Dec 2016 31 Dec 2016
AHFM GBP 109,920 5,320 26,291 693
AUEE USD 31,000 4,122 1,337 345
GSI USD 39,058 4,127 2,682 774
L&CGBFI USD 121,161 7,957 27,189 10,197
L&CGCFI USD 112,167 7,624 18,335 3,354
L&CGDE USD 172,978 7,603 17,416 3,302
L&CGEME USD 91,910 2,390 8,435 723
L&CGGFI USD 70,170 7,011 21,361 9,929
L&CGSE USD 316,733 8,885 39,538 10,635
L&CUSE GBP 48,582 3,437 5,629 957
PAAF GBP 64,517 3,429 27,111 2,076
SGVIF GBP 36,776 3,435 17,442 1,104
Depositary and Depositary Oversight Fees
Up to 1st August 2016
Transaction and Safekeeping fees based on the Net Asset Value of the Company’s assets that vary, from 0.071% to 1.46% per annum, depending on the country in which the security is traded and held, subject to a minimum annual fee, exclusive of transaction charges and out-of-pocket expenses, of €55,000 per annum in total. The Company shall also bear the cost of all sub-custodian charges and transaction charges incurred by the Depositary, or any sub-custodian, which shall not exceed normal commercial rates. The Depositary is also entitled to reimbursement of properly vouched out of pocket expenses incurred by the Depositary, or any sub-custodian, for the benefit of the Company out of the assets of the Company in respect of which such charges and expenses were incurred. Depositary Fees are accrued daily and paid monthly in arrears.
The Depositary, in respect of its depositary oversight services, is entitled to a fee payable out of the assets of each Sub-Fund accruing daily and payable monthly in arrears at the end of each calendar month at an annual rate of up to 0.02% for a Net Asset Value per Sub-Fund below €500,000,000 and up to 0.01% for a Net Asset Value per Fund in excess of €500,000,000. The charges are subject to a minimum annual fee for each sub-fund exclusive of out-of-pocket expenses, of €10,000. From 1st August 2016 Transaction and Safekeeping fees based on the Net Asset Value of the Company's assets that vary, from 0.005% to 1.08% per annum, depending on the country in which the security is traded and held, subject to a minimum monthly fee, exclusive of transaction charges and out-of-pocket expenses, of €400 per Sub-Fund. The Sub-Fund shall also bear the cost of all sub-custodian charges and transaction charges incurred by the Depositary, or any sub-custodian, which shall not exceed normal commercial rates. The Depositary shall also be entitled to reimbursement of properly vouched out of pocket expenses incurred by the Depositary, or any sub-custodian, for the benefit of the Sub-Fund out of the assets of the Sub-Fund in respect of which such charges and expenses were incurred. Depositary Fees will be accrued daily and paid monthly in arrears.
GemCap Investment Funds (Ireland) Plc (Formerly Gemini Investment Funds Plc)
290
Notes forming part of the Financial Statements (Continued)
7. FEES AND EXPENSES (Continued)
Depositary and Depositary Oversight Fees (Continued) The Depositary, in respect of its depositary oversight services, shall be entitled to a fee payable out of the assets of each Sub-Fund accruing daily and payable monthly in arrears at the end of each calendar month at an annual rate of up to 0.025% of the Net Asset Value per Sub-Fund for the first €100,000,000, up to 0.02% of the Net Asset Value per Sub-Fund for the next €400,000,000 and up to 0.01% of the Net Asset Value per Sub-Fund in excess of €500,000,000. The charges are subject to a minimum annual fee for each Sub-Fund, exclusive of out-of-pocket expenses, of €10,000 and an annual fee of €5,000 per Sub-Fund for cash flow monitoring and reconciliation. Depositary and depositary oversight fees charged for the financial year ended 31st December 2017 amounted to $462,270 (2016: $328,680), with fees payable at 31st December 2017 amounting to $31,425 (31st December 2016: $58,621). Directors’ Fees The Directors are entitled to remuneration which will be accrued at the each Valuation Point of each Sub-Fund and paid quarterly for their services as Directors, provided that the aggregate emoluments of such Directors in respect of any 12 month financial period shall not exceed €250,000 plus any VAT or such other amount as the Directors may determine from time to time and notify to shareholders in advance. The Directors are entitled to be reimbursed for their reasonable out of pocket expenses (including travelling expenses) incurred in discharging their duties as Directors.
Directors’ fees and expenses charged for the financial year ended 31st December 2017 amounted to $140,516 (2016: $168,539), with fees payable at 31st December 2017 amounting to $3,942 (31st December 2016: $991). Audit Fees The Independent Auditor, Deloitte, earned the following fees (excluding VAT) from the Company:
2017 2016 EUR EUR Audit of Statutory Financial Statements 83,000 73,000 Other Assurance Services - - Taxation Services - - Other Services - - Total 83,000 73,000 Audit fees as disclosed on the Statement of Comprehensive Income are based on accrued figures for the financial year and are quoted in USD Dollars.
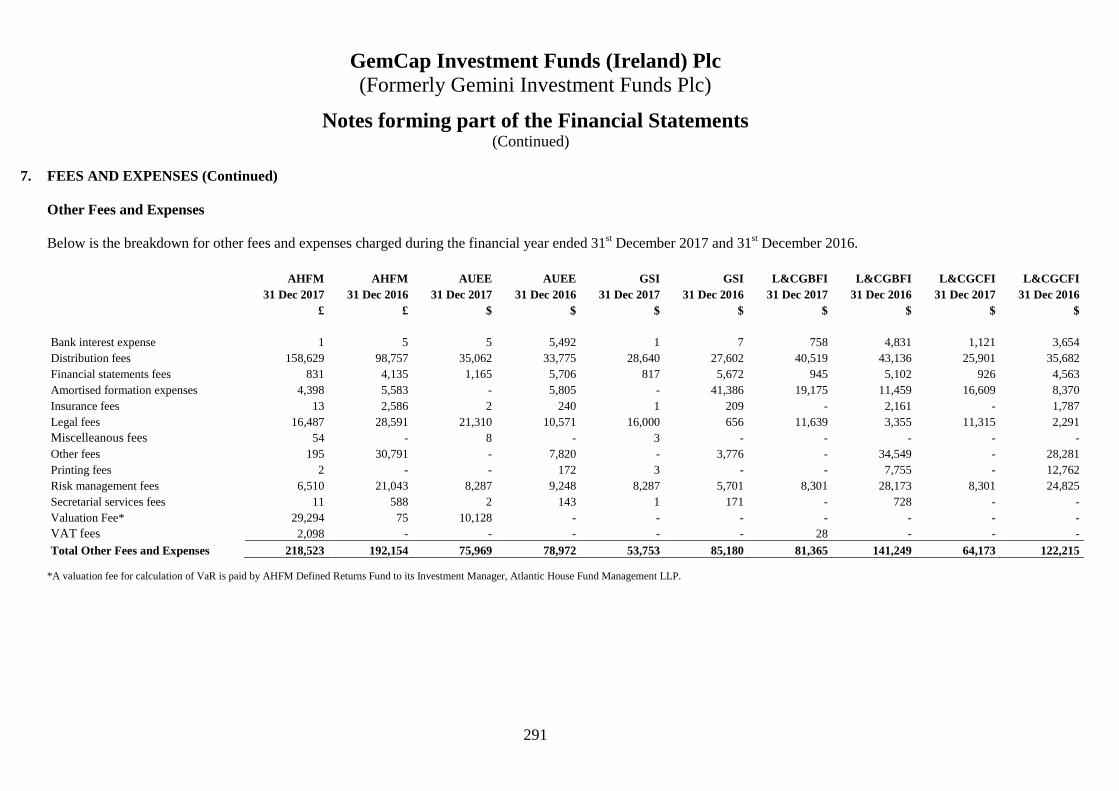
GemCap Investment Funds (Ireland) Plc (Formerly Gemini Investment Funds Plc)
291
Notes forming part of the Financial Statements (Continued)
7. FEES AND EXPENSES (Continued)
Other Fees and Expenses Below is the breakdown for other fees and expenses charged during the financial year ended 31st December 2017 and 31st December 2016.
AHFM AHFM AUEE AUEE GSI GSI L&CGBFI L&CGBFI L&CGCFI L&CGCFI 31 Dec 2017 31 Dec 2016 31 Dec 2017 31 Dec 2016 31 Dec 2017 31 Dec 2016 31 Dec 2017 31 Dec 2016 31 Dec 2017 31 Dec 2016 £ £ $ $ $ $ $ $ $ $
Bank interest expense 1 5 5 5,492 1 7 758 4,831 1,121 3,654 Distribution fees 158,629 98,757 35,062 33,775 28,640 27,602 40,519 43,136 25,901 35,682 Financial statements fees 831 4,135 1,165 5,706 817 5,672 945 5,102 926 4,563 Amortised formation expenses 4,398 5,583 - 5,805 - 41,386 19,175 11,459 16,609 8,370 Insurance fees 13 2,586 2 240 1 209 - 2,161 - 1,787 Legal fees 16,487 28,591 21,310 10,571 16,000 656 11,639 3,355 11,315 2,291 Miscelleanous fees 54 - 8 - 3 - - - - - Other fees 195 30,791 - 7,820 - 3,776 - 34,549 - 28,281 Printing fees 2 - - 172 3 - - 7,755 - 12,762 Risk management fees 6,510 21,043 8,287 9,248 8,287 5,701 8,301 28,173 8,301 24,825 Secretarial services fees 11 588 2 143 1 171 - 728 - - Valuation Fee* 29,294 75 10,128 - - - - - - - VAT fees 2,098 - - - - - 28 - - - Total Other Fees and Expenses 218,523 192,154 75,969 78,972 53,753 85,180 81,365 141,249 64,173 122,215
*A valuation fee for calculation of VaR is paid by AHFM Defined Returns Fund to its Investment Manager, Atlantic House Fund Management LLP.
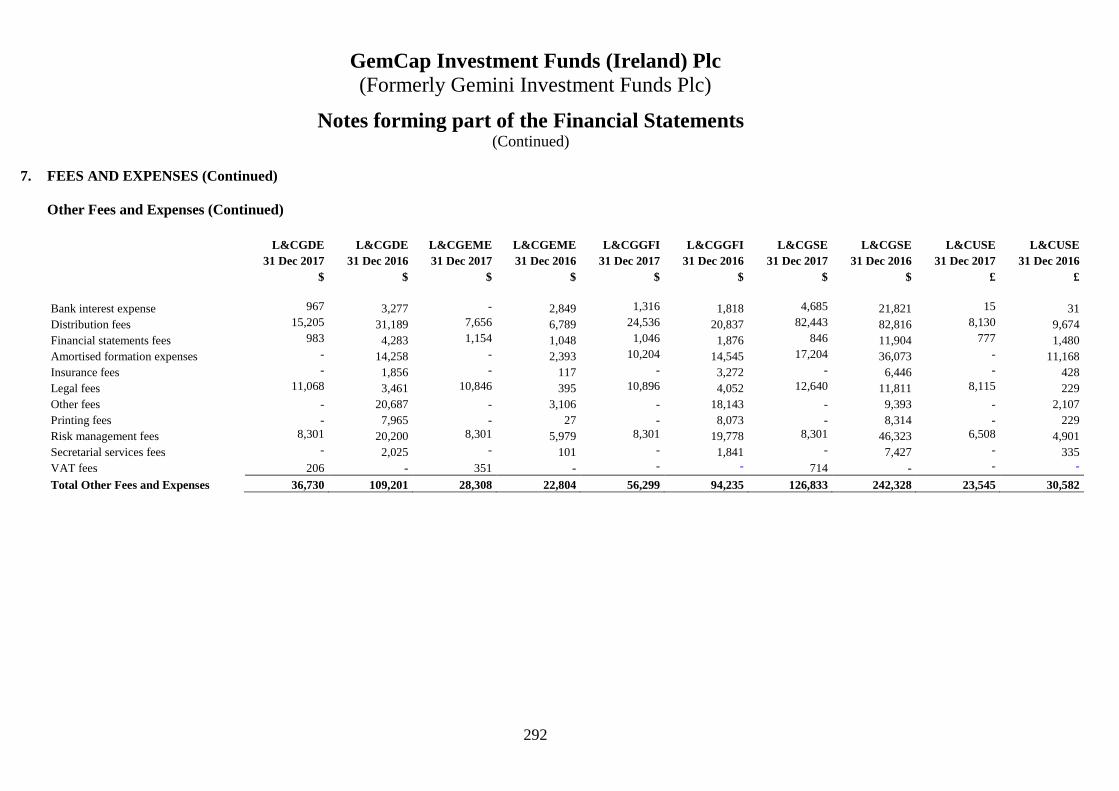
GemCap Investment Funds (Ireland) Plc (Formerly Gemini Investment Funds Plc)
292
Notes forming part of the Financial Statements (Continued)
7. FEES AND EXPENSES (Continued)
Other Fees and Expenses (Continued)
L&CGDE L&CGDE L&CGEME L&CGEME L&CGGFI L&CGGFI L&CGSE L&CGSE L&CUSE L&CUSE 31 Dec 2017 31 Dec 2016 31 Dec 2017 31 Dec 2016 31 Dec 2017 31 Dec 2016 31 Dec 2017 31 Dec 2016 31 Dec 2017 31 Dec 2016 $ $ $ $ $ $ $ $ £ £
Bank interest expense 967 3,277 - 2,849 1,316 1,818 4,685 21,821 15 31 Distribution fees 15,205 31,189 7,656 6,789 24,536 20,837 82,443 82,816 8,130 9,674 Financial statements fees 983 4,283 1,154 1,048 1,046 1,876 846 11,904 777 1,480 Amortised formation expenses - 14,258 - 2,393 10,204 14,545 17,204 36,073 - 11,168 Insurance fees - 1,856 - 117 - 3,272 - 6,446 - 428 Legal fees 11,068 3,461 10,846 395 10,896 4,052 12,640 11,811 8,115 229 Other fees - 20,687 - 3,106 - 18,143 - 9,393 - 2,107 Printing fees - 7,965 - 27 - 8,073 - 8,314 - 229 Risk management fees 8,301 20,200 8,301 5,979 8,301 19,778 8,301 46,323 6,508 4,901 Secretarial services fees - 2,025 - 101 - 1,841 - 7,427 - 335 VAT fees 206 - 351 - - - 714 - - -
Total Other Fees and Expenses 36,730 109,201 28,308 22,804 56,299 94,235 126,833 242,328 23,545 30,582

GemCap Investment Funds (Ireland) Plc (Formerly Gemini Investment Funds Plc)
293
Notes forming part of the Financial Statements (Continued)
7. FEES AND EXPENSES (Continued)
Other Fees and Expenses (Continued)
PAAF PAAF SGVIF* SGVIF TAREVF*** TAVF**** TOTAL TOTAL 31 Dec 2017 31 Dec 2016 31 Dec 2017 31 Dec 2016 31 Dec 2017 31 Dec 2017 31 Dec 2017 31 Dec 2016 £ £ £ £ $ $ $ $
Bank interest expense 28,218 60,763 102 215 560 19 45,949 126,401 Distribution fees 36,911 32,697 - - 14,790 5,512 542,748 473,004 Financial statements fees 881 4,205 332 4,556 686 661 12,864 59,628 Amortised formation expenses - 21,426 - 23,639 52,993 52,865 174,718 218,028 Insurance fees 2 396 - 77 - - 23 20,811 Legal fees 12,450 77,330 16,815 4,669 54,649 10,455 240,240 186,712 Other expenses 10 123 20,824 - - - 26,931 167 Other fees - 74,463 - 17,003 - - 251 294,222 Printing fees 2 - 2 - - - 12 45,378 Risk management fees 6,512 6,607 2,974 - 4,092 3,944 103,418 204,322 Secretarial services fees 2 810 - - - - 20 14,784 Valuation Fee** - - - - - - 47,881 102 Stamp fees - - - - 140,452 - 140,452 - Brokerage fees 22,718 - - - - - 29,278 - Upfront commission on subscription 137,962 - 5,000 - - - 184,245 - VAT fees - - (1) - 5,537 1,486 11,025 - Tax consulting fees - - 3,250 - - - 4,188 -
Total Other Fees and Expenses 245,668 278,820 49,298 50,159 273,759 74,942 1,564,243 1,643,559 * Terminated on 27th April 2017. **A valuation fee for calculation of VaR is paid by AHFM Defined Returns Fund to its Investment Manager, Atlantic House Fund Management LLP. *** Launched on 30th May 2017. **** Launched on 7th June 2017.
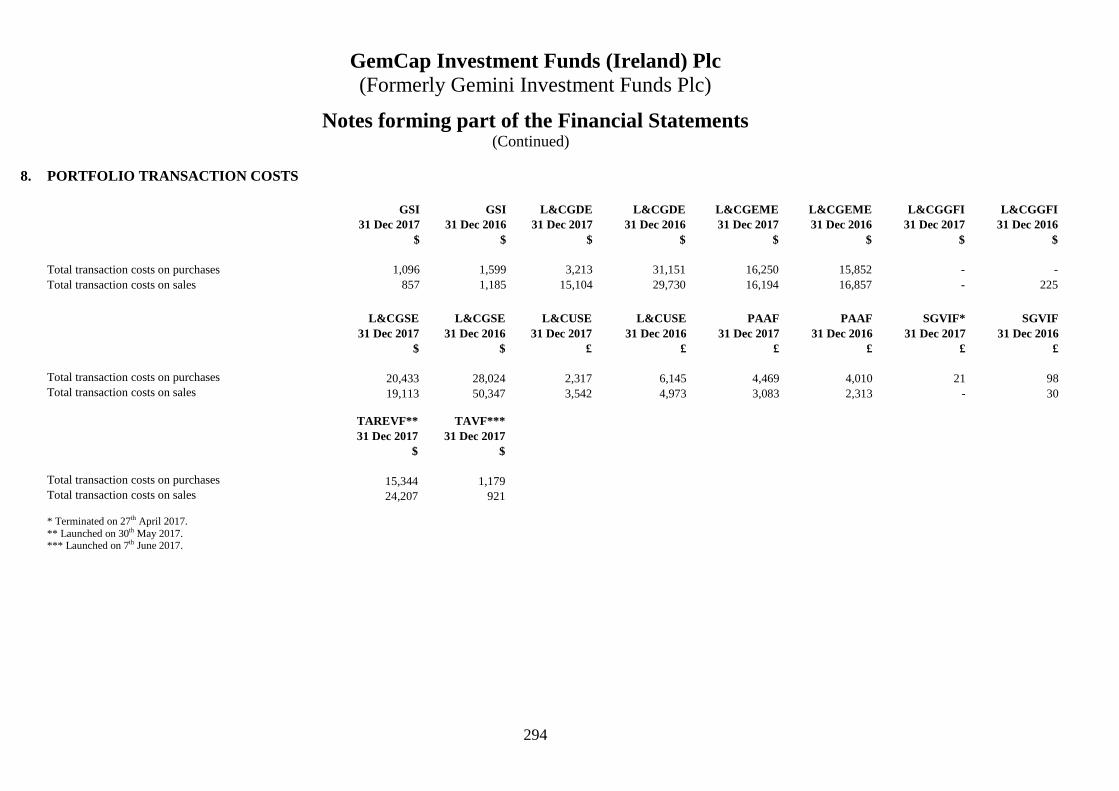
GemCap Investment Funds (Ireland) Plc (Formerly Gemini Investment Funds Plc)
294
Notes forming part of the Financial Statements (Continued)
8. PORTFOLIO TRANSACTION COSTS
GSI GSI L&CGDE L&CGDE L&CGEME L&CGEME L&CGGFI L&CGG FI 31 Dec 2017 31 Dec 2016 31 Dec 2017 31 Dec 2016 31 Dec 2017 31 Dec 2016 31 Dec 2017 31 Dec 2016 $ $ $ $ $ $ $ $
Total transaction costs on purchases 1,096 1,599 3,213 31,151 16,250 15,852 - - Total transaction costs on sales 857 1,185 15,104 29,730 16,194 16,857 - 225
L&CGSE L&CGSE L&CUSE L&CUSE PAAF PAAF SGVIF* SGVIF 31 Dec 2017 31 Dec 2016 31 Dec 2017 31 Dec 2016 31 Dec 2017 31 Dec 2016 31 Dec 2017 31 Dec 2016 $ $ £ £ £ £ £ £
Total transaction costs on purchases 20,433 28,024 2,317 6,145 4,469 4,010 21 98 Total transaction costs on sales 19,113 50,347 3,542 4,973 3,083 2,313 - 30 TAREVF** TAVF*** 31 Dec 2017 31 Dec 2017 $ $
Total transaction costs on purchases 15,344 1,179 Total transaction costs on sales 24,207 921 * Terminated on 27th April 2017. ** Launched on 30th May 2017. *** Launched on 7th June 2017.
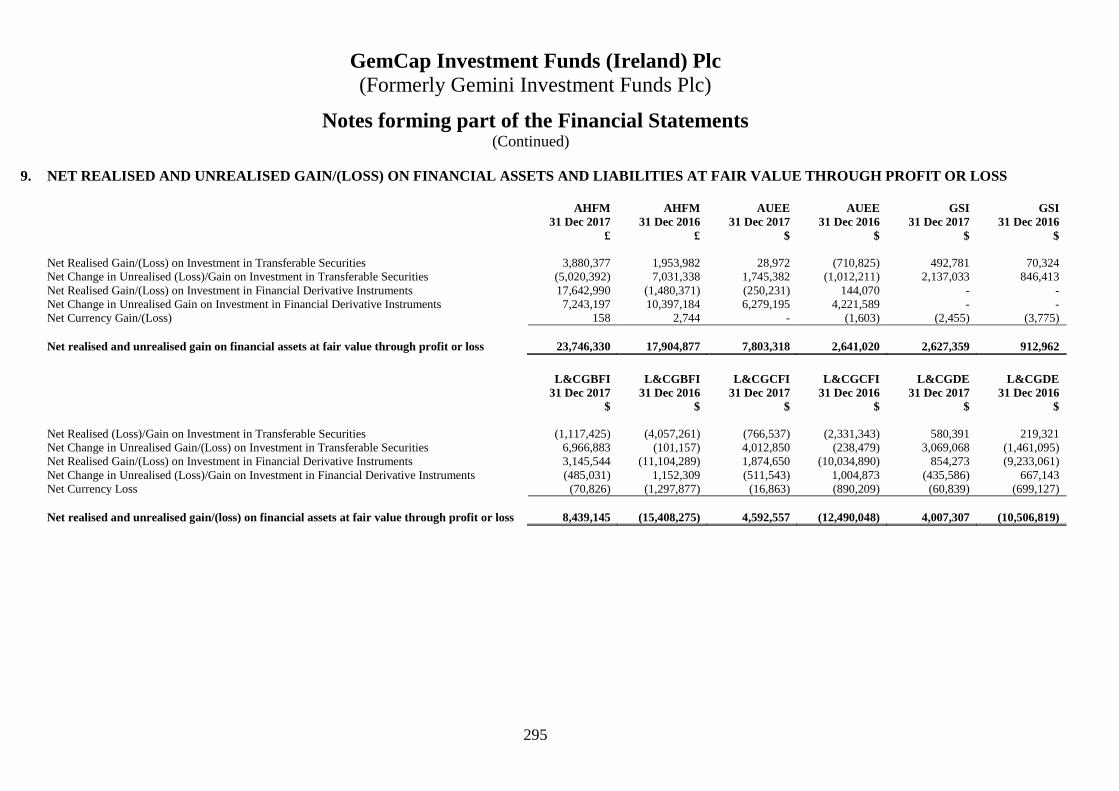
GemCap Investment Funds (Ireland) Plc (Formerly Gemini Investment Funds Plc)
295
Notes forming part of the Financial Statements (Continued)
9. NET REALISED AND UNREALISED GAIN/(LOSS) ON FINAN CIAL ASSETS AND LIABILITIES AT FAIR VALUE THROUGH P ROFIT OR LOSS
AHFM AHFM AUEE AUEE GSI GSI
31 Dec 2017 31 Dec 2016 31 Dec 2017 31 Dec 2016 31 Dec 2017 31 Dec 2016 £ £ $ $ $ $
Net Realised Gain/(Loss) on Investment in Transferable Securities 3,880,377 1,953,982 28,972 (710,825) 492,781 70,324 Net Change in Unrealised (Loss)/Gain on Investment in Transferable Securities (5,020,392) 7,031,338 1,745,382 (1,012,211) 2,137,033 846,413 Net Realised Gain/(Loss) on Investment in Financial Derivative Instruments 17,642,990 (1,480,371) (250,231) 144,070 - - Net Change in Unrealised Gain on Investment in Financial Derivative Instruments 7,243,197 10,397,184 6,279,195 4,221,589 - - Net Currency Gain/(Loss) 158 2,744 - (1,603) (2,455) (3,775)
Net realised and unrealised gain on financial assets at fair value through profit or loss 23,746,330 17,904,877 7,803,318 2,641,020 2,627,359 912,962
L&CGBFI L&CGBFI L&CGCFI L&CGCFI L&CGDE L&CGDE
31 Dec 2017 31 Dec 2016 31 Dec 2017 31 Dec 2016 31 Dec 2017 31 Dec 2016 $ $ $ $ $ $
Net Realised (Loss)/Gain on Investment in Transferable Securities (1,117,425) (4,057,261) (766,537) (2,331,343) 580,391 219,321 Net Change in Unrealised Gain/(Loss) on Investment in Transferable Securities 6,966,883 (101,157) 4,012,850 (238,479) 3,069,068 (1,461,095) Net Realised Gain/(Loss) on Investment in Financial Derivative Instruments 3,145,544 (11,104,289) 1,874,650 (10,034,890) 854,273 (9,233,061) Net Change in Unrealised (Loss)/Gain on Investment in Financial Derivative Instruments (485,031) 1,152,309 (511,543) 1,004,873 (435,586) 667,143 Net Currency Loss (70,826) (1,297,877) (16,863) (890,209) (60,839) (699,127)
Net realised and unrealised gain/(loss) on financial assets at fair value through profit or loss 8,439,145 (15,408,275) 4,592,557 (12,490,048) 4,007,307 (10,506,819)

GemCap Investment Funds (Ireland) Plc (Formerly Gemini Investment Funds Plc)
296
Notes forming part of the Financial Statements (Continued)
9. NET REALISED AND UNREALISED GAIN/(LOSS) ON FINAN CIAL ASSETS AND LIABILITIES AT FAIR VALUE THROUGH P ROFIT OR LOSS
(Continued)
L&CGEME L&CGEME L&CGGFI L&CGGFI L&CGSE L&CGSE 31 Dec 2017 31 Dec 2016 31 Dec 2017 31 Dec 2016 31 Dec 2017 31 Dec 2016
$ $ $ $ $ $
Net Realised Gain/(Loss) on Investment in Transferable Securities 731,757 (42,054) (46,047) (2,319,221) 7,759,853 (1,651,544) Net Change in Unrealised Gain/(Loss) on Investment in Transferable Securities 2,704,718 (249,845) 5,426,437 878,361 16,536,574 (114,420) Net Realised Gain/(Loss) on Investment in Financial Derivative Instruments 618,048 (2,153,346) 1,314,668 (3,726,908) 4,573,137 (12,874,285) Net Change in Unrealised (Loss)/Gain on Investment in Financial Derivative Instruments (43,848) 279,082 (97,366) 468,078 (567,273) 1,152,871 Net Currency (Loss)/Gain (24,761) (110,034) 17,209 (723,218) 363,525 (2,971,164) Net realised capital loss tax (11,155) - - - - - Net realised and unrealised gain/(loss) on financial assets at fair value through profit or loss 3,974,759 (2,276,197) 6,614,901 (5,422,908) 28,665,816 (16,458,542)
L&CUSE L&CUSE PAAF PAAF SGVIF* SGVIF
31 Dec 2017 31 Dec 2016 31 Dec 2017 31 Dec 2016 31 Dec 2017 31 Dec 2016 £ £ £ £ £ £
Net Realised Gain/(Loss) on Investment in Transferable Securities 1,282,808 858,906 (600,084) 46,562 232,869 851,620 Net Change in Unrealised (Loss)/Gain on Investment in Transferable Securities (668,829) 1,131,009 (1,155,264) 323,246 (163,357) 19,334 Net Realised Gain/(Loss) on Investment in Financial Derivative Instruments - - 1,542,005 1,144,940 - (151,910) Net Change in Unrealised Gain/(Loss) on Investment in Financial Derivative Instruments - - 227,259 (51,216) - - Net Currency (Loss)/Gain (972) 650 (61,167) 120,718 (24,324) (25,126) Net realised capital gain tax - - - - (1,405) - Net realised and unrealised gain/(loss) on financial assets at fair value through profit or loss 613,007 1,990,565 (47,251) 1,584,250 43,783 693,918 * Terminated on 27th April 2017.

GemCap Investment Funds (Ireland) Plc (Formerly Gemini Investment Funds Plc)
297
Notes forming part of the Financial Statements (Continued)
9. NET REALISED AND UNREALISED GAIN/(LOSS) ON FINAN CIAL ASSETS AND LIABILITIES AT FAIR VALUE THROUGH P ROFIT OR LOSS
(Continued)
TAREVF* TAVF** 31 Dec 2017 31 Dec 2017
$ $
Net Realised Gain on Investment in Transferable Securities 2,300,670 60,122 Net Change in Unrealised Gain on Investment in Transferable Securities 11,748,421 257,800 Net Realised Gain on Investment in Financial Derivative Instruments 2,761,918 3,155 Net Change in Unrealised Gain/(Loss) on Investment in Financial Derivative Instruments 622,727 (264) Net Currency (Loss)/Gain (3,299) 973 Net realised and unrealised gain on financial assets at fair value through profit or loss 17,430,437 321,786 * Launched on 30th May 2017. ** Launched on 7th June 2017.
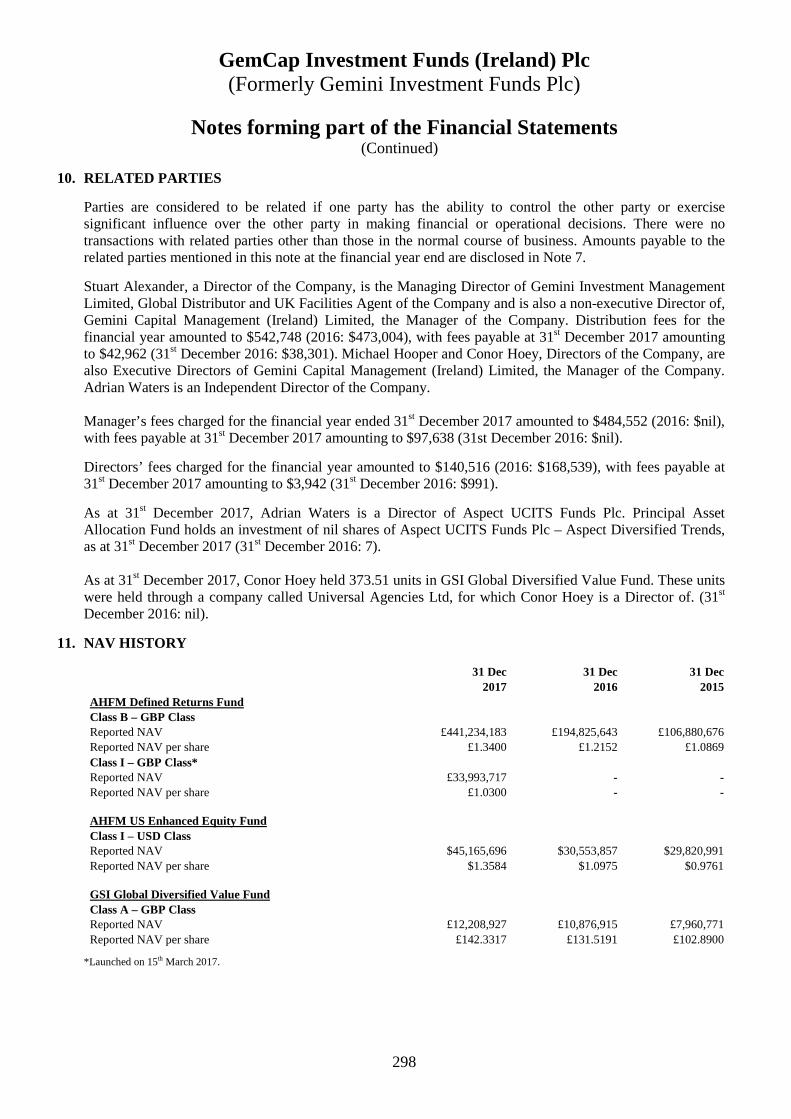
GemCap Investment Funds (Ireland) Plc (Formerly Gemini Investment Funds Plc)
298
Notes forming part of the Financial Statements (Continued)
10. RELATED PARTIES
Parties are considered to be related if one party has the ability to control the other party or exercise significant influence over the other party in making financial or operational decisions. There were no transactions with related parties other than those in the normal course of business. Amounts payable to the related parties mentioned in this note at the financial year end are disclosed in Note 7.
Stuart Alexander, a Director of the Company, is the Managing Director of Gemini Investment Management Limited, Global Distributor and UK Facilities Agent of the Company and is also a non-executive Director of, Gemini Capital Management (Ireland) Limited, the Manager of the Company. Distribution fees for the financial year amounted to $542,748 (2016: $473,004), with fees payable at 31st December 2017 amounting to $42,962 (31st December 2016: $38,301). Michael Hooper and Conor Hoey, Directors of the Company, are also Executive Directors of Gemini Capital Management (Ireland) Limited, the Manager of the Company. Adrian Waters is an Independent Director of the Company. Manager’s fees charged for the financial year ended 31st December 2017 amounted to $484,552 (2016: $nil), with fees payable at 31st December 2017 amounting to $97,638 (31st December 2016: $nil).
Directors’ fees charged for the financial year amounted to $140,516 (2016: $168,539), with fees payable at 31st December 2017 amounting to $3,942 (31st December 2016: $991).
As at 31st December 2017, Adrian Waters is a Director of Aspect UCITS Funds Plc. Principal Asset Allocation Fund holds an investment of nil shares of Aspect UCITS Funds Plc – Aspect Diversified Trends, as at 31st December 2017 (31st December 2016: 7). As at 31st December 2017, Conor Hoey held 373.51 units in GSI Global Diversified Value Fund. These units were held through a company called Universal Agencies Ltd, for which Conor Hoey is a Director of. (31st December 2016: nil).
11. NAV HISTORY
31 Dec 31 Dec 31 Dec 2017 2016 2015 AHFM Defined Returns Fund Class B – GBP Class Reported NAV £441,234,183 £194,825,643 £106,880,676 Reported NAV per share £1.3400 £1.2152 £1.0869 Class I – GBP Class* Reported NAV £33,993,717 - - Reported NAV per share £1.0300 - - AHFM US Enhanced Equity Fund Class I – USD Class Reported NAV $45,165,696 $30,553,857 $29,820,991 Reported NAV per share $1.3584 $1.0975 $0.9761 GSI Global Diversified Value Fund Class A – GBP Class Reported NAV £12,208,927 £10,876,915 £7,960,771 Reported NAV per share £142.3317 £131.5191 £102.8900
*Launched on 15th March 2017.

GemCap Investment Funds (Ireland) Plc (Formerly Gemini Investment Funds Plc)
299
Notes forming part of the Financial Statements (Continued)
11. NAV HISTORY (continued)
31 Dec 31 Dec 31 Dec 2017 2016 2015 London & Capital Global Balanced Fixed Income Fund Class I – USD Class Reported NAV $1,955,345 $1,201,161 $1,091,964 Reported NAV per share $113.0384 $105.7844 $104.0006 Class I – GBP Class Reported NAV £14,413,216 £17,414,217 £22,698,262 Reported NAV per share £111.4494 £105.8133 £105.0031 Class X – USD Class Reported NAV $12,683,853 $12,113,909 $12,203,651 Reported NAV per share $106.5309 $102.8982 $103.2070 Class X – GBP Class Reported NAV £40,901,239 £37,294,265 £31,495,546 Reported NAV per share £104.6914 £102.3459 £103.6663 Class X – EUR Class Reported NAV €3,197,088 €1,043,476 €735,252 Reported NAV per share €100.2800 €97.4800 €99.5700 London & Capital Global Conservative Fixed Income Fund Class I – USD Class Reported NAV $13,312,115 $724,791 $653,804 Reported NAV per share $104.6610 $99.7344 $98.6563 Class I – GBP Class Reported NAV £9,840,780 £16,339,556 £18,650,944 Reported NAV per share £107.5262 £103.8750 £103.7080 Class X – USD Class Reported NAV $6,270,484 $6,664,847 $6,560,359 Reported NAV per share $103.9675 $101.5527 $101.7672 Class X – GBP Class Reported NAV £26,133,570 £30,957,284 £22,884,532 Reported NAV per share £100.7044 £99.7192 £100.8480 Class X – EUR Class Reported NAV €375,565 €428,705 - Reported NAV per share €103.9675 €98.3100 - London & Capital Global Defensive Equity Fund Class I – USD Class Reported NAV $397,220 $489,163 $512,178 Reported NAV per share $102.6502 $95.6459 $95.2204 Class I – GBP Class Reported NAV £5,633,473 £16,451,293 £14,150,860 Reported NAV per share £102.7737 £97.2473 £98.1322 Class X – USD Class Reported NAV $3,614,711 $9,342,570 $5,054,198 Reported NAV per share $107.6357 $101.0810 $100.9943 Class X – GBP Class Reported NAV £12,078,381 £28,241,363 £16,937,754 Reported NAV per share £103.4732 £98.16230 £99.2164 Class X – EUR Class Reported NAV €366,060 €690,913 €133,668 Reported NAV per share €106.6616 €100.5800 €102.2500

GemCap Investment Funds (Ireland) Plc (Formerly Gemini Investment Funds Plc)
300
Notes forming part of the Financial Statements (Continued)
11. NAV HISTORY (Continued)
31 Dec 31 Dec 31 Dec 2017 2016 2015
London & Capital Global Emerging Markets Equity Fund Class I – USD Class Reported NAV $90,101 £74,733 - Reported NAV per share $120.8563 $100.2424 - Class I – GBP Class Reported NAV £3,597,510 £3,312,075 £1,287,298 Reported NAV per share £110.3204 £92.8472 £97.2231 Class X – USD Class Reported NAV $4,240,197 $3,539,061 $6,784,835 Reported NAV per share $107.2329 $89.1151 $92.7212 Class X – GBP Class Reported NAV £9,759,600 £5,523,370 £5,010,144 Reported NAV per share £104.7749 £87.9745 £92.7123 Class X – EUR Class Reported NAV €121,001 €94,447 €41,604 Reported NAV per share €105.9796 €89.0622 €94.5550
London & Capital Global Growth Fixed Income Fund Class I – USD Class Reported NAV $852,554 $534,140 $511,114 Reported NAV per share $117.5268 $107.1167 $102.4990 Class I – EUR Class* Reported NAV €4,565,079 - - Reported NAV per share €100.8500 - - Class I – GBP Class Reported NAV £8,472,090 £7,595,854 £4,380,138 Reported NAV per share £116.3313 £107.5121 £103.6566 Class X – USD Class Reported NAV $10,006,049 $8,042,368 $15,314,130 Reported NAV per share $108.0248 $101.9403 $100.2886 Class X – GBP Class Reported NAV £25,264,973 £14,508,050 £16,392,502 Reported NAV per share £108.3922 £103.1870 £101.9260 Class X – EUR Class Reported NAV €1,558,568 €629,936 €346,955 Reported NAV per share €102.7300 €100.3151 €99.7300
* Launched on 31st August 2017.
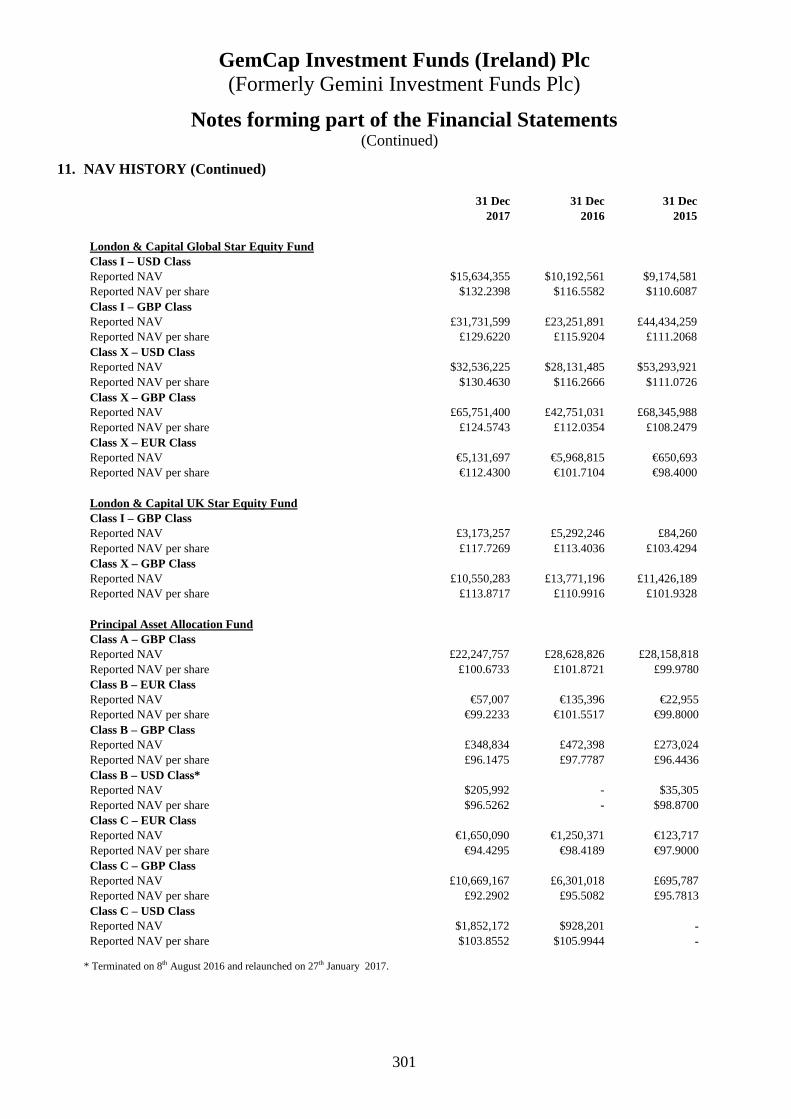
GemCap Investment Funds (Ireland) Plc (Formerly Gemini Investment Funds Plc)
301
Notes forming part of the Financial Statements (Continued)
11. NAV HISTORY (Continued) 31 Dec 31 Dec 31 Dec 2017 2016 2015
London & Capital Global Star Equity Fund Class I – USD Class Reported NAV $15,634,355 $10,192,561 $9,174,581 Reported NAV per share $132.2398 $116.5582 $110.6087 Class I – GBP Class Reported NAV £31,731,599 £23,251,891 £44,434,259 Reported NAV per share £129.6220 £115.9204 £111.2068 Class X – USD Class Reported NAV $32,536,225 $28,131,485 $53,293,921 Reported NAV per share $130.4630 $116.2666 $111.0726 Class X – GBP Class Reported NAV £65,751,400 £42,751,031 £68,345,988 Reported NAV per share £124.5743 £112.0354 £108.2479 Class X – EUR Class Reported NAV €5,131,697 €5,968,815 €650,693 Reported NAV per share €112.4300 €101.7104 €98.4000
London & Capital UK Star Equity Fund Class I – GBP Class Reported NAV £3,173,257 £5,292,246 £84,260 Reported NAV per share £117.7269 £113.4036 £103.4294 Class X – GBP Class Reported NAV £10,550,283 £13,771,196 £11,426,189 Reported NAV per share £113.8717 £110.9916 £101.9328
Principal Asset Allocation Fund Class A – GBP Class Reported NAV £22,247,757 £28,628,826 £28,158,818 Reported NAV per share £100.6733 £101.8721 £99.9780 Class B – EUR Class Reported NAV €57,007 €135,396 €22,955 Reported NAV per share €99.2233 €101.5517 €99.8000 Class B – GBP Class Reported NAV £348,834 £472,398 £273,024 Reported NAV per share £96.1475 £97.7787 £96.4436 Class B – USD Class* Reported NAV $205,992 - $35,305 Reported NAV per share $96.5262 - $98.8700 Class C – EUR Class Reported NAV €1,650,090 €1,250,371 €123,717 Reported NAV per share €94.4295 €98.4189 €97.9000 Class C – GBP Class Reported NAV £10,669,167 £6,301,018 £695,787 Reported NAV per share £92.2902 £95.5082 £95.7813 Class C – USD Class Reported NAV $1,852,172 $928,201 - Reported NAV per share $103.8552 $105.9944 -
* Terminated on 8th August 2016 and relaunched on 27th January 2017.
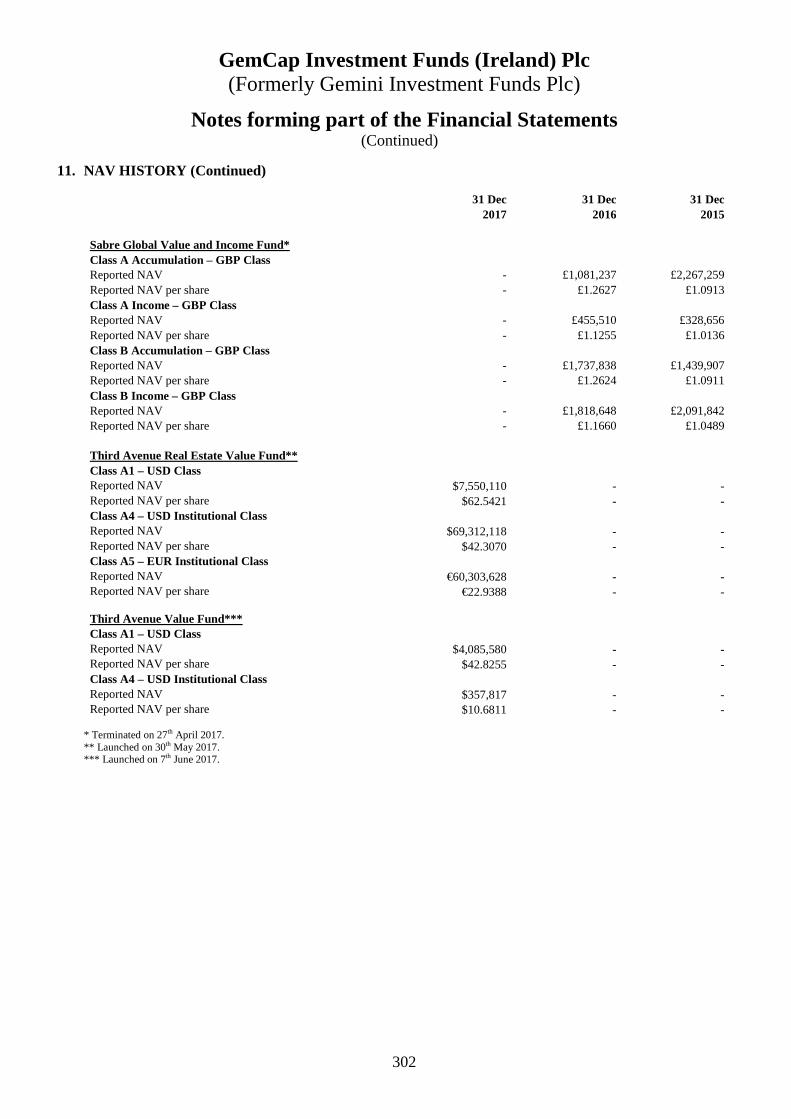
GemCap Investment Funds (Ireland) Plc (Formerly Gemini Investment Funds Plc)
302
Notes forming part of the Financial Statements (Continued)
11. NAV HISTORY (Continued)
31 Dec 31 Dec 31 Dec 2017 2016 2015
Sabre Global Value and Income Fund* Class A Accumulation – GBP Class Reported NAV - £1,081,237 £2,267,259 Reported NAV per share - £1.2627 £1.0913 Class A Income – GBP Class Reported NAV - £455,510 £328,656 Reported NAV per share - £1.1255 £1.0136 Class B Accumulation – GBP Class Reported NAV - £1,737,838 £1,439,907 Reported NAV per share - £1.2624 £1.0911 Class B Income – GBP Class Reported NAV - £1,818,648 £2,091,842 Reported NAV per share - £1.1660 £1.0489 Third Avenue Real Estate Value Fund** Class A1 – USD Class Reported NAV $7,550,110 - - Reported NAV per share $62.5421 - - Class A4 – USD Institutional Class Reported NAV $69,312,118 - - Reported NAV per share $42.3070 - - Class A5 – EUR Institutional Class Reported NAV €60,303,628 - - Reported NAV per share €22.9388 - -
Third Avenue Value Fund*** Class A1 – USD Class Reported NAV $4,085,580 - - Reported NAV per share $42.8255 - - Class A4 – USD Institutional Class Reported NAV $357,817 - - Reported NAV per share $10.6811 - -
* Terminated on 27th April 2017. ** Launched on 30th May 2017. *** Launched on 7th June 2017.

GemCap Investment Funds (Ireland) Plc (Formerly Gemini Investment Funds Plc)
303
Notes forming part of the Financial Statements (Continued)
12. NAV Reconciliation The net assets value in the financial statements as at 31st December 2017 differs from that included in the published valuations as at 31st December 2017. The difference is due to the change in methodology in accounting for organisation costs as prescribed by IFRS, and the methodology indicated in the most recent Prospectus. This does not have any effect on the published or dealing Net Asset Values of any of the Sub-Funds.
AHFM Defined Returns Fund 31 Dec 31 Dec 2017 2016 £ £ Net Assets for financial statement purposes 475,227,900 194,825,643 Adjustment for unamortised organisation costs - 586 Total Net Assets for shareholder dealing/prospectus 475,227,900 194,826,229
AHFM US Enhanced Equity Fund 31 Dec 31 Dec 2017 2016 $ $ Net Assets for financial statement purposes 45,165,696 30,553,857 Adjustment for unamortised organisation costs - -
Total Net Assets for shareholder dealing/prospectus 45,165,696 30,553,857
GSI Global Diversified Value Fund 31 Dec 31 Dec 2017 2016 $ $ Net Assets for financial statement purposes 16,515,626 13,366,386 Adjustment for unamortised organisation costs (23,894) 35,474
Total Net Assets for shareholder dealing/prospectus 16,539,520 13,401,860
London & Capital Global Balanced Fixed Income Fund 31 Dec 31 Dec 2017 2016 $ $ Net Assets for financial statement purposes 93,304,890 82,016,210 Adjustment for unamortised organisation costs - -
Total Net Assets for shareholder dealing/prospectus 93,304,890 82,016,210
London & Capital Global Conservative Fixed Income Fund 31 Dec 31 Dec 2017 2016 $ $ Net Assets for financial statement purposes 56,397,828 66,284,154 Adjustment for unamortised organisation costs - -
Total Net Assets for shareholder dealing/prospectus 56,397,828 66,284,154
London & Capital Global Defensive Equity Fund 31 Dec 31 Dec 2017 2016 $ $ Net Assets for financial statement purposes 28,411,207 65,784,952 Adjustment for unamortised organisation costs (2,688) -
Total Net Assets for shareholder dealing/prospectus 28,413,895 65,784,952

GemCap Investment Funds (Ireland) Plc (Formerly Gemini Investment Funds Plc)
304
Notes forming part of the Financial Statements (Continued)
12. NAV Reconciliation (Continued)
London & Capital Global Emerging Markets Equity Fund 31 Dec 31 Dec 2017 2016
$ $
Net Assets for financial statement purposes 22,544,427 14,630,929
Adjustment for unamortised organisation costs (1,242) 2,393
Total Net Assets for shareholder dealing/prospectus 22,545,669 14,633,322
London & Capital Global Growth Fixed Income Fund 31 Dec 31 Dec 2017 2016 $ $ Net Assets for financial statement purposes 63,849,690 36,553,621 Adjustment for unamortised organisation costs - 10,471
Total Net Assets for shareholder dealing/prospectus 63,849,690 36,564,092
London & Capital Global Star Equity Fund 31 Dec 31 Dec 2017 2016 $ $ Net Assets for financial statement purposes 186,202,847 126,176,164 Adjustment for unamortised organisation costs - 36,073
Total Net Assets for shareholder dealing/prospectus 186,202,847 126,212,237
London & Capital UK Star Equity Fund 31 Dec 31 Dec 2017 2016 £ £ Net Assets for financial statement purposes 13,723,540 19,063,442 Adjustment for unamortised organisation costs (4,921) 6,746
Total Net Assets for shareholder dealing/prospectus 13,728,461 19,070,188
Principal Asset Allocation Fund 31 Dec 31 Dec 2017 2016 £ £ Net Assets for financial statement purposes 36,302,568 37,339,008 Adjustment for unamortised organisation costs (10,646) 16,028
Total Net Assets for shareholder dealing/prospectus 36,313,214 37,355,036
Third Avenue Real Estate Value Fund* 31 Dec 2017 $ Net Assets for financial statement purposes 149,274,824 Adjustment for unamortised organisation costs (47,398)
Total Net Assets for shareholder dealing/prospectus 149,322,222
Third Avenue Value Fund** 31 Dec 2017 $ Net Assets for financial statement purposes 4,443,397 Adjustment for unamortised organisation costs (47,477)
Total Net Assets for shareholder dealing/prospectus 4,490,874
* Launched on 30th May 2017, therefore comparative information is not available. ** Launched on 7th June 2017, therefore comparative information is not available.
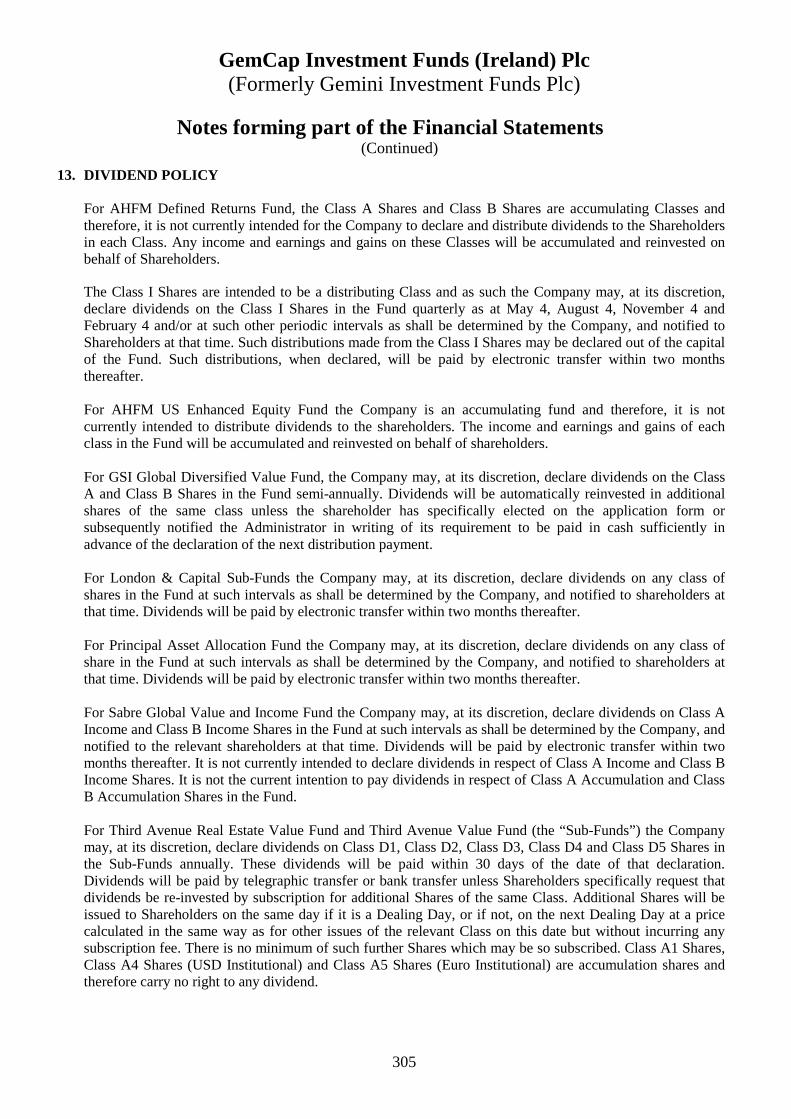
GemCap Investment Funds (Ireland) Plc (Formerly Gemini Investment Funds Plc)
305
Notes forming part of the Financial Statements (Continued)
13. DIVIDEND POLICY For AHFM Defined Returns Fund, the Class A Shares and Class B Shares are accumulating Classes and therefore, it is not currently intended for the Company to declare and distribute dividends to the Shareholders in each Class. Any income and earnings and gains on these Classes will be accumulated and reinvested on behalf of Shareholders. The Class I Shares are intended to be a distributing Class and as such the Company may, at its discretion, declare dividends on the Class I Shares in the Fund quarterly as at May 4, August 4, November 4 and February 4 and/or at such other periodic intervals as shall be determined by the Company, and notified to Shareholders at that time. Such distributions made from the Class I Shares may be declared out of the capital of the Fund. Such distributions, when declared, will be paid by electronic transfer within two months thereafter. For AHFM US Enhanced Equity Fund the Company is an accumulating fund and therefore, it is not currently intended to distribute dividends to the shareholders. The income and earnings and gains of each class in the Fund will be accumulated and reinvested on behalf of shareholders. For GSI Global Diversified Value Fund, the Company may, at its discretion, declare dividends on the Class A and Class B Shares in the Fund semi-annually. Dividends will be automatically reinvested in additional shares of the same class unless the shareholder has specifically elected on the application form or subsequently notified the Administrator in writing of its requirement to be paid in cash sufficiently in advance of the declaration of the next distribution payment. For London & Capital Sub-Funds the Company may, at its discretion, declare dividends on any class of shares in the Fund at such intervals as shall be determined by the Company, and notified to shareholders at that time. Dividends will be paid by electronic transfer within two months thereafter. For Principal Asset Allocation Fund the Company may, at its discretion, declare dividends on any class of share in the Fund at such intervals as shall be determined by the Company, and notified to shareholders at that time. Dividends will be paid by electronic transfer within two months thereafter. For Sabre Global Value and Income Fund the Company may, at its discretion, declare dividends on Class A Income and Class B Income Shares in the Fund at such intervals as shall be determined by the Company, and notified to the relevant shareholders at that time. Dividends will be paid by electronic transfer within two months thereafter. It is not currently intended to declare dividends in respect of Class A Income and Class B Income Shares. It is not the current intention to pay dividends in respect of Class A Accumulation and Class B Accumulation Shares in the Fund. For Third Avenue Real Estate Value Fund and Third Avenue Value Fund (the “Sub-Funds”) the Company may, at its discretion, declare dividends on Class D1, Class D2, Class D3, Class D4 and Class D5 Shares in the Sub-Funds annually. These dividends will be paid within 30 days of the date of that declaration. Dividends will be paid by telegraphic transfer or bank transfer unless Shareholders specifically request that dividends be re-invested by subscription for additional Shares of the same Class. Additional Shares will be issued to Shareholders on the same day if it is a Dealing Day, or if not, on the next Dealing Day at a price calculated in the same way as for other issues of the relevant Class on this date but without incurring any subscription fee. There is no minimum of such further Shares which may be so subscribed. Class A1 Shares, Class A4 Shares (USD Institutional) and Class A5 Shares (Euro Institutional) are accumulation shares and therefore carry no right to any dividend.

GemCap Investment Funds (Ireland) Plc (Formerly Gemini Investment Funds Plc)
306
Notes forming part of the Financial Statements (Continued)
14. SIGNIFICANT EVENTS DURING THE FINANCIAL YEAR
The Third Avenue Real Estate Value Fund and Third Avenue Value Fund were both approved by the Central Bank of Ireland on 14th February 2017 and launched on 30th May 2017 and 7th June 2017 respectively. The Third Avenue Real Estate Value Fund, a sub-fund of Third Avenue Capital Plc merged into Third Avenue Real Estate Value Fund, a sub-fund of the Company effective 30th May 2017. The Third Avenue Value Fund, a sub-fund of Third Avenue Capital Plc merged into Third Avenue Value Fund, a sub-fund of the Company effective 7th June 2017. On 28th March 2017 Gemini Investment Funds Plc changed its name to GemCap Investment Funds (Ireland) Plc. The Sabre Global Value and Income Fund was closed by way of compulsory redemption on 27th April 2017. Shares in this sub-fund are no longer available for investment. The Company intends to apply to the Central Bank to revoke this sub-fund’s approval following preparation of the audited financial statements for the year ended 31st December 2017.
15. TAXATION
The Company will be regarded as resident for tax purposes in Ireland if it is centrally managed and controlled in Ireland. It is intended that the Directors of the Company will conduct the affairs of the Company in a manner that will allow for this. The Directors have been advised that the Company is an investment undertaking within the meaning of Section 739B of the Taxes Consolidation Act (“TCA”) and therefore is not chargeable to Irish tax on its relevant income or relevant gains so long as the Company is resident for tax purposes in Ireland only. On this basis, under current Irish law and practice it should generally not be chargeable to Irish tax on its income and gains. However, Irish tax may still arise on occurrence of a “Chargeable Event” in respect of the Company. Shareholders, other than Irish residents, who complete a declaration confirming that they are neither Irish residents nor ordinarily residents, will not be liable to Irish tax on income or gains arising to them from their investment in the Company and no tax will be deducted on distributions from the Company or payments by the Company in respect of a redemption or other disposal of their investment. In the absence of an appropriate declaration, the Company will be liable to Irish tax on the occurrence of a chargeable event. There were no chargeable events during the financial year under review.

GemCap Investment Funds (Ireland) Plc (Formerly Gemini Investment Funds Plc)
307
Notes forming part of the Financial Statements (Continued)
15. TAXATION (Continued)
A chargeable event includes any distribution to shareholders or any redemption or transfer of shares. A chargeable event does not include: (i) any transactions in relation to shares held in a recognised clearing system as designated by order of the Revenue Commissioners of Ireland; (ii) an exchange of shares representing one Portfolio for another Portfolio of the Company; (iii) an exchange of shares arising on a qualifying amalgamation or reconstruction of the Company with another fund; or (iv) certain exchanges of shares between spouses and former spouses. Capital gains, dividends and interest received may be subject to withholding taxes imposed by the country of origin and such taxes may not be recoverable by the Company or its shareholders.
16. EXCHANGE RATES USED IN THIS REPORT The following exchange rates were used for AHFM and SGVIF to translate assets and liabilities into one £:
31 Dec 31 Dec 2017 2016 Australian Dollar - 1.706463 Canadian Dollar - 1.657069 Swiss Franc - 1.255853 Euro 1.126541 1.171510 Hong Kong Dollar - 9.580167 Indonesia Rupee - 16,646.234676 Japanese Yen - 144.119966 South Korean Won - 1,492.330918 Norwegian Krone - 10.636109 New Zealand Dollar - 1.772049 Swedish Krona - 11.225426 Singapore Dollar - 1.785144 United States Dollar 1.352750 16.897547
The following exchange rates were used for AUEE to translate assets and liabilities into one $:
31 Dec 31 Dec 2017 2016 Euro 0.832778 0.948092 Great British Pound 0.739235 -
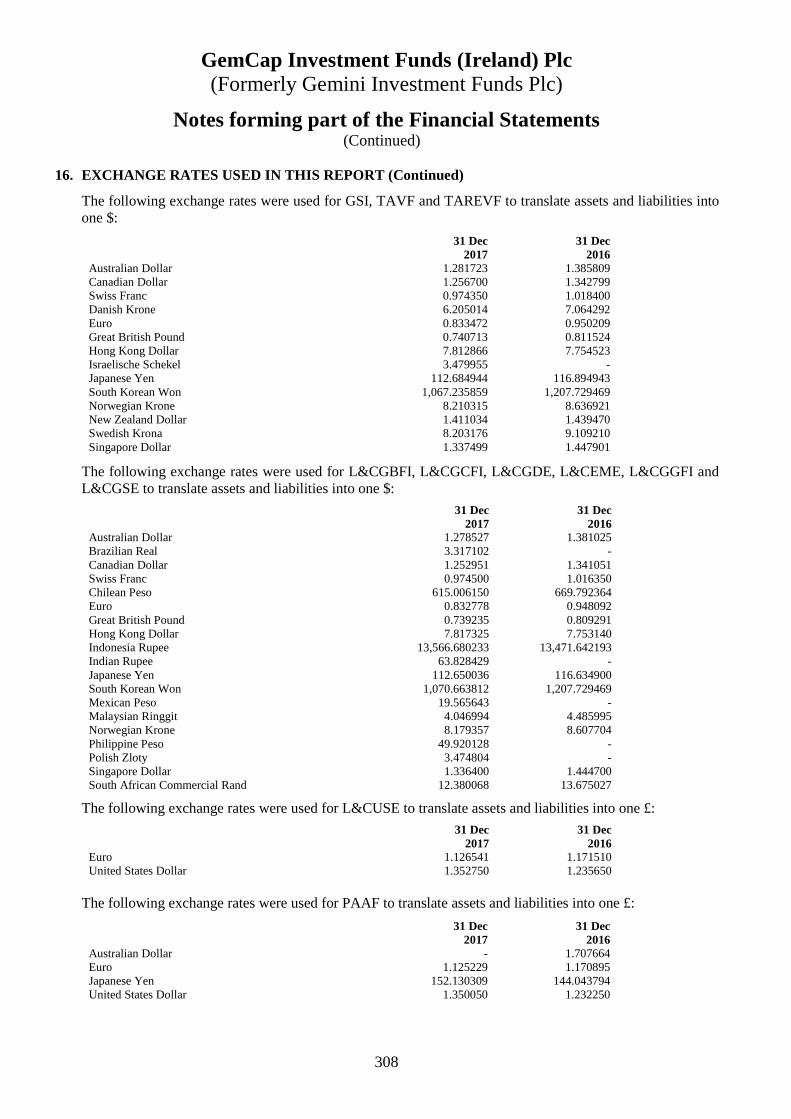
GemCap Investment Funds (Ireland) Plc (Formerly Gemini Investment Funds Plc)
308
Notes forming part of the Financial Statements (Continued)
16. EXCHANGE RATES USED IN THIS REPORT (Continued)
The following exchange rates were used for GSI, TAVF and TAREVF to translate assets and liabilities into one $:
31 Dec 31 Dec 2017 2016 Australian Dollar 1.281723 1.385809 Canadian Dollar 1.256700 1.342799 Swiss Franc 0.974350 1.018400 Danish Krone 6.205014 7.064292 Euro 0.833472 0.950209 Great British Pound 0.740713 0.811524 Hong Kong Dollar 7.812866 7.754523 Israelische Schekel 3.479955 - Japanese Yen 112.684944 116.894943 South Korean Won 1,067.235859 1,207.729469 Norwegian Krone 8.210315 8.636921 New Zealand Dollar 1.411034 1.439470 Swedish Krona 8.203176 9.109210 Singapore Dollar 1.337499 1.447901
The following exchange rates were used for L&CGBFI, L&CGCFI, L&CGDE, L&CEME, L&CGGFI and L&CGSE to translate assets and liabilities into one $:
31 Dec 31 Dec 2017 2016 Australian Dollar 1.278527 1.381025 Brazilian Real 3.317102 - Canadian Dollar 1.252951 1.341051 Swiss Franc 0.974500 1.016350 Chilean Peso 615.006150 669.792364 Euro 0.832778 0.948092 Great British Pound 0.739235 0.809291 Hong Kong Dollar 7.817325 7.753140 Indonesia Rupee 13,566.680233 13,471.642193 Indian Rupee 63.828429 - Japanese Yen 112.650036 116.634900 South Korean Won 1,070.663812 1,207.729469 Mexican Peso 19.565643 - Malaysian Ringgit 4.046994 4.485995 Norwegian Krone 8.179357 8.607704 Philippine Peso 49.920128 - Polish Zloty 3.474804 - Singapore Dollar 1.336400 1.444700 South African Commercial Rand 12.380068 13.675027
The following exchange rates were used for L&CUSE to translate assets and liabilities into one £:
31 Dec 31 Dec 2017 2016 Euro 1.126541 1.171510 United States Dollar 1.352750 1.235650
The following exchange rates were used for PAAF to translate assets and liabilities into one £:
31 Dec 31 Dec 2017 2016 Australian Dollar - 1.707664 Euro 1.125229 1.170895 Japanese Yen 152.130309 144.043794 United States Dollar 1.350050 1.232250

GemCap Investment Funds (Ireland) Plc (Formerly Gemini Investment Funds Plc)
309
Notes forming part of the Financial Statements (Continued)
17. COMMITMENTS AND CONTINGENT LIABILITIES
At the financial year end date, the Company had no commitments and contingent liabilities.
18. SOFT COMMISSION ARRANGEMENTS
The Investment Manager may effect transactions through the agency of another person with whom the Investment Manager has an arrangement under which that party will, from time to time, provide or procure for the Investment Manager as research. Under such arrangements, no direct payment is made or required to be made for such services or benefits, but instead the Investment Manager undertakes to place business with that party. For the avoidance of doubt, such services do not include travel, accommodation, entertainment, general administrative goods or services, general office equipment or premises, membership fees, employees’ salaries or direct money payments. In such case, the Investment Manager as the case may be, shall ensure that such arrangements shall assist in the provision of investment services to the relevant Fund and the broker/counterparty to the arrangement has agreed to provide best execution to the relevant Fund.
During the year ended 31st December 2017 and year ended 31st December 2016, the Investment Manager has entered into such research arrangements with brokers in respect of which services used to support the investment decision process were received.
19. SUBSEQUENT EVENTS
Up to the date of approval the below events took place.
The following dividends per share were declared with ex-date 6th February 2018 and paid on 13th February 2018:
Sub-Fund Name Class I – GBP
Class AHFM Defined Returns Fund £0.010100
Semper Total Return Fund launched on 29th March 2018. The following dividends per share were declared with ex-date 6th April 2018 and paid on 10th April 2018:
Sub-Fund Name Class X – GBP Class Class X – USD Class Class X – EUR Class
London & Capital Global Balanced Fixed Income Fund £2.332862 $2.420465 €1.771036
London & Capital Global Conservative Fixed Income Fund £1.674180 $1.852687 €1.261751
London & Capital Global Defensive Equity Fund £0.321475 $0.315861 €0.292651
London & Capital Global Growth Fixed Income Fund £2.493823 $2.268901 €2.369173
London & Capital Global Star Equity Fund £0.871402 $0.836926 €0.852357
London & Capital Global Emerging Markets Equity Fund £0.203870 $0.186926 €0.209855
London & Capital UK Star Equity Fund £0.368601 - -
AHFM Total Return Fund is expected to launch in May 2018.
There were no other subsequent events which occurred after the financial year end.
20. APPROVAL OF FINANCIAL STATEMENTS
The Directors authorised the financial statements for issue on 19th April 2018.
GemCap Investment Funds (Ireland) Plc (Formerly Gemini Investment Funds Plc)
310
Appendix 1 (unaudited)
1. Remuneration Policy
The Manager has remuneration policies and practices in place consistent with the requirements of the UCITS Regulations and will also comply with the requirements of the ESMA Guidelines, as required and when applicable. The Manager will procure that any delegate, including the Investment Managers, to whom such requirements also apply pursuant to the ESMA Guidelines will have equivalent remuneration policies and practices in place as required and when applicable.
The remuneration policy reflects the Manager's objective for good corporate governance, promotes sound and effective risk management and does not encourage risk-taking which is inconsistent with the risk profile of the Funds or the Instrument. It is also aligned with the investment objectives of the each Fund and includes measures to avoid conflicts of interest. The remuneration policy is reviewed on an annual basis (or more frequently, if required) by the board of directors of the Manager, led by the independent non-executive chairman of the Manager, to ensure that the overall remuneration system operates as intended and that the remuneration pay-outs are appropriate for each Fund. This review will also ensure that the policy reflects best practice guidelines and regulatory requirements, as may be amended from time to time.
Details of the up-to-date remuneration policy will be available by means of a website www.gemini-im.com and a paper copy will be made available to Shareholders free of charge upon request as soon as it becomes available.
2. Cybersecurity Risk Cybersecurity breaches may occur allowing an unauthorized party to gain access to assets of the Funds, Shareholder data, or proprietary information, or may cause the Company, the Investment Manager, the Distributor, the Administrator or the Depositary to suffer data corruption or lose operational functionality. The Funds may be affected by intentional cybersecurity breaches which include unauthorized access to systems, networks, or devices (such as through “hacking” activity); infection from computer viruses or other malicious software code; and attacks that shut down, disable, slow, or otherwise disrupt operations, business processes, or website access or functionality. In addition, unintentional incidents can occur, such as the inadvertent release of confidential information (possibly resulting in the violation of applicable privacy laws). A cybersecurity breach could result in the loss or theft of Shareholder data or funds, the inability to access electronic systems, loss or theft of proprietary information or corporate data, physical damage to a computer or network system, or costs associated with system repairs. Such incidents could cause the Company, the Investment Manager, the Distributor, the Administrator, the Depositary, or other service providers to incur regulatory penalties, reputational damage, additional compliance costs, or financial loss. Consequently, Shareholders may lose some or all of their invested capital. In addition, such incidents could affect issuers in which a Sub- Fund invests, and thereby cause a Sub-Fund’s investments to lose value, as a result of which investors, including the relevant Sub-Fund and its Shareholders, could potentially lose all or a portion of their investment with that issuer. Cybersecurity breaches may occur allowing an unauthorized party to gain access to assets of the Funds, Shareholder data, or proprietary information, or may cause the Company, the Investment Manager, the Distributor, the Administrator or the Depositary to suffer data corruption or lose operational functionality.