Geeves Track Preliminary Business Case · 2.2 The Southwest Tasmanian Wild Tourism ... At present...
81
GEEVES TRACK PRELIMINARY BUSINESS CASE FINAL Prepared for SEPTEMBER 2017 The Geeves Effect
Transcript of Geeves Track Preliminary Business Case · 2.2 The Southwest Tasmanian Wild Tourism ... At present...

GEEVES TRACK PRELIMINARY BUSINESS CASE
FINAL Prepared for
SEPTEMBER 2017 The Geeves Effect

© SGS Economics and Planning Pty Ltd 2017
This report has been prepared for The Geeves Effect. SGS Economics and Planning has taken all due care in the preparation of this report. However, SGS and its associated consultants are not liable to any person or entity for any damage or loss that has occurred, or may occur, in relation to that person or entity taking or not taking action in respect of any representation, statement, opinion or advice referred to herein.
SGS Economics and Planning Pty Ltd ACN 007 437 729 www.sgsep.com.au Offices in Canberra, Hobart, Melbourne, Sydney

Geeves Track Preliminary Business Case i
TABLE OF CONTENTS
1. INTRODUCTION 1
1.1 Project Background 1
1.2 The Project 1
1.3 Study Area 2
2. THE PROPOSED TRAIL AND PRECINCT 3
2.1 The Track 3
2.2 The Southwest Tasmanian Wild Tourism Precinct 3
3. INVESTMENT NEED AND POLICY CONTEXT 5
3.1 Socio-economic profile 5
3.2 The current tourism industry 12
3.3 Policy context 19
3.4 Environmental context 21
3.5 Consultation findings 23
3.6 Popularity of other destinations 24
3.7 Summary of investment need 25
4. DEMAND ASSESSMENT 26
4.1 Method for demand study 26
4.2 Case studies 26
4.3 Consultation findings 32
4.4 Visitor analysis 32
4.5 Track demand forecast 34
4.6 Tourism precinct forecast 39
4.7 Summary of demand 42
5. PROPOSAL COSTING 43
5.1 The Geeves Track 43
5.2 Accommodation along track 44
5.3 Operation costs of track and nodes 44
6. ECONOMIC IMPACT ASSESSMENT 46
6.1 Introduction 46
6.2 Economic stimuli (direct impacts) 46
6.3 The Input-Output (I-O) Model 47
6.4 Assessed economic impacts 47
6.5 Distributional analysis – economic stimulus for the Region 52
6.6 Other regional impacts 58

Geeves Track Preliminary Business Case ii
6.7 Limitations of EIA 58
7. COST BENEFIT ANALYSIS 60
7.1 The CBA Analysis 60
7.2 The Geeves Effect CBA 60
7.3 The Geeves Effect CBA – Government (public) cost perspective 65
8. RISK ANALYSIS 67
9. FINDINGS 72
APPENDIX 74
LIST OF FIGURES
FIGURE 1: STUDY AREA 2
FIGURE 2: MEDIAN AGE OF RESIDENTS 5
FIGURE 3: AGE PROFILE OF HUON VALLEY LGA COMPARED TO TASMANIA 6
FIGURE 4: MEDIAN PERSONAL INCOME ($ WEEK) 7
FIGURE 5 IRSD SCORES FOR SOUTHERN TASMANIA BY SA2 8
FIGURE 6: LQ ANALYSIS OF REGION 10
FIGURE 7: CONCENTRATION OF INDUSTRIES (BASED ON EMPLOYMENT) OVER TIME (2001-2011) 11
FIGURE 8: HUON VALLEY UNEMPLOYMENT RATE COMPARED TO NEARBY LGAS (2010-2017) 12
FIGURE 9: GROWTH IN ANNUAL VISITORS TO TASMANIA (2014-17) 13
FIGURE 10: EXISTING ATTRACTIONS IN STUDY AREA (NON-FOOD AND BEVERAGE RELATED) 14
FIGURE 11: EXISTING FOOD AND BEVERAGE ATTRACTIONS 16
FIGURE 12: EXISTING ACCOMMODATION PROVIDERS IN STUDY AREA 17
FIGURE 13: PLACES VISITED BY TOURISTS AND WHETHER THEY PASS THROUGH, STOP OR STAY (2016/17*) 18
FIGURE 14 METHOD FOR DEMAND STUDY 26
FIGURE 15 CHARACTERISTICS AND DEMAND 31
FIGURE 16: LENGTH OF TIME SPENT IN TASMANIA BY SEGMENT 33
FIGURE 17: OVERNIGHT BUSHWALKERS VISITING TASMANIA - HOUSEHOLD INCOME 37
LIST OF TABLES
TABLE 1: ESTIMATED VISITOR NUMBERS TO ATTRACTIONS (APRIL 2016-MARCH 2017) 15
TABLE 2: TASMANIAN VISITOR ANALYSIS (2016/17) 33
TABLE 3: CONSIDERATION OF TWO BROAD TRACK OPTIONS 34
TABLE 4: SOTH ISLAND NEW ZEALAND OVERNIGHT BUSHWALKS 39
TABLE 5: ESTABLSHMENTS WITH 15 OR MORE ROOMS BY REGION (2016) 40
TABLE 6: DEMAND FOR WILDERNESS LODGES 40
TABLE 7: DEMAND SUMMARY (OPTION 2) 42
Geeves Track Preliminary Business Case iii
TABLE 8: CASE STUDY OF OTHER PROPOSED TOURISM PRECINCTS AND WILDERNESS LODGES/RESORTS 47
TABLE 9: TASMANIAN ECONOMIC IMPACTS - CONSTRUCTION PHASE 49
TABLE 10: TASMANIAN ECONOMIC IMPACTS - TRACK OPERATION (ANNUAL) 49
TABLE 11 TASMANIAN ECONOMIC IMPACTS, BY INDUSTRY – VISITOR SPENDING (ANNUAL) 51
TABLE 12: TOTAL TASMANIAN ECONOMIC IMPACTS - OPERATIONAL PHASE (ANNUAL) 51
TABLE 13: REGIONAL ECONOMIC IMPACTS - TRACK AND PRECINCT CONSTRUCTION PHASE 52
TABLE 14: REGIONAL ECONOMIC IMPACTS - TRACK OPERATION (ANNUAL) 53
TABLE 15 REGIONAL ECONOMIC IMPACTS, BY INDUSTRY – VISITOR SPENDING AT PRECINCT (ANNUAL) 55
TABLE 16: WIDER REGIONAL IMPACTS BY INDUSTRY – VISITOR SPENDING ACROSS REGION (ANNUAL) 56
TABLE 17: COUNT OF BUSINESSES BY TURNOVER RANGE - ACCOMMODATION AND FOOD SERVICES (2016) 57
TABLE 18: TOTAL ECONOMIC IMPACTS - CONSTRUCTION PHASE 58
TABLE 19: TOTAL ECONOMIC IMPACTS - OPERATIONAL PHASE (PER ANNUM) 58
TABLE 20 INTERPRETATION OF PERFORMANCE MEASURES 60
TABLE 21 DEVELOPMENT COSTS – HIGH-AMENITY OPTION 61
TABLE 22 CBA PERFORMANCE RESULTS (20 YEARS) 63
TABLE 23 SCENARIO TESTING – CHANGES TO KEY ASSUMPTIONS 64
TABLE 24: SCENARIO TESTING – ONE ASSUMPTION 65
TABLE 25: SCENERIO TESTING TWO ASSUMPTIONS – PESSIMISTIC 65
TABLE 26: QUANTIFIED PUBLIC COSTS 65
TABLE 27 CBA PERFORMANCE RESULTS – PUBLIC PERSPECTIVE (20 YEARS) 66
TABLE 28 RISK SCORING MATRIX 68
TABLE 29: RISK ANALYSIS 69

Geeves Track Preliminary Business Case 1
1. INTRODUCTION
The Lake Geeves Track and Accommodation Precinct is a proposed project in Tasmania’s South West. This report provides an overview of the project, the key attributes of the local area, an estimate of potential visitation, a high-level cost estimate, and an assessment of its overall the potential benefits the project could deliver.
1.1 Project Background The Geeves Effect have identified the opportunity to upgrade and extend an existing walking track near Lake Geeves in south western Tasmania.
The group have developed a concept and identified a number of opportunities associated with the track including attracting further tourism investment in to the region, and linking together a number of existing tourism attractions in the region. An accommodation and tourism precinct is also proposed, to provide a location for track walkers to stay before and after their walk, and also to attract additional tourism to the region, including overnight and day trip visitors.
The purpose of this project is to develop a ‘proof of concept’ for the project; to identify the high-level costs and potential benefits and to identify if, and how, the project should proceed. It includes refinement of the opportunities and characteristics to be provided by the Project (such as the nature and configuration of accommodation along the track and at the Precinct). The report will provide a preliminary view of the benefits (and costs/risks) of the proposal, and concludes with an indication as to whether further planning and investigations should proceed.
1.2 The Project The project considered in this report comprises an upgraded trail, allowing walkers to access Lake Geeves and Federation Peak. Huts located on the track would provide overnight accommodation as part of the walk. The project also incorporate investment in a range of tourist infrastructure at the trail head– close to the town of Geeveston.
The Track
Lake Geeves is located in the south west of Tasmania, near the town of Geeveston and at the foot of the Federation Peak. Although a number of walking tracks currently provide access to Federation Peak, the Lake (at the base of Federation Peak) is currently inaccessible on foot. In order to provide access to the unique and spectacular landscape views of the Federation Peak and Lake, 17.5km of the existing Eastern Arthur Range Traverse Track requires upgrading, and the environmentally sensitive construction of an additional 2.5km of track would be required (the Track).
The terrain that this ~20km of track covers is particularly rugged, and as such would not be traversable as a day trip. Overnight accommodation along the track is therefore a crucial component of the project.
The upgrading and extension of the track would create a significant tourism drawcard for the region. The track would provide unique vistas and views of Federation Peak, and would enable a broader range of visitors to visit what is currently a difficult area to access.

Geeves Track Preliminary Business Case 2
The new Management Plan for the TWWHA (2016) allows for an increased opportunity for the use of built infrastructure both for management purposes and for commercial tourism operations. In particular, the prohibition on built infrastructure within the Southwest National Park has been lifted. However, for the Geeves Track to be approved a change of zoning along the proposed route will be required.
It is anticipated that the track would also provide access to a range of other, existing tracks including Federation Peak, Moss Ridge; Eastern Arthurs, Western Arthurs and Lake Pedder; The Huon Track; YoYo Track.
To further support the development of the tourism offer in the region, and the accessibility of the Track, an Accommodation and Wilderness Experience Precinct is also proposed.
The Precinct
The Precinct would operate as a ‘launching pad’ for those seeking to use the trail, providing accommodation and access to other nearby outdoor/ adventure activities. The precinct is also envisaged to provide a range of other activities and attractions, including food and beverage offering/s, retail and visitor information.
The precinct would capitalise on growing demand for ecotourism in Tasmania, positioning itself as a premium destination for those seeking an immersive wilderness experience. In developing the precinct there would be a need to be cognisant of the existence of the nearby Tahune Airwalk, and offer experiences and services that complement, rather than compete with, the services offered there.
The precinct would leverage the fact that there is a lack of overnight accommodation and other tourist infrastructure in the region to the south of Hobart, in spite of the region’s popularity among daytrippers.
1.3 Study Area The proposed Track and Precinct are located in the Huon Valley LGA. This is the ‘study area’ or the ‘region’ and is the area that will capture flow on demand to other attractions and businesses, the economic impact, and wider social benefits that will flow. It is shown in Figure 1.
FIGURE 1: STUDY AREA

Geeves Track Preliminary Business Case 3
2. THE PROPOSED TRAIL AND PRECINCT
The ‘Project’ comprises the Track (including Track accommodation) and Tourist Precinct. This section provides additional detail regarding the proposed Project and its context.
2.1 The Track Lake Geeves is located 670m below the iconic destination of Federation Peak in the wilderness of the Eastern Arthurs Ranges. Views of Federation Peak are possible from the Lake.
At present there is a rough, overgrown track into the area, with the last 2.5 km into Lake Geeves not passable. The proposal is to provide a year-round walking track from Farmhouse Creek to Lake Geeves. This involves the upgrading 17.5 km of the existing Eastern Arthur Range Traverse Track and the environmentally sensitive construction of an additional 2.5km of track to reach Lake Geeves. The track is in the Tasmanian Wilderness World Heritage Area (TWWHA).
Accommodation along the Track is also required, given the time required to traverse the track. Two accommodation locations are proposed at different locations along the track; it is assumed that walkers would walk to the first accommodation on Day 1, and stay there overnight. On Day 2, walkers would visit the Lake to view the Peak, before returning to the second accommodation pod. On Day 3, walkers would return to the beginning of the track. The location of the accommodation pods would be planned to enable a second attempt at walking to view the Peak, should weather conditions on Day 1 not provide a view of the Peak.
2.2 The Southwest Tasmanian Wild Tourism Precinct A Tourism Precinct incorporating a range of functions is also proposed. It could include:
Accommodation, including a large scale eco-facility which could accommodate at least a tour bus sized group of people, providing pre or post walk accommodation for walkers and operating as a Track welcome and reception
A visitor information centre providing information, promotion of the region’s tourism offering, and context and history of the region.
Retail and food/ beverage outlets, particularly linked to local produce and goods launching place for other wilderness activities (e.g. bike riding, rafting, wildlife tours) Access to nearby short walks Gallery or other arts component
The private sector would be provided with opportunities to identify the specific activities and design the layout of the precinct, consistent with the concept of an ‘Immersive wilderness experience’.
It is anticipated the Precinct designed in this way would be an attraction its own right, generating demand for overnight and day visits, distinct from the Track. To enable this, the layout, structure and activities within the precinct would require further consideration and design. The development of an ‘eco/ wilderness’ destination is anticipated to have the potential to attract a much wider audience to the area and region.

Geeves Track Preliminary Business Case 4
A location has been identified nearby the head of the proposed Track, but outside of the Tasmanian Wilderness World Heritage Area (TWWHA), for the tourism precinct.

Geeves Track Preliminary Business Case 5
3. INVESTMENT NEED AND POLICY CONTEXT
This chapter provides a socio-economic analysis of Region, an overview of the consultation undertaken with relevant stakeholders; and a review of relevant policy documents, to establish the project context in more detail.
3.1 Socio-economic profile A socio-economic profile of the Region has been collated to understand the context of the Project.
Population and income
The population of the Region has grown steadily over the past decade (2006 to 2016) – rising from 14,000 to around 16,200. This represents an increase of 2,200 residents equating to an average annual growth rate (AAGR) of 1.5%. This AAGR is significantly higher than the state average over the same period. While population growth is a component of a region’s economic vitality, other population factors including age profile are also important.
Error! Reference source not found. shows the change in median age of the Region, with the neighbouring Kingborough and Hobart, and Tasmania as a whole included for comparison. The figure shows that while the population of the state as a whole is ageing, though the median age of the population of the Huon Valley has grown even more rapidly. Driven by the popularity of the region as a location for retirement-age residents, the median age across the region has grown from 39 to 45 in only ten years.
FIGURE 2: MEDIAN AGE OF RESIDENTS
Source: ABS Census of Population and Housing
25
30
35
40
45
2006 2011 2016
HUON VALLEY LGA HOBART LGA KINGBOROUGH LGA TASMANIA

Geeves Track Preliminary Business Case 6
Figure 3 also considers this aging demographic. It shows that compared to Tasmania as a whole, the proportion of people aged 15-39 in the Huon Valley is lower than for the state as a whole. Conversely the portion of the population aged 45-74 in the Huon Valley is higher than for the state of Tasmania. This reflects the fact that young people tend leave the region in their late teens and early twenties in search of employment and education opportunities. It also further confirms the popularity of the region among retirement age cohorts. The lack of working age residents represents a substantial risk to the regional economy. As such, creation of sustainable employment opportunities for young people in the region should be treated as a priority.
FIGURE 3: AGE PROFILE OF HUON VALLEY LGA COMPARED TO TASMANIA
Source: ABS Census of Population and Housing
0%
1%
2%
3%
4%
5%
6%
7%
8%
9%
10%
0-4
5-9
10
-14
15
-19
20
-24
25
-29
30
-34
35
-39
40
-44
45
-49
50
-54
55
-59
60
-64
65
-69
70
-74
75
-79
80
-84
85
yea
rs +
SHA
RE
OF
PO
PU
LATI
ON
IN A
GE
RA
NG
E
AGE RANGE
Huon Valley LGA Tasmania

Geeves Track Preliminary Business Case 7
The median total personal income in the Region has also grown, though at a substantially lower rate than the rest of Tasmania. The table shows nominal incomes increased by 42 per cent over ten years. Adjusting for inflation1, the real increase in median income was substantially less (17 per cent). Low incomes in comparison to the rest of Tasmania reflect a relative lack of skilled service sector jobs in the region, and relatedly, a relatively low number of skilled, highly-educated local workers.
The ABS Index of Relative Socio-economic Disadvantage (IRSD) provides a measure of the economic and social status of regional populations. The index produces a score that facilitates comparisons between areas at a given time, incorporating a range of variables such as educational attainment, employment status and income.
Figure 5 shows the spatial element of disadvantage across south eastern Tasmania, with the study area comprised of the Huonville-Franklin, Cygnet, and Geeveston-Dover SA2s. The most heavily disadvantaged regions have a score of 1, indicating that they are in the lowest decile for SEIFA (i.e. they are among the 10 per cent of Australia’s most disadvantaged SA2s). The most disadvantaged regions are situated to the north of Hobart and in parts of the Eastern Shore, with most of the Hobart metropolitan area shown to experience relatively little disadvantage.
The Geeveston-Dover area receives a low score (3) indicating that it is among the 30 per cent of most disadvantaged SA2s in Australia. The limited number of jobs available within a short travel time amplifies this disadvantage.
1 Using the ABS CPI for Hobart
200
300
400
500
600
700
800
2006 2011 2016
INC
OM
E P
ER W
EEK
($
)
HUON VALLEY LGA HOBART LGA KINGBOROUGH LGA TASMANIA
FIGURE 4: MEDIAN PERSONAL INCOME ($ WEEK)

Geeves Track Preliminary Business Case 8
FIGURE 5 IRSD SCORES FOR SOUTHERN TASMANIA BY SA2
Source: ABS Census of Population and Housing: Socio-Economic Indexes for Areas (SEIFA), Australia, 2011 *A score of 1 is an area that is considered the most disadvantaged, in comparison to the rest of Tasmania. *A score of 10 is an area with little disadvantage compared to the rest of Tasmania
Industry and employment
This section considers the performance of a range of industries across the region.
Location quotient analysis (LQ)
A location quotient (LQ) analysis is a valuable tool for quantifying how concentrated a particular industry group is in a region as compared to a broader region (e.g. a state or a nation). It can reveal what makes a particular region ’unique’ in comparison to the broader regional average.

Geeves Track Preliminary Business Case 9
Regions, due to their physical, technological and intellectual characteristics, can have cost, productivity and other strategic advantages relative to other economies. Comparative strategic advantages are widely considered to be one of the origins of international trade, and in an increasingly global economy they can be considered the key drivers of regional economic growth. The theory of comparative advantage can be applied at the national, state, regional and local level.
Comparative strategic advantages result in high levels of employment in industries that benefit from these advantages, and this is revealed through the LQ analysis. When the LQ value is greater than one it is an indication that a region is fairly specialised and has a competitive advantage in that field of industry over other regions. Generally speaking, a region is a net exporter if the location quotient is high (that is >1), and a net importer if the location quotient is low (that is <1).
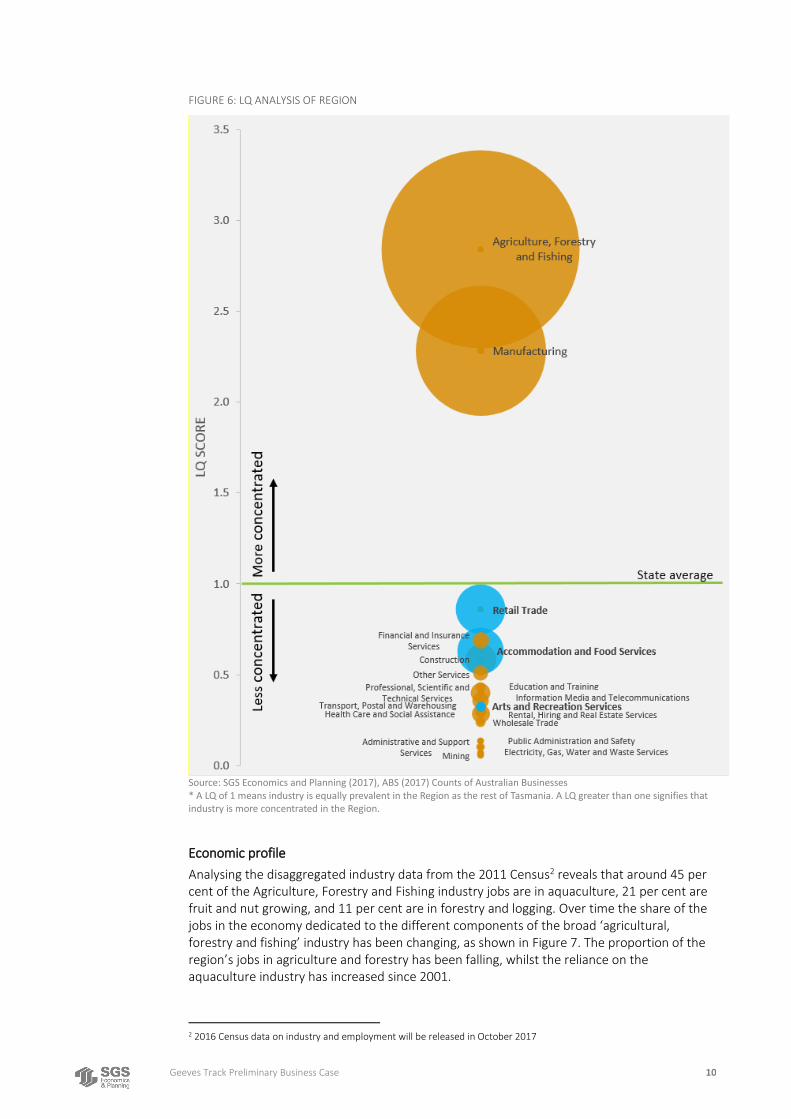
An LQ analysis of the Region reveals that there are two industries that have a higher concentration in the Huon valley than in Tasmania as a whole, as shown in Figure 6. These industries are agriculture, forestry & fishing (LQ of 2.8) and manufacturing (LQ of 2.3). An LQ greater than one signifies that industry type is more concentrated than it is across Tasmania, and the higher the LQ the more concentrated that industry is. In Figure 6 the size of the circles represent the number of people employed in that industry.
The economy of the Region is dominated by agriculture, forestry and fishing, and manufacturing. It is also evident that industries related to tourism; accommodation & food services, retail trade, and arts & recreation (the blue circles) are underrepresented in the Region in comparison to the rest of the State.
Geeves Track Preliminary Business Case 10
FIGURE 6: LQ ANALYSIS OF REGION
Source: SGS Economics and Planning (2017), ABS (2017) Counts of Australian Businesses * A LQ of 1 means industry is equally prevalent in the Region as the rest of Tasmania. A LQ greater than one signifies that industry is more concentrated in the Region.
Economic profile
Analysing the disaggregated industry data from the 2011 Census2 reveals that around 45 per cent of the Agriculture, Forestry and Fishing industry jobs are in aquaculture, 21 per cent are fruit and nut growing, and 11 per cent are in forestry and logging. Over time the share of the jobs in the economy dedicated to the different components of the broad ‘agricultural, forestry and fishing’ industry has been changing, as shown in Figure 7. The proportion of the region’s jobs in agriculture and forestry has been falling, whilst the reliance on the aquaculture industry has increased since 2001.
2 2016 Census data on industry and employment will be released in October 2017

Geeves Track Preliminary Business Case 11
This reflects the region’s current reliance on aquaculture (the salmon industry specifically). While this industry has grown significantly recently, and it makes a significant contribution to the local economy, the reliance on a single sector can limit a regions resilience and capacity to respond to future economic or environmental changes.
FIGURE 7: CONCENTRATION OF INDUSTRIES (BASED ON EMPLOYMENT) OVER TIME (2001-2011)
In terms of manufacturing, 25 per cent of the manufacturing industry in the Region is related to wood products, and 19 per cent is related to food products (largely seafood processing and bakery products). The manufacturing sector is strongly related to the agricultural, forestry and aquaculture industries in the region and together comprise the main economic drivers of the region.
While the Tasmanian forestry industry retains a role in the local economy, it has been through a process of major structural transformation brought about by changing markets and the influence of changes in government policy. This resulted in significant reductions in employment and economic opportunities, and eroded regional communities’ confidence in their future3. The effects of this are still felt in many communities in Tasmania, including the Huon Valley. From 2008, the downturn in industry activity resulted in large job losses. Between 2008 and 2011, employment in forest industry jobs declined by around 50%, or 3,500 jobs across Tasmania; 139 of these jobs were lost in the Huon Valley4.
The further development of the tourism industry presents an opportunity to diversify the region’s economy. This would limit the impact of economic downturns in key industries and an important step in securing the ongoing sustainability and vitality of regional communities.
3 West et al (2012). Diversifying Tasmania’s Economy: Analysis and Options. Australian Innovation Research Centre 4 Jacki Schirmer, Caroline Dunn, Edwina Loxton (2014). Socio-economic impacts of forest industry change - Tasmanian forest industry employment and production, 2012-13
0%
2%
4%
6%
8%
10%
12%
14%
16%
18%
Agriculture Forestry and Logging Aquaculture
2001 2011

Geeves Track Preliminary Business Case 12
Unemployment
The Region has been experiencing high rates of unemployment in recent years, with unemployment relatively high (see Figure 8). This chronic shortage of jobs presents a major challenge for the Region, with a need to create economic activity (and employment) to support and enhance the quality of life of residents.
FIGURE 8: HUON VALLEY UNEMPLOYMENT RATE COMPARED TO NEARBY LGAS (2010-2017)
Source: SGS Economics and Planning (2017), Australian Department of Employment (2017) Small Area Labour Markets — March quarter 2017
3.2 The current tourism industry
State level tourism trends
Tourism is an important contributor to the sustainable development of regional areas around Australia. It is often advocated as a means to diversify economic conditions in rural and regional areas by providing alternative sources of employment and income generation in times of downturn in traditional industries such as agriculture and forestry.5
Tasmania has a well-established and recognised ‘tourism brand’ and the Australian Innovation Research Centre (AIRC) recently prepared a report for the Commonwealth Department of Infrastructure and Regional Development that identified six main areas of opportunity for Tasmania, including tourism generally, and more specifically ‘experiential’ tourism, i.e. tourism related to the island’s wilderness and consumption of gourmet products.
The Saffire resort, the Museum of Old and New Art and the development of new trails including a new iconic wilderness walk on the Tasman Peninsula, lend weight to the sector’s growth prospects.6
This is reflected in the growth of visitor nights in the State, which have increased by 19% between March 2014 and March 2017. While this growth in tourism was initially centred on Hobart, visitor numbers are now growing in regions across the State. Visitation has been
5 Carmen Cox & Meredith Wray (2011) Best Practice Marketing for Regional Tourism Destinations, Journal of Travel & Tourism Marketing, 28:5, 524-540 6 RDA Tasmania Regional Plan (2015)
0.0%
2.0%
4.0%
6.0%
8.0%
10.0%
12.0%
Dec-10 Dec-11 Dec-12 Dec-13 Dec-14 Dec-15 Dec-16
HUON VALLEY LGA HOBART LGA KINGBOROUGH LGA

Geeves Track Preliminary Business Case 13
growing at six per cent in the South, 11 per cent on the East Coast, four per cent in the North and five per cent on the Cradle Coast7.
Figure 9 shows the overall growth in visitor numbers, as well as specific segments which are growing, which includes:
Outdoor and other activities Bushwalking Visiting national parks Overnight bushwalking
FIGURE 9: GROWTH IN ANNUAL VISITORS TO TASMANIA (2014-17)
The rapidly increasing number of overnight bushwalkers visiting the State since 2015 has been credited to being mostly due to the establishment of the Three Capes Track8.
The following sections provide an overview of the current tourism offer in the region.
Existing Regional attractions
The existing attractions in the Region are identified in Figure 10. It indicates that there are a number of tourism attractions in the region, including adventure based outdoor activities, galleries, museums, and sites of interest.
7 Tasmanian Government – Jobs and Economic Plan 2016 Update 8 Gramenz, E. (2017). Three Capes Track helping drive Tasmania’a record tourist numbers. ABC News, Sun 19 March 2017
Bushwalk overnight or longer (AAGR = 28%)
Visit National Parks (AAGR = 12%)
Outdoor and other activities (AAGR = 9%)
Bushwalk - not overnight (AAGR = 10%)
Total visitors (AAGR = 6'%)
-
200,000
400,000
600,000
800,000
1,000,000
1,200,000
1,400,000
Mar-14 Mar-15 Mar-16 Mar-17
Nu
mb
er o
fan
nu
al v
isit
ors

Geeves Track Preliminary Business Case 14
FIGURE 10: EXISTING ATTRACTIONS IN STUDY AREA (NON-FOOD AND BEVERAGE RELATED)
Source: SGS Economics and Planning (2017), Tasmanian Government (2015) LIST Points of Interest dataset.
The region is home to a number of relatively well-known bushwalking trails; these include those in the Hartz Mountain National Park, Adamson’s Peak and the South Coast Track. The South Coast Track is designated as one of Tasmania’s ‘Great Bushwalks’9 and consists of a challenging 85 kilometres of remote wilderness walk, typically popular among experienced bushwalkers. The track is currently undergoing a $2 million upgrade to ensure it remains a quality walking experience capable of delivering ongoing economic benefits to the broader region10. The South Coast Track attracts about 1,200 to 1,300 walkers per year.
Other tracks include Lake Espereance Track; Lake Osbourne Track; Huon Track; Big Tree Walk; Mt Picton; Tahune short walks. Many of these tracks are in poor condition and consequently are not utilised by many walkers.
Table 1 provides an overview of visitation levels at major regional and Tasmanian tourist attractors. It indicates that whilst there are a number of attractions which support visitation to the region, including several significant attractions (the Tahune Airwalk and Hastings Caves)
9 Tasmanian Parks and Wildlife Service 10 State Government Media Release (2016). Upgrading the South Coast Track

Geeves Track Preliminary Business Case 15
the level of visitation they generate is considerably lower than other well-known, iconic attractions in other parts of Tasmania.
TABLE 1: ESTIMATED VISITOR NUMBERS TO ATTRACTIONS (APRIL 2016-MARCH 2017)
Major Huon Region Attractions Estimated visitors AAGR (2014-2017)
Tahune Forest Airwalk 71,385 2.8%
Hastings Caves/Thermal Springs 34,962 14.0%
Signature Tasmanian Attractions
Salamanca Market 427,334 5.6%
MONA - Museum of Old and New Art 341,578 4.9%
Mount Wellington 321,654 10.3%
Port Arthur Historic Site 275,253 8.3%
Freycinet National Park 249,960 12.1%
Cradle Mountain 236,842 12.1%
Cataract Gorge 225,992 1.6%
Source: Toursim Tasmania (2017). Tourism Visitor Survey
*AAGR = Average Annual Growth Rate
Table 1 also reveals that nature based attractions have experienced strong growth over the past three years (Cradle Mountain and the Freycinet National Park in particular). This may be indicative of a broader shift in preferences among tourists for nature-based holiday experiences.
Existing food and beverage attractions
Figure 11 shows the existing food and beverage attractions in the Region. The quality of the hospitality offer in a region is crucial in attracting visitation in particular segments; the availability of ‘local’ produce and a range of hospitality choices is particularly beneficial and can complement the development of the track and precinct.

Geeves Track Preliminary Business Case 16
FIGURE 11: EXISTING FOOD AND BEVERAGE ATTRACTIONS
Source: SGS Economics and Planning (2017), Tasmanian Government (2015) LIST Points of Interest dataset.
The existing supply and distribution of food and beverage attractions in the region reflects the local agricultural sector, which includes ciders, cherries, apples and wine. The availability of local produce is an important consideration for the tourism context.
Existing accommodation supply
Figure 12 provides an overview and location of existing accommodation in the region. Most of this accommodation comprises small holiday units or guest houses.

Geeves Track Preliminary Business Case 17
FIGURE 12: EXISTING ACCOMMODATION PROVIDERS IN STUDY AREA
Source: Source: SGS Economics and Planning (2017), Tasmanian Government (2015) LIST Points of Interest dataset.
Although the map suggests that the supply of accommodation across the region is relatively widespread, in terms of overall accommodation capacity, options are relatively limited with the majority of facilities being holiday units/houses or bed and breakfasts alongside a few small hotels and camping grounds. A further 152 options are listed on AirBnB.
The capacity of the region to accommodate large groups (e.g. those arriving in a tour bus) in a single location is limited. This is likely to mean that fewer tourists stay overnight in the region than would otherwise be the case. This is reflected in visitor data (as shown in Figure 13) which reveals that for the four prominent towns in the Region (Dover, Geeveston, Cygnet and Huonville) nearly 50 per cent of visitors on average across the four simply pass through without stopping. In terms of attracting tourists to stay overnight, only 10 per cent of tourists to Geeveston stay overnight, rising to 19 per cent at Dover.
Coles Bay and Cradle Mountain have been included in the chart for context11; these locations are significant nature based tourist attractions and experience a much higher percentage of
11 There are a range of factors which could influence the proportion of visitors who stay overnight compared to passing through or just stopping; this includes distance from a major city and whether the town is located at the end of a route. Both Cradle Mountain and Coles Bay are further away from a major city than the towns in the region, and are located at

Geeves Track Preliminary Business Case 18
overnight visitors and tourists who stop, in comparison to the four towns in the study Region. This is likely a result of their relative distance from major population centres making them relatively unattractive as day trip destinations.
FIGURE 13: PLACES VISITED BY TOURISTS AND WHETHER THEY PASS THROUGH, STOP OR STAY (2016/17*)
Source: Tourism Tasmania (2017) Tasmanian Visitor survey
*Data for Geeveston from 2013/14
Summary and implications
The current tourism industry in the region comprises a range of attractions, accommodation, and food and beverage facilities. The TWWHA is a major asset, and there is a significant range of gourmet food and beverage suppliers. There are several small-scale attractors in the regions, such as the Tahune Airwalk, Hartz Mountain and Hastings Cave.
the end of a road instead of being part of a ‘route’. These factors are likely to increase the propensity of tourists to stay the night – however the difference is still stark.

Geeves Track Preliminary Business Case 19
There is however, no major flagship attraction or large-scale accommodation and the LQ analysis in Figure 6, indicates that the tourism industry is less prominent in the Region than across Tasmania as a whole, with the three sectors most closely associated with tourism (i.e. accommodation & food services, retail trade, and arts & recreation services) having an LQ below one.
Analysis of major nature based attractions elsewhere in Tasmania indicates they are experiencing growth, suggesting there is significant demand for such activities in the State.
3.3 Policy context
Tasmanian State Government – EOI Program
The Tasmanian Government is undertaking an expressions of interest (EOI) program for tourism investment opportunities in the TWWHA, National Parks and Reserves, to unlock the natural areas to new tourism experiences. The EOI process provides opportunities within Tasmania’s natural areas for new tourism experiences that also contribute to the conservation of the natural environment. The Tasmanian Government’s EOI Process invites investors with ideas for tourism ideas to pitch them to the Government. The Government is looking for developments that broaden the range of experiences on offer, improve access for tourists, complemented by sensitive and appropriate tourism infrastructure, while maintaining the integrity of natural and cultural heritage.
The EOI process demonstrates the State Government’s support for appropriate tourism developments in the TWWHA. The Tasmanian Government recognises the importance of managing the TWWHA in a way that is genuinely respectful of its natural and cultural heritage values. It also recognises that “the TWWHA is an area to be experienced, celebrated and shared with the world. The Tasmanian Government is supportive of sensitive and appropriate use of the TWWHA for recreational and tourism purposes and acknowledges the important role tourism plays in contributing to the economic wellbeing of the Tasmanian community12”.
Tasmanian State Government – Jobs and Economic Plan (2016 update)
Economic growth and job creation are the Hodgman Liberal Government’s ‘greatest priorities’. The Government wishes to support Tasmania’s competitive strengths to drive Tasmania’s economy and build confidence. The current Hodgman State Government has a target of reducing Tasmania’s unemployment rate to at least the national average.
Tourism 21
Tourism is supported by many institutions including Tourism Tasmania, the Department of State Growth, Tourism Industry Council Tasmania, four Regional Tourism Organisations, the 29 Local Government Areas, many Local Tourism Associations and the Tasmania Visitor Information Network.
Their collective strategy is Tourism 21 which aims to bring 1.5 million visitors per annum to Tasmania by 2020. A priority for the strategy is to:
“Invest in quality visitor infrastructure Investment in private and public infrastructure is the backbone for growing the visitor economy. For Tasmania to achieve 1.5 million visitors a year by 2020 requires the ongoing development of exciting new visitor experiences to drive interest in Tasmania, stimulate visitor demand and encourage travel within the state.”
Tasmanian Visitor Engagement Strategy
The Tasmanian Visitor Engagement Strategy is a key action of T21 and sets out the guiding principles, elements and actions that the State Government will undertake with industry to rethink and strengthen the State’s approach to visitor engagement.
12 TWWHA Management Plan – Minister’s Forward

Geeves Track Preliminary Business Case 20
The following principles were developed to guide the future of visitor engagement in Tasmania:
Provide a landscape where visitors engage in meaningful experiences rather than skimming the surface of the destination.
Encourage greater interaction between locals and visitors. Help visitors connect with the rich stories that set Tasmania apart. Inspire visitors to create and share unique itineraries that meet their special interests and
get off the beaten track. Let the landscape, culture and people of Tasmania lead the story through seamless and,
where possible unobtrusive visitor engagement.
Destination Management Plan – Destination Southern Tasmania (2014)
With record levels of visitation to Hobart, the key priorities for Destination Southern Tasmania are to provide a better experience to extend the length of stay and yield, (or encourage frequent, repeat visits), and to achieve wider regional dispersal - as opposed to attracting significantly increased visitor numbers.
The Management Plan argues that successful regional dispersal has only occurred with the bundling of attractive, market-led experiences and accommodation – the success of Bruny Island being a key example. Accommodation occupancy rates in Southern Tasmania currently sit at more than 85%, however this figure is largely driven by the exceptionally high occupancies in central Hobart. Beyond this core tourism precinct, many accommodation operators are struggling with occupancies closer to 35-40% in regional areas.
“Despite the optimism around the latest visitor data, the reality remains that regional Tasmania is not experiencing a corresponding growth. This is a key factor in considering Hobart vis-à-vis the broader Southern region. The current situation reflects a ‘two-speed’ visitor economy.”
Further, the DMP argues that product development and investment is paramount is the Southern Region. This is necessary to capitalise on the record visitor numbers to the immediate Hobart area, and to encourage regional dispersal. This investment should cover both the development of new and existing products and infrastructure. These investments, such as the development of accommodation in ‘wilderness’ areas, revamped visitor centres, food and beverage tours, tasting centres and improved tourism signage, to name a few will have cross-over impacts and meet a range of objectives; well-focused investments leverage further opportunities.
Reimagining the Visitor Experience of Tasmania’s Wilderness World Heritage Area: Ecotourism Investment Profile
The Reimagining project aims to establish a new vision for growing and enhancing visitor experiences to the TWWHA. This Ecotourism Investment Profile aims to guide and facilitate growth in ecotourism through a strategic approach, following consultation with key stakeholders, investors, industry, and regional tourism stakeholders.
A broad vision for tourism in the Tasmanian Wilderness World Heritage Area was identified. The vision decided upon was “To deliver the most contemporary wilderness World Heritage Area experience offering shared, life changing, moments.” It was argued that the focus for the future of the TWWHA is on growing the value of the place at a low volume, and aims at attracting visitors who are willing to pay for high value experiences.
Analysis in the Investment Profile found that while the importance of the World Heritage Area is without question, its pulling power for domestic and international visitors has waned, and that while the wilderness is seen as a core attraction, the TWWHA region has not seen the levels of innovation, or created the new attractions or experiences needed to maintain a competitive advantage over the last decade.

Geeves Track Preliminary Business Case 21
A consideration of relevant tourism trends found that increasingly, the trends in wilderness tourism are towards both adventure and comfort, resulting in booms elsewhere of investment in the following:
‘Glamping’ and luxury tents in spectacular locations Reuse of industrial and heritage sites for modern luxury Ziplines, via ferrata, high ropes/flying fox and tubing Overnight mountain-biking, hiking and skiing trails Heli-touring, jet boating and other rapid transport
In terms of accommodation opportunities, it was argued that there is significant opportunity for more, new, low-impact, environmentally sensitive wilderness accommodation to be developed inside and around the edges of the TWWHA, in order to deliver more immersive World Heritage wilderness experiences for visitors – and provide greater accommodation capacity for visitors to the TWWHA. New and innovative commercial, wilderness accommodation in and around the TWWHA – with associated food and wine experiences, guided tours and more – would provide greater opportunities for visitors to experience, learn about, and become advocates for unique wilderness destinations, which they may otherwise have not been able to visit. Investment in small-scale wilderness accommodation will make the TWWHA more attractive for new, higher-yield markets; in response the Investment Profile identifies identifying suitable precincts for eco-lodge accommodation developments as a priority project.
In terms of new trails in the TWWHA the Investment Profile reads that whilst there continues to be high demand for the Overland Track, international and national trends suggest that there is a growing demand for shorter walks, including one and two night soft adventure experiences. In response it was recommended that there is an opportunity to develop an additional ‘iconic’ walk in the TWWHA at Cradle Mountain – a two day-one night commercial, guided walking experience.
3.4 Environmental context The proposed hut-based Geeves Track is in the Tasmania Wilderness World Heritage Area, meaning that the area has very-high natural values to drive demand, but also that special approvals are required to develop in the TWWHA, including a change to the zoning under the Management Plan.
The TWWHA Management Plan
The Management Plan sets out what uses may occur within the TWWHA, where they may occur and under what circumstances.
A range of proclamations are made in the Management Plan which are relevant to the Geeves Track component of the Geeves Effect. In regard to:
Tourism in the TWWHA - “There is considerable demand for commercial adventure tourism, immersive experiences and a variety of accommodation; from the rustic lodgings of Mount Field’s Government Huts, to the luxury standard at Pumphouse Point at Lake St Clair. Activities include wildlife viewing, walking, camping, rafting, climbing, canyoning and yachting.”
Scope for development - “There is considerable scope to increase the contribution the TWWHA make to Tasmania (social and economic) while “continuing to protect the TWWHA’s natural and cultural values, particularly through the fostering of greater private investment as an accepted component of future management.”
Development of infrastructure - “creation of appropriate commercial opportunities and provision of opportunities for self-reliant recreation must all be prioritised where visitor demand is highest or there are gaps in presentation opportunities.”

Geeves Track Preliminary Business Case 22
Presentation is a key requirement of the World Heritage Convention. Management of presentation covers all aspects of the visitor experience, including information, interpretation, recreation opportunities, management presence and facilities
Regional economies - “will benefit from strategies that boost visitation in the TWWHA. It is vital that presentation of the area evolves to ensure that it continues to play an important role in the overall tourism sector in Tasmania, and for Tasmanians and visitors alike to continue to experience the values of the TWWHA”
Access - is a “fundamental aspect of the visitor experience. However, it requires careful management practices that are consistent with the protection of the TWWHA’s natural and cultural values.”
Use and potential development in the TWWHA are primarily regulated and controlled through a system of four Management Zones. The Management Zones (Visitor Services, Recreation, Self-Reliant Recreation and Wilderness) reflect the spectrum of current and anticipated use and their associated levels of infrastructure.
The Management Plan does allow for new track developments in the TWWHA, but for the Geeves Track the trail to Federation Peak will need to be rezoned from Self-Reliant Recreation Zone to Recreation zone (the same as the overland track) and the new section from the Federation Peak Track into Geeves Lake will need to be rezoned from Wilderness to Recreation. The current zones that overlay the Track do not allow for significant Tracks or new tracks.
Community access to natural heritage
The TWWHA Management Plan explicitly acknowledges the importance of the TWWHA to local communities and the connections that many people have with it. Community involvement in its management is a key objective and the plan also recognises that the TWWHA should play an important role in the social and economic life of local communities.
Allowing greater access to world heritage wilderness for people does not need to compromise the value of the area. Other regions in the world are successfully managing their world heritage assets whilst still allowing locals and tourists to experience and connect with the heritage on offer.
For example, Iceland has seen a rapid increase in visitation built of the countries natural heritage. The Þingvellir National Park is located in the southwest region of Iceland, and was designated a World Heritage site in 2004.
The Management Plan for the Park has a Vision that reads that “as many people as possible should be able to enjoy what the national park has to offer, without affecting its quality. Emphasis is placed upon visitors enjoying the park in diverse ways, and restrictive management is applied only where it clearly serves the interests of conservation in accord with this management plan13”.
In Norway, the managers of their natural heritage sites have changed their approach in the past decade regarding the way heritage is protected. The changes come from a desire to incorporate human rights and culture into their heritage and environmental management plans. It is argued that when the universal values associated with World Heritage listed places are applied, this can override (or imped) the individual, local and traditional connection to the land.
The key task in Norway when managing to protect the environmental heritage is about bridging the divide of culture and heritage, as they believe it is culture that applies significance to a heritage site. Generally, this applies to indigenous people and their biocultural connection to the land, however in Norway the recognition of connections between people and nature applies to all of society. A benefit of this approach is that it is
13 Þingvellir National Park Management Plan 2004-2024, page 27.

Geeves Track Preliminary Business Case 23
believed that by allowing and building these connections between society and nature, people will care for and respect for the natural heritage, and act as custodians.
3.5 Consultation findings Targeted consultation was undertaken with a number of stakeholders, including:
Local business and tourism industry:
local business owners the Apple Shed Tahune Airwalk Destination Southern Tasmania / Key individual for development of Three Capes
Track
Data and information contacts:
CEO Destination Southern Tasmania Tourism Tasmania Huon Valley Council Parks and Wildlife Service
Others:
Hanny Allston (member of National Parks and Wildlife Advisory Council)
The key messages relating to the need for investment include:
While the region is relatively close to Hobart, there is a lack of a ‘signature’ tourist product in the Huon Valley, and the overall ‘brand’ of the region is limited.
The region’s economic growth and employment growth is limited, and growth in the tourism sector could potentially support economic development. It can have widespread benefits.
While the salmon industry is important for the local economy, it’s not enough. For the Geeves Track proposal to be successful it needs to be more than just a
bushwalk; it needs to allow for a sophisticated experience. The Tahune Airwalk was designed and built with the intention that it become the
signature attraction and experience for the region. Initial visitation was encouraging but has tapered off of late. Existing attractions, including The Airwalk stand to benefit from the development of a flagship tourism attractor. The operators of the Tahune Airwalk are fully supportive of the project and see the potential of the Geeves Track increasing the appeal of the region and drawing more people in. The Airwalk is currently expanding and offering lodge accommodation.
The development of a number of other ‘day trip’ experiences both in Hobart and nearby (e.g. MONA, Pennicott tours, Bruny Island) has developed competition for the Tahune Airwalk and may have contributed to its limited growth.
There is limited accommodation in the region. While there are some existing B&B and pubs, there is nowhere that accommodates a group (small or large) overnight.
There is no wilderness accommodation or significant hotels in the Region. Although the regions of the Tasman Peninsula and the Huon Valley are not directly
comparable (the Peninsula already had a tourism market prior to the Three Capes Track due to the Port Arthur Historic Site); anecdotally the Track has benefited the Tasman Peninsula community. Real Estate prices in Nubeena have increased for example, with local real estate agents putting this down to the influence of the Three Capes Track. There has also have been a range of new small investments in tourism infrastructure and businesses that is anecdotally linked to the presence of the Three Capes Track being in the region.
The local tourism industry very seasonal; sales drop for 4-5 months of the year. This has implications for business confidence and employment.

Geeves Track Preliminary Business Case 24
The quality of accommodation along the track is an important consideration. No one wants to see Hastings Cave in winter, but Geeves Track can be rugged.
Tasmania has promoted itself as a ‘Clean and Green’ state and the Geeves project is consistent with this.
The area to which the Geeves Track will provide access is currently inaccessible, the track would open it up for all types of people who normally wouldn’t have access to the wilderness.
Existing community support
The Geeves Effect Inc has already presented to a wide range of groups and individuals with an overwhelming indication of support, including:
Huon Valley business community, via a meeting at Port Huon with over 100 local business owners in attendance
Huon Valley Economic Development Committee (who made a unanimous recommendation to Council to support the Project)
Huon Valley Council and councillors (who provided unanimous support) Huon Valley Kingborough Tourism Association Far South Tourism Association Huon Valley Kingborough Business Association Huon Valley Council Commissioner, General Manager and senior managers Huon Valley Liberal Party The Huon Valley Rotary Kingborough Rotary Huon Eldercare Kingborough Senior Citizens organisation Huon Resource Development Group Inc, Numerous State and Federal politicians Previous Federal Tourism Minister (which lead to the securing of funding for the
demand study) Destination Southern Tasmania Previous Director Parks and Wildlife Service Tasmania Numerous public servants from Department of Premier and Cabinet and Department
of State Growth, The Office of the Coordinator General The Premier of Tasmania.
The Geeves Effect Inc has also participated in extended interviews on ABC Radio broadcasting state-wide to inform the public of the proposal.
The feedback from this consultation has been positive, with the vast majority of groups very supportive of the project. Specific consultation with Parks and Wildlife indicated that due to the current status of the track in the World Heritage Precinct, they are unable to support the project however all other groups indicated support.
3.6 Popularity of other destinations Some of Tasmania’s iconic natural attractions and destinations appear to be experiencing high levels of crowding and activity. While this reflects a positive outcome for local economies, it also suggests that there is increasing demand for Tasmania’s tourism assets and latent demand for hiking trails in Tasmania.
Developing a new, regionally significant, attraction in a currently under visited region of the State can provide additional choices for visitors and encourage total capacity in visitors to increase.
This is supported by an Australian study by Cox & Wray (2011) which considered the regional marketing efforts of 21 regional destinations in Australia. From this the authors identified a

Geeves Track Preliminary Business Case 25
range of approaches that allow for best practice regional marketing to occur. Identification of new product development opportunities and visitor experiences was seen as important. Importantly developing new products in peripheral parts of a region was found to be highly effective to disperse visitors more broadly through a region, often having the secondary benefits of avoiding over-visitation of key icon attractions and also extending the guests’ overall length of stay14.
3.7 Summary of investment need Tasmania’s economy has undergone significant change as a result of changes to the timber industry, and this has had major impacts on some communities, including Huonville. While some other industries have emerged (including salmon fishing) and some manufacturing associated with the timber and agriculture industry remains, the region retains a relatively narrow economic base. This is a key risk for the future of the region.
The region also accommodates a small tourism sector including some attractions leveraging its natural assets, agriculture and some accommodation. Visitor numbers to Tasmania are growing, reflecting demand for the State’s natural assets and tourism offer. The region does not, however, have a major attractor or drawcard.
There is also a lack of accommodation capacity, with limited opportunities to accommodate large numbers of tourists. The number of visitor nights in the region is low, representing a missed opportunity to capture visitor expenditure.
The natural advantages are well placed to support ‘experiential tourism’ in the region, and the tourism sector represents an opportunity for economic and employment growth. Failure to respond to these challenges is likely to lead to lower levels of economic activity, fewer jobs, and increasing levels of social and economic disadvantage.
The development of tourism infrastructure in the World Heritage area needs to be done carefully, but this would enable more people to experience Tasmania’s natural beauty and environment.
These conclusions were broadly supported by stakeholder consultation. The consultation further uncovered a belief among stakeholders that investment is required to attract more visitors. A lack of appropriate accommodation was also identified as a key issue.
In summary:
The region’s economy was significantly affected by changes to the timber industry. While some industries are growing, the region retains a narrow economic base. Unemployment remains high compared to neighbouring areas
The population is ageing and there is a lack of opportunities for young people in the region
Tasmania’s tourism economy is growing. There is some tourism activity in the region however
It is not coordinated and there is no central ‘precinct’ which draws visitors by providing an ‘experience’
There is a lack of flagship attraction precinct There is limited accommodation in the region
There is policy support for additional tourism activity in the region and in the TWWHA from State Government, as well as strong community support.
14 Carmen Cox & Meredith Wray (2011) Best Practice Marketing for Regional Tourism Destinations, Journal of Travel & Tourism Marketing, 28:5, 524-540

Geeves Track Preliminary Business Case 26
4. DEMAND ASSESSMENT
This section provides a demand analysis to understand current and future demand for the Geeves Track and Tourist Precinct and assess their potential market appeal.
4.1 Method for demand study The following chart provides an overview of the method used for the Demand Study.
FIGURE 14 METHOD FOR DEMAND STUDY
4.2 Case studies Strategic investment by the State Government and by investor-developers has contributed significantly to creating demand for Tasmania’s tourism products. The following review identifies how trail developments (both hiking and mountain bike) can provide positive outcomes, particularly in rural and regional settings. It will also identify usage of the trails in Tasmanian context, to help establish likely demand for the Geeves Track and Tourist Precinct.
Three Capes Track and surrounds
The Three Capes Track (3CT) was planned, developed and then constructed over a period of ten years. The track was officially opened in November of 2015. The development of Three Capes included major upgrading of existing track and the creation of new track, plus the construction of three accommodation complexes on the route. The development allowed for
1) Review of similar
offerings
•Review current multi-day bushwalks in Tasmania via a case study review
•Current demand for iconic trails in Tasmania
•Consultation with the Toursim industry
2) Visitor analysis
•Visatation to Tasmania by market segment
•Visitation growth forecasts
3) Competitive market
assessment
•Qualitative assessment of likely market appeal
•Market strengths of the proposal
4) Demand assessment
•Establish likely demand of Track and Precinct
•Likely flow-on deamnd to businesses and other attractions

Geeves Track Preliminary Business Case 27
a wider demographic to experience the area; walkers no longer have to be experienced, be able to set up their own camp, or carry heavy backpacks.
The construction of the track included 47 kilometres of formed track (either gravel or pine boards) and three huts, providing walkers a safe, short and not-overly taxing alternative to other iconic experiences in Tasmania, such as the Overland Track.
The walk is an ‘easy to moderate’ point to point walk, with three hut locations along the track providing walking unique experiences each day. The huts collect rainwater for drinking, washing and cooking provide solar power for lighting and USB charging stations and pellet fires for heating.
Walkers book their departure day online, and pay a track fee of $495 per adult which includes:
Site entry, car parking and secure lockers at Port Arthur Historic Site Pennicott Wilderness Journey cruise, departing Port Arthur at 11.30am and 2pm daily Three nights accommodation in cabins on the track Bus transfer from Fortescue Bay back to Port Arthur Historic Site Guide book with maps
During planning, it was argued that the Track would increase the profile of the Tasman Peninsula’s natural values which would help transform the Tasman from a day destination to an overnight one. It was estimated that the track would attract 10,000 walkers per year (60 departures per day) with 90% of walkers being from interstate. The 10,000 walkers per annum was met in the first year of operation, not after ten years as envisioned.
It was estimated that this would generate spending of $3.1 million per year and the creation of 70 jobs for the region. It was also predicted that more than 55 jobs would be created for the construction phase, at least ten of which would be traineeship or similar positions. At a state level, it was projected that the development of the Three Capes Track would generate $19.7 million spending within Tasmania annually creating an additional 334 jobs in Tasmania.
Since opening the Track has been a success with visitation meeting and exceeding predictions, and the track has won prestigious industry awards including the 2016 Gold for new tourism business at the Australian Tourism Awards. This has led to increasing confidence in the project with extensions to the Track supported by the State Government, and private investment to construct two further on-track, premium eco-lodges.
The investment in the 3CT by the State Government has proven to be very fruitful with a very high return on investment15. Annual revenues from walker fees alone in the near future (after construction of privately operated huts) will equal the total investment made by the State Government ($17 million). Revenues received on the Track are set to reach $4.5 million in the 2017/18 financial year16. The Track has been credited with making a significant economic contribution to the Tasman Peninsula, with the PWS employing 13 FTE staff to run and manage the Track, with a further7 FTE staff at Pennicot Wilderness Journeys and the Port Arthur Historic site17. During the construction phase 93% of the construction expenditure was spent with-in Tasmanian18
The identification in the planning stage of the need to provide a high-quality track and accommodation experience, without the need for walkers to carry heavy packs, has proven to be accurate leading to strong market appeal. The tourism market is increasingly expecting a high-quality, sophisticated, unique, experience based attractions and leisure activities; a key reason for the success of the Three Capes Track is that it tapped into a large, new market of potential visitors19. Three Capes didn’t market itself purely at the small bushwalking market,
15 Information from consultation with Destination Southern Tasmania - Stuart Lennox 16 Groom, M (2017). Iconic tracks hike up revenues. Press release from Minister for Environment and Parks 17 Groom, M (2017). Iconic tracks hike up revenues. Press release from Minister for Environment and Parks 18 Clark, B (2017). 2017 National and International Trail Awards, Tasmania’s Three Capes Track 19 Information from consultation with Destination Southern Tasmania - Stuart Lennox

Geeves Track Preliminary Business Case 28
but instead the wider experiential tourist market, i.e. it was aimed at people who want an experience, not people purely interested in bushwalking. The 3CT experience includes boat rides, art works, interpretation via a guide book, and knowledgeable resident park ranges. This access to a new market segment is seen as crucial to the Three Capes Tracks success.
Destination Southern Tasmania, with support from the Department of State Growth, has recently developed the Tasman Destination Action Plan 2016–2018. The Plan aims to leverage the signature experiences of the Three Capes Track. Key opportunities for the Tasman region identified in the Plan generated by the growing tourism industry in the region include:
Converting day visitors to overnight visitors Leverage Three Capes Track to grow market – be seen as a premium walking
destination, day and overnight Converting visitation to population growth, including business investment Product development for high yield visitors including food and beverage
opportunities and niche experiences including game fishing and surfing
Regarding access to the Capes for bushwalkers not wanting to stay in huts and avoid the walking fee, they cannot walk the entire 3CT circuit. However, walkers can access Cape Pillar via a two day walk on the old Cape Pillar track from Fortescue Bay. A formal campsite is provided with tent platforms, toilet and rainwater tank. Walkers can return via Mt Fortescue and Cape Hauy.
Implication for Geeves Track: A well-considered, planned and delivered track, combined with successful brand growth/ marketing, can support increased visitation and tourism activity. The identification of the appropriate visitor segment, carefully planned accommodation and track activation strategies are crucial to deliver an integrated and compelling tourism product.
Overland Track
The Overland Track is a world-famous, six-day walk through the mountains, alpine meadows, glacial landscapes and temperate rainforests of the Tasmanian Wilderness World Heritage Area (TWWHA). The walk begins at Cradle Mountain and extends 65 kilometres to Lake St Clair. The walk can be undertaken as an independent walker, a member of a large group (13 max) e.g. a school or community group, or as a member of a commercial group (Cradle Mountain Huts) staying in private huts.
Public accommodation along the Track is provided by six overnight nodes to accommodate walkers. Each overnight node has basic facilities with accommodation options including:
Huts with bunks (no mattresses), tables and bench seats, and heating. No lighting or cooking facilities are provided.
Tent platforms for campers (platforms protect vegetation) Toilets (composting toilets – all waste is flown out by helicopter) Water supplied by rainwater tanks
The Overland Track Report for 2015/16 reported that walker numbers were up by 17.5 per cent on the previous year. During 2015/16 a total of 8,265 walkers departed Cradle Mountain to walk the Overland Track; the months of December to March were almost fully booked, with fewer bookings in the shoulder months of October, November, April and May. No bookings are required in June through September.
The Overland Track has been a significant part of the Tasmanian tourism brand for many years, but it is also making an important contribution to regional economic development and the broader Tasmanian economy. A recent report, The Socio-economic Impact of the Overland Track, identified the value of direct and indirect tourism expenditure from the track for 2012- 2013 at $16.36 million and estimated the business supports the equivalent of 85 full-time jobs. The track has a direct benefit to the many businesses that are associated with it through providing guided walks or transport for walkers to and from the track. Other businesses supply the Parks and Wildlife Services with materials and/or services including

Geeves Track Preliminary Business Case 29
track materials, products and services for the huts and toilets, energy supplies and helicopter services.
In 2015/16 the Parks and Wildlife Service Business Enterprise that operates the Overland Track generated $1.1 million in revenue. This revenue was generated through walker fees, commercial licences/leases, and merchandise. The Overland Track generates an economic return to the Parks and Wildlife Service which is reinvested to maintain and improve services.
Implication for Geeves Track: Successful tracks can generate revenue which can be re-invested to support track operations and maintenance. Selecting an appropriate price point for the walk is crucial, to avoid dampening demand via high price, but to also recoup costs and support track maintenance and operation of the walk.
Cradle Mountain Village
Located just outside the TWWHA, the Cradle Mountain Village connects visitors to a wide choice of wilderness experiences. Experiences include well-known bushwalks such as the summit of Cradle Mountain and the six-kilometre Dove Lake circuit, and the Devil Sanctuary and Wildlife Park. Of an evening, activities include dinner at accommodation and nocturnal wildlife walks.
Cradle Mountain is considered the primary gateway to the TWWHA, and is the beginning point for the Overland Track.
Accommodation options at the village include camping and huts, budget rooms and five-star luxury lodges and hotels. Accommodation is located within two-to-five minutes of the Cradle Mountain Visitor Centre.
The Cradle Mountain Visitor Centre and visitor experience with-in the Park are set to be upgraded. The proposal includes a cable-car to transport visitors into the park and significant upgrade to the Visitor Centre. Economic modelling performed by Inspired by Marketing as part of the Master Plan (2016) reveals that the upgrade will lead to increased tourism expenditure in Tasmania due to attracting more visitors. The redevelopment is forecast to attract an additional:
58,600 visitors 102,100 visitor nights $29.2m in incremental expenditure
Implications for Geeves Track: Investments in visitor infrastructure on the boundary of the TWWHA can generate economic benefits for the surrounding region.
Freycinet National Park and Peninsula Circuit
The Freycinet National Park is Tasmania’s most visited Park, attracting around 270,000 visitors per annum. Freycinet Peninsula encompasses the Freycinet National Park and adjacent Coles Bay and Swanwick townships. It is receiving unprecedented visitation with growth to Freycinet National Park increasing 61% from 186,000 visitors in 2011 – 2012 to an expected 300,000 in 2017-2018.
There are several options for walking and experiencing the Freycinet Peninsula. Bushwalkers can walk Freycinet Peninsula Circuit, taking two to three days. No huts are provided and walkers carry their own tent and sleeping gear, cooking equipment, water and food; the track is grade T2, Narrow but distinct tracks, which can be muddy in some place. Costs for independent bushwalkers completing the Freycinet Circuit are the cost of access to the National Park (parks pass) and bookings are not required.
At Freycinet there is also the award-winning Freycinet Experience Walk; a four-day privately operated guided tour along the Freycinet Peninsula. The Experience includes bus transfers to and from Hobart with stops at attractions along the way, two sea cruises, fishing, swimming and daily bushwalks throughout the Freycinet Peninsula. The experience is limited to 10

Geeves Track Preliminary Business Case 30
guests and two guides at a time. Accommodation is provided at the high-quality Friendly Beaches Lodge, purposely designed to be eco-friendly, and located deep with-in the National Park. The cost for the Experience Walk is $2,400 per person for the summer season.
The Freycinet Lodge is also located with-in the Parks boundaries and has close to 100 per cent occupancy over summer and 90% in the shoulder seasons20; the Lodge has recently gained council approval to expand, with-in its existing footprint. Camping in the Freycinet National Park is also very popular with campsites, including powered sites, allocated via a ballot system over summer due to the demand. Hotel, motel, backpacker and cabin accommodation are available outside the Park in the nearby town of Coles Bay, including the international award winning, 5 star, Saffire Resort.
The success of Tourism at Freycinet and along-the East Coast more generally, alongside the decline of primary industries such as farming fishing and forestry, has seen the tourism industry become the largest industry for the region over the past decade21. The East Coast Regional Tourist Organisation22 is targeting that by 2020 the East Coast’s tourism industry will employ 1,100 people, attract 1.9 million room nights and be worth $200 Million.
However there has been some recent concern that Freycinet is reaching capacity with some commentators and groups calling visitation caps to be put in place. The region’s tourism body highlights that the ongoing success has highlighted some infrastructure pressure – especially around the Freycinet area. Some of the antiquated sewerage systems are struggling with the peak loads and the Wineglass Bay Walk car park overflows most days during the peak times which can negatively impact on the Visitor Experience23. Large increases in visitor numbers at any national park or reserve can place pressure on natural values, services, visitor experience and amenity.
In response to crowding the State Government has announced funding to provide for 80 new car parks at the National Park to alleviate parking issues. It is argued that the current situation is at a critical point and if allowed to degrade further could significantly threaten the ongoing success of the Peninsula as a regional and state tourism drawcard and become a detriment of the Tasmanian brand
Implications for Geeves Track: Very high-quality offerings, such as the Freycinet Experience and Saffire Resort, can be offered in tandem with more general Park entry.
The Park is reaching capacity and attracting visitors to other regions of the State could limit the impact on the natural environment, and possibly Tasmania’s brand, at the National Park.
Blue Derby Trails and Pods Ride Experience
The Dorset Council established the 80km of mountain-bike trails with funding from the Tasmanian Forest Agreement. Since then an unprecedented era of visitation, exposure and opportunity has occurred in the area. The Blue Derby forest reserves attracts riders from all over the state, across the country and around the globe and hosted a multi-day Trail Running event over the long weekend in 2016 and 2017. Economist Saul Eslake reports close to a 250 per cent increase in visitation to the Derby region since 2015, “reflecting the region’s success in attracting mountain bike riders to the newly developed trails”.24
The wider trails network has been a huge success. The two local councils, Dorset and Break O’Day, estimated during planning that the trails might attract 5,000 riders a year; the councils now expect up to 50,000 people to use the trails over the next 12 to 18-month period, with 70 per cent of users coming from interstate25. Unemployment was high in Dorset before the
20 http://www.themercury.com.au/lifestyle/ract-pod-project-at-freycinet-national -park-approved-by-glamorgan-spring-bay-council/news-story/6938a4a46a42070db4442accf51b2a30 21 Geografia et al. (2014) Planning for Sustainable Tourism on Tasmania’s East Coast - Sustainable Tourism Options Report 22 East Coast Regional Tourist Organisation (2016) Annual Report 23 East Coast Regional Tourist Organisation (2016) Annual Report 24 The Mercury (2017). No Point Turning Back Now. 25 Bearup, G. (2017). It’s pedalicious: Blue Derby Pods Ride. The Australian.

Geeves Track Preliminary Business Case 31
construction of the tracks, but since work began on the tracks the number of cafes in Derby is set to double and tourist accommodation is to be tripled26. Land and housing prices have also increased rapidly with many houses being converted to Airbnbs.
The Blue Derby Pods Ride adds to the experience by providing a high-end, multi-day riding option. Accommodation consists of high amenity, architecturally designed ‘pods’ set in the natural environment. The pods include solar panels, composting toilets and manually pumped showers in an effort to reduce their environmental impact. Prices for the pod ride experience start at $1,750 per person in winter, $1,950 at shoulder times and $2,150 at peak for two nights, three days. The price includes bikes and helmets, all food and drinks, pod accommodation, mountain biking instruction and flora and fauna descriptions.
The pods alone are estimated to create 16 full-time jobs, and accommodate up to 1,000 visitors a year.
Implications for Geeves Track: There are opportunities to be gained through delivering new, high-yield eco-tourism attractions in the protected area network.
Case study summary and findings
FIGURE 15 CHARACTERISTICS AND DEMAND
Three Capes Track Overland Track Cradle Mountain Village
Freycinet Peninsula
Blue Derby Pods Ride
Established 2015 1935 1922 1916 2015
Annual visitors 10,000 walkers 8,000 walkers An estimated 288,000 visitor nights
250,000 to 270,000 visitors to the Park.
1,000 for the pod experience. 50,000 for the trail network
Fees and charges $495 $200 + Parks Pass Accommodation costs can range from $30 a night for camping through to over $500 a night for the high-end wilderness lodges
Ranges from the cost of a Parks Pass through to $2,400 for the Freycinet Experience
$1,750-$2,150 for the pods experience
Track 47km. T1 Standard Track.
65km, T2 standard.
Access to day walks around Cradle Mountain and the Overland Track
30km, T2 standard.
World class mountain biking trial network
Length of experience 3-night walk. Set to be expanded
6 day walk The average amount of time spent at Cradle Mountain is 2.2 nights27
Multiple experiences. Can do simple 2-hour walks to the lookout, multi-night independent walks or the 4 day privately operated Freycinet Experience.
Pod experience is two nights. Users of trail often stay in the region for multiple nights.
Conservation area Tasman National Park
TWWHA Just outside TWWHA
Freycinet National Park
Blue Tier Forest Reserve
Accommodation High-amenity huts Low-amenity huts and tent platforms
Camping areas and budget options through to 5-star wilderness lodges and hotels
Full range of options in the National Park from basic camping to the Friendly Beaches Lodge.
Architecturally designed, high amenity pods with food and wine provided.
26 Beavis, L. (2015). Mountain bike tourism' helps drive economic turnaround in Tasmania's north east. ABC News 27 Tasmanian Visitor Survey (2017)

Geeves Track Preliminary Business Case 32
Three Capes Track Overland Track Cradle Mountain Village
Freycinet Peninsula
Blue Derby Pods Ride
More options in nearby Coles Bay
Accommodation also provided in nearby towns for general trail users.
Other experiences Includes boat trip with Pennicott Wilderness Journeys and entry to the Port Arthur site
Various side-tracks can be completed on-route, and a ferry ride to finish.
Devil Park. Village is used as a base for exploring the wider Cradle Coast region.
The Freycinet Peninsula is a coastal park with swimming, snorkelling, and fishing being other popular activities.
Exploring the North-east region of Tasmania.
Track activation
Track activation is a key component of ensuring the track reaches a broad market of potential visitors, and also enhances visitor experience at the track. It entails delivering enhanced trail amenity including signage, interesting rest stops, water refills and toilets as well as providing interpretation along the trail on environmental, cultural or heritage values; either by story boards along the trail, by guides, or via guide books. Linking the Track experience with a wide range of other opportunities can also allow for an experience with more depth and the Track can be marketed to the wider experience seeker tourist market. The recent developments of the 3 Capes Track and Blue Derby Pods Ride are examples of creating highly activated track experiences to increase marketability and interest.
4.3 Consultation findings A range of factors impacting demand were revealed via tourism industry consultation. These insights included:
There is demand for another multi-night, high quality walk in Tasmania. Demand for Three Capes has been significant; the year ten, annual visitor estimate was met in the year one.
Walker numbers at the TCT are already higher than the Overland Track, which is a remarkable achievement given how embedded the Overland Track is in the market. There is sufficient demand from interstate for the next 30 to 40 years to keep the TCT at capacity, without even considering demand from international visitors or local Tasmanians.
19% of walkers on the TCT, and around 10% on the Overland Track, are currently Tasmanian, well above Tasmania’s share of population nationally (3%), demonstrating that Tasmanians too are willing to pay a premium price for experiences in the State’s National Parks. Tasmanian’s have not been ‘locked out’ as some feared.
Demand for ‘experiences’ is set to continue as the population across the country ages, retires and seeks unique experiences. This cohort has a significant amount of money to spend on experiences and are also looking to maintain their health and fitness.
The market at the Tahune Airwalk was reported as tending to affluent; demand at the Airwalk includes lifelong learners, young professionals, and well-heeled retirees, who would all be happy to entertain the idea of significant walks as part of their trip.
4.4 Visitor analysis
Visitor segments
Tourism Tasmania collects and analyses a range of data on visitors to Tasmania, including the purpose of their visit, length of stay, estimated expenditure, type of accommodation and transport. This enables segmentation of visitors, based on the purpose of their visit.

Geeves Track Preliminary Business Case 33
There are two key visitor segments relevant for this study; visitors who participate in overnight bushwalking and those participating in outdoor and nature based activities more generally.
Between April 2016 and March 2017, it was estimated28 that 45,794 visitors to Tasmania undertook an overnight or longer bushwalk whilst in Tasmania; a significant 40% increase on the previous 12 months. The wider group of visitors who participated in outdoor and nature based activities (including overnight bushwalks) was 848,457, an increase of 10% on the previous 12 months.
Figure 16 identifies the number of nights these visitors spend in Tasmania when they visit. It shows that overnight bushwalkers typically spend 8 to 14 days in Tasmania. Visitors interested in more general outdoor activities tend to spend less time in the State; they are for example much more likely than overnight bushwalkers to only spend 1 to 3 days in the State (20% of visitors), with the modal number of days being 4 to 7. The mean number of nights spent in Tasmania by overnight bushwalkers is 15; in comparison participants in more general outdoor activities spend 10 nights in the State.
While visitors who stay longer can, in some instances, explore towns and regions and participate in other activities and therefore spend more, this may not apply to overnight bushwalkers, given the nature of their activities.
FIGURE 16: LENGTH OF TIME SPENT IN TASMANIA BY SEGMENT
Source: Tourism Tasmania (2017)
The following table provides an overview of the visitor analysis of both the overnight bushwalking, and outdoor and other activities enthusiast market segments in Tasmania.
TABLE 2: TASMANIAN VISITOR ANALYSIS (2016/17)
Overnight bushwalkers Participants of outdoor activities
Total visitors participated 45,794 848,457
Growth rate (2014 to 2017) 28% per annum 9% per annum
Share of total visitors to Tasmania 4% 67%
28 Data provided by Tourism Tasmania – Tourism Visitor Survey
0%
5%
10%
15%
20%
25%
30%
35%
40%
45%
1-3 4-7 8-14 15-21 22-30 31-60 61-90 90+
PER
CEN
TAG
E O
F V
ISIT
OR
S
NUMBER OF DAYS SPENT IN TASMANIA
Overnight Bushwalkers General outdoor enthusiasts

Geeves Track Preliminary Business Case 34
Mean number of nights in TAS 15.3 10.0
Daily spend (total) $162 $215
Daily spend – Transport $23 $38
Daily spend - Accommodation $76 $91
Daily Spend – Other items $62 $86
Popular types of accommodation used (can stay in more than one type)
52% - camping or cabin (non-caravan park) 38% - Wilderness lodge 27% - Luxury hotel (4+ stars) 24% - Youth hostel/backpackers
30% - Luxury hotel (4+ stars) 27% - Friend or relatives home 18% - Standard hotel 14% - Motel
Main form of transport 36% - Rental vehicle 18% - Public transport 15% - Walking
49% - Rental vehicle 17% - Friend or relative’s vehicle 15% - Own vehicle
Participation in outdoor activities 100% - went bushwalking 85% - visit national parks 42% - view wildlife in the wild 25% - river or coastal cruise 6% - canoe or kayak 5% - mountain bike
67% - went bushwalking 5% - bushwalk overnight or longer 61% - visit national parks 29% - view wildlife in the wild 26% - river or coastal cruise 3% - canoe or kayak 3% - mountain bike
Participation in F&B activities 30% - visit local food producer 26% - visit wineries 16% - visit breweries/distilleries
37% - visit local food producer 27% - visit wineries 20% - visit breweries/distilleries
Source: Toursim Tasmania (2017)
The Parks and Wildlife Service Overland Track Walker Survey29 also reveals a range of characteristics that overnight bushwalkers possess, including:
50% of Overland Track walkers are professionals (lawyers, teachers, accountants, engineers etc), with the next most frequent segment being managers (11%).
66% of walkers are from interstate, 22% from overseas and 11% from Tasmania 42% of walkers are in pairs or a couple, 16% solo, 12% as a group of three, 12% as a
group of four and 19% in groups of 5 and above. 55% of walkers said the main reason they visited Tasmania was to walk Overland Track;
34% said the Overland Track was the only reason they came to the State (participating in no other activities). 11% came to Tasmania for different reasons but walked the Overland Track whilst in the State.
4.5 Track demand forecast Two track options have been identified:
Lower quality in terms of infrastructure provided, but offers a more ‘rugged’ experience. Would attract a more experienced walking market (Option 1)
High-quality trail and accommodation attempting to match the world-standard benchmark set by the Three Capes experience (Option 2). Could be marketed to a much wider audience.
Table 3 outlines these options in greater detail.
TABLE 3: CONSIDERATION OF TWO BROAD TRACK OPTIONS
Element Option 1 – ‘Rough’ track Option 2 – High-quality track
29 Parks and Wildlife Service - Report for Overland Track Walker Survey 2014- 2015
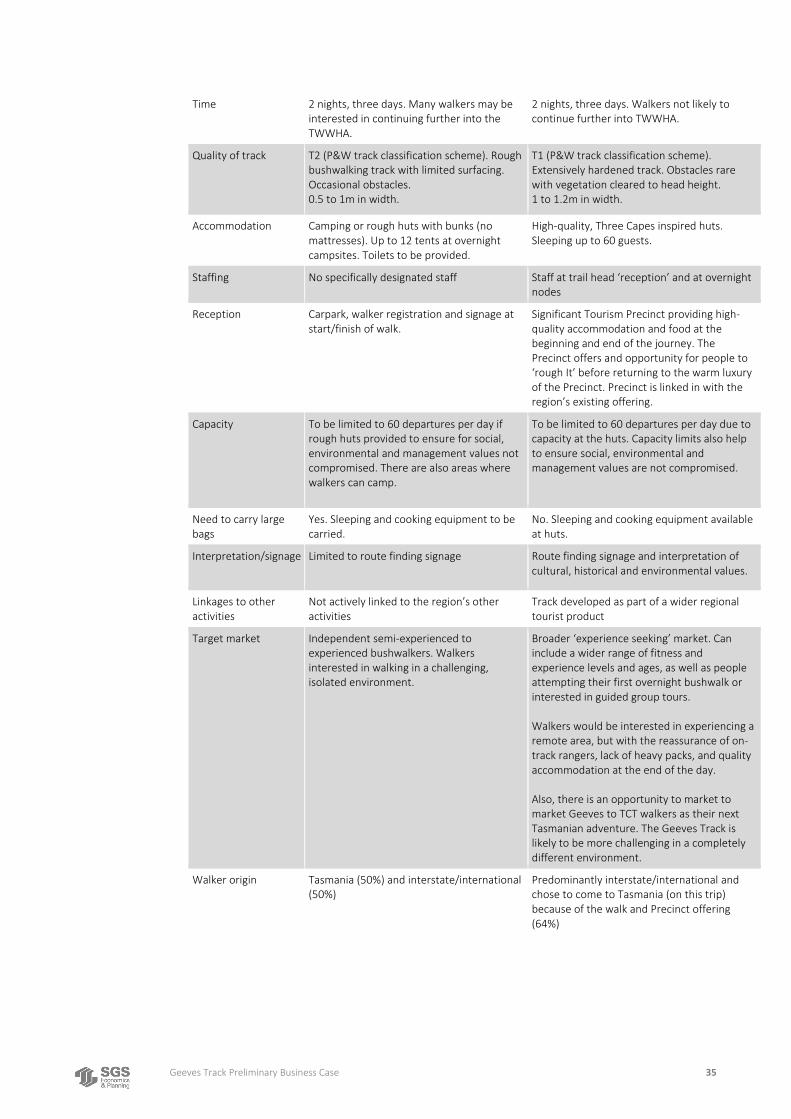
Geeves Track Preliminary Business Case 35
Time 2 nights, three days. Many walkers may be interested in continuing further into the TWWHA.
2 nights, three days. Walkers not likely to continue further into TWWHA.
Quality of track T2 (P&W track classification scheme). Rough bushwalking track with limited surfacing. Occasional obstacles. 0.5 to 1m in width.
T1 (P&W track classification scheme). Extensively hardened track. Obstacles rare with vegetation cleared to head height. 1 to 1.2m in width.
Accommodation Camping or rough huts with bunks (no mattresses). Up to 12 tents at overnight campsites. Toilets to be provided.
High-quality, Three Capes inspired huts. Sleeping up to 60 guests.
Staffing No specifically designated staff Staff at trail head ‘reception’ and at overnight nodes
Reception Carpark, walker registration and signage at start/finish of walk.
Significant Tourism Precinct providing high-quality accommodation and food at the beginning and end of the journey. The Precinct offers and opportunity for people to ‘rough It’ before returning to the warm luxury of the Precinct. Precinct is linked in with the region’s existing offering.
Capacity To be limited to 60 departures per day if rough huts provided to ensure for social, environmental and management values not compromised. There are also areas where walkers can camp.
To be limited to 60 departures per day due to capacity at the huts. Capacity limits also help to ensure social, environmental and management values are not compromised.
Need to carry large bags
Yes. Sleeping and cooking equipment to be carried.
No. Sleeping and cooking equipment available at huts.
Interpretation/signage Limited to route finding signage Route finding signage and interpretation of cultural, historical and environmental values.
Linkages to other activities
Not actively linked to the region’s other activities
Track developed as part of a wider regional tourist product
Target market Independent semi-experienced to experienced bushwalkers. Walkers interested in walking in a challenging, isolated environment.
Broader ‘experience seeking’ market. Can include a wider range of fitness and experience levels and ages, as well as people attempting their first overnight bushwalk or interested in guided group tours. Walkers would be interested in experiencing a remote area, but with the reassurance of on-track rangers, lack of heavy packs, and quality accommodation at the end of the day. Also, there is an opportunity to market to market Geeves to TCT walkers as their next Tasmanian adventure. The Geeves Track is likely to be more challenging in a completely different environment.
Walker origin Tasmania (50%) and interstate/international (50%)
Predominantly interstate/international and chose to come to Tasmania (on this trip) because of the walk and Precinct offering (64%)

Geeves Track Preliminary Business Case 36
Walking fees Parks pass required Walking fee ($200-$450) plus parks pass. Fee includes on track accommodation and transport from Tourism Precinct which acts as a reception for the walk. Other activities/accommodation should be available to ‘added-on’ as part of a package to encourage participation in other activities in the region.
Commercial tour operators
Permitted with consent, but not actively sought out. Focus is on independent walkers.
Encouraged. There will be an opportunity for a commercial operator to provide a fully guided walk experience. It is also envisioned the Precinct will be privately operated.
Assessment of track options
It is important for developments in the TWWHA to have minimal impact on the surrounding natural environment. This can be achieved in a number of ways, including variations to track construction approach, but the key variable is the number of visitors.
The main objective in the creation of a signature attraction for the region is to attract an increase in overall tourist expenditure. This can be delivered via a high number of low spending visitors, or a lower number of high-yielding visitors. Given the need to minimise the impact of visitation on the natural environment, in the context of the TWWHA the latter is preferable.
Based on the experience at 3CT, A high-quality product is more likely to attract high yielding visitors. The quality of the Track and Precinct will enable a wide range of visitors to access and engage with the natural environment; providing comfort and accessibility, and broadening the potential audience and demand.
In the Feasibility Study for the 3CT the key drivers were deemed to be the standard of the accommodation, the standard of track, the inclusion of water-based experience (or non-walking experience) and the presence of guides and track ranges. The high quality of on-track accommodation was seen as crucial to the success of the 3CT, along with a range of other factors including scenery and concept. The huts and track have set a new global benchmark in bushwalking amenity.
For these reasons Option 2 has been selected as the preferred option. This will support the ability of the Track to attract high yield visitors, a key management goal for the TWWHA. Figure 17 shows that the high-income visitor cohort is a significant and growing market segment for overnight bushwalks in the State.

Geeves Track Preliminary Business Case 37
FIGURE 17: OVERNIGHT BUSHWALKERS VISITING TASMANIA - HOUSEHOLD INCOME
Source: Tasmanain Visitor Survey (2017)
Research suggests that demand for ‘experiences’ is set to continue as the Australian population ages, retires and seeks unique experiences. Baby boomers are healthier, financially well off, better educated and have a greater desire for novelty, escape and authentic experiences and more adventurous forms of leisure than previous cohorts of retirees; as a result, the next wave of successful tourism businesses will be those geared towards the experience economy30.
Other factors affecting demand
Competition with existing Tasmanian walks
The Geeves Track is envisioned to be a similar offering to the 3CT in terms of being a hut-based walk that only requires a light pack (mattresses and cooking equipment available at the huts). For this Project to provide a net benefit to the state (rather than just the local region) it needs to generate new demand or accommodate presently unmet demand, rather than redirecting visitors from other regions. The demand analysis has assumed that 64%31 of walkers of the Geeves Track will visit the State because of the existence of the Track.
The Geeves Track will be a slightly more challenging walk, in a markedly different natural environment, located in a different region with unique side attractions and this will drive additional visitation to the State. It is also anticipated that there is latent demand of walkers who want to do an overnight hut walk in Tasmania but cannot due to capacity restraints at 3CT and the Overland Track, particularly during summer. While the Track will be
30 Ian Patterson & Shane Pegg (2009) Marketing the Leisure Experience to Baby Boomers and Older Tourists, Journal of Hospitality Marketing & Management 31 Based on 80% of walkers being from interstate/overseas (which is less than 3CT and Overland); and 80% of those walkers deciding to visit Tasmania because of wanting to walk the Track (compared to 89% at the Overland Track)
0
2,000
4,000
6,000
8,000
10,000
12,000
NU
MB
ER O
F O
VER
NIG
HT
BU
SHW
ALK
ERS
2015/16 2016/17

Geeves Track Preliminary Business Case 38
complementary product to the TCT, as opposed to a substitute these walkers would also comprise an element of the demand for the Geeves Track.
Walkers who complete and appreciate the TCT experience may be attracted back to Tasmania to complete another overnight walk in a different environment, on a Track of similar quality to the TCT. The TCT and Geeves Track could be marketed as a complementary pair of experiences driving return visitation to the State, or as a driver of extended stays in Tasmania with walkers completing both tracks in the same visit. The Track could also act as a ‘gateway’ to longer, less developed walks around the State (i.e. the Overland Track or South Coast Track).
The Geeves Track also has the potential to be a winter or shoulder season offering for some visitors, with snow-capped mountains and warm, inviting huts at the end of the day’s walking providing a unique experience. Tasmania’s reputation as a winter destination has been growing in recent years, especially with success of Dark Mofo, the Festival of Voices, and the Huon Midwinter Festival.
The TCT, Freycinet and the Overland Track experience very high demand. In this context, the development of a similar (but different) product in the Huon Valley has the potential to complement existing attractions, and to attract additional visitors to Tasmania.
Climate and track conditions
The TCT and Overland track are located in parts of Tasmania which experience somewhat milder and drier conditions compared to Huonville and the Geeves Track. The proposed Geeves track is also somewhat more challenging than these existing tracks. These conditions suggest there is a need to take a more conservative approach to forecasting demand, compared to the existing walks. In considering this assessment, however, it should be noted that there are a number of successful walks in New Zealand which include similar, challenging conditions.
The Fiordland National Park in New Zealand is he location of three of New Zealands premier overnight hut based walks; the Kelper Track, Routeburn Track, and the Milford Track. This area of New Zealand is located at the bottom of the South Island, further south than Tasmania’s South West Wilderness.
On average in the area about 7 metres of rain falls per year, an average of 200 rainy-days per year. Regarding temperatures, in the warmest month of the year (Janruary) the average daily high is only degrees on the Kepler Track, and 18 degrees on the Routeburn and Milford Tracks. Even in January the overnight minimum temperatures can hover around zero degrees, including snow at higher levels.
Even with this seemingly undesirable weather, the three tracks are overwhelming popular, with Tracks now operating at over 90 % capacity over the summer period32. Table 4 provides an overview of the characteristics of the Tracks.
32 New Zealand Department of Conservation

Geeves Track Preliminary Business Case 39
TABLE 4: SOTH ISLAND NEW ZEALAND OVERNIGHT BUSHWALKS
Track Description Accommodation Annual walkers
Kepler Track – Fiordland National Park
60km over 3-4 days. higher standard track.
Cost of walking the Track is $180 for three nights in huts.
There are 3 huts (and two campsites) along the Track. Must be booked in advance during the Great Walks season (Oct-Apr). Facilities include: Bunks with mattresses
Eater supply, flushing toilets, wash basins with cold running water (but no showers).
Heating with fuel
Cooking facilities tables and seating
A conservation ranger on-site
11,936 in 2014/15, up 8% on previous year.
Huts and campsites can book out many months in advance
Routeburn Track - Fiordland National Park
This alpine adventure Track is 32km and completed over two to four days.
Cost of walking the Track is $180 for three nights in huts.
Huts include: Bunks with mattresses in a communal sleeping layout.
Water supply, flushing toilets, wash basins with cold running water (but no showers).
Heating with fuel available, and usually solar lighting in the main area.
Cooking facilities with fuel, tables and seating (but no cooking utensils).
A resident Park ranger
14,225 in 2014/15, up 2.7% on previous year.
Huts and campsites can book out many months in advance.
Milford Track - Fiordland National Park
The Milford Track is 53.5 km long and is completed over days. Higher standard Track.
Cost of walking the Track is $193 for three nights in huts. Camping is not permitted on the Milford Track.
Huts include: Bunks with mattresses in a communal sleeping layout.
Water supply, flushing toilets, wash basins with cold running water (but no showers).
Heating with fuel available, and usually solar lighting in the main area.
Cooking facilities with fuel, tables and seating (but no cooking utensils).
A resident Park ranger
7,107 in 2014/15.
Huts and campsites can book out many months in advance
Source: New Zealand Department of Conservation
The average temperature is similar between most places on the Southern Island of New Zealand and South West Tasmania. The experience is New Zealand suggests that poor weather is not necessarily an impediment to the popularity of hut-based multi-night walks.
Estimated Track Demand
Due to the above factors the following estimate has been made: Three years after being fully developed the visitors to the Track is assumed to be 10,000;
the same as 3CT currently.
4.6 Tourism precinct forecast The development of a high-quality walking track in the region would be complemented by the development of a tourism precinct. This would:
Provide a start and end of trip point for track walkers, with high quality, comfortable accommodation available
Attract visitors who are not doing the overnight walk, including overnight visitors as well as increasing the day trip market
The development of accommodation is a key component of the precinct. Consideration of current accommodation supply in the region indicates that the majority of the accommodation supply in the region consists of holiday units/houses or bed and breakfasts alongside a few small hotels and camping grounds, and 152 option listed on AirBnB. There is a shortage of large accommodation options that can accommodate groups or a tour bus of

Geeves Track Preliminary Business Case 40
visitors in a single location. The ABS data below confirms the lack of large accommodation facilities in the Huon Valley Region compared to other parts of regional Tasmania.
TABLE 5: ESTABLSHMENTS WITH 15 OR MORE ROOMS BY REGION (2016)
Region Establishments with 15+ rooms Number of beds in large establishments
Tasman Peninsula 4 – with several more in planning 454
East Coast, Triabunna to Bicheno (including Coles Bay/Freycinet)
11 1,086
East Coast, St Helens to Scamander
7 932
Sheffield – Railton (nearby and including Cradle Mountain)
5 695
West Coast 9 1,141
Huon Valley Region 0 0
Source: ABS (2016). Tourist Accommodation, Australia, 2015-16
The undersupply of medium to large accommodation establishments in the region suggests that the development of accommodation at the Tourism Precinct would be addressing a current gap in the accommodation network.
There has been strong growth in the number of nights spent in ecotourism and wilderness accommodation across Tasmania in recent years. Between 2013/14 and 2016/17 (see Table 6), the number of nights spent in wilderness lodge accommodation by visitors to Tasmania increased by 8.9 per cent per annum, and the number of nights spent in tents or cabins (not in caravan parks) increased by 6.7 per cent per annum. These growth rates are higher than growth in total visitor nights in Tasmania representing significant growth in this ecotourism/ wilderness market when compared to other non-nature based accommodation types.
TABLE 6: DEMAND FOR WILDERNESS LODGES
Accommodation type 2013/14 2016/17 AAGR
Total nights – all types 9,138,834 10,881,283 4.5%
Camping/cabin – not caravan park 252,136 326,910 6.7%
Wilderness lodge 128,053 179,996 8.9%
Source: Tasmanain Visitor Survey (2017)
Generating demand for visitation at the Precinct goes beyond providing accommodation. Affluent luxury seekers view ecotourism/ wilderness accommodation as a whole experience, and evaluate accommodation and destination as a package when making a decision to travel. It therefore likely that visitors attracted by the Track and Precinct would participate in other activities which could be housed at the Precinct, including rafting, mountain biking, and produce/wine tours. However, as the detailed planning and design of the Precinct is not part of this stage, the participation in these activities has not been included as part of the demand for the Precinct, but are included as part of the wider flow-on demand for the region.
Demand for the Precinct is estimated to be driven by three components:
Track walkers, who if stay one night on average each, equates to 10,000 visitor nights per annum.
People who currently travel to the Region tend to not stay in the region. The average amount of people who stay overnight in the region across the four major towns is 15%. With the Precinct providing an enticing offer the amount of people staying overnight in

Geeves Track Preliminary Business Case 41
the region is assumed to increase to 20%, resulting in an additional 4,316 visitor nights per annum.
New demand for the outdoor activities and wilderness immersion. By averaging the number of visitors to three major towns in the Region (Huonville, Dover, Cygnet) we get 95,721 visitors as a proxy estimate of the number of visitors who said they participated in outdoor activities and visited the region. This represents 11% of all visitors to the State who participated in outdoor activities. With the development of the Precinct and associated outdoor activities (mountain biking, short walks, picnics, rafting etc) it is assumed that the Region captures a greater share of these visitors. If the Region now attracts 16% of all outdoor visitors, the same as New Norfolk and Bruny Island (but still less than Richmond (28%) and Port Arthur (28%)), then this equates to an additional 40,032 visitors. If 50% stay overnight (in-line with point 2) this leads to an additional 10,016 visitor nights per annum at the Precinct, once the track walkers are removed to avoid double counting. This also results in 20,032 day visitors per annum to the Precinct who would have otherwise not visited the region.
In total, the estimated demand for the accommodation at the precinct is 24,332.
Further, if occupancy rates are assumed to be 70%, and the number of people per room is estimated at 1.8, this equates to a demand for at least a 53 room development as a rough estimate.
Flow-on demand
The establishment of the Geeves Track and Precinct will also support other tourist experiences in the region, both existing and yet to be developed. The Parks and Wildlife Service conducted a survey in 2014 looking at options for regional experiences either before or after walkers complete the Three Capes Track33. It revealed that a large number of respondents were interested in both staying in the surrounding region, as well as engaging in activities such as visiting local tourist attractions or participating in specialised tours, before or after undertaking the TCT. A similar interest in activities other than the walk is likely in the Huon Valley Region.
The region has the potential to leverage the Track to support growth of regional accommodation, outdoor experiences, food, cider and wine experiences, and cultural/historic attractions. Increased tourism provides an opportunity to extend the scope and scale of built attractions and hospitality that would not normally be available if they were solely reliant on local patronage and current low visitation. The development could stimulate the use of existing infrastructure in the area such as the Tahune Airwalk, Hartz Mountain and Hastings Caves.
This would also increase the range of activities available to the local community.
It is also envisaged that growth will drive a shift in the way visitors engage with the region, helping to transform it from a day trip destination to one in which visitors seek extended stays.
33 PWS (2014). Project Update. http://www.parks.tas.gov.au/file.aspx?id=37381
REGIONAL MARKETING
Demand for attractions in the region will depend, in part, on successful promotion. Studies have shown that one of the ultimate requirements of a successful destination marketing strategy is for the region to be able to present a unique identity to potential visitors, rather than just promoting a collection of attractions available within an area in an ad-hoc manner. This provides the visitor with a real sense of connection with the ’place’ and the destinations key offerings.

Geeves Track Preliminary Business Case 42
4.7 Summary of demand The following provides a summary of the estimates of visitation for the track and precinct.
It is assumed that of the 10,000 track walkers per year, 80 per cent of these are visitors from outside Tasmania, and 80% of these people would not have otherwise visited Tasmania. This means that 64 percent of track walkers are new visitors to the State. The remainder of visitors are either Tasmanian residents (20 percent) or visitors who had planned to visit Tasmania but not the Track.
It is assumed that the average length of stay of these additional visitors is 4 nights in the region, comprising 2 nights on the track, 1 night at the precinct and 1 night elsewhere in the region. It is also assumed that these visitors spend 2 nights elsewhere in Tasmania.
TABLE 7: DEMAND SUMMARY (OPTION 2)
Component High
Track Visitation
Track users (3 years after development) 10,000
Additional international/domestic visitors in Tasmania due to the Track (ie would not have otherwise visited Tasmania)
64%
Average length of stay in Tasmania (of overseas / domestic visitors from outside Tasmania)
6 nights (in total)
Average length of stay in region (of overseas visitors/ domestic from outside Tas)
4 nights, made up of 2 nights on the Track, 1 night at the Precinct, 1 night elsewhere in the Region
Precinct bed nights 24,322
Precinct Visitation
Flow-on demand from Track (visitor nights in region) 8,000
New day trips to Region (visiting the Precinct) 20,032

Geeves Track Preliminary Business Case 43
5. PROPOSAL COSTING
This section provides a high level costing of the proposed Track including on track accommodation
5.1 The Geeves Track
Assumptions
The following assumptions have been made in order to provide the high-level estimate:
Track construction specification is the same as the Three Capes Track. Walk specification is not the same as Three Capes. The maximum grade of the Three
Capes Track is 8 degrees grade. This limit is most likely not achievable with the current route for the Geeves Track. So if this specification is to be met then the track will become significantly longer.
The length of the Track is assumed to be 20 kilometres. This is a desktop estimate, and assumes no alteration to the existing route. SGS acknowledges that the
Length of track is assumed to be 20 kilometres based on a desk-top estimate and no rerouting of the existing route34.
Costing for the Geeves Track is based on the actual cost of sections of the Three Capes Track comparable to Farmhouse Creek Track. The northern section of Mt Fortescue ($267 per metre) was used with an allowance for an increase in width from 0.6m to 1m.
The prices here are in 2015 terms, when the Three Capes Track was constructed. The existing Lake Geeves route follows river and creek beds. This has consequences in
that the Track will be affected by flooding from time-to-time, possibly causing physical damage and periods of closure for safety reasons.
Limitations
It should be noted that while the construction cost estimates will be robust, the challenging environment of the trail, and nature of the concept plans, will mean that the costs will be preliminary. This is in keeping with the intent of the project to further investigate the concept of the trail improvement and extension.
The preliminary costings include track construction, helicopter costs, logistics and materials. They do not include:
Costs associated with project management, project planning or approvals processes; Any differential associated with variations in material cost or availability within the Huon
Region; and An allowance for the extra cost of 17 bridges and approaches. One of these bridges will
be major in order to cross the South Cracroft River.
Track costing
The cost of delivering the track was estimated at $534 per metre, allowing for 16.5 kilometres of existing track and 700 metres for the realignment required for river and creek crossings. A further 2.5 km of new track with 300 metres costing allowance for realignment and viewing
34 SGS recognise that the ultimate location and route of the track is subject to change should environmental or other assessments deem alternate locations to be more suitable.

Geeves Track Preliminary Business Case 44
areas was also costed. The total preliminary cost was calculated at $10,146,000 in 2015 dollar terms.
Inflating costs to 2017 terms35 gives an estimated total cost of $10,513,000.
5.2 Accommodation along track
Assumptions
The following items have been included in the high-level estimate of two design options for the accommodation nodes:
Planning and design, ground works, materials, construction, and all logistics including use of helicopter
Limitations
The estimates will vary depending on the exact location of where the accommodation is built with the zoning of the soils, distance from the road head and elevation of the construction site in relation to the start point, all impacting the final costs.
It should also be noted that any additional maintenance costs associated with increased use of connecting tracks (such as the Eastern Arthurs track) has not been included.
Track accommodation costings
The following high-level estimates have been calculated:
The provision along the Geeves Track of accommodation node complexes similar to the TCT would cost $3.3 million (+/- $0.2 million) per node, if built in 2015. This estimate includes the cost of staff facilities on-site. Inflating costs to 2017 terms36 results in an estimated cost of $3,419,000 per node.
The provision of accommodation nodes of lower amenity, similar to those provided on the Overland Track, would cost in the vicinity of $1.9 million to $2.1million per node. This estimate would rise if any facilities were provided for staff on site. I.e. power, separate staff structure, communications and etc. Inflating costs to 2017 terms37 results in an estimated cost of $2,072,000 per node.
5.3 Operation costs of track and nodes Estimates for annual running cost, based on the TCT experience, would be around $1.036 million per annum38 with two hut nodes.
This figure includes management and overheads costs, hut staffing, all helicopter costs to operate the nodes, and all other logistics and material and maintenance of huts and track.
Limitations
The estimates will vary depending on:
Helicopter costs which are most likely to be higher than 3CT due to there being no local company, and therefore higher ferrying costs. If no helicopters used then maintenance costs lower.
35 By using the ABS Consumer Price Index for Hobart. 36 By using the ABS Consumer Price Index for Hobart. 37 By using the ABS Consumer Price Index for Hobart. 38 Inflated to 2017 dollars by using the ABS Consumer Price Index for Hobart.

Geeves Track Preliminary Business Case 45
There is a chance that track maintenance will be higher than estimated above due to the Geeves Track being mostly within the flood plains of several creeks and a river, leading to the need for maintenance. The area the Track will traverse experiences a much higher rainfall than the 3CT.
A more certain estimate cannot be provided at this preliminary stage without the actual Track design. A scenario with higher than estimated operation and maintenance costs has been modelled in section 0 to consider this variable further.
Geeves Track Preliminary Business Case 46
6. ECONOMIC IMPACT ASSESSMENT
This section uses the estimated demand established in section 4 and data on the spending patterns of multi-night bushwalkers and nature-based activity participants in Tasmania to estimate the impact of attracting visitors to the region.
6.1 Introduction
An Economic Impact Assessment (EIA) measures the degree to which the economic stimulus associated with a project results in total economic activity levels of a defined region, i.e. after measuring the cumulative impact of all the buyer/ supplier transactions that are induced in the region.
The basic steps in undertaking an EIA include:
1. Isolating how the project stimulates the regional economy (direct impacts). In this instance, it includes money spent by new visitors from outside Tasmania on a range of goods and services (e.g. accommodation, food and beverages, transport and activities/attractions) as well as money spent by visitors who are attracted to stay longer in the Region because of the improved tourism offer.
2. Generating region specific econometric models and subsequently deriving economic multipliers for major regional industry groups.
3. Applying these multipliers (by relevant industry group) to the direct impacts to estimate total regional impacts in terms of regional (output) value added and employment. This effectively represents how money ‘flows’ through the economy. For example, a new visitor to the region will purchase meals and accommodation. The inputs to this (raw food, services in the form of local wages) will generate further economic activity in the local economy.
SGS has developed and used a region-specific Input-Output model to assess economic impacts of the proposed redevelopment on both the Huon Valley Region (the Region) and Tasmania as a whole.
This sections first considers the economic impacts at a whole of Tasmania level; before a distributional analysis outlines the impacts directly on the Regional economy.
6.2 Economic stimuli (direct impacts)
The economic stimuli of the Geeves Track and Tourism Precinct (step 1 above) include:
Capital (construction) costs of the Track, including on-track accommodation nodes On-going operation and management of the Track. Visitor expenditure of walkers on accommodation, food and beverages, retail, transport
and activities/attractions whilst in the Region and State. Visitor expenditure at the Tourist Precinct on accommodation. This includes Track
walkers, existing visitors enticed to stay in the region longer, and new demand as estimated in chapter 4.

Geeves Track Preliminary Business Case 47
Visitor expenditure at the Tourist Precinct by overnight guests plus day-trippers (as estimated in chapter 4) on food and beverages, local produce and art, and transport and activities at (or departing from) the precinct.
For a detailed list of assumptions regarding the estimated direct economic stimuli see the Appendix.
Visitor expenditure and the construction of the infrastructure is ‘new money’ contributed to the local economy which supports jobs, real estate value and the provision of services, facilities and activities in the community.
6.3 The Input-Output (I-O) Model
The Input-Output (I-O) Model is a tool which quantifies the linkages of all sectors in a given economy (Step 2, above). A region-specific model for Tasmania was utilised to assess economic impacts of the project during the construction and operational phases. Multipliers derived from the models estimated three key measures:
Output (or income); Value added Gross Regional Product (GRP); and Full time equivalent (FTE) jobs.
The model examines how the proposed track and precinct affect the local economy through all of the upstream and downstream linkages. The assessment traced all the flow on effects – ‘production’ and ‘consumption’ induced effects - in the local / regional economy, to estimate the direct and indirect effects of the turnover generated during the redevelopment’s construction and operational phases. The economic impact in terms of output (or income), value added (GRP) and employment (FTE jobs) have been summarised in this chapter.
6.4 Assessed economic impacts
Construction phase
Construction impacts are a one-off economic impact and consists of two components:
The construction of the track and on-trail accommodation The construction of the tourist precinct
High-level Precinct Costings
The assess the economic impacts of a tourist precinct on the Region and the State a high-level estimate has been made, noting that the precise scale and design is yet to be determined. A case study of other proposed tourist precincts or wilderness lodges was performed to understand the likely development costs of a similar facility.
The Precinct has been assumed in the analysis to be developed by the private sector, none-the-less the construction costs have been quantified as the construction of the Precinct will have economic impacts for the Region.
Table 8 provides a short overview of five proposals for eco based developments.
TABLE 8: CASE STUDY OF OTHER PROPOSED TOURISM PRECINCTS AND WILDERNESS LODGES/RESORTS
Facilities Cost
World Heritage Wilderness Village at
Cradle Mountain (Proposed)
The World Heritage Wilderness Village is part of the Cradle Mountain Visitor Experience Master Plan, which seeks to deliver a ‘precinct revitalisation’ at Cradle Mountain. The Village is envisaged to include Visitor Centre with Interpretation; Tour Desk; Events Space; New Cradle Feast Experience; Café
The total estimated construction cost for the project is $41.5

Geeves Track Preliminary Business Case 48
and Restaurant; Retail. million39, which excludes the cable car. The cost for the visitor centre and cradle hub is estimated at $23.9 million; $28.9 including contingencies and consultants.
Franklin Foreshore Redevelopment
(Proposed)
Hotel, microbrewery, café, tenancies and museum on the Huon River at Franklin. Proposed hotel portion of the site will consist of 22 hotel suites.
Estimated to cost $5.5 million to construct/redevelop from existing sheds and buildings. High quality design.
Remarkable Lodge at Crescent Bay, Tasman Peninsula (Proposed)
A proposed luxury wilderness lodges consisting of 20 suites.
Estimated to cost in the region if $20 million
Table Cape Resort, Wynyard (Approved
for construction)
A state of the art tourism destination, which is to include a 50-room luxury resort, public restaurant, a spa and wellness centre, a local farmer’s restaurant (open to public) and a function centre.
The development has an estimated construction cost of $90 million.
Princetown Eco-resort, Great Ocean
Road, Victoria. (Approved for construction)
20-room eco-lodge, eco-cabins, restaurant, pool, car parking, boat shed and associated infrastructure on a 49-hectare site
Development estimated to cost in $9 million
It is clear the costs vary significantly depending on the actual proposal. For the analysis a figure of $20 million has been used to estimate the economic impacts, however this figure is likely to change to suite the desires and vision of the private sector, the figure should be regarded as a proxy estimate for the economic analysis only.
Track costing
A high amenity track with two accommodation nodes was costed in Chapter 5 at $16,746,000 in 2015 terms. Inflating to 2017 dollar terms40 the estimated construction and development costs total $17,351,000.
SGS assumes 93 percent of the value of construction and material supply contracts for the work will be awarded to businesses in Tasmania, (i.e. $16.1 million), in-line with the experience constructing the 3CT. The remaining 7% is assumed to leave the state and is not included in the EIA analysis.
A breakdown of these economic impacts is provided in Table 9.
39 Cradle Mountain Visitor Experience Master Plan Final 1.0 40 By using the ABS Consumer Price Index for Hobart.

Geeves Track Preliminary Business Case 49
TABLE 9: TASMANIAN ECONOMIC IMPACTS - CONSTRUCTION PHASE
Source of Stimulus Initial Flow-On Total
Construction Activities (Track)
Output $16,100,000 $16,000,000 $32,200,000
Value Added $6,100,000 $7,100,000 $13,200,000
Employment 11 53 64
Construction Activities (Precinct)
Output $18,600,000 $22,400,000 $41,000,000
Value Added $5,000,000 $9,600,000 $14,600,000
Employment 33 72 105
Total Impact of Construction Activities (Track and Precinct)
Output $34,700,000 $38,400,000 $73,200,000
Value Added $11,100,000 $16,700,000 $27,800,000
Employment 43 126 169
The stimulus generated during the construction period is estimated to generate $11 million in initial value add and directly support 43 jobs in Tasmania, over the length of the construction period, assumed to be three years.
When the flow-on effects are incorporated, this construction stimulus translates to a combined (direct and indirect) economic impact of:
Output/income $73.2 million during construction Value added $27.8 million during construction Employment 169 full time equivalent jobs during construction
Operational phase
Track operation and maintenance
Operation of the track is an economic stimulus generating employment and the purchase of materials and services from suppliers. The on-going expenses of operating the track include staff costs, track works, maintenance of huts, cleaning and waste removal, and booking systems and IT. It does not, as noted previously, include maintenance of other tracks in the region that may experience increased use as a result of the upgrade to the Lake Geeves track.
It has been assumed that the business model for the Geeves Track will be to obtain full operational cost recovery. Annual operational costs for the Geeves Track is estimated at $1.036 million per annum, as estimated in section 5.
TABLE 10: TASMANIAN ECONOMIC IMPACTS - TRACK OPERATION (ANNUAL)
Source of Stimulus Initial Flow-On Total
Annual maintenance and operational costs
Output (millions of dollars) $1,000,000 $800,000 $1,800,000
Value Added (millions of dollars) $500,000 $400,000 $900,000
Employment 9 3 12
The stimulus generated by maintenance and operation of the Track is estimated to generate $500,000 in initial value add and directly supports 9 FTE jobs in Tasmania, per annum.

Geeves Track Preliminary Business Case 50
When the flow-on effects are incorporated, this stimulus translates to a combined (direct and indirect) economic impact of:
Output/income $1,800,000 per annum Value added $900,000 per annum Employment 12 full time equivalent jobs per annum
Other un-modelled economic impacts
An important benefit associated with the establishment of the track will be profit generated as a result the ongoing operation of the track. If revenues (walking fees) are greater than the annual operational and management costs then the profits generated accrue to the State Government (if operated by the Parks and Wildlife Service). These funds could be reinvested into the State’s protected area network or other community infrastructure. This economic impact has not been considered here as this stimulus will not flow directly to the Huon Valley Region and community. This stimulus is estimated as a benefit in the CBA analysis.
Visitor expenditure impacts
The Track and Precinct will attract new visitors to Tasmania. It has been assumed that 80% of walker and visitors to the Precinct are from interstate and overseas and that 80% of visitors would have otherwise not come to Tasmania or are Tasmanian’s who wold have left the State and holidayed elsewhere.
In total, it is assumed that 64% of the demand for the Track and Precinct can be considered as new economic stimulus for Tasmania41. Each Track walker is assumed to spend $323 a day on accommodation, food and beverages, transport, retail goods and activities/attractions, and in total spend 6 days in the State, estimated in section 4. Spending for outdoor enthusiasts already traveling in region but attracted to stay at the Precinct (but not walk the Track) is estimated at $215 per day, as estimated in section 4. For the full break-down of the assumptions used to calculate the economic stimulus of visitor spending also see the Appendix.
The impacts of this expenditure on Tasmania’s tourism related industries are shown in Table 11.
41 These assumptions are a conservative estimate based on the experience at 3CT and the Overland Track, where 81%-90% of walkers are from interstate and overseas, and 89% of walkers on the Overland Track said the main reason for coming to Tasmania was to walk the Track.

Geeves Track Preliminary Business Case 51
TABLE 11 TASMANIAN ECONOMIC IMPACTS, BY INDUSTRY – VISITOR SPENDING (ANNUAL)
Source of Stimulus Initial Flow-On Total
Accommodation providers
Output $4,400,000 $4,100,000 $8,500,000
Value Added $2,000,000 $2,000,000 $4,000,000
Employment 23 14 37
Hospitality industry (food and beverage)
Output $3,200,000 $3,100,000 $6,300,000
Value Added $1,500,000 $1,500,000 $3,000,000
Employment 26 10 36
Retail
Output $1,600,000 $1,400,000 $3,000,000
Value Added $900,000 $800,000 $1,700,000
Employment 12 5 17
Transport providers (excluding airlines)
Output $900,000 $700,000 $1,600,000
Value Added $400,000 $300,000 $700,000
Employment 4 3 6
Attractions and activities
Output $2,100,000 $1,400,000 $3,500,000
Value Added $900,000 $800,000 $1,700,000
Employment 14 6 19
In total, the operation of the Track and the stimulus generated by tourists visiting the State, visitors staying longer, or Tasmanian’s deciding to holiday at home, due to the Track and Precinct development is estimated to generate $6.0 million in initial value add and directly supports 87 FTE jobs across the State, as shown in Table 12.
TABLE 12: TOTAL TASMANIAN ECONOMIC IMPACTS - OPERATIONAL PHASE (ANNUAL)
Source of Stimulus Initial Flow-On Total
Total operational impact
Output $13,200,000 $10,800,000 $24,000,000
Value Added $6,000,000 $5,500,000 $11,500,000
Employment 87 39 126
When the flow-on effects are incorporated, the operational stimulus for the State generated by the Track and Precinct development translates to a combined (direct and indirect) economic impact of:
Output/income $24.0 million per annum Value added $11.5 million per annum Employment 126 full time equivalent jobs per annum

Geeves Track Preliminary Business Case 52
Much of this economic stimulus will be captured by the Huon Valley Region, a region in need of jobs and investment. The next section considers the scale of the economic stimulus that will flow to the Region.
6.5 Distributional analysis – economic stimulus for the Region This section considers the economic impacts of the investments in the Track and Precinct for the Huon Valley Region. As discussed in section 3 of this Report, the region performs poorly not only economically and socially compared to the rest of the State, but also has a underdeveloped tourist offering which has potential to be developed to a higher standard and provide employment and training opportunities, and industry diversification for the Region.
Construction phase
Construction of the track and accommodation nodes has the potential to offer opportunities for workers with relevant skills in the Region, likely to be derived from downsizing industries such as forestry. The provision and transport of materials and construction of the Track and huts will offer opportunities for the transport, extractive industries and construction sectors.
It has been assumed that 75% of Track and Precinct construction materials and labour will be sourced from the Region (with 93% in total staying with in Tasmania). As shown in Table 13, the stimulus equates to a direct value-add to the regional economy of $8 million over the construction period, and the creation of 36 direct FTE jobs, which equates to 84% of the direct jobs of constructing the Track and Precinct.
TABLE 13: REGIONAL ECONOMIC IMPACTS - TRACK AND PRECINCT CONSTRUCTION PHASE
Source of Stimulus Initial Flow-On Total
Construction Activities (Track)
Output $13,000,000 $4,300,000 $17,300,000
Value Added $4,300,000 $1,500,000 $5,900,000
Employment 9 16 25
Construction Activities (Precinct)
Output $18,100,000 $18,000,000 $36,100,000
Value Added $3,700,000 $2,400,000 $6,100,000
Employment 27 25 51
Total Impact of Construction Activities (Track and Precinct)
Output $31,100,000 $22,300,000 $53,400,000
Value Added $8,000,000 $3,900,000 $12,000,000
Employment 36 40 76
When the flow-on effects are incorporated, this construction stimulus translates to a combined (direct and indirect) regional economic impact of:
Output/income $53.4 million during construction Value added $12.0 million during construction Employment 76 full time equivalent jobs during construction
In total, with the flow-on effects incorporated, the EIA modelling shows that 73% of total output will accrue to the local region during construction, 43% of economic value-added and 45% of the total jobs.

Geeves Track Preliminary Business Case 53
Operational phase – Track operation and maintenance
Track operation and maintenance
Management and maintenance of the track has the potential to offer opportunities for workers with relevant skills in the Region. Table 14 shows the economic impacts that having the Track in the Region will have in terms of its operation and maintenance. The stimulus equates to a direct value-add to the regional economy of $0.4 million per, and the creation of 9 direct FTE jobs, which equates to 100% of the direct jobs of operating and maintaining the Track.
TABLE 14: REGIONAL ECONOMIC IMPACTS - TRACK OPERATION (ANNUAL)
Source of Stimulus Initial Flow-On Total
Annual maintenance and operational costs
Output (millions of dollars) $1,000,000 $200,000 $1,200,000
Value Added (millions of dollars) $400,000 $100,000 $500,000
Employment 9 1 10
When the flow-on effects are incorporated, this stimulus from operating the Track translates to a combined (direct and indirect) regional economic impact of:
Output/income $1.2 million per annum Value added $0.5 million per annum Employment 10 full time equivalent jobs per annum
In total, with the flow-on effects incorporated, the EIA modelling shows that 69% of total output will accrue to the local region, 55% of economic value-added and 81% of the total employment.
Operational phase – Visitor expenditure impacts
The increased tourist expenditure generated by attracting new visitors or existing visitors to stay longer in the Region is the key economic stimulus generated by the Track and Precinct. Currently the Region has a promising, but underdeveloped tourist offering, including a lack of large scale accommodation.
It was noted in the Investment Need chapter that in broad terms, the viability of the region’s tourism industry would be greatly improved through extending the length of stay of visitors, improving the yield from each visitor and evening out the seasonality of visitation. This would boost the viability of local businesses, by increasing demand during low-visitation periods. The EIA demonstrates that by attracting visitors to visit and stay longer in the Region, particularly high-yield visitors, and the promotion of the Geeves Track as a nearly year-round attraction, there significant economic benefits for the region.
This section considers:
The economic stimulus that is generated at the Precinct, including the scale of employment that is estimated to be located there
The wider economic impacts to the Region’s existing attractions and businesses A consideration of the impacts on existing Government infrastructure and investments,
including the Tahune airwalk
Precinct economic impact on the Region
The Precinct will provide many functions that will increase the tourist expenditure in the Region. The Precinct will:

Geeves Track Preliminary Business Case 54
Provide a new large-scale accommodation offering for the Region, including a large scale eco-facility which could accommodate at least a tour bus sized group of people. Large scale accommodation is under supplied in the Region. Visitors who already visit the Region will be enticed to stay overnight instead of using the Region as a day excursion.
The Precinct will provide pre or post walk accommodation for walkers. This generates spending at the Precinct, with the expenditure staying in the Region as opposed leaving if walkers were to stay in Hobart. The Precinct will allow people to access the wilderness but return to warm, comfortable location to rest.
Creating an experience that is wider than purely the walk is a key factor to success. The Precinct will operate as a Track welcome and reception, and link walkers with a host of other activities, tours or experiences with-in the Region. The Precinct is a launching place for wilderness activities (e.g. bike riding, rafting, wildlife tours, short bushwalks). The effects of this is two-fold, it makes the Track experience more desirable driving demand whilst also spreading the tourist expenditure to other tourism operators in the Region.
It is anticipated the Precinct would be an attraction its own right, generating demand for overnight and day visits, distinct from the Track. It has been estimated that the Precinct will experience demand from overnighters and day-trippers who would have otherwise not visited the Region at all. Tour groups, particularly form the growing Asian tourist market, and cruise ship visitors are likely market segments which will be attracted.
A visitor information centre providing information, promotion of the region’s tourism offering, and context and history of the region is also envisioned to be offered, further connecting the Track and Precinct to the wider Region’s tourism offering.
The Precinct is envisioned to host a retail and food/ beverage outlets, particularly linked to local produce and goods. The Precinct will be an opportunity to champion the Regions produce, products and arts and crafts.
In summary, the Precinct will capture a significant portion of the tourist expenditure generated by the Track in the Region by providing a desirable place for walkers to stay per or post walk, whilst also attracting new visitors to the Region, or by enticing existing visitors to stay longer. It is assumed that 80% of visitors to the Precinct would not have otherwise stayed in, or visited the Region. The economic impacts of this are shown in Table 15.
The economic stimulus captured at the Precinct directly leads direct value-add to the regional economy of $2.9 million per year, and the creation of 42 direct FTE jobs. Direct employment across the four sectors at the Precinct is accommodation (18 jobs), a restaurant and/or café (12 jobs), activities and tours (7 jobs) and retail/visitor centre (5 jobs).

Geeves Track Preliminary Business Case 55
TABLE 15 REGIONAL ECONOMIC IMPACTS, BY INDUSTRY – VISITOR SPENDING AT PRECINCT (ANNUAL)
Source of Stimulus Initial Flow-On Total
Accommodation at Precinct
Output $3,400,000 $3,100,000 $6,500,000
Value Added $1,500,000 $400,000 $1,900,000
Employment 18 3 21
Food and beverages bought at Precinct (restaurant/café)
Output $1,500,000 $1,500,000 $3,000,000
Value Added $700,000 $200,000 $900,000
Employment 12 1 14
Activities and tours beginning from Precinct
Output $1,300,000 $900,000 $2,200,000
Value Added $300,000 $100,000 $400,000
Employment 7 1 8
Precinct Retail
Output $700,000 $600,000 $1,300,000
Value Added $400,000 $100,000 $500,000
Employment 5 1 6
Total expenditure at Precinct
Output $6,900,000 $6,100,000 $13,000,000
Value Added $2,900,000 $800,000 $3,700,000
Employment 42 6 49
For the list of assumptions used to calculate visitor spending see Section 4 of this Report and the Appendix.
When the flow-on effects are incorporated, this stimulus from the capture of visitor spending at the Precinct equates to a total combined (direct and indirect) regional economic impact of:
Output/income $13 million per annum Value added $3.7 million per annum Employment 49 full time equivalent jobs per annum
In total, with the flow-on effects incorporated, the EIA modelling shows all of the output generated will accrue to the local region, 77% of economic value-added and 96% of the total employment.
Wider economic impacts to the Region’s existing attractions and businesses
The wider economic impacts encapsulate the visitor spending that is not captured at the Precinct or on the Track (via track operational and management costs). It represents the expenditure of walkers attracted to the Region by the Track who then explore and visit other sites, attractions and areas in the Region. The main assumption is that Track walkers spend 1 night in the Region (on average) beside their two nights on the Track and one night (on average) in the Precinct.
This stimulus has the potential to foster greater town vibrancy and attract a larger pool of customers to businesses. This will likely lead to increased business confidence and profitability, and increased investment, in the towns of the region including Huonville/Ranelagh, Franklin, Cygnet, Geeveston, Dover and Southport as well as providing employment for the Region’s workers in tourism related businesses. The development, by

Geeves Track Preliminary Business Case 56
attracting greater tourist expenditure, will enable the expansion of the employment market in both depth and scope through the availability of a greater variety of occupations such as accommodation managers, chefs, waiters, retail workers, parks rangers, tour operators, and more.
Table 16 shows the estimated economic impacts generated by walkers being attracted to other parts of the Region. It shows that the economic stimulus generated directly leads direct value-add to the regional economy of $2.2 million per year, and the creation of 34 direct FTE jobs. Direct employment across the five tourism related sectors across the Region is accommodation (6 jobs), restaurant and cafés (13 jobs), other attractions and activities (7 jobs), retail (6 jobs), and transport (3 jobs).
TABLE 16: WIDER REGIONAL IMPACTS BY INDUSTRY – VISITOR SPENDING ACROSS REGION (ANNUAL)
Source of Stimulus Initial Flow-On Total
Accommodation across the Region
Output $1,100,000 $300,000 $1,400,000
Value Added $500,000 $100,000 $600,000
Employment 6 1 7
Food and beverages bought across the Region (restaurant/cafés)
Output $1,500,000 $400,000 $1,900,000
Value Added $700,000 $200,000 $900,000
Employment 13 1 14
Other attractions/activities in the Region
Output $800,000 $100,000 $900,000
Value Added $300,000 $100,000 $400,000
Employment 7 1 7
Regional retail expenditure
Output $800,000 $200,000 $1,000,000
Value Added $500,000 $100,000 $600,000
Employment 6 1 7
Regional expenditure on transport (petrol, bus fares, tours etc)
Output $700,000 $100,000 $800,000
Value Added $200,000 $100,000 $300,000
Employment 3 1 4
Total wider regional expenditure
Output $4,900,000 $1,100,000 $6,000,000
Value Added $2,200,000 $600,000 $2,800,000
Employment 34 5 38
When the flow-on effects are incorporated, this stimulus from the capture of visitor spending in the Region equates to a total combined (direct and indirect) regional economic impact of:
Output/income $6 million per annum Value added $2.8 million per annum Employment 38 full time equivalent jobs per annum

Geeves Track Preliminary Business Case 57
In total, with the flow-on effects incorporated, the EIA modelling shows that 48% of total output of walkers exploring the state before or after completing the Geeves Track will accrue to the local region, 46% of economic value-added and 58% of the total employment.
Evidence42 shows that trails have been beneficial for businesses both through the absorption of excess tourism capacity and by spreading risk through the diversification of tourism products across a region. Tracks provide tourist operators with opportunities to deliver tourist services and packages and leverage opportunities for private investors to provide services such as tours and luggage transfers, food and accommodation, and the retail or local produce arts and crafts.
There are a range of small businesses in the Region that will benefit from stimulus created. For example, an additional $1.5 million worth of expenditure will flow to the Region’s restaurants and cafés, and $1.1 million to the Region’s accommodation providers. Table 17 provides a count of accommodation and food services businesses by their turnover range in the Region. Most of the Region’s accommodation and food businesses are very small, with a turnover of less than $500,000.
TABLE 17: COUNT OF BUSINESSES BY TURNOVER RANGE - ACCOMMODATION AND FOOD SERVICES (2016)
Area of Region Zero to $50k $50k to $100k
$100k to $200K
$200k to $500k
$500k to $2m
$2m or more
Cygnet 0 5 5 4 0 0
Geeveston - Dover 4 0 7 3 3 0
Huonville - Franklin 4 3 8 10 6 0
Total Region 8 8 20 17 9 0
Source: ABS 8165.0 Counts of Australian Businesses, including Entries and Exits, June 2016
As a rough exercise demonstrating the potential benefits for the accommodation and food businesses in the region, if we divide the direct visitor expenditure by the number of existing businesses, each businesses’ revenue could increase by up to $42,000. This is quite significant, particularly for businesses with a turnover of below $200,000..
Summary of Regional and Tasmanian Impacts
The investment in the Geeves Track and Southwest Tasmanian Wild Tourism Precinct will create economic benefits for Tasmania. Importantly, the proposal also generates significant benefits, both during construction and once operational, for the Huon Valley Region. As discussed earlier in this Report the Region needs investment to drive employment and support the growth of the tourism industry in the Region, which currently is less developed than most other regions in the State. The Region, given its proximity to Hobart and the potential of the existing offering, is poised to capture a greater share of Tasmania’s growing tourism industry if investment is provided to provide a critical mass of new visitors.
During the construction phase, in total, the proposal creates 169 jobs in Tasmania, with an estimated 51 being created in the Region, as shown in Table 18. Jobs will be created in terms of not only building the Track and Precinct, but also supplying materials and specialised services (planning, design, support etc); 43 of the jobs are direct with 126 being flow-on or indirect jobs.
42 Ministry of Business, Innovation and Employment, Nga Haerenga – The New Zealand Cycle Trail Evaluation Report

Geeves Track Preliminary Business Case 58
TABLE 18: TOTAL ECONOMIC IMPACTS - CONSTRUCTION PHASE
Source of Stimulus Huon Valley Region Tasmania (includes Huon Valley)
Construction
Output $50,400,000 $73,200,000
Value Added $12,000,000 $27,800,000
Employment 51 169
Once operational, the Track and Precinct will generate positive economic impacts for the Region and the State. Visitors attracted to walk the Track and stay at the Precinct will purchase goods and services during their stay. Visitors are assumed to not only spend time in the Region, but will also likely visit other parts of the State before or after the walk. Table 19 outlines the total impacts at the Regional and State level.
TABLE 19: TOTAL ECONOMIC IMPACTS - OPERATIONAL PHASE (PER ANNUM)
Source of Stimulus Huon Valley Region Tasmania (includes Huon Valley)
Construction
Output $20,200,000 $24,700,000
Value Added $7,000,000 $11,800,000
Employment (per annum) 97 128
The modelling shows that by attracting 6,400 new visitors (10,000 in total) per annum to Tasmania via the high-quality, world-class tourist product that is the Geeves Track, in tandem with the development of the Tourist Precinct to capture a greater share of visitor expenditure in the Region, a total of:
Output/income $24.7 million per annum, with 82% being captured in the Region Value added $11.8 million per annum, with 59% being captured in the Region Employment 128 FTE jobs per annum, 76% being in the Region
6.6 Other regional impacts Increased visitation in the Region due the Geeves Track will lead to increased visitation and existing government developed or owned attractions such as the Tahune Airwalk, Hartz Mountain National Park and Hastings Caves. These attractions will be promoted through the Precinct and would increase the return on investment for Government at the sites.
Within the area of the proposed developments there is a series of road infrastructure already in place. When a road is constructed benefits flow to the community via a range of benefits including access and travel time savings. The increased usage of the existing infrastructure therefore represents a more efficient and beneficial use of government investment. This is also relevant for the government tourism infrastructure in the region.
6.7 Limitations of EIA Though a cost-effective and widely used technique for economic impact analysis, I-O modelling has some limitations, as follows.
The model assumes relationships between industries are static over the forecast period. That is, productivity improvements are not factored in and historic relationships are assumed to hold;
The input output model derives relationships between industries using total production estimates. Consequently, the relationships are ‘average’, whereas the stimulus used as an input is ‘marginal’. Such an approach does not account for any ‘underutilised capacity’ at

Geeves Track Preliminary Business Case 59
the industry level or additional economies of scale that might ensue, as production expands from its existing base;
The model assumes that there are no supply constraints. A drawback is that the model does not take into account the ‘crowding out’ of other sectors. This is recognition of the fact that there are scarce resources in an economy. Especially in the case of large construction projects there may be impacts in terms of availability of labour.
A feasible alternative to using I-O modelling for economic impact assessments is to utilise partial or general equilibrium econometric models. Having said this, general equilibrium models require an annual stimulus of >$100 million before the impacts start to be measurable across the economy.

Geeves Track Preliminary Business Case 60
7. COST BENEFIT ANALYSIS
A Cost Benefit Analysis (CBA) assesses the merit of investing in a project, i.e. it assesses if is it worth doing when a broad societal perspective is taken. A CBA contrasts the project’s economic, social and environmental benefits with its costs, to establish if the benefits outweigh the costs. A range of differing scenarios are also tested to gauge the ‘sensitivity’ of the results to changes in inputs.
7.1 The CBA Analysis Under this framework, the merit of the proposed initiative to develop the Geeves Track and Tourism Precinct was evaluated on an incremental basis (i.e. the initiative’s outcomes are tested in comparison to the outcomes that would occur under a business as usual (BAU) scenario). Furthermore, real values have been used throughout the analysis. This means that dollar prices have not been escalated for inflation over time during the analysis period (20 years).
The CBA compares the financial costs of the proposal with the financial and wider social and economic benefits to the community. The CBA has been undertaken from a whole of Tasmania perspective, in two forms; the perspective of government investment only (excludes private investment) and a consideration of the project with both public and private costs included.
In line with convention, the CBAs has been undertaken on an ‘incremental’ basis. This measures the performance of a development of the Geeves Track and Precinct scenario against the BAU by subtracting costs and benefits that would have occurred regardless of the investment.
Two performance measures are subsequently generated:
Net Present Value (NPV), and Benefit Cost Ratio (BCR).
Details on how these measures are calculated and how they should be interpreted are summarised in Table 20.
TABLE 20 INTERPRETATION OF PERFORMANCE MEASURES
Performance measure Estimation method Decision rule
Net Present Value (NPV) A number generated by deducting the present values of the stream of costs from the present value of the stream of and benefits, with the present value of costs and benefits determined by using an appropriate discount rate.
Accept scenario if it has a positive NPV Reject scenario if it has a negative NPV, and The greater the NPV the better.
Benefit Cost Ratio (BCR) Ratio of discounted present day benefits over discounted present day costs.
Accept scenario if the BCR exceeds one Reject scenario if the BCR is less than one, and The greater the BCR the better.
Source: SGS Economics & Planning 2017
7.2 The Geeves Effect CBA

Geeves Track Preliminary Business Case 61
The CBA incorporates:
The financial cost to Government funding the construction Track The financial cost of operating and maintaining the Track The cost to the private sector of developing the Precinct The economic benefits (in the form of value-added) to the community as a result of the
increase in visitor spending in the State The health benefits that accrue to Tasmanian’s who walk the Geeves Track The utility benefits (enjoyment and leisure) that accrue to Tasmania’s who now have
access to an additional world-class walking Track
Quantified costs (assumptions)
Construction and development
Construction and developments costs total $17.351 million, as shown in Table 21, and were estimated in chapter 5 – proposal costing.
The accommodation along the track has been costed as high quality, architecturally designed huts with significant amenity (decks, cooking equipment, mattresses, and communal areas) similar to the Three Capes Track huts.
TABLE 21 DEVELOPMENT COSTS – HIGH-AMENITY OPTION
Description Estimated cost
Geeves Track $10,513,000
Two on-track accommodation nodes $6,839,000
Precinct investment $20,000,000
Total Development Cost $37,351,000
The capital needed for construction is considered a cost to society as the money and resources used have an opportunity cost in that they could have been applied elsewhere in the state.
An assumption on the timing of the construction works was made, with all construction works assumed to be completed by December 2021.
On-going maintenance and managements costs
Operational and maintenance costs were estimated in chapter 5 – proposal costing. They equate to $1.036 million per year.
Quantified benefits
There are a range of benefits that have been quantified as a result of increasing tourism expenditure in the region.
Track revenue
An important benefit of the track will be the revenue generated during the Track’s on-going operations. These funds could be reinvested into the State’s protected area network or other community infrastructure. Revenue is calculated as number of walkers multiplied by the price, estimated at $300 for the two night walk.
Revenue at 3CT - The investment in the TCT by the State Government has proven to be very fruitful with a very high return on investment43. Revenues received on the Track are set to reach $4.5 million in the 2017/18 financial year44. For the Geeves Track the benefit for
43 Information from consultation with Destination Southern Tasmania - Stuart Lennox 44 Groom, M (2017). Iconinc tracks hike up revenues. Press release from Minister for Envoronment and Parks

Geeves Track Preliminary Business Case 62
Tasmania from the Track revenue has been assumed to be $2.4 million per annum, which is $300 by the number of walkers, and not including revenue from Tasmanian’s walkers as this is considered a transfer with-in the Tasmanian economy.
Visitor spending benefits - Track
This benefit is the additional direct value added to the Regional economy as calculated in the economic impact assessment.
Alternate visitor scenarios are considered in section 0.
Visitor spending benefits - Precinct
This benefit is the additional direct value added to the Regional economy as calculated in the economic impact assessment.
An assumption has also made that spending at the Precinct will grow in-line with the State’s forecast tourism growth; I.e. the Precinct will receive a market share in-line with the rest of the State in terms of growth.
Alternate visitor scenarios are considered in section 0.
Health benefits
The value of health costs savings in future accruing to Tasmania, which can be linked to the physical activity levels of Track users.
Trail user benefits
The local community and users of the trail derive enjoyment by using the Trail and Precinct. By enabling improved access to the TWWHA, a wider cohort of the community will be able to experience the area.
Individuals value their leisure time, even if they are not paid for it. According to the Queensland Treasury half of an appropriate hourly wage rate is assumed to be a reasonable proxy for the value of leisure time; this approach is also used by the NSW Treasury. To calculate the value of leisure time ABS Census data was used to calculate average weekly earnings of paid workers in Tasmania ($1,017), which equates to an average hourly wage in the Tasmania of $26.77; dividing this by two we have a leisure value of $13.38 per hour. To calculate the annual value of the leisure time the value per hour is multiplied by number of hours on the Track and the accommodation nodes (excluding sleeping time).
Project performance
Over a 20-year evaluation period, the development of the Geeves Track and Tourism Precinct appears to be a satisfactory project from a community perspective, assuming that private investment will enable the development of the Precinct – Both the Net Present Value and Benefit Cost Ratio criteria are met met. The full analysis results are shown in Table 22 which outlines the present value (PV) of the costs and benefits quantified over a twenty-year period.

Geeves Track Preliminary Business Case 63
TABLE 22 CBA PERFORMANCE RESULTS (20 YEARS)
The Geeves Effect – High Amenity Option Summary Results
Costs 7% Discount Rate
PV Track construction and development costs $13,300,000
PV Track operation and maintenance costs $6,700,000
PV Precinct development costs $15,300,000
Total Costs $35,300,000
Benefits
PV Visitor spending benefits - Track $19,500,000
PV Visitor spending benefits - Precinct $15,300,000
PV Track operator revenue $14,600,000
PV Health benefits $800,000
PV Leisure benefits $5,200,000
Total Benefits $55,400,000
Benefit-Cost Ratio (BCR) 1.57
Net Present Value (NPV) $20,100,000
Source: SGS Economics and Planning 2017
Other benefits
There are a range of other benefits that will be experienced as a result of the Geeves Effect that have not been quantified in the analysis, but are important to note.
Due to the considerable list of unquantified benefits, it can be assumed the NPV of the project, and therefore the benefit to the community, lay even higher than the results shown in Table 22.
Environmental and heritage outcomes
Walking tracks present a unique opportunity for education. People of all ages can learn more about nature, culture or history along trails. They can give people a sense of place and an understanding of the enormity of past events and an understanding of what is at stake if the environment is not properly cared for.
Hiking and walking trails, and nature-based accommodation and tourism more broadly, play an important role in the environmental movement, as they can act as an active means for teaching people about the natural environments. They can also play a key role in securing lands for environmental conservation.
The increased awareness of immersion in nature leads to more respect for the environment, and a desire to protect it, across a wide range of cohorts.
Skills development
The development, by attracting greater tourist expenditure, will enable the expansion of the employment market in both depth and scope through the availability of a greater variety of occupations such as accommodation managers, chefs, waiters, retail workers, parks rangers,

Geeves Track Preliminary Business Case 64
tour operators. The economic impact assessment (section 6 of this report) revealed that the development will create 97 on-going full-time positions across a range of tourism related industries, and another 31 elsewhere in Tasmania. This is critically important for the Region in particular, for a variety of reasons, including reducing dependence on a few main industries and providing employment for young people to entice them to remain in the Region.
Marketing and promotion of the region
Marketing of the Track and Precinct would occur in the context of the Huon region more broadly. This would drive increased visitation to the region, beyond those visiting the Track and Precinct specifically. The Region overall could become more popular as result.
Improved business confidence and encouragement of private investment
It was quantified that there will be flow-on effects generated by the Track and Precinct. Another benefit of this is that the project will foster greater town vibrancy and attract a larger pool of customers to businesses. This will likely lead to increased business confidence and increased investment in the towns of the region including Huonville/Ranelagh, Franklin, Cygnet, Geeveston, Dover and Southport.
Population increase
The improved vibrancy and economic performance could lead to Region becoming an even more desirable place to live.
Scenario testing
A range of scenarios have been run to add robustness to the analysis, and to consider how changing the key assumptions will impact overall results. For this sensitivity analysis, eight key assumptions have been tested both under a pessimistic and optimist scenario, as shown in Table 23.
TABLE 23 SCENARIO TESTING – CHANGES TO KEY ASSUMPTIONS
Assumption As modelled Pessimistic scenario Optimistic scenario
Discount Rate 7% 10% 4%
Number of walkers 10,000 5,000 12,000
Precinct visitor nights (non-walkers) 14,332 7,166 20,159
Average length of stay in Tasmania 6 4 8
Percentage of visitors that are new 64% 50% 80%
Track development costs $17.35 million $26.03 million $13.01 million
Precinct development costs $20 million $30 million $10 million
Track operating and maintenance $1.036 million $2 million $500,000
The results of these scenario tests, i.e. the impact of changing the key assumption on the projects NPV and BCR, are shown in Table 24.
Out of the scenario tests performed, only a halving of the walker numbers (and subsequent drop in visitor nights demanded at the Precinct) results in negative NPV and a BCR less than one.

Geeves Track Preliminary Business Case 65
TABLE 24: SCENARIO TESTING – ONE ASSUMPTION
As
modelled Discount
rate Number of
walkers
Non-walker precinct nights
Ave. length of stay
% new visitors
Track dev. costs
Precinct dev. costs
Operating costs
Pessimistic $20.3
(1.57)
$9.5
(1.31)
-$6.6
(0.81)
$17.0
(1.48)
$8.5
(1.24)
$12.7
(1.36)
$13.5
(1.32)
$12.5
(1.29)
$13.8
(1.33)
Optimistic $20.3
(1.57)
$37.3
(1.9)
$33.4
(2.01)
$24.4
(1.69)
$29.9
(1.85)
$28.2
(1.80)
$23.5
(1.74)
$27.8
(2.01)
$23.6
(1.74)
Further to this, SGS ran a further round of scenario testing where two assumptions were changed to the pessimistic scenario to identify the key assumptions that could lead the project not being beneficial from a community perspective. Once again a halving of the visitor numbers appears to be the key variable in regards to the projects viability from a CBA perspective. With all the other variables, even with two changed to the pessimistic scenario concurrently, still result in the project having a positive NPV over twenty years and a BCR greater than one.
TABLE 25: SCENERIO TESTING TWO ASSUMPTIONS – PESSIMISTIC
Discount rate
(10%)
Number of walkers reduced
Non-walker precinct
nights halved
Ave. length of stay shorter
% new visitors lower
Track costs higher
Precinct costs higher
Operating costs higher
Discount rate (10%)
- -$9.7
(0.68)
$7.3
(1.24)
$1.1
(1.04)
$4.1
(1.13)
$3.6
(1.10)
$2.6
(1.07)
$5.0
(1.14)
Number of walkers reduced
-$9.7
(0.68) -
-$10.9
(0.69)
-$9.7
(0.73)
-$9.4
(0.73)
-$13.2
(0.68)
-$14.2
(0.67)
-$12.9
(0.69)
precinct visitor nights halved
$7.3
(1.24)
-$10.9
(0.69) -
$5.4
(1.15)
$10.3
(1.29)
$10.4
(1.25)
$9.4
(1.22)
$10.7
(1.26)
Ave. length of stay shorter
$1.1
(1.04)
-$9.7
(0.73)
$5.4
(1.15) -
$6.0
(1.17)
$1.9
(1.05)
$0.9
(1.02)
$2.2
(1.05)
% new visitors lower
$4.1
(1.13)
-$9.4
(0.73)
$10.3
(1.29)
$6.0
(1.17) -
$6.1
(1.15)
$5.1
(1.12)
$6.4
(1.15)
Track dev. costs higher
$3.6
(1.10)
-$13.2
(0.68)
$10.4
(1.25)
$1.9
(1.05)
$6.1
(1.15) -
$5.9
(1.12)
$7.2
(1.15)
Precinct costs higher
$2.6
(1.07)
-$14.2
(0.67)
$9.4
(1.22)
$0.9
(1.02)
$5.1
(1.12)
$5.9
(1.12) -
$6.2
(1.13)
Operating costs higher
$5.0
(1.14)
-$12.9
(0.69)
$10.7
(1.26)
$2.2
(1.05)
$6.4
(1.15)
$7.2
(1.15)
$6.2
(1.13)
-
7.3 The Geeves Effect CBA – Government (public) cost perspective The CBA, from a Government perspective incorporates the same benefits and costs of the previous CBA, however the private sector costs are removed. This CBA is an analysis of the proposal, from a purely Government cost perspective, and assumes the development of the Track leads to the private sector developing the precinct with no additional funding needed from the State Government.
TABLE 26: QUANTIFIED PUBLIC COSTS
Description Estimated cost
Geeves Track $10,513,000
Two on-track accommodation nodes $6,839,000
Total Government funding cost $17,351,000
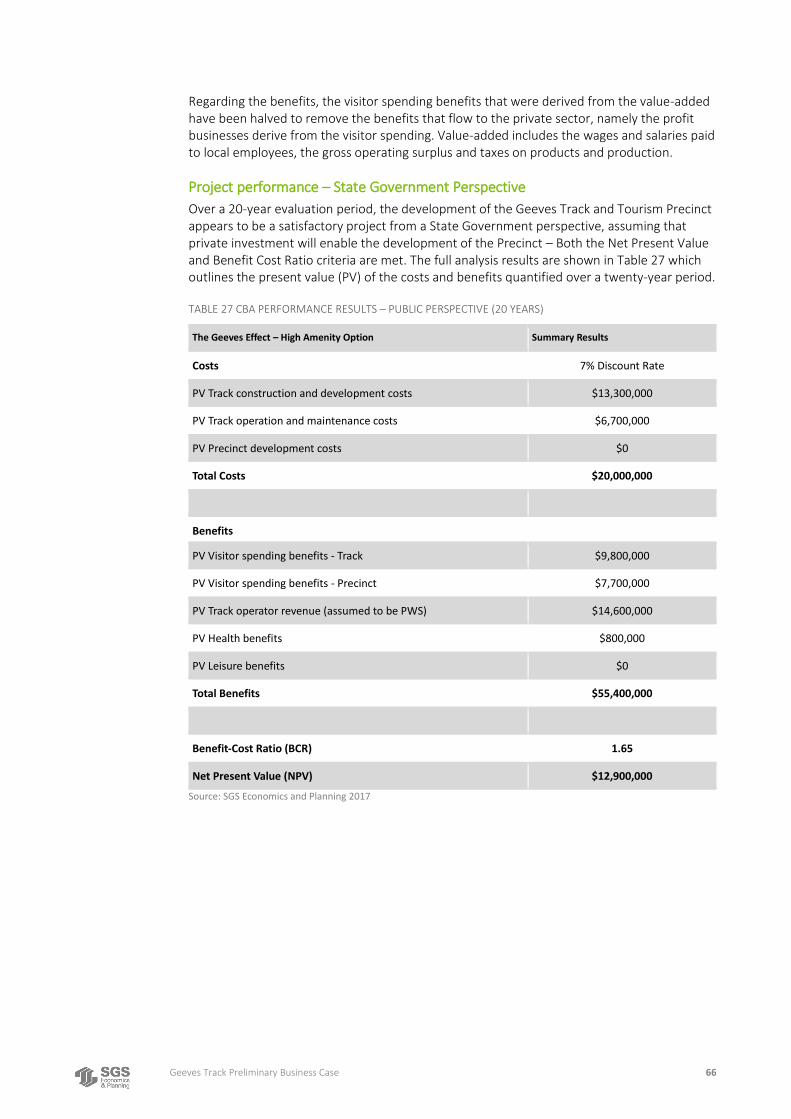
Geeves Track Preliminary Business Case 66
Regarding the benefits, the visitor spending benefits that were derived from the value-added have been halved to remove the benefits that flow to the private sector, namely the profit businesses derive from the visitor spending. Value-added includes the wages and salaries paid to local employees, the gross operating surplus and taxes on products and production.
Project performance – State Government Perspective
Over a 20-year evaluation period, the development of the Geeves Track and Tourism Precinct appears to be a satisfactory project from a State Government perspective, assuming that private investment will enable the development of the Precinct – Both the Net Present Value and Benefit Cost Ratio criteria are met. The full analysis results are shown in Table 27 which outlines the present value (PV) of the costs and benefits quantified over a twenty-year period.
TABLE 27 CBA PERFORMANCE RESULTS – PUBLIC PERSPECTIVE (20 YEARS)
The Geeves Effect – High Amenity Option Summary Results
Costs 7% Discount Rate
PV Track construction and development costs $13,300,000
PV Track operation and maintenance costs $6,700,000
PV Precinct development costs $0
Total Costs $20,000,000
Benefits
PV Visitor spending benefits - Track $9,800,000
PV Visitor spending benefits - Precinct $7,700,000
PV Track operator revenue (assumed to be PWS) $14,600,000
PV Health benefits $800,000
PV Leisure benefits $0
Total Benefits $55,400,000
Benefit-Cost Ratio (BCR) 1.65
Net Present Value (NPV) $12,900,000
Source: SGS Economics and Planning 2017

Geeves Track Preliminary Business Case 67
8. RISK ANALYSIS
It is important to identify relevant risks so appropriate mitigation and management strategies can be put in place. There are two categories of risks that have been identified and assessed as part of this project:
Risks in not proceeding with the project. Risks in delivering the project
The risks associated with not proceeding with the project primarily relate to Government policy objectives and social outcomes.
The risks which may occur across the course of the project have been analysed by Project Phase: Establishment, Permit/ approvals, Design, Construction and Operation.
Risks in not proceeding
The key risks in not delivering the project are as follows.
Missed opportunity to improve economic opportunities for the local community. As outlined, the economy of Tasmania and Huonville have undergone significant transformation associated with the decline of the forestry industry. This has resulted in a reduction in the economic opportunities available in the Huonville area, and this has a range of flow on impacts including reduced local income and socio economic status. This project presents an opportunity to address some of these issues; not proceeding with the project would mean these opportunities are not realised.
More restricted access to environmental and natural assets. The project provides an opportunity for more people to see and experience a beautiful natural environment; without the project these areas would remain difficult to access and fewer people would enjoy the benefits of the asset.
Limited capacity to leverage existing government investments. The project is proposed in an area in which government has already invested in various forms of infrastructure, including the Tahune Airwalk and road infrastructure, in particular. This investment is not fully utilised and bringing additional visitation to the region would enable a greater use of these sunk costs.
Missed opportunity in not meet Government Policy objectives. Economic growth and job creation are identified as the Hodgman Liberal Government’s ‘greatest priorities’.

Geeves Track Preliminary Business Case 68
Risks in delivering the project
At this stage of the project, major risks in delivering the project have been identified and potential mitigation and management strategies put in place. During any detailed business case stage, this risk management framework will need to be expanded and further developed.
The following framework has been used to identify, classify and manage the risks that may arise in delivering the project. It comprises a consequence scale (1-3), and likelihood scale (1-4).
This risk assessment should inform the next steps and planning for the next stage of the project.
TABLE 28 RISK SCORING MATRIX
Consequence
Insignificant Moderate Catastrophic
C4 C3 C1
Like
liho
od
Almost Certain L4
Likely L3
Unlikely L2
Almost Unprecedented L1
Key to Risk Exposure: Severe Moderate Low

Geeves Track Preliminary Business Case 69
TABLE 29: RISK ANALYSIS

Geeves Track Preliminary Business Case 70
Phase Risk Likelihood Consequence Exposure Management/ Mitigation
Establishment No or limited support from local community Unlikely Moderate Moderate Continue to engage with community, outlining potential benefits and opportunities of project
Funding for more detailed feasibility study not secured, or not secured within necessary timeframe
Unlikely Catastrophic Moderate Continue to engage with key stakeholders, outlining potential benefits and opportunities of project Clearly articulate quantum of additional funding required, and tasks to be undertaken
Supporting infrastructure– water, roads, sewage etc. not provided
Unlikely Catastrophic Moderate Engage with service providers and local government at appropriate points in project Ensure State government aware of scope of infrastructure requirements
Organisational support from Parks and Wildlife doesn’t occur
Likely Catastrophic Severe Continue to engage with landowners and other stakeholders, outlining potential benefits and opportunities of project Work with landowners to address specific concerns
Market sounding reveals limited support/ appetite for concept
Unlikely Catastrophic Moderate Take conservative approach to demand forecasting in future work and include sensitivity testing Engage with private sector early and consider and address concerns
Similar alternative tourism development occurs nearby
Almost Unprecedented Catastrophic Moderate Engage with government to potential benefits and opportunities of project Secure funding for further work promptly
Other tracks expand resulting in less demand for Geeves track
Almost Unprecedented Moderate Low Engage with government to potential benefits and opportunities of project Secure funding for further work promptly
Permit/ Planning
Changes to World Heritage Management Plan not supported
Likely Catastrophic Severe Engage with government to potential benefits and opportunities of project Develop appropriate plans to ensure environmental impacts documented and managed
Support and approvals from Local Government/ State take longer than planned
Likely Moderate Moderate Engage with government to potential benefits and opportunities of project Ensure appropriate material supports application/ submission
Only some elements approved (eg only precinct) resulting in only part of project delivered
Likely? Catastrophic Severe Engage with government to potential benefits and opportunities of project
Time taken to gain approval more costly than envisaged
Likely Moderate Moderate Engage with government to potential benefits and opportunities of project Ensure appropriate material supports application/ submission
Design Need to re-route existing track due to terrain constraints resulting in increased costs.
Unlikely Moderate Moderate Take conservative approach to cost estimates in future work and include sensitivity testing Undertake more detailed costing promptly

Geeves Track Preliminary Business Case 71
Environmental constraints mean amendments to track or concept resulting in decreased amenity
Unlikely Moderate Moderate Undertake more detailed design work promptly
Construction Track construction takes longer than envisaged resulting in additional costs
Likely Moderate Moderate Take conservative approach to cost estimates in future work and include sensitivity testing
Track more expensive than envisaged Likely Catastrophic Severe Take conservative approach to cost estimates in future work and include sensitivity testing
Contracts and tender process for track construction not designed in a way which appeals to market and hence limited competitive responses
Unlikely Catastrophic Moderate Ensure market sounding is undertaken and informs scope of tender documentation
Unforeseen damage to environment or cultural heritage occurs in construction phase
Unlikely Catastrophic Moderate Develop appropriate plans to ensure environmental impacts documented and managed Include cost provision for mitigating unforeseen impacts
Operation Marketing partnerships aren’t coordinated to get message out results in limited demand
Likely Catastrophic Severe Ensure stakeholders are aware of potential benefits and opportunities of project Support tourism boards and others involved in developing marketing campaign to develop marketing information
Don’t attract private investment to deliver broad concept/ additional activities results in limited tourism offer
Likely Catastrophic Severe Ensure market sounding is undertaken and informs scope of project Ensure tender documentation is attractive to private sector
Investors have limited economic relationships with local economy and don’t flow through to local people.
Unlikely Catastrophic Moderate Ensure tender documentation is attractive to private sector Consider including local supplier component to tender
Substitutes existing visitation, rather than generating additional visitation to Tasmania
Unlikely Moderate Moderate Ensure marketing campaign extends broadly and ‘offer’ is clearly differentiated
Estimates of future visitation patterns don’t materialise: Out and back nature of track not as popular Climate impacts attractiveness of track Views of peak not consistently available
Unlikely Catastrophic Moderate Ensure planning and design of track allows for optimal viewing locations Ensure huts are comfortable in a range of weather conditions
Weather causes more damage resulting in higher maintenance costs
Likely Catastrophic Severe Ensure funding application includes adequate provision made for impact of severe weather conditions
Not adequate maintenance of track because of funding resulting in safety issues and potential closure
Unlikely Catastrophic Moderate Ensure funding application includes adequate provision made for track maintenance
Operation of existing landowners (eg Sustainable Timbers) limits amenity at tourism precinct
Unlikely Catastrophic Moderate Engage with landowners and surrounding land owners to ensure understanding of project requirements and benefits
Operating costs – eg gas to huts, waste disposal, costs are greater than estimated
Likely Catastrophic Severe Ensure funding application includes adequate provision for operating cost Consider review of track fees following establishment of track and walk, to cover additional costs.

Geeves Track Preliminary Business Case 72
9. FINDINGS
9.1 Summary The economy in the region has been heavily impacted by structural economic change.
It has an ageing population, high unemployment, and faces a number of challenges in terms of its economic future.
Tasmania has an established profile as a destination for camping and hiking.
Iconic destinations including the 3 Capes Trail and Cradle Mountain have attracted high levels of visitation. Tasmania’s visitor market is growing, playing an increasing role in the State’s economy.
Case studies have shown that well planned and targeted hiking and hut based walking infrastructure can deliver a range of benefits.
Those using trails spend money in a region, and often travel to other parts of the State. This results in economic benefits across the State. In many cases, trail projects have been more successful than planned, indicating there is significant demand for these activities in Tasmania.
The Geeves Track is currently in poor condition
The 17.5km track is particularly difficult to navigate and there is no accommodation on trail. This means it is only available to experienced walkers and hikers who are able to hike fully supported over several days.
There are several other tourist attractions in the region.
The Tahune Airwalk, Hastings Caves and Great Southern Forest are all located in the region, and attract visitors from Hobart and there are opportunities to leverage these assets. There are also numerous fresh produce and agri-tourism destinations in the region. There are however, limited accommodation options in the region, meaning that visits are often limited to day trips from Hobart.
Upgrading the Track, and developing a Tourism Precinct could deliver benefits to the region.
Investment in the Track and Precinct would result in increased economic activity in the region and State, including additional employment opportunities and demand for locally produced goods and services. Analysis shows that for every dollar invested, $1.57 would be returned to the local economy.
The environment asset is currently not accessible to a wide range of visitors
The development of the track and precinct would provide access to an environmentally significant area to broader range of visitors.
There are a range of risks and issues to consider in developing the project
In particular, the challenging environment, support of stakeholders and approvals process represent risks during the project delivery. The documentation and management of these risks should inform the next stages of the project.
There are also significant risks in not proceeding with the project
The project represents an opportunity to address some of the key socio economic and community issues present in the Huonville area. Not proceeding with the project would mean not realising these benefits, and subsequently the challenges would remain.

Geeves Track Preliminary Business Case 73
9.2 Further work This report has outlined that the project would deliver benefits to the local and broader Tasmanian community and economy. On this basis, the following next steps are recommended:
Further engagement with stakeholders to gain support for project Market sounding: engage with the private sector to understand parameters for successful
attraction of investment. This is likely to cover: Length and security of land tenure Land rents (license fees) Exclusive development rights (competition levels) Local access and supply capabilities Precinct governance and monitoring arrangements Public commitment to marketing and promotions
Engage with State government land owners to identify expectations regarding Approvals processes Financial return hurdles Risk sharing expectations Procurement processes Precinct governance expectations
This will enable clearer project parameters to be established.
Seek funding for detailed design and full business case

Geeves Track Preliminary Business Case 74
APPENDIX
EIA assumptions
Economic stimuli Regional Impacts Tasmanian Impacts*
Capital construction costs of Track and on-track visitor nodes
As estimated in Chapter 5. Assumes 75% of materials and labour sourced from with-in the Region.
As estimated in Chapter 5. Assumes 93% of materials and labour sourced from with-in Tasmania45
Capital construction costs of Tourism Precinct As estimated in Chapter 5. Assumes 75% of materials and labour sourced from with-in Region.
As estimated in Chapter 5. Assumes 93% of materials and labour sourced from with-in Tasmania
Operation and management costs of the Track As estimated in Chapter 5. Assumes 75% of labour and materials sourced from Region.
As estimated in Chapter 5. Assumes 100% of labour and materials sourced from State.
Visitor expenditure by walkers on accommodation
One night of accommodation in the Region (non-precinct) before or after walking the Track (overseas/international visitors only; 80% of demand). Assumes every walker would have otherwise not visited the Region if not for the Track. Assumes 42% of daily budget ($135) spent on accommodation (estimated using TVS).
Three nights’ accommodation in the State before or after walking the Track (overseas/international visitors only; 80% of demand).
Assumes that for 20% of overseas/international walkers the Track was not an influence on them coming to Tasmania - this visitor spending is excluded. Assumes 42% of daily budget ($135) spent on accommodation (estimated using TVS)
Visitor expenditure by walkers on food and beverages
Assumes three days in the Region (excluding Precinct). 20% of daily budget ($65) spent on Food and Beverages (estimated using TVS).
Assumes five days in the State (excluding one night at Precinct). 20% of daily budget ($65) spent on Food and Beverages (estimated using TVS).
Visitor expenditure by walkers on retail goods Assumes three days in the Region (excluding Precinct). 10% of daily budget ($32) spent on Retail (estimated using TVS).
Assumes five days in the State (excluding Precinct). 10% of daily budget ($32) spent on Retail (estimated using TVS).
Visitor expenditure by walkers on transport whilst in the State
Assumes three days in the Region (excluding Precinct). 9% of daily budget ($29) spent on Transport, excludes money spent on airfares (estimated using TVS).
Assumes three days in the State (excluding Precinct). 9% of daily budget ($29) spent on Transport, excludes money spent on airfares (estimated using TVS).
Visitor expenditure by walkers on attractions and other activities
Assumes three days in the Region (excluding Precinct). 10% of daily budget ($32) spent on attractions and other activities, excludes money spent walking fees (estimated using TVS).
Assumes five days in the State (excluding Precinct). 10% of daily budget ($32) spent on attractions and other activities, excludes money spent walking fees (estimated using TVS).
Visitor expenditure on accommodation at the Precinct
Assumes that there will be an additional 24,322 visitor nights at the Precinct derived from walkers, existing visitors to the Region, and new demand. Around a third of the visitor nights have been assumed to be housed in high-end accommodation at the Precinct at an estimated $300 per night; whilst the other third housed in mid-range accommodation at an estimated $100 dollars a night.
All direct expenditure assumed to be with-in the Region, so Tasmanian direct impacts the same as regional, with some additional flow-on impacts.
Visitor expenditure on food and beverages at the Precinct
Assumes the overnight visitors, plus 20,032 day visitors, spend 20% of their daily budget on food and beverages at the Precinct, equating to $65 for high-end visitors, $43 for mid-range visitors and $32 for day trippers.
All direct expenditure assumed to be with-in the Region, so Tasmanian direct impacts the same as regional, with some additional flow-on impacts.
45 The 3CT sourced 93% of labour and materials from with-in Tasmania

Geeves Track Preliminary Business Case 75
Visitor expenditure on activities and transport at/departing from the Precinct
Assumes the overnight visitors, plus 20,032 day visitors, spend 19% of their daily budget on transport and activities at or departing from the Precinct, equating to $61 for high-end visitors, $41 for mid-range visitors and $31 for day trippers.
All direct expenditure assumed to be with-in the Region, so Tasmanian direct impacts the same as regional, with some additional flow-on impacts.
Visitor expenditure on retail (local produce and art) at the Precinct
Assumes the overnight visitors, plus 20,032 day visitors, spend 10% of their daily budget on transport and activities at or departing from the Precinct, equating to $32 for high-end visitors, $22 for mid-range visitors and $16 for day trippers.
All direct expenditure assumed to be with-in the Region, so Tasmanian direct impacts the same as regional, with some additional flow-on impacts.

Contact us
CANBERRA Level 2, 28-36 Ainslie Place Canberra ACT 2601 +61 2 6257 4525 [email protected]
HOBART PO Box 123 Franklin TAS 7113 +61 421 372 940 [email protected]
MELBOURNE Level 14, 222 Exhibition St Melbourne VIC 3000 +61 3 8616 0331 [email protected]
SYDNEY 209/50 Holt St Surry Hills NSW 2010 +61 2 8307 0121 [email protected]
PARRAMATTA Level 7, 91 Phillip Street Parramatta NSW 2150 +61 2 8307 0121 [email protected]