
GeDEA-II: A Simplex Crossover Based Evolutionary … · GeDEA-II: A Simplex Crossover Based...
13
GeDEA-II: A Simplex Crossover Based Evolutionary Algorithm Including the Genetic Diversity as Objective Claudio Comis Da Ronco and Ernesto Benini Abstract—The key issue for an efficient and reliable multi- objective evolutionary algorithm is the ability to converge to the True Pareto Front with the least number of objective function evaluations, while covering it as much as possible. To this purpose, in a previous paper performance comparisons showed that the Genetic Diversity Evolutionary Algorithm (GeDEA) was at the same level of the best state-of-the-art MOEAs due to it intrinsic ability to properly conjugate exploitation of current non-dominated solutions and the exploration of the search space. In this paper, an improved version, namely the GeDEA- II, is proposed which features a novel crossover operator, the Simplex-Crossover, and a novel mutation operator, the Shrink- Mutation. GeDEM operator was left unchanged and completed using the non-dominated-sorting based on crowding distance. The comparison among GeDEA-II and GeDEA, as well as with three other modern elitist methods, on different extremely multidimensional test problems, clearly indicates that the per- formance of GeDEA-II is, at least in these cases, superior. In addition, authors aimed at putting in evidence the very good performance of GeDEA-II even in extremely multidimensional landscapes. To do this, four test problems were considered, and the GeDEA-II performance tested as the number of decision variables was increased. In particular, ZDT test functions featured a number of decision variables ranging from the original proposed number up to 1000, whereas on DTLZ the decision variables were increased up to 100 times the original proposed number. Results obtained contribute to demonstrate further the GeDEA-II breakthrough performance. Index Terms—Evolutionary algorithms, Simplex Crossover, Shrink Mutation, Pareto optimality, multi objective optimiza- tion, Empirical - Comparison. I. I NTRODUCTION In the past, several of MOEAs were proposed, e.g., Multi Objective Genetic Algorithm (MOGA) [1], Niched Pareto Genetic Algorithm (NPGA) [2] and Non-dominated Sorting Genetic Algorithm (NSGA) [3], which demonstrated the capability of evolutionary multi-objective optimization (EMO) algorithms to approximate the set of optimal trade- offs in a single optimization run. These approaches did not incorporate elitism explicitly, but a few years later the importance of this concept in multi-objective search was recognized and supported experimentally [4]. A couple of elitist MOEAs, which soon became state-of-the-art, were Strength Pareto Evolutionary Algorithm (SPEA) [5], [6] and Pareto Archived Evolution Strategy (PAES) [7]. SPEA, an acronym for Strength Pareto Evolutionary Algorithm, was C. Comis Da Ronco is with HIT09 S.r.l, Galleria Storione 8, 35131 Padova, ITALY e-mail: [email protected] Ernesto Benini is with the Department of Industrial Engineering, University of Padova, Via Venezia 1, 35131, Padova, ITALY e-mail: [email protected] among the first techniques that were extensively compared to several existing evolution-based methods [6], [4]. Later on, further progress has been made and the new proposed methods, featuring different diversity preservation mecha- nisms, for instance NSGA-II [8], PESA [9] and SPEA2 [10] were shown to outperform SPEA and NSGA on certain test problems. GeDEA [11] algorithm, strictly designed around the genetic diversity preservation mechanism called GeDEM, proved to be able to compete and, in some cases, to outper- form, the aforementioned EAs as far as speed of convergence and covering uniformity of the Pareto Front are concerned. In fact, the common drawback of all of the previously mentioned MOEAs is the huge amount of objective function evaluations (or number of generations) required to reach and sufficiently cover the Pareto Front. To try to overcome this common weakness, during the last decade several authors started hybridizing evolutionary algorithms (EAs) with local search (LS) operators, giving rise to the so-called Memetic Algorithms (MAs), (see [12] for a review, [13] for a collection of recent algorithmic and theoretical work, and [14] for a comprehensive bibliography). In [15], authors proposed a hybridized version of NSGA- II, coupled with a classical Sequential Quadratic Program- ming (SQP) procedure to achieve better performance. As clearly claimed by the authors in [16], “the main drawback of this approach is that SQP requires calculating the function gradient and the optimum step length at every iteration, an operation that can be costly for a practical engineering problem”. A valid alternative to the time-consuming calcu- lation of gradient information is constituted by the direct local search method. Among the direct search methods, the Simplex method proposed for the first time by the authors in [17] and subsequently improved by the authors in [18], is one of the most popular methods due to its simplicity and ease of encoding. In [19], the authors worked out an hybrid method, called continuous hybrid algorithm, performing the exploration with a Genetic Algorithm (GA), and the exploitation with a Nelder-Mead Simplex algorithm. In [20], the authors integrated Nelder-Mead simplex search method [18] with genetic algorithm in order to combine the local search capabilities of the former, and the exploratory behavior of the latter. Moreover, several works were presented, with the purpose to extend these concepts to multi-objective problems. Authors in Recently, in [21] an hybrid Simplex MOEA has been proposed, which uses three subsets to evolve simultaneously. The first two subsets are constituted by individuals calculated Engineering Letters, 21:1, EL_21_1_04 (Advance online publication: 9 February 2013) ______________________________________________________________________________________
Transcript of GeDEA-II: A Simplex Crossover Based Evolutionary … · GeDEA-II: A Simplex Crossover Based...

GeDEA-II: A Simplex Crossover BasedEvolutionary Algorithm Including the Genetic
Diversity as ObjectiveClaudio Comis Da Ronco and Ernesto Benini
Abstract—The key issue for an efficient and reliable multi-objective evolutionary algorithm is the ability to converge to theTrue Pareto Front with the least number of objective functionevaluations, while covering it as much as possible. To thispurpose, in a previous paper performance comparisons showedthat the Genetic Diversity Evolutionary Algorithm (GeDEA)was at the same level of the best state-of-the-art MOEAs due toit intrinsic ability to properly conjugate exploitation of currentnon-dominated solutions and the exploration of the searchspace. In this paper, an improved version, namely the GeDEA-II, is proposed which features a novel crossover operator, theSimplex-Crossover, and a novel mutation operator, the Shrink-Mutation.
GeDEM operator was left unchanged and completed usingthe non-dominated-sorting based on crowding distance. Thecomparison among GeDEA-II and GeDEA, as well as withthree other modern elitist methods, on different extremelymultidimensional test problems, clearly indicates that the per-formance of GeDEA-II is, at least in these cases, superior. Inaddition, authors aimed at putting in evidence the very goodperformance of GeDEA-II even in extremely multidimensionallandscapes. To do this, four test problems were considered, andthe GeDEA-II performance tested as the number of decisionvariables was increased. In particular, ZDT test functionsfeatured a number of decision variables ranging from theoriginal proposed number up to 1000, whereas on DTLZ thedecision variables were increased up to 100 times the originalproposed number. Results obtained contribute to demonstratefurther the GeDEA-II breakthrough performance.
Index Terms—Evolutionary algorithms, Simplex Crossover,Shrink Mutation, Pareto optimality, multi objective optimiza-tion, Empirical - Comparison.
I. INTRODUCTION
In the past, several of MOEAs were proposed, e.g.,Multi Objective Genetic Algorithm (MOGA) [1], NichedPareto Genetic Algorithm (NPGA) [2] and Non-dominatedSorting Genetic Algorithm (NSGA) [3], which demonstratedthe capability of evolutionary multi-objective optimization(EMO) algorithms to approximate the set of optimal trade-offs in a single optimization run. These approaches didnot incorporate elitism explicitly, but a few years later theimportance of this concept in multi-objective search wasrecognized and supported experimentally [4]. A couple ofelitist MOEAs, which soon became state-of-the-art, wereStrength Pareto Evolutionary Algorithm (SPEA) [5], [6] andPareto Archived Evolution Strategy (PAES) [7]. SPEA, anacronym for Strength Pareto Evolutionary Algorithm, was
C. Comis Da Ronco is with HIT09 S.r.l, Galleria Storione 8, 35131Padova, ITALY e-mail: [email protected]
Ernesto Benini is with the Department of Industrial Engineering,University of Padova, Via Venezia 1, 35131, Padova, ITALY e-mail:[email protected]
among the first techniques that were extensively comparedto several existing evolution-based methods [6], [4]. Lateron, further progress has been made and the new proposedmethods, featuring different diversity preservation mecha-nisms, for instance NSGA-II [8], PESA [9] and SPEA2 [10]were shown to outperform SPEA and NSGA on certain testproblems. GeDEA [11] algorithm, strictly designed aroundthe genetic diversity preservation mechanism called GeDEM,proved to be able to compete and, in some cases, to outper-form, the aforementioned EAs as far as speed of convergenceand covering uniformity of the Pareto Front are concerned.In fact, the common drawback of all of the previouslymentioned MOEAs is the huge amount of objective functionevaluations (or number of generations) required to reach andsufficiently cover the Pareto Front.
To try to overcome this common weakness, during thelast decade several authors started hybridizing evolutionaryalgorithms (EAs) with local search (LS) operators, givingrise to the so-called Memetic Algorithms (MAs), (see [12]for a review, [13] for a collection of recent algorithmic andtheoretical work, and [14] for a comprehensive bibliography).
In [15], authors proposed a hybridized version of NSGA-II, coupled with a classical Sequential Quadratic Program-ming (SQP) procedure to achieve better performance. Asclearly claimed by the authors in [16], “the main drawbackof this approach is that SQP requires calculating the functiongradient and the optimum step length at every iteration,an operation that can be costly for a practical engineeringproblem”. A valid alternative to the time-consuming calcu-lation of gradient information is constituted by the directlocal search method. Among the direct search methods, theSimplex method proposed for the first time by the authorsin [17] and subsequently improved by the authors in [18], isone of the most popular methods due to its simplicity andease of encoding.
In [19], the authors worked out an hybrid method, calledcontinuous hybrid algorithm, performing the exploration witha Genetic Algorithm (GA), and the exploitation with aNelder-Mead Simplex algorithm.
In [20], the authors integrated Nelder-Mead simplex searchmethod [18] with genetic algorithm in order to combine thelocal search capabilities of the former, and the exploratorybehavior of the latter.
Moreover, several works were presented, with the purposeto extend these concepts to multi-objective problems.
Authors inRecently, in [21] an hybrid Simplex MOEA has been
proposed, which uses three subsets to evolve simultaneously.The first two subsets are constituted by individuals calculated
Engineering Letters, 21:1, EL_21_1_04
(Advance online publication: 9 February 2013)
______________________________________________________________________________________

via simplex-based local search method to achieve faster con-vergence and better diversity, whereas the third one gatherstogether individuals generated by means of ordinary geneticoperators to avoid premature convergence.
In [16], authors proposed their version of hybrid MOEA,which starts with a randomly generated population witha user-defined size. Using this initial population, a fewgenerations of NSGA-II are carried on. The local searchis activated only after all the individuals of the currentpopulation are located at the first non-domination front.When activated, the local search operates only on a subset ofthe current population. The selected solutions in the currentpopulation are then replaced by the improved solutions foundby the local search, creating a locally improved population.The locally improved population is used then as an initialpopulation for the next few generations by NSGA-II. Onceagain, the individuals created by means of the local searchand those ones created with the variation operators of theMOGA are created at two different moments, and mergedtogether into the final population.
In spite of the different frameworks, in all the previouslymentioned works, the local search, based on the Simplexalgorithm, and the global exploration based on the EA, areperformed separately, in a sequential manner, that is, a pointof the search space is calculated via either the first or thelatter.
In the authors’ opinion, the previously mentioned exam-ples of hybridization with local search often degrade theglobal search ability of MOEAs. Moreover, local searchbased on the Nelder and Mead requires additional and severalfunctions evaluations.
In this paper, GeDEA-II is presented, aiming at reducingthe potential weaknesses of its predecessor and competitors,while retaining its superior performance, that is, a goodbalance between exploration and exploitation. In this work,a different approach is proposed to combine the EA-basedglobal search and the Simplex theory, since global explo-ration and local search are intimately related and performedsimultaneously, in such a way they take advantage from eachother. In details, the individuals created by the proposedalgorithm via the Simplex-based crossover, undergo mutationin a subsequently step, so as to promote global search capa-bilities of the algorithm. Moreover, important modificationshave been brought about to the original Simplex theory, inorder to enhance further the local search capabilities withoutpenalizing the exploration of the search space.
The main differences of GeDEA-II in comparison withGeDEA regard its new Tournament-Selection operator,its new Simplex-Crossover operator, and its new Shrink-Mutation operator. The diversity preserving mechanism, theGenetic Diversity Evaluation Method (GeDEM) already usedin the GeDEA release, was retained in GeDEA-II and leftunchanged due to its superior performance.
The paper is structured as follows. Section II presents abrief description of the main characteristics of the competi-tors MOEAs. In Section III, the main characteristics of theGeDEA are presented to prepare the ground for the GeDEA-II, whose framework is introduced and described in detail inSection IV. Finally, in Section V a systematic comparisonbetween GeDEA-II and other state-of-the-art MOEAs ispresented, following the guidelines proposed in [4], and then
we describe our experimental results.
II. MULTIOBJECTIVE EVOLUTIONARY ALGORITHMS ANDTHE PROBLEM OF DIVERSITY PRESERVATION
Nowadays, two features are demanded of an efficient androbust MOEA, which are:
1) To perform the optimization reducing at a minimum theoverall optimization time;
2) To perform multiple runs while achieving the sameresults.
The first feature is important when considering a MOEAactual application to a real-world engineering problem, whereoverall computational time is significant. The second featureis referred to as repeatability, and it is important in orderto judge the efficiency of the EA under investigation. Asdiscussed in Section V-D, GeDEA-II proves to have boththese characteristics.
In the following, the authors briefly analyze the consti-tutive framework of the respective MOEAs, along with thestrategies implemented to promote diversity. For comprehen-sive overviews of evolutionary approaches to multi-objectiveoptimization the reader is referred to the following morespecific studies [22], [23].
Many EAs for multi-objective optimization have beenproposed [4], [22], [9]. Probably, the most popular MOEAstoday are the Strength Pareto Evolutionary Algorithm 2(SPEA2) [10] and the Non-dominated Sorting GeneticAlgorithm-II [8], which have been used for comparison inthe Experimental results Section. As clearly stated in [24],the two algorithms similarly maintain a separate populationof size N (current population, or offspring population) and afixed-capacity archive (previous population, or parent popula-tion), often (as in NSGA-II) also dimensioned N. In each gen-eration, the current and the previous populations are mergedtogether, and undergo the process of elite preservation. Thepopulation constituting the new generation is filled by takingthe best-ranked solutions from the merged list. Rank conflictsare resolved via a diversity metric. Individuals are alsosubject to tournament selection, crossover, and mutationto form the population for the next generation. The maindifference between the two is the way elite preservation isapplied. NSGA-II invokes a procedure called non-dominatedsorting. Non-dominated sorting assigns domination ranks toeach individual solution in a population, in such a mannerthat solutions are assigned lower ranks than the ones theydominate. The non-dominated sorting procedure incorporatesa diversity preservation mechanism, introduced in SectionIV-C, which estimates the density of solutions in the ob-jective space, and the crowded comparison operator, whichguides the selection process towards a uniformly spreadPareto frontier.
SPEA2 on the other hand, as clearly stated in [5], incorpo-rates a fine-grained fitness assignment strategy which takesinto account for each individual the number of individualsthat dominate it and the number of individuals by which itis dominated. It then uses a nearest neighbor density esti-mation technique which guides the search more efficiently,and finally performs an enhanced archive truncation thatguarantees the preservation of boundary solutions.
Engineering Letters, 21:1, EL_21_1_04
(Advance online publication: 9 February 2013)
______________________________________________________________________________________
Another interesting multi-objective evolutionary algorithmis the Indicator-Based Evolutionary Algorithm (IBEA), pro-posed in [25]. It is a MOEA that calculates fitness valuesby comparing individuals on the basis of a quality indicator.Thereby, no particular diversity preservation techniques suchas fitness sharing, clustering, etc. is necessary.
III. GENETIC DIVERSITY EVOLUTIONARY ALGORITHM(GEDEA)
As GeDEA (Genetic Diversity Evolutionary Algorithm)forms the basis for GeDEA-II, we give a brief summaryof the algorithm here. For a more detailed description, theinterested reader is referred to [11]. The Genetic DiversityEvolutionary Algorithm (GeDEA) is a framework that isstrictly designed around GeDEM to exalt its characteristics.Some of the design choices follow from the basic featuresof GeDEM (e.g., the replacement of clones, the use ofan elitist strategy), the others are inspired by the will tomake things as simple as possible, and neither introducingarbitrary parameters nor using sophisticated heuristics. Tobriefly introduce the GeDEM principle, it is worth to con-ceptually go back to the beginning of Section 2, where itwas explained that the multi-objective optimization processhas two objectives, which are themselves conflicting: theconvergence to the Pareto-optimal set and the maintenanceof genetic diversity within the population. The basic ideaof GeDEM is to actually use these objectives during theevaluation phase and to rank the solutions with respect tothem, emphasizing the non-dominated solutions as well asthe most genetically different.When the GeDEM is applied, the actual ranks of thesolutions are determined maximizing (i) the ranks scoredwith respect to the objectives of the original MOOP, thenon-dominated solutions having the highest rank, and (ii)the values assigned to each individual as a measure ofits genetic diversity, calculated according to the chosendistance metric, i.e. the (normalized) Euclidean distance inthe decision variable space. The structure of GeDEA followsthe main steps of a (µ + λ) Evolution Strategy [26]. Theevolution, however, is considered at its genotypic level, withthe traditional binary coding of the decision variables. In thefollowing the framework of the GeDEA is recalled for clarity.• Step 1: An initial population of µ individuals is gener-
ated at random.• Step 2: A mating pool of 2λ individuals is formed, each
individual having the same probability of being selected.• Step 3: λ offspring are generated by crossover. Some
bits of the offspring are also randomly mutated with aprobability pmut.
• Step 4: The whole population of µ + λ individuals ischecked to discover possible clones. These clones areremoved and replaced with new randomly generatedindividuals (this is done to encourage the explorationof the search space and also to have the algorithmevaluate, for convenience, new λ different offspringevery generation; still the occurrence of clones birth isnot so frequent if clones are removed generation aftergeneration). This task is accomplished every generation,just before the objective functions evaluation, in orderto prevent the same individual is evaluated more thanonce.
0.2 0.4 0.6 0.8 1
0.1
0.2
0.3
0.4
0.5
0.6
0.7
0.8
0.9
f1
f2
True P. F.GeDEA−IIGeDEAIBEANSGAIISPEA2
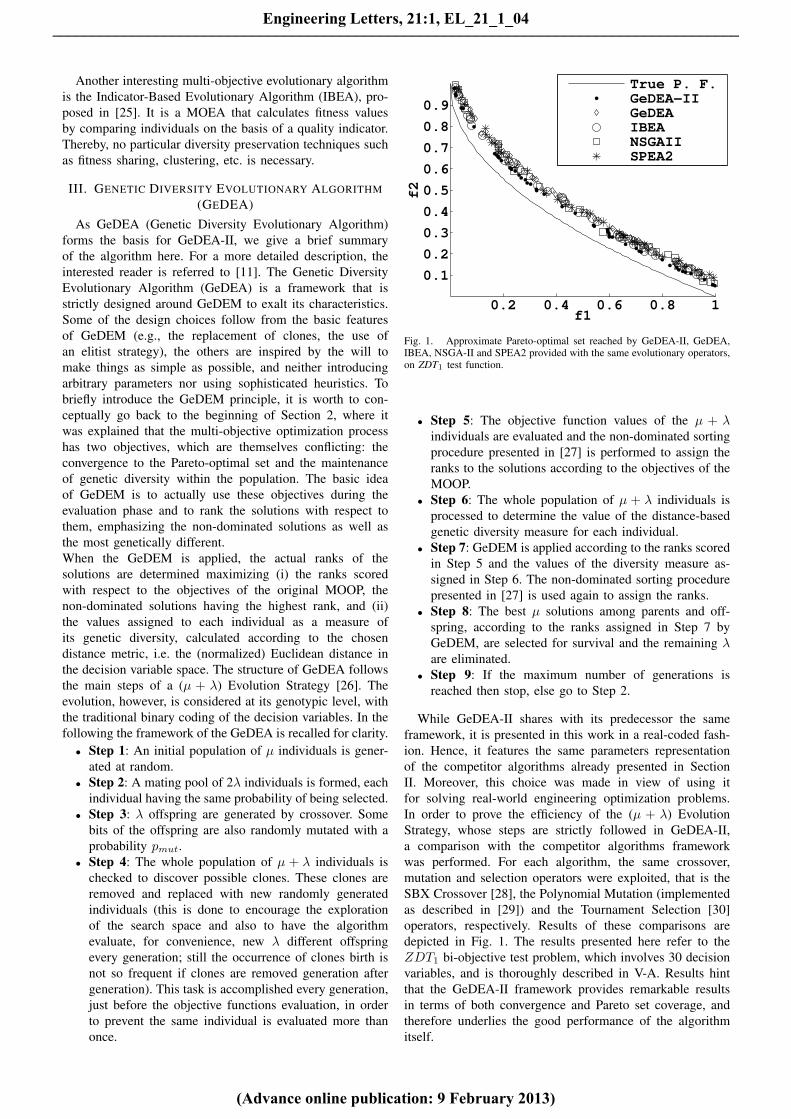
Fig. 1. Approximate Pareto-optimal set reached by GeDEA-II, GeDEA,IBEA, NSGA-II and SPEA2 provided with the same evolutionary operators,on ZDT1 test function.
• Step 5: The objective function values of the µ + λindividuals are evaluated and the non-dominated sortingprocedure presented in [27] is performed to assign theranks to the solutions according to the objectives of theMOOP.
• Step 6: The whole population of µ + λ individuals isprocessed to determine the value of the distance-basedgenetic diversity measure for each individual.
• Step 7: GeDEM is applied according to the ranks scoredin Step 5 and the values of the diversity measure as-signed in Step 6. The non-dominated sorting procedurepresented in [27] is used again to assign the ranks.
• Step 8: The best µ solutions among parents and off-spring, according to the ranks assigned in Step 7 byGeDEM, are selected for survival and the remaining λare eliminated.
• Step 9: If the maximum number of generations isreached then stop, else go to Step 2.
While GeDEA-II shares with its predecessor the sameframework, it is presented in this work in a real-coded fash-ion. Hence, it features the same parameters representationof the competitor algorithms already presented in SectionII. Moreover, this choice was made in view of using itfor solving real-world engineering optimization problems.In order to prove the efficiency of the (µ + λ) EvolutionStrategy, whose steps are strictly followed in GeDEA-II,a comparison with the competitor algorithms frameworkwas performed. For each algorithm, the same crossover,mutation and selection operators were exploited, that is theSBX Crossover [28], the Polynomial Mutation (implementedas described in [29]) and the Tournament Selection [30]operators, respectively. Results of these comparisons aredepicted in Fig. 1. The results presented here refer to theZDT1 bi-objective test problem, which involves 30 decisionvariables, and is thoroughly described in V-A. Results hintthat the GeDEA-II framework provides remarkable resultsin terms of both convergence and Pareto set coverage, andtherefore underlies the good performance of the algorithmitself.
Engineering Letters, 21:1, EL_21_1_04
(Advance online publication: 9 February 2013)
______________________________________________________________________________________

IV. GENETIC DIVERSITY EVOLUTIONARYALGORITHM-II (GEDEA-II)
GeDEA proved to be an efficient algorithm, able to explorewidely the search space, while exploiting the relationshipsamong the solutions. In order to enhance GeDEA algorithmperformance further, several main features were added to theprevious GeDEA version, yet retaining its constitutive frame-work. The main innovation is the novel crossover function,namely the Simplex-crossover, which takes place in lieu theprevious Uniform crossover. Novel selection and mutationoperators were also developed. The first one, namely theTournament-selection operator, allows exploring the designspace more effectively. The second one, namely the Shrink-mutation, allows exploring more effectively the design space.The remaining steps characterizing GeDEA algorithm, inparticular the GeDEM, were left unchanged.
The latter was integrated with the Non-Dominating sortingprocedure based on the crowding distance. The followingsections present a detailed overview of the work alreadydescribed in [31].
A. The SIMPLEX Crossover
In many EAs, a recombination with two parents is com-monly used to produce offspring. At the end of the 90’s,in several studies the use of more than two parents forrecombination in EAs have been reported [32], [33], [34].
In [35], the simplex crossover (SPX) was proposed, anew multi-parent recombination operator for real-coded GAs.The experimental results with test functions used in theirstudies showed that SPX works well on functions havingmultimodality and/or epistasis with a medium number ofparents: 3 parents on a low dimensional function or 4 parentson high dimensional functions. However, the authors didnot consider the application of the SPX to multi-objectiveproblems. Moreover, they did not consider the possibility totake into account the fitness of the objective function/s asthe driving force of the simplex. Therefore, we decided tointegrate in the GeDEA-II the SPX with these and furthernew distinctive features.
Before introducing the SPX exploited in the GeDEA-II,some words are spent to elucidate the Simplex algorithm,whose first release was presented in [17]. A simplex inn-dimensions is a construct consisting of n+1 solutionsxk, k = 1, 2, . . . , n+ 1 [18]. In a two dimensional plane,this corresponds to a triangle. The solutions are evaluatedin each step and the worst solution w, i.e., the one withthe highest fitness value, is identified. The centroid, M,of the remaining points is computed as M = 1
n
∑x xk
(k identifying the two best solutions) and a new solutionr, replacing w, is obtained by reflection, r =M+(M−w).In the Nelder and Mead version of the simplex algorithm,further operators are considered, such as expansion, internalcontraction and external contraction. However, they are nottaken into account in this work, since this choice wouldresult in additional functions evaluations, as well as addcomplexity to the algorithm. In Fig. 2, the reflection step ofthe Nelder and Mead simplex algorithm is depicted, appliedto a problem in R2.
w is the worst point, to be replaced by point r. M is thecentroid between the two other points, x1 and x2.
��
��� ��
�
��
Fig. 2. The reflection step of the simplex algorithm applied to a problemin R2.
GeDEA-II utilizes the Simplex concept as the crossoveroperator, in order to speed-up the evolution process, as statedbelow. As a matter of fact, crossover function plays animportant role in the EAs, since it combines two individuals,or parents, to form a new individual, or child, for thenext generation. Since the Simplex is itself an optimizationalgorithm, the generated children are expected to featurebest fitness values when compared to the parents. Unlikethe SPX presented in [35], the SPX exploited in GeDEA-IIrequires only two parents to form a new child. This choicewas motivated by the following considerations. First of all, itis reminded here that two is the minimum number required toform a simplex. Second, from linear algebra, it can be easilydemonstrated1 that, given k vectors, there can be found morecouples of mutually linearly independent vectors than canbe done when considering triplets (or, in general, n-tuples)of independent vectors. As a straightforward consequence,it follows that this statement is even more true if not inde-pendence but only diversity (that is, at least one componentdifferent from a vector to another one) is required. Therefore,every time a new child is created, this characteristic of theSPX ensures that this child comprises genes different fromthose of the other children, and allows the greatest designspace exploration, due to the diversity of the parents. Thesetwo parents are selected according to the selection procedurefrom the previous population, and combined following theguidelines of the simplex algorithm. Let assume p1, p2 beingthe two parent vectors, characterized by different, multiplefitness values, the child vector Child is formed according tothe reflection move described in [18]:
Child := (1 +Refl) ·M−Refl · p2 (1)
where Child is the new formed child and Refl is the reflectioncoefficient.
It is assumed that p1 is the best fitness individual amongthe two chosen to form the Child, whereas p2 the worst one.Below the strategy followed to decide every time the bestand the worst individual is highlighted.
1Let us consider three vectors in R3 design space, namely ~a=(1,0,0),~b=(0,1,0), and ~c=(0,0,1). There can be found three couples of linearlyindependent vectors, that is [~a,~b], [~a,~c] and [~b,~c] but only a triplet ofmutually and simultaneously independent vectors, that is the triplet [~a,~b,~c].This simple demonstration remains valid when extended to the Rn space.
Engineering Letters, 21:1, EL_21_1_04
(Advance online publication: 9 February 2013)
______________________________________________________________________________________

M is the centroid of p1, calculated in the followingmanner:
M :=
(1
n
)· (p1) (2)
where n is the number of the remaining individual,excluded the worst one. A dedicated discussion will bedone concerning this coefficient, and reported below. Reflcoefficient is set equal to a random number (refl ∈ [0, 1]),unlike the elemental Simplex theory, which assumes a valueequal to 1 for the Refl coefficient. This choice allows tocreate a child every time distant in a random manner fromthe parents, hence to explore more deeply the design space.
Moreover, unlike the Simplex algorithm theory, it wasdecided to switch from 1 to 2 the coefficient n in Eq. (2).
In order to establish if differences on performance existbetween the two crossover configurations, that is the one withn=1 and the one with n=2, minimization experiments on thetest suite presented in V-A were performed. The GeDEA-IIwas executed equipped with the two crossover configurations30 times, the population size and the number of generationsbeing specified in Section V-B. The guidelines given in[36] were strictly followed. However, since these are multi-objective test problems, the best fitness value was replacedwith the best hypervolume value (see Section V-C for moreelucidations) of that particular run. Table I shows our results.The performance measures used are the following:• A performance: average of the hypervolume indicator
calculated at the end of each run;• B performance: greater hypervolume indicator found;• σ: standard deviation;
The Student parameter T in this table represents the resultof a t-Test (at a 0.05 level of significance) as follows:• T is introduced to ascertain if differences in A perfor-
mance for the best crossover operator area significantwhen compared with the one of the other crossoverconfiguration in the respective test problem.
In these columns, the crossover with the best A perfor-mance value is marked with (∗∗), and the direction of anysignificant differences is denoted either by a (+) sign for animprovement in A performance or an approximate sign (∼=)if non-significant difference exists between the two averages.
First of all, the n=2 configuration performs the best almost onall the test problems, and the standard deviation demonstratesthat the repeatability of its performance is high level whencompared to that of the other configuration.
Second, some test problems exist where the difference ofthe performance is not significant.
Third, the results analyzed as a whole show that whenthe coefficient n is 2, the SPX operator favors exploitationwithout penalizing exploration of the design space, and helpsreaching the final approximation set, while covering it in asatisfactory manner.
Table II shows the percentages in which each crossoveroperator has obtained the best A performance on all the testfunctions. Its columns have the following meaning, accordingto the guidelines given in [36]:• Best average/best t-test: percentage of test functions in
which the crossover configuration has obtained the best
TABLE ISTATISTICAL COMPARISON BETWEEN THE TWO SPX CONFIGURATIONS.
RESULTS FOR THE ZDT AND DTLZ TEST SUITES.
Coefficient n = 2A B σ T
ZDT1 1.1048 1.1063 0.0011 **ZDT2 0.6204 0.6502 0.1100 **ZDT3 1.1085 1.1103 0.0015 **ZDT4 10.7612 11.1671 0.3928 **ZDT6 7.4321 7.4441 0.0277 **KUR 82.5799 83.2329 0.5201 *
DTLZ1 35.1480 35.7413 1.4350 **DTLZ2 10.6261 10.6519 0.0171 **DTLZ3 186.6339 188.2572 3.5181 **DTLZ4 4.6273 4.6638 0.0255 **DTLZ5 0.6398 0.6511 0.0048 **DTLZ6 8.5188 8.5291 0.0112 **DTLZ7 1.8662 1.9086 0.0221 **
Coefficient n = 1A B σ T
ZDT1 0.7545 0.8627 0.0775 +ZDT2 0.2492 0.3953 0.0746 +ZDT3 0.9332 1.0037 0.0476 +ZDT4 9.7198 10.4062 2.6585 ∼=ZDT6 4.2096 5.1145 0.5140 +KUR 82.0038 83.5124 1.2317 ∼=
DTLZ1 17.7558 26.4431 5.2643 +DTLZ2 10.4655 10.5520 0.0568 +DTLZ3 110.7428 156.1789 42.8868 +DTLZ4 4.5029 4.6010 0.0619 +DTLZ5 0.5673 0.6044 0.0214 +DTLZ6 5.9904 8.5244 2.0642 +DTLZ7 1.5801 1.9013 0.6277 ∼=
A performance (∗∗ in A column) and the applicationof the t-test confirms that it is significantly the best(plus sign (+) in the T column associated with theother crossover configuration); it is denoted with Romannumber I in Table II.
• Best average/similar t-test: this column shows the sameinformation as the previous one but the other crossoverfeatures no difference in A performance, according tothe t-test (the other crossover configuration has a (∼=)sign in the T column); it is denoted with Roman numberII in Table II.
• Total best: percentage of test functions in which thecrossover achieves the best A performance, withoutconsidering the t-test. This percentage is calculated asthe sum of the previous two columns; it is denoted withRoman number III in Table II.
• Similar t-test/no best average: percentage of test func-tions in which the crossover configuration shows, afterthe application of the t-test, non-significant differencesin A performance regarding the best value ((∼=) sign inthe T column); it is denoted with Roman number IV inTable II.
• Total best/similar: percentage of test functions in whichthe crossover configuration achieves either the best Abehavior or the one similar to the best. This percentageis the result of the sum of the two previous columns. itis denoted with Roman number V in Table II.
Engineering Letters, 21:1, EL_21_1_04
(Advance online publication: 9 February 2013)
______________________________________________________________________________________

TABLE IIANALYSIS FOR THE SPX OPERATORS PROVIDED WITH n=2 AND n=1
COEFFICIENT
I II III IV VCoefficient n=2 76.9 % 23.0 % 100 % 0 % 100 %Coefficient n=1 0.0 % 0.0 % 0.0 % 23.1 % 23.1 %
Results presented in Table II confirm the preceding anal-ysis, which shows the best performance achieved by n=2configuration.
The information about the fitness values is the key issue ofthis version of crossover: unlike the SPX operator presentedin [35], this characteristic allows the crossover process tocreate a new individual, which is expected to be better thanthe parents. This new crossover operator was expected tocombine both exploration and exploitation characteristics.In fact, the new formed child comprises the genes of twoparents, that means a good exploration of the design space.However, it explores a design space region opposite to thatcovered by the parent number 2, that means it explores aregion potentially not covered so far. In the early stages ofthe evolution, this means that child moves away from regionscovered from bad parents, while exploring new promisingones.
Since the Simplex algorithm is itself a single-objectiveoptimizer, a strategy was implemented to adapt it to a multi-objective algorithm. To deeply exploit the characteristics ofthe simplex, at each generation the mean of each objectivefunction, extended to all the µ individuals, is computed. Thismean is then compared to the one characterizing the previousgeneration, and the objective function featuring the greatestdifference is selected as the fitness function used within theSimplex algorithm to decide every time the best and the worstindividual. This choice was made after several experiments,which showed how a correct balance between explorationof the search space and the convergence to the P.F. can beachieved by means of a switching among multiple objectivefunctions, each time selecting the most promising one.
Algorithm 1 presents the pseudo-code related to the ap-plication of the SPX in a multi-objective context, extendedto the most general case involving M objective functions. Itit assumed that all of the objectives are to be minimized. Ateach generation ignr, the mean of each objective functionmean is calculated. Based on these values, the percentagevariations PV are subsequently derived. At this point, thetwo selected parents are sorted according to these values,and the child created according to Eqs. 1 and 2. This choiceguarantees that the objective function characterized by thegreatest difference is selected every time, therefore ensuringthe highest convergence rate to the PF. For test probleminvolving more than two objective functions, the objectivefunction considered to form the new child is chosen randomlyin order to enhance the design space exploration of thecrossover, required in highly dimensional objective spaces.
During evolution, GeDEA-II makes use exclusively of theSPX until half of the generations has been reached. Afterthat, SPX is used alternatively with the SBX with a switchingprobability of 50 percent. This choice is motivated by the will
1Here SM refers to the Shrink Mutation operator introduced in SectionIV-B
2Hereafter o.f. stands for objective function
Algorithm 1 Application of SPX in a multi objective context.1: Set M = number of objectives2: Set µ = number of parents3: Set ignr = current generation4: for i = 1→M do5: Mean = 06: for j = 1→ µ do7: MEAN(i)(ignr) = Mean(i)(ignr) +√
odfit(j)2
8: end for9: end for
10: for i = 1→M do11: PVi =
MEAN(i)(ignr−1)−MEAN(i)(ignr)
MEAN(i)(ignr−1)
12: end for13: Set count = 114: while count ≤= µ do15: Choose two parents, p1 and p2, according to SM 1
16: for i = 1→M do17: oldfit(i, 1) = ith o. f.
2 of parent p118: oldfit(i, 2) = ith o. f. of parent p219: end for20: Set A = maxi∈M (PVi)21: Find index k ∈M correspondent to A22: Set OLDFIT = [oldfit(k, 1), oldfit(k, 2)]23: if oldfit(k, 1) ≤ oldfit(k, 2) then24: Set M =
(1n
)· p1
25: Child = (1 +Refl) ·M −Refl · p226: else27: Set M =
(1n
)· p2
28: Child = (1 +Refl) ·M −Refl · p129: end if30: Set offpsring(count, :) = Child31: count = count+ 132: end while
of improving further the distribution and uniformity of thecandidate solutions on the Approximate Pareto-optimal set.
B. The Shrink Mutation
As far as mutation is concerned, a new Shrink-mutationoperator is introduced in the GeDEA-II.
In the literature, this kind of mutation strategy is referredto as Gaussian mutation [37], and conventional implemen-tations of Evolutionary Programming (EP) and EvolutionStrategies (ES) for continuous parameter optimization usingGaussian mutations to generate offspring are presented in[26] and [38], respectively.
In general, mutation operator specifies how the geneticalgorithm makes small random changes in the individuals inthe population to create mutation children. Mutation providesgenetic diversity and enables the genetic algorithm to searcha broader space. Unlike the previous version of mutationfeaturing GeDEA algorithm, where some bits of the offspringwere randomly mutated with a probability pmut, here themutation operator adds a random number taken from aGaussian distribution with mean equal to the original value ofeach decision variable characterizing the entry parent vector.
Engineering Letters, 21:1, EL_21_1_04
(Advance online publication: 9 February 2013)
______________________________________________________________________________________

The shrinking schedule employed is:
Shrinki := Shrinki−1 ·(1− ignr
ngnr
)(3)
where Shrinki is a vector representing the current mutationrange allowed for that particular design variable, ignr rep-resents the current generation and ngnr the total number ofgenerations. The shape of the shrinking curve was decidedafter several experimental tests. The fact that the variationis zero at the last generation is also a key feature ofthis mutation operator. Being conceived in this manner, themutation allows to deeply explore the design space duringthe first part of the optimization, while exploiting the non-dominated solutions during the last generations. Once thecurrent variation range has been calculated, one decisionvariable of a selected child is randomly selected, and mutatedaccording to the following formula:
Childmut := Childcross + [Shrinki] (4)
Unlike crossover operator, which generates all the offspring,mutation is applied only on a selected part of the offspring.Before starting offspring mutation, offspring population israndomly shuffled to prevent locality effects. After that, apre-established percentage (fixed to 40% for all of the testproblems) of the individuals are selected for mutation. Theinitial Shrink factor is set equal to the whole variation rangeof the design variables. This mutation operator was found tobe powerful especially in multi-objective problems requiringa huge exploration of the design space.
C. Diversity preservation
As underlined in Sections 2 and 3, maintaining the geneticdiversity within the population is mandatory for a robustEA. To this purpose, in GeDEA-II two diversity preservationmechanism are used, namely the GeDEM, already employedin GeDEA [11] and the Non-Dominated Sorting [8]. Bothof the two mentioned mechanism are adopted since inauthors’ opinion each of them has unique features whichcan take benefit from each other. To make this assertionclearer, it is worth to briefly go back to the mathematicaldefinition of GeDEM and non-dominated sorting based oncrowding distance. The definition of dominance used in thenon-dominated sorting procedure performed by GeDEM is:
Vector u = (ranku; distu) dominates vector v =(rankv; distv)if and only if
(ranku > rankv) ∧(distu ≥ distv)
On the contrary, the definition of dominance used in thenon-dominated sorting based on crowding distance is:
Vector u = (ranku; distu) dominates vector v =(rankv; distv)if and only if
(ranku > rankv) ∨[(ranku = rankv) ∧(distu≥ distv)]
Clearly, the logical operator is the great difference be-tween the aforementioned diversity mechanisms, which en-tails the slightly different behavior of the two algorithms.In particular, GeDEM tends to create less non-dominated
individuals, since both the rank and the diversity conditionsare to be fulfilled simultaneously. Therefore, the evolutionprocess results faster. On the other hand, non-dominatedsorting based on crowding distance tends to create more non-dominated individuals, which results in a better Pareto frontcoverage. In order to take advantage of both the characteris-tics, in GeDEA-II the diversity preservation is accomplishedby means of GeDEM, in the first three quarters of thegenerations, whereas in the remainder of the generations theNon-Dominated Sorting mechanism is exploited.
V. COMPARISON WITH OTHER MULTIOBJECTIVEEVOLUTIONARY ALGORITHMS
In order to judge the performance of the GeDEA-II,a comparison with other different state-of-the-art multi-objective EAs was performed. SPEA-2 [10], NSGA-II [8]and IBEA [25] were chosen as competitors, and their perfor-mance against GeDEA-II was measured on two test problemsfeaturing the characteristics that may cause difficulties inconverging to the Pareto-optimal front and in maintainingdiversity within the population [39]: discrete Pareto fronts,and biased search spaces. In addition, their performancewas tested also on two more recent and more challengingbenchmark test functions chosen among the scalable TestProblems presented in [40]. The four test functions, themethodology and the metric of performance used in thecomparison are briefly recalled in the following for easyreference.
A. Test Functions
Here only four test problems are presented due to layoutconstraints. The original version of ZDT3 and ZDT6 pre-sented in [4] featured 30 and 10 decision variables, respec-tively. Here we propose them with 100 decision variables.As regards DTLZ3, the number of variables suggested in[40] is 12. Here we propose it with 22 decision variables,respectively. As regards DTLZ7, we increased the number ofdecision variables from the original one equal to 22, up to100.
B. Methodology
The methodology used in [4] is strictly followed. GeDEA-II and competitors are executed 30 times on each testfunction. There are different parameters associated with thevarious algorithms, some common to all and some specific toa particular one. In order to make a fair comparison among allthe algorithms, most of these constants are kept the same. InGeDEA-II, GeDEA and in competitors’ algorithms, the pop-ulation size is set to 100. In the following, the parameters ofthe competitors MOEA are reported following the terminol-ogy used in PISA implementation2. The individual mutation
2Individual mutation probability (probability that a certain individualundergoes mutation); individual recombination probability (probability thata certain pair of individuals undergoes recombination); variable mutationprobability (probability that a certain variable in a given individual ismutated); variable swap probability (probability that a certain pair of vari-ables is swapped during recombination); variable recombination probability(probability that the SBX recombination operator is used for a given pairof variables; this decision is independent from variable swap probability);ηmutation (distribution index for mutation operator); ηrecombination
(distribution index for recombination operator).
Engineering Letters, 21:1, EL_21_1_04
(Advance online publication: 9 February 2013)
______________________________________________________________________________________
probability is always 1 and the variable mutation probabilityis fixed at 1/n, n being the number of the decision variablesof the test problem considered. The individual recombinationprobability along with the variable recombination probabilityare set to 1. The variable swap probability is set to 0.5.ηmutation is always set to 20 and ηrecombination is fixedto 15. For IBEA algorithm, tournament size is always setto 2, whereas additive epsilon is chosen as the indicator.Scaling factor kappa is set to 0.05, and rho factor is fixedto 1.1. For both NSGA-II and SPEA2, tournament size isgiven a value equal to 2. NSGA-II, SPEA2 and IBEA arerun with the PISA3 implementation [41], with exactly thesame parameters and variation operators. The number ofgenerations was intentionally reduced in order to test theconvergence properties of the investigated algorithms, andcontribute to justify the different results reported here, whencompared to those presented in the original papers [4], [40].
TABLE IIIORIGINAL AND PROPOSED NUMBER OF GENERATIONS FOR THE ZDT
AND DTLZ TEST PROBLEMS.
Number of generationsOriginal version prob-lems
Proposed test problems
ZDT3 250 40ZDT6 250 30
DTLZ3 500 150DTLZ7 200 100
C. Metric of Performance
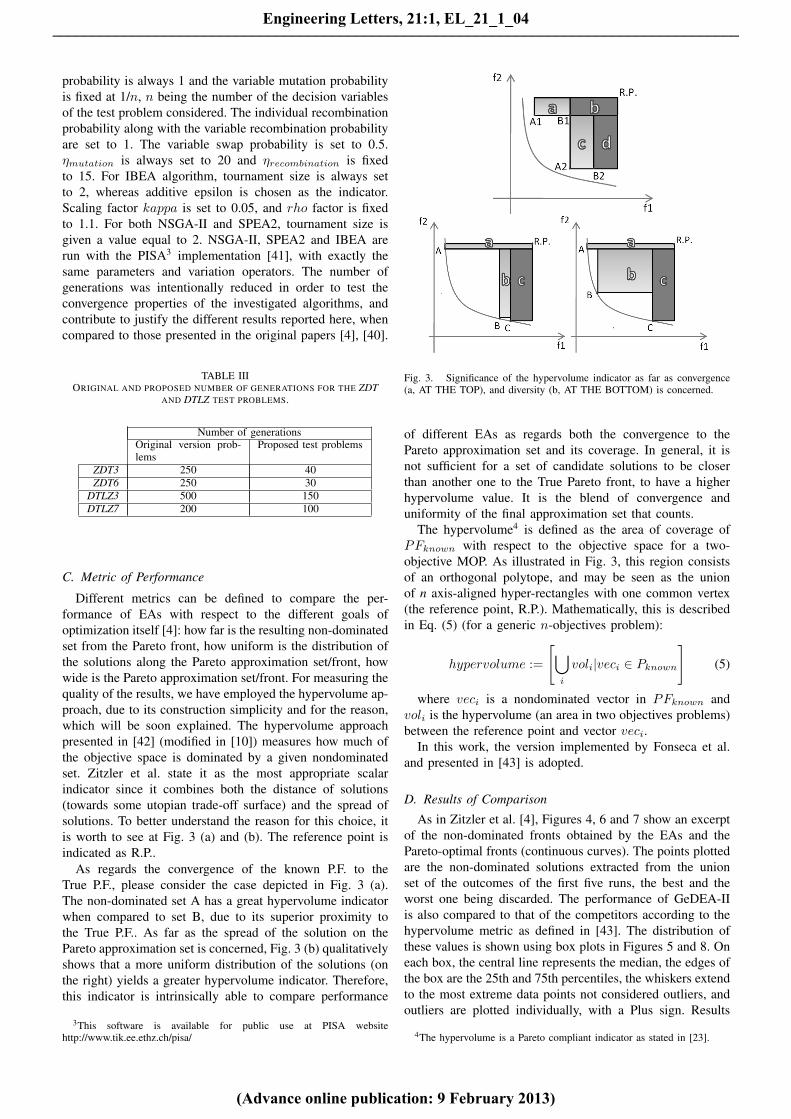
Different metrics can be defined to compare the per-formance of EAs with respect to the different goals ofoptimization itself [4]: how far is the resulting non-dominatedset from the Pareto front, how uniform is the distribution ofthe solutions along the Pareto approximation set/front, howwide is the Pareto approximation set/front. For measuring thequality of the results, we have employed the hypervolume ap-proach, due to its construction simplicity and for the reason,which will be soon explained. The hypervolume approachpresented in [42] (modified in [10]) measures how much ofthe objective space is dominated by a given nondominatedset. Zitzler et al. state it as the most appropriate scalarindicator since it combines both the distance of solutions(towards some utopian trade-off surface) and the spread ofsolutions. To better understand the reason for this choice, itis worth to see at Fig. 3 (a) and (b). The reference point isindicated as R.P..
As regards the convergence of the known P.F. to theTrue P.F., please consider the case depicted in Fig. 3 (a).The non-dominated set A has a great hypervolume indicatorwhen compared to set B, due to its superior proximity tothe True P.F.. As far as the spread of the solution on thePareto approximation set is concerned, Fig. 3 (b) qualitativelyshows that a more uniform distribution of the solutions (onthe right) yields a greater hypervolume indicator. Therefore,this indicator is intrinsically able to compare performance
3This software is available for public use at PISA websitehttp://www.tik.ee.ethz.ch/pisa/
2001)) measures how much of the objective space is dominated by a given nondominated set A. Zitzler et al. state it as the most appropriate scalar indicator since it combines both the distance of solutions (towards some utopian trade‐off surface) and the spread of solutions.
To better understand the reason for this choice, it is worth to see at Fig. 3 (a) and (b). The reference point is indicated as R.P. in Fig. 3.
Fig. 3 ‐ Significance of the Hypervolume indicator as far as convergence (a, AT THE TOP), and
diversity (b, AT THE BOTTOM) is concerned. As regards the convergence of the known P.F. to the True P.F., please consider the
case depicted in Fig. 3 (a). The non‐dominated set A has a great Hypervolume indicator when compared to set B, due to its superior proximity to the True P.F..
As far as the spread of the solution on the Pareto Front is concerned, Fig. 3 (b) qualitatively shows that a uniform distribution of the solutions (on the right) yields a great Hypervolume indicator.
Therefore, this indicator is intrinsically able to compare performances of different EAs as far as both the convergence and the genetic diversity preservation is concerned.
The Hypervolume Pareto compliant indicator is defined as the area of coverage of PFknown with respect to the objective space for a two‐objective MOP. This equates to the summation of all the rectangular areas, bounded by some reference point and (f1(x), f2(x)). Mathematically, this is described in equation (3) (for a generic n‐objectives problem):
⎥⎦
⎤⎢⎣
⎡∈= knowni
ii PvecvoleHypervolum |U (3)
where veci is a nondominated vector in PFknown and voli is the Hypervolume (an area
in two objectives problems) between the reference point and vector veci. In (Zitzler et al., 1999a; Zitzler et al., 1999b), the reference point is set to (0, 0).
Fig. 3. Significance of the hypervolume indicator as far as convergence(a, AT THE TOP), and diversity (b, AT THE BOTTOM) is concerned.
of different EAs as regards both the convergence to thePareto approximation set and its coverage. In general, it isnot sufficient for a set of candidate solutions to be closerthan another one to the True Pareto front, to have a higherhypervolume value. It is the blend of convergence anduniformity of the final approximation set that counts.
The hypervolume4 is defined as the area of coverage ofPFknown with respect to the objective space for a two-objective MOP. As illustrated in Fig. 3, this region consistsof an orthogonal polytope, and may be seen as the unionof n axis-aligned hyper-rectangles with one common vertex(the reference point, R.P.). Mathematically, this is describedin Eq. (5) (for a generic n-objectives problem):
hypervolume :=
[⋃i
voli|veci ∈ Pknown
](5)
where veci is a nondominated vector in PFknown andvoli is the hypervolume (an area in two objectives problems)between the reference point and vector veci.
In this work, the version implemented by Fonseca et al.and presented in [43] is adopted.
D. Results of Comparison
As in Zitzler et al. [4], Figures 4, 6 and 7 show an excerptof the non-dominated fronts obtained by the EAs and thePareto-optimal fronts (continuous curves). The points plottedare the non-dominated solutions extracted from the unionset of the outcomes of the first five runs, the best and theworst one being discarded. The performance of GeDEA-IIis also compared to that of the competitors according to thehypervolume metric as defined in [43]. The distribution ofthese values is shown using box plots in Figures 5 and 8. Oneach box, the central line represents the median, the edges ofthe box are the 25th and 75th percentiles, the whiskers extendto the most extreme data points not considered outliers, andoutliers are plotted individually, with a Plus sign. Results
4The hypervolume is a Pareto compliant indicator as stated in [23].
Engineering Letters, 21:1, EL_21_1_04
(Advance online publication: 9 February 2013)
______________________________________________________________________________________

are normalized with the best Hypervolume value comingfrom the union set of all of the runs, extended to all ofthe algorithms. For each test problem, the reference pointis assumed equal for all of the algorithms, and equal to themaximum value for each objective function from the unionof all of the output points.
0 0.2 0.4 0.6 0.8 1−1
0
1
2
3
4
5
f1
f2
T3 test function
GeDEA−IIGeDEAIBEANSGA−IISPEA2True P.F.
0.2 0.4 0.6 0.8 10
2
4
6
8
10
f1
f2
T6 test function
GeDEA−IIGeDEAIBEANSGA−IISPEA2True P.F.
Fig. 4. Test functions ZDT3 (AT THE TOP) and ZDT6 (AT THEBOTTOM).
In general, the experimental results show that GeDEA-IIis able to converge towards the True Pareto-optimal frontand to develop a widely and well distributed non-dominatedset of solutions. The comparison with the other three best-performing MOEAs according to the Hypervolume metricproves that the performance of GeDEA-II is somewhatsuperior. Considering the specific features of the two ZDTtest functions, GeDEA-II shows similar performance bothon multi-front and biased Pareto-optimal fronts. NSGA-II,SPEA-2 and IBEA seem instead to have more difficultieswith discreteness (test function ZDT3). The performance ofGeDEA-II is particularly remarkable in the case of biasedsearch space (test function ZDT6) where it is also able toevolve a well-distributed non-dominated set. These resultsgain even more significance, since the number of decisionvariables was set to 100, unlike the original values of 30 (10for the test function ZDT6).
As far as DTLZ3 and DTLZ7 test functions is concerned,GeDEA-II is able to reach the True Pareto Front, whereas
0.5
0.6
0.7
0.8
0.9
1
GeDEA−II GEDEA SPEA2 NSGA−II IBEA
DTLZ4 test function
Hyp
erv
olu
me
−In
dic
ato
r
0.2
0.4
0.6
0.8
1
GeDEA−II GEDEA SPEA2 NSGA−II IBEA
DTLZ4 test function
Hyp
erv
olu
me
−In
dic
ato
r
Fig. 5. Box plots based on the Hypervolume metric. Each square containssix box plots representing the distribution of Hypervolume values for thesix algorithms. Results refer to the ZDT3 (AT THE TOP) and ZDT6 (ATTHE BOTTOM) test functions.
the competitors remain trapped in the local Pareto Approxi-mation Sets, as shown in Fig. 6 and 7.
Finally, box plots prove, in general, that the performanceof GeDEA-II is superior to those of the competitors also asfar as the repeatability of the results is concerned.
E. GeDEA-II Performance on Extremly MultidimensionalLandscapes
In this section, authors aim at putting in evidence theoutstanding performance of GeDEA-II even on high mul-tidimensional environments. To do this, two test problems,chosen among those presented in Section V-A are considered,and the GeDEA-II performance tested by changing everytime the number of decision variables. Test functions chosenfor this test are the ZDT4 and DTLZ3, that is, the mostdifficult to solve problems, as stated in [4] and [40].
In Table IV, the number of variables and generations char-acterizing these tests are reported. In particular, ZDT4 testfunction feature a maximum number of decision variablesof 1000, whereas on DTLZ3 test functions the maximumnumber of decision variables is increased up to 100 timesthe original proposed number [40].
Engineering Letters, 21:1, EL_21_1_04
(Advance online publication: 9 February 2013)
______________________________________________________________________________________

0
1000
2000 01000
2000
0
500
1000
1500
2000
f2f1
f3
GeDEA−IIGeDEAIBEANSGA−IISPEA2True P.F.
0
50
100 050
100
0
20
40
60
80
100
f2f1
f3
GeDEA−IIGeDEAIBEANSGA−IISPEA2True P.F.
0
1
2 01
2
0
0.5
1
1.5
2
f2f1
f3
GeDEA−IIGeDEAIBEANSGA−IISPEA2True P.F.
Fig. 6. Test function DTLZ3. From the left, Auto scale axes, Mediumzoom and True Pareto Front region.
Fig. 7. Test function DTLZ7.
0.94
0.95
0.96
0.97
0.98
0.99
1
GeDEA−II GEDEA SPEA2 NSGA−II IBEA
DTLZ4 test function
Hyp
erv
olu
me
−In
dic
ato
r
0.4
0.5
0.6
0.7
0.8
0.9
1
GeDEA−II GEDEA SPEA2 NSGA−II IBEA
DTLZ4 test function
Hyp
erv
olu
me
−In
dic
ato
r
Fig. 8. Box plots based on the Hypervolume metric. Each square containssix box plots representing the distribution of Hypervolume values for thesix algorithms. Results refer to the DTLZ1 (AT THE TOP) and DTLZ7
(AT THE BOTTOM) test functions.
To the best of the authors’ knowledge, this is the firsttime a MOEA is tested on these test problems, with thesenumber of decision variables. For each test problems, we
Engineering Letters, 21:1, EL_21_1_04
(Advance online publication: 9 February 2013)
______________________________________________________________________________________

TABLE IVMINIMUM AND MAXIMUM NUMBER OF DECISION VARIABLES FOR THE
ZDT4 and DTLZ3 test problems.
Number of gener-ations
Minimum num-ber of decisionvariables
Maximum num-ber of decisionvariables
ZDT4 40 10 1000DTLZ3 80 12 1200
performed 30 independent runs for each number of decisionvariables, and the boxplots were then built, following theguidelines already given in Section V-D. Y-axes are scaledin such a way the best run is given a value equal to 1. InFigure 9, the boxplots showing GeDEA-II performance arepresented, as the decision variables are increased from theminimum value up to the maximum one. Results clearly
0.997
0.9975
0.998
0.9985
0.999
0.9995
1
#10 #100 #250 #500 #1000
DTLZ4 test function
Hyp
erv
olu
me
−In
dic
ato
r
0.975
0.98
0.985
0.99
0.995
1
#10 #100 #250 #500 #1200
DTLZ4 test function
Hyp
erv
olu
me
−In
dic
ato
r
Fig. 9. Box plots based on the Hypervolume metric. Each square containsfive box plots representing the distribution of Hypervolume values for thesix number of decision variables.Results refer to the ZDT4 (AT THE TOP)and DTLZ3 (AT THE BOTTOM) test functions.
states that GeDEA-II performance is high-level. In eachtest problem, performance is never lower than 99% of themaximum value, no matter how many the decision variablesare. This clearly demonstrate GeDEA-II manages to evolvethe initial population near to the True Pareto front, even when
0 0.2 0.4 0.6 0.8 10
0.2
0.4
0.6
0.8
1
f1
f2
ZDT4 test function
GeDEA−IITrue P.F.
0
0.5
1 00.5
1
0
0.5
1
1.5
f2
DTLZ3 test function
f1
f3
GeDEA−IITrue P.F.
Fig. 10. Final Approximation Set reached by the GeDEA-II on test functionZDT4 (AT THE TOP) and the non dominated solutions found by GeDEA-IIon DTLZ3 (AT THE BOTTOM), featuring 1200 decision variables.
the number of decision variables is dramatically increased.Figure 10 shows in the objective space, the distributionof the final solutions obtained in the run with the lowestHypervolume-value by the GeDEA-II for each test instance,for the maximum number of decision variables. It is evidentthat as regards the convergence to the True Pareto Front andspread of solutions, GeDEA-II performance is high level.
VI. CONCLUSION
In this paper, we have presented GeDEA-II, an improvedmulti-objective evolutionary algorithm that employs novelvariation operators compared to its predecessor GeDEA.Extensive numerical comparisons of GeDEA-II with GeDEAand with NSGAII, SPEA-2 and IBEA, three state-of-the-art recently proposed algorithms, have been carried out onvarious test problems. Moreover, optimization difficultieshave been enhanced further, in order to test the robustnessof the codes. The key results of the comparison show theexcellent performance of the GeDEA-II, when compared tothe competitors algorithm, in terms of both exploration andexploitation capabilities. Boxplots show that the reproducibil-ity of results of GeDEA-II is high-level, when compared
Engineering Letters, 21:1, EL_21_1_04
(Advance online publication: 9 February 2013)
______________________________________________________________________________________

to that of the NSGAII, SPEA-2 and IBEA. In extremelyhigh dimensional spaces, GeDEA-II clearly shows excellentperformance. In addition to these characteristics, GeDEA-II performs these tasks with a reduced number of objectivefunctions evaluations, a very useful feature when consideringits application to real-world engineering problems.
APPENDIX
Each of the three ZDT test functions, namely ZDT3, ZDT4
and ZDT6 introduced in [4] is a two-objective minimizationproblem that involves a distinct feature among those iden-tified in [39]. All the test functions are constructed in thesame way, according to the guidelines in [39]:
Minimize : T (x) = (f1(x1), f2(x)) (6)subject to : f2(x) = g(x2; . . . ;xm)
h(f1(x1), g(x2; . . . ;xm))
where : x = (x1, . . . , xM)
Function f controls vector representation uniformity along thePareto approximation set. Function g controls the resultingMOP characteristics (whether it is multifrontal or has anisolated optimum). Function h controls the resulting Paretofront characteristics (e.g., convex, disconnected, etc.) Thesefunctions respectively influence search along and towardsthe true Pareto front, and the shape of a Pareto front inR2. Deb [39] implies that a MOEA has difficulty findingPFtrue because it gets “trapped” in the local optimum,namely PFlocal. Test functions reported in this work featurean increased number of decision variables, when comparedto their original versions reported in [4]. This choice was mo-tivated by the authors’ will of testing exploration capabilitiesof the algorithms also on highly dimensional test problems,and contributes to justify the results presented in SectionV-D.• Test function ZDT3 features a Pareto-optimal front dis-
connected, consisting of several noncontiguous convexparts:
f 1(x1) = (x1) (7)
g(x2; . . . ;xn) = 1 + 9 ·n∑
i=2
xi(n− 1)
h(f1, g) = 1−
(√f1g
)−(f1g
)· sin(10πf1 )
where n = 100 and xi ∈ [0,1]. The Pareto-optimal frontcorresponds to g(x) = 1. The original version presentedin [4] featured 30 decision variables.
• Test function ZDT4 contains 219 local Pareto-optimalfronts and, therefore, tests for the EA ability to dealwith multifrontality:
f 1(x1) = (x1)
g(x2; . . . ;xn) = 1 + 10(n− 1)
·n∑
i=2
(xi
2 − 10 cos(4πxi))
h(f1, g) = 1−
√f1g
(8)
where n = 100 and xi ∈ [0,1]. The Pareto-optimal frontis convex and corresponds to g(x) = 1. The originalversion presented in [4] featured 10 decision variables.
• Test function ZDT6 features two difficulties caused bythe non-uniformity of the search space: first, the Paretooptimal solutions are nonuniformly distributed alongthe PFtrue (the front is biased for solutions for whichf1(x1) is near one); and second, the density of thesolutions is lowest near the PFtrue and highest awayfrom the front::
f 1(x1) = 1− exp(−4x1) sin6(6πx1)
g(x2; . . . ;xn) = 1 + 9 ·
(n∑
i=2
xi(n− 1)
)1/4
(9)
h(f1, g) = 1−(f1g
)2
where n = 100 and xi ∈ [0,1]. The Pareto-optimal frontis non-convex and corresponds to g(x) = 1. The originalversion presented in [4] featured 10 decision variables.
Finally, two of the tri-objective minimization test func-tions designed by Kalyanmoy Deb, Lothar Thiele, MarcoLaumanns and Eckart Zitzler, and presented in [40], are con-sidered, in order to demonstrate the GeDEA-II capabilities onmore than two-objectives test problems. In the following, nidentifies the number of decision variables, M the number ofobjective functions, and k = |xM | = n−M+1 the number ofvariables of the functional g(xM ). The number of variableswas always increased when compared to that suggested bythe authors in [40], whereas the decision variables range wasleft unchanged. These features help clarifying the differentresults between those reported in Section V-D and theoriginal ones [40].• Test function DTLZ3 is similar to test function DTLZ2,
except for the function g, which introduces (3k − 1)local Pareto-optimal fronts, and only one global Pareto-optimal front.
f1(x) = (1 + g(xM )) cos(x1π/2 ) cos(x2π/2 )
f2(x) = (1 + g(xM )) cos(x1π/2 ) sin(x2π/2 )
f3(x) = (1 + g(xM )) sin(x1π/2 ) (10)
g = 100 · [k +∑
xi∈xM
(xi − 0.5)2 −
cos (20π (xi − 0.5))]
where n = 22 and xi ∈ [0,1]. The number of variablessuggested in [40] is 12.
• Test function DTLZ7 features 2M−1 disconnected localPareto-optimal regions in the search space. It is chosento test the MOEA ability in finding and maintain stableand distributed subpopulations in all four disconnectedglobal Pareto-optimal regions.
f1(x) = x1
f2(x) = x2
f3(x) = (1 + g(xM ))h (11)
g = 1 +9
k
∑xi∈xM
(xi)
h = M −M−1∑i=1
[fi
1 + g(sin((1 + 3πfi))
]
Engineering Letters, 21:1, EL_21_1_04
(Advance online publication: 9 February 2013)
______________________________________________________________________________________

where n = 100 and xi ∈ [0,1]. Once again, the numberof decision variables was dramatically increased whencompared to the original one, suggested in [40] for thistest problem, and equal to 22.
REFERENCES
[1] C. M. Fonseca and P. J. Fleming, Genetic algorithms for multiobjectiveoptimization: Formulation, discussion and generalization. In S.Forrest (Ed.), Proceedings of the Fifth International Conference onGenetic Algorithms, San Mateo, California, pp. 416-423. MorganKaufmann., 1993.
[2] J. Horn, N. Nafpliotis, and D. E. Goldberg, “A niched pareto geneticalgorithm for multiobjective optimization,” in In Proceedings of theFirst IEEE Conference on Evolutionary Computation, IEEE WorldCongress on Computational Intelligence, 1994, pp. 82–87.
[3] N. Srinivas and K. Deb, “Multiobjective optimization using nondomi-nated sorting in genetic algorithms,” Evolutionary Computation, vol. 2,no. 3, pp. 221–248, 1994.
[4] E. Zitzler, K. Deb, and L. Thiele, “Comparison of multiobjective evo-lutionary algorithms: Empirical results,” Evolutionary Computation,vol. 8, no. 2, pp. 173–195, 2000.
[5] E. Zitzler and L. Thiele, An evolutionary algorithm for multiobjectiveoptimization: The strength pareto approach. Technical Report 43,Computer Engineering and Networks Laboratory (TIK), Swiss FederalInstitute of Technology (ETH) Zurich, Gloriastrasse 35, CH-8092Zurich, Switzerland., 1998.
[6] ——, “Multiobjective evolutionary algorithms: A comparative casestudy and the strength pareto approach,” IEEE Transactions on Evo-lutionary Computation, vol. 3, no. 4, pp. 257–271., 1999.
[7] J. Knowles and D. Corne, “The Pareto Archived Evolution Strategy:A New Baseline Algorithm for Pareto Multiobjective Optimisation,”IEEE Press, vol. 1, pp. 98–105, 1999.
[8] K. Deb, A. Pratap, S. Agarwal, and T. Meyarivan, “A fast and elitistmultiobjective genetic algorithm: NSGA-II,” IEEE Transactions onEvolutionary Computation, vol. 6, no. 2, pp. 182–197, 2002.
[9] D. W. Corne, J. D. Knowles, and M. J. Oates, The pareto envelope-based selection algorithm for multiobjective optimisation. Proceed-ings of the Parallel Problem Solving from Nature, VI Conference,Berlin, pp. 839-848. Springer., 2000.
[10] E. Zitzler, M. Laumanns, and L. Thiele, SPEA2: Improving theStrength Pareto Evolutionary Algorithm. Technical Report 103,Computer Engineering and Networks Laboratory (TIK), Swiss FederalInstitute of Technology (ETH) Zurich, Gloriastrasse 35, CH-8092Zurich, Switzerland,May 2001., 2001.
[11] A. Toffolo and E. Benini, “Genetic diversity as an objective in multi-objective evolutionary algorithms,” Evolutionary Computation, vol. 11,no. 2, pp. 151–157, 2002.
[12] N. Krasnogor and J. Smith, “A tutorial for competent memetic algo-rithms: model, taxonomy and design issues,” IEEE Transactions onEvolutionary Computation, vol. 9, no. 5, pp. 474–488, 2005.
[13] N. Krasnogor, W. Hart, and J. Smith, Recent Advances in MemeticAlgorithms, Studies in Fuzziness and Soft Computing. Springer-Verlag, 2004.
[14] P. Moscato, R. Berretta, and C. Cotta, Memetic Algorithms. JohnWiley Sons, Inc., 2010.
[15] K. Deb, S. Lele, and R. Datta, “A hybrid evolutionary multi-objectiveand sqp based procedure for constrained optimization,” Advances inComputation and Intelligence, vol. 4683, pp. 36–45, 2007.
[16] H. Ghiasi, D. Pasini, and L. Lessard, “A non-dominated sorting hybridalgorithm for multi-objective optimization of engineering problems,”Engineering Optimization, vol. 43, no. 1, pp. 39–59, 2011.
[17] W. Spendley, G. R. Hext, and F. R. Himsworth, “Sequential Applica-tion of Simplex Designs in Optimization and Evolutionary Operation,”Technometrics, vol. 4, pp. 441–461, 1962.
[18] J. M. Nelder and R. Mead, “A simplex method for function minimiza-tion,” Comput. J., vol. 7, no. 4, pp. 308–313, 1965.
[19] R. Chelouah and P. Siarry, “Genetic and nelder-mead algorithmshybridized for a more accurate global optimization of continuousmultiminima functions,” European Journal of Operational Research,vol. 148, no. 2, pp. 335–348, 2003.
[20] S.-K. S. Fan, Y.-C. Liang, and E. Zahara, “A genetic algorithm and aparticle swarm optimizer hybridized with nelder-mead simplex search,”Computers Industrial Engineering, vol. 50, pp. 401–425, 2006.
[21] X. Guo, “A hybrid simplex multi-objective evolutionary algorithmbased on preference order ranking,” in Computational Intelligence andSecurity, International Conference on, 2011, pp. 29–33.
[22] K. Deb, Multi-objective Optimization using Evolutionary Algorithms.John Wiley, Chichester, UK., 2001.
[23] C. A. Coello Coello, D. A. Van Veldhuizen, and G. B. Lamont, Evo-lutionary Algorithms for Solving Multi-objective Problems. KluwerAcademic Publishers, New York, NY, 2002.
[24] P. Koduru, Z. Dong, S. Das, S. Welch, J. L. Roe, and E. Charbit, “Amultiobjective evolutionary-simplex hybrid approach for the optimiza-tion of differential equation models of gene networks,” IEEE Trans.Evolutionary Computation, vol. 12, no. 5, pp. 572–590, 2008.
[25] E. Zitzler and S. Kunzli, Indicator-Based Selection in MultiobjectiveSearch. In Parallel Problem Solving from Nature (PPSN VIII), X.Yao et al., Eds. Berlin, Germany: Springer-Verlag, 2004, pp. 832-842.,2004.
[26] T. Back, Evolutionary Algorithms in Theory and Practice. OxfordUniversity Press, 1996.
[27] D. E. Goldberg, Genetic Algorithms in Search, Optimization andMachine Learning. Addison Wesley, Reading, Massachusetts., 1989.
[28] R. B. Agrawal and K. Deb, “Simulated binary crossover for continuoussearch space,” Complex Systems, 9, pp. 115-148., 1994.
[29] K. Deb and M. A. Goyal, “Combined Genetic Adaptive Search (Ge-neAS) for Engineering Design,” Computer Science and Informatics,vol. 26, pp. 30–45, 1996.
[30] T. Back, “Selective pressure in evolutionary algorithms: A character-ization of selection mechanisms,” In Proceedings of the First IEEEConference on Evolutionary Computation, pp. 57–62, 1994.
[31] C. Comis Da Ronco and E. Benini, “Gedea-II: A novel evolutionaryalgorithm for multi-objective optimization problems based on thesimplex crossover and the shrink mutation,” in Lecture Notes in Engi-neering and Computer Science: Proceedings of The World Congresson Engineering and Computer Science 2012, WCECS 2012, 24-26October, 2012, San Francisco, USA, pp. 1298–1303.
[32] A. E. Eiben and T. Back, “Empirical investigation of multiparentrecombination operators in evolution strategies,” Evolutionary Com-putation, vol. 5, no. 3, pp. 347–365, 1997.
[33] I. Ono and S. Kobayashi, “A real-coded genetic algorithm for functionoptimization using unimodal normal distribution crossover,” Proceed-ings of the Seventh International Conference on Genetic Algorithms,pp. 246–253, 1997.
[34] S. Tsutsui and A. Ghosh, “A study on the effect of multi-parentrecombination in real coded genetic algorithms,” Proceedings of the1998 IEEE ICEC, pp. 828–833, 1998.
[35] S. Tsutsui, M. Yamamura, and T. Higuchi, “Multi-parent recom-bination with simplex crossover in real coded genetic algorithms,”Proceedings of the GECCO-99, pp. 657–644, 1999.
[36] F. Herrera, M. Lozano, and A. M. Sanchez, “A taxonomy for thecrossover operator for real-coded genetic algorithms: An experimentalstudy,” International Journal of Intelligent Systems, vol. 18, pp. 309–338, 2003.
[37] T. Back and H.-P. Schwefel, “An overview of evolutionary algorithmsfor parameter optimization,” Evolutionary Computation, vol. 1, no. 1,pp. 1–23, 1993.
[38] D. B. Fogel, Evolutionary computation: toward a new philosophy ofmachine intelligence. Piscataway, NJ, USA: IEEE Press, 1995.
[39] K. Deb, “Multi-objective genetic algorithms: Problem difficulties andconstruction of test problems,” Evolutionary Computation, vol. 7,no. 3, pp. 205–230, 1999.
[40] K. Deb, L. Thiele, M. Laumanns, and E. Zitzler, “Scalable testproblems for evolutionary multi-objective optimization,” ComputerEngineering and Networks Laboratory (TIK), TIK-Technical ReportNo. 112, Swiss Federal Institute of Technology, 2001.
[41] S. Bleuler, M. Laumanns, L. Thiele, and E. Zitzler, PISA - A Plat-form and Programming Language Independent Interface for SearchAlgorithms. Springer, 2002.
[42] E. Zitzler, K. Deb, and L. Thiele, “Comparison of multiobjective evo-lutionary algorithms on test functions of different difficulty,” Proceed-ings of the 1999 Genetic and Evolutionary Computation Conference,pp. 121–122, 1999.
[43] C. M. Fonseca, L. Paquete, and M. Lopez-Ibanez, “An improveddimension-sweep algorithm for the hypervolume indicator,” IEEECongress on Evolutionary Computation, pp. 1157–1163, 2006.
Engineering Letters, 21:1, EL_21_1_04
(Advance online publication: 9 February 2013)
______________________________________________________________________________________