Ge/Ay133 Jovian planet formation. Core-accretion or gravitational instability?
date post
22-Dec-2015Category
view
222download
2
Ge/Ay133
Disk Structure and Spectral Energy Distributions (SEDs)

Cloud collapse Rotating disk
infall
outflow
Planet formationMature solar system
x1000 in scale
Adapted from McCaughrean
How are stars and planets made?
outflowB68 HH30
HD 141569
BVIJHK
B68
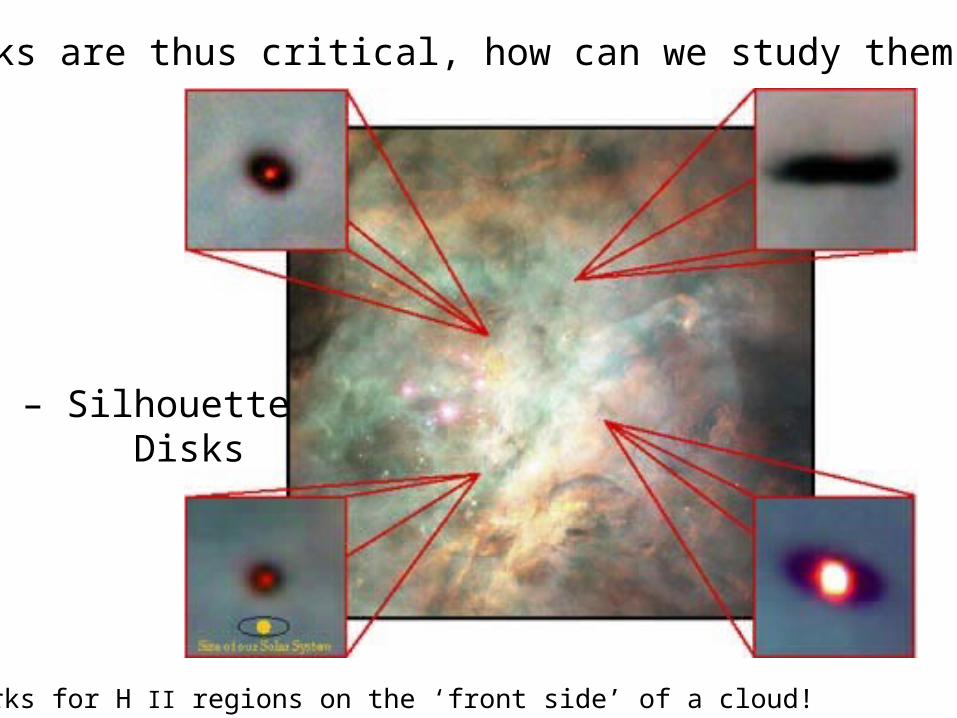
Disks are thus critical, how can we study them?
#1 – Silhouette Disks
Only works for H II regions on the ‘front side’ of a cloud!

Age →
#2 – Edge-on Disks
Highly informative, but also rare!

While edge-on disks provide a natural coronograph, …
more generally, need special circumstances for detection.
AU Mic, Keck
HD 141569A, HST

Remember, disks are small:
1 A.U. = 7 milli-arcseconds for D=140 pc (Taurus, Ophichus)
Angular momentum budget: For a MMSN mass profile Keplerian disk of radius R,
J~(3x1020 cm2/s)(R/100 AU)1/2

Imaging surveys/unresolved photometry rather easier. What do such surveys tell us?
R=MIPS1 G=IRAC2 B=IRAC1 in Serpens
VV Ser
Blue=main sequence starRed =protostar/AGB star
Spitzer

Characterizing large disk samples? SED Models:
IR disk surface within several 0.1 – several tens of AU(sub)mm disk surface at large radii, disk interior. What determines disk properties (radius, flaring, T)?
G.J. vanZadelhoff2002
Chiang &Goldreich 1997
HH 30

Two different limits: Accretion-dominated vs. Passive
How hot do accretion disks get? At the very least, infalling material must dissipate an energy of order (GM*/Rdisk) per unit mass. Balance this against thermal radiation: (GM*/Rdisk)(Mdisk)~2Rdisk
2T4·where accretion timescale. Numerically,
T~(500 K)(1 AU/Rdisk)3/4
for 105 yr and a solar mass star.
Thus, more massive and/or faster evolving disks are hotter. Notice the different vertical temperature structure for more realistic models.

Passive Disks: The SHAPE is critical
If the central stellar mass dominates, the “vertical” acceleration at a distance R and height above the midplane z is g=geff ≈ (GM*/R3)·z = ·zwhere =(vK/R)=the Keplerian angular vel. For an ideal gas, the sound speed c is simply c=(RT)1/2 (R=ideal gas constant). From the equation of hydrostatic equilibrium dP/dz=-geff=-z=-(P/RT)z=-P(/c)2z
For a vertically isothermal disk this gives P = P0exp(-z2/H2) ,Where the scale height H=c/For a sound speed of 1 km/s and R~10 km/s, H/R=(sound speed)/(Keplerian vel.)~0.1. More quantitative models give (a=R):
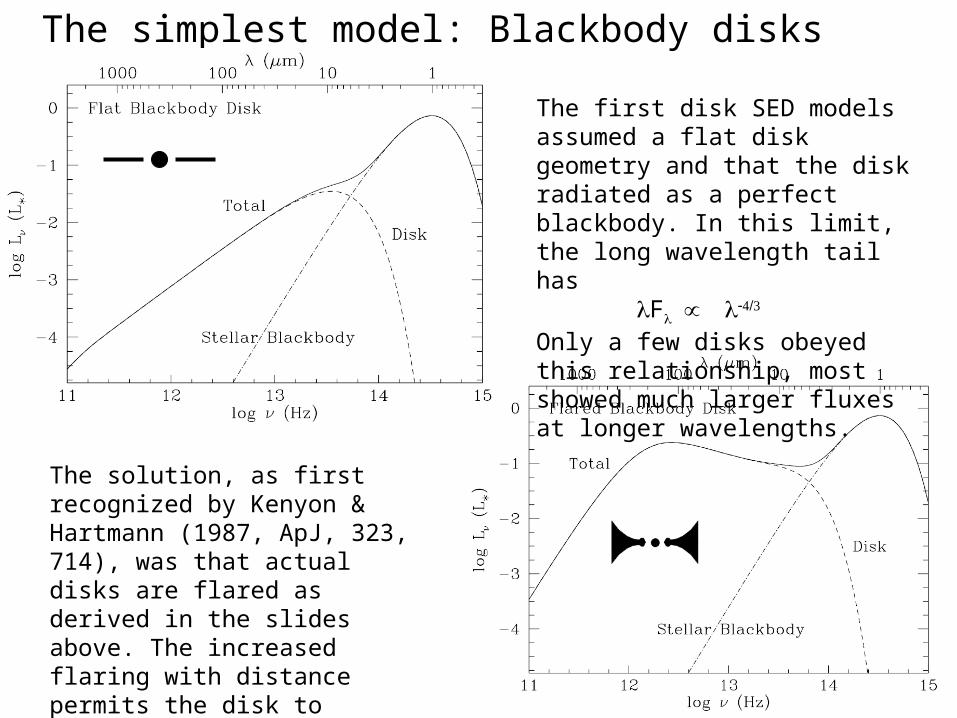
The simplest model: Blackbody disks
The first disk SED models assumed a flat disk geometry and that the disk radiated as a perfect blackbody. In this limit, the long wavelength tail has F
Only a few disks obeyed this relationship, most showed much larger fluxes at longer wavelengths.
The solution, as first recognized by Kenyon & Hartmann (1987, ApJ, 323, 714), was that actual disks are flared as derived in the slides above. The increased flaring with distance permits the disk to intercept more light from the star and re-radiate it in the far-IR.

Somewhat more realistic: Two layer disk models
Chiang & Goldreich 1997, ApJ, 490, 368
While still not fully self-consistent, a rather better two-layer disk model was developed by Eugene Chiang for his thesis. The basic idea is that the stellar light is absorbed by the surface layers of the disk that are optically thin to re-radiated infrared energy from grains. This approach w/flared disks provides a good fit to most observed SEDs.

Next step: Include grain model opacities
Predicts silicate emission bandsfor the SiO stretchingand bending modesat 10/18 m.
The grains in disk surfaces are not perfect black- or greybodies, but instead have wavelength dependent emissivities.

Grain Emission/Growth in Disk Surface Layers10 m band 20 m band
Models
Data
Kessler-Silacci et al. 2006, ApJ

Warning: Recent data suggest complex disk atmospheres
See water, organics. How do such species survive near the disk surface? Transport?
Many disks display intense molecular emission even at R=600 (Spitzer IRS)!

How unique are these models?
Nearly all are degenerate for <30 m.
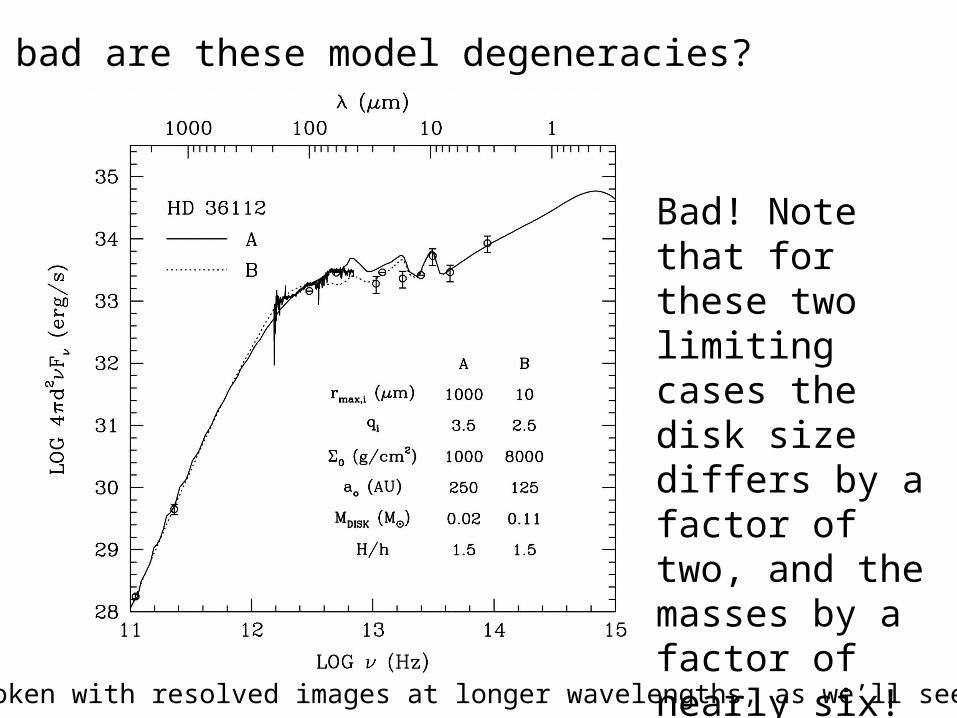
How bad are these model degeneracies?
Can be broken with resolved images at longer wavelengths, as we’ll see next time.
Bad! Note that for these two limiting cases the disk size differs by a factor of two, and the masses by a factor of nearly six!

How do we know how old pre-main sequence stars are?
Old clusters `dated’ with turn-off stars.
Young stars contract to main sequence, need accurate data on M, L, T along with * models.
← Mass
← T
ime