
GE Grid Solutions · FUNCTIONS Viewing the Action ... Database List ... GE Energy Aggregator is...
180
Instruction Manual GE Energy Aggregator revision: 4.2 GE publication code: GEK-119642 Manual Part Number: 1601-0501-A1 1601-0501-A1 GE Grid Solutions
Transcript of GE Grid Solutions · FUNCTIONS Viewing the Action ... Database List ... GE Energy Aggregator is...

Instruction ManualGE Energy Aggregator revision: 4.2
GE publication code: GEK-119642
Manual Part Number: 1601-0501-A1
1601-0501-A1
GEGrid Solutions

Copyright © 2017 GE Multilin Inc. All rights reserved.
GE Energy Aggregator Instruction Manual for product revision 4.2.
The contents of this manual are the property of GE Multilin Inc. This documentation is furnished on license and may not be reproduced in whole or in part without the permission of GE Multilin. The manual is for informational use only and is subject to change without notice.
Part number: 1601-0501-A1 (June 2017)

Safety words and definitionsThe following symbols used in this document indicate the following conditions
Note Indicates a hazardous situation which, if not avoided, will result in death or serious injury.
Note Indicates a hazardous situation which, if not avoided, could result in death or serious injury.
Note Indicates a hazardous situation which, if not avoided, could result in minor or moderate injury.
Note Indicates practices not related to personal injury


Table of Contents
1.OVERVIEW About GE Energy Aggregator..................................................................................................... 1 - 1GE Energy Aggregator licensing............................................................................................... 1 - 2Order codes ........................................................................................................................................ 1 - 3Contact us ........................................................................................................................................... 1 - 3
2.INSTALLATION Installing the GE Energy Aggregator Application ............................................................. 2 - 1Important Installation Requirements...............................................................................................2 - 2Installation Procedure.............................................................................................................................2 - 5
Enter a Software License Key .................................................................................................... 2 - 9Steps for Using the GE Energy Aggregator Application...............................................2 - 11
3.USING GE METERMANAGER TO AUTOMATE GE ENERGY AGGREGATOR
Add Meters to the Meter List Using Auto Discovery ........................................................ 3 - 2Manually Connect to Meter......................................................................................................... 3 - 5Log Retrieval through GE MeterManager............................................................................. 3 - 7
4.SETTING UP LOGGING
5.CONFIGURING APPLICATION SETTINGS
Set Up a Provider.............................................................................................................................. 5 - 4Set Up Rate Structures ................................................................................................................5 - 14Set Up a Customer.........................................................................................................................5 - 38Set Up a Location and Add Meters to It...............................................................................5 - 40
Adding a Meter Manually ................................................................................................................... 5 - 50Meter at Location Example................................................................................................................ 5 - 52Importing External Data...................................................................................................................... 5 - 54
6.GE ENERGY AGGREGATOR DASHBOARD VIEWER
Accessing the GE Energy Aggregator Dashboard Viewer............................................ 6 - 3Usage Dashboard............................................................................................................................ 6 - 6Generating and Viewing Usage Reports.............................................................................6 - 13
Executive Summary Usage Report ................................................................................................ 6 - 13Generate Usage Reports..................................................................................................................... 6 - 15Generate Custom Reports.................................................................................................................. 6 - 18
Generating and Viewing Customer Bills..............................................................................6 - 21Individual Bills........................................................................................................................................... 6 - 22Generate Bills Manually ...................................................................................................................... 6 - 26View Bills ..................................................................................................................................................... 6 - 27
7.MANAGING DATA View/Copy/Export Meter Data................................................................................................... 7 - 1Export Meters Data...................................................................................................................................7 - 5
Edit Data Errors ................................................................................................................................. 7 - 7Re-Aggregate All Locations......................................................................................................... 7 - 9Rebuild Period Analysis ................................................................................................................. 7 - 9
GE ENERGY AGGREGATOR – INSTRUCTION MANUAL TOC–I

8.ADDITIONAL FEATURES AND ADVANCED FUNCTIONS
Viewing the Action Log ..................................................................................................................8 - 1The Service Status Bar............................................................................................................................ 8 - 4
Database Maintenance .................................................................................................................8 - 6Database List .............................................................................................................................................. 8 - 7Archive Database Clusters ................................................................................................................... 8 - 7Restore Database Clusters................................................................................................................... 8 - 9Clear Database ........................................................................................................................................8 - 11Server Status.............................................................................................................................................8 - 12Database Actions....................................................................................................................................8 - 13
Clear Meter Data............................................................................................................................ 8 - 14Option Screens................................................................................................................................ 8 - 15
Path Setting ...............................................................................................................................................8 - 15Configuration Setting............................................................................................................................8 - 16UI (User Interface) Setting ...................................................................................................................8 - 18Language....................................................................................................................................................8 - 19
Performing Tasks Using Command Line............................................................................. 8 - 22Import Data Using Command Line.................................................................................................8 - 22Generate All Bills Using Command Line .......................................................................................8 - 22
Remote Access................................................................................................................................ 8 - 23
A.SAMPLE USAGE SUMMARY REPORT
G.GLOSSARY
TOC–II GE ENERGY AGGREGATOR – INSTRUCTION MANUAL

GE Energy Aggregator
Chapter 1: Overview
GEGrid Solutions
Overview
1.1 About GE Energy Aggregator
GE Energy Aggregator is a fully customizable software application that lets you create and view an energy dashboard, analyze costs, and automatically generate detailed energy usage reports and usage bills using GE Communicator application databases.
GE Energy Aggregator is designed for use with GE Energy EPM meters with logging (memory) functionality.
This includes the following meters:
Power Quality Meters
• EPM 7000
• EPM 9450/9460
• EPM 9800
• EPM 9900
Submetering
• EPM 4600
• EPM 7100
GE Energy Aggregator performs complex calculations such as multiple entity aggregation, and supports user-programmable rate and tariff structures. This robust application allows for generation, transmission, distribution, and tax charges, and can be used for steam and other commodities as well as electrical billing. It also supports detailed usage analysis in the form of usage reports and trending charts.
GE Energy Aggregator has three parts:
• GE Energy Aggregator Settings Editor: the part of the application you use to set up billing, including customer and location configuration, data import, rate configuration, and correcting errors in the imported data.
GE ENERGY AGGREGATOR – INSTRUCTION MANUAL 1–1

CHAPTER 1: OVERVIEW GE ENERGY AGGREGATOR LICENSING
• GE Energy Aggregator Dashboard Viewer: the part of the application you use to view the Energy Dashboard, generate and view bills, view and analyze usage data, and generate and view usage reports.
• Database Server: the part of the application which provides access to the billing database.
GE Energy Aggregator includes the following features:
• Support from GE MeterManager software allows for meter and logging automation and management
• Dashboard layout
• Weather data to provide weather vs. load comparisons
• Meter aggregation feature and virtual meters
• Ability to archive rate structures that have changed
• Ability to set up seasonal fixed charges
• Ability to set up tiered rates
• Ability to export data from the meter
• Reporting capabilities
• Technical tools
Multiple simultaneous sessions of the software are supported.
• Up to 250 locations per customer and 2500 meters (total) are supported.
DO NOT EXCEED this number. Additionally, do not exceed 100 meters per location. The software will issue Warnings indicating that this is the maximum limit; i.e, 100 meters per location, 250 locations per customer, 2500 meters total.
1.2 GE Energy Aggregator licensing
GE Energy Aggregator is available with a free Demo license for trial use, or a fully licensed paid version.
In addition to a paid license, the GE Energy Aggregator application requires at least one GE Communicator (4.0 or higher) license for full functionality.
GE Energy Aggregator uses the GE MeterManager automation component, which is installed as a part of the GE Communicator (4.0 or higher) application. A licensed version of the GE Communicator4.0 software must be installed on the PC that will function as the Server. The demo version of GE Communicator does not include the GE MeterManager automation component, and will not work with GE Energy Aggregator.
GE Energy Aggregator license types
Features available
Demo license (free) Limited to a single meter location
Full license (paid) - Unlimited meter locations- Automated updates
1–2 GE ENERGY AGGREGATOR – INSTRUCTION MANUAL

ORDER CODES CHAPTER 1: OVERVIEW
1.3 Order codes
GE Energy Aggregatorlicenses are available with different maintenance plans.
Maintenance, in this case, refers to automated updates of the GE Energy Aggregator software.
1.4 Contact us
For product support, contact the information and call center as follows:
GE Grid Solutions
650 Markland Street
Markham, Ontario
Canada L6C 0M1
Worldwide telephone: +1 905 927 7070
Europe/Middle East/Africa telephone: +34 94 485 88 54
North America toll-free: 1 800 547 8629
Fax: +1 905 927 5098
Worldwide e-mail: [email protected] e-mail: [email protected]
Website: http://www.gegridsolutions.com/multilin
� * DescriptionPLSOFT � EAG1M GE Energy Aggregator License with 1 year of maintenancePLSOFT � EAG5M GE Energy Aggregator License with 5 years of maintenance
GE ENERGY AGGREGATOR – INSTRUCTION MANUAL 1–3

CHAPTER 1: OVERVIEW CONTACT US
1–4 GE ENERGY AGGREGATOR – INSTRUCTION MANUAL

GE Energy Aggregator
Chapter 2: Installation
GEGrid Solutions
Installation
2.1 Installing the GE Energy Aggregator Application
GE Energy Aggregator software can be run either as a standalone program (the databases are stored on the computer that is running the application) or in a Client/Server format (the databases are stored on the Server and the application is run on the Client PCs). See your System Administrator for the setup you will be using.
IMPORTANT: The GE Energy Aggregator application utilizes the GE MeterManager automation component, which is installed as part of the GE Communicator (4.0 or higher) application. A licensed version of the GE Communicator 4.0 software must be installed on the PC that will function as the Server. The shareware (demo) version does not have the GE MeterManager automation component and will not work.
NOTE
Note The licensed copy of the GE Communicator application only needs to be on the Server, not the Clients, for the GE MeterManager application to operate. However, some extended features such as custom meter addresses do require a GE Communicator application license to be installed on the Client PCs.
NOTE
Note The GE MeterManager application should be configured to download log data only from the Server, not from the Clients. The Clients will read the data from the Server PC.
GE Energy Aggregator must be run on a computer with and one of the following operating systems:
• Microsoft Windows® Server 2008
• Microsoft Windows® Server 2012
• Microsoft Windows® 7 Professional Operating System
• Microsoft Windows® 8/8.1 Professional Operating System
• Microsoft Windows® 10 Professional Operating System
GE ENERGY AGGREGATOR – INSTRUCTION MANUAL 2–1

CHAPTER 2: INSTALLATION INSTALLING THE GE ENERGY AGGREGATOR APPLICATION
Refer to the following diagram for a graphical representation of the way the software modules work together
2.1.1 Important Installation Requirements
This section gives the system resource requirements for full usage of the GE MeterManager and GE Energy Aggregator applications installed and run together, on a single computer. Recommendations for optimum usage are given. The GE MeterManager application is installed as part of the Professional version of the GE Communicator software. It centralizes, groups, and provides easy access to all meters, automatically. It also acts as an App launcher, allowing a user to view data in real time, to view stored data, and to launch other GE applications, as needed. It specifically allows for automation of the log downloads which GE Energy Aggregator needs for usage reporting and billing.
Storage: The storage requirements for running and storing meter data and reports depends on a number of factors. The majority of these factors are affected by the number of meters in the system. Items that are stored consist of:
• Reports
• Meter Log Databases
• Retrieval Logs
• GE Energy Aggregator Databases
• Internal Logs
GE Communicator 4.0
Database Application
Network
Meters
Network
GE MeterManager
Automated Data Collection and Meter Management
GE Energy Aggregator Settings Editor
GE Energy Aggregator System Server includes Dashboard Viewer
Client PC
GE Energy Aggregator(Dashboard Viewer only)
GE Communicator 4.0
2–2 GE ENERGY AGGREGATOR – INSTRUCTION MANUAL

INSTALLING THE GE ENERGY AGGREGATOR APPLICATION CHAPTER 2: INSTALLATION
Storage requirements are given in the following table.
System: The amount of system resources needed for running the various components of the system depends both on the specific configuration of the system and on how it is being used. The majority of system usage occurs during log retrieval, importing data into GE Energy Aggregator, and generating reports. The different usage loads are as follows:
• Idle
• Viewing: Each GE MeterManager Monitor, GE Energy Aggregator Settings Editor, and GE Energy Aggregator Dashboard Viewer that is open, puts a load on the system, due to the functions of reading data from the database and refreshing the UI. The primary system usage is by the CPU, and it is caused by refreshing the UI. These open components (monitor, editor, dashboard) also occur in parallel, so their usage can result in cumulative loads on the system.
• Retrieval: Retrieval of meter logs involves downloading the meter data and converting it to a local file database. This occurs at the retrieval interval specified by the user. These functions also occur in parallel, so they can result in cumulative loads on the system. A large amount of disk usage occurs while the log databases are converted and data is being written to the local database files.
• Importing: Meter logs are checked every hour for new data to be imported into the GE Energy Aggregator database. If there is no new data, only regular viewing usage occurs. When new data is found, the peak load of Importing occurs. While importing, a large amount of network and disk usage occurs while the new data is written to the database.
• Reporting: Reports are checked every 12 hours. While checking, only regular viewing usage occurs. Once a month, multiple reports are generated for the various GE Energy Aggregator locations. At this time, the peak load of Reporting occurs. While generating reports, a large amount of disk usage occurs while data that needs to go into the reports is read from the database.
Years
Meters Locations 1/12 1 5
10 1 23 MB 273 MB 1,365 MB
10 10 24 MB 282 MB 1,412 MB
100 10 195 MB 2,345 MB 11,727 MB
100 50 199 MB 2,387 MB 11,934 MB
100 100 203 MB 2,439 MB 12,193 MB
500 10 960 MB 11,515 MB 57,574 MB
500 100 967 MB 11,608 MB 58,040 MB
500 500 1,002 MB 12,023 MB 60,113 MB
1000 10 1,915 MB 22,977 MB 114,883 MB
1000 200 1,931 MB 23,173 MB 115,867 MB
1000 1000 2,000 MB 24,002 MB 120,012 MB
2000 50 3,828 MB 45,941 MB 229,707 MB
2000 200 3,841 MB 46,097 MB 230,484 MB
2000 2000 3,997 MB 47,962 MB 239,810 MB
GE ENERGY AGGREGATOR – INSTRUCTION MANUAL 2–3

CHAPTER 2: INSTALLATION INSTALLING THE GE ENERGY AGGREGATOR APPLICATION
System requirements are given in the following table. The usage requirements that are shown should be considered the Peak usage (the highest values seen on a normal basis).
• CPU: The CPU usage is given as a percent across the entire system, and can vary based on the number of threads (which determine how the CPU handles multiple software processes). For example, with 10 viewers, there are 11 softwares running, resulting in a cumulative usage of 400%. If there are 16 threading contexts, then each will only see a usage peak of 40% (with 5 contexts free for other tasks). However, if only 4 threading contexts are available, each will be loaded with 100% usage. See the Recommendations section, which follows.
• Usage overflow: RAM, CPU, and Disk rely on each other, and overflowing one can lead to increased usage on the others. The numbers given above are dependent on enough free usage/space to accommodate the given tasks.
• Other System Usage: If there are any other tasks running on the system at the same time (such as other applications), these can take system resources away from GE MeterManager and GE Energy Aggregator, which will cause all tasks to run more slowly.
Recommendations: The following table gives the recommendations for optimal performance. The Dedicated column is the amount that should be reserved for the GE MeterManager/GE Energy Aggregator system for optimal performance. The Overall System column gives the recommendations for the average, single user system. A multiuser system should allocate more resources.
• Disk Space: The system uses about 26 MB per year, per meter. 320 GB dedicated disk space will allow for 2000 meters for 5 years. See the previous Requirements chart.
• CPU: As multi-threaded systems, GE MeterManager and GE Energy Aggregator can benefit from multiple CPU cores and threading contexts. It is recommended that the CPU have at least 4 cores and 8 threading contexts (for example, the Intel I7 processor).
• Disk Throughput: The greatest load on the system is reading from and writing to the databases on the disk. Because the entire system relies on reading from and writing to the disk, a slow disk will cause the entire system to run slowly. Under peak load, 50
Peak
idle viewing (per user)
viewing (10 users)
retrieval (per meter)
retrieval (10 meters)
importing reporting
RAM 50 MB 140 MB 1000 MB 60 MB 600 MB 150 MB 500 MB
CPU (one thread)
0.24% 40% 400% 100% 1000% 150% 100%
Disk 2 kB/s 40 kB/s 400 kB/s 3,000 kB/s 30,000 kB/s 7,500 kB/s 3,000 kB/s
Recommendation
Dedicated Overall system
Disk Space 320 GB 1 TB
CPU 4 core, 3 GHz
RAM 8 GB 16 GB
Disk Throughput 50 MB/s 200 MB/s
2–4 GE ENERGY AGGREGATOR – INSTRUCTION MANUAL

INSTALLING THE GE ENERGY AGGREGATOR APPLICATION CHAPTER 2: INSTALLATION
MB/s can be read/written to the disk, so it is recommended that a High Performance Hard-Drive, such as a Solid State Drive, be used for database storage.
• Dedicated System: The Meter Log Retrieval and Report Generation components of the software have heavy usage requirements when running. For an optimal system, it is recommended that GE MeterManager be run on a dedicated server, reserved solely for that purpose.
2.1.2 Installation Procedure
1. Insert the GE Energy Aggregator application’s CD into your PC's CD drive. You will see the following screen in your web browser.
GE ENERGY AGGREGATOR – INSTRUCTION MANUAL 2–5
CHAPTER 2: INSTALLATION INSTALLING THE GE ENERGY AGGREGATOR APPLICATION
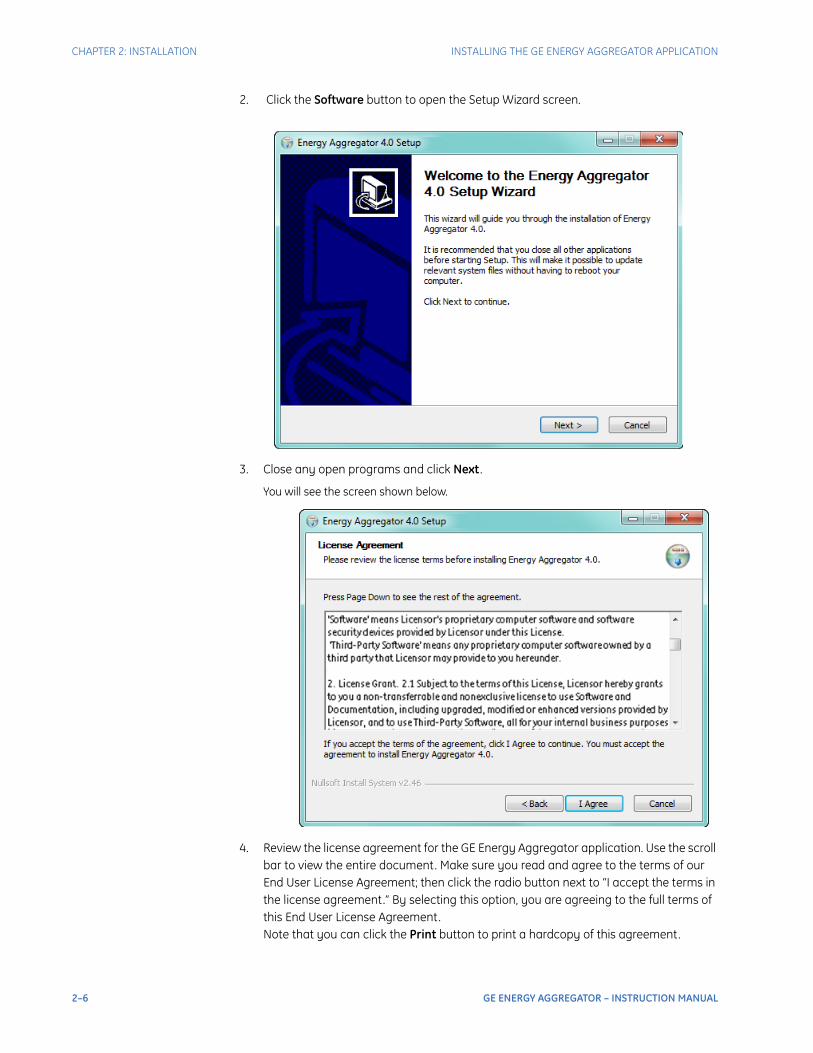
2. Click the Software button to open the Setup Wizard screen.
3. Close any open programs and click Next .
You will see the screen shown below.
4. Review the license agreement for the GE Energy Aggregator application. Use the scroll bar to view the entire document. Make sure you read and agree to the terms of our End User License Agreement; then click the radio button next to “I accept the terms in the license agreement.” By selecting this option, you are agreeing to the full terms of this End User License Agreement. Note that you can click the Print button to print a hardcopy of this agreement.
2–6 GE ENERGY AGGREGATOR – INSTRUCTION MANUAL

INSTALLING THE GE ENERGY AGGREGATOR APPLICATION CHAPTER 2: INSTALLATION
5. Click Next . You will see the screen shown below.
6. Click Install. You will see the screen shown below as the software is being installed.
GE ENERGY AGGREGATOR – INSTRUCTION MANUAL 2–7

CHAPTER 2: INSTALLATION INSTALLING THE GE ENERGY AGGREGATOR APPLICATION
7. When the application has been installed, you will see the screen shown below.
8. Click Finish to close the Setup Wizard. NOTE: You can open a Notepad file with the installation details by selecting the checkbox next to “Show the Windows Installer log.” The file will open after you click Finish.
9. To run the application, select it from the Start menu: Start > All Programs > GE Applications > Energy Aggregator > Energy Aggregator Viewer or Energy Aggregator Settings Editor.
2–8 GE ENERGY AGGREGATOR – INSTRUCTION MANUAL
ENTER A SOFTWARE LICENSE KEY CHAPTER 2: INSTALLATION
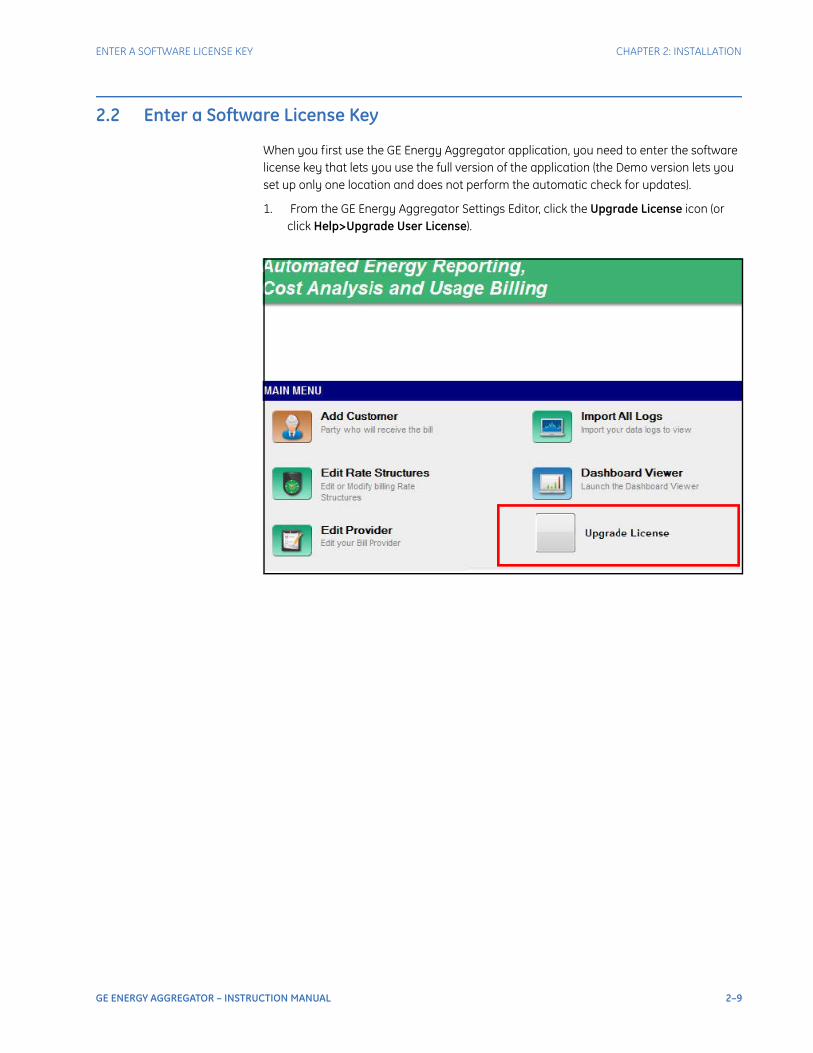
2.2 Enter a Software License Key
When you first use the GE Energy Aggregator application, you need to enter the software license key that lets you use the full version of the application (the Demo version lets you set up only one location and does not perform the automatic check for updates).
1. From the GE Energy Aggregator Settings Editor, click the Upgrade License icon (or click Help>Upgrade User License).
GE ENERGY AGGREGATOR – INSTRUCTION MANUAL 2–9

CHAPTER 2: INSTALLATION ENTER A SOFTWARE LICENSE KEY
This window opens.
2. Enter the software license key and click the Upgrade button. The software will be upgraded to the full version of the application.
Enter license key here and click Upgrade
2–10 GE ENERGY AGGREGATOR – INSTRUCTION MANUAL

STEPS FOR USING THE GE ENERGY AGGREGATOR APPLICATION CHAPTER 2: INSTALLATION
2.3 Steps for Using the GE Energy Aggregator Application
As mentioned at the beginning of this chapter, the GE Energy Aggregator application generates bills using either GE Communicator log databases
You already performed Step 1 in this chapter. You need to perform the following steps in order to set up the database files to be used for Energy and other commodity logging, and to use the GE Energy Aggregator application to generate usage reports and bills:
Step 2 - Use the GE MeterManager application to set up your meters for automatic log retrieval. See Chapter 3 “Using GE MeterManager to automate GE Energy Aggregator”; additional information is located in chapters 16 and 18 of the GE Communicator Instruction Manual.
Step 3 - The GE EPM meters are already set up for Energy logging - there is nothing additional you need to do. If you need to make any changes, you use the GE Communicator application to configure your meter(s) to log the values you want to use for Energy, other commodity logging, and/or demand. See Chapter 4 “Setting up Logging”.
Step 4 - Configure the GE Energy Aggregator application settings: provider, customer, customer locations, rate structures, meters at location. See Chapter 5 “Configuring Application Settings”.
Step 5 - Use the GE Energy Aggregator Dashboard Viewer: use the Usage Dashboard to compare usage data for different time frames/meters/dates and compared to weather data; generate and view usage reports and bills. See Chapter 6 “GE Energy Aggregator Dashboard Viewer”.
Manage your data. See Chapter 7 “Managing Data”.
View the Action log, test the application, and learn additional tips and advanced options. See Chapter 8 “Additional Features and Advanced Functions”.
GE ENERGY AGGREGATOR – INSTRUCTION MANUAL 2–11

CHAPTER 2: INSTALLATION STEPS FOR USING THE GE ENERGY AGGREGATOR APPLICATION
2–12 GE ENERGY AGGREGATOR – INSTRUCTION MANUAL

GE Energy Aggregator
Chapter 3: Using GE MeterManager to automate GE Energy Aggregator
GEGrid Solutions
Using GE MeterManager to automate GE Energy Aggregator
You use the GE MeterManager application to organize your meters and to set up automatic log retrieval, both of which make the GE Energy Aggregator application very simple to use.
• The GE MeterManager application lets you automatically add all of your network meters to its Meter List. The Meter List is an essential feature for the GE Energy Aggregator application. All you have to do to set up your billing locations is to add meters to it from the Meter List. All of the meter data you need is then automatically brought into the GE Energy Aggregator application.
• The GE MeterManager application lets you set up automatic log retrieval for all of your meters.
NOTE: The basic steps are described here, but there are other features of the GE MeterManager application, which are covered in the GE Communicator Instruction Manual.
There are two ways to add meters into the Meter List:
1. Auto Discovery - this is the simplest method. In this mode the software searches out and locates any meters on the network. Once the meters are found, they are automatically added to groups (based on the meter type), and the software automatically begins to download stored meter data.
2. Manual Connect - in this mode, you manually connect to the meter using its IP address. Once the address is entered, the software adds it to a group (based on the meter type), and automatically begins to collect stored meter data for that meter.
GE ENERGY AGGREGATOR – INSTRUCTION MANUAL 3–1
CHAPTER 3: USING GE METERMANAGER TO AUTOMATE GE ENERGY AGGREGATOR ADD METERS TO THE METER LIST USING AUTO DISCOVERY
3.1 Add Meters to the Meter List Using Auto Discovery
There are two methods to configure Auto Discovery. Use whichever one best suits your needs.
• Auto Scan - searches an IP range you enter for network meters and adds them to the Meter List.
• Meter Discovery Configuration - gives you access to additional settings for customizing scanning for meters. See Chapter 18 in the GE Communicator Instruction Manual for instructions for using Meter Discovery Configuration.
When you use Auto Scan, the application looks for and adds Network meters in the IP address range you enter. You have the option of putting the meters into groups based on meter model.
NOTE: The first time you start the MeterManager Monitor after installation, you are asked if you want to enable Auto Scan. GE recommends that you do enable Auto Scan.
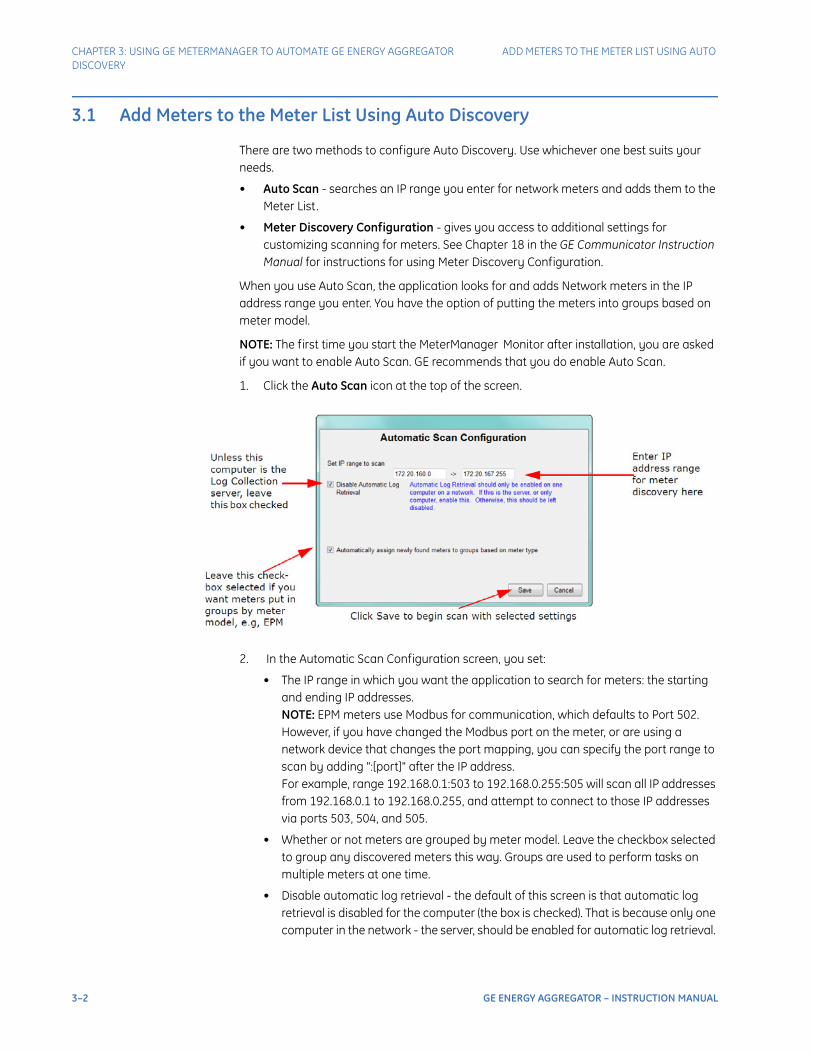
1. Click the Auto Scan icon at the top of the screen.
2. In the Automatic Scan Configuration screen, you set:
• The IP range in which you want the application to search for meters: the starting and ending IP addresses. NOTE: EPM meters use Modbus for communication, which defaults to Port 502. However, if you have changed the Modbus port on the meter, or are using a network device that changes the port mapping, you can specify the port range to scan by adding ":[port]" after the IP address. For example, range 192.168.0.1:503 to 192.168.0.255:505 will scan all IP addresses from 192.168.0.1 to 192.168.0.255, and attempt to connect to those IP addresses via ports 503, 504, and 505.
• Whether or not meters are grouped by meter model. Leave the checkbox selected to group any discovered meters this way. Groups are used to perform tasks on multiple meters at one time.
• Disable automatic log retrieval - the default of this screen is that automatic log retrieval is disabled for the computer (the box is checked). That is because only one computer in the network - the server, should be enabled for automatic log retrieval.
3–2 GE ENERGY AGGREGATOR – INSTRUCTION MANUAL

ADD METERS TO THE METER LIST USING AUTO DISCOVERY CHAPTER 3: USING GE METERMANAGER TO AUTOMATE GE ENERGY AGGREGATOR
• If this computer is not the Log Collection server, leave the box checked.
• If this computer is the Log Collection server, click on the box to uncheck it - the screen will change as shown below.
Now that you have enabled automatic log retrieval for the computer, you can set the log retrieval interval. The default is every 12 hours, which is the recommended setting. If you want to change the interval, click the Configure button and then enter the new interval. See the example screen on the next page.
Changing Log Retrieval Interval screen
GE ENERGY AGGREGATOR – INSTRUCTION MANUAL 3–3

CHAPTER 3: USING GE METERMANAGER TO AUTOMATE GE ENERGY AGGREGATOR ADD METERS TO THE METER LIST USING AUTO DISCOVERY
• Click Save to begin the automatic scan for meters with these settings. In the Searching IP Address field of the Status section, the Meter List screen will show the IP addresses as the application searches for meters. When searching is complete, the discovered meters will be shown in the Meters List (see below).
Figure 3-1: Meter list screen
3–4 GE ENERGY AGGREGATOR – INSTRUCTION MANUAL

MANUALLY CONNECT TO METER CHAPTER 3: USING GE METERMANAGER TO AUTOMATE GE ENERGY AGGREGATOR
3.2 Manually Connect to Meter
To manually connect to a meter, you enter the meter’s IP address.
Figure 3-2: Manual Meter Setup Screen
When you click Connect , the software looks for the meter, and, when found, shows the screen below.
GE ENERGY AGGREGATOR – INSTRUCTION MANUAL 3–5

CHAPTER 3: USING GE METERMANAGER TO AUTOMATE GE ENERGY AGGREGATOR MANUALLY CONNECT TO METER
e
This screen shows meter connection information. Click Connect to add the meter to the Meter List. You set the interval for log retrieval for a manually connected meter by clicking Configure Scripts from either the left side or top of the Meter List screen.
The default interval for log retrieval is every 12 hours. This means that you will receive data from all the meters in this group every 12 hours. If you need the data faster than that, it can be collected as often as every hour.
NOTE
Note The smaller the interval between log retrievals, the more load is placed on the network.
2. Click Configur to open the Interval setting screen
3. This screen is the same as shown on page 3-3: see instructions there
1. Select the group the meter is in
4. Click Apply
5. Click Save to implement change
3–6 GE ENERGY AGGREGATOR – INSTRUCTION MANUAL
LOG RETRIEVAL THROUGH GE METERMANAGER CHAPTER 3: USING GE METERMANAGER TO AUTOMATE GE ENERGY AGGREGATOR
Mete on t ers
allyed
EamG(a
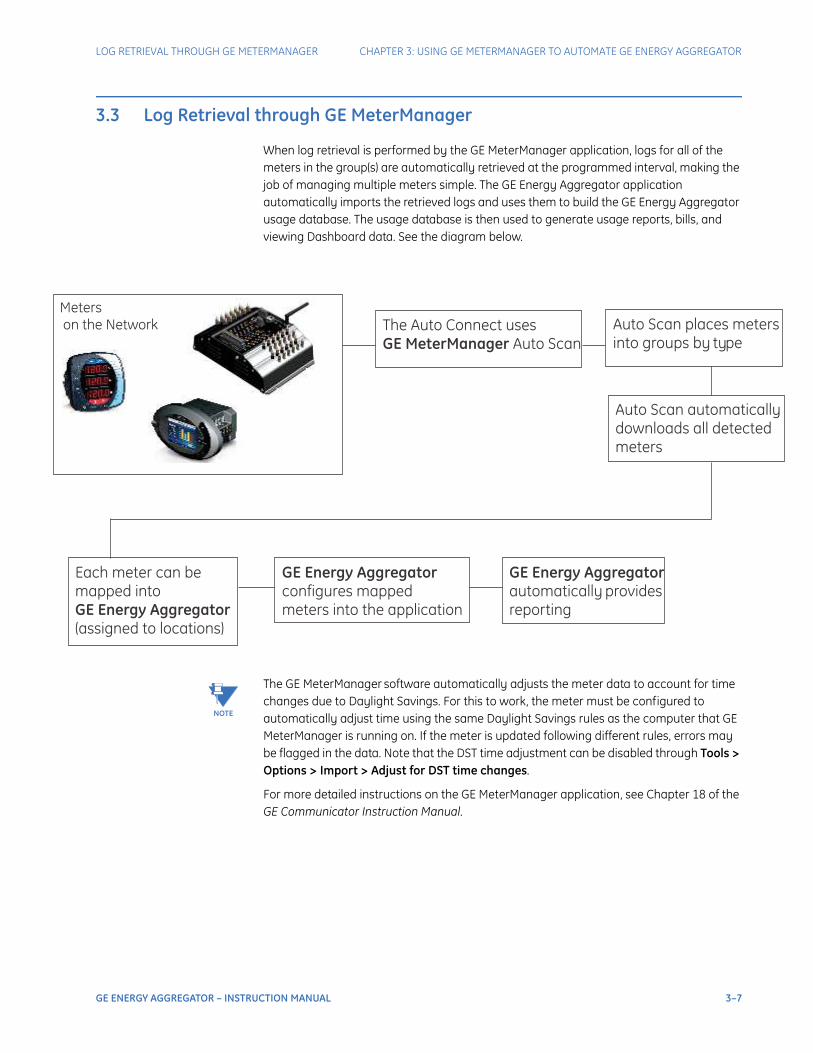
3.3 Log Retrieval through GE MeterManager
When log retrieval is performed by the GE MeterManager application, logs for all of the meters in the group(s) are automatically retrieved at the programmed interval, making the job of managing multiple meters simple. The GE Energy Aggregator application automatically imports the retrieved logs and uses them to build the GE Energy Aggregator usage database. The usage database is then used to generate usage reports, bills, and viewing Dashboard data. See the diagram below.
NOTE
Note The GE MeterManager software automatically adjusts the meter data to account for time changes due to Daylight Savings. For this to work, the meter must be configured to automatically adjust time using the same Daylight Savings rules as the computer that GE MeterManager is running on. If the meter is updated following different rules, errors may be flagged in the data. Note that the DST time adjustment can be disabled through Tools > Options > Import > Adjust for DST time changes.
For more detailed instructions on the GE MeterManager application, see Chapter 18 of the GE Communicator Instruction Manual.
rshe Network The Auto Connect uses
GE MeterManager Auto ScanAuto Scan places metinto groups by type
Auto Scan automaticdownloads all detectmeters
ch meter can beapped intoE Energy Aggregatorssigned to locations)
GE Energy Aggregatorconfigures mappedmeters into the application
GE Energy Aggregatorautomatically providesreporting
GE ENERGY AGGREGATOR – INSTRUCTION MANUAL 3–7

CHAPTER 3: USING GE METERMANAGER TO AUTOMATE GE ENERGY AGGREGATOR LOG RETRIEVAL THROUGH GE METERMANAGER
3–8 GE ENERGY AGGREGATOR – INSTRUCTION MANUAL

GE Energy Aggregator
Chapter 4: Setting up Logging
GEGrid Solutions
Setting up Logging
In most cases, there is no need to do anything special to set up logging for the GE Energy Aggregator database. This is because all EPM meters ship with a default Device Profile that logs energy values. As long as you haven’t changed this, the automatic log retrieval set for the meters using GE MeterManager will get all the data that the GE Energy Aggregator application needs in order to generate usage reports.
NOTE
Note If you wish to include the demand computed by the meter in the bill, then add the Demand channel to the historical log configuration. This allows the GE Energy Aggregator application to import the meter's demand values to use in the bill.
If you need to add Demand, or make any other changes to Energy, Energy in the Interval, and other Commodity logging, use the meter’s Device Profile, accessed through the GE Communicator software.
NOTE
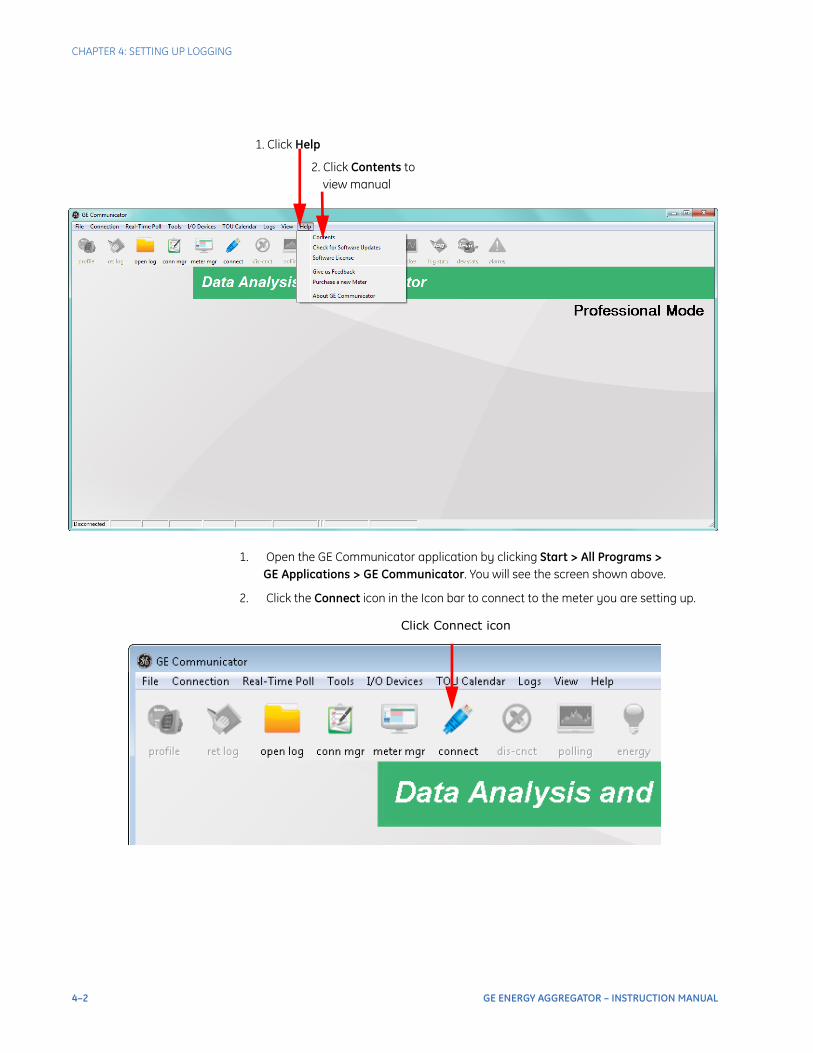
Note Only the basic steps are given here. For more detailed information, consult the GE Communicator Instruction Manual (you can access the manual online by clicking Help > Contents in the GE Communicator Menu Bar).
GE ENERGY AGGREGATOR – INSTRUCTION MANUAL 4–1
CHAPTER 4: SETTING UP LOGGING
1. Open the GE Communicator application by clicking Start > All Programs > GE Applications > GE Communicator. You will see the screen shown above.
2. Click the Connect icon in the Icon bar to connect to the meter you are setting up.
1. Click Help
2. Click Contents to view manual
Click Connect icon
4–2 GE ENERGY AGGREGATOR – INSTRUCTION MANUAL

CHAPTER 4: SETTING UP LOGGING
See the example screen below.
1. Enter Device Address2. Enter Device’s IP Address
3. Click Connect
GE ENERGY AGGREGATOR – INSTRUCTION MANUAL 4–3

CHAPTER 4: SETTING UP LOGGING
3. From the GE Communicator main screen, click the Profile icon.
The Device Profile screen for the meter opens. See the example screen, shown below.
Figure 4-1: EPM 7000 Meter Device Profile Screen
4. For EPM 7000 meters and EPM 4600 meters click the + sign next to Trending Profiles; for other EPM meters, click the + sign next to Trending Profile Settings and then the + sign next to Trending Setup. You will see a list of historical (trending) logs.
Double-click on the log you want to use to trend energy or other usage. You will see a screen that lets you select the values you want to log. Refer to the table below for the values to select for energy logging.
4–4 GE ENERGY AGGREGATOR – INSTRUCTION MANUAL

CHAPTER 4: SETTING UP LOGGING
NOTE
Note For the EPM 4600 metering system there is only one historical log for use with the GE Energy Aggregator application - either historical log 2 for the EPM 4600-T three phase configuration or historical log 3 for the EPM 4600-S single phase configuration. The log is pre-configured with the data points you need for logging.
Table 4–1: Table of Settings for Logging Energy, Energy in the Interval, and Commodity
See the GE Communicator Instruction Manual for detailed instructions.
Meter Group/Sub-group Data Point
Energy Interval Energy Commodity Energy Interval Energy Commodity
EPM 7000EPM 7100
Energy Energy in the Interval
Accumulators Watt-hours Received
Watt-hours Received
Input used for accumulation
EPM 9450/9460EPM 9900
Accumulators / Energy/Scaled Primary
Interval Accumulators / Energy/ Scaled Primary
Internal Pulse Accumulation /Aggregations
Quadrant 1+4 Wh
Quadrant 1+4 Wh
Input used for accumulation
EPM 4600 Pre-configured in Log 2 (EPM 4600-T) or Log 3 (EPM 4600-S)
GE ENERGY AGGREGATOR – INSTRUCTION MANUAL 4–5

CHAPTER 4: SETTING UP LOGGING
4–6 GE ENERGY AGGREGATOR – INSTRUCTION MANUAL

GE Energy Aggregator
Chapter 5: Configuring Application Settings
GEGrid Solutions
Configuring Application Settings
NoteUse the GE Energy Aggregator Editor to set up the information you need to generate usage data, bills and usage reports.
When you start the GE Energy Aggregator Settings Editor you see the main screen.
NOTE
If the GE MeterManager application is running (downloading meter logs), you will see “Script Service Running” at the bottom right of the screen. Click on the message to either pause the MeterManager service, or open the MeterManager Monitor. See Chapter 18 of the GE Communicator Instruction Manual for additional information.
Follow these basic steps to set up the GE Energy Aggregator application:
1. Set up provider information.
The provider is the person or organization which is providing the energy, sending the bill, and receiving payments. This information appears on the generated bills, so that the customer knows where to send payment.
See Set Up a Provider on page 5–4
GE ENERGY AGGREGATOR – INSTRUCTION MANUAL 5–1

CHAPTER 5: CONFIGURING APPLICATION SETTINGS
2. Set up rate structures.
The rate structure is the collection of settings that determine what rates to apply to the usage values for a commodity, e.g., kWh. The rate structure includes On Peak and Off Peak settings, holidays, and other charges, such as taxes.
See Set Up Rate Structures on page 5–14
3. Set up a customer.
A customer is the person or organization which is receiving the bill. A customer may have multiple locations, each of which will get its own bill.
See Set Up a Customer on page 5–38
4. Set up the customer’s locations.
A billing location is a single unit for which a bill is generated, e.g., a building. A customer can have multiple locations.
See Set Up a Location and Add Meters to It on page 5–40
5. Assign the meters and a rate structure to the customer’s locations.
See Adding a Meter Manually on page 5–50
Each location can have multiple meters and a rate structure for each commodity being billed for, e.g., Energy and gas.
A meter billing point can also be an aggregate of more than one metering point; this is called a virtual meter. For example:
• Meter A + Meter B
• Meter A + 50% of Meter B
• Meter A - Meter B
• Meter A - 50% of Meter B
• Etc.
With virtual meters a user can configure meters to accurately represent the load, by apportioning the correct amount of energy per meter for the actual circuit usage.
For example, if your customer owns three apartment buildings, you would set up each building as a location, and enter all of the meters in a building as well as any rate structures applied to usage for that building. See the diagram on the next page.
5–2 GE ENERGY AGGREGATOR – INSTRUCTION MANUAL
CHAPTER 5: CONFIGURING APPLICATION SETTINGS
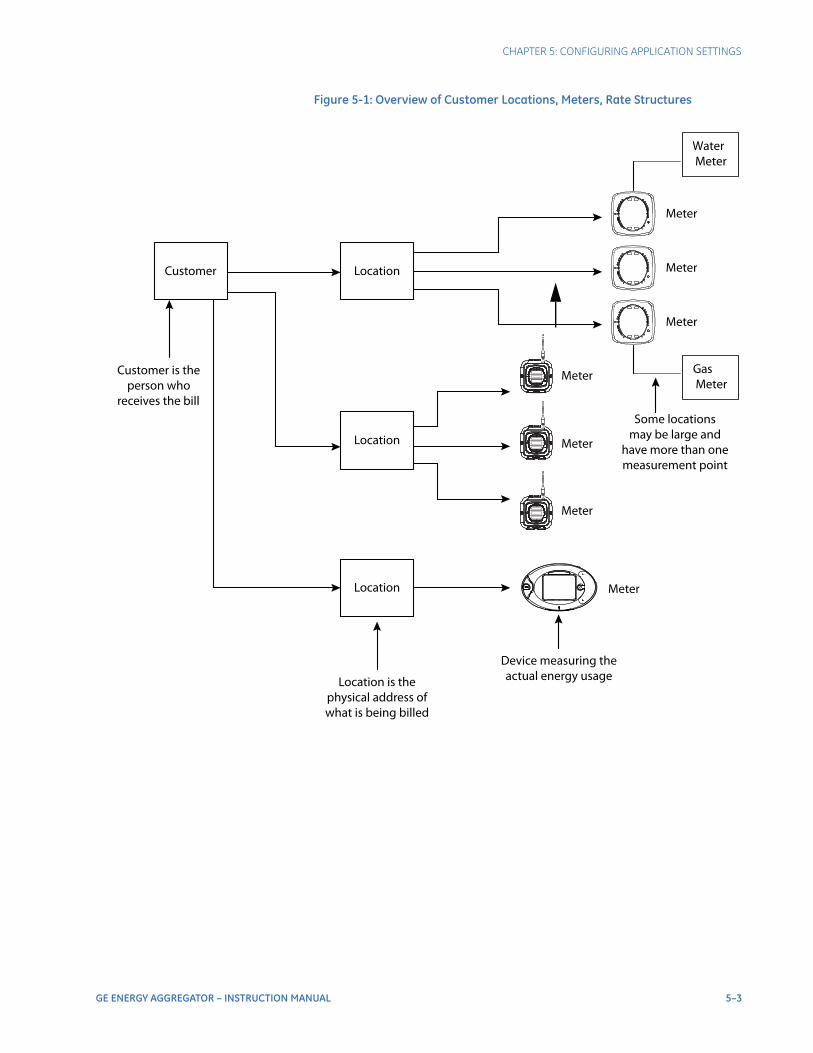
Figure 5-1: Overview of Customer Locations, Meters, Rate Structures
LocationCustomer
Customer is the person who
receives the b llSome locations
may be large andhave more than onemeasurement point
Location is thephysical address ofwhat is being billed
Device measuring theactual energy usage
Location
Meter
Meter
Meter
Meter
Meter
Meter
Meter
Location
Water Meter
Gas Meter
GE ENERGY AGGREGATOR – INSTRUCTION MANUAL 5–3

CHAPTER 5: CONFIGURING APPLICATION SETTINGS SET UP A PROVIDER
5.1 Set Up a Provider
First set up the provider information. The provider is the person who is sending the bill to the customer. The provider will get paid for providing the electricity or other commodity to the customer; the customer is the user of the commodity.
1. From the GE Energy Aggregator Settings Editor main screen, click the Configure Provider Information icon.
2. For the provider, enter:
• Name
• Telephone
• Address
• Payment Address - the address where payment should be sent
• Provider Logo:
Click Select to choose a company logo for the bill.
NOTE
Note The image must be 256x128 pixels in size. If it is not, the image will be scaled by the application, which may result in the image not looking the way you want.
5–4 GE ENERGY AGGREGATOR – INSTRUCTION MANUAL

SET UP A PROVIDER CHAPTER 5: CONFIGURING APPLICATION SETTINGS
• Email Server Settings:
Click Configure next to Email Server Settings to open the screen below.
The settings on this screen are used by the software when it automatically emails bills and enabled reports to customers. The automatic Bill Report and Usage Report email feature lets you generate hundreds of automated bills or energy reports. You can configure the system to send out bills to users automatically on a monthly basis. This feature provides you with an automated accounting service and eliminates any need for third party billing providers. You receive feedback of successful transmission for accounting purposes and can set up a cc address so that you receive a copy of the bill or usage report.
Enter the following:
• From Email: enter the name that will appear in the emails’ From field.
NOTE
Note When the checkbox next to “Send copy of emails to provider” is selected (checked), a copy of any bill or report email sent to a customer is sent to the From email address.
• Host Settings: enter the email’s Host Name, Port, and User name and Password if being used.
• SSL checkbox: this box needs to be checked if the email server you are using requires SSL security. See the examples below for setting up email.
GE ENERGY AGGREGATOR – INSTRUCTION MANUAL 5–5

CHAPTER 5: CONFIGURING APPLICATION SETTINGS SET UP A PROVIDER
• Send Settings: enter the number of email retries in sending and the Retry Timeout in milliseconds (the default is 1000ms). If you want to disable the Retry Timeout, enter 0 in this field.
• Click OK to close this screen. You will see the Provider Information screen.
Email Server Setting Examples: - Yahoo Host:smtp.mail.yahoo.com Port:587 User:Yahoo Account E-Mail Address Password: Yahoo Account Password SSL:Check SSL Is Required -Gmail Host:smtp.gmail.com Port:587 User:GMail Account E-Mail Address Password: GMail Account Password SSL:Check SSL Is Required Note that for Gmail, you also need to enable the setting "Allow access from less secure apps,” which is accessed from Gmail Account settings.
• Report Settings:
Click Configure next to Report Settings to open the screen below.
This screen lets you set up emails, bills, and custom reports to be sent to the customer.
5–6 GE ENERGY AGGREGATOR – INSTRUCTION MANUAL

SET UP A PROVIDER CHAPTER 5: CONFIGURING APPLICATION SETTINGS
a. Click Configure next to Email Report Settings to set up automatic emailing of bills and/or usage reports. The screen below opens.
- Select Bill Report or Usage Report from the pull-down menu.
- Click the Enable checkbox to set the report to be emailed automatically.
- Enter a Subject line and Body text that will appear in the email.
- Click OK to save the settings. The screen closes.
NOTE
Note If you want to send both Bill Report and Usage Report, repeat this process.
GE ENERGY AGGREGATOR – INSTRUCTION MANUAL 5–7

CHAPTER 5: CONFIGURING APPLICATION SETTINGS SET UP A PROVIDER
b. Click the Bill Settings tab to enter additional, optional information for the bill.
• If you wish, click the checkbox next to Display Due Period in Bill and select the Due Period, i.e., the number of days from the bill’s origination date until the due date.
• You can set the usage display precision from the pull-down menu. This is the number of digits to display for the energy usage reported on the bill. For example, if the meter measures 173.567 kWh in a month, and the precision is 0, then 173 will be displayed. If the precision is 2, then 173.56 will be displayed. Setting the precision higher allows the user to see the precise value of their usage. Note that this setting is only used for display. Internally, the full usage value is used for calculations.
• You have the option of entering text that you want to be printed on the bill. If you want to do so, click the checkbox next to Enable Bill Notes and enter the text you want printed on the bill in the Notes field.
c. The GE Energy Aggregator application gives you the ability to create custom CSV (comma separated values) usage reports of meters and locations. You can then send these reports to customers, import them into external energy or costing software applications, or use them for further analysis.
• Once a custom usage report is generated, it can be automatically sent via email.
• The report is also saved in the following directory: C:\Users\Public\Public Documents\GE Applications\Energy Aggregator\ Reports\Custom Usage Note that this path is configurable - see “Path Setting” on page 8-15, for
5–8 GE ENERGY AGGREGATOR – INSTRUCTION MANUAL

SET UP A PROVIDER CHAPTER 5: CONFIGURING APPLICATION SETTINGS
Default and NewReports
plus t
Click todelete
the selectereport
Click toadd areport
instructions on configuring the path.
• To set up a custom report, click the Custom Usage Report tab.
Any reports already created are shown in the Report Templates box on the left side of the screen. There is a default custom report already available for use - click on it to see the fields in the default report.
Create a New Custom Usage Report
To add a new report, click on the green plus sign icon (to delete a report, click on it in the list and then click the red minus sign icon). Make the following settings:
• Report Name: Enter a name for the report in the Report Name field. This name will be used as the first part of the filename when the file is saved, followed by the report period starting date, and then the type of report, e.g, monthly. For example, Special customers.2015-10-28.Monthly for a report named Special customers, on a monthly schedule, and containing data for October 28, 2015 to November 27, 2015.
• Auto Generate: If you want the report to be automatically generated on its period schedule, click the Auto-Generate box to check it .
Name of the report currently selected in the Report Templates box
Additional settings - auto generation, report period, email settings, etc.
Click to view a preview of the report
Report Templates box - click green plus icon to add a report to the list
Report Fields - click the greenicon to add a field to the repor
Click to copythe selectedreport template
d
GE ENERGY AGGREGATOR – INSTRUCTION MANUAL 5–9

CHAPTER 5: CONFIGURING APPLICATION SETTINGS SET UP A PROVIDER
Note that you can generate the report manually at any time via the GE Energy Aggregator Dashboard Viewer - see “Generate Custom Reports” on page 6-18, for instructions.
• Location Report: The Location Report checkbox determines whether the report gives the requested information for each meter in the location (box unchecked) or for the locations as a whole (checked). You may want a more detailed report of all of the meters in a location for analysis, and you may want a report of locations as a whole to use for billing. Select whichever option is best for your needs.
• Report Period and Period Start: Select the Report Period (Daily, Weekly, Monthly, or Yearly) and Period Start (1st - 28th) from the pull-down menus. When the report is generated automatically, these fields determine both the length of the report, for example - a months’ worth of data; and when the report starts, for example on the 5th of the month. For example, if you select “Monthly” and “5,” the report will contain data from the 5th of each month to the 4th of the next month.
• Scope: The Scope setting controls which meters and locations are included in the report. Select All, Customer, or Location from the pull-down menu. - If you select All, the report will be generated with the requested data from all meters, in all locations, and from all customers. - If you select Customer, the report will be generated for all meters, in all locations for just the customer you select in the Target field. - If you select Location, the report will be generated for all meters in the location you select in the Target field.
• Target: - If you select Customer for the Scope setting, select the customer you want to print the report for, from the pull-down menu. - If you select Location for the Scope setting, select the location you want to print the report for, from the pull-down menu.
• Include Virtual Aggregate Meter: The Aggregate meter is a virtual, i.e., non-physical meter, that contains the totalized readings from all of the meters at a location. If you want to include this in your report, click the Include Virtual Aggregate Meters checkbox to select it .
5–10 GE ENERGY AGGREGATOR – INSTRUCTION MANUAL

SET UP A PROVIDER CHAPTER 5: CONFIGURING APPLICATION SETTINGS
Automatically Email the Custom Usage Report
• Email To: The custom usage report can be automatically emailed to your customer and others, e.g., you, as the Provider. If you want the report to be emailed, click the Email Report box to check it . - You will see the Email To field and CC fields. - Enter the email address. - You can choose to send a copy of the email to the Provider and/or the customer, by clicking the box next to each option to check it . - When Customer is selected in the Scope field, the email will be CC’d to the email address configured in the customer’s information - see “Set Up a Customer” on page 5-38.
Set Up the Custom Usage Report Fields
• Report Fields: The Report Fields box lets you set up the actual data and report headings that will be in the report, called Custom Field and Column Header in the screen. i. Click the green plus sign icon. ii. A blank line is added in the Custom Field section.
iii. Click on the arrow in the blank line in Column Field. iV. A Field box opens. Click on the arrow in the box.
New Blank Line Click on the arrow
Click on the green plus sign icon to add a field
GE ENERGY AGGREGATOR – INSTRUCTION MANUAL 5–11

CHAPTER 5: CONFIGURING APPLICATION SETTINGS SET UP A PROVIDER
Field Box
Click on the arrow
5–12 GE ENERGY AGGREGATOR – INSTRUCTION MANUAL

SET UP A PROVIDER CHAPTER 5: CONFIGURING APPLICATION SETTINGS
r
v. The available data fields are shown in the list that is displayed - see the example screen, below. (a) Click on a field to (b) add it to the blank line in the Custom Fields section.
vi. Enter a Column Header for the field. See the example fields and headers in the screen, above. The name you enter in the column header field will be the column heading in the CSV file. - You can remove a field by clicking on its line and clicking the red minus sign icon. - The up and down arrow icons let you move a field up or down in the list, to change where it appears in the report.
• Preview: You can generate a preview of the report by clicking the Preview button. The report will be opened in Excel. This lets you see how the report will look when it is generated. Click OK to save your selections. You will be returned to the Provider Information screen.
3. Click Store to save your entries and then click Exit to close the screen.
(a)Click on a field
(b)The field is added to the report fields
Enter a column headefor the field
GE ENERGY AGGREGATOR – INSTRUCTION MANUAL 5–13

CHAPTER 5: CONFIGURING APPLICATION SETTINGS SET UP RATE STRUCTURES
5.2 Set Up Rate Structures
The next step is creating rate structures that will be applied to billed usage at locations.
• A rate structure is the way in which energy usage costing is calculated in monetary numbers. For example, if in an American jurisdiction, the rates will be set up in US dollars.
• Each utility has a different method of calculating rates for electrical usage. For this reason, the user can set up the rate structure to mimic what the utility is generally doing.
• You can set up one rate structure for each commodity at a location.
• Multiple locations can use the same rate structure.
1. From the GE Energy Aggregator Settings Editor main screen, click the Edit Rate Structures icon.
2. If you have already set up rate structures, you will see those in the box on the left. To add a new rate structure, click the Add New Rate Structure icon.
3. Select Seasonal Schedule or Flat Rate from the pull-down menu and click OK.
• Select Seasonal Schedule to set up a rate structure with different rates for different times of the day, week, and/or year. Then continue with step 4 on page 5–15.
5–14 GE ENERGY AGGREGATOR – INSTRUCTION MANUAL

SET UP RATE STRUCTURES CHAPTER 5: CONFIGURING APPLICATION SETTINGS
• Select Flat Rate to set up a rate structure with a single rate only (no On Peak/Off Peak, Seasons, Weekend/Weekday or Holiday rates). Then go to step 6 on page 5–31.
4. After selecting Seasonal Schedule, you’ll see the screen above. Use this screen to set up all of the information for this rate. Do the following:
• Enter a name for the rate structure; this name will appear on the bill.
• Select Commodity from the pull-down menu. A commodity is a usage value the software uses when computing the rates for a bill from the imported Energy or other commodity data. You can select an existing commodity, or Create New. For Energy usage, select kWh. When the bill is generated, the software uses the rate structure for the commodity, e.g., kWh, to determine the charge for the amount of usage the customer has for the billing period, e.g., total kWh. If you select Create New, you will see the screen shown below, which lets you set up a new commodity to use.
GE ENERGY AGGREGATOR – INSTRUCTION MANUAL 5–15

CHAPTER 5: CONFIGURING APPLICATION SETTINGS SET UP RATE STRUCTURES
a, Enter a name for the new commodity.
b. Select the scalar from the pull-down menu - you can select Unit (1), k(1000), M(1000000) or Custom (Infinity). If you select custom, another field opens up on the screen for you to enter the Custom Scalar value.
The scalar you select is applied to the commodity’s usage values for all of the meters. This is important because the meters themselves may have been set up with different scaling values. The scalar insures that the usage values will all be scaled the same way in the GE Energy Aggregator application.
When you are tracking usage other than Energy, a custom scalar can be used to change the unit measured. For example, if you are tracking Condensate (steam), the meter’s pulse accumulator channel, i.e., Digital Input, records the number of pulses coming from the Condensate meter which is measuring the steam directly. But you may need to convert the pulse accumulation value to MMBTUs for your billing. In this case, you would use the scalar to convert the number of pulses to the MMBTU usage value. See the following figure and example screen.
Figure 5-2: Scalar Example for Commodities Other Than Energy
Pulse Accumulation Measurement Example-This example converts measured condensate to MMBTU's
To convert condensate to MMBTU,
This value should be the value to convert 1 pulse to MMBTU.
For example, if 1 pulse = 1 kgallon of steam, and 1 gallon of steam equals 8.2345 MMBTU, then the scalar should be 0.0082345.
MeasuredSteam
Meter withPulse Output
OutputsPulses
Meter’sDigitalInput
Pulses are counted by meter
ImportLog Data
(Pulse Accumulator)
MMBTUCommodity
MMBTU Data
Pulse Values scaled from Condensate to MMBTU's
*
*
*
*
5–16 GE ENERGY AGGREGATOR – INSTRUCTION MANUAL

SET UP RATE STRUCTURES CHAPTER 5: CONFIGURING APPLICATION SETTINGS
Figure 5-3: Scalar Example for Commodities Other Than Energy
c. Click OK to save your entries and close the screen (click Cancel if you want to close the screen without saving your entries).
• The other settings for rate structure are as follows:
Seasons Setting
Some utility companies bill their customers higher rates at different times of the year. The reason for this is that it may be more costly for utilities to generate or buy electricity during peak seasons.
The Seasons setting lets you set up different rates for up to four different times of the year that you may need in your rate jurisdiction. Select the number of seasons from the pull-down menu. If you select more than one season, you will see a Seasons tab that you will use to set the seasons’ dates. You use the Rates tab to set different On-Peak and Off-Peak rates for each season, and you use the Rate Times tab to assign On-Peak and Off-Peak to different days and times of the day, for each season.
GE ENERGY AGGREGATOR – INSTRUCTION MANUAL 5–17

CHAPTER 5: CONFIGURING APPLICATION SETTINGS SET UP RATE STRUCTURES
NOTE
Note The Monthly setting for Number of Seasons allows for a different season to be applied to each month of the year. Each monthly season applies from the first of the month to the first of the next month. For example, the July season will apply from July 1st to August 1st. The Seasons tab for the Monthly setting shows all twelve seasons.
Weekdays/Weekends
A weekday is usually billed at a higher time of use rate than a weekend. For this reason, you can select what days are designated as a weekend in your jurisdiction.
Click the Weekdays tab to designate days as weekday or weekend (this is the tab view you see when the screen first opens). You use the Rates tab to set different rates for weekends and weekdays.
Holidays
A holiday is a day that is billed at a different rate than a weekday or a weekend. Typically, it is considered an off-peak time, which will be billed at a lower rate.
The GE Energy Aggregator application configures holidays based on a perpetual calendar. A perpetual calendar allows you to set up the holidays once and from then on have the software determine all the future holidays based on the rules you set up.
You can set up different Holiday rates for different seasons.
5–18 GE ENERGY AGGREGATOR – INSTRUCTION MANUAL

SET UP RATE STRUCTURES CHAPTER 5: CONFIGURING APPLICATION SETTINGS
Click the Holidays tab.
Use this screen to designate days that will use the Holiday rate. Once you setup the holidays you use the Rates tab to enter the Holiday rate.
a. Click the Add New Holiday icon.
b. Enter a name for the holiday.
c. You have these options for setting up the holiday:
• Click the radio button next to Every and select the month and day from the pull-down menus, e.g., January 1. The nearest Monday and Nearest Weekday checkboxes are used for holidays that are changed to another day of observance if they fall on a Saturday or Sunday. If the holiday will be celebrated on the following Monday if it falls on a weekend, click the Nearest Monday checkbox. If the holiday will be celebrated on the nearest weekday if it falls on the weekend (i.e., Friday if the holiday falls
GE ENERGY AGGREGATOR – INSTRUCTION MANUAL 5–19
CHAPTER 5: CONFIGURING APPLICATION SETTINGS SET UP RATE STRUCTURES
on Saturday, or Monday if it falls on Sunday), click the Nearest Weekday checkbox.
• Click the second radio button and select First, Second, Third, Fourth, Fifth, or Last from the first pull-down menu; select the day of the week from the second pull-down menu; and select the month from the third pull-down menu, e.g., The Third Thursday in November for U.S. Thanksgiving Day.
• Click the radio button next to Specific Day and click the pull-down menu to open a calendar that lets you choose the day of the holiday that only occurs once.
• Click the radio button next to Special Days to select a holiday that doesn’t follow any of the above rules, such as Easter.
d. Click OK to save the holiday and return to the Holidays tab screen.
NOTE
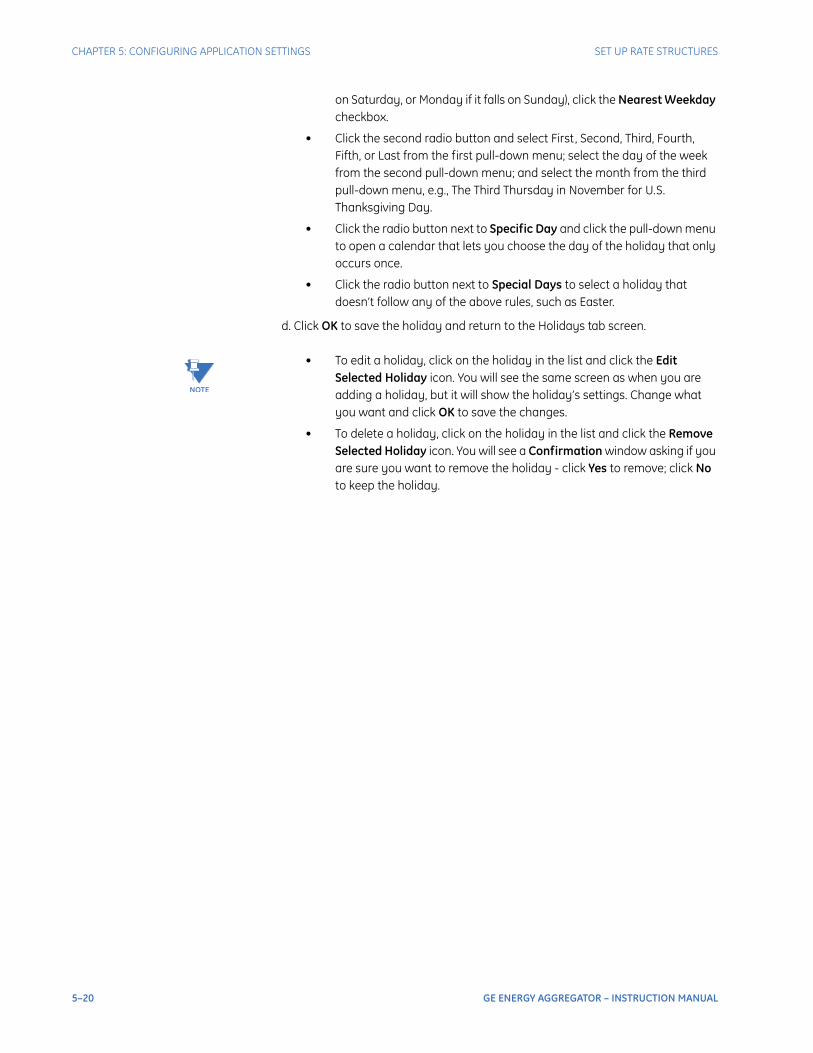
Note • To edit a holiday, click on the holiday in the list and click the Edit Selected Holiday icon. You will see the same screen as when you are adding a holiday, but it will show the holiday’s settings. Change what you want and click OK to save the changes.
• To delete a holiday, click on the holiday in the list and click the Remove Selected Holiday icon. You will see a Confirmation window asking if you are sure you want to remove the holiday - click Yes to remove; click No to keep the holiday.
5–20 GE ENERGY AGGREGATOR – INSTRUCTION MANUAL

SET UP RATE STRUCTURES CHAPTER 5: CONFIGURING APPLICATION SETTINGS
Fixed Charges
A fixed charge is a charge that is added onto the bill.
Click the Fixed Charges tab to configure single charges you want to be applied to the commodity when the bill is generated.
You can add a fixed charge, edit an existing fixed charge, or remove an existing fixed charge. You can also assign the fixed charges to any of the seasons you have set up.
GE ENERGY AGGREGATOR – INSTRUCTION MANUAL 5–21

CHAPTER 5: CONFIGURING APPLICATION SETTINGS SET UP RATE STRUCTURES
a. Click the Add Fixed Charge icon. You will see the screen shown below.
b. Select the Charge Type from the pull-down menu. You can select Fixed, Peak Demand, Flat Rate, Tax, Coincidental Peak Demand, or Tiered Rate:
• Fixed: select this to add a single charge that is added to the bill when it is generated, regardless of the usage amount, e.g., processing fee.
• Peak Demand: select this to enter a Peak Demand surcharge, which is an additional charge applied to Peak (highest amount) demand during the billing period (see step d).
• Flat Rate: select this to add a charge that applies to the total usage, e.g., a Generation charge or Fuel surcharge. This rate is multiplied by the total usage when the bill is generated.
• Tax: select this to enter a tax percentage that will be applied to the total when the bill is generated, i.e., multiplied by the total dollar amount on the bill for the commodity, and added to the bill.
• Coincidental Peak Demand: select this to compute the Peak Demand time from a meter at another location, e.g., a Utility meter. The time of the charge comes from the Utility meter, but the charge is applied to the sum of the location’s meter(s)’ usage. See the example on page 5-18.
• Tiered Rate: select Tiered rates to indicate charges that are dependent on the amount of usage during the Bill period. For example, a multiple tiered rate may be defined to encourage energy conservation by charging higher rates for customers that exceed what is considered typical consumption.
• Daily Charge: select this to add a fixed charge to the total usage, based on the number of days in the billing period. The bill charge will be the Daily Charge rate multiplied by the number of days in the billing period.
5–22 GE ENERGY AGGREGATOR – INSTRUCTION MANUAL

SET UP RATE STRUCTURES CHAPTER 5: CONFIGURING APPLICATION SETTINGS
c. For charge types Fixed, Flat Rate, and Taxed, you must enter the Charge Name, select what season(s) to apply it to from the pull-down menu, and enter the Rate (or Percentage for Tax).
d. If you select Peak Demand, the screen changes as shown below.
The charge’s name defaults to Peak Demand, though you can change it if you want. The name appears on the bill next to the Peak Demand charge.
Click to select fixed charge Click to select season(s)
Enter name Enter rate
Click OK
GE ENERGY AGGREGATOR – INSTRUCTION MANUAL 5–23

CHAPTER 5: CONFIGURING APPLICATION SETTINGS SET UP RATE STRUCTURES
e. Select the season(s) to apply the Peak Demand charge to, enter the Peak Demand rate, and click the checkbox(es) (rate periods) you want the Peak Demand rate applied to. You can apply it to Holiday, Peak and/or Seasonal Off Peak usage. The Peak Demand rate you enter will be applied to peak demand in the selected rate periods when the bill is generated, i.e. the Peak Demand usage is multiplied by the Peak Demand rate to get the Peak Demand charge.
f. Coincidental Peak Demand is a charge applied against the Peak Demand over the period of the bill, where the Peak Demand is computed based on the configured Utility meter, rather then the meters at the location.
For example: 2 locations, with 4 meters, total. Location 1 has 1 meter, which is the Utility meter that the Peak Demand is based on. The demand values for this meter are shown in the table below.
Location 2 has 3 meters. The meters’ demand values are shown in the table below.
When the Coincidental Peak Demand fixed charge is set up using the Utility meter, and this rate structure is applied to Location 2, a bill generated for Location 2 will have a Coincidental Peak Demand value of (4+3+1) 8kWh x the fixed charge rate, since the Peak Demand at meter 1 (Location 1) is at 12:15.
NOTE
Note The Utility meter can be at any location.
Time kWh Reading
12:00 15kWh
12:15 17kWh
12:30 16kWh
12:45 14kWh
Time
kWh Reading
Meter 1 Meter 2 Meter 3
12:00 7kWh 8kWh 3kWh
12:15 4kWh 3kWh 1kWh
12:30 5kWh 1kWh 8kWh
12:45 15kWh 20kWh 9kWh
5–24 GE ENERGY AGGREGATOR – INSTRUCTION MANUAL

SET UP RATE STRUCTURES CHAPTER 5: CONFIGURING APPLICATION SETTINGS
After selecting Coincidental Peak Demand, select the season(s) to apply it to, enter a Name and Rate for the Coincidental Peak Demand, and then choose the coincidental Utility meter from the pull-down menu.
g. Tiered Rate: a tiered rate gets higher (more expensive) as the amount of energy consumed increases. This rate type is typically used to encourage customers to conserve usage. You would use the Tiered Rate option to set up charges that vary depending on the amount of usage during the Bill period, charging higher rates when their usage exceeds a certain amount.
Select which season(s) to apply the Tiered Rate to, give the Tiered Rate a name, and enter the Tiers information: the highest amount of usage in the Tier (entered in the Tier field) and the rate for the Tier (entered in the Rate field).
GE ENERGY AGGREGATOR – INSTRUCTION MANUAL 5–25

CHAPTER 5: CONFIGURING APPLICATION SETTINGS SET UP RATE STRUCTURES
NOTE
Note The Tiered Rate screen’s default is Tiers 1 and 2 and an overage Tier (unnumbered.) Click the + button to add a Tier and then enter the upper usage amount and rate for the Tier. You can click the - button to remove a tier.
For example, in the screen above, Tier 1’s rate of $0.01 is applied to usage up to 1000, Tier 2’s rate of $0.02 is applied to usage from 1001 - 2000, and the overage Tier’s rate of $0.05 is applied to usage from 2001 up.
Let’s say the commodity is kWh. Since the rate is multiplied by the amount of usage to get the final charge, you can see the effect of the tiered rate charges in the following table:
h. Click OK to save your settings and return to the Fixed Charges tab screen. Your new charge is listed on the screen.
NOTE
Note • To edit a charge, click on the charge in the list and click the Edit Selected Fixed Charge icon. You will see the same screen as when you are adding a fixed charge, but it will show the charge’s settings. Change what you want and click OK to save the changes.
• To delete a charge, click on the charge in the list and click the Remove Selected Fixed Charge icon. You will see a Confirmation window asking if you are sure you want to remove the charge - click Yes to remove; click No to keep the charge.
Rates
Rates are the amount of money charged per usage commodity. For instance, with electricity, the rate is usually an amount of cents per kWh. On Peak rates often cost more than Off Peak rates. If you are not using Time of Use based rates, then set only one rate and amount. The charge per unit is in dollars and cents, so for 5 cents, enter 0.05.
Click the Rates tab to configure specific rates: by Default, On Peak, Off Peak, and Holiday rates. If you have set up seasons, you can configure rates for each season; you can also configure Holiday rates for each season. The rates will be
Customer kWh Usage Tiered Rate Surcharges
Added to Monthly Bill
#1 900 $0.01 x 900 $9.00
#2 1500 $0.01 x 1000$0.02 x 500
$20.00
#3 2500 $0.01 x 1000$0.02 x 1000$0.05 x 500
$45.00
5–26 GE ENERGY AGGREGATOR – INSTRUCTION MANUAL

SET UP RATE STRUCTURES CHAPTER 5: CONFIGURING APPLICATION SETTINGS
applied to the usage when the bill is generated, e.g., if you set a rate for Season 1 Off Peak, that rate is applied to all usage that occurs during Off Peak times, during the period designated as Season 1.
a. If you want to use more rates than Off Peak and On Peak, click the Add Rate icon.
b. Enter a name for the rate; select the Season the rate will be applied to (if you selected only one season, you will only be able to choose Season One); enter the charge per unit. For Energy usage, this is the charge per kWh.
c. Click OK to save the rate and return to the Rates tab screen. The rate you added is now listed in the screen. Make sure you assign Rate Times for this new rate (see below).
NOTE
Note • To edit a rate, click on the rate in the list and click the Edit Selected Rate icon. You will see the same screen as when you are adding a rate, but it will show the rate’s settings. Change what you want and click OK to save the changes.
GE ENERGY AGGREGATOR – INSTRUCTION MANUAL 5–27

CHAPTER 5: CONFIGURING APPLICATION SETTINGS SET UP RATE STRUCTURES
• To delete a rate, click on the rate in the list and click the Remove Selected Rate icon. You will see a Confirmation window asking if you are sure you want to remove the rate - click Yes to remove; click No to keep the rate. If you delete a rate, the rate times assigned to it (see the following section) are reassigned to the next available rate.
Rate Times
Click the Rate Times tab to assign different times of the day as on-peak or off-peak, for billing purposes. You set on-peak and off-peak times for both week-days and weekends, as well as for all the seasons you set up for this rate structure. These settings are used to generate the bill by identifying which rate is applied to the usage for the specific time period, e.g., if you set Season 1 Weekend time intervals as all Off Peak, then any usage for Season 1 weekends is charged the Off Peak rate.
5–28 GE ENERGY AGGREGATOR – INSTRUCTION MANUAL
SET UP RATE STRUCTURES CHAPTER 5: CONFIGURING APPLICATION SETTINGS
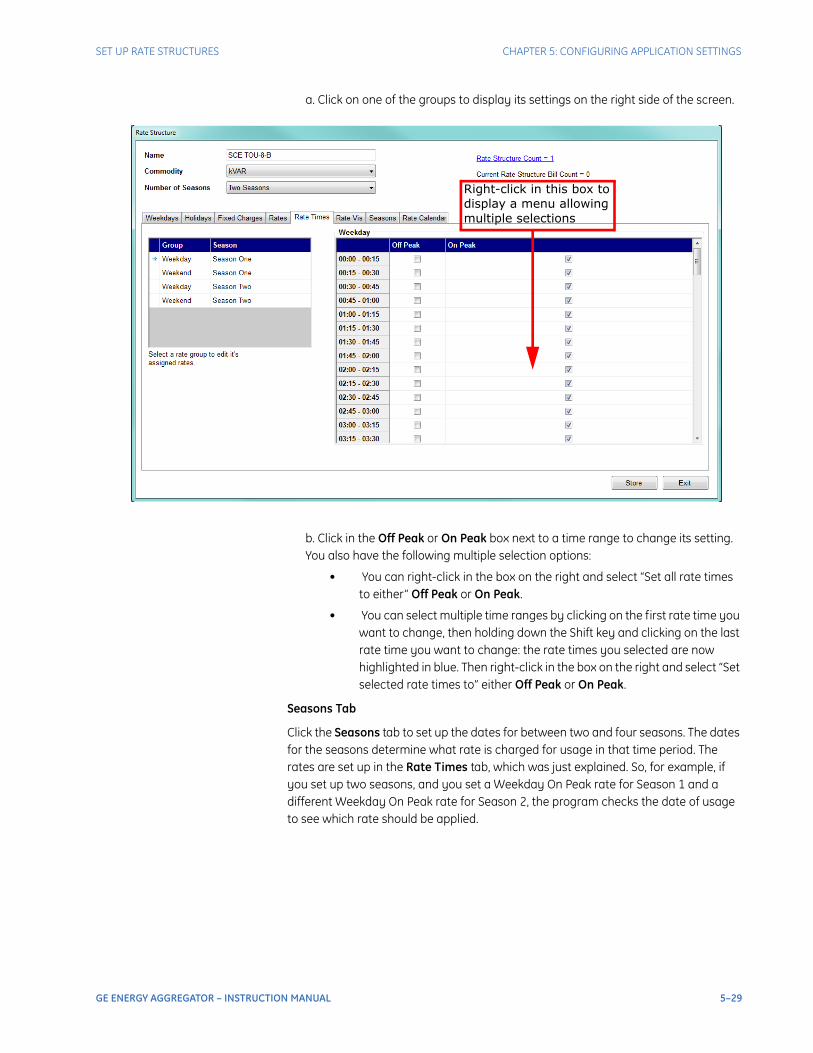
a. Click on one of the groups to display its settings on the right side of the screen.
b. Click in the Off Peak or On Peak box next to a time range to change its setting. You also have the following multiple selection options:
• You can right-click in the box on the right and select “Set all rate times to either” Off Peak or On Peak.
• You can select multiple time ranges by clicking on the first rate time you want to change, then holding down the Shift key and clicking on the last rate time you want to change: the rate times you selected are now highlighted in blue. Then right-click in the box on the right and select “Set selected rate times to” either Off Peak or On Peak.
Seasons Tab
Click the Seasons tab to set up the dates for between two and four seasons. The dates for the seasons determine what rate is charged for usage in that time period. The rates are set up in the Rate Times tab, which was just explained. So, for example, if you set up two seasons, and you set a Weekday On Peak rate for Season 1 and a different Weekday On Peak rate for Season 2, the program checks the date of usage to see which rate should be applied.
Right-click in this box to display a menu allowing multiple selections
GE ENERGY AGGREGATOR – INSTRUCTION MANUAL 5–29
CHAPTER 5: CONFIGURING APPLICATION SETTINGS SET UP RATE STRUCTURES
NOTE
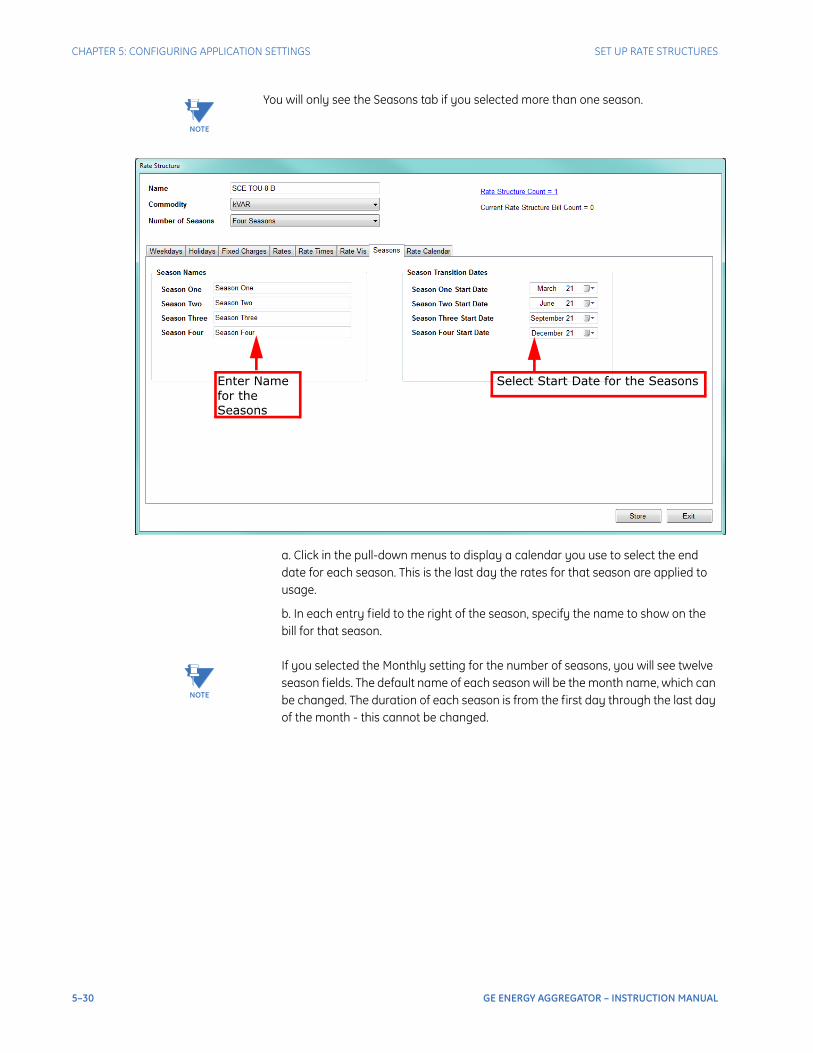
Note You will only see the Seasons tab if you selected more than one season.
a. Click in the pull-down menus to display a calendar you use to select the end date for each season. This is the last day the rates for that season are applied to usage.
b. In each entry field to the right of the season, specify the name to show on the bill for that season.
NOTE
Note If you selected the Monthly setting for the number of seasons, you will see twelve season fields. The default name of each season will be the month name, which can be changed. The duration of each season is from the first day through the last day of the month - this cannot be changed.
Select Start Date for the SeasonsEnter Name for the Seasons
5–30 GE ENERGY AGGREGATOR – INSTRUCTION MANUAL

SET UP RATE STRUCTURES CHAPTER 5: CONFIGURING APPLICATION SETTINGS
Rate Calendar
The rate calendar provides a graphical means of viewing the rates and the times they are applied to. This is useful to make sure that the system has been set up as you intended.
Review your rates on the rate calendar to make sure you have everything set up correctly.
5. Click Store to save your rate structure. Instructions for setting up a Flat Rate schedule follow. If you do not need this information, continue to step h on page 5–26.
6. To set up a rate structure with Fixed Charges only (no Time of Use, such as On Peak/Off Peak, Seasons, Weekend/Weekday or Holiday rates), select Flat Rate from the Add Rate Structure pull-down menu.
GE ENERGY AGGREGATOR – INSTRUCTION MANUAL 5–31

CHAPTER 5: CONFIGURING APPLICATION SETTINGS SET UP RATE STRUCTURES
You will see a screen similar to the Fixed Charges tab of the Seasonal Schedule.
a. Enter a Name for the Rate Structure, select the Commodity it will be applied to from the pull-down menu, and click Edit Selected Fixed Charge.
b. Keep the Charge Type as Flat Rate, and enter a Flat Rate Name and Rate.
c. Click OK to save the fixed charge.
7. Click Store to save your Flat Rate rate structure.
5–32 GE ENERGY AGGREGATOR – INSTRUCTION MANUAL

SET UP RATE STRUCTURES CHAPTER 5: CONFIGURING APPLICATION SETTINGS
8. Click Exit to return to the Configure Rate Structures screen. Your new rate structure is now listed in the Rate Structures box and there is a new box called Locations That Use This Rate at the bottom left of the screen. Once you assign customer locations to this rate, they are listed in the box.
NOTE
NoteNOTES: • To edit an existing rate structure, click on the rate structure and click the Edit the Selected Rate Structure icon. You will see the same screen as when you are adding a rate structure, but it will show the rate structure’s settings. Change what you want and click OK to save the changes. Any new bills generated will use the changed settings.
• If you edit a rate structure that has already been used for the generation of a bill, you are given the opportunity to archive that rate structure in its pre-edited condition (click Yes to archive - see the screen capture, below). This way, previously generated
GE ENERGY AGGREGATOR – INSTRUCTION MANUAL 5–33

CHAPTER 5: CONFIGURING APPLICATION SETTINGS SET UP RATE STRUCTURES
bills may be reproduced using the rate structure that was in effect at the time the bill was originally generated.
• If you choose not to archive the edited rate structure, a regenerated bill will use the rates defined in the current, edited rate structure.
• Once a rate structure has been archived, the archived copy may not be edited, again; though you can delete it or change its end date - instructions follow.
• If a rate structure has been archived, it will be used to generate cost data in the Usage Dashboard cost graphs for the billing periods when the archived rate structure was still in effect.
• When a rate structure has been archived, you can view the date range and bill count for the archive from the Archived Rate Structure History screen. Click the blue Rate Structure Count line, in the Rate Structure screen, to open the Archived Rate Structure History screen.
• If a rate structure was archived in error, or is no longer needed, you can delete the archive for that date range by right clicking on the archive and selecting Delete Period. The archive before the deleted archive is modified to cover the deleted archive's date range. For example, if you delete an archived rate with an End Date of
Click to openthe Archived ateStructure Historycreen
5–34 GE ENERGY AGGREGATOR – INSTRUCTION MANUAL

SET UP RATE STRUCTURES CHAPTER 5: CONFIGURING APPLICATION SETTINGS
February 2, 2016, the archived rate before that rate will now have an End Date of February 2, 2016. Note that you cannot delete the current rate structure.
Deleting the archived rate structure is permanent, and cannot be undone.
• The Archived rate’s End date and the Current rate’s Start Date are both defaulted to the current date. If you need a rate structure to take effect on a specific date, you can
GE ENERGY AGGREGATOR – INSTRUCTION MANUAL 5–35

CHAPTER 5: CONFIGURING APPLICATION SETTINGS SET UP RATE STRUCTURES
accomplish this by editing the End Date for the Archived rate structure listed before the Current rate structure. See the example screen below.
a. Click in the End Date field of the Archived rate.
b. Click on the arrow to display a calendar.
c. The current date is shown at the bottom of the calendar - in this example, 4/11/2017. When you select a different date by clicking on it in the calendar- in this example, April 19, 2017, the End Date for the Archived rate and the Start Date for the Current rate both change to the new date.
d. When done, click Update to store the changes.
• To delete a rate structure, click on the rate structure and click the Remove the Selected Rate Structure icon. You will see a Confirmation window asking if you are sure you want to remove the rate structure - click Yes to remove; click No to keep the rate structure. Removing the rate structure also removes it from any locations using it .
• You can also add, edit, or delete commodities from the Rate Structures screen.
Archived rate
Current rate
Current date
New date
5–36 GE ENERGY AGGREGATOR – INSTRUCTION MANUAL
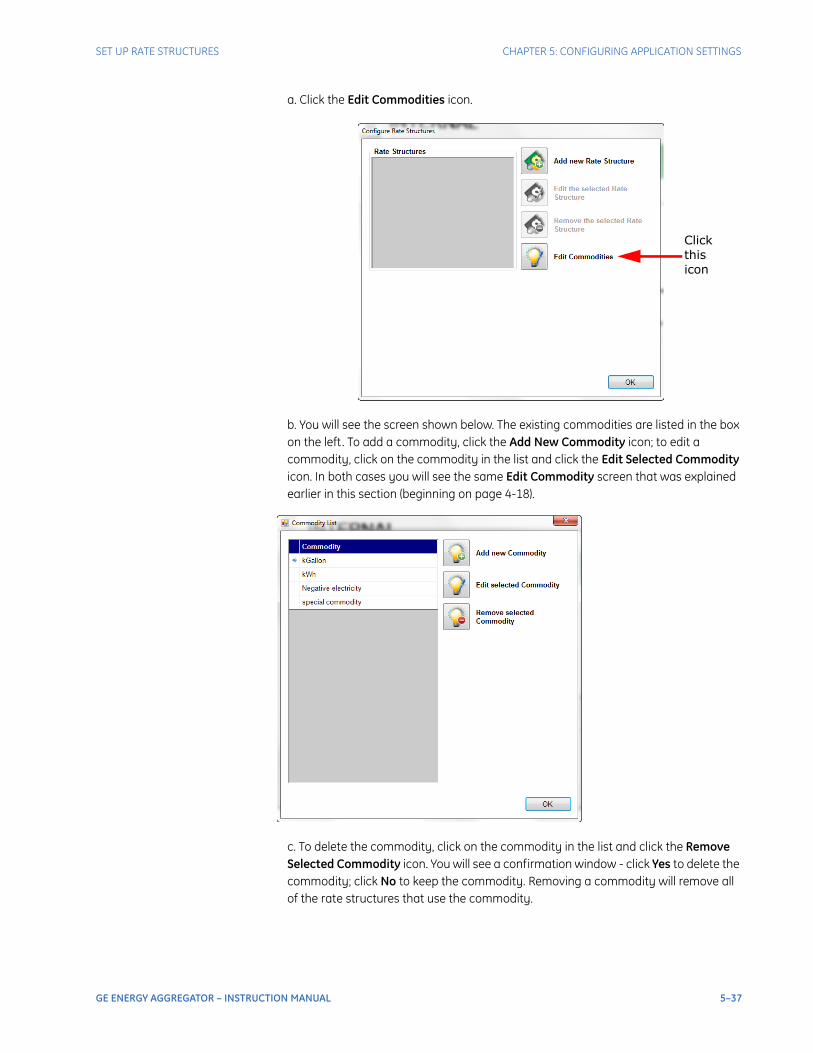
SET UP RATE STRUCTURES CHAPTER 5: CONFIGURING APPLICATION SETTINGS
a. Click the Edit Commodities icon.
b. You will see the screen shown below. The existing commodities are listed in the box on the left. To add a commodity, click the Add New Commodity icon; to edit a commodity, click on the commodity in the list and click the Edit Selected Commodity icon. In both cases you will see the same Edit Commodity screen that was explained earlier in this section (beginning on page 4-18).
c. To delete the commodity, click on the commodity in the list and click the Remove Selected Commodity icon. You will see a confirmation window - click Yes to delete the commodity; click No to keep the commodity. Removing a commodity will remove all of the rate structures that use the commodity.
Click this icon
GE ENERGY AGGREGATOR – INSTRUCTION MANUAL 5–37

CHAPTER 5: CONFIGURING APPLICATION SETTINGS SET UP A CUSTOMER
5.3 Set Up a Customer
Next you set up customer information. The customer is the person who will be receiving the bill from the provider. The customer can have one location or multiple locations. The software will generate a bill for each location for this customer.
1. From the GE Energy Aggregator Settings Editor main screen, click the Add Customer icon. You will see the screen shown below, but there will be an Apply icon in place of the other icons.
2. Enter the following:
• Customer ID: enter a unique identifier for the customer, which will be used to identify this customer.
• Customer Name: enter the customer’s name (this does not have to be unique).
• Address: enter the customer’s billing address.
• Telephone number
• Email Address
• Report Email Settings: after you click Apply you will be able to set up this field.
3. Click the Apply icon to save your changes. The message “Values Saved” displays in the bottom left of the screen, and two new icons appear on the screen - Add Location to This Customer and Remove This Customer (shown on the previous screen).
NOTE
Note If you want to delete the customer, click the Remove This Customer icon. You will see a confirmation window - click Yes to delete the customer; click No to keep the customer. Removing the customer will delete all locations and meters for the customer.
5–38 GE ENERGY AGGREGATOR – INSTRUCTION MANUAL

SET UP A CUSTOMER CHAPTER 5: CONFIGURING APPLICATION SETTINGS
4. After clicking Apply, you will also see a Configure button next to Report Email settings. Click the button to display the Report Email Settings screen.
• When this screen first opens, the Use default box is checked and the Subject and Body fields aren’t editable. Keep that setting as is, if you want to use the report email settings you already set up in the Default Report Email Settings screen (see page 4-6) for this customer.
• If you want to change the Subject and Body fields for this customer’s usage report and/or bill report:
a. Click the Default button to disable the default setting.
b. Select Bill Report or Usage Report from the Report pull-down menu.
c. Enter the Subject and Body text you want to use.
d. Click the Enable checkbox.
e. Repeat these steps if desired, for the other Report option.
f. Click OK to close the screen.
5. Click Add Location to This customer and continue to the next section.
GE ENERGY AGGREGATOR – INSTRUCTION MANUAL 5–39
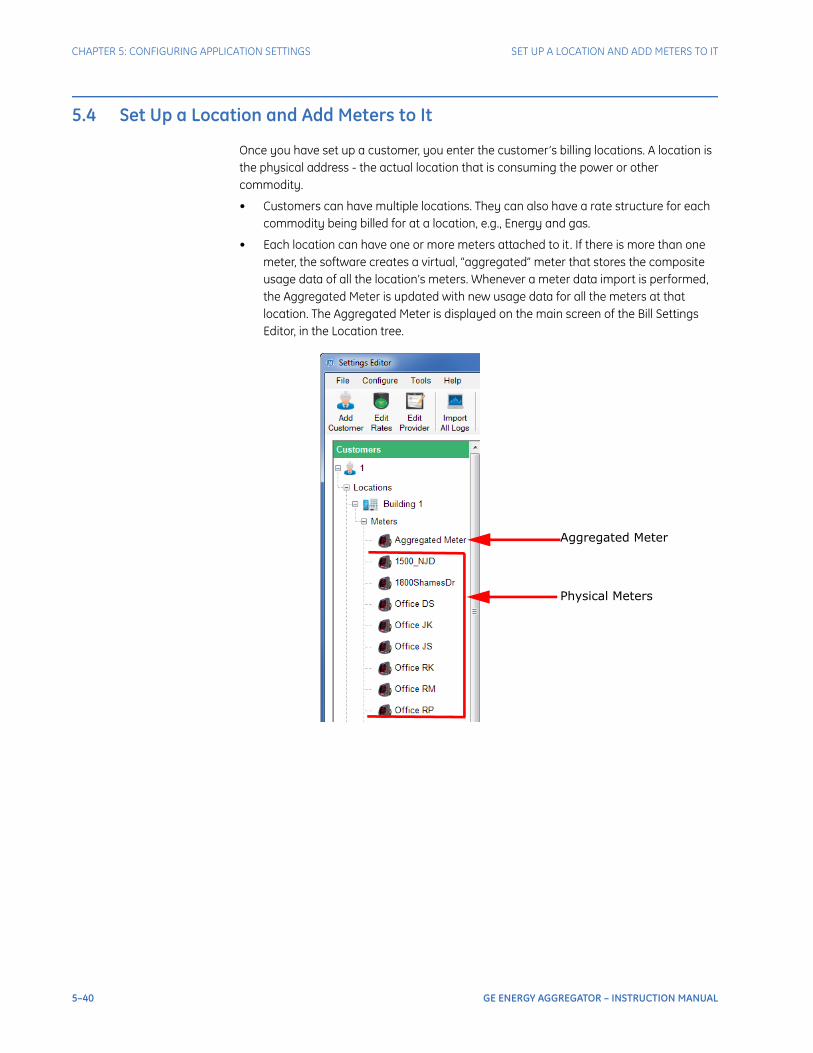
CHAPTER 5: CONFIGURING APPLICATION SETTINGS SET UP A LOCATION AND ADD METERS TO IT
5.4 Set Up a Location and Add Meters to It
Once you have set up a customer, you enter the customer’s billing locations. A location is the physical address - the actual location that is consuming the power or other commodity.
• Customers can have multiple locations. They can also have a rate structure for each commodity being billed for at a location, e.g., Energy and gas.
• Each location can have one or more meters attached to it . If there is more than one meter, the software creates a virtual, “aggregated” meter that stores the composite usage data of all the location’s meters. Whenever a meter data import is performed, the Aggregated Meter is updated with new usage data for all the meters at that location. The Aggregated Meter is displayed on the main screen of the Bill Settings Editor, in the Location tree.
Aggregated Meter Physical Meters
5–40 GE ENERGY AGGREGATOR – INSTRUCTION MANUAL

SET UP A LOCATION AND ADD METERS TO IT CHAPTER 5: CONFIGURING APPLICATION SETTINGS
1. When you click the Add Location to This Customer icon, you see the screen shown below. Use this screen to set up information for the billing location.
2. Enter a unique name for the location in the Location Name field.
3. Click Edit next to Bill Period to select a billing period. The billing period is the day of the month on which the bill is computed.
4. From the pull-down menu, select the day of the month you want the billing period to begin and then click OK. The Bill Period screen closes and the day you chose is displayed in the Edit Location Information screen.
5. Add the Location address.
6. Click Apply to create the location.
A window opens with weather data information based on the address you entered for the location, and asking if you want to enable automatic weather data updates. The GE Energy Aggregator application can get weather data for your locations; that you can then use to compare commodity usage against temperature, humidity, and barometric pressure.
Weather data is collected from an online weather data service provider. The service uses the latitude and longitude of your location to find the closest weather station. The latitude and longitude for this location’s address is displayed in the window.
Click to select Bill Period
GE ENERGY AGGREGATOR – INSTRUCTION MANUAL 5–41

CHAPTER 5: CONFIGURING APPLICATION SETTINGS SET UP A LOCATION AND ADD METERS TO IT
Verify that the discovered weather location is correct, and then click Yes to enable automatic weather data updates; click No if you don’t want to automatically update, or if you want to configure weather data collection manually (instructions on page 5–44).
NOTE
NoteNOTES: • The default for weather display is Fahrenheit. You can change it to Celsius through the Options screen’s Configuration tab. See Section 7.4.2 for instructions.
• You can disable the automatic configuration of weather data through the Option screen’s Configuration tab. See Section 7.4.2.
• Weather data consists of temperature, humidity and barometric pressure. Usually, the weather station updates this information not more than once an hour; but it may choose to limit the number of requests that can be fulfilled per hour.
5–42 GE ENERGY AGGREGATOR – INSTRUCTION MANUAL

SET UP A LOCATION AND ADD METERS TO IT CHAPTER 5: CONFIGURING APPLICATION SETTINGS
7. The screen changes to offer more options.
The new options let you:
• Configure weather data collection manually
• Add a meter to this location
• Add a rate structure to this location
• Edit a rate structure for this location
• Remove a rate structure from this location
• Remove this location
In addition, there are two boxes on the screen - one for Rate Structures assigned to this location, and one for meters assigned to this location. When you are adding a new location, these boxes will be empty, but if you are editing an existing location, there will be entries in the boxes.
GE ENERGY AGGREGATOR – INSTRUCTION MANUAL 5–43
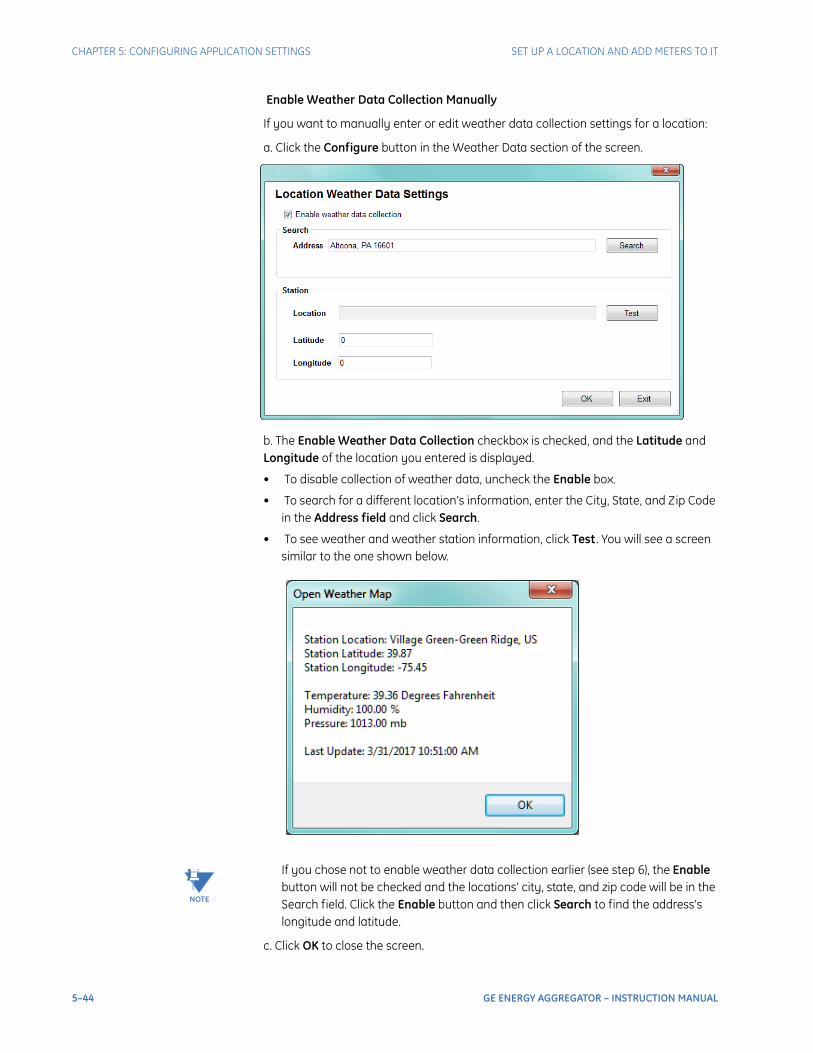
CHAPTER 5: CONFIGURING APPLICATION SETTINGS SET UP A LOCATION AND ADD METERS TO IT
Enable Weather Data Collection Manually
If you want to manually enter or edit weather data collection settings for a location:
a. Click the Configure button in the Weather Data section of the screen.
b. The Enable Weather Data Collection checkbox is checked, and the Latitude and Longitude of the location you entered is displayed.
• To disable collection of weather data, uncheck the Enable box.
• To search for a different location’s information, enter the City, State, and Zip Code in the Address field and click Search.
• To see weather and weather station information, click Test . You will see a screen similar to the one shown below.
NOTE
Note If you chose not to enable weather data collection earlier (see step 6), the Enable button will not be checked and the locations’ city, state, and zip code will be in the Search field. Click the Enable button and then click Search to find the address’s longitude and latitude.
c. Click OK to close the screen.
5–44 GE ENERGY AGGREGATOR – INSTRUCTION MANUAL
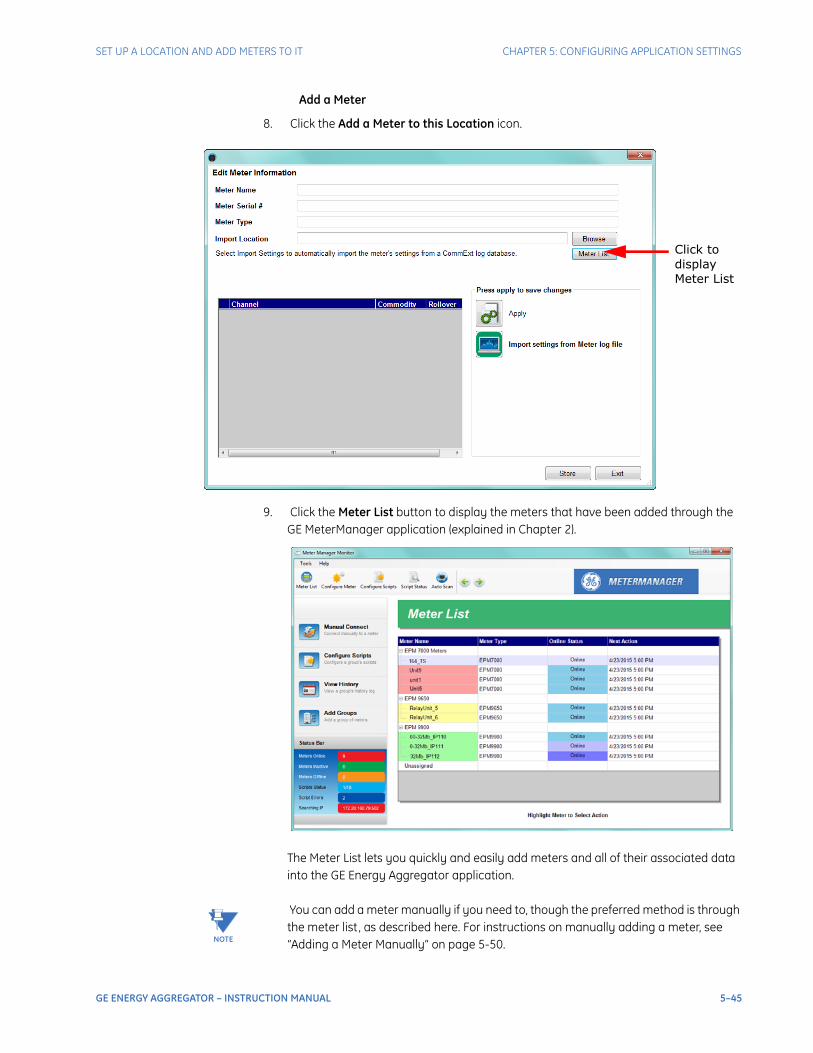
SET UP A LOCATION AND ADD METERS TO IT CHAPTER 5: CONFIGURING APPLICATION SETTINGS
Add a Meter
8. Click the Add a Meter to this Location icon.
9. Click the Meter List button to display the meters that have been added through the GE MeterManager application (explained in Chapter 2).
The Meter List lets you quickly and easily add meters and all of their associated data into the GE Energy Aggregator application.
NOTE
Note You can add a meter manually if you need to, though the preferred method is through the meter list , as described here. For instructions on manually adding a meter, see “Adding a Meter Manually” on page 5-50.
Click to display Meter List
GE ENERGY AGGREGATOR – INSTRUCTION MANUAL 5–45

CHAPTER 5: CONFIGURING APPLICATION SETTINGS SET UP A LOCATION AND ADD METERS TO IT
10. The meters are listed in their assigned groups. Click on a meter and click the Select button to add it . The Edit Meter Information screen is re-displayed, with the selected meter’s Import Location.
11. Click the Import Settings from Meter Log File icon. You will see a window telling you that the settings have been imported. Click OK to close the window.
Selected meter’s location information
Click to import meter settings
5–46 GE ENERGY AGGREGATOR – INSTRUCTION MANUAL

SET UP A LOCATION AND ADD METERS TO IT CHAPTER 5: CONFIGURING APPLICATION SETTINGS
12. Click the Apply icon. The screen will re-display showing the selected meter’s information and additional icons.
13. After the meter settings are imported from the meter’s log file and you click Apply, the first energy channel is selected and displayed in the Channel fields. A channel is a single type of data item from the meter’s log database, e.g., Watt-hours Received. The channel will be linked to a commodity for use in generating bills; e.g., the Watt-hours Received channel linked to the kWh commodity. The Channel icons let you add channels, edit them, or remove them. - To add a channel, Click Add Channel.
14. Select the channel from the pull-down menu. The channels you see are the data values that you set up for this log using the GE Communicator application. They are channels for Energy and/or pulse accumulations. See “Importing External Data” on page 5-54, for channel setting instructions for external databases.
15. Select the commodity from the pull-down menu. Once the data has been imported, it will be tracked by the commodity.
• You can select only one channel per commodity, per meter, e.g., Total Watt-hours for kWh.
Selected meter’s informa-tion
Selected meter’s first energychannel data
Channel icons
Remove Meter icon
GE ENERGY AGGREGATOR – INSTRUCTION MANUAL 5–47

CHAPTER 5: CONFIGURING APPLICATION SETTINGS SET UP A LOCATION AND ADD METERS TO IT
• A meter can have multiple commodities. See the diagram below.
Figure 5-4: Example of Meter Measuring Multiple Commodities
16. Auto-adjust Rollover is the default selection on the screen. The unscaled rollover field will display the settings from the GE Communicator software for this channel, if you click on the Auto-adjust Rollover box to de-select it . You can edit the value in the unscaled rollover field.
NOTE
Note Manually setting the rollover field is only applicable to older EPM 9450 models.
17. The Percentage of Usage Applied to Bill field lets you add or subtract a portion of the usage for this channel, for this meter, to the bill when it is generated, allowing for credits for certain meters. You might want to use this if you want to remove a meter from being billed for this usage. For example, if you have a main meter at a location, e.g., a meter attached to the building’s utility feeder, and submeters in individual tenant units, you may want to bill for main meter usage, comprised of things like hallway and outside lighting, on a separate bill from the tenant billing. - To do this you would put 100% for the usage field for the submeters and -100% for the usage field for the meter attached to the utility feeder.
18. When you have made your choices, click OK. The channel, commodity, and roll-over value are now shown in the Channel/Commodity/Rollover box in the Edit Meter Information screen.
NOTE
NoteNOTES: • To edit a channel, click on it in the box and click the Edit Channel icon; to remove a Channel, click on it in the box and click the Remove Channel icon.
• When changing the meter channel used for the commodity, if the new channel’s type changes from accumulator (e.g., Quadrant 1+4 Wh) to interval accumulator (e.g, Interval Energy Quadrant 1+4 Wh), or vice versa, the GE Energy Aggregator application will automatically try to convert the data that has already been imported, in order to preserve it . This can help ensure continuity of data when you change the meter's log configuration.
• When converting from Accumulator to Interval Accumulator, the interpolated interval values will be used as a basis for the new Interval Accumulator values to be imported.
• When converting from Interval Accumulator to Accumulator, the interval values will be used as a basis for the new interpolated intervals. This allows interval data to be retrieved from before the available accumulator values.
19. If you want to add a channel for another commodity, follow the same procedure. When you are done selecting channels, click Store to save the settings.
Tracking Energy Usage through Voltage and Current Inputs
Pulse Input 1 Gas Usage
Pulse Input 2 Condensate
Meter
5–48 GE ENERGY AGGREGATOR – INSTRUCTION MANUAL
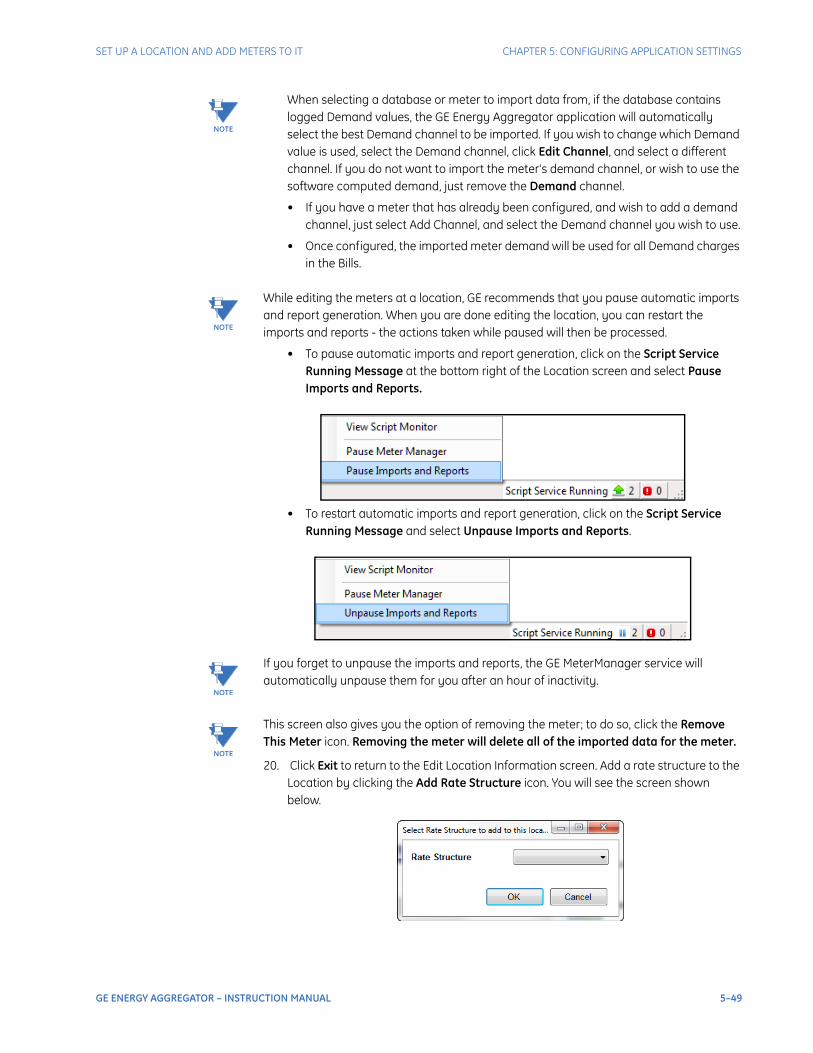
SET UP A LOCATION AND ADD METERS TO IT CHAPTER 5: CONFIGURING APPLICATION SETTINGS
NOTE
Note When selecting a database or meter to import data from, if the database contains logged Demand values, the GE Energy Aggregator application will automatically select the best Demand channel to be imported. If you wish to change which Demand value is used, select the Demand channel, click Edit Channel, and select a different channel. If you do not want to import the meter's demand channel, or wish to use the software computed demand, just remove the Demand channel.
• If you have a meter that has already been configured, and wish to add a demand channel, just select Add Channel, and select the Demand channel you wish to use.
• Once configured, the imported meter demand will be used for all Demand charges in the Bills.
NOTE
Note While editing the meters at a location, GE recommends that you pause automatic imports and report generation. When you are done editing the location, you can restart the imports and reports - the actions taken while paused will then be processed.
• To pause automatic imports and report generation, click on the Script Service Running Message at the bottom right of the Location screen and select Pause Imports and Reports.
• To restart automatic imports and report generation, click on the Script Service Running Message and select Unpause Imports and Reports.
NOTE
Note If you forget to unpause the imports and reports, the GE MeterManager service will automatically unpause them for you after an hour of inactivity.
NOTE
Note This screen also gives you the option of removing the meter; to do so, click the Remove This Meter icon. Removing the meter will delete all of the imported data for the meter.
20. Click Exit to return to the Edit Location Information screen. Add a rate structure to the Location by clicking the Add Rate Structure icon. You will see the screen shown below.
GE ENERGY AGGREGATOR – INSTRUCTION MANUAL 5–49

CHAPTER 5: CONFIGURING APPLICATION SETTINGS SET UP A LOCATION AND ADD METERS TO IT
21. Select the rate structure you want from the pull-down menu and click OK to close the screen.
NOTE
Note You can also select Create New to add a new rate structure. Follow the instructions for adding a rate structure in Section 4.2.
5.4.1 Adding a Meter Manually
The usual and preferred method of adding meters to a location is through the meter list, as shown in the previous section. If you need to enter a meter manually, follow these instructions:
1. From the Edit Location Information screen, click the Add a Meter to This Location icon. The Edit Information screen opens. Enter the following:
• Meter Name: enter a unique identifier for the meter. This name must be unique across all locations. It is used to identify the meter’s billing data.
• Meter Serial #: enter the meter’s serial number.
• Meter Type: enter the meter type.
2. Import Location is the place where the meter’s billing log data is stored (e.g., C:\Users\Public\Documents\GE Applications\Communicator_EXT\Retrieved Logs). This log data file contains the raw values the GE Energy Aggregator application imports in order to generate its billing database, i.e., Energy usage or pulse accumulations. Refer to Figure 4.1 for a depiction of the data flow between applications; see Chapter 2 if you need to refresh your understanding of setting up the meters’ historical logs for GE Energy Aggregator application use.
3. Click Browse to locate the meter’s log database file.You will see a screen that lets you locate and select the log file. See the example screen shown below.
NOTE
Note • The log database file comes from either the GE Communicator application (*.db or *.dml: the database created when logs are retrieved using the GE Communicator application).
5–50 GE ENERGY AGGREGATOR – INSTRUCTION MANUAL

SET UP A LOCATION AND ADD METERS TO IT CHAPTER 5: CONFIGURING APPLICATION SETTINGS
• See View/Copy/Export Meter Data on page 7–1 for file importing suggestions.
WARNINGS! • Be careful when selecting the location to import from. Importing is done by the GE Energy Aggregator Settings Editor software, and if you select a location that is not accessible (or invalid), you may not be able to import the data.
• If you change the import location file, it will wipe out the selected channels. You will have to select the channels you want to import, again.
4. When you find the file you want to use, click Open. The screen closes and you see the Edit Meter Information screen. The log file’s path is now displayed on the screen next to Import Location.
5. Once you’ve selected the file to import from, the application will verify that it contains log items that can be linked to commodities. This includes Energy, e.g., Total Watt-hours, and pulse accumulations, e.g., a Digital Input channel.
6. If you are using a GE Communicator log database, click the Import Settings from Meter Log File icon. You will see the message window shown below. It tells you that the meter settings were imported from the meter with the serial number listed in the screen. Click OK to close the window.
NOTE
Note The Import Settings function will only fill in a meter name that has not already been entered. If you have already filled in the meter name, it will leave that as is. TIP: GE highly recommends importing all the meter configuration data. This automated tool makes the meter configuration task much simpler.
GE ENERGY AGGREGATOR – INSTRUCTION MANUAL 5–51

CHAPTER 5: CONFIGURING APPLICATION SETTINGS SET UP A LOCATION AND ADD METERS TO IT
7. Click the Apply icon to create the meter. The Edit Meter information screen re-displays with additional options - now you can choose the channels to import. See the example screen shown below.
8. Continue from step 13 in “Set Up a Location and Add Meters to It” on page 5-40.
5.4.2 Meter at Location Example
If you have two meters at a location, for example, each metering a utility feeder, you would set up both meters for the location, following the instructions in this section. The software will import all of the usage data for both meters and when the bill is generated the usage for both meters will be totalized to arrive at the billed dollar amount. See the diagram below.
NOTE
Note Meter imports are a background process managed by the server, and are automatically performed when settings change or when new log data is downloaded from the meter - you do not need to manually import any data. The current status of the currently running imports can be viewed from the View Imports screen - see “The Service Status Bar” on
5–52 GE ENERGY AGGREGATOR – INSTRUCTION MANUAL

SET UP A LOCATION AND ADD METERS TO IT CHAPTER 5: CONFIGURING APPLICATION SETTINGS
page 8-4.
Figure 5-5: Totalizing Meters
GE ENERGY AGGREGATOR – INSTRUCTION MANUAL 5–53

CHAPTER 5: CONFIGURING APPLICATION SETTINGS SET UP A LOCATION AND ADD METERS TO IT
5.4.3 Importing External Data
If you are setting up the GE Energy Aggregator application for use with external data (as opposed to the GE Communicator application log data), there are some unique considerations. The database file must have four fields:
• DATE: the date of the record formatted as yyyy/mm/dd
• TIME: the time of day of the record formatted as hh:mm:ss
• KWHR: the Energy usage in kilo-watt-hours
• CONDENSATE: this field is a pulse accumulator channel, intended for condensate (steam) pulses. You can assign this channel to other commodities, such as gas or water, in the GE Energy Aggregator application - see Section 4.4 for instructions. This field is assumed to be in kilo scale.
These are the only fields you can use. If you need to use more fields, split the data into multiple files and import as multiple meters.
• The optimal interval for the data is 15 minutes, time-stamped on the minute.
• The database file must be a dBase IV format database. It can be opened in Excel, but should not be saved in Excel as this can cause database corruption which will prevent the file from working with the GE Energy Aggregator application.
• The file name should be eight characters with an extension of three characters, e.g., EPM9900_2.dbf.
NOTE
Note • The GE Energy Aggregator application rollover value should be the same as the rollover value in the meter’s device profile, set in the GE Communicator application (in the meter’s Device Profile > Revenue and Energy Settings > Energy Scaling).
Rollover Value
5–54 GE ENERGY AGGREGATOR – INSTRUCTION MANUAL
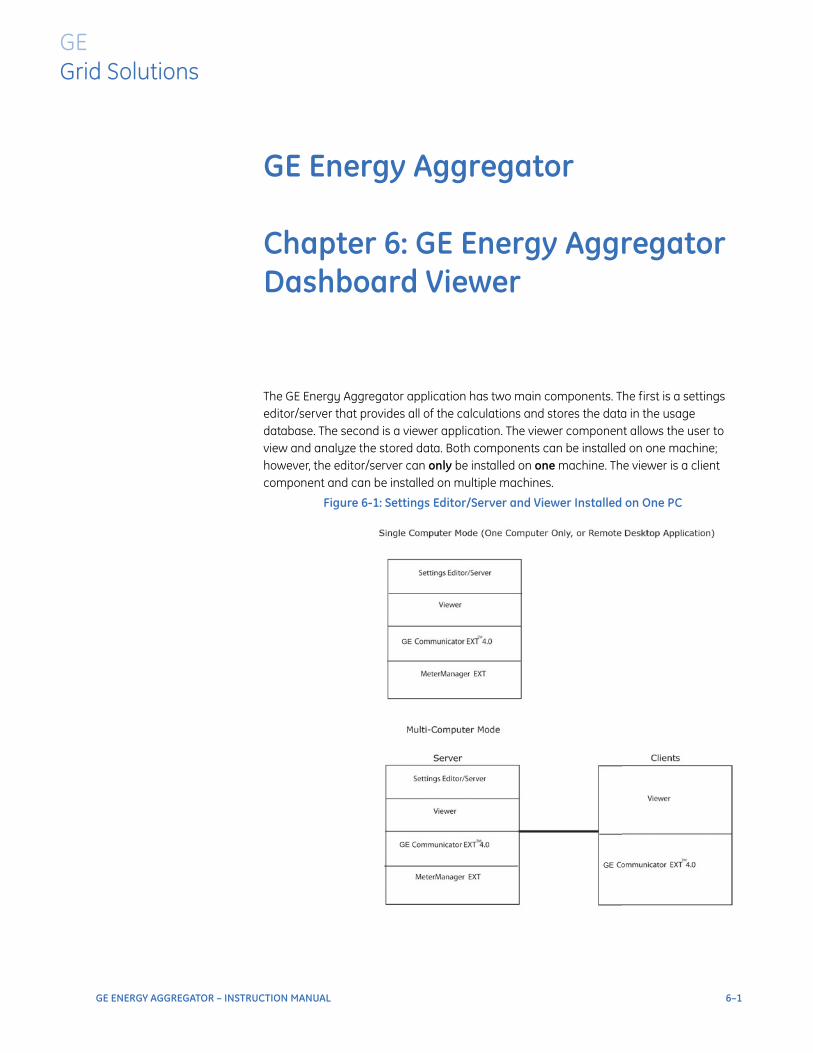
GE Energy Aggregator
Chapter 6: GE Energy Aggregator Dashboard Viewer
GEGrid Solutions
GE Energy Aggregator Dashboard Viewer
The GE Energy Aggregator application has two main components. The first is a settings editor/server that provides all of the calculations and stores the data in the usage database. The second is a viewer application. The viewer component allows the user to view and analyze the stored data. Both components can be installed on one machine; however, the editor/server can only be installed on one machine. The viewer is a client component and can be installed on multiple machines.
Figure 6-1: Settings Editor/Server and Viewer Installed on One PC
GE ENERGY AGGREGATOR – INSTRUCTION MANUAL 6–1

CHAPTER 6: GE ENERGY AGGREGATOR DASHBOARD VIEWER
You used the GE Energy Aggregator Settings Editor/Server to set up customers, locations for customers, and meters at locations, as well as commodities and rate structures that will be applied to usage. The GE MeterManager application automatically downloads the logs from the selected meters and the GE Energy Aggregator application automatically imports the commodity usage data from the logs. The GE Energy Aggregator application generates the bills and usage reports based on the billing period and report criteria you have set up using the GE Energy Aggregator Settings Editor.
The GE Energy Aggregator Dashboard Viewer is the part of the GE Energy Aggregatorapplication that lets you see, print, and export billing and usage information for the customers, locations, and meters.
As mentioned in Chapter 5, locations with multiple meters generate a virtual meter to store aggregated meter data. The Aggregate Meter’s data can also be accessed from the GE Energy Aggregator Dashboard Viewer.
6–2 GE ENERGY AGGREGATOR – INSTRUCTION MANUAL

ACCESSING THE GE ENERGY AGGREGATOR DASHBOARD VIEWER CHAPTER 6: GE ENERGY AGGREGATOR DASHBOARD VIEWER
6.1 Accessing the GE Energy Aggregator Dashboard Viewer
1. Click either the Dashboard Viewer icon from the top of the GE Energy Aggregator Settings Editor screen, or the Dashboard Viewer icon from the GE Energy Aggregator Settings Editor main screen. Dashboard Viewer is the part of the GE Energy Aggregator application that lets you see, print, and export billing and usage information for the customers, locations, and meters
NOTE
Note You can click Tools > Refresh to return to the main screen display from another screen, e.g., the Location screen.
GE ENERGY AGGREGATOR – INSTRUCTION MANUAL 6–3
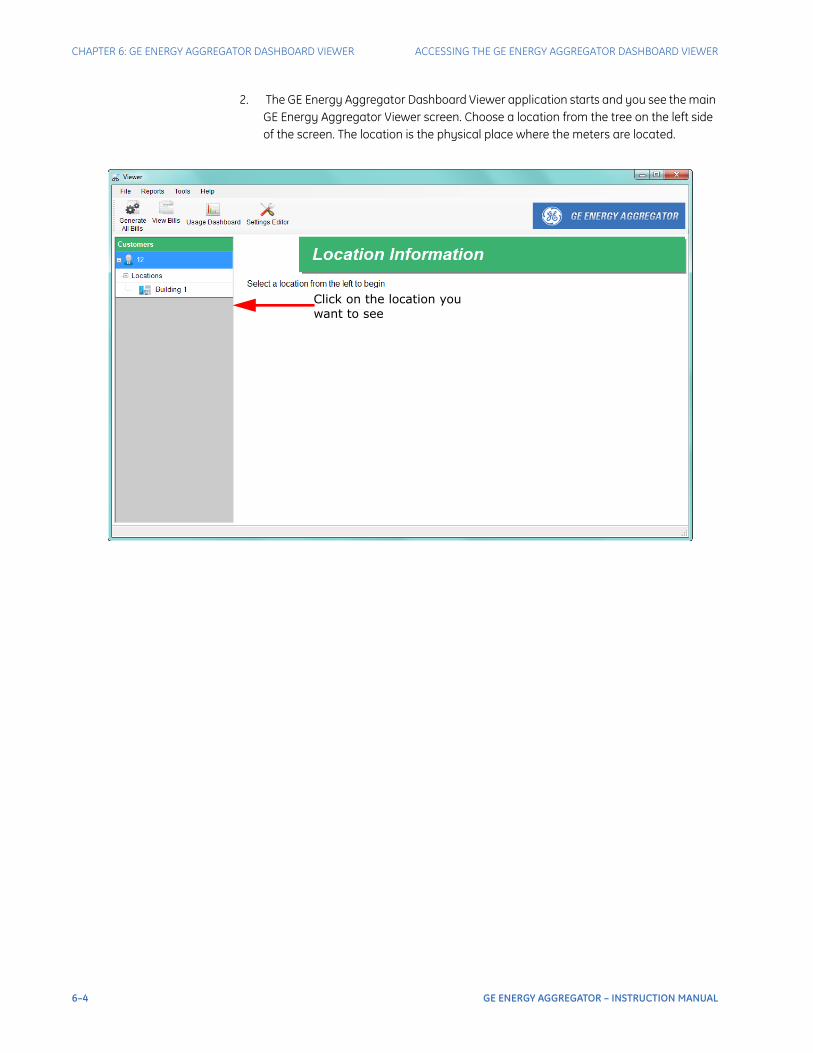
CHAPTER 6: GE ENERGY AGGREGATOR DASHBOARD VIEWER ACCESSING THE GE ENERGY AGGREGATOR DASHBOARD VIEWER
2. The GE Energy Aggregator Dashboard Viewer application starts and you see the main GE Energy Aggregator Viewer screen. Choose a location from the tree on the left side of the screen. The location is the physical place where the meters are located.
Click on the location you want to see
6–4 GE ENERGY AGGREGATOR – INSTRUCTION MANUAL

ACCESSING THE GE ENERGY AGGREGATOR DASHBOARD VIEWER CHAPTER 6: GE ENERGY AGGREGATOR DASHBOARD VIEWER
3. After you click on a location, information about the location is shown in the middle of the screen.
4. You can select a different month/date to see the Bill and Usage Report status for that month.
The icons on the right of the screen let you:
• Monthly Utility Bill - view the bill for the month. If it hasn’t been generated yet, it will be generated and then displayed. See “Generating and Viewing Customer Bills” on page 6-21.
• Executive Summary - generate the Executive Summary Usage report based on your selections. See “Executive Summary Usage Report” on page 6-13.
• Usage Dashboard - display the Usage Dashboard - see “Usage Dashboard” on page 6-6.
The icons at the top of the screen let you:
• Generate All Bills - generate customer bills. See “Generating and Viewing Customer Bills” on page 6-21.
• View Bills - see already generated bills. See “Generating and Viewing Customer Bills” on page 6-21.
• Usage Dashboard- display the Usage Dashboard - see “Usage Dashboard” on page 6-6.
• Settings Editor - open the GE Energy Aggregator Settings Editor application. See Chapter 4.
Click to select another month/date
Bill and Report Status
GE ENERGY AGGREGATOR – INSTRUCTION MANUAL 6–5
CHAPTER 6: GE ENERGY AGGREGATOR DASHBOARD VIEWER USAGE DASHBOARD
The menu items at the top of the screen let you:
• File - select to connect to the database or exit the GE Energy Aggregator Dashboard Viewer.
• Reports - view or generate bills and usage reports, per selected criteria. See “Generating and Viewing Usage Reports” on page 6-13, and “Generate Custom Reports” on page 6-18.
• Tools - view bill data, view bill errors for locations, export meter data, perform advanced tasks (see chapters 7 and 8).
• Help - check for updates, see User Manual, see information about the application version, read the User License.
6.2 Usage Dashboard
One of the important features of the GE Energy Aggregatorapplication is the Usage Dashboard. It allows you to easily view Energy and other commodity usage data in a number of formats:
• View usage by day, week, month, year, or by a customized date range
• Compare usage between meters/locations
• Compare usage against weather data
• View costs
• View top Demand by day, week, month, year, or by a customized date range
• View meter logs (for meters set up using the GE MeterManager Meter List)
• Connect to the meter through GE Communicator software (for meters set up using the GE MeterManager Meter List)
• Copy, export, or print graph image
The Usage Dashboard provides a configurable, top-level view of usage, to enable a precise understanding of energy consumption patterns. These patterns include trends, and demand on the power system.
6–6 GE ENERGY AGGREGATOR – INSTRUCTION MANUAL

USAGE DASHBOARD CHAPTER 6: GE ENERGY AGGREGATOR DASHBOARD VIEWER
1. To open the Usage Dashboard, click on the Dashboard Viewer icon either at the top or the middle right of the GE Energy Aggregator Dashboard Viewer screen.
2. The GE Energy Aggregator Dashboard Viewer opens.
GE ENERGY AGGREGATOR – INSTRUCTION MANUAL 6–7
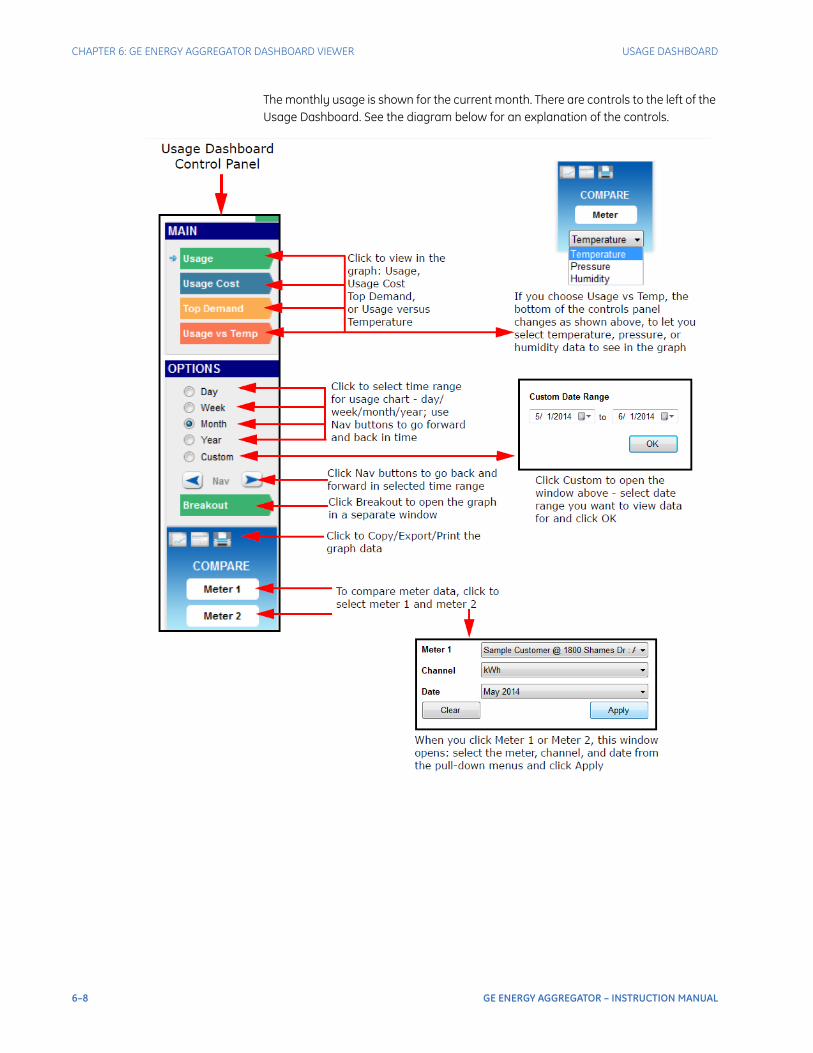
CHAPTER 6: GE ENERGY AGGREGATOR DASHBOARD VIEWER USAGE DASHBOARD
The monthly usage is shown for the current month. There are controls to the left of the Usage Dashboard. See the diagram below for an explanation of the controls.
6–8 GE ENERGY AGGREGATOR – INSTRUCTION MANUAL

USAGE DASHBOARD CHAPTER 6: GE ENERGY AGGREGATOR DASHBOARD VIEWER
You can also right-click in a graph to open a sub-menu.
The following pages show examples of different graph selections.
Figure 6-2: Two Meter Usage Comparison for One Month
Click to make adjustments to graph display
Click to export the graph or graph data
GE ENERGY AGGREGATOR – INSTRUCTION MANUAL 6–9

CHAPTER 6: GE ENERGY AGGREGATOR DASHBOARD VIEWER USAGE DASHBOARD
Figure 6-3: Two Meter Usage Cost Comparison for One Week
Figure 6-4: Breakout of Top Demand Comparison for Two Meters for the Year
6–10 GE ENERGY AGGREGATOR – INSTRUCTION MANUAL

USAGE DASHBOARD CHAPTER 6: GE ENERGY AGGREGATOR DASHBOARD VIEWER
Figure 6-5: Usage Versus Weather - Temperature for the Month
Figure 6-6: Usage Versus Weather - Pressure - for One Week
GE ENERGY AGGREGATOR – INSTRUCTION MANUAL 6–11

CHAPTER 6: GE ENERGY AGGREGATOR DASHBOARD VIEWER USAGE DASHBOARD
Figure 6-7: Usage Versus Weather - Humidity - for One Day
3. To exit the usage dashboard, click the Location Info icon at the top of the screen.
6–12 GE ENERGY AGGREGATOR – INSTRUCTION MANUAL

GENERATING AND VIEWING USAGE REPORTS CHAPTER 6: GE ENERGY AGGREGATOR DASHBOARD VIEWER
6.3 Generating and Viewing Usage Reports
The following sections explain GE Energy Aggregator application’s usage report options.
6.3.1 Executive Summary Usage Report
The Executive Summary Usage Report is a customized report containing the location and data you specify, or, for all customer locations, containing extensive, detailed usage information. It is designed to provide a complete picture of energy consumption, including analytics on usage patterns and contributing factors, such as weather.
1. From the GE Energy Aggregator Dashboard Viewer’s Location Information screen, click the Executive Summary icon on the right side of the screen.
2. You will see the window shown on the next page. Use it to select the data you want to see in your report. This feature lets you generate a customized report with only the data you want.
GE ENERGY AGGREGATOR – INSTRUCTION MANUAL 6–13

CHAPTER 6: GE ENERGY AGGREGATOR DASHBOARD VIEWER GENERATING AND VIEWING USAGE REPORTS
For example, you can choose to view the highest usage per meter, or the total usage per meter during the Peak Day.
NOTE
Note Usage reports can be very large. Because of this, executive summary usage reports cannot be generated for customers that have more then 200 meters (across all their locations). In addition, executive summary usage reports cannot be generated for any location with more than 100 meters.
3. Select the channel from the pull-down menu.
4. Note that the location you are currently viewing is displayed at the top of the screen. That is the only location whose data will be shown unless you select Generate for all customer locations by clicking in its checkbox.
5. If you want to see demand in your report, select Display Demand by clicking in its checkbox.
6. Click the checkboxes of the data you want included in the report. By default, all of the data is selected. Click on a box to uncheck it if you don’t want that data in your report.
7. Click Generate. You will see a message while the report is being generated and then it will display on the screen. A sample Executive Summary Usage Report follows.
6–14 GE ENERGY AGGREGATOR – INSTRUCTION MANUAL

GENERATING AND VIEWING USAGE REPORTS CHAPTER 6: GE ENERGY AGGREGATOR DASHBOARD VIEWER
6.3.2 Generate Usage Reports
Click Reports in the GE Energy Aggregator Dashboard Viewer main screen’s Menu bar. You will see the submenu shown below.
There are two Report options - Generate Usage Reports and View Usage Reports.
1. Click Reports > Generate Usage Reports > Generate Customer Report . You will see the screen shown below.
2. Select the customer, start date for the month, and channel. The Month box fills with the available months for the customer (the months which contain usage data).
3. Click each of the month(s) you want to create the usage report for.
GE ENERGY AGGREGATOR – INSTRUCTION MANUAL 6–15

CHAPTER 6: GE ENERGY AGGREGATOR DASHBOARD VIEWER GENERATING AND VIEWING USAGE REPORTS
4. Click Options. You will see the screen shown below.
5. Configure the following settings:
• The default path is displayed in the Output Path field. Click the Browse button if you want to choose another output path for the file. This is where the report will be saved.
• The Use Default Report Name checkbox is already selected. The default report name is the customer number, commodity, and date of the usage, e.g., 11567_kWh_2013-03 for a report of kWh usage data for March 2013 for customer number 11567. If you want to use a different name for the usage report, un-check the box and enter a name in the blank field next to it .
• File format: your format choices are PDF (Adobe PDF document), RTF (rich text format), or HTML (for viewing over the web).
• Report Commodity: select the commodity you want to use from the pull-down menu. Usage reports are only generated for a single commodity at a time.
• Click Single Page Summary if you want to have the month, week, and day usages on the same page.
• If you select Single Page Summary, you can also select Overlay Interval Data. Click this option if you want to have trend data or Demand data (if you select the display Demand option) on the same graph as the usage bars.
• You can select to colorize either TOU or periods.
• Display Demand: labels the Interval usage report as Demand.
6–16 GE ENERGY AGGREGATOR – INSTRUCTION MANUAL

GENERATING AND VIEWING USAGE REPORTS CHAPTER 6: GE ENERGY AGGREGATOR DASHBOARD VIEWER
6. Click OK. The screen closes and you see the previous screen. Click Generate to process the report. You see a progress message while the report is being generated. When the process is complete, you see the following message window.
7. Click the OK button to close the message window. Another window opens asking if you want to view your report. See the next section.
6.3.2.1 View Usage Reports
When you generate a Usage report you have the option to view it right away.
Click Yes to open the report. See the sample report in Appendix A.
GE ENERGY AGGREGATOR – INSTRUCTION MANUAL 6–17

CHAPTER 6: GE ENERGY AGGREGATOR DASHBOARD VIEWER GENERATING AND VIEWING USAGE REPORTS
1. To view Usage reports at any time, click Reports > View Usage Reports. See the example screen shown below.
2. This screen lets you view all of the months with usage data for customer locations. (Click on the + signs next to customer, location, and commodity to see the list of months.) Double-click on a month to view its usage report (or click on the month and click the View Report icon). See the sample report in Appendix A.
If the report hasn’t been generated yet for the month, it is generated when you select it .
3. You can also:
• Click the Options icon to change output options before you generate another usage report, e.g., if you want to use a different format for the report. You will see the Output Options screen shown in “Generate Usage Reports” on page 6-15, step 4.
• Click the Save Report icon to open a window that lets you choose a filename and a save location for a copy of the report.
6.3.3 Generate Custom Reports
As mentioned in “Set Up a Provider” on page 5-4, you can choose to manually generate a Custom report. To do so:
6–18 GE ENERGY AGGREGATOR – INSTRUCTION MANUAL

GENERATING AND VIEWING USAGE REPORTS CHAPTER 6: GE ENERGY AGGREGATOR DASHBOARD VIEWER
1. Select Reports>Generate Custom Usage Report from the Dashboard Viewer’s Menu bar.
2. Select the custom usage report template you want to use from the pull-down menu.
3. If you want to generate the report for another customer and/or location, or for alternate dates, click the Override Template Settings box to check it . You will then be able to choose another customer from the pull-down menu. Once you have chosen a customer (other than “All”), you will be able to choose a customer location from the pull-down menu.
4. Click the Refresh button.
5. You will now be able to select the period for the report from the pull-down menu. If you chose earlier to override template settings, you can also:
• Change the start date - click the Custom Start Date box to check it and select the start date from the calendar displayed when you click the arrow.
GE ENERGY AGGREGATOR – INSTRUCTION MANUAL 6–19
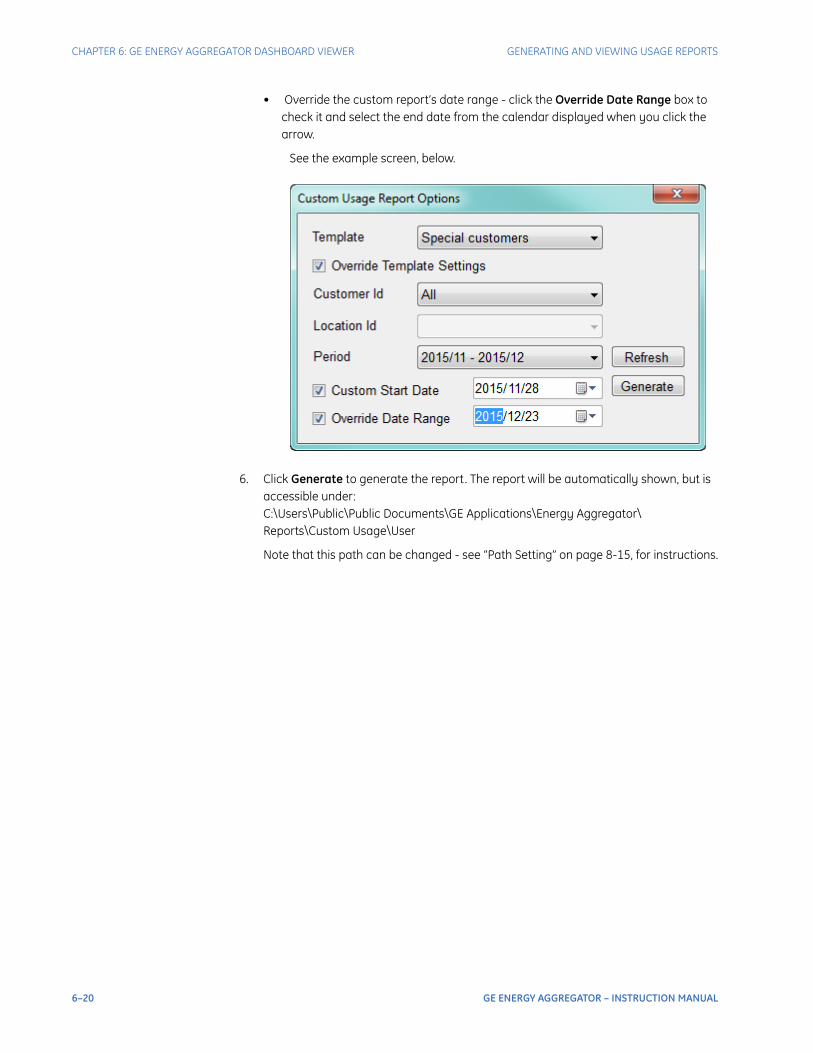
CHAPTER 6: GE ENERGY AGGREGATOR DASHBOARD VIEWER GENERATING AND VIEWING USAGE REPORTS
• Override the custom report’s date range - click the Override Date Range box to check it and select the end date from the calendar displayed when you click the arrow.
See the example screen, below.
6. Click Generate to generate the report. The report will be automatically shown, but is accessible under: C:\Users\Public\Public Documents\GE Applications\Energy Aggregator\ Reports\Custom Usage\User
Note that this path can be changed - see “Path Setting” on page 8-15, for instructions.
6–20 GE ENERGY AGGREGATOR – INSTRUCTION MANUAL

GENERATING AND VIEWING CUSTOMER BILLS CHAPTER 6: GE ENERGY AGGREGATOR DASHBOARD VIEWER
6.4 Generating and Viewing Customer Bills
You use the GE Energy Aggregator application’s GE Energy Aggregator Dashboard Viewer to generate and view bills. See the diagram below.
Figure 6-8: Bill Generation through the GE Energy Aggregator Application
Bills and reports are automatically generated every twelve hours, for any location for which there is a full months’ worth of data. You can also manually generate bills and reports if you want.
GE ENERGY AGGREGATOR – INSTRUCTION MANUAL 6–21

CHAPTER 6: GE ENERGY AGGREGATOR DASHBOARD VIEWER GENERATING AND VIEWING CUSTOMER BILLS
6.4.1 Individual Bills
Bills can be generated individually for a specific location and bill period.
1. Select the location from the Location Tree on the left of the main screen, then select the Bill Period to view by selecting it in the list of Available Bill Data. If the bill has already been generated for the period, the bill generation date will be shown next to the billing period. See the screen shown below.
NOTE
Note It may take a while for the data to be displayed if there are multiple meters at the location, or if there is a lot of data to search. Please be patient.
2. Click the Monthly Utility Bill icon. The software checks to see if the period you selected contains valid data.
NOTE
Note If you want to generate a bill for a time period outside of the regular billing period, for example, a bill for only 3 days, hold control-shift when clicking the Monthly Utility Bill button, and then enter the date range for the bill you want to generate.
6–22 GE ENERGY AGGREGATOR – INSTRUCTION MANUAL

GENERATING AND VIEWING CUSTOMER BILLS CHAPTER 6: GE ENERGY AGGREGATOR DASHBOARD VIEWER
• If the Period contains errors, the View Errors icon appears (see the partial screen, following). Click this icon to see a list all of the errors that prevent the bill from being generated.
• Click on a channel to view the errors in the meter data records. Follow the instructions in Section 7.1.7 to correct errors.
NOTE
NoteNOTES: • Errors can only be corrected from the GE Energy Aggregator Settings Editor.
• Typically, the errors in DEMAND and INTERPOLATE.INTERVAL are caused by the problems in the Root Commodity value. Correct that value before checking the others.
• If the Period contains no data, the Monthly Utility Bill icon is greyed out and displays the message “Unable to generate monthly bill: too many records missing from period.” This happens if you have less then 2 days’ worth of data.
3. While the Bill is being generated, the progress is displayed in a screen.
NOTE
Note You can generate multiple bills for a single bill period, so if you click the Generate Monthly Bill for Selected Bill Period icon twice, you will generate two bills.
GE ENERGY AGGREGATOR – INSTRUCTION MANUAL 6–23

CHAPTER 6: GE ENERGY AGGREGATOR DASHBOARD VIEWER GENERATING AND VIEWING CUSTOMER BILLS
4. Once the bill is generated, it opens in your screen. See the example bill below.
6–24 GE ENERGY AGGREGATOR – INSTRUCTION MANUAL

GENERATING AND VIEWING CUSTOMER BILLS CHAPTER 6: GE ENERGY AGGREGATOR DASHBOARD VIEWER
NOTE: If this bill was generated from Interval Energy data, there will be noPREV(ious) or PRES(ent) usage values.
Usage Chart
GE ENERGY AGGREGATOR – INSTRUCTION MANUAL 6–25

CHAPTER 6: GE ENERGY AGGREGATOR DASHBOARD VIEWER GENERATING AND VIEWING CUSTOMER BILLS
6.4.2 Generate Bills Manually
Bills are generated manually from the GE Energy Aggregator Dashboard Viewer. When a bill is generated, the software analyzes the usage data for the meters at a location, and applies the configured rate structure to that data.
A bill is always generated for a bill period, which is the date range from the billing date of the previous month, to the billing date of the current month. A bill period need not contain a full month’s worth of data: a bill can be manually generated if there is at least two days’ worth of data.
Generate All Bills
1. From the GE Energy Aggregator Dashboard Viewer main screen, click the Generate All Bills icon.
2. While the software is scanning for bills to generate, the list of periods found so far are displayed. You can stop the scan at any time to generate bills from the list of values scanned so far: to do so, click Cancel.
3. When scanning is done (or after you’ve clicked Cancel), the list of available periods is displayed. See the screen shown below.
4. Select which periods you want to generate bills for by clicking in the Generate box. By default, all periods which have no errors, and haven’t been generated before, are selected for generating bills (their box is checked).
NOTE
Note • Any period which already has a bill generated for it appears in grey with an unchecked box. You can still select it , if you want to generate another bill for that period, e.g., if the meter's data was changed after the bill was generated. This can happen if you generate a bill before the end of the month.
• Any period which contains errors, or is missing too much data, appears in red. You cannot generate bills for these periods until you correct the errors (see Section 7.1.7 for instructions).
6–26 GE ENERGY AGGREGATOR – INSTRUCTION MANUAL

GENERATING AND VIEWING CUSTOMER BILLS CHAPTER 6: GE ENERGY AGGREGATOR DASHBOARD VIEWER
5. When you’ve selected all the periods you want to generate bills for, click Generate. While the bill is being generated, the progress is displayed. The Bills to Generate screen closes once the bills have been generated.
Generate All Bills for Customers/Location
Since the Generate All Bills option can take a long time to complete, the GE Energy Aggregator application gives you two additional options for generating a smaller number of bills. Access these options from the Reports > Generate Bills submenu from the GE Energy Aggregator Dashboard Viewer main screen’s Menu bar. The submenu is shown below.
• Click Generate All Bills for Customer to generate all available bills for all locations for the selected customer (the customer currently displayed on the screen).
• Click Generate All Bills for Location to generate all available bills for the selected location (the location currently displayed on the screen).
You will see the Bills to Generate screen shown on the previous page. The instructions are the same as those shown in the Generate All Bills section on the previous page, steps 4 and 5.
NOTE
Note The Generate All Bills for All Customers option is the same as the Generate All Bills option on the previous page.
6.4.3 View Bills
1. You can view generated bills either by clicking the View Bills icon in the GE Energy Aggregator Dashboard Viewer’s main screen, or by clicking Reports > View Bills from the screen’s Menu bar.
NOTE
Note The viewed bill is just a temporary file that has been downloaded from the GE Energy Aggregator Database server, where the bills are stored. Any changes you make to it are not saved on the Database server.
GE ENERGY AGGREGATOR – INSTRUCTION MANUAL 6–27
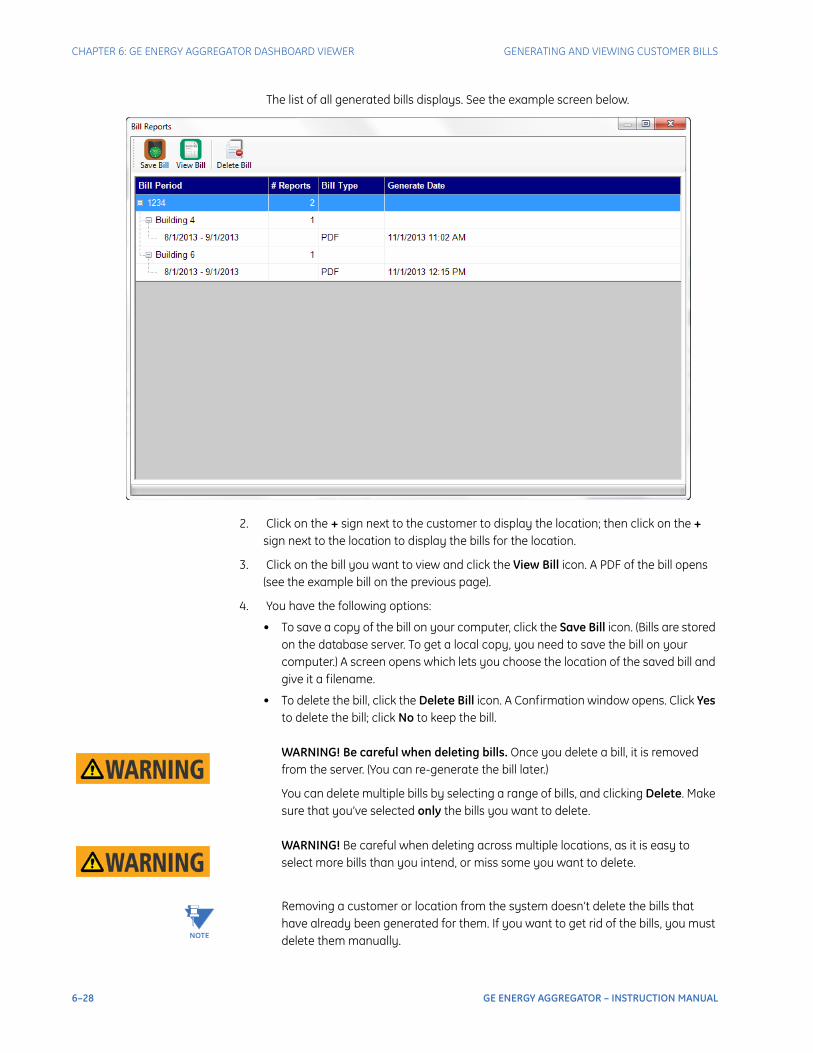
CHAPTER 6: GE ENERGY AGGREGATOR DASHBOARD VIEWER GENERATING AND VIEWING CUSTOMER BILLS
The list of all generated bills displays. See the example screen below.
2. Click on the + sign next to the customer to display the location; then click on the + sign next to the location to display the bills for the location.
3. Click on the bill you want to view and click the View Bill icon. A PDF of the bill opens (see the example bill on the previous page).
4. You have the following options:
• To save a copy of the bill on your computer, click the Save Bill icon. (Bills are stored on the database server. To get a local copy, you need to save the bill on your computer.) A screen opens which lets you choose the location of the saved bill and give it a filename.
• To delete the bill, click the Delete Bill icon. A Confirmation window opens. Click Yes to delete the bill; click No to keep the bill.
WARNING! Be careful when deleting bills. Once you delete a bill, it is removed from the server. (You can re-generate the bill later.)
You can delete multiple bills by selecting a range of bills, and clicking Delete. Make sure that you’ve selected only the bills you want to delete.
WARNING! Be careful when deleting across multiple locations, as it is easy to select more bills than you intend, or miss some you want to delete.
NOTE
Note Removing a customer or location from the system doesn’t delete the bills that have already been generated for them. If you want to get rid of the bills, you must delete them manually.
6–28 GE ENERGY AGGREGATOR – INSTRUCTION MANUAL

GE Energy Aggregator
Chapter 7: Managing Data
GEGrid Solutions
Managing Data
The GE Energy Aggregator application gives you access to the usage data in a variety of ways. You can view the data, copy it, export it , and correct any errors in the meter data.
7.1 View/Copy/Export Meter Data
Follow these steps to view, copy, or export the imported meter data.
1. From the GE Energy Aggregator Settings Editor main screen, use the Tree menu on the left of the screen to navigate to the meter you want. See the example screen below.
Click on meter Click this icon
GE ENERGY AGGREGATOR – INSTRUCTION MANUAL 7–1

CHAPTER 7: MANAGING DATA VIEW/COPY/EXPORT METER DATA
2. Click the Edit Imported Data icon.
3. This screen lets you choose which data point (channel), date range, and type of values you want to view.
• Meter: from the pull-down menu, select the meter whose data you want to view. Only meters at the currently selected location are shown.
• Data Point: the channel of the data to view. There are typically three values for each commodity:
• <commodity>: this is the value from the meter’s logs. These are your base usage values, and are the only values you can change, as all other values are computed from this value; e.g., kWh. If you want to view the “raw” usage data from the meter, select this option.
• <commodity>.interpolate.interval: this is the computed interval value of the commodity, typically in 15 minute periods. The values are interpolated from the root commodity values to correct for odd timestamps and missing data. These values cannot be changed, as they are computed from the root commodity; e.g., kWh. If you want to view the computed interval values, select this option.
• <commodity>.DEMAND: this is the maximum Demand for an hour period, computed from the interpolated interval values for the previous hour. These values cannot be changed, as they are computed from the root commodity; e.g., kWh.DEMAND. If you want to view the max Demand, select this option.
• Start Date: the start date of the data to show. You can only change this field when All Timestamps and Bill Period are unchecked.
• End Date: the end date of the data to show. You can only change this field when All Timestamps and Bill Period are unchecked.
• All Timestamps: select this checkbox to automatically select the entire range of stored data to show.
• Bill Period: select this checkbox to see the date range of the billing data in all available billing periods. Click the pull-down menu to display the date ranges.
7–2 GE ENERGY AGGREGATOR – INSTRUCTION MANUAL

VIEW/COPY/EXPORT METER DATA CHAPTER 7: MANAGING DATA
When you select a date range, the beginning and ending date are displayed in the Start Date and End Date fields.
• Values to Show: the checkboxes provide filters, so that only the data you want to see is shown, e.g., only Errors.
• All Values: show all the values. If this is selected, no other option is valid.
• Rollover: show values flagged as a rollover. This occurs when the previous value is near the configured rollover point, and the current value is near zero. This is not considered an error.
• Increasing Too Fast: show values flagged as increasing too fast. Values which are increasing more then 3 times the trend in the previous hour are considered as increasing too fast, and might indicate a problem. This is considered an error, and must be cleared before a bill can be generated.
• Wobbly Value: are interval energy values which rapidly swing up and down in sequential periods.
• Decreasing Counter: show values flagged as a decreasing counter. Except for the Rollover condition, counters (such as Energy and pulse accumulators, used for Commodities) should never decrease. If they do, this indicates a problem, and must be cleared before a bill can be generated.
• Good Values: show values which are not flagged with an error condition.
4. Once you’ve selected the filters you want to use, click View. The data is retrieved from the database and displayed. Values which are flagged as a warning are shown in Green. Values which are errors and will prevent a bill from being generated are shown in Red. See the example screen below.
GE ENERGY AGGREGATOR – INSTRUCTION MANUAL 7–3

CHAPTER 7: MANAGING DATA VIEW/COPY/EXPORT METER DATA
NoteThis screen lets you view the values, correct any errors in the data, and export the data for external use.
NOTE
NOTES: • This screen is available from both the GE Energy Aggregator Settings Editor and the GE Energy Aggregator Dashboard Viewer, but you can only modify the values using the screen from the GE Energy Aggregator Settings Editor. To view this screen from the GE Energy Aggregator Dashboard Viewer, select the meter whose data you want to view and click Tools > View Bill Data. Only 20,000 points are displayed on the interface at any time. If you are trying to view more than that number of points, click the Next and Previous buttons to scroll the data.
• The preferred method for correcting data errors is described in Section 6.2.
• When viewing Interval Energy values, the times displayed for the values are the beginning of the billing interval the value belongs to.
• The buttons on the top of the screen and their functions are shown below.
7–4 GE ENERGY AGGREGATOR – INSTRUCTION MANUAL

VIEW/COPY/EXPORT METER DATA CHAPTER 7: MANAGING DATA
7.1.1 Export Meters Data
You can export meter data in two ways.
From the Edit Imported Data Screen (shown in Section 7.1: only for GE Energy Aggregator Settings Editor)
1. Click the Export Data icon shown above.
This screen lets you export the data to either the clipboard or a .csv file. Then you can copy the data into another application, such as the Microsoft Excel® application, or use it in your own applications.
2. Use the options in the Output box to specify where to export the data:
• CSV File: exports the data to a CSV (Comma Separated Value) Text file (though you can select other than commas to separate the exported values). When you select this option, you must enter a Filename in the bottom of the screen.
• Clipboard: exports the data to the clipboard. Be careful when using this option, as the amount of data being exported may be very large. When you select this option, you do not enter a filename.
3. The setting in the Layout box controls the layout of the data being exported. The only option is Tabular, which means the data is exported in a table format: rows are data entries and columns are fields.
4. The settings in the Format box control how the output is formatted.
• Column Separator: use this setting to select the character used to separate fields in a row.
• Comma (‘,’) is the most common separator.
• Tab should be selected if you plan to paste the data into a spreadsheet program, e.g., the Microsoft Excel® application.
• Space should be selected if needed by your application.
• Line Separator: use this setting to configure the sequence of characters used to indicate the end of a row. Your options are CRLF and LF. Different operating
GE ENERGY AGGREGATOR – INSTRUCTION MANUAL 7–5

CHAPTER 7: MANAGING DATA VIEW/COPY/EXPORT METER DATA
systems and software applications expect different line endings, but CRLF is the most common.
• Include Column Headers: click this box to put the name of the field at the top of the column, before the start of the data. You may want to leave this box unchecked when using automated processing, if your application doesn’t know to discard the first line (the column headings).
• Include Billing Event Information: click this box to export analysis information, such as error code or modified date, along with the regular data. If you leave this box unchecked, only the Timestamp and Value are exported.
5. File Options: you will see this field if you choose the .csv file Output option. Click Browse to locate the directory for your file and enter a filename.
6. Click Export to export the data. You will see a Confirmation window when the export is complete. Click OK to close the window and the Data Export Options screen.
From the Tools > Export Meters Data (for either the GE Energy Aggregator Settings Editor or the GE Energy Aggregator Dashboard Viewer.)
1. Click Tools > Export Meters Data.
2. The currently selected customer and location are displayed in the screen.
• Select Commodity from the pull-down menu
• Click the Export Cost checkbox if you want cost data exported
• Either click Bill Period and select a period from the pull-down menu, or click Custom Range and select the Start and End Date from the pull-down menus.
3. Click Export . A window opens letting you select the location of the .csv file. You can the copy the data into another application, such as the Microsoft Excel® application, or use it in your own applications.
7–6 GE ENERGY AGGREGATOR – INSTRUCTION MANUAL

EDIT DATA ERRORS CHAPTER 7: MANAGING DATA
7.2 Edit Data Errors
Following is the recommended procedure for correcting data errors, for example, zero values due to problems in communication.
1. From the GE Energy Aggregator Settings Editor Main screen, click Tools > Edit Data Errors. You will see the screen shown below.
2. You use the fields on the right side of the screen to refine your search for data errors. You can specify customer, location, meter, and/or channel, or select Any which will display data errors for all of the entries in that field; for example, to see data errors for all of the meters at a location, select the Location from the Location ID pull-down menu, and then select Any from the Meter ID pull-down menu.
3. Click Scan to cause the software to begin looking for the data errors. When scanning is done, any errors will display on the left side of the screen, along with the meter and timestamp. The fields on the left display the Error Description field, and detailed information regarding the error and ways to handle it are displayed on the right side of the screen.
Select the cus-tomer/location/meter/channel you want to see errors for
Click Scan
GE ENERGY AGGREGATOR – INSTRUCTION MANUAL 7–7

CHAPTER 7: MANAGING DATA EDIT DATA ERRORS
See the example below.
• The top right of the screen displays the timestamp and value of the erroneous data and the timestamps and values around it, to help you diagnose the error and decide what to do about it .
• The bottom right of the screen gives information about the error and the suggested way to handle it .
• Middle right of the screen contains options you can use to handle the error.
4. Use the options shown above to handle the erroneous data:
• New Value: if you know what the value should be, enter it in this field. If the value is wrong, but you don’t know what it should be, use Interpolate (see information below).
• Update: after entering a new value, click this button. The next error, if there is one, is displayed. Update uses the new value for the error record. It doesn’t clear the error, though, so if the new value is wrong, it will still be an error.
Error
Information about the error
Suggested way to handle the error
7–8 GE ENERGY AGGREGATOR – INSTRUCTION MANUAL

RE-AGGREGATE ALL LOCATIONS CHAPTER 7: MANAGING DATA
• Interpolate: if you don’t know what the value should be, click this button to have the software calculate the new value for you. The software can only do this if there are enough intervals before and after the error for it to compute the value from.
• Clear Error: if the error is not something that you can correct by entering a new value, e.g., missing data, click this button. This flags the value as valid, and tells the system that you want to use this value to compute reports.
• Previous: to view the error before this one, click this button.
• Next: to view the error after this one, click this button.
5. Click the Commit button to save all your changes. The software re-analyzes the data, and presents the results in the Scan and Edit Errors screen. If all the data is good, the screen should show no errors.
6. If you have any more errors to correct, click Filter to re-display the selection fields on the right side of the screen, and then click Scan to view and address the errors. If you do not have any more errors to correct, click X to close the window.
7.3 Re-Aggregate All Locations
You can force all aggregate meters to reaggregate the data from their locations:
1. From the GE Energy Aggregator Settings Editor, click Tools > Database Maintenance > Re-aggregate all Locations.
2. You will see a progress screen as the re-aggregation is taking place.
7.4 Rebuild Period Analysis
All data ranges are based off the Period Analysis, to provide faster access to data. You can force each location to rebuild this analysis:
1. From the GE Energy Aggregator Settings Editor, click Tools > Database Maintenance > Rebuild Period Analysis.
2. You will see a progress screen as the rebuilding takes place.
GE ENERGY AGGREGATOR – INSTRUCTION MANUAL 7–9

CHAPTER 7: MANAGING DATA REBUILD PERIOD ANALYSIS
7–10 GE ENERGY AGGREGATOR – INSTRUCTION MANUAL

GE Energy Aggregator
Chapter 8: Additional Features and Advanced Functions
GEGrid Solutions
Additional Features and Advanced Functions
8.1 Viewing the Action Log
The GE Energy Aggregator application has a log in which actions such as importing, generating bills, updating data and sending emails are stored. You can view this log through the Action Log Viewer, which is available from the GE Energy Aggregator Settings Editor. In addition, errors can be viewed and corrected from the Action Log Viewer.
GE ENERGY AGGREGATOR – INSTRUCTION MANUAL 8–1

CHAPTER 8: ADDITIONAL FEATURES AND ADVANCED FUNCTIONS VIEWING THE ACTION LOG
1. From the GE Energy Aggregator Settings Editor, click Tools > View Action Log. See the example screen below.
2. The actions are listed on the screen, along with the date/time the action took place, the location the action was performed for, and a description of the action. You can use the scroll bars or expand the screen to view all of the actions and the information for them. Any errors are shown in red.
3. To display options, right-click on the action or error:
• If you right-click on an action, you can select to:
• Repeat the action, e.g., re-import data if the action is “Importing”
• Acknowledge All Errors: they won’t show in red anymore.
• Delete Selected Actions: remove the action from the action log
• Hide Details/Show Details: this option toggles between hiding or displaying the detailed information on the right side of the screen.
• If you right-click on an Error, you have an additional option:
• Mark as Acknowledged Error/Mark as Unacknowledged Error: this option toggles between acknowledging the error and removing acknowledgement of the error.
8–2 GE ENERGY AGGREGATOR – INSTRUCTION MANUAL

VIEWING THE ACTION LOG CHAPTER 8: ADDITIONAL FEATURES AND ADVANCED FUNCTIONS
4. The options at the top of the screen let you:
• Refresh the action display by clicking the Refresh icon.
• Select the order of action display by clicking in the View By pull-down menu. The choices are Date/Time (the default setting), Customers, and Action Type.
• Acknowledge all Errors by clicking the checkmark icon.
• Export to XML by checking the document icon: this copies the action log in XML format - you can then paste it into an XML file.
• Re-import meter data by selecting the two arrows icon.
• Select between Show All Actions and Select Unacknowledged Action Errors from the pull-down menu.
• Clear all actions by clicking the red X. You will see a Confirmation message window.
• Clear any selected action (highlighted action) by clicking the red exclamation point. You will see a Confirmation message window.
5. If there is an error associated with an action, you can correct the error and then perform the action again from the Action Log Viewer screen. For example, if there is an error in importing, you can correct it , and then click on the original action and select Re-import Data.
GE ENERGY AGGREGATOR – INSTRUCTION MANUAL 8–3

CHAPTER 8: ADDITIONAL FEATURES AND ADVANCED FUNCTIONS VIEWING THE ACTION LOG
8.1.1 The Service Status Bar
The bottom right of the GE Energy AggregatorSettings Editor gives you information on the number of pending meter data imports and the number of failed imports.
The Imports Count will only show meters for which there is actually something to be imported.
To review any imports which failed, and to see details on the pending imports, click on the green arrow to display the menu with View Imports. When you click on View Imports a screen displays that allows you to see the current status of meters being imported, as well as the history of the imports.
This screen can be used to identify if there are any problems with the data being imported, as well as when a meter's data was last updated.
The Import Status section of the screen provides information about the imports currently being processed. The fields shown are:
• Queue: The number of imports which are currently pending to be done.
• Status: The action being performed by the current import.
• Device: If the meter being imported is connected to the GE MeterManager Meter List, the device will be listed here. This can be particularly useful, as GE MeterManager can automatically queue the import for the meter when it has finished retrieving the logs from the meter.
• Meter: The name of the GE Energy Aggregator meter that is currently being imported. For Location Virtual Meter Aggregations, the location will be listed here.
• Time Start: When the import started.
ImportsCount
Errors Count
8–4 GE ENERGY AGGREGATOR – INSTRUCTION MANUAL

VIEWING THE ACTION LOG CHAPTER 8: ADDITIONAL FEATURES AND ADVANCED FUNCTIONS
The Import History section of the screen provides information about what imports have been performed. It lists the last 1000 imports that have been performed. If nothing needed to be done for the import, it will be added to the No Action count, and no history item will be recorded.
NOTE
Note This history will reset when the GE MeterManager Service is restarted.
The fields shown are:
• Import Start: This lists when the import action started.
• Device: If the meter being imported is connected to the GE MeterManager Meter List, the device will be listed here. This can be particularly useful, as GE MeterManager can automatically queue the import for the meter when it has finished retrieving the logs from the meter.
• Meter: The name of the GE Energy Aggregator meter that is currently being imported. For Location Virtual Meter Aggregations, the location will be listed here.
• Duration: How long the import took.
• Data Start: The first timestamp of the data being imported to GE Energy Aggregator.
• Data End: The last timestamp of the data being imported to GE Energy Aggregator.
• Error: If any errors occurred while importing the data, they will be listed here.
GE ENERGY AGGREGATOR – INSTRUCTION MANUAL 8–5

CHAPTER 8: ADDITIONAL FEATURES AND ADVANCED FUNCTIONS DATABASE MAINTENANCE
8.2 Database Maintenance
The GE Energy Aggregator Settings Editor gives you options for maintaining the GE Energy Aggregator application database. To access these options:
1. From the GE Energy Aggregator Settings Editor, click Tools > Database Maintenance > Maintenance Utilities from the main screen’s Menu bar. You will see the screen shown below, displaying a warning message.
2. Click Continue to access the database options, explained in the next sections.
8–6 GE ENERGY AGGREGATOR – INSTRUCTION MANUAL

DATABASE MAINTENANCE CHAPTER 8: ADDITIONAL FEATURES AND ADVANCED FUNCTIONS
8.2.1 Database List
To view existing databases:
1. From the Database Maintenance List , click the Database List tab (this is the first tab displayed when the Database Maintenance screen opens, so you may not need to click the tab to see it).
2. This screen displays the status (Open or Closed) of the databases and information about them.
8.2.2 Archive Database Clusters
To ensure that your data is backed up, or if you want to migrate the database server from one computer to another, you can archive your database cluster. This creates a local copy of the data, which can later be uploaded to a server to restore the database to the saved condition. NOTE: This function copies all of the data on the database server. Using this to restore to a server will overwrite all data.
• A database archive can be extremely large. For example, a database with hundreds of meters, with data accrued for a few years, can be at least 20GB in size. Make sure you have the room to store the archive.
• Only the data stored on the server is saved. The server’s settings and configuration must be manually re-configured when the data is restored.
GE ENERGY AGGREGATOR – INSTRUCTION MANUAL 8–7

CHAPTER 8: ADDITIONAL FEATURES AND ADVANCED FUNCTIONS DATABASE MAINTENANCE
1. From the Database Maintenance screen, click the Archive Databases tab.
2. Click the Browse button to choose the location you want to save the archive to.
3. To save the database to a single file, leave the checkbox selected. This option makes it easier to store and transfer the archive, but may cause problems for older operating systems.
You should disconnect the database so that no one else can modify it while you are performing the archive. Otherwise the archive may be corrupted.
4. Click the Begin Archive button. You will see the message window shown on the right. Click OK to continue. Once you begin archiving the database, the process won’t stop until the entire database has been archived. As the message says, this can take a very long time, so be patient.
8–8 GE ENERGY AGGREGATOR – INSTRUCTION MANUAL
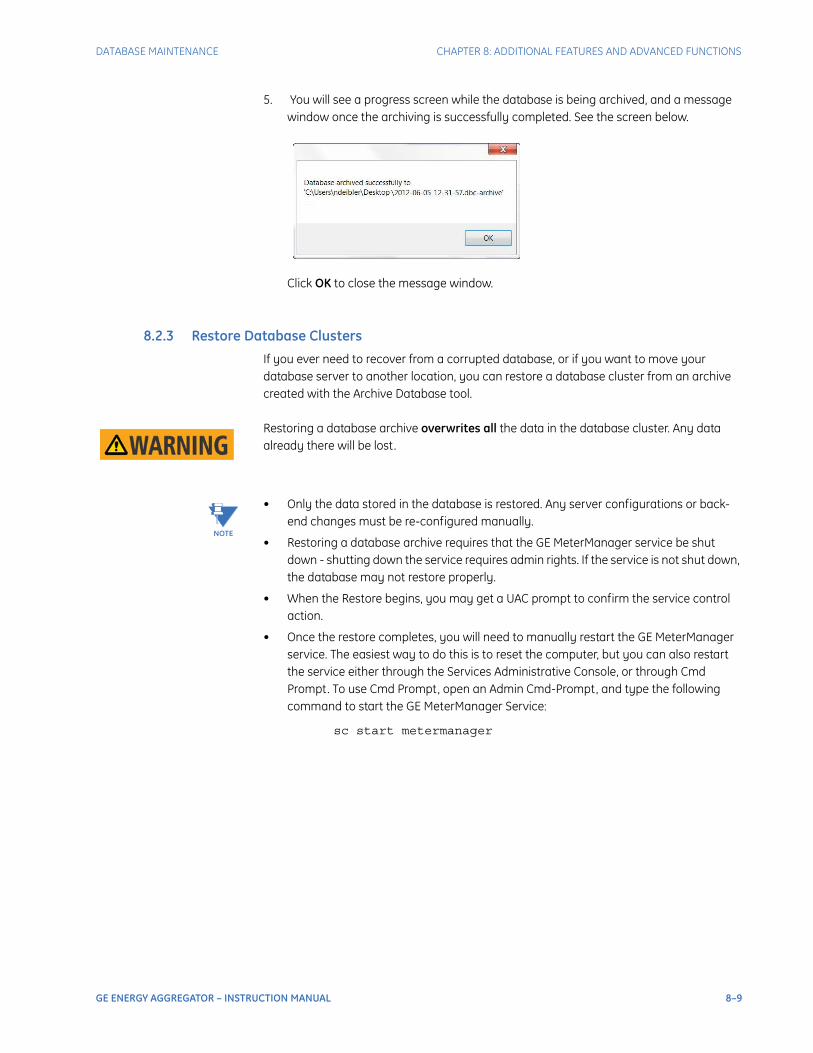
DATABASE MAINTENANCE CHAPTER 8: ADDITIONAL FEATURES AND ADVANCED FUNCTIONS
5. You will see a progress screen while the database is being archived, and a message window once the archiving is successfully completed. See the screen below.
Click OK to close the message window.
8.2.3 Restore Database Clusters
If you ever need to recover from a corrupted database, or if you want to move your database server to another location, you can restore a database cluster from an archive created with the Archive Database tool.
Restoring a database archive overwrites all the data in the database cluster. Any data already there will be lost.
NOTE
Note • Only the data stored in the database is restored. Any server configurations or back-end changes must be re-configured manually.
• Restoring a database archive requires that the GE MeterManager service be shut down - shutting down the service requires admin rights. If the service is not shut down, the database may not restore properly.
• When the Restore begins, you may get a UAC prompt to confirm the service control action.
• Once the restore completes, you will need to manually restart the GE MeterManager service. The easiest way to do this is to reset the computer, but you can also restart the service either through the Services Administrative Console, or through Cmd Prompt. To use Cmd Prompt, open an Admin Cmd-Prompt, and type the following command to start the GE MeterManager Service:
sc start metermanager
GE ENERGY AGGREGATOR – INSTRUCTION MANUAL 8–9

CHAPTER 8: ADDITIONAL FEATURES AND ADVANCED FUNCTIONS DATABASE MAINTENANCE
1. From the Database Maintenance screen, click the Restore Databases tab.
2. Click Browse to locate the database archive you want to restore.
3. If the archive was stored in a single file, leave the checkbox selected. If it was stored in multiple files, uncheck the box.
4. Click Begin Restore to restore the database. You will see the message window shown below.
5. Click Yes to continue. You will see the message window shown.
8–10 GE ENERGY AGGREGATOR – INSTRUCTION MANUAL

DATABASE MAINTENANCE CHAPTER 8: ADDITIONAL FEATURES AND ADVANCED FUNCTIONS
6. Click Yes to continue. You will see the message window shown on the right. Key RESTORE in the blank field and click OK.
7. While the database is being restored you will see a screen showing the progress.
If there is a large amount of data, this process may take a long time to complete, e.g., it will take hours to restore a 20 Gigabyte database archive. When the restore is done, the window closes. You can now re-open the GE Energy Aggregator application.
8.2.4 Clear Database
You can clear a database with this procedure.
Make very sure that you want to delete all of the data in the database before you click Delete Databases. This command deletes all imported data and all configured settings, including all bills and any changes you have made to data.
1. From the Database Maintenance screen, click the Clear Databases tab.
2. Click the Delete Databases button.
GE ENERGY AGGREGATOR – INSTRUCTION MANUAL 8–11

CHAPTER 8: ADDITIONAL FEATURES AND ADVANCED FUNCTIONS DATABASE MAINTENANCE
8.2.5 Server Status
1. From the Database Maintenance screen, click the Server Status tab.
2. You have three options:
• Restart: click this button to start the local database server after it has been shut down.
• Shutdown: click this button to close the local database server. You see a window that shows the progress of stopping the server, and then a window telling you that the software must be shutdown to finish stopping the server. Click OK to proceed with the shutdown.
NOTE
Note The local database server does not close when you exit the GE Energy Aggregator application. You must use this command if you want to close it .
• Start: click this button to start the main Database server (not the local database server) if it is not opening correctly (it should open when the software starts).
8–12 GE ENERGY AGGREGATOR – INSTRUCTION MANUAL
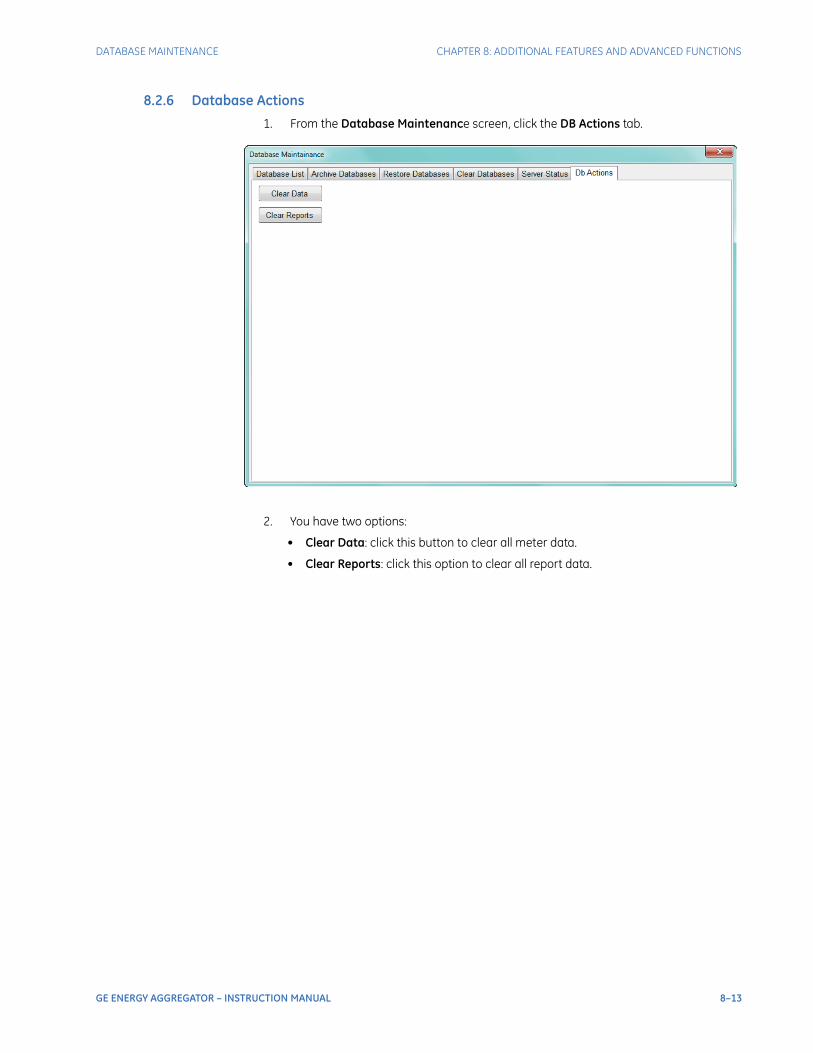
DATABASE MAINTENANCE CHAPTER 8: ADDITIONAL FEATURES AND ADVANCED FUNCTIONS
8.2.6 Database Actions
1. From the Database Maintenance screen, click the DB Actions tab.
2. You have two options:
• Clear Data: click this button to clear all meter data.
• Clear Reports: click this option to clear all report data.
GE ENERGY AGGREGATOR – INSTRUCTION MANUAL 8–13

CHAPTER 8: ADDITIONAL FEATURES AND ADVANCED FUNCTIONS CLEAR METER DATA
8.3 Clear Meter Data
The GE Energy Aggregator Settings Editor gives you the option to clear meter data. You may want to do this if you imported the incorrect data or corrupted data and want to remove it .
1. From the GE Energy Aggregator Settings Editor Location screen, highlight the meter whose data you want to clear. See the example screen below.
2. From the Menu bar, click Tools > Database Maintenance > Clear Meter Data.
3. You will see a window that prompts you to enter DELETE. See the example screen on the right. Type DELETE in the entry field and click OK to delete the meter data.
4. You will see the message window on the right. Click OK to close the message window.
8–14 GE ENERGY AGGREGATOR – INSTRUCTION MANUAL

OPTION SCREENS CHAPTER 8: ADDITIONAL FEATURES AND ADVANCED FUNCTIONS
8.4 Option Screens
Both the GE Energy Aggregator Settings Editor and GE Energy Aggregator Dashboard Viewer have an Options screen. You access this screen by clicking Tools > Options from the main screen’s Menu bar. The screen has four tabs for settings: Paths, Configuration, UI, and Language. The settings are the same on both screens, except for the Paths settings. See the screens below.
8.4.1 Path Setting
GE Energy Aggregator Dashboard Viewer setting:
• Default Bill Definition: this is the template for the bills. Click Browse to set up another location.
• Plug-in Directory: not used at the current time.
• Report Path: this is the default location for all custom usage reports, bills, and executive summary reports. Click Browse to set up another location for all of the reports.
GE Energy Aggregator Settings Editor settings:
• Pg Tools Path: this is the path to the pg_tools exe, which is a utility used to archive, restore, and perform other maintenance operations on the database cluster. Click Browse to set up another location.
• Default Archive Path: this is the default location where the archive is stored when the database cluster is archived. Click Browse to select the location.
GE Energy Aggregator Settings Editor Options GE Energy Aggregator Dashboard Viewer Options
GE ENERGY AGGREGATOR – INSTRUCTION MANUAL 8–15

CHAPTER 8: ADDITIONAL FEATURES AND ADVANCED FUNCTIONS OPTION SCREENS
8.4.2 Configuration Setting
The settings are similar for the GE Energy Aggregator Dashboard Viewer and the GE Energy Aggregator Settings Editor. This setting controls what options are available to the user.
1. Click the Configuration tab. You will see the screen shown below from the GE Energy Aggregator Settings Editor. The Options screen from the GE Energy Aggregator Dashboard Viewer does not have the Autoconfigure Weather Data checkbox.
2. Click the radio button of the option you want to set:
• Basic restricts access to functional billing tasks and provides a user friendly interface to configure settings.
• Advanced provides access to all options, and should only be chosen for advanced users.
3. The Weather Data section lets you select Celsius or Fahrenheit from the pull-down menu.
4. The default Weather Data configuration is Auto-Configure. If you do not wish to automatically configure settings for weather data acquisition for new locations at the time they are first created, click on the Autoconfigure Weather Data button to disable this feature.
8–16 GE ENERGY AGGREGATOR – INSTRUCTION MANUAL

OPTION SCREENS CHAPTER 8: ADDITIONAL FEATURES AND ADVANCED FUNCTIONS
5. If you’ve made a change, when you click OK you will see this window.
6. Click Yes to restart the GE Energy Aggregator software now; click No if you don’t want to restart the software.
NOTE
Note Changes you make won’t take effect until you restart the software.
GE ENERGY AGGREGATOR – INSTRUCTION MANUAL 8–17

CHAPTER 8: ADDITIONAL FEATURES AND ADVANCED FUNCTIONS OPTION SCREENS
8.4.3 UI (User Interface) Setting
Except for one setting, the GE Energy Aggregator Dashboard Viewer and GE Energy Aggregator Settings Editor Option screens have the same UI settings.
1. Click the UI tab. The screen shown below is from the GE Energy Aggregator Dashboard Viewer. The Options screen from the GE Energy Aggregator Settings Editor does not have Display option.
2. These are the setting options:
• Warn on software close: this setting asks the user to confirm closing the software. The default of the setting is checked - selected. To un-select the setting click on the checkbox to remove the checkmark.
• Warn on startup if the root path is invalid: this setting verifies that the database server has been configured correctly and is accessible. The default of the setting is checked - selected. To un-select the setting click on the checkbox to remove the checkmark (this is not recommended).
• Show debug window: click the checkbox to show the debug trace window while the software is running.
• Display units in Dashboard - select either Usage or Demand.
3. Click OK to close the screen and apply your settings.
8–18 GE ENERGY AGGREGATOR – INSTRUCTION MANUAL

OPTION SCREENS CHAPTER 8: ADDITIONAL FEATURES AND ADVANCED FUNCTIONS
8.4.4 Language
This feature allows you to select a translation of the software to use, as well as providing a tool that can be used to translate the software.
1. Click the Language tab from the GE Energy Aggregator Settings Editor or Dashboard Viewer Options screen.
2. Select from the available languages from the pull-down menu. You can click Language File Information for details of the selected Language file.
3. To add a new translation, click the Create New Language button.
GE ENERGY AGGREGATOR – INSTRUCTION MANUAL 8–19

CHAPTER 8: ADDITIONAL FEATURES AND ADVANCED FUNCTIONS OPTION SCREENS
4. Enter the language name and click OK.
5. Use the screen shown above to enter the translations. You enter the translation in the Translation column for each term in the Phrase column. See the example screen below.
6. When you have finished entering the translations, click Save Changes to save the language file.
8–20 GE ENERGY AGGREGATOR – INSTRUCTION MANUAL

OPTION SCREENS CHAPTER 8: ADDITIONAL FEATURES AND ADVANCED FUNCTIONS
7. The Language screen is redisplayed. Select the language you want to use from the pull-down menu and click OK. You will see the following confirmation window.
8. Click Yes. The software will shut down. Open it again to display the translated application.
GE ENERGY AGGREGATOR – INSTRUCTION MANUAL 8–21

CHAPTER 8: ADDITIONAL FEATURES AND ADVANCED FUNCTIONS PERFORMING TASKS USING COMMAND LINE
8.5 Performing Tasks Using Command Line
You can trigger an import of all meters or generate all bills from command line. This feature is used if you wish to launch the GE Energy Aggregator application from a third party application and have it run tasks. Using the command line, the GE Energy Aggregator application can be embedded, as a launch command, into any third party application.
8.5.1 Import Data Using Command Line
This can be useful for automating the importing of data. The command you use is as follows:
“[Path]\BillSettingsEditor.Master.exe” --script --import meter=all
NOTE
Note IMPORTANT!
• [Path] is the path to the application on your PC.
• You must include the quotation marks. For example: “C:\Program Files (x86)\GE Applications\Energy Aggregator\ BillSettingsEditor\BillSettings Editor.Master.exe” --script --import meter=all
8.5.2 Generate All Bills Using Command Line
This can be useful for automating the generation of bills. Make sure this runs after all the data for the month has been imported. The command you use is as follows:
"[Path]\BillViewer\BillViewer.exe" --script --generate_bill
NOTE
Note IMPORTANT!
• [Path] is the path to the application on your PC.
• You must include the quotation marks. For example: “C:\Program Files (x86)\GE Applications\Energy Aggregator\ BillViewer\BillViewer.exe” --script --generate_bill
8–22 GE ENERGY AGGREGATOR – INSTRUCTION MANUAL
REMOTE ACCESS CHAPTER 8: ADDITIONAL FEATURES AND ADVANCED FUNCTIONS
8.6 Remote Access
In order to help secure your data, GE Energy Aggregator by default, does not allow remote access to the server. If you have a need to access the GE Energy Aggregator data from a remote computer, you can enable remote access. To do so:
1. From the Settings Editor, click Tools > Database Maintenance > Remote Access > Enable Remote Access - note that this action requires admin rights. An exception is created in the Windows Firewall and connections from other computers will be accepted by the GE Energy Aggregator Data Server.
2. To disable remote access, click Tools > Database Maintenance > Remote Access > Disable Remote Access - note that this action also requires admin rights. Connections from other computers will no longer be accepted by the GE Energy Aggregator Data Server.
GE ENERGY AGGREGATOR – INSTRUCTION MANUAL 8–23

CHAPTER 8: ADDITIONAL FEATURES AND ADVANCED FUNCTIONS REMOTE ACCESS
8–24 GE ENERGY AGGREGATOR – INSTRUCTION MANUAL

GE Energy Aggregator
A: Sample Usage Summary Report
GEGrid Solutions
Sample Usage Summary Report
GE ENERGY AGGREGATOR – INSTRUCTION MANUAL A–1

CHAPTER A: SAMPLE USAGE SUMMARY REPORT
Figure A-1: Description of the Report Data
GE- EngineeringAugust, 2014 - Usage Summary Report
Usage Summary Report for GE- Engineering – August 2014This report provides a summary of the kWh usage for GE- Engineering from Friday, August 01, 2014 to Sunday, August 31, 2014. This report was generated on Tuesday, October 07, 2014.
Meter ReportEach meter report contains 6 sub-reports:
1. Month UsageSummarizes the usage of the meter over the course of August 2014, from 08/01/2014 00:00:00 to 08/31/2014 23:59:00. All values presented are the computed 15 minute interval values of the recorded commodity (kWh), summed over the specified interval. 4 values are presented:
a. Total Usage – The sum of all the 15 minute interval values over the period of the report.b. Peak Usage – The peak 15 minute interval value over the period of the report.c. Month Usage – A graph of the summed usage of each day during the period of the report.d. Month Trend – A trend graph of the 15 minute interval values during the period of the report.
2. Peak Week UsageSummarizes the usage of the meter over the course of the peak week during August 2014. The peak week is defined as the week containing the peak day. All values presented are the computed 15 minute interval values of the recorded commodity (kWh), summed over the specified interval. 4 values are presented:
a. Total Usage – The sum of all the 15 minute interval values over the period of the peak week.b. Peak Usage – The peak 15 minute interval value over the period of the peak week.c. Usage over the Week – A graph of the summed usage of each day during the peak week.d. Trend over the Week – A trend graph of the 15 minute interval values during the peak week.
3. Peak Day UsageSummarizes the usage of the meter over the course of the peak day during August 2014. The peak day is defined as the day which has the highest total usage. All values presented are the computed 15 minute interval values of the recorded commodity (kWh), summed over the specified interval. 3 values are presented:
a. Total Usage – The sum of all the 15 minute interval values during the peak day.b. Peak Usage – The peak 15 minute interval value during the peak day.c. Usage over the Day – A graph of the 15 minute interval values during the peak day.
4. Average Hourly and Daily UsageDisplays the average usage over the course of the month, averaged by hour, and by weekday. The highest and lowest usage for each hour and weekday over the course of the month are determined, and displayed as the bounding lines in Red and Green.
5. Comparison to previous Month and YearDisplays a comparison of daily usage between this month and last month, and this month this year and this month last year. The daily usage is lined up by week day for each month. The numbers at the bottom indicate what day in the month each bar represents: The top value is the current month, the bottom value the month being compared against.
6. Monthly Usage and TemperatureDisplays a comparison of monthly usage and temperature. The highest and lowest temperature for each day over the course of the month are determined, and displayed as the bounding lines in Red and Green.
A–2 GE ENERGY AGGREGATOR – INSTRUCTION MANUAL

CHAPTER A: SAMPLE USAGE SUMMARY REPORT
Figure A-2: Monthly usage summary - aggregated meter, building, all individual meters
GE- EngineeringAugust, 2014 - Usage Summary Report
Monthly Usage SummaryCustomer GE- EngineeringMonth Date 08/01/2014 to 08/31/2014Commodity kWh
FFigure MMeter Location MMeter Name MMeter Type MMeter Serial TTotal Usage PPeak Usage PPeak Demand1 Main Building Aggregated Meter Aggregated Meter 17731 14 572 Main Building 0123995130 17345 14 563 Main Building Cubicle 1 0145324120 71 0 04 Main Building Cubicle 2 0126370221 50 0 05 Main Building Cubicle 3 0145324019 55 0 06 Main Building Cubicle 4 0145324423 69 0 07 Main Building Cubicle 5 0145324524 9 0 08 Main Building Cubicle 6 0145282931 98 0 19 Main Building Cubicle 7 0145324221 35 0 0
GE ENERGY AGGREGATOR – INSTRUCTION MANUAL A–3

CHAPTER A: SAMPLE USAGE SUMMARY REPORT
Figure A-3: Highest usage comparison for the building and each meterA: Sample Usage Summary Report
*E- EngineeringAugust, 2014 - Usage Summary Report
Highest Usage Meter ComparisonCustomer *E- Engineering
Commodity kWhHighest Usage Meter Main Building:1800ShamesDr @ 17345Lowest Usage Meter Main Building:Cubicle 5 @ 9
Top Usage Meters
Highest usage comparison for the building and each meter
123 Main St.
A–4 GE ENERGY AGGREGATOR – INSTRUCTION MANUAL

CHAPTER A: SAMPLE USAGE SUMMARY REPORT
Figure A-4: Monthly usage for aggregated meter and all individual meters
GE- EngineeringAugust, 2014 - Usage Summary Report
Monthly Usage at a GlanceCustomer E- EngineeringMonth Date 08/01/2014 to 08/31/2014Commodity kWh
Main Building : Aggregated Meter 1 Main Building : 2
Main Building : Cubicle 1 3 Main Building : Cubicle 2 4
Main Building : Cubicle 3 5 Main Building : Cubicle 4 6
Main Building : Cubicle 5 7 Main Building : Cubicle 6 8
GE ENERGY AGGREGATOR – INSTRUCTION MANUAL A–5

CHAPTER A: SAMPLE USAGE SUMMARY REPORT
Figure A-5: Aggregated meter total usage during month
E- EngineeringAugust, 2014 - Usage Summary Report
Main Building : Aggregated MeterTotal Usage during Month08/01/2014 to 08/31/2014
Total Usage 17731Peak Usage 14Peak Demand 57
A–6 GE ENERGY AGGREGATOR – INSTRUCTION MANUAL

CHAPTER A: SAMPLE USAGE SUMMARY REPORT
Figure A-6: Aggregated meter total usage during peak week
E- EngineeringAugust, 2014 - Usage Summary Report
Main Building : Aggregated MeterTotal Usage during Peak Week08/10/2014 to 08/16/2014
Total Usage 3929Peak Usage 14
GE ENERGY AGGREGATOR – INSTRUCTION MANUAL A–7
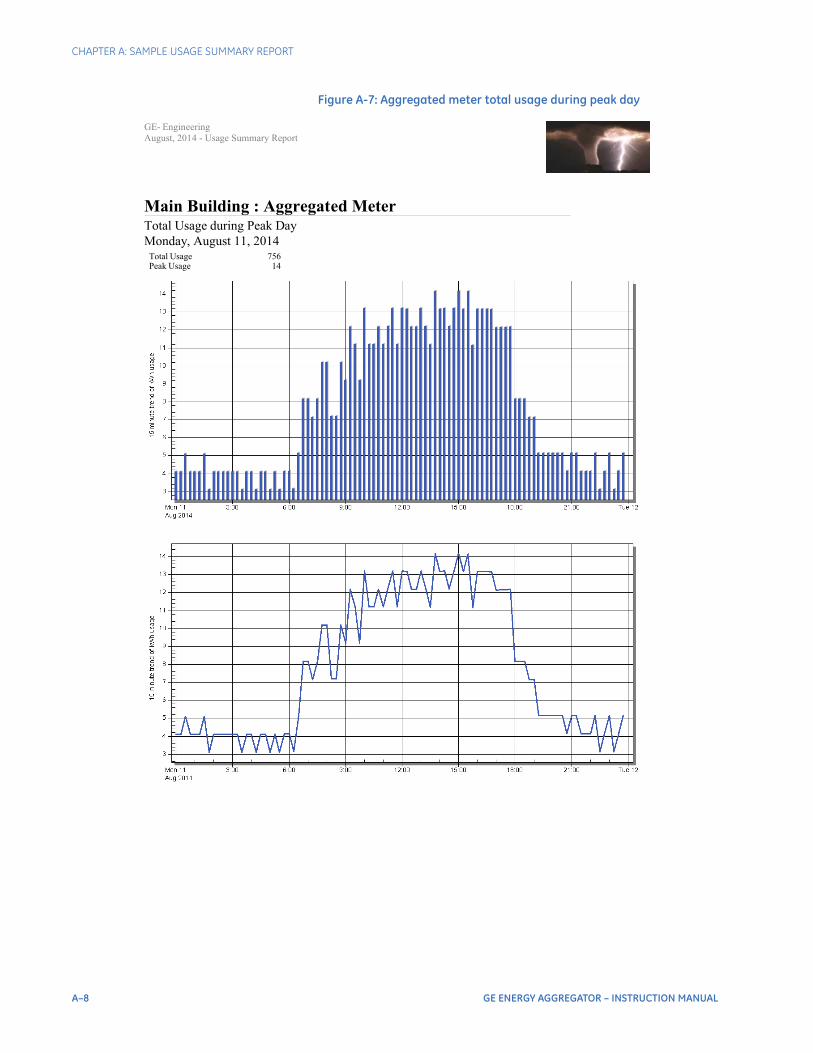
CHAPTER A: SAMPLE USAGE SUMMARY REPORT
Figure A-7: Aggregated meter total usage during peak day
E- EngineeringAugust, 2014 - Usage Summary Report
Main Building : Aggregated MeterTotal Usage during Peak DayMonday, August 11, 2014
Total Usage 756Peak Usage 14
A–8 GE ENERGY AGGREGATOR – INSTRUCTION MANUAL

CHAPTER A: SAMPLE USAGE SUMMARY REPORT
Figure A-8: Aggregated meter average hourly and daily usage
E- EngineeringAugust, 2014 - Usage Summary Report
Main Building : Aggregated MeterAverage Hourly and Daily UsageDisplays the average usage over the course of the month, averaged by hour, and by weekday. The highest and lowest usage for each hour and weekday over the course of the month are determined, and displayed as the bounding lines in Red and Green.
GE ENERGY AGGREGATOR – INSTRUCTION MANUAL A–9
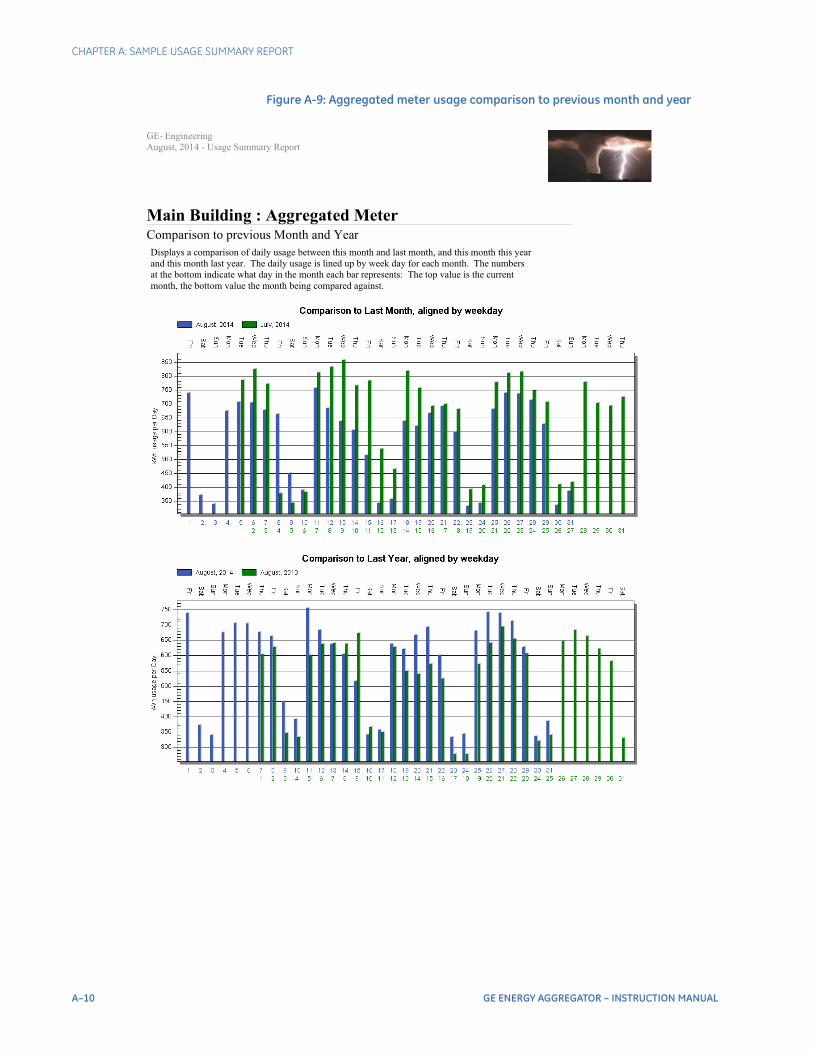
CHAPTER A: SAMPLE USAGE SUMMARY REPORT
Figure A-9: Aggregated meter usage comparison to previous month and year
E- EngineeringAugust, 2014 - Usage Summary Report
Main Building : Aggregated MeterComparison to previous Month and YearDisplays a comparison of daily usage between this month and last month, and this month this year and this month last year. The daily usage is lined up by week day for each month. The numbers at the bottom indicate what day in the month each bar represents: The top value is the current month, the bottom value the month being compared against.
A–10 GE ENERGY AGGREGATOR – INSTRUCTION MANUAL

CHAPTER A: SAMPLE USAGE SUMMARY REPORT
Figure A-10: Aggregated meter monthly usage compared to temperature
E- EngineeringAugust, 2014 - Usage Summary Report
Main Building : Aggregated MeterMonthly Usage and TemperatureDisplays a comparison of monthly usage and temperature. The highest and lowest temperature for each day over the course of the month are determined, and displayed as the bounding lines in Red and Green.
GE ENERGY AGGREGATOR – INSTRUCTION MANUAL A–11

CHAPTER A: SAMPLE USAGE SUMMARY REPORT
Figure A-11: Main building total usage during month
E- EngineeringAugust, 2014 - Usage Summary Report
Main Building : Total Usage during Month08/01/2014 to 08/31/2014
Total Usage 17345Peak Usage 14Peak Demand 56
A–12 GE ENERGY AGGREGATOR – INSTRUCTION MANUAL

CHAPTER A: SAMPLE USAGE SUMMARY REPORT
Figure A-12: Main building total usage during Peak week
E- EngineeringAugust, 2014 - Usage Summary Report
Main Building : Total Usage during Peak Week08/10/2014 to 08/16/2014
Total Usage 3838Peak Usage 14
GE ENERGY AGGREGATOR – INSTRUCTION MANUAL A–13

CHAPTER A: SAMPLE USAGE SUMMARY REPORT
Figure A-13: Main building total usage during Peak day
E- EngineeringAugust, 2014 - Usage Summary Report
Main Building : 123 Main St.Total Usage during Peak DayMonday, August 11, 2014
Total Usage 741Peak Usage 14
A–14 GE ENERGY AGGREGATOR – INSTRUCTION MANUAL

CHAPTER A: SAMPLE USAGE SUMMARY REPORT
Figure A-14: Main building average hourly and daily usage
E- EngineeringAugust, 2014 - Usage Summary Report
Main Building : Average Hourly and Daily UsageDisplays the average usage over the course of the month, averaged by hour, and by weekday. The highest and lowest usage for each hour and weekday over the course of the month are determined, and displayed as the bounding lines in Red and Green.
GE ENERGY AGGREGATOR – INSTRUCTION MANUAL A–15

CHAPTER A: SAMPLE USAGE SUMMARY REPORT
Figure A-15: Main building comparison to previous month and year
E- EngineeringAugust, 2014 - Usage Summary Report
Main Building : 123 Main St.Comparison to previous Month and YearDisplays a comparison of daily usage between this month and last month, and this month this year and this month last year. The daily usage is lined up by week day for each month. The numbers at the bottom indicate what day in the month each bar represents: The top value is the current month, the bottom value the month being compared against.
A–16 GE ENERGY AGGREGATOR – INSTRUCTION MANUAL

CHAPTER A: SAMPLE USAGE SUMMARY REPORT
Figure A-16: Main building monthly usage compared to temperature
E- EngineeringAugust, 2014 - Usage Summary Report
Main Building : Monthly Usage and TemperatureDisplays a comparison of monthly usage and temperature. The highest and lowest temperature for each day over the course of the month are determined, and displayed as the bounding lines in Red and Green.
GE ENERGY AGGREGATOR – INSTRUCTION MANUAL A–17

CHAPTER A: SAMPLE USAGE SUMMARY REPORT
Figure A-17: Meter 1 total usage during month
E- EngineeringAugust, 2014 - Usage Summary Report
Main Building : Cubicle 1Total Usage during Month08/01/2014 to 08/31/2014
Total Usage 71Peak Usage 0Peak Demand 0
A–18 GE ENERGY AGGREGATOR – INSTRUCTION MANUAL

CHAPTER A: SAMPLE USAGE SUMMARY REPORT
Figure A-18: Meter 1 total usage during peak week
E- EngineeringAugust, 2014 - Usage Summary Report
Main Building : Cubicle 1Total Usage during Peak Week08/03/2014 to 08/09/2014
Total Usage 31Peak Usage 0
GE ENERGY AGGREGATOR – INSTRUCTION MANUAL A–19

CHAPTER A: SAMPLE USAGE SUMMARY REPORT
Figure A-19: Meter 1 total usage during peak day
E- EngineeringAugust, 2014 - Usage Summary Report
Main Building : Cubicle 1Total Usage during Peak DayFriday, August 08, 2014
Total Usage 5Peak Usage 0
A–20 GE ENERGY AGGREGATOR – INSTRUCTION MANUAL

CHAPTER A: SAMPLE USAGE SUMMARY REPORT
Figure A-20: Meter 1 average hourly and daily usage
E- EngineeringAugust, 2014 - Usage Summary Report
Main Building : Cubicle 1Average Hourly and Daily UsageDisplays the average usage over the course of the month, averaged by hour, and by weekday. The highest and lowest usage for each hour and weekday over the course of the month are determined, and displayed as the bounding lines in Red and Green.
GE ENERGY AGGREGATOR – INSTRUCTION MANUAL A–21

CHAPTER A: SAMPLE USAGE SUMMARY REPORT
Figure A-21: Meter 1 usage comparison to previous month and year
E- EngineeringAugust, 2014 - Usage Summary Report
Main Building : Cubicle 1Comparison to previous Month and YearDisplays a comparison of daily usage between this month and last month, and this month this year and this month last year. The daily usage is lined up by week day for each month. The numbers at the bottom indicate what day in the month each bar represents: The top value is the current month, the bottom value the month being compared against.
A–22 GE ENERGY AGGREGATOR – INSTRUCTION MANUAL

CHAPTER A: SAMPLE USAGE SUMMARY REPORT
Figure A-22: Meter 1 monthly usage compared to temperature
E- EngineeringAugust, 2014 - Usage Summary Report
Main Building : Cubicle 1Monthly Usage and TemperatureDisplays a comparison of monthly usage and temperature. The highest and lowest temperature for each day over the course of the month are determined, and displayed as the bounding lines in Red and Green.
GE ENERGY AGGREGATOR – INSTRUCTION MANUAL A–23

CHAPTER A: SAMPLE USAGE SUMMARY REPORT
A–24 GE ENERGY AGGREGATOR – INSTRUCTION MANUAL

GE Energy Aggregator
Glossary
GEGrid Solutions
Glossary
<pg_data>
The data directory for the PostGreSql database cluster for the GE Energy Aggregator application. This is the “<Common Application Data>\GE Applications\Server\PostGreSql\9.5\Data” directory.
For Windows® 7: This is typically “C:\ProgramData\GE Applications\Server\PostGreSql\9.5\Data”.
<pg_exe>
The directory which contains the PostGreSql Database Server executable. This is typically “<Program Files>\GE Applications\Server\PostGreSQL\9.5”.
GE Communicator Application
The software application that is the main component of GE’s energy management software suite. It is a complete energy management application for configuring EPM meters, viewing real time readings remotely, trending data, retrieving and viewing logs, viewing and analyzing power quality information, and performing forensic engineering analysis. The data used by GE Energy Aggregator to analyze usage is provided by the GE Communicator application.
GE Energy Aggregator Settings Editor
The GE Energy Aggregator software for administering the Billing Package, including location configuration, data import, rate configuration, and modifying data values.
Bill Structure
Another name for Rate Structure.
GE Energy Aggregator Dashboard Viewer
The GE Energy Aggregator software for generating bills, viewing bills, and trending the data values.
Billing Database
The internal storage on the database cluster which holds all the data imported from the meters.
GE ENERGY AGGREGATOR – INSTRUCTION MANUAL G–1

CHAPTER G: GLOSSARY
Channel
A single type of data item, such as kWh or pulses.
Charge
A monetary value applied to the bill, outside of the normal usage. This includes things such as a peak demand charge, credits, and taxes.
Commodity
A type of channel (typically from Energy or accumulations) which is a usage value the software uses when computing the rates for a bill.
Customer
The person or organization which is receiving the bill. A customer may have multiple locations, each of which gets its own bill.
Database Cluster
The collection of databases which the Database Server provides access to. A database server may provide access to multiple database clusters.
Database Server
The combination of computer and process that provides the interface to the database cluster (currently PostGreSql 9.5).
GE Energy Aggregator
The package of software which includes GE Energy Aggregator Settings Editor, GE Energy Aggregator Dashboard Viewer, and the Database Server.
Import Location
The actual source of the data imported for the meter. This is typically a log file, such as a GE Communicator .db log file. This file is scanned when imported, and new data is placed into the billing database.
Location
A single unit for which a bill is generated. Each location may have its own set of meters and rate structures.
Meter
A data monitoring unit, which acts as an import point for collecting usage data. Each meter may have multiple channels, but only one channel can be assigned to a commodity at a time. When multiple meters are at a single location, the matching usage values are aggregated when generating the bill.
GE MeterManager
A software application that works within the GE Communicator application to handle and automate tasks for meters, simplifying meter management, especially for large meter installations. The GE MeterManager application also automates the Log Retrieval which is necessary to build the database for the GE Energy Aggregator application’s usage reports and billing.
G–2 GE ENERGY AGGREGATOR – INSTRUCTION MANUAL
CHAPTER G: GLOSSARY
Off-Peak/On-Peak
Used for utility billing purposes, Off-Peak and On-Peak are designations applied to different times of the day so that utilities can bill at higher rates for times when energy is more expensive to produce. The GE Energy Aggregator application allows you to assign On-Peak and Off-Peak to different times of the day, for each season in a rate structure.
Provider
The person or organization which is providing the energy, sending the bill, and receiving payments.
Rate
The monetary value applied to the usage which occurs during specific periods.
Rate Structure
The collection of settings which determine what rates to apply to the usage values for a commodity. Includes calendar rates (such as on peak and off peak), holidays, and other charges.
Seasons
In the GE Energy Aggregator application, Seasons are periods of time in a calendar year to which different rates can be applied, e.g., Summer and Winter. Up to four seasons can be created in a rate structure.
Software License Key
An alphanumeric sequence of characters that is typically used to enable software upgrades or installation. In the EnergyReporter EXTTM application, the software license key is used to enable full use of the application.
GE ENERGY AGGREGATOR – INSTRUCTION MANUAL G–3

CHAPTER G: GLOSSARY
G–4 GE ENERGY AGGREGATOR – INSTRUCTION MANUAL


