
GE Capital Overview/Strategy - General Electric€¦ · · 2014-04-22business and financial...
19
Imagination at work. “This document contains “forward-looking statements”- that is, statements related to future, not past, events. In this context, forward-looking statements often address our expected future business and financial performance, and often contain words such as “expect,” “anticipate,” “intend,” “plan,” believe,” “seek,” or “will.” Forward-looking statements by their nature address matters that are, to different degrees, uncertain. For us, particular uncertainties that could adversely or positively affect our future results include: the behavior of financial markets, including fluctuations in interest and exchange rates and commodity and equity prices; the commercial and consumer credit environment; the impact of regulation and regulatory and legal actions; strategic actions, including acquisitions and dispositions; future integration of acquired businesses; future financial performance of major industries which we serve, including, without limitation, the air and rail transportation, energy generation, media, real estate and healthcare industries; and numerous other matters of national, regional and global scale, including those of a political, economic, business and competitive nature. These uncertainties may cause our actual future results to be materially different than those expressed in our forward-looking statements. We do not undertake to update our forward-looking statements." 2014 first quarter GE Capital Overview/Strategy
Transcript of GE Capital Overview/Strategy - General Electric€¦ · · 2014-04-22business and financial...

Imagination at work.
“This document contains “forward-looking statements”- that is, statements related to future, not past, events. In this context, forward-looking statements often address our expected future business and financial performance, and often contain words such as “expect,” “anticipate,” “intend,” “plan,” believe,” “seek,” or “will.” Forward-looking statements by their nature address matters that are, to different degrees, uncertain. For us, particular uncertainties that could adversely or positively affect our future results include: the behavior of financial markets, including fluctuations in interest and exchange rates and commodity and equity prices; the commercial and consumer credit environment; the impact of regulation and regulatory and legal actions; strategic actions, including acquisitions and dispositions; future integration of acquired businesses; future financial performance of major industries which we serve, including, without limitation, the air and rail transportation, energy generation, media, real estate and healthcare industries; and numerous other matters of national, regional and global scale, including those of a political, economic, business and competitive nature. These uncertainties may cause our actual future results to be materially different than those expressed in our forward-looking statements. We do not undertake to update our forward-looking statements."
2014 first quarter
GE Capital Overview/Strategy

GE

GE’s portfolio
$146 billion in revenue
53% revenue outside the U.S
$17 billion operating earnings
15.7% industrial operating margin
$8.3B industrial CFOA*
$8 billion dividends paid
$10 billion buyback
Transportation
$5.9B
$1.2B
-
Rev.
OP
’14E
Power
& Water
$24.7B
$5.0B
+
Energy
Management
$7.6B
$0.1B
++
Oil & Gas
$17.0B
$2.2B
++
Aviation
$21.9B
$4.3B
++ Appliances &
Lighting
$8.3B
$0.4B
++
Capital
$44.1B
$8.3B
~$7B
Healthcare
$18.2B
$3.0B
+/++
Rev.
OP
’14E
(Total Year 2013 figures)
*ex. NBCU deal-related tax $11B
3

129 147 157 160 166 168 180 181
46 53
53 56 57 61 64 64
'10 '11 '12 1Q'13 2Q'13 3Q'13 4Q'13 1Q'14
($ in billions)
Equip.
Services
$216
$175
$200 $210
$223 $244
$229 $245
Infrastructure backlog & orders
TY orders +8% and backlog up $34B
Equipment & services backlog expansion continues
Largest backlog in history
4
2013 Orders - $30.7B
Equipment book-to-bill 1.3 driven by orders strength in P&W
Service orders +5% with 5/6 segments
Broad regional growth … MENAT +70%, China +25%, SSA +18%, U.S. +8%, Europe +3%
Backlog +$15B … Aviation services & P&W equipment
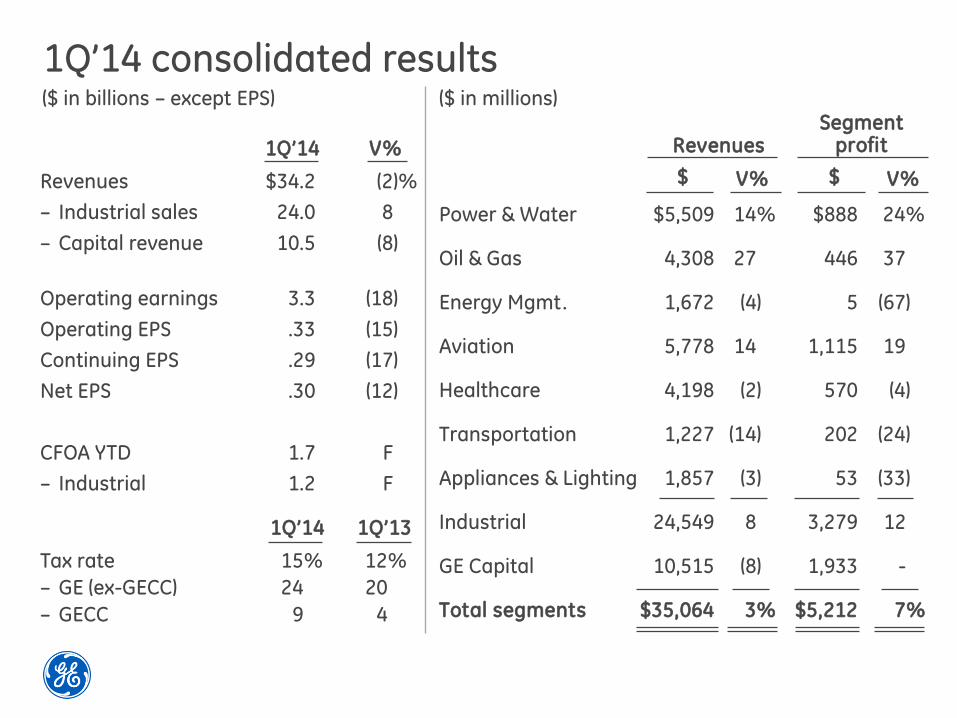
Revenues $34.2 (2)%
– Industrial sales 24.0 8
– Capital revenue 10.5 (8)
Operating earnings 3.3 (18)
Operating EPS .33 (15)
Continuing EPS .29 (17)
Net EPS .30 (12)
CFOA YTD 1.7 F
– Industrial 1.2 F
1Q’14 V%
Segment profit
Power & Water $5,509 14% $888 24%
Oil & Gas 4,308 27 446 37
Energy Mgmt. 1,672 (4) 5 (67)
Aviation 5,778 14 1,115 19
Healthcare 4,198 (2) 570 (4)
Transportation 1,227 (14) 202 (24)
Appliances & Lighting 1,857 (3) 53 (33)
Industrial 24,549 8 3,279 12
GE Capital 10,515 (8) 1,933 -
Total segments $35,064 3% $5,212 7%
Revenues
$ V% $ V%
1Q’14 1Q’13
Tax rate 15% 12%
– GE (ex-GECC) 24 20
– GECC 9 4
($ in billions – except EPS) ($ in millions)
1Q’14 consolidated results

GE Capital
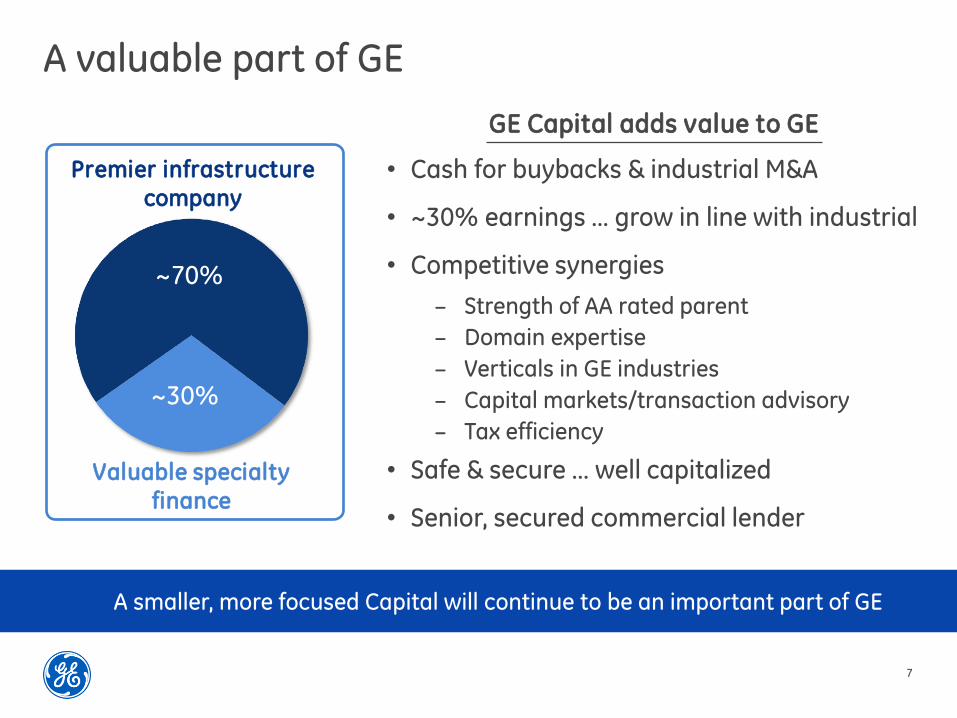
A valuable part of GE
A smaller, more focused Capital will continue to be an important part of GE
~30%
• Cash for buybacks & industrial M&A
• ~30% earnings … grow in line with industrial
• Competitive synergies
‒ Strength of AA rated parent
‒ Domain expertise
‒ Verticals in GE industries
‒ Capital markets/transaction advisory
‒ Tax efficiency
• Safe & secure … well capitalized
• Senior, secured commercial lender
~70%
Premier infrastructure company
Valuable specialty finance
GE Capital adds value to GE
7

GE Capital today
Competitively advantaged, specialty finance business
Assets: $174B
Net Income: $2.0B
• Secured lender
• Leader in 6 U.S. middle markets
• ~1MM customers
Commercial Loans & Leases
Consumer Real Estate Aviation Services
Energy Fin’l. Services
Assets: $132B
Net Income: $4.3B
• US: Store cards and sales finance
• Global banks
• Broad spread of risk
Assets: $39B
Net Income: $1.7B
• Originating debt at attractive returns
• Continuing to shrink equity
Assets: $46B
Net Income: $0.9B
• GE domain • Leader in
industry • Broad product
set
Assets: $16B
Net Income: $0.4B
• GE domain
• Essential assets
• Alignment with GE Energy
8
‘13 revenue: $44B ‘13 assets: $517B ($380B Ending Net Investment) –a) ‘13 profit: $8.3B –b)
a) ENI is shown ex-cash
b) Continuing operations attributable to company

GE Capital businesses
Businesses we know…deep domain…decades of performance
Business
Commercial Lending & Leasing
1Q’14 assets
• Entered in the 60’s • ~100% secured loans and leases • Support mid-market customers
• Entered in the 70’s • Secured loans against diversified properties • Own/operate high quality properties
• Entered in the 30’s • Store cards and sales finance for retailers • Broad spread of risk
• Entered in the 60’s • GE domain • Broad product set with full life cycle management
• Entered in the 80’s • GE domain • Essential assets; secure cash flows
Domain + expertise
Real Estate $38 - Debt
- Equity
Consumer $132 - U.S. PLCC
- Global
Aviation Services $45
Energy Financial Services $16
($ in billions)
$175
9

1.88% 1.75%
1.98% 1.93% 2.14% 2.16% 2.10%
1.41% 1.24% 1.30%
6.11% 6.09% 6.11% 6.07% 5.75%
11.24% 11.83% 11.54% 11.17%
10.31%
1Q'13 2Q'13 3Q'13 4Q'13 1Q'14
GE Capital – 1Q’14 results
Revenue $10,515 (8)%
Pretax earnings 2,142 5
Net income 1,933 –
ENI (ex. cash) 374B (7)
Net Interest margin 4.9% (11) bps.
Tier 1 common % (B1) 11.4% 32 bps.
CLL $175 -% $564 42% Lower impairments, asset sales; disciplined origination
Consumer 132 (3) 786 47 Non-repeat of reserve adjustments & U.S. growth
Real Estate 38 (11) 239 (65) Lower gains (30 Rock non-repeat); strong debt volume
GECAS 45 (8) 352 1 Solid operating performance offset by lower assets
EFS 16 (14) 153 84 Strong operating income
$ V% 1Q’14
Segment profit ($MM)
$ V% $ V%
Assets ($B)
1Q segment dynamics
30+ delinquencies
Real Estate
Consumer
Mortgage
CLL
($ in millions)
10

GE Capital – future
Focusing GE Capital on the middle market and verticals connected to GE Building on GE strengths & our domain expertise
11
(ENI (ex. cash), $ in billions)
• Execute phase II of transformation … N.A. Retail exit & continued non-core run-off
• Returns on tangible equity > cost of equity
• Build out world-class regulatory infrastructure
• Deliver ~30% of GE’s net income
• Pivot to growth in line with Industrial
Operating priorities
Lending & leasing
Real Estate
Consumer
GECAS / EFS
2013 2015F Future
$380
~$300-350 +
33%
11%
14%
42%
10-15%
10-15%
20-25%
50-55%
5%
10-15%
20-25%
55-65%

Funding

GECC funding
Debt composition–a)
Commercial paper
LT debt
Alternative funding/other
Deposits/CDs
39 29 25
26 25 24
49 53 55
241 234 232
30 30 29
1Q'13 4Q'13 1Q'14
$371 $365-b)
Non-recourse Securitization
$385
Cash & equiv. $68 $75 $75
Bank lines $48 $48 $47
CP coverage 100%+ 100%+ 100%+
LT debt <1yr. $35 $39 $41
($ in billions)
(a - Continuing operations (b - Includes ~$1.1B YTD FX impact and ~$0.9B YTD FAS 133 (c- Total equity ex. non-controlling interests
Funding strategy
Centralized Treasury operation
‒ No speculative trading … not a profit
center
Matched funding policy
Diversification of funding
Rigorous liquidity management
− Cash $75B at 100%+ coverage of next 12 months LT debt maturities
− Bank lines $47B at 100%+ coverage of
commercial paper
Strong implicit and explicit GE parent support … Income Maintenance
Agreement
Equity –c) $84 $83 $85
13

Alternative funding transition
~20% alternative funding ex. Retail … opportunities for further growth
Enabling strategic transition
8%
29% 63%
14%
12%
74%
Alternative funding –a) $62 $108
(a - 4Q’08 securitization balance is pre SFAS 167 (’08 $6B, 4Q’13 $30B)
’13 ’08
14%
22%
13%
35%
17%
U.S. secured
Other
U.S. retail deposits
U.S. brokered deposits
Int’l. deposits
Continue diversification journey
• Enabling reduction of annual LTD issuance & CP outstanding
• Driving improved asset/liability match
• Self funding enabling key dispositions (Retail Finance, Swiss)
• U.S. deposit growth focus
• Mix shift … brokered to direct retail deposits
• Leverage additional secured borrowing capacity
LTD
CP Alternative funding
($ in billions)
14

2007 2008 2013 1Q'14
Commercial paper
Significantly reduced footprint … lowest CP balance in 20+ years
Global Outstanding ($B)
• Credit ratings … A-1+/P-1
• Issue in four currency markets
• USD paper placed directly with end investors by experienced team in U.S.
• Committed undrawn credit lines $47B from ~50 institutions globally
14%
86%
GECC U.S. Market share down from 5.1% in ‘07
to ~2.1% at 1Q’14
$72
$101
Highlights
Int’l
U.S.
$29
$25
15

'07 '08 '09 '10 '11 '12 '13 '14E
Issuances Maturities
GECC unsecured issuances and maturities ($B)
90 84
70
25 27
45
56
69 66 64
32
80
Issuance in 11 currencies … ~8 year WAM
Smaller market footprint <2% of USD investment grade index
Support from diverse investor base
Committed to current rating (AA+/A1)
(a- senior unsecured long term debt; Maturities excludes callable LT debt non-guaranteed, LT debt from alternative funding/ other sources
Share of USD issuance
4.6% 2.8% 1.8% 1.8% 1.6% 1.5% 1.1%
2013 total year issuance - $32B
USD-Institutional
37%
USD-Retail 13% EUR
22%
AUD 7%
GBP 7%
CAD 5%
SEK 3%
Other 6%
Called
4
~8
32 35
25
35
Unsecured long term debt dynamics
~$(150)B of net negative supply in 2010-2014
2014 YTD issuance
~$5B in three currencies
16

WFC
GECC
Bank Idx
JPM
FinCo Idx
C
Aa Corp
50
100
150
May-13 Aug-13 Nov-13 Feb-14
OAS over Treasuries (bps)
GE Capital 5yr bond spread vs. peers
Source: Barclays Capital
17

$7.4
Net income –a)
$8.3
2012 2013
ENI ($B) -b)
b) - Ending net investment ex. cash and equivalents
Summary
Strong and valuable franchise
Smaller and safer franchise
Our businesses are strong and well positioned competitively
Capital levels are in excess of expected targets
We have strong liquidity and funding … continuing to diversify funding sources
Regulatory policies continue to evolve − Designated nonbank SIFI
Key messages
($ in billions)
a) - Earnings from continuing operations attributable to GECC
$444 $418
$380
2011 2012 2013
2011
$6.6
18