Ge 260104
14
Compressi on and tensi on est s on drive n pile s in chalk N . B. HOBBS* and P. ROBINS? A programme of tes t piling was ecentl y carried out by the GL C in conne xion with he Thames Flood Preventi on Sche me at Nort h Woolwich, London, comprising l oading and pulling tests on a number of closed-end steel t ube and H-secti on pi les dri ven var yi ng distances int o gravel and chalk. The ground condit ions, soft alluvium, gravel and chalk are described. Maintained load tests immedi ately ol owed by CRP tests were carrie d out 5 to 40 days after drivi ng, and ollowing a further interval of 24 t o 50 days the piles were subjected t o pull i ng tests. The skin ricti on in the chalk w as assesse d by de ducti ng rom t he measured pul l -out resi stance the ski n ricti on i n gravel and alluvi um base d on pulling test s n piles terminati ng in he gravel. It w s possible t o determine t he end beari ng capacit y of one stee l t ube and t hree H-piles di rectl y by deducting t he measured pull-out resistance from t he ultimat e bearing capacity i n direct loading. The relationship, q,JN i n kN /m2, betwee n t he end resista nce and t he SPT N val ue w as ound o vary between 200 and 280 for the H-piles, and to have a value of 230 for the test on the steel tube pil . The dynamic resistance usi ng t he Hile y ormul a w as ound t o overestimat e the t otal stati c ultimat e resistance by about 30%. The result s of the compression tests are compared wit h hose obt ai ned on similar types of pile driven into c halk at Chatham, Erit h and Newbury. Finally t he performances of t he pile s are compared i n terms of efi ciency and pri ce per t on of l oad carried. U n program me d’es sai de pi eux a re’cemment e’te’ ntrepri s par l e GL C a propos du proje t de la prevent i on d’inondation de la Tamise, h N ort h Woolwich, Londres, comprenant des essais de chargement e t de tracti on sur diflerent s pie ux cre ux e n acier e rmd h a pointe e t de section H, qui ont e’t e ’ att us a des distances diverse s dans du gravie r ou du calcaire. Les caracteristiques du sol, depot alluvionnair e tendre, gravie r e t crai e sont d&rites. Des e ssai s de chargement de longue dur ee immediat ement suivi spar des essai s CRP, ont et 6 execute s de 5 a 40 ours ap res bat tage, et d la suit e dun nouvel intervall e de 24 a 50 ours, le spieux ont et & oumi s h de s essai s de tract i on. Le rottement ate ral dans a craie a e’t t valud parti r de s essai s de racti on e t e rottement lateral dans Ie gravie r e t l e depot al l uvionnai re determi ne d parti r des e ss ai s de traction s ur des pie ux se termi nant dans e gravie r. I I a etepossibl e de determi ner directement l a orce portante depointe d’un t ube en acie r et de troi s pie ux H en deduisant la traction me sure ’e de l a resista nce , ultime total e dans e chargement direct. O n a constateque l a el at i on, qJ N e n kNlm2, ent re l a esistance depoi nt e e t a vale ur N du PT, vari e ent re 200 et 280pour lespieux H, et qu’el l e a une val eur de 230 pour l ’essai sur e pieu h ube en aci e r. O n a cons t atequ’en calculant a esistance dyna mi que en utilisant la ormul e Hiley on surestimait l a resistance totale statique limite d’environ 30%. L es r e sultat s des ess ai s de charge ment sont compares av e c c e ux obte nus sur des type s de pi eux semblable s batt us dans de la crai e h Chat ham, Erit h et Newbury. Fin al e ment les performances des pie ux sont comparees au poi nt de vue d’e&acite ’ et pri x par t onne de charge port e. * Soil Mechanics Limited. t Department of Public Health Engineering, GLC.
-
Upload
amanda-rodriguez -
Category
Documents
-
view
225 -
download
0
Transcript of Ge 260104
8/12/2019 Ge 260104
http://slidepdf.com/reader/full/ge-260104 1/14
Compressi on and t ensi on est s on dri ven pi l es i n chal k
N. B. HOBBS* and P. ROBINS?
A programme of test pil i ng w as ecent l y carri ed out by the GLC in connexion w i t h he Thames
Flood Prevent i on Scheme at Nort h Woolw i ch, London, compri si ng l oading and pull i ng tests on a
number of closed-end st eel t ube and H-secti on pi l es dri ven var yi ng di stances int o gravel and chal k.
The ground condit i ons, soft al l uvi um, gravel and chal k ar e descri bed. M aint ained load tests
immediately ol l ow ed by CRP t ests w ere carri ed out 5 to 40 days aft er dri vi ng, and ollowing a
fur t her i nt erv al of 24 t o 50 days the pi l es w ere subjected t o pul l i ng t ests. The ski n ri ct i on in the
chalk w as assessed by deducti ng rom t he measured pul l -out resi stance the ski n ri cti on i n gravel
and al l uvi um based on pull i ng t est s n pi l es terminat i ng in he gravel . I t w s possi bl e t o det ermi ne
t he end beari ng capaci t y of one steel t ube and t hree H- pi l es di rectl y by deducti ng t he measured
pull -out r esi stance from t he ul t imat e beari ng capaci t y i n di rect l oading. The rel at i onship, q,JN
in kN /m2, betw een the end resistance and t he SPT N val ue w as ound t o vary betw een 200 and 280
for t he H-pi l es, and t o have a val ue of 230 for t he t est on the steel t ube pi l e. The dynamic
resi st ance usi ng t he Hi l ey ormul a w as ound t o overestimat e the t otal st at i c ul t imat e resi st ance by
about 30%. The result s of t he compressi on t ests are compared w i t h hose obtai ned on simi l ar
t ypes of pi l e driv en i nto chalk at Chat ham, Erit h and New bury. Final l y t he perfo rmances of t he
pi l es are compared i n t erms of efi ciency and pri ce per t on of l oad carri ed.
Un programme d’essai de pi eux a re’cemment e’t e’ ntrepri s par l e GLC a propos du proj et de l a
prevent i on d’i nondat i on de l a Tami se, h Nort h Woolw i ch, Londres, comprenant des essai s de
chargement et de t ract i on sur di fl erent s pi eux creux en acier ermd h a poi nt e et de secti on H , qui
ont e’t e’ at t us a des distances diverses dans du gravi er ou du cal cair e. Les caracteri sti ques du sol ,
depot al l uvi onnair e t endre, gravi er et crai e sont d& ri t es. Des essais de chargement de l ongue
duree immedia t ement sui v i spar des essai s CRP, ont et 6 executes de 5 a 40 ours apres bat t age, et
d la suit e dun nouvel i nt erval l e de 24 a 50 ours, l espieux ont et& oumi s h des essai s de t ract i on.
Le rot t ement l at eral dans a craie a e’t t val ud part i r des essai s de racti on et e rot t ement l ateraldans Ie gravi er et l e depot al l uvi onnai re det ermi ne d part i r des essai s de tr acti on sur des pi eux se
t ermi nant dans e gravi er. I I a et epossi ble de det ermi ner di rectement l a orce portante depointe
d’un t ube en aci er et de t roi s pi eux H en dedui sant l a tract i on mesure’e de l a resistance, ul t ime
tot al e dans e chargement di rect. On a const at eque l a el at i on, qJN en kN lm2, ent re l a esistance
depoi nt e et a val eur N du SPT, var i e ent re 200 et 280pour l espieux H , et qu’el l e a une val eur de
230 pour l ’essai sur e pi eu h ube en aci er. On a const at equ’en calculant a esistance dynami que
en uti l i sant l a ormul e Hi l ey on surest imai t l a resi stance tot al e st ati que l imi te d’envi ron 30%.
Les resul t at s des essai s de chargement sont compares avec ceux obt enus sur des t ypes de pi eux
sembl abl es bat t us dans de la craie h Chatham, Eri t h et New bury . Final ement l es perf ormances
des pi eux sont comparees au poi nt de vue d’e& acit e’ et pri x par t onne de charge port & e.
* Soil Mechanics Limited.
t Department of Public Health Engineering, GLC.
8/12/2019 Ge 260104
http://slidepdf.com/reader/full/ge-260104 2/14
34 N B. HOBBS AND P ROBINS
loose to medium
Group I testfr
UBP254xZS4xSkg 1,2,3.5.12
3 5xllOkg 4
6.7
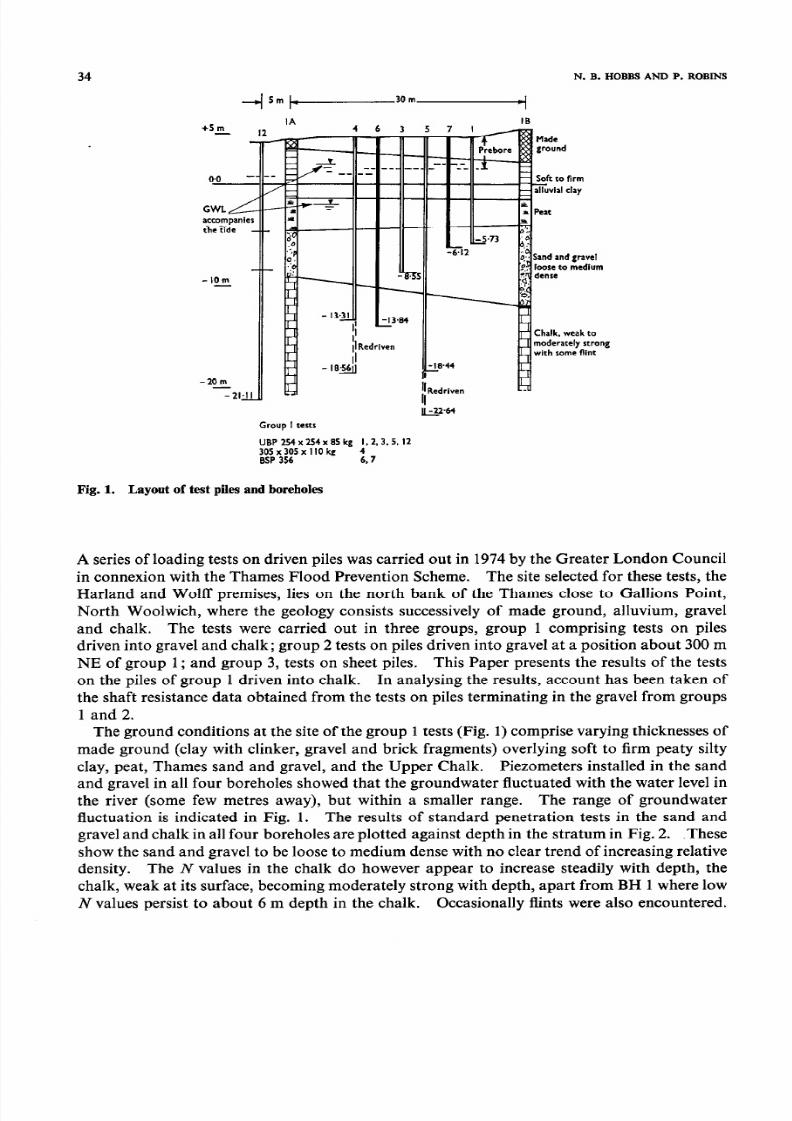
Fig. 1. Layout of test piles and boreboles
A series of loading tests on driven piles was carried out in 1974 by the Greater London Council
in connexion with the Thames Flood Prevention Scheme. The site selected for these tests, the
Harland and Wolff premises, lies on the north bank of the Thames close to Gallions Point,
North Woolwich, where the geology consists successively of made ground, alluvium, gravel
and chalk. The tests were carried out in three groups, group 1 comprising tests on piles
driven into gravel and chalk; group 2 tests on piles driven into gravel at a position about 300 m
NE of group 1; and group 3, tests on sheet piles. This Paper presents the results of the tests
on the piles of group 1 driven into chalk. In analysing the results, account has been taken ofthe shaft resistance data obtained from the tests on piles terminating in the gravel from groups
1 and 2.
The ground conditions at the site of the group 1 tests (Fig. 1) comprise varying thicknesses of
made ground (clay with clinker, gravel and brick fragments) overlying soft to firm peaty silty
clay, peat, Thames sand and gravel, and the Upper Chalk. Piezometers installed in the sand
and gravel in all four boreholes showed that the groundwater fluctuated with the water level in
the river (some few metres away), but within a smaller range. The range of groundwater
fluctuation is indicated in Fig. 1. The results of standard penetration tests in the sand and
gravel and chalk in all four boreholes are plotted against depth in the stratum in Fig. 2. .These
show the sand and gravel to be loose to medium dense with no clear trend of increasing relativedensity. The N values in the chalk do however appear to increase steadily with depth, the
chalk, weak at its surface, becoming moderately strong with depth, apart from BH 1 where low
N values persist to about 6 m depth in the chalk. Occasionally flints were also encountered.

8/12/2019 Ge 260104
http://slidepdf.com/reader/full/ge-260104 3/14
PILES IN WEAK ROCK 35
S T blows
-I I
s-
I O
S
SPT blows, N
O9
-e--d,
Chalk
. \O
\
o
\
\
3
\ .1/ .
BH IA q BHZA 3M)mtoNE
o BH IB . BH 28I
ofBHlAandlB
Fig. 2. Standard penetration test results
TEST PILES
The test piles comprised 364 mm o.d. steel tube piles driven with a closed end (BSP cased
piles), and H-section universal bearing (UB) piles in two sizes, 254 x 254 mm x 85 kg/m and305 x 305 x 110 kg/m. The BSP piles were driven with a 2 t internal drop hammer with a 1 m
drop, and the UB piles with a DE40 Mackiernan Terry diesel hammer, with the exception of
pile 12, the last in the series, which was driven with a D12 Delmag diesel hammer. (Relevant
details of the two hammers are given in Table 3.) The piles were pitched into prebored holes
through the made ground to the depths shown in Fig. 1, following which the driving resistances
were continuously recorded as the number of blows to cause 300 mm penetration of the pile.
The sets for the final 900 mm penetration are given in Table 1.
The piles were driven in a line in the positions and to the depths shown in Fig. 1. Two of
the UB piles, 4 and 5, were extended and redriven after load testing and were subsequently
retested. An attempt was made to redrive the BSP pile, 6, but without success, the casingbuckling under the severe stresses caused by top driving.
PILE TESTING
Load was applied to the piles by jacking against a kentledge supported on cribbages set up on
either side of the line of test piles. These cribbages were so dimensioned that the pressure
applied to the ground prior to loading did not exceed 100 kN/m2. The pile heads were fitted
with flat horizontal steel plate cappings to accommodate the hydraulic jack and load cell.
The test programme comprised maintained load (ML) tests followed by constant rate of
penetration (CRP) tests at 2 mm/min. and then, after a long delay tension tests under a constant
rate of extraction (CRE) at 1 mm/min. In the ML tests the load was generally applied in200 kN increments and held until the rate of settlement fell below 0.1 mm in 20 min. Similar
requirements were observed when unloading, and on removal of the load, observations were
continued until all movement ceased.

8/12/2019 Ge 260104
http://slidepdf.com/reader/full/ge-260104 4/14
Te1Pedasdvnresa
atereuts
/
I
I
No
T
4
U
3
O
4
a
3
O
(edv
5 5a
5a
U
2 2
(mdv
2
(edv
6
B
(3
m
od
1
U
2
- . _ -
P
ao
Hm
D
vn
esa
inoc
k
(bow
3
m
L
h
m
fo
a
he
m
3
m
nevs
1
0
33
2
2
85
D (deD
1
1
1
2
2
5
2
1
78
2
3
1
0
2
3
1
0
D (de D (d
eD
2
2
2
5
5
5
5
5
5
(de
1
5
36
B 2o
(do
3
3
3
(1m
do
2
2
1
8
D
1
(de
4
3
2
_ _ _ -
U
m
e
o
kN
M
nan
lo
e
-
A ; 1 2 1 $
&
$ (4 6 (2 1 (3
- _ _ _ -
B 7 9 8 1 -1
- . _ _ -
C
C
cm
e
o
te
o
te
te 6 (5
I
1
lo
2
1
(6
(1
3 (7
I
8 (2
3 (5
Fg
e
nba
sd
eh
nev
nd
bw
dvn
o
e
vn
a
e
n
*2
e
o
e
tA
m
m
m
lo
e
d
B
o
a
s
em
o
1%
o
pedame
8/12/2019 Ge 260104
http://slidepdf.com/reader/full/ge-260104 5/14
T
e2
Sm
yo
a
ys
o
eus
w
hpe
nod
o
n
e
n
dh
z 6
P
k
raoino
Q
:h
k
z
m
-
Sa
oin
au
um
a kNm
Sresa
inga
U
m
e
lo
a
to
o
pe
kN
U
m
e
e
b
n
E
y
S
esa
inc
k
S
e
sa
D
u
m
e
lo
eb
n
m
u
lJoB
B
M
m
U 2 m 24m
m
m
I
Pe
N
ty
U 2 m 24
B
‘
c- - -
ve N
rk
_ _ -
S
Fg
1
fo
d
as
te
ve fs
Nm
U 3 m 3 m 1 7
.
Im 2
4m
1
8
1
8
1
1 1
7 7
U
B
3 m 3 m-
1
1
fs
q
N
kNm
v
u
L
I?k
- - -
f9
Nm
1
2
-
1 9
8
1
9
)
12%
;g
2 ; ; 1
8
1
1
2
2
-_ 4
%
5%
4
4
%
2 4 6
3
3 2 4 2 2 2
3
3
4
U
6
B
:a
:
1
U
5
U
7
N
e
Fco
reus
gv
n
ba
s
aeb
O
v
u
o
an
fom
he
o
teso
pe
o
sm
a
y
Em
b
m
reus
dw
um
au
e
o
tesaem
G
T
em
n
h
b
e
m
e
un
h
sh
es
a
fom
h
e
a
hg
.
T
sh
esa
o
h
U
pe
h
b
ccae
o
h
go
p
m
e
ie
o
m
h
dm
o
*T
sv
u
a
om
som
aow
fo
h
ee
o
e
e
lo
n
s
Fg
5
b
T
e3
Cm
so
od
m
ca
sac
esa
o
h
pe
E
g
p
bow
k$m
3
5
3
6
W
g
o
p$ k
N2
8
2
705
05
M
ue
s
p
bow
s
m63
77
M
ue
tem
ay
cm
e
o
c
m
-_ -
84
2
Pe
N1
Hm
D
m (de
W
g
oam kN 1
2
5a
M
em
18
T
y
D
4
(de
U
m
e
sac
resa
kN
resa
R
kN
M
nan
C
lo
e
te
A
B
1
1
8
1
1
3
LO
(1
(4
(4
1
1
1
-
(3
(3
N
e
13m
em
ay
cm
e
o
h
b
aow
o
h
dvn
h
Fg
e
nba
s
d
e
nev
nd
bw
dvn
a
e
n
*T
o
h
bow
daam
tH
e
om
a
R
E
s
0
5
A
m
m
m
o
e
d
B
o
as
em
o
1%
o
pesz
8/12/2019 Ge 260104
http://slidepdf.com/reader/full/ge-260104 6/14
38 N. B. HOBBS AND P. ROBINS
Load : kN
600
- - - RP comprerrlo” tests
. . CRP fenlion tests
@ Interval between driving
or redriving and
testing days)
Pile 4 comprerslon tests
Load : kN
400 WO l2W 1600
1‘Bare rerlstance
Load : kN
200 400 600 800
Pile 4 a) redriven)
Compresrlon test
also rhowlng bare resistance curve
using the recqnd tenrion test)
Tension tests
6) (c)
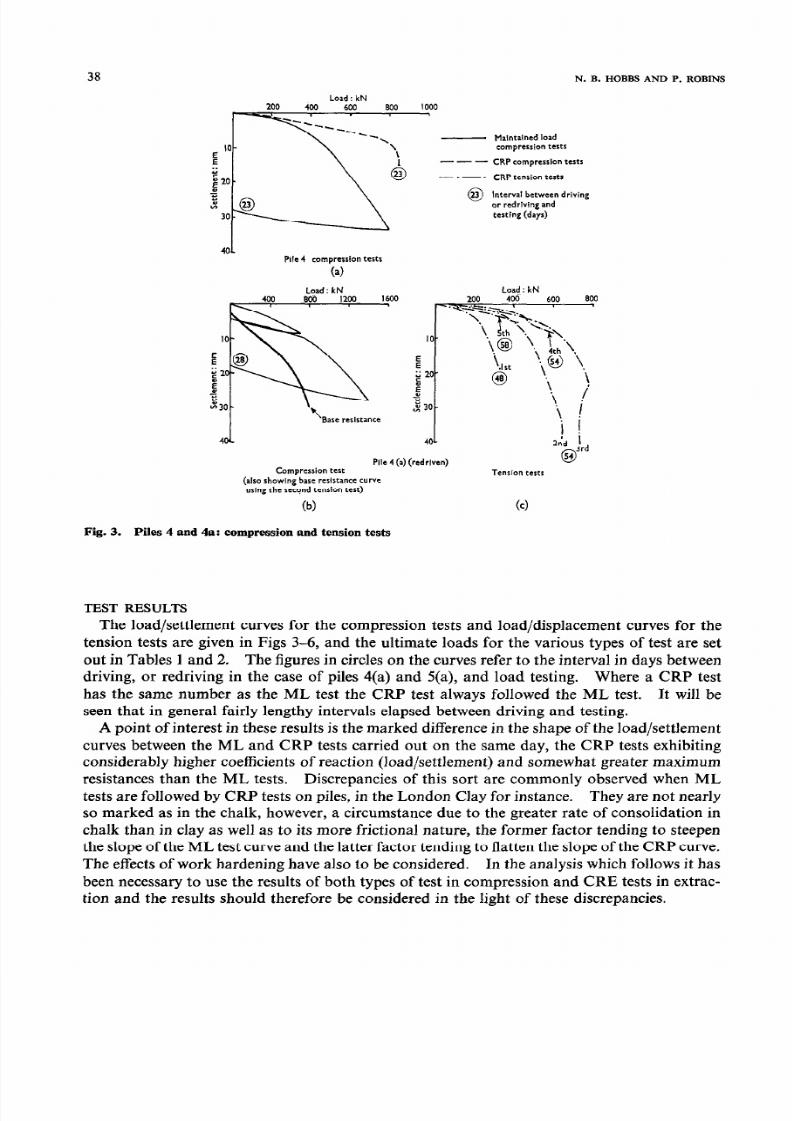
Fig. 3. Piles 4 and 4a: compression and tension tests
TEST RESULTS
The load/settlement curves for the compression tests and load/displacement curves for the
tension tests are given in Figs 3-6, and the ultimate loads for the various types of test are set
out in Tables 1 and 2. The figures in circles on the curves refer to the interval in days between
driving, or redriving in the case of piles 4(a) and 5(a), and load testing. Where a CRP test
has the same number as the ML test the CRP test always followed the ML test. It will be
seen that in general fairly lengthy intervals elapsed between driving and testing.
A point of interest in these results is the marked difference in the shape of the load/settlement
curves between the ML and CRP tests carried out on the same day, the CRP tests exhibiting
considerably higher coefficients of reaction (load/settlement) and somewhat greater maximum
resistances than the ML tests. Discrepancies of this sort are commonly observed when ML
tests are followed by CRP tests on piles, in the London Clay for instance. They are not nearly
so marked as in the chalk, however, a circumstance due to the greater rate of consolidation in
chalk than in clay as well as to its more frictional nature, the former factor tending to steepen
the slope of the ML test curve and the latter factor tending to flatten the slope of the CRP curve.
The effects of work hardening have also lo be considered. In the analysis which follows it hasbeen necessary to use the results of both types of test in compression and CRE tests in extrac-
tion and the results should therefore be considered in the light of these discrepancies.

8/12/2019 Ge 260104
http://slidepdf.com/reader/full/ge-260104 7/14
PILES IN WEAK ROCK 39
Load : kN
- MaintaIned Icedcompression ests
- - -- CRP comprerslon tests
-- -- CRP tenslollests
Pile 5 compression ests
4
Load:k
Pile S a) redriven)
lb>
Compression tests also showing base
resistancecurve deduced rom
CRP test at 12 days and tension test)
Fig. 4. Piles 5 and Sa: compression and tension tests
Load : k
Load : kN
Compression tests
also showing base resistance
cuwes deduced for maintained
load test and CRP test)
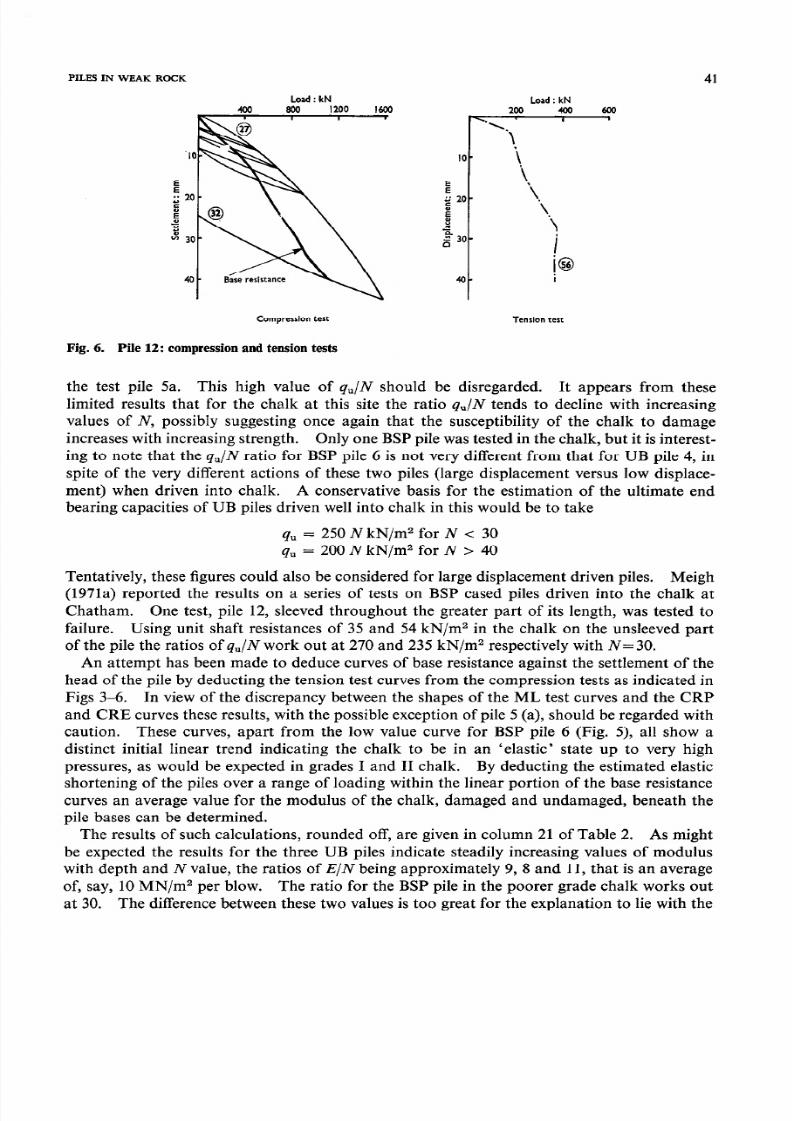
Fig. 5. Pile 6: compression and tension tests
Tenrlon test
71 days after initial drive,
but only 33 after abortive
redrive attempt)
8/12/2019 Ge 260104
http://slidepdf.com/reader/full/ge-260104 8/14
40 N B HOBBS AND P ROBINS
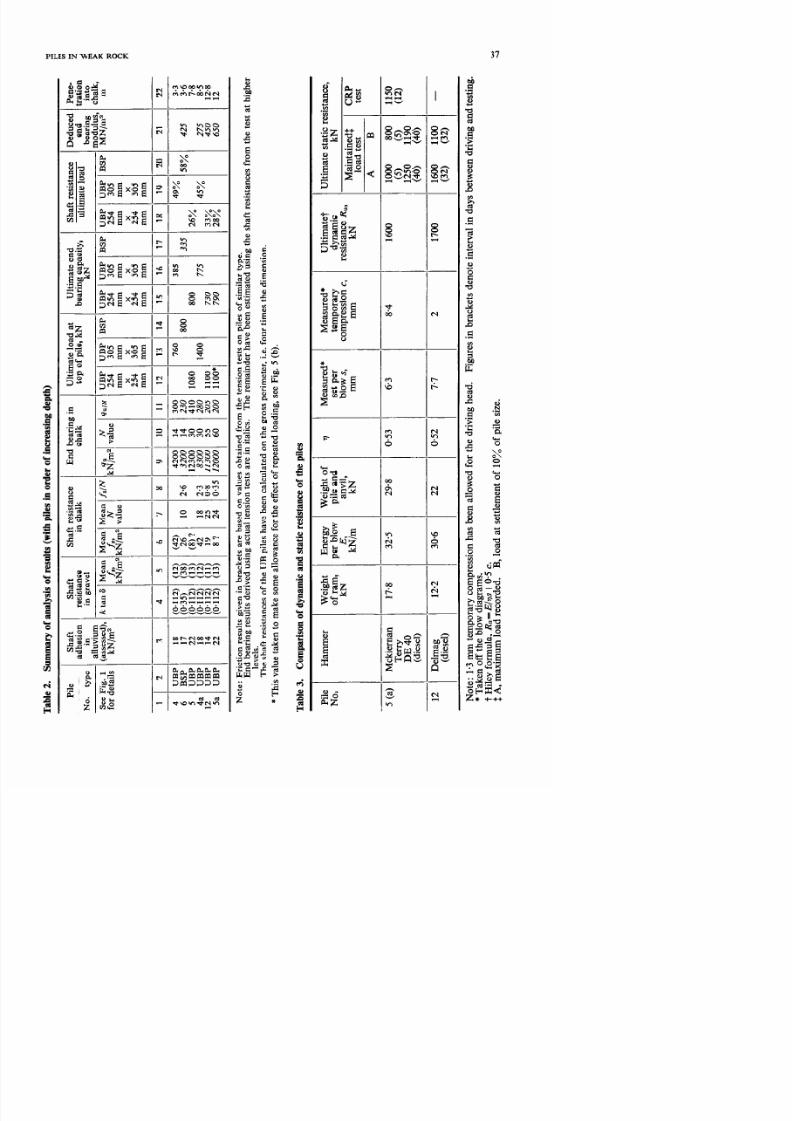
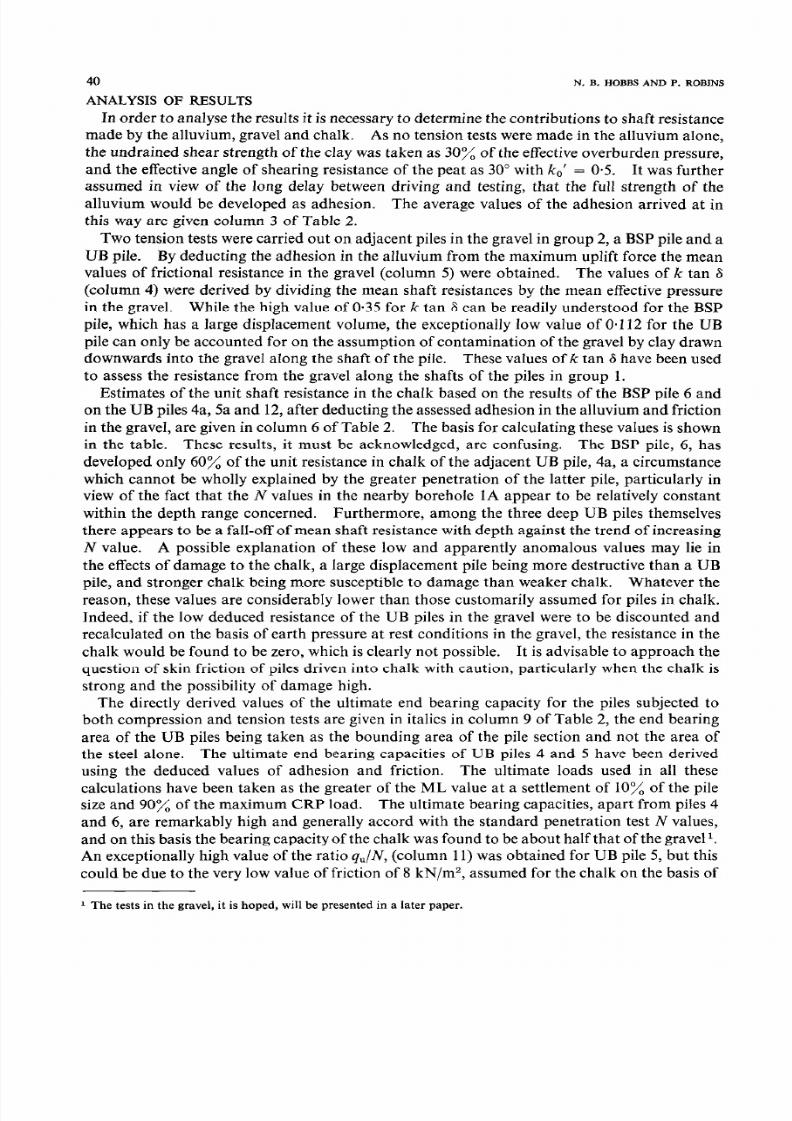
ANALYSIS OF RESULTS
In order to analyse the results it is necessary to determine the contributions to shaft resistance
made by the alluvium, gravel and chalk. As no tension tests were made in the alluvium alone,
the undrained shear strength of the clay was taken as 30 of the effective overburden pressure,
and the effective angle of shearing resistance of the peat as 30” with k,,’ = 0.5. It was furtherassumed in view of the long delay between driving and testing, that the full strength of the
alluvium would be developed as adhesion. The average values of the adhesion arrived at in
this way are given column 3 of Table 2.
Two tension tests were carried out on adjacent piles in the gravel in group 2, a BSP pile and a
UB pile. By deducting the adhesion in the alluvium from the maximum uplift force the mean
values of frictional resistance in the gravel (column 5) were obtained. The values of k tan 6
(column 4) were derived by dividing the mean shaft resistances by the mean effective pressure
in the gravel. While the high value of 0*35 for k tan 6 can be readily understood for the BSP
pile, which has a large displacement volume, the exceptionally low value of 0.112 for the UB
pile can only be accounted for on the assumption of contamination of the gravel by clay drawndownwards into the gravel along the shaft of the pile. These values of tan 6 have been used
to assess the resistance from the gravel along the shafts of the piles in group 1.
Estimates of the unit shaft resistance in the chalk based on the results of the BSP pile 6 and
on the UB piles 4a, 5a and 12, after deducting the assessed adhesion in the alluvium and friction
in the gravel, are given in column 6 of Table 2. The basis for calculating these values is shown
in the table. These results, it must be acknowledged, are confusing. The BSP pile, 6, has
developed only 60 of the unit resistance in chalk of the adjacent UB pile, 4a, a circumstance
which cannot be wholly explained by the greater penetration of the latter pile, particularly in
view of the fact that the N values in the nearby borehole IA appear to be relatively constant
within the depth range concerned. Furthermore, among the three deep UB piles themselvesthere appears to be a falI-off of mean shaft resistance with depth against the trend of increasing
iV value. A possible explanation of these low and apparently anomalous values may lie in
the effects of damage to the chalk, a large displacement pile being more destructive than a UB
pile, and stronger chalk being more susceptible to damage than weaker chalk. Whatever the
reason, these values are considerably lower than those customarily assumed for piles in chalk.
Indeed, if the low deduced resistance of the UB piles in the gravel were to be discounted and
recalculated on the basis of earth pressure at rest conditions in the gravel, the resistance in the
chalk would be found to be zero, which is clearly not possible. It is advisable to approach the
question of skin friction of piles driven into chalk with caution, particularly when the chalk is
strong and the possibility of damage high.The directly derived values of the ultimate end bearing capacity for the piles subjected to
both compression and tension tests are given in italics in column 9 of Table 2, the end bearing
area of the UB piles being taken as the bounding area of the pile section and not the area of
the steel alone. The ultimate end bearing capacities of UB piles 4 and 5 have been derived
using the deduced values of adhesion and friction. The ultimate loads used in all these
calculations have been taken as the greater of the ML value at a settlement of 10 of the pile
size and 90 of the maximum CRP load. The ultimate bearing capacities, apart from piles 4
and 6, are remarkably high and generally accord with the standard penetration test N values,
and on this basis the bearing capacity of the chalk was found to be about half that of the gravel l.
An exceptionally high value of the ratioq,JN,
(column 11) was obtained for UB pile 5, but thiscould be due to the very low value of friction of 8 kN/m2, assumed for the chalk on the basis of
1 The tests in the gravel, it is hoped, will be presented in a later paper.
8/12/2019 Ge 260104
http://slidepdf.com/reader/full/ge-260104 9/14
8/12/2019 Ge 260104
http://slidepdf.com/reader/full/ge-260104 10/14
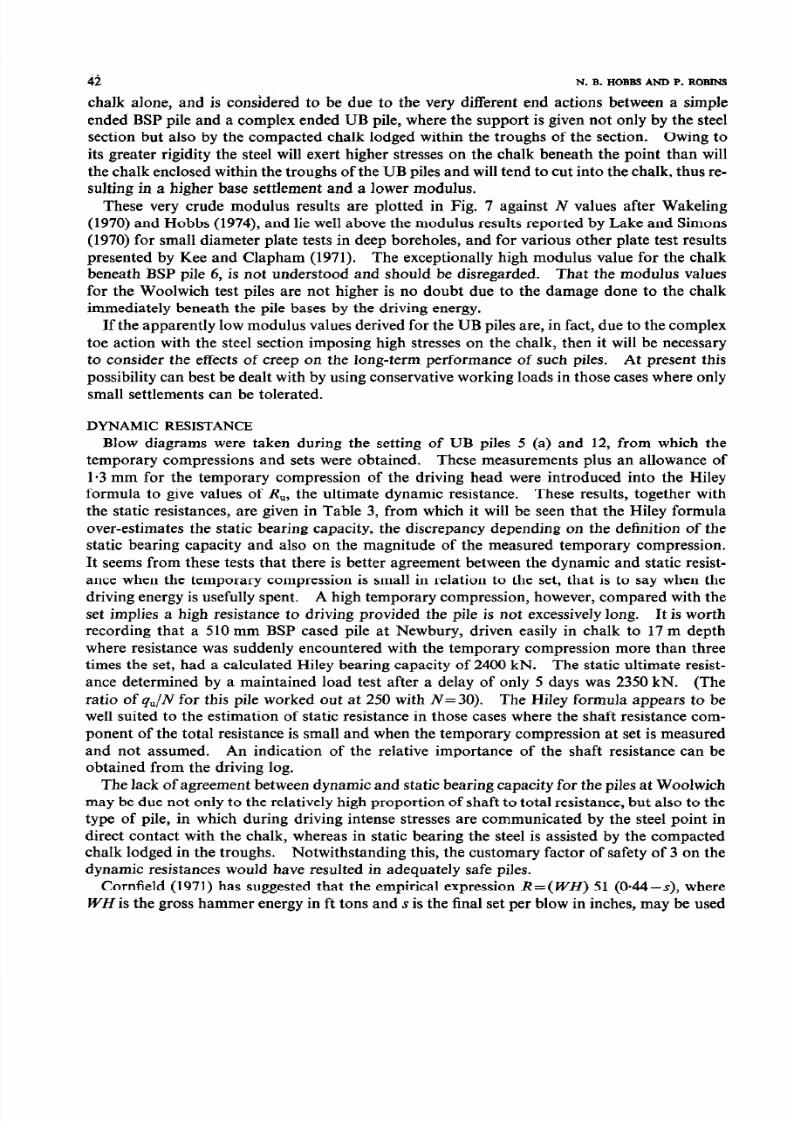
42 N B HOBBS AND P ROBI NS
chalk alone, and is considered to be due to the very different end actions between a simple
ended BSP pile and a complex ended UB pile, where the support is given not only by the steel
section but also by the compacted chalk lodged within the troughs of the section. Owing to
its greater rigidity the steel will exert higher stresses on the chalk beneath the point than will
the chalk enclosed within the troughs of the UB piles and will tend to cut into the chalk, thus re-sulting in a higher base settlement and a lower modulus.
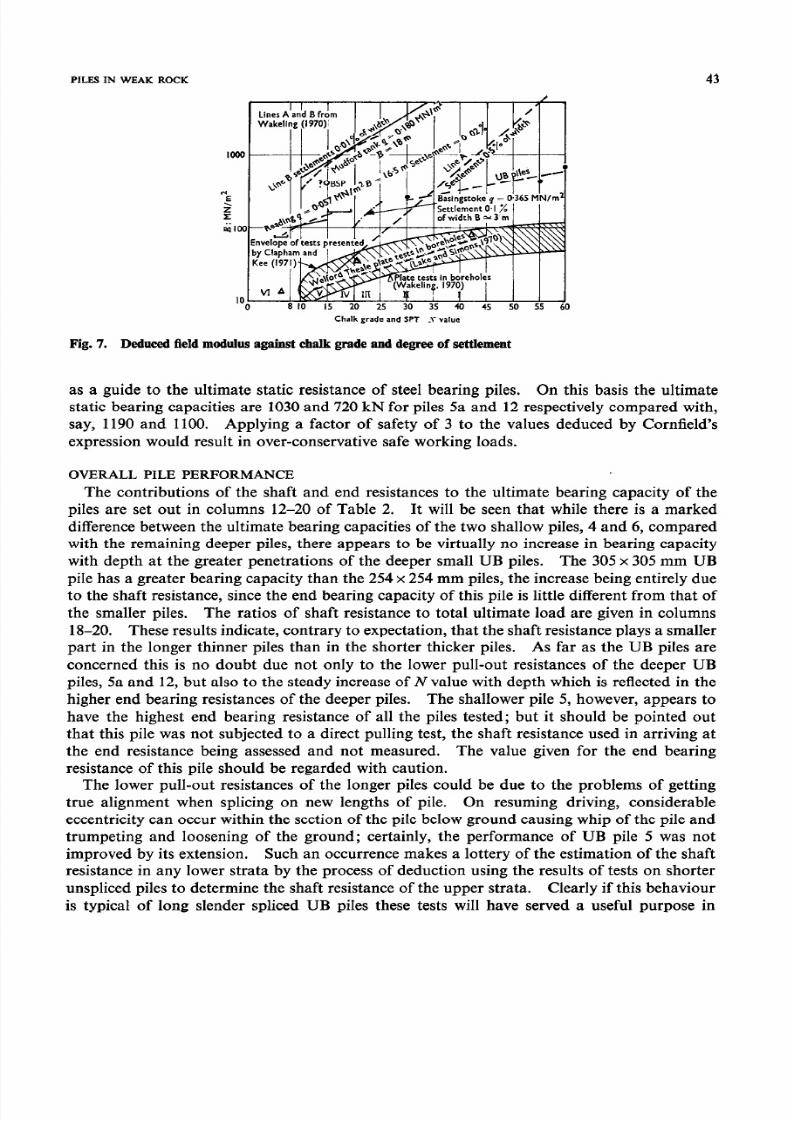
These very crude modulus results are plotted in Fig. 7 against N values after Wakeling
(1970) and Hobbs (1974), and lie well above the modulus results reported by Lake and Simons
(1970) for small diameter plate tests in deep boreholes, and for various other plate test results
presented by Kee and Clapham (1971). The exceptionally high modulus value for the chalk
beneath BSP pile 6, is not understood and should be disregarded. That the modulus values
for the Woolwich test piles are not higher is no doubt due to the damage done to the chalk
immediately beneath the pile bases by the driving energy.
If the apparently low modulus values derived for the UB piles are, in fact, due to the complex
toe action with the steel section imposing high stresses on the chalk, then it will be necessaryto consider the effects of creep on the long-term performance of such piles. At present this
possibility can best be dealt with by using conservative working loads in those cases where only
small settlements can be tolerated.
DYNAMIC RESISTANCE
Blow diagrams were taken during the setting of UB piles 5 (a) and 12, from which the
temporary compressions and sets were obtained. These measurements plus an allowance of
1.3 mm for the temporary compression of the driving head were introduced into the Hiley
formula to give values of R,, the ultimate dynamic resistance. These results, together with
the static resistances, are given in Table 3, from which it will be seen that the Hiley formulaover-estimates the static bearing capacity, the discrepancy depending on the definition of the
static bearing capacity and also on the magnitude of the measured temporary compression.
It seems from these tests that there is better agreement between the dynamic and static resist-
ance when the temporary compression is small in relation to the set, that is to say when the
driving energy is usefully spent. A high temporary compression, however, compared with the
set implies a high resistance t driving provided the pile is not excessively long. It is worth
recording that a 510 mm BSP cased pile at Newbury, driven easily in chalk to 17 m depth
where resistance was suddenly encountered with the temporary compression more than three
times the set, had a calculated Hiley bearing capacity of 2400 kN. The static ultimate resist-
ance determined by a maintained load test after a delay of only 5 days was 2350 kN. (Theratio of qu/N for this pile worked out at 250 with N= 30). The Hiley formula appears to be
well suited to the estimation of static resistance in those cases where the shaft resistance com-
ponent of the total resistance is small and when the temporary compression at set is measured
and not assumed. An indication of the relative importance of the shaft resistance can be
obtained from the driving log.
The lack of agreement between dynamic and static bearing capacity for the piles at Woolwich
may be due not only to the relatively high proportion of shaft to total resistance, but also to the
type of pile, in which during driving intense stresses are communicated by the steel point in
direct contact with the chalk, whereas in static bearing the steel is assisted by the compacted
chalk lodged in the troughs. Notwithstanding this, the customary factor of safety of 3 on thedynamic resistances would have resulted in adequately safe piles.
Cornfield (1971) has suggested that the empirical expression R= WH) 51 (044-s), where
WH is the gross hammer energy in ft tons and s is the final set per blow in inches, may be used
8/12/2019 Ge 260104
http://slidepdf.com/reader/full/ge-260104 11/14
PIL ES IN WEAK ROCK 43
IO0 8 IO 15 20 25 30 35 40 45 50 55 60
Chalk grade and SPT S value
Fig. 7 Deduced field modulus against chalk grade and degree of settlement
as a guide to the ultimate static resistance of steel bearing piles. On this basis the ultimate
static bearing capacities are 1030 and 720 kN for piles 5a and 12 respectively compared with,
say, 1190 and 1100. Applying a factor of safety of 3 to the values deduced by Cornfield’s
expression would result in over-conservative safe working loads.
OVERALL PILE PERFORMANCE
The contributions of the shaft and end resistances to the ultimate bearing capacity of the
piles are set out in columns 12-20 of Table 2. It will be seen that while there is a markeddifference between the ultimate bearing capacities of the two shallow piles, 4 and 6, compared
with the remaining deeper piles, there appears to be virtually no increase in bearing capacity
with depth at the greater penetrations of the deeper small UB piles. The 305 x 305 mm UB
pile has a greater bearing capacity than the 254 x 254 mm piles, the increase being entirely due
to the shaft resistance, since the end bearing capacity of this pile is little different from that of
the smaller piles. The ratios of shaft resistance to total ultimate load are given in columns
18-20. These results indicate, contrary to expectation, that the shaft resistance plays a smaller
part in the longer thinner piles than in the shorter thicker piles. As far as the UB piles are
concerned this is no doubt due not only to the lower pull-out resistances of the deeper UB
piles, 5a and 12, but also to the steady increase of N value with depth which is reflected in thehigher end bearing resistances of the deeper piles. The shallower pile 5, however, appears to
have the highest end bearing resistance of all the piles tested; but it should be pointed out
that this pile was not subjected to a direct pulling test, the shaft resistance used in arriving at
the end resistance being assessed and not measured. The value given for the end bearing
resistance of this pile should be regarded with caution.
The lower pull-out resistances of the longer piles could be due to the problems of getting
true alignment when splicing on new lengths of pile. On resuming driving, considerable
eccentricity can occur within the section of the pile below ground causing whip of the pile and
trumpeting and loosening of the ground; certainly, the performance of UB pile 5 was not
improved by its extension. Such an occurrence makes a lottery of the estimation of the shaftresistance in any lower strata by the process of deduction using the results of tests on shorter
unspliced piles to determine the shaft resistance of the upper strata. Clearly if this behaviour
is typical of long slender spliced UB piles these tests will have served a useful purpose in

8/12/2019 Ge 260104
http://slidepdf.com/reader/full/ge-260104 12/14
44 N B HOBBS AND P ROBINS
demonstrating that pull-out resistance does not necessarily increase pari passu with increasing
depth, but may even diminish. To get the best results with long piles in chalk it seems that
certain practical problems have to be overcome, and certainly the straighter and stiffer the
piles the better the results are likely to be. It should not be assumed from these observations
that low shaft resistances will only result with spliced piles: very long slender piles driven inone length are also likely to have low shaft resistances. The high dynamic resistances of the
UB piles may well be due to the above cause, in that energy lost in the lateral vibration of
the pile due to lack of alignment is not taken into account in the Hiley formula. This being so,
the formula will inevitably lead to over-estimates of the static resistance.
Meigh (197lb) compared the performance of a variety of piles by means of the settlement
at a load on the pile equivalent to 5.15 MN/m2 irrespective of the type of pile, the bounded
area being used in the case of UB piles. The results of such a procedure are given in Table 4,
based on the ML test curves, and show quite clearly the superiority of shorter, larger piles over
longer, thinner ones. Apart from UB piles 4 and 5, the settlements at a working stress of
5 MN/m2 are all comparable. The working load on pile 5 at the same settlement as the otherpiles is also given in the table, and this corresponds to a working stress of 9.2 MN/m2, leading
to a considerably higher efficiency. Of all the piles in this group, only the BSP cased pile 6, is
being worked at maximum efficiency, that is to say the applied working load is the maximum
possible from considerations of the allowable stress on the material of the shaft. The maxi-
mum possible working loads on the 305 mm and 254 mm UB piles in mild steel are 1700 and
1300 kN respectively, with corresponding efficiencies of 27.5 and 23 . The results presented
by Meigh (197lb) for BSP cased piles at Chatham and a 16 in. x 12 in. x 100 lb UB pile at
Erith are also given in Table 4, from which it will be seen that the performances of the BSP
piles are comparable, with the Woolwich BSP pile having a somewhat better coefficient of
reaction QJs at a smaller penetration into the chalk than the smaller Chatham pile. If pile 4,which penetrated the chalk at Woolwich for only 3.3 m, is ignored, the 305 mm UB pile 4a
Table 4. Comparison of pile performances and prices
Pile No.
-
Type
4, UB6, BSP5 UB
4a UB12 UB5a UB
::;7.8
1i.z12.0
47052030055ot470300300
-
Chatham At 48 ton/fta (5.15 MN/m2)
BSP 16 in.BSP 20 in.
Erith
HlZxl6in.
--
-6.1 640 8.4 76 26.5 Williams (1971)
Penetrationinto chalk,
m load
E?
At 5 MN/ma stress on end area of the pile
Settlement
s,m
Qa pile efficiency-9
kN;mm c Qa
-- -_
-.
-.
Price
perkN
carried,f
0.870.67l-430.781.161.551.68
Price
perpile,
L
415350430430545465505
Reference
Meigh (1971b)
* Q,,, is the maximum working capacity of the pile shaft.t Ptle 5 with the load at 550 kN to give comparable settlement with the other piles.
8/12/2019 Ge 260104
http://slidepdf.com/reader/full/ge-260104 13/14
PILES IN WEAK ROCK 45
Estimated price per pile : Lsterling
I
IS-
20.
E.
5tn 2s’
30.
--y--x- UBP305x305xllOk~--_-
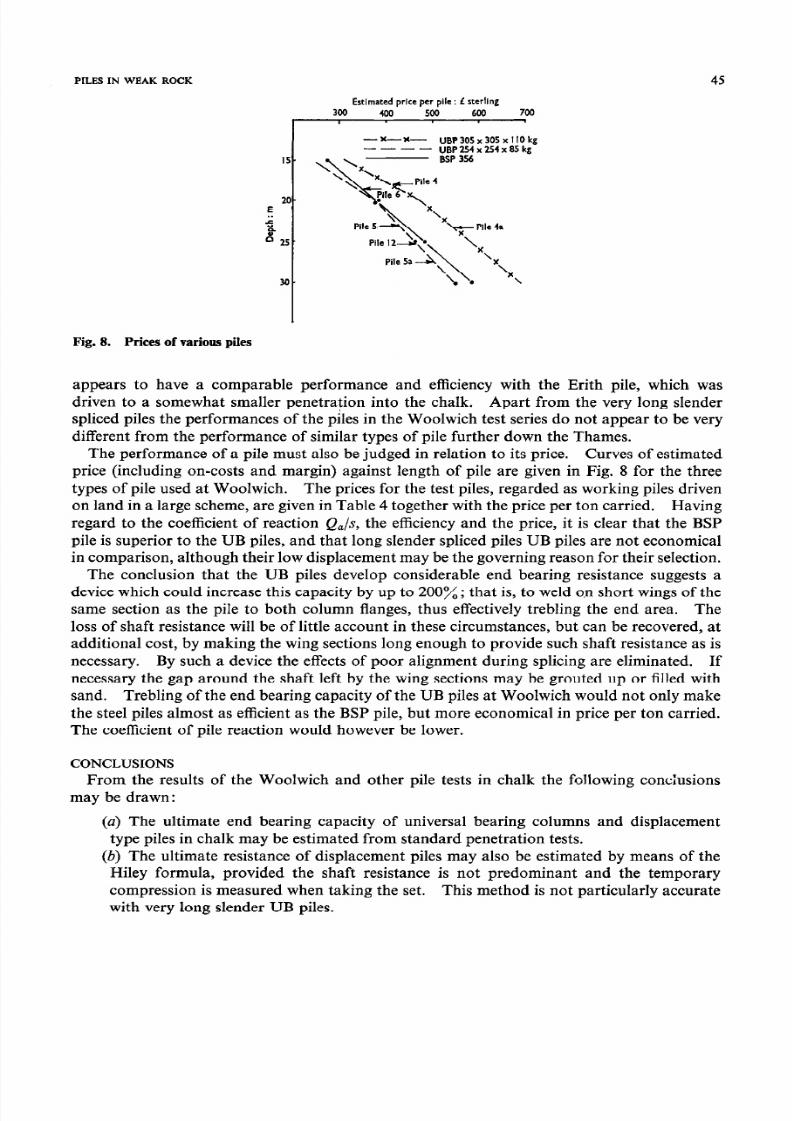
Fig 8 Prices of various piles
appears to have a comparable performance and efficiency with the Erith pile, which was
driven to a somewhat smaller penetration into the chalk. Apart from the very long slender
spliced piles the performances of the piles in the Woolwich test series do not appear to be very
different from the performance of similar types of pile further down the Thames.
The performance of a pile must also be judged in relation to its price. Curves of estimated
price (including on-costs and margin) against length of pile are given in Fig. 8 for the three
types of pile used at Woolwich. The prices for the test piles, regarded as working piles driven
on land in a large scheme, are given in Table 4 together with the price per ton carried. Havingregard to the coefficient of reaction QJs, the efficiency and the price, it is clear that the BSP
pile is superior to the UB piles, and that long slender spliced piles UB piles are not economical
in comparison, although their low displacement may be the governing reason for their selection.
The conclusion that the UB piles develop considerable end bearing resistance suggests a
device which could increase this capacity by up to 200 ; that is, to weld on short wings of the
same section as the pile to both column flanges, thus effectively trebling the end area. The
loss of shaft resistance will be of little account in these circumstances, but can be recovered, at
additional cost, by making the wing sections long enough to provide such shaft resistance as is
necessary. By such a device the effects of poor alignment during splicing are eliminated. If
necessary the gap around the shaft left by the wing sections may be grouted up or filled withsand. Trebling of the end bearing capacity of the UB piles at Woolwich would not only make
the steel piles almost as efficient as the BSP pile, but more economical in price per ton carried.
The coefficient of pile reaction would however be lower.
CONCLUSIONS
From the results of the Woolwich and other pile tests in chalk the following conchtsions
may be drawn :
(a) The ultimate end bearing capacity of universal bearing columns and displacement
type piles in chalk may be estimated from standard penetration tests.
(b) The ultimate resistance of displacement piles may also be estimated by means of theHiley formula, provided the shaft resistance is not predominant and the temporary
compression is measured when taking the set. This method is not particularly accurate
with very long slender UB piles.

8/12/2019 Ge 260104
http://slidepdf.com/reader/full/ge-260104 14/14
46 N. B. HOBBS AND P. ROBINS
c) The shaft resistance of long slender UB piles in chalk cannot be reliably forecast.
(d) Shorter stouter piles are likely to be more effective and more economical than longer
thinner piles, and in general displacement type piles are to be preferred to UB piles,
although it is recognized that there may be special circumstances when UB piles are
essential.
ACKNOWLEDGEMENTS
Acknowledgement is made to the Greater London Council and to Mr N. D. Ayres, Director
of Public Health Engineering, for the use of the material included in this Paper and the permis-
sion to publish it. The tests were carried out by Soil Mechanics Limited.
REFERENCES
Cornfield, G. M. (1971). Steel bearingpiles. London: Constrado.Hobbs, N. B. (1974). Factors affecting the prediction of settlement of structures on rock. Proc. Conf.
Settlement of Structur es. Cambridge: Pentech Press.
Lake, L. M. & Simons, N. E. (1970). Investigations into the engineering properties of chalk at Welford Theale,Berkshire. Proc. Conf. I n situ investigations in soils and rocks. London: British Geotechnical Society.
Meigh, A. C. (1971a). Some driving and loading tests on piles in chalk. Proc. Conf. Behaviour of Pil es.
London: Institution of Civil Engineers.Meigh, A. C. (1971b). Discussion: Some driving and loading tests on piles in chalk. Proc. Co Behaviour
of Pi les. London: Institution of Civil Engineers.
Wakeling, T. R. M. (1970). A comparison of the results of standard site investigation methods with the resultsof a detailed geotechnical investigation in Middle Chalk at Mundford, Norfolk. Proc. Conf. In situ investi-
gations in soil s and rocks. London: British Geotechnical Society.Wiliams, J. A. Discussion: Some driving and loading tests on piles in chalk. Proc. Conf. Behaviour of Piles.
London: Institution of Civil Engineers.