GCSE GEOGRAPHY Skills and Fieldwork for AQA GCSE Geography Maximise every student’s performance...
13
John Widdowson Rebecca Blackshaw Meryl King Simon Oakes Sarah Wheeler Michael Witherick GEOGRAPHY AQA GCSE SAMPLE MATERIAL This title has been selected for AQA’s official approval process
Transcript of GCSE GEOGRAPHY Skills and Fieldwork for AQA GCSE Geography Maximise every student’s performance...
John WiddowsonRebecca BlackshawMeryl KingSimon Oakes Sarah WheelerMichael Witherick
GEOGRAPHY
AQAGCSE
SAMPLE M
ATERIAL
This title has been selected for
AQA’s offi cial approval process
Also available:
AQA GCSE Geography Dynamic LearningDynamic Learning is an innovative online subscription service that enriches your teaching and simpli� es your planning, providing lesson planning tools, readymade presentations, differentiated worksheets, exam support, self-marking tests, geographical resources and eTextbook elements that all work together to create the ultimate classroom and homework resource.
Prices from: £420 + VAT for access until December 2018Publishing from: Spring 2016
Geographical Skills and Fieldwork for AQA GCSE GeographyMaximise every student’s performance with a step-by-step approach to learning, improving and applying the geographical and � eldwork skills they need to achieve their best under the reformed AQA speci� cation.
Price: £13.99Publishing: June 2016
My Revision Notes: AQA GCSE GeographyUnlock your students’ full potential at GCSE with revision guides that focus on the key knowledge and skills required for the 2016 speci� cation.
Price: £7.99Publishing from: September 2017
Wideworld magazineWideworld magazine helps students learn more, gaining deeper subject knowledge and the skills to progress skilfully through their GCSE studies. With a rich bank of up-to-date case studies, � eldwork examples and practical exam advice, Wideworld offers complete support for your GCSE geographers.
Institutional price: £20 • Student price: £10 • 4 issues per year
Philip Allan CPD TrainingEnsure that you are ready for the upcoming changes by attending one of our Preparing to Teach the New 2016 AQA GCSE Geography Speci� cation courses.
Simon Ross and Sarah Wheeler will support you in making a smooth transition to the 2016 AQA GCSE Geography speci� cation on this one-day course that looks at resources, teaching and learning strategies and � eldwork.
AQA TrainingFrom understanding and preparing to teach new speci� cations, through to developing subject expertise and moving leadership, AQA has a training offering for you. Continued professional development training is provided to over 30,000 teachers each year, either through face to face, online or in school courses, events and workshops.
For more information and to book your place visit www.aqa.org.uk/cpd
Meet the demands of the new AQA GCSE speci� cation with print and digital resources that support your planning, teaching and assessment needs; complemented by Wideworld magazine and expert-led, con� dence-boosting CPD events.
The following print and digital resources have been selected for AQA’s of� cial approval process:AQA GCSE Geography Student’s Book 9781471859922 March 2016 £22.99AQA GCSE Geography Student eTextbook 9781471859953 April 2016 From £5.75
To request Inspection Copies, eInspection Copies or free, no obligation 30-day Student eTextbook trials, visit www.hoddereducation.co.uk/Geography/GCSE/AQA
To � nd out more and request Inspection Copies, eInspection Copies and free, no obligation Dynamic Learning trials, visit www.hoddereducation.co.uk/Geography/GCSE/AQA
The Whiteboard eTextbook and Teaching and Learning Resources have not been entered into the AQA approval process
GEOGRAPHY
AQAGCSE

iv v
Contents
ContentsIntroduction
Theme 1: Living with the Physical Environment
Section A: The challenge of natural hazardsChapter 1 Natural hazards
Chapter 2 Tectonic hazards
Chapter 3 Weather hazards
Chapter 4 Climate change
Question Practice
Section B: The living worldChapter 5 Ecosystems
Chapter 6 Tropical rainforests
Chapter 7 Hot deserts
Chapter 8 Cold environments
Question Practice
Section C: Physical landscapes in the UKChapter 9 The physical diversity of the UK
Chapter 10 Coastal landscapes
Chapter 11 River landscapes
Chapter 12 Glacial landscapes
Question Practice
Theme 2: Challenges in the Human Environment
Section A: Urban challengesChapter 13 The global pattern of change
Chapter 14 Urban challenges in a low income country
Chapter 15 The urban challenges in the UK
Chapter 16 Sustainable development of urban areas
Question Practice
Section B: The changing economic worldChapter 17 Economic development and quality of life
Chapter 18 Reducing the global development gap
Chapter 19 Economic development in Nigeria
Chapter 20 Economic change in the UK
Question Practice
Section C: The challenge of resource managementChapter 21 The global distribution of food, water and energy
Chapter 22 Resources in the UK
Chapter 23 Food: global resource security
Chapter 24 Water: global resource security
Chapter 25 Energy: global resource security
Question Practice
Theme 3: Geographical ApplicationsChapter 26 Issue evaluation
Chapter 27 Fieldwork and geographical enquiry
Glossary
Index
1 Natural hazards
6
1.1
� KEY LEARNING➤ What a natural hazard is
➤ Di� erent types of natural hazards
➤ Factors that a� ect hazard risk
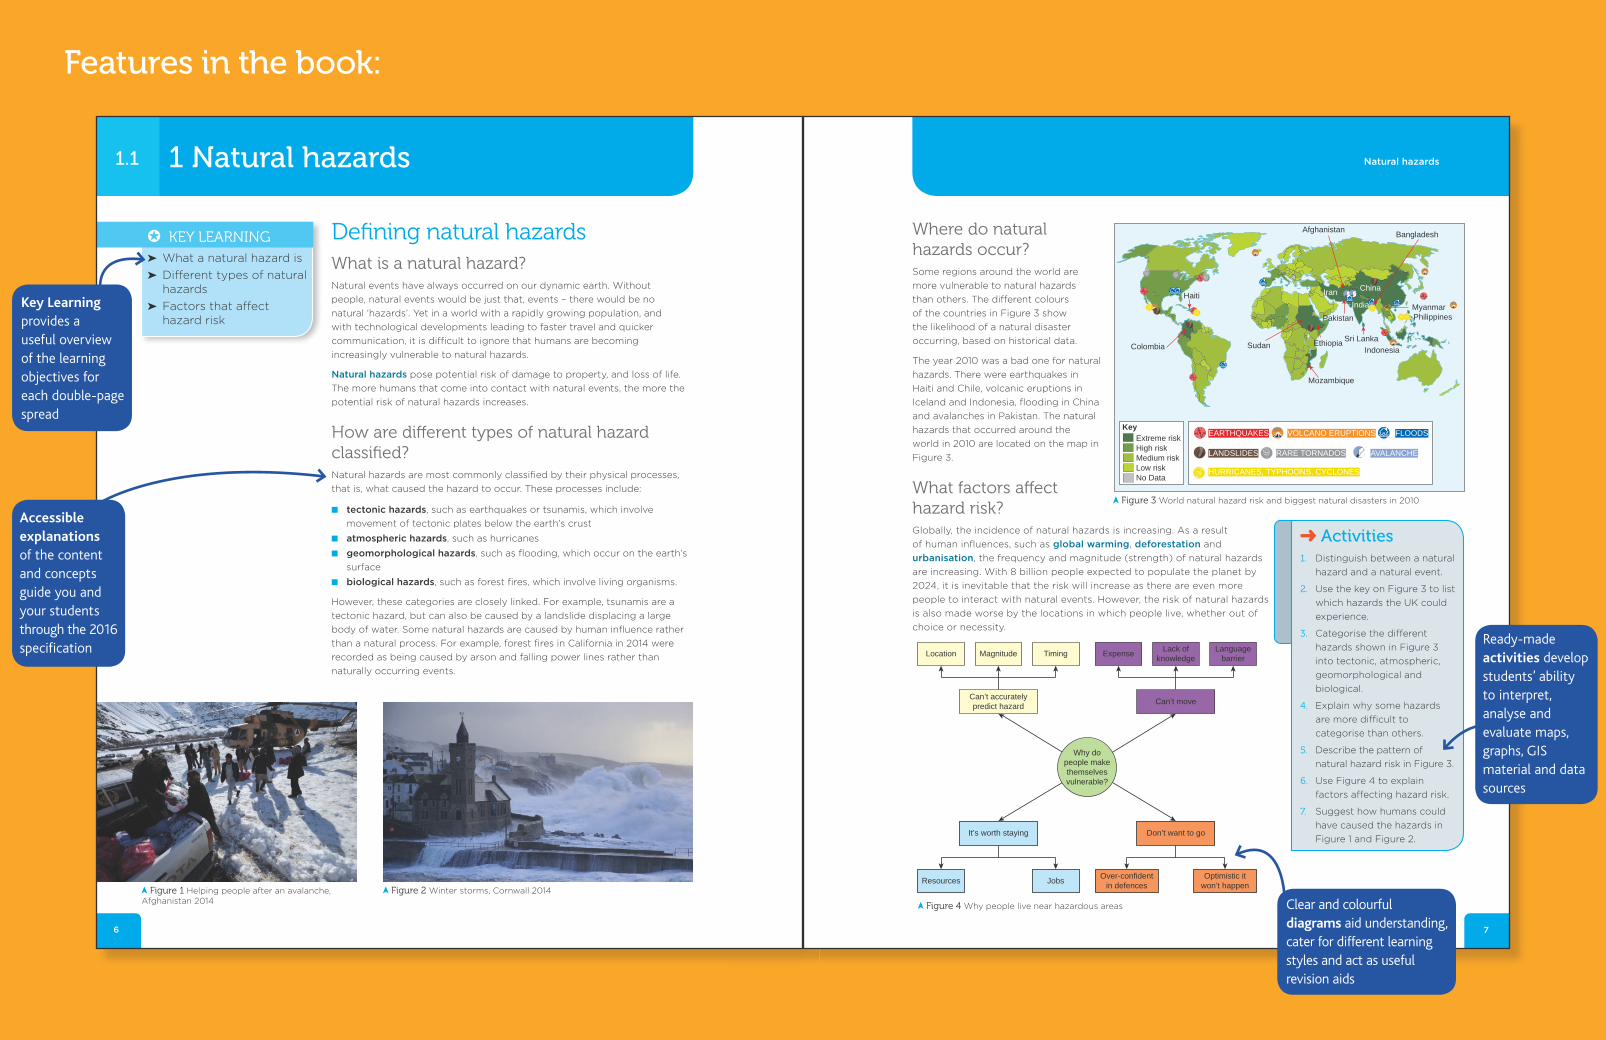
Defi ning natural hazardsWhat is a natural hazard?Natural events have always occurred on our dynamic earth. Without
people, natural events would be just that, events – there would be no
natural ‘hazards’. Yet in a world with a rapidly growing population, and
with technological developments leading to faster travel and quicker
communication, it is di cult to ignore that humans are becoming
increasingly vulnerable to natural hazards.
Figure 1 Helping people after an avalanche, Afghanistan 2014
Figure 2 Winter storms, Cornwall 2014
Natural hazards pose potential risk of damage to property, and loss of life.
The more humans that come into contact with natural events, the more the
potential risk of natural hazards increases.
How are di� erent types of natural hazard classifi ed?Natural hazards are most commonly classifi ed by their physical processes,
that is, what caused the hazard to occur. These processes include:
� tectonic hazards, such as earthquakes or tsunamis, which involve
movement of tectonic plates below the earth’s crust
� atmospheric hazards, such as hurricanes
� geomorphological hazards, such as fl ooding, which occur on the earth’s
surface
� biological hazards, such as forest fi res, which involve living organisms.
However, these categories are closely linked. For example, tsunamis are a
tectonic hazard, but can also be caused by a landslide displacing a large
body of water. Some natural hazards are caused by human infl uence rather
than a natural process. For example, forest fi res in California in 2014 were
recorded as being caused by arson and falling power lines rather than
naturally occurring events.
859922_AQA_GCSE_Geog_CH_01_006_007.indd 6 01/12/15 8:24 am
Key Learning provides a useful overview of the learning objectives for each double-page spread
Accessible explanations of the content and concepts guide you and your students through the 2016 specifi cation
7
Where do natural hazards occur?Some regions around the world are
more vulnerable to natural hazards
than others. The di erent colours
of the countries in Figure 3 show
the likelihood of a natural disaster
occurring, based on historical data.
The year 2010 was a bad one for natural
hazards. There were earthquakes in
Haiti and Chile, volcanic eruptions in
Iceland and Indonesia, fl ooding in China
and avalanches in Pakistan. The natural
hazards that occurred around the
world in 2010 are located on the map in
Figure 3.
What factors a� ect hazard risk?Globally, the incidence of natural hazards is increasing. As a result
of human infl uences, such as global warming, deforestation and
urbanisation, the frequency and magnitude (strength) of natural hazards
are increasing. With 8 billion people expected to populate the planet by
2024, it is inevitable that the risk will increase as there are even more
people to interact with natural events. However, the risk of natural hazards
is also made worse by the locations in which people live, whether out of
choice or necessity.
Activities1. Distinguish between a natural
hazard and a natural event.
2. Use the key on Figure 3 to list
which hazards the UK could
experience.
3. Categorise the di erent
hazards shown in Figure 3
into tectonic, atmospheric,
geomorphological and
biological.
4. Explain why some hazards
are more di� cult to
categorise than others.
5. Describe the pattern of
natural hazard risk in Figure 3.
6. Use Figure 4 to explain
factors a ecting hazard risk.
7. Suggest how humans could
have caused the hazards in
Figure 1 and Figure 2.
Natural hazards
Extreme riskHigh riskMedium riskLow riskNo Data
Key
Colombia
Haiti
Sudan Ethiopia Sri Lanka
Pakistan
Bangladesh
MyanmarPhilippines
Indonesia
India
ChinaIran
Afghanistan
Mozambique
EARTHQUAKES VOLCANO ERUPTIONS FLOODS
LANDSLIDES RARE TORNADOS AVALANCHE
HURRICANES, TYPHOONS, CYCLONES
Figure 3 World natural hazard risk and biggest natural disasters in 2010
Location Magnitude Timing
Can’t accuratelypredict hazard
Languagebarrier
Lack ofknowledgeExpense
Can’t move
Resources Jobs
It’s worth staying
Optimistic itwon’t happen
Over-confidentin defences
Don’t want to go
Why dopeople makethemselvesvulnerable?
Figure 4 Why people live near hazardous areas
859922_AQA_GCSE_Geog_CH_01_006_007.indd 7 01/12/15 8:24 am
Features in the book:
Clear and colourful diagrams aid understanding, cater for different learning styles and act as useful revision aids
Ready-made activities develop students’ ability to interpret, analyse and evaluate maps, graphs, GIS material and data sources
8 9
Urban challenges in the UK16 Urban challenges in the UK16.1
� KEY LEARNING➤ How the population of
the UK is distributed➤ Where cities in the UK
are located➤ How UK cities are
growing
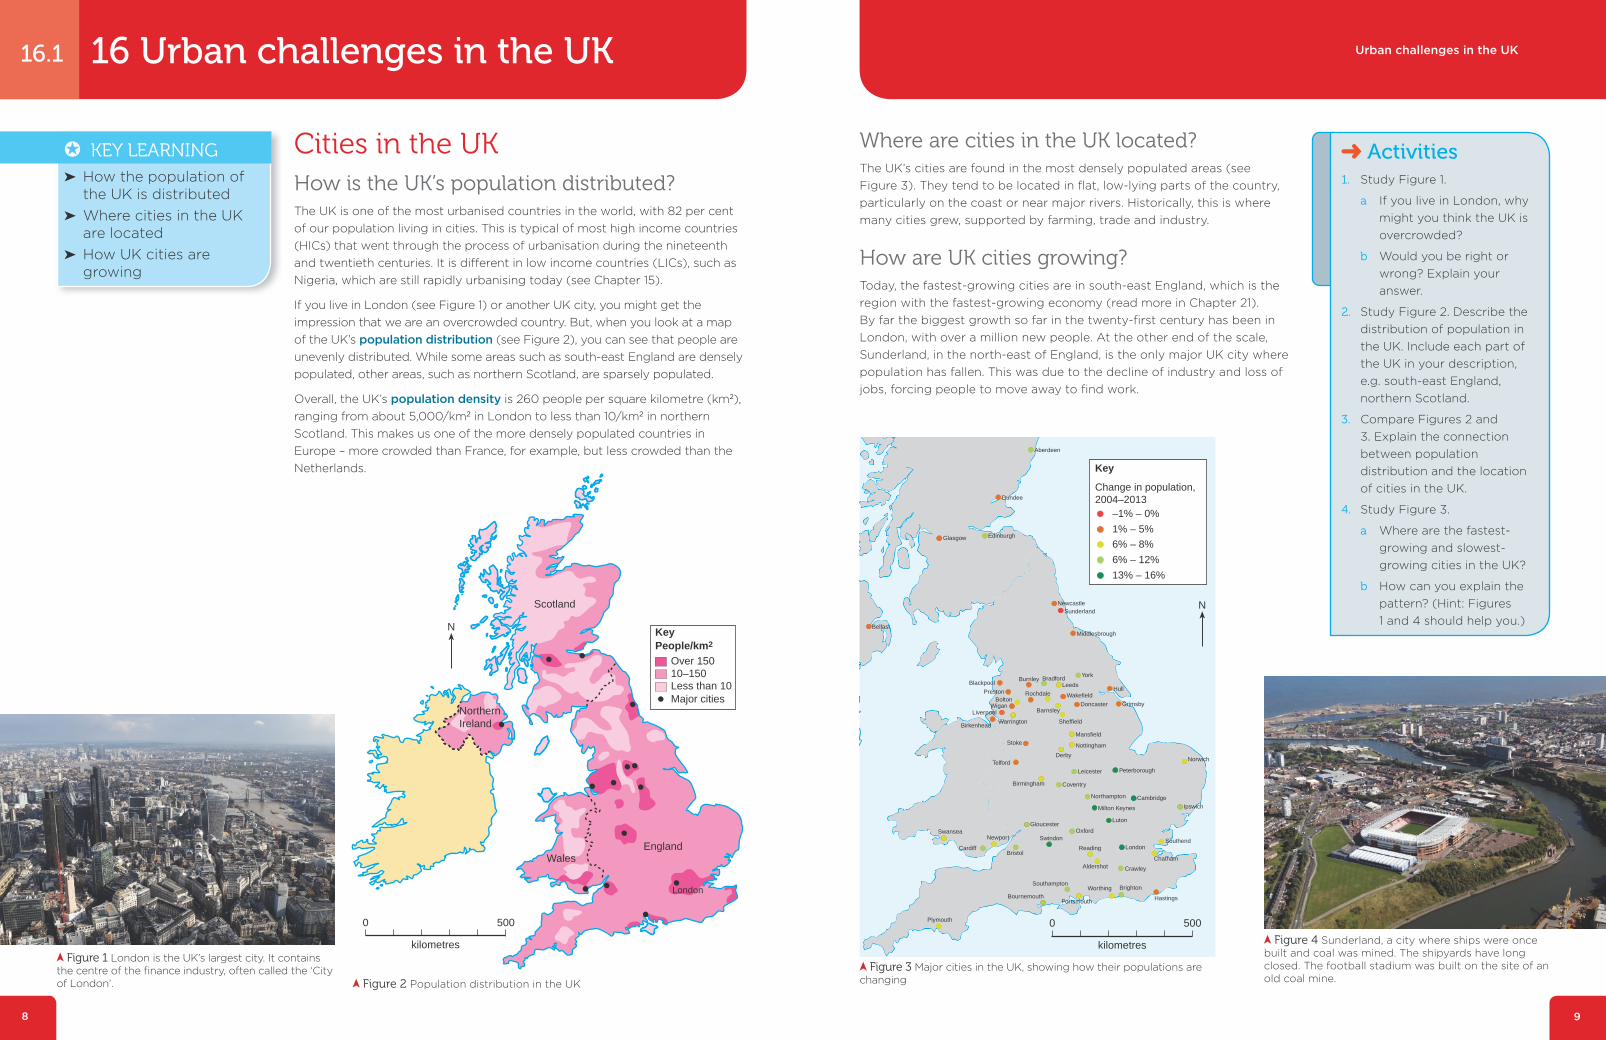
Cities in the UKHow is the UK’s population distributed?The UK is one of the most urbanised countries in the world, with 82 per cent of our population living in cities. This is typical of most high income countries (HICs) that went through the process of urbanisation during the nineteenth and twentieth centuries. It is di� erent in low income countries (LICs), such as Nigeria, which are still rapidly urbanising today (see Chapter 15).
If you live in London (see Figure 1) or another UK city, you might get the impression that we are an overcrowded country. But, when you look at a map of the UK’s population distribution (see Figure 2), you can see that people are unevenly distributed. While some areas such as south-east England are densely populated, other areas, such as northern Scotland, are sparsely populated.
Overall, the UK’s population density is 260 people per square kilometre (km2), ranging from about 5,000/km2 in London to less than 10/km2 in northern Scotland. This makes us one of the more densely populated countries in Europe – more crowded than France, for example, but less crowded than the Netherlands.
Where are cities in the UK located?The UK’s cities are found in the most densely populated areas (see Figure 3). They tend to be located in fl at, low-lying parts of the country, particularly on the coast or near major rivers. Historically, this is where many cities grew, supported by farming, trade and industry.
How are UK cities growing?Today, the fastest-growing cities are in south-east England, which is the region with the fastest-growing economy (read more in Chapter 21). By far the biggest growth so far in the twenty-fi rst century has been in London, with over a million new people. At the other end of the scale, Sunderland, in the north-east of England, is the only major UK city where population has fallen. This was due to the decline of industry and loss of jobs, forcing people to move away to fi nd work.
Figure 2 Population distribution in the UK
Over 15010–150Less than 10Major cities
People/km2Key
Scotland
NorthernIreland
England
London
Wales
N
0 500
kilometres Figure 1 London is the UK’s largest city. It contains
the centre of the fi nance industry, often called the ‘City of London’.
Figure 4 Sunderland, a city where ships were once built and coal was mined. The shipyards have long closed. The football stadium was built on the site of an old coal mine.
Figure 3 Major cities in the UK, showing how their populations are changing
Sunderland
Hull
Stoke
Hastings
Newcastle
Middlesbrough
GrimsbyDoncaster
Mansfield
Birmingham
Swansea
York
Cambridge
CrawleyAldershot
Reading
Oxford
Bristol
Wakefield
TelfordPeterborough
Coventry
Ipswich
Southend
Sheffield
Norwich
Nottingham
Leicester
Milton Keynes
Luton
London
Chatham
Gloucester
Cardiff
Newport
Bournemouth
Birkenhead
Liverpool
Bolton
Warrington
Blackpool
Derby
Northampton
Swindon
Plymouth
SouthamptonWorthing
Portsmouth
Brighton
Preston
Wigan
LeedsBradford
Dundee
EdinburghGlasgow
Aberdeen
Burnley
Rochdale
Belfast
Barnsley
Change in population,2004–2013
–1% – 0%
1% – 5%
6% – 8%
6% – 12%
13% – 16%
Key
N
0 500
kilometres
Activities1. Study Figure 1.
a If you live in London, why might you think the UK is overcrowded?
b Would you be right or wrong? Explain your answer.
2. Study Figure 2. Describe the distribution of population in the UK. Include each part of the UK in your description, e.g. south-east England, northern Scotland.
3. Compare Figures 2 and 3. Explain the connection between population distribution and the location of cities in the UK.
4. Study Figure 3.
a Where are the fastest-growing and slowest-growing cities in the UK?
b How can you explain the pattern? (Hint: Figures 1 and 4 should help you.)
10 11
Urban challenges in the UKChallenges in the Human Environment
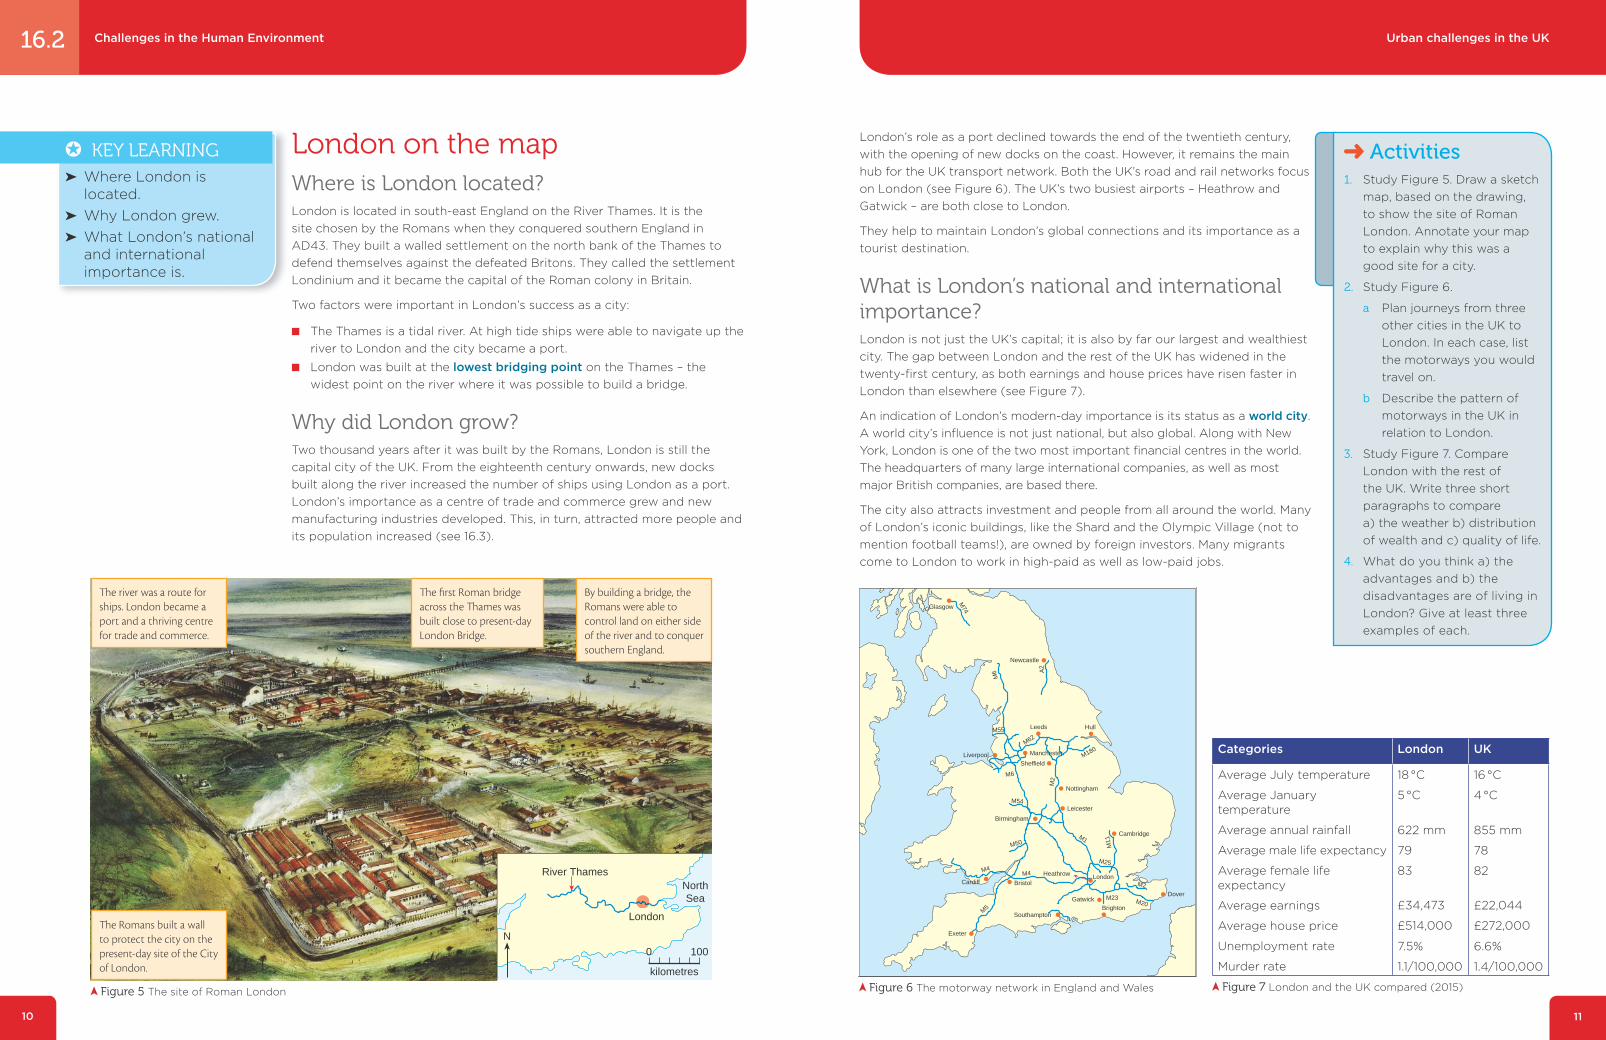
London on the mapWhere is London located?London is located in south-east England on the River Thames. It is the site chosen by the Romans when they conquered southern England in AD43. They built a walled settlement on the north bank of the Thames to defend themselves against the defeated Britons. They called the settlement Londinium and it became the capital of the Roman colony in Britain.
Two factors were important in London’s success as a city:
� The Thames is a tidal river. At high tide ships were able to navigate up the river to London and the city became a port.
� London was built at the lowest bridging point on the Thames – the widest point on the river where it was possible to build a bridge.
Why did London grow?Two thousand years after it was built by the Romans, London is still the capital city of the UK. From the eighteenth century onwards, new docks built along the river increased the number of ships using London as a port. London’s importance as a centre of trade and commerce grew and new manufacturing industries developed. This, in turn, attracted more people and its population increased (see 16.3).
London’s role as a port declined towards the end of the twentieth century, with the opening of new docks on the coast. However, it remains the main hub for the UK transport network. Both the UK’s road and rail networks focus on London (see Figure 6). The UK’s two busiest airports – Heathrow and Gatwick – are both close to London.
They help to maintain London’s global connections and its importance as a tourist destination.
What is London’s national and international importance?London is not just the UK’s capital; it is also by far our largest and wealthiest city. The gap between London and the rest of the UK has widened in the twenty-fi rst century, as both earnings and house prices have risen faster in London than elsewhere (see Figure 7).
An indication of London’s modern-day importance is its status as a world city. A world city’s infl uence is not just national, but also global. Along with New York, London is one of the two most important fi nancial centres in the world. The headquarters of many large international companies, as well as most major British companies, are based there.
The city also attracts investment and people from all around the world. Many of London’s iconic buildings, like the Shard and the Olympic Village (not to mention football teams!), are owned by foreign investors. Many migrants come to London to work in high-paid as well as low-paid jobs.
16.2
� KEY LEARNING➤ Where London is
located.➤ Why London grew.➤ What London’s national
and international importance is.
Figure 5 The site of Roman London
NorthSea
London
River Thames
1000
kilometres
N
� e river was a route for ships. London became a port and a thriving centre for trade and commerce.
� e fi rst Roman bridge across the � ames was built close to present-day London Bridge.
By building a bridge, the Romans were able to control land on either side of the river and to conquer southern England.
� e Romans built a wall to protect the city on the present-day site of the City of London.
London
Gatwick
Heathrow
Dover
BrightonSouthampton
Bristol
Exeter
Cardiff
Birmingham
Cambridge
Leicester
Nottingham
Sheffield
HullLeeds
Newcastle
Glasgow
ManchesterLiverpool
M23 M20
M2
M25
M1
M4
M5
M4
M50
M54
M6
M2
M62M55
A2
M74
M6
M180
M11
Figure 6 The motorway network in England and Wales Figure 7 London and the UK compared (2015)
Categories London UK
Average July temperature
Average January temperature
Average annual rainfall
Average male life expectancy
Average female life expectancy
Average earnings
Average house price
Unemployment rate
Murder rate
18�°C
5�°C
622 mm
79
83
£34,473
£514,000
7.5%
1.1/100,000
16�°C
4�°C
855 mm
78
82
£22,044
£272,000
6.6%
1.4/100,000
Activities1. Study Figure 5. Draw a sketch
map, based on the drawing, to show the site of Roman London. Annotate your map to explain why this was a good site for a city.
2. Study Figure 6.
a Plan journeys from three other cities in the UK to London. In each case, list the motorways you would travel on.
b Describe the pattern of motorways in the UK in relation to London.
3. Study Figure 7. Compare London with the rest of the UK. Write three short paragraphs to compare a) the weather b) distribution of wealth and c) quality of life.
4. What do you think a) the advantages and b) the disadvantages are of living in London? Give at least three examples of each.
12
Challenges in the Human Environment
✪ KEY LEARNING➤ How London’s
population has changed
➤ What London’s population structure is now
➤ The ethnic composition of London’s population
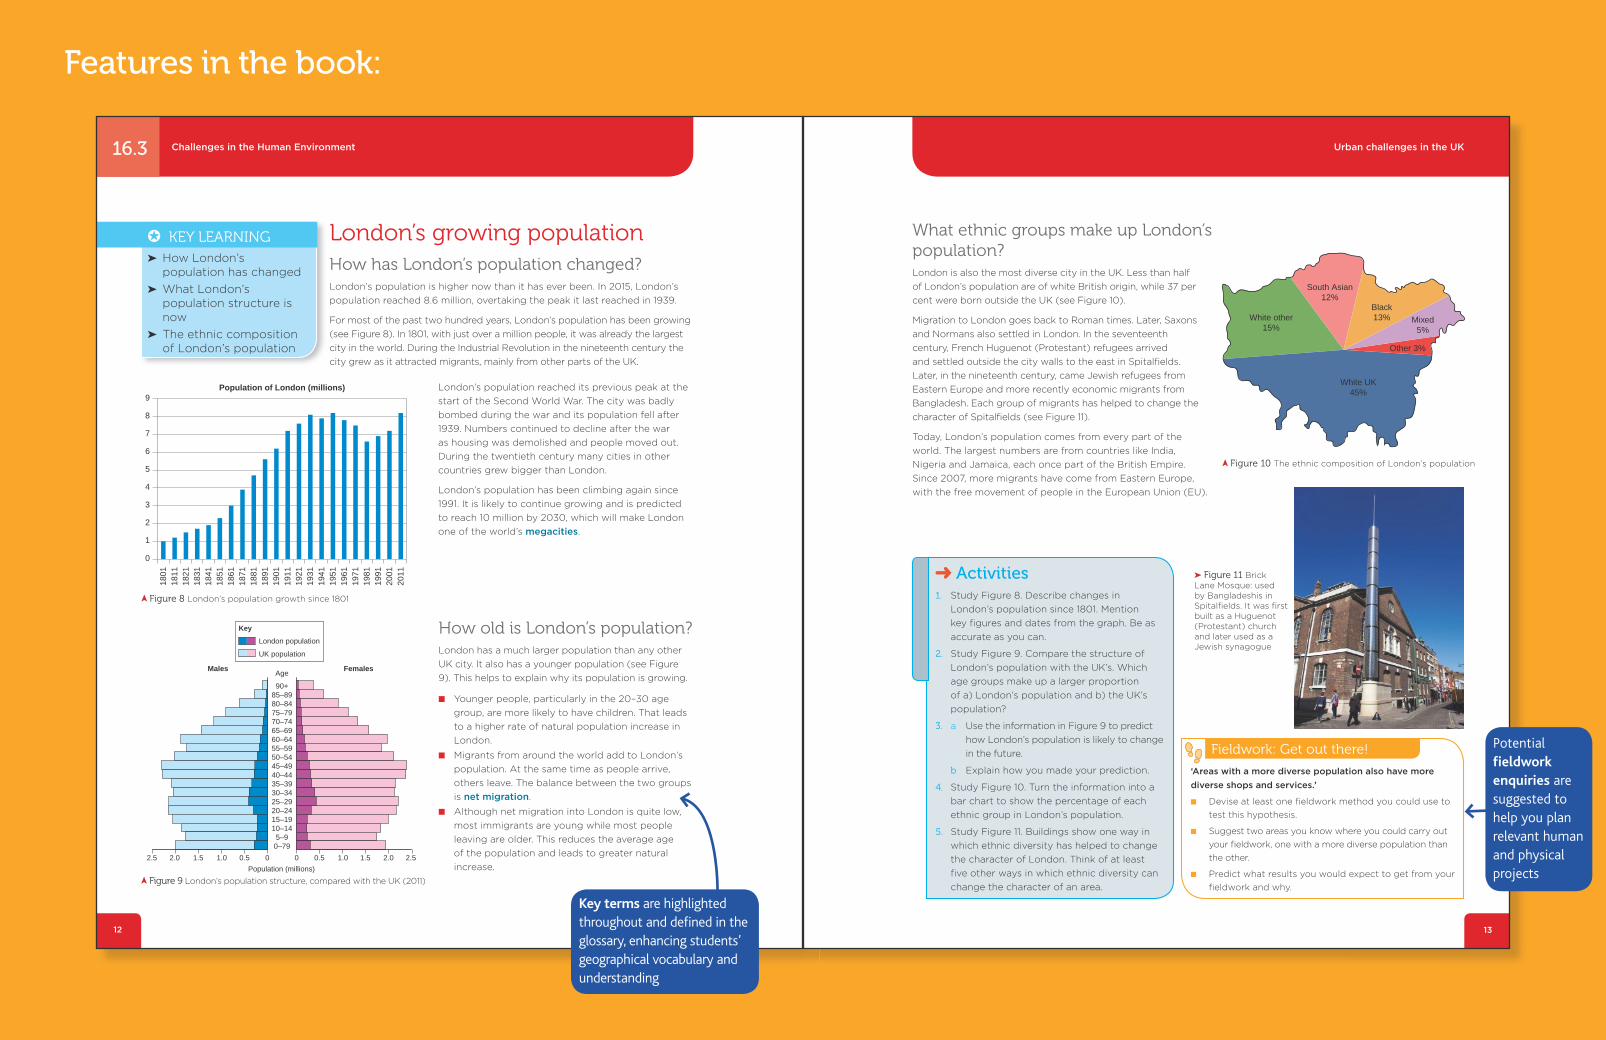
London’s growing populationHow has London’s population changed?London’s population is higher now than it has ever been. In 2015, London’s
population reached 8.6 million, overtaking the peak it last reached in 1939.
For most of the past two hundred years, London’s population has been growing
(see Figure 8). In 1801, with just over a million people, it was already the largest
city in the world. During the Industrial Revolution in the nineteenth century the
city grew as it attracted migrants, mainly from other parts of the UK.
London’s population reached its previous peak at the
start of the Second World War. The city was badly
bombed during the war and its population fell after
1939. Numbers continued to decline after the war
as housing was demolished and people moved out.
During the twentieth century many cities in other
countries grew bigger than London.
London’s population has been climbing again since
1991. It is likely to continue growing and is predicted
to reach 10 million by 2030, which will make London
one of the world’s megacities.
How old is London’s population?London has a much larger population than any other
UK city. It also has a younger population (see Figure
9). This helps to explain why its population is growing.
n Younger people, particularly in the 20–30 age
group, are more likely to have children. That leads
to a higher rate of natural population increase in
London.
n Migrants from around the world add to London’s
population. At the same time as people arrive,
others leave. The balance between the two groups
is net migration.
n Although net migration into London is quite low,
most immigrants are young while most people
leaving are older. This reduces the average age
of the population and leads to greater natural
increase.
16.3
0
1
2
3
4
5
6
7
8
9Population of London (millions)
1801
1811
1821
1831
1841
1851
1861
1871
1881
1891
1901
1911
1921
1931
1941
1951
1961
1971
1981
1991
2001
2011
Figure 8 London’s population growth since 1801
London populationUK population
Key
00 0.50.5 1.01.0 1.51.5 2.02.0 2.52.5
90+85–8980–8475–7970–7465–6960–6455–5950–5445–4940–4435–3930–3425–2920–2415–1910–14
5–90–79
AgeMales Females
Population (millions) Figure 9 London’s population structure, compared with the UK (2011)
859922_AQA_GCSE_Geog_Ch_16_012-013.indd 12 30/11/15 10:29 pm
13
Urban challenges in the UK
What ethnic groups make up London’s population?London is also the most diverse city in the UK. Less than half
of London’s population are of white British origin, while 37 per
cent were born outside the UK (see Figure 10).
Migration to London goes back to Roman times. Later, Saxons
and Normans also settled in London. In the seventeenth
century, French Huguenot (Protestant) refugees arrived
and settled outside the city walls to the east in Spitalfields.
Later, in the nineteenth century, came Jewish refugees from
Eastern Europe and more recently economic migrants from
Bangladesh. Each group of migrants has helped to change the
character of Spitalfields (see Figure 11).
Today, London’s population comes from every part of the
world. The largest numbers are from countries like India,
Nigeria and Jamaica, each once part of the British Empire.
Since 2007, more migrants have come from Eastern Europe,
with the free movement of people in the European Union (EU).
White other15%
South Asian12%
Black13% Mixed
5%
White UK45%
Other 3%
Figure 10 The ethnic composition of London’s population
Figure 11 Brick Lane Mosque: used by Bangladeshis in Spitalfields. It was first built as a Huguenot (Protestant) church and later used as a Jewish synagogue
Activities1. Study Figure 8. Describe changes in
London’s population since 1801. Mention
key figures and dates from the graph. Be as
accurate as you can.
2. Study Figure 9. Compare the structure of
London’s population with the UK’s. Which
age groups make up a larger proportion
of a) London’s population and b) the UK’s
population?
3. a Use the information in Figure 9 to predict
how London’s population is likely to change
in the future.
b Explain how you made your prediction.
4. Study Figure 10. Turn the information into a
bar chart to show the percentage of each
ethnic group in London’s population.
5. Study Figure 11. Buildings show one way in
which ethnic diversity has helped to change
the character of London. Think of at least
five other ways in which ethnic diversity can
change the character of an area.
Fieldwork: Get out there!
‘Areas with a more diverse population also have more
diverse shops and services.’
n Devise at least one fieldwork method you could use to
test this hypothesis.
n Suggest two areas you know where you could carry out
your fieldwork, one with a more diverse population than
the other.
n Predict what results you would expect to get from your
fieldwork and why.
859922_AQA_GCSE_Geog_Ch_16_012-013.indd 13 30/11/15 10:29 pm
Features in the book:
Key terms are highlighted throughout and defi ned in the glossary, enhancing students’ geographical vocabulary and understanding
Potential fi eldwork enquiries are suggested to help you plan relevant human and physical projects
14 15
Challenges in the Human Environment Urban challenges in the UK
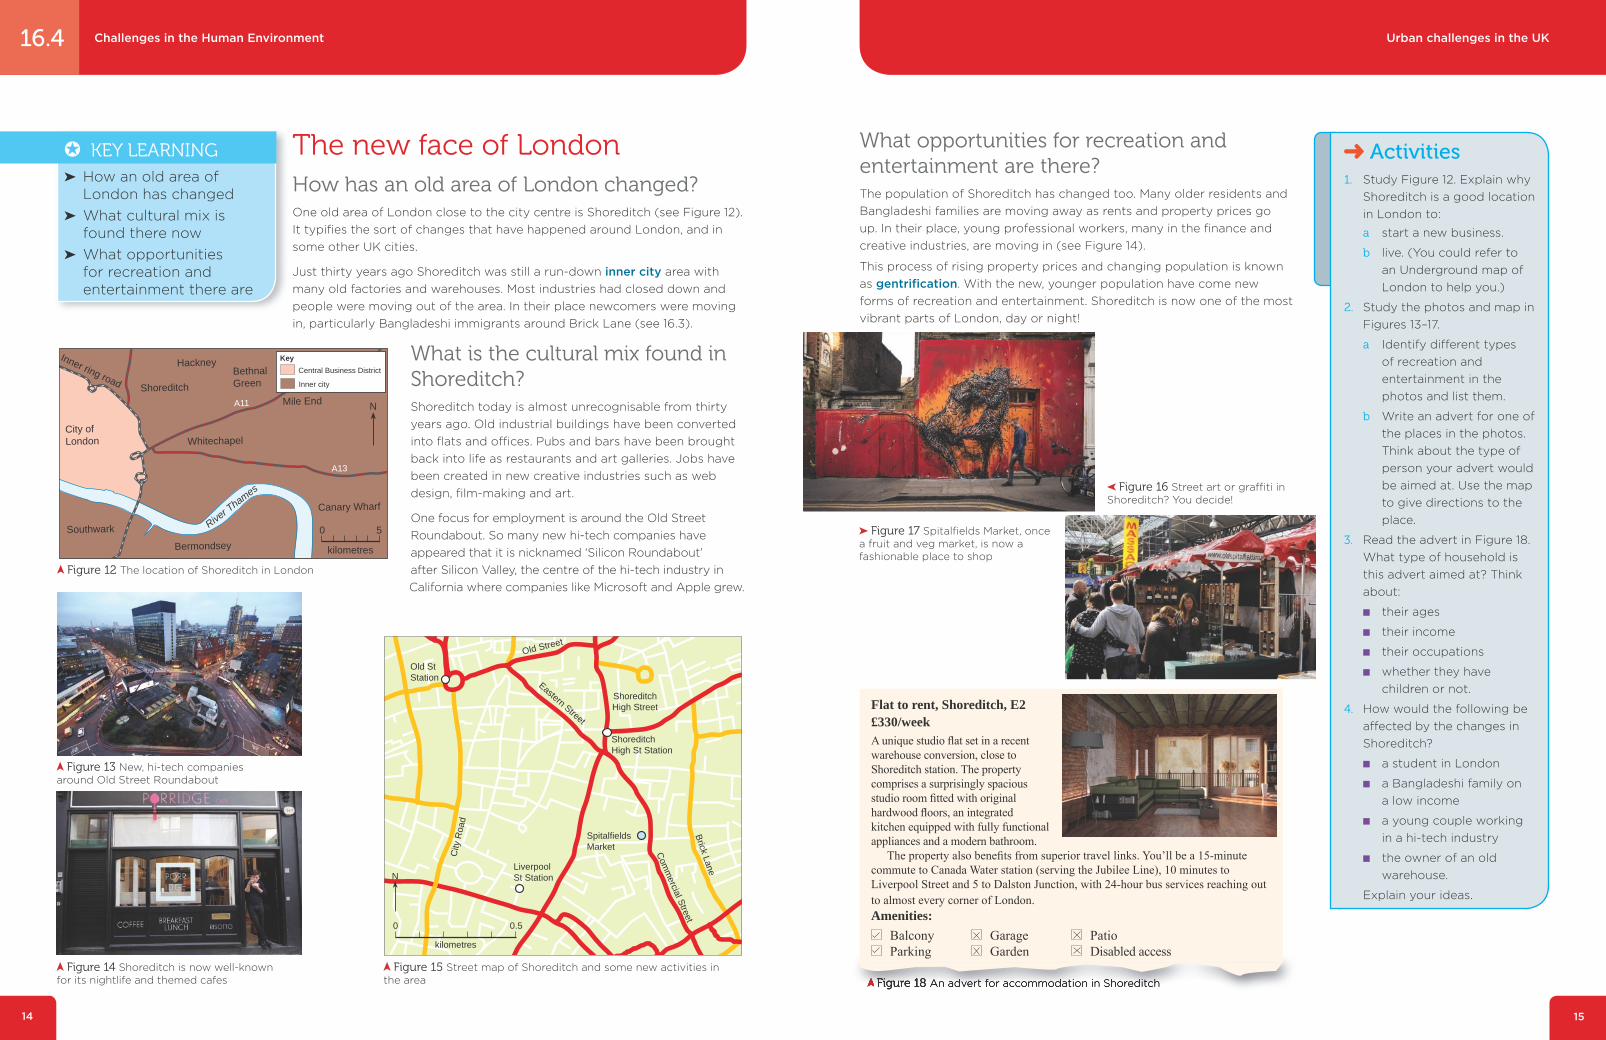
What opportunities for recreation and entertainment are there?The population of Shoreditch has changed too. Many older residents and Bangladeshi families are moving away as rents and property prices go up. In their place, young professional workers, many in the fi nance and creative industries, are moving in (see Figure 14).
This process of rising property prices and changing population is known as gentrifi cation. With the new, younger population have come new forms of recreation and entertainment. Shoreditch is now one of the most vibrant parts of London, day or night!
The new face of LondonHow has an old area of London changed?One old area of London close to the city centre is Shoreditch (see Figure 12). It typifi es the sort of changes that have happened around London, and in some other UK cities.
Just thirty years ago Shoreditch was still a run-down inner city area with many old factories and warehouses. Most industries had closed down and people were moving out of the area. In their place newcomers were moving in, particularly Bangladeshi immigrants around Brick Lane (see 16.3).
16.4
Shoreditch
Hackney
Whitechapel
Mile EndA11
A13
Bermondsey
Canary Wharf
City ofLondon
Southwark
BethnalGreen
River T
hames
Inner ring roadCentral Business District
Inner city
Key
N
0 5
kilometres
Figure 12 The location of Shoreditch in London
Old Street
Com
mercial S
treet
City
Roa
d
Brick Lane
Eastern Street
Old StStation
ShoreditchHigh St Station
SpitalfieldsMarket
N
ShoreditchHigh Street
0 0.5
kilometres
Liverpool St Station
Figure 15 Street map of Shoreditch and some new activities in the area
Figure 13 New, hi-tech companies around Old Street Roundabout
Figure 14 Shoreditch is now well-known for its nightlife and themed cafes
Figure 17 Spitalfi elds Market, once a fruit and veg market, is now a fashionable place to shop
Figure 16 Street art or gra� ti in Shoreditch? You decide!
� KEY LEARNING➤ How an old area of
London has changed➤ What cultural mix is
found there now➤ What opportunities
for recreation and entertainment there are
Figure 18 An advert for accommodation in Shoreditch Figure 18 Figure 18 An advert for accommodation in Shoreditch
Flat to rent, Shoreditch, E2 £330/weekA unique studio fl at set in a recent warehouse conversion, close to Shoreditch station. The property comprises a surprisingly spacious studio room fi tted with original hardwood fl oors, an integrated kitchen equipped with fully functional appliances and a modern bathroom.
The property also benefi ts from superior travel links. You’ll be a 15-minute commute to Canada Water station (serving the Jubilee Line), 10 minutes to Liverpool Street and 5 to Dalston Junction, with 24-hour bus services reaching out to almost every corner of London. Amenities:
Balcony Parking
Garage Garden
Patio Disabled access
Activities1. Study Figure 12. Explain why
Shoreditch is a good location in London to:
a start a new business.
b live. (You could refer to an Underground map of London to help you.)
2. Study the photos and map in Figures 13–17.
a Identify di� erent types of recreation and entertainment in the photos and list them.
b Write an advert for one of the places in the photos. Think about the type of person your advert would be aimed at. Use the map to give directions to the place.
3. Read the advert in Figure 18. What type of household is this advert aimed at? Think about:
■ their ages
■ their income
■ their occupations
■ whether they have children or not.
4. How would the following be a� ected by the changes in Shoreditch?
■ a student in London
■ a Bangladeshi family on a low income
■ a young couple working in a hi-tech industry
■ the owner of an old warehouse.
Explain your ideas.
What is the cultural mix found in Shoreditch?Shoreditch today is almost unrecognisable from thirty years ago. Old industrial buildings have been converted into fl ats and o� ces. Pubs and bars have been brought back into life as restaurants and art galleries. Jobs have been created in new creative industries such as web design, fi lm-making and art.
One focus for employment is around the Old Street Roundabout. So many new hi-tech companies have appeared that it is nicknamed ‘Silicon Roundabout’ after Silicon Valley, the centre of the hi-tech industry in California where companies like Microsoft and Apple grew.
16 17
Urban challenges in the UKChallenges in the Human Environment
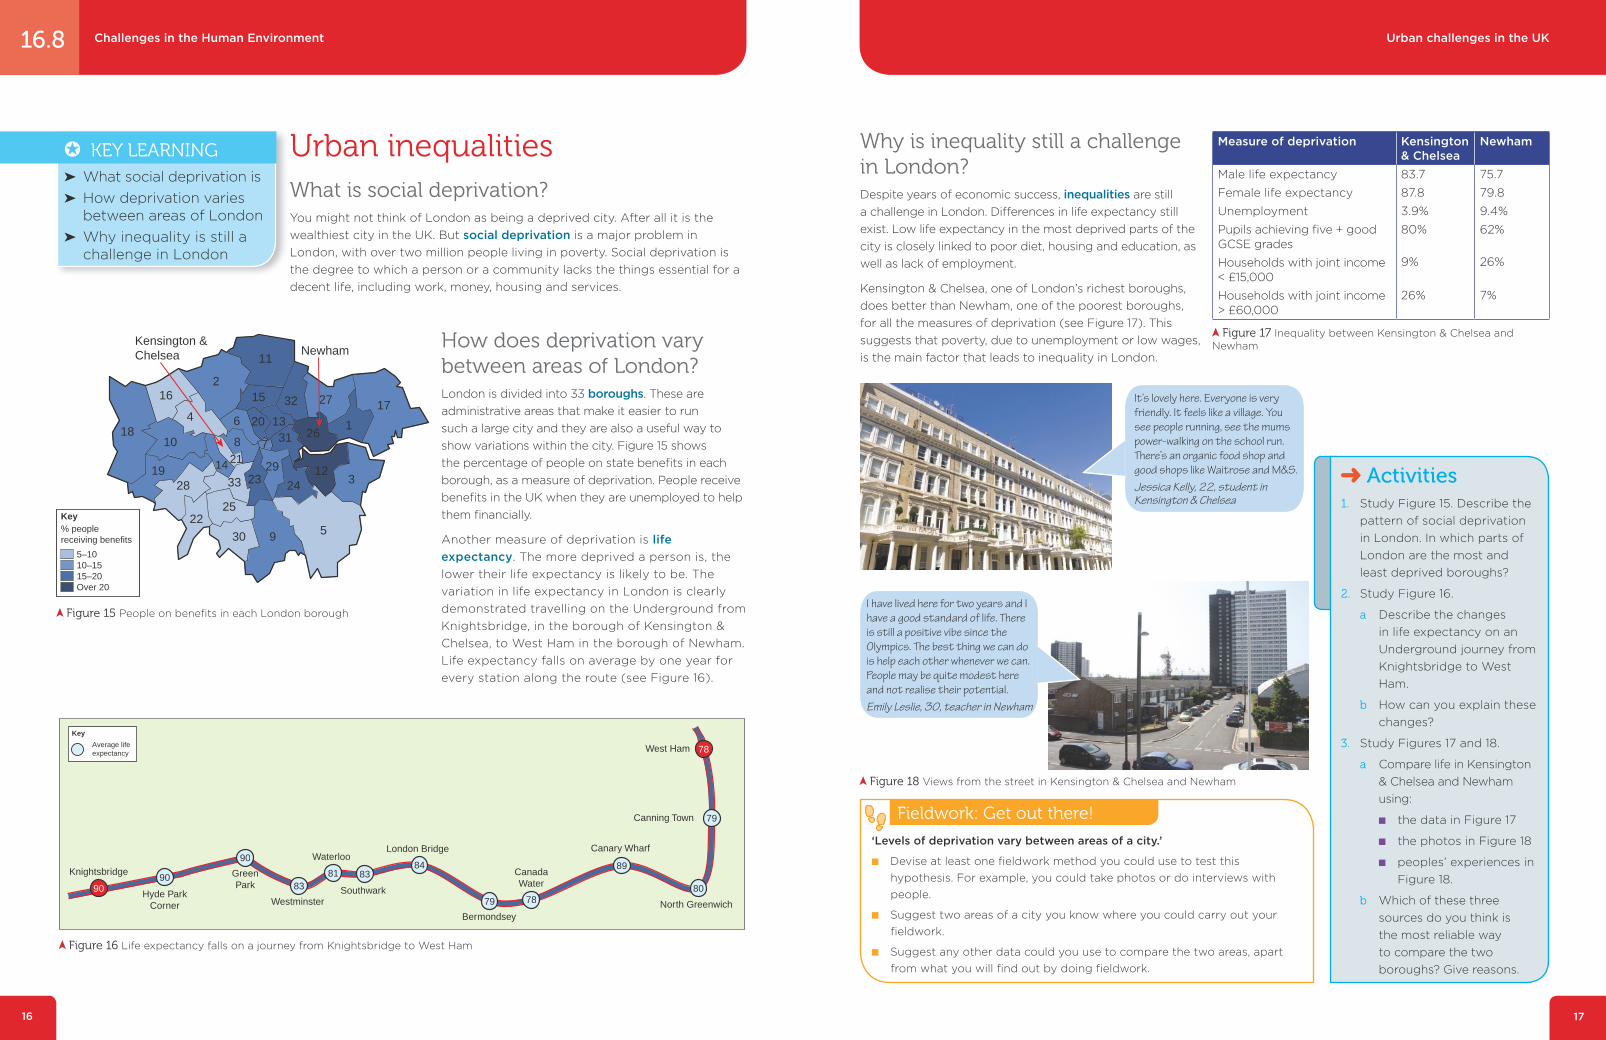
Urban inequalitiesWhat is social deprivation?You might not think of London as being a deprived city. After all it is the wealthiest city in the UK. But social deprivation is a major problem in London, with over two million people living in poverty. Social deprivation is the degree to which a person or a community lacks the things essential for a decent life, including work, money, housing and services.
18
162
11Newham
Kensington &Chelsea
19
10
4 6
7
15 32 27
1
17
3
5
1224
930
2522
28 33 2329
20 1331 26
8
14 21
5–1010–1515–20Over 20
Key% peoplereceiving benefits
Figure 15 People on benefi ts in each London borough
Bermondsey
CanadaWater
London Bridge
GreenPark
Hyde ParkCorner
Knightsbridge
Canary Wharf
North Greenwich
Canning Town
West Ham
WestminsterSouthwark
Waterloo
9090
90
8381 83
84
79 78
89
80
79
78Average lifeexpectancy
Key
Figure 16 Life expectancy falls on a journey from Knightsbridge to West Ham
16.8
Why is inequality still a challenge in London?Despite years of economic success, inequalities are still a challenge in London. Di� erences in life expectancy still exist. Low life expectancy in the most deprived parts of the city is closely linked to poor diet, housing and education, as well as lack of employment.
Kensington & Chelsea, one of London’s richest boroughs, does better than Newham, one of the poorest boroughs, for all the measures of deprivation (see Figure 17). This suggests that poverty, due to unemployment or low wages, is the main factor that leads to inequality in London.
� KEY LEARNING➤ What social deprivation is➤ How deprivation varies
between areas of London➤ Why inequality is still a
challenge in London
Figure 18 Views from the street in Kensington & Chelsea and Newham
Measure of deprivation Kensington & Chelsea
Newham
Male life expectancy
Female life expectancy
Unemployment
Pupils achieving fi ve + good GCSE grades
Households with joint income < £15,000
Households with joint income > £60,000
83.7
87.8
3.9%
80%
9%
26%
75.7
79.8
9.4%
62%
26%
7%
Figure 17 Inequality between Kensington & Chelsea and Newham
Activities1. Study Figure 15. Describe the
pattern of social deprivation in London. In which parts of London are the most and least deprived boroughs?
2. Study Figure 16.
a Describe the changes in life expectancy on an Underground journey from Knightsbridge to West Ham.
b How can you explain these changes?
3. Study Figures 17 and 18.
a Compare life in Kensington & Chelsea and Newham using:
■ the data in Figure 17
■ the photos in Figure 18
■ peoples’ experiences in Figure 18.
b Which of these three sources do you think is the most reliable way to compare the two boroughs? Give reasons.
Fieldwork: Get out there!
‘Levels of deprivation vary between areas of a city.’
� Devise at least one fi eldwork method you could use to test this hypothesis. For example, you could take photos or do interviews with people.
� Suggest two areas of a city you know where you could carry out your fi eldwork.
� Suggest any other data could you use to compare the two areas, apart from what you will fi nd out by doing fi eldwork.
It’s lovely here. Everyone is very friendly. It feels like a village. You see people running, see the mums power-walking on the school run. There’s an organic food shop and good shops like Waitrose and M&S. Jessica Kelly, 22, student in Kensington & Chelsea
I have lived here for two years and I have a good standard of life. There is still a positive vibe since the Olympics. The best thing we can do is help each other whenever we can. People may be quite modest here and not realise their potential.Emily Leslie, 30, teacher in Newham
How does deprivation vary between areas of London?London is divided into 33 boroughs. These are administrative areas that make it easier to run such a large city and they are also a useful way to show variations within the city. Figure 15 shows the percentage of people on state benefi ts in each borough, as a measure of deprivation. People receive benefi ts in the UK when they are unemployed to help them fi nancially.
Another measure of deprivation is life expectancy. The more deprived a person is, the lower their life expectancy is likely to be. The variation in life expectancy in London is clearly demonstrated travelling on the Underground from Knightsbridge, in the borough of Kensington & Chelsea, to West Ham in the borough of Newham. Life expectancy falls on average by one year for every station along the route (see Figure 16).
18 19
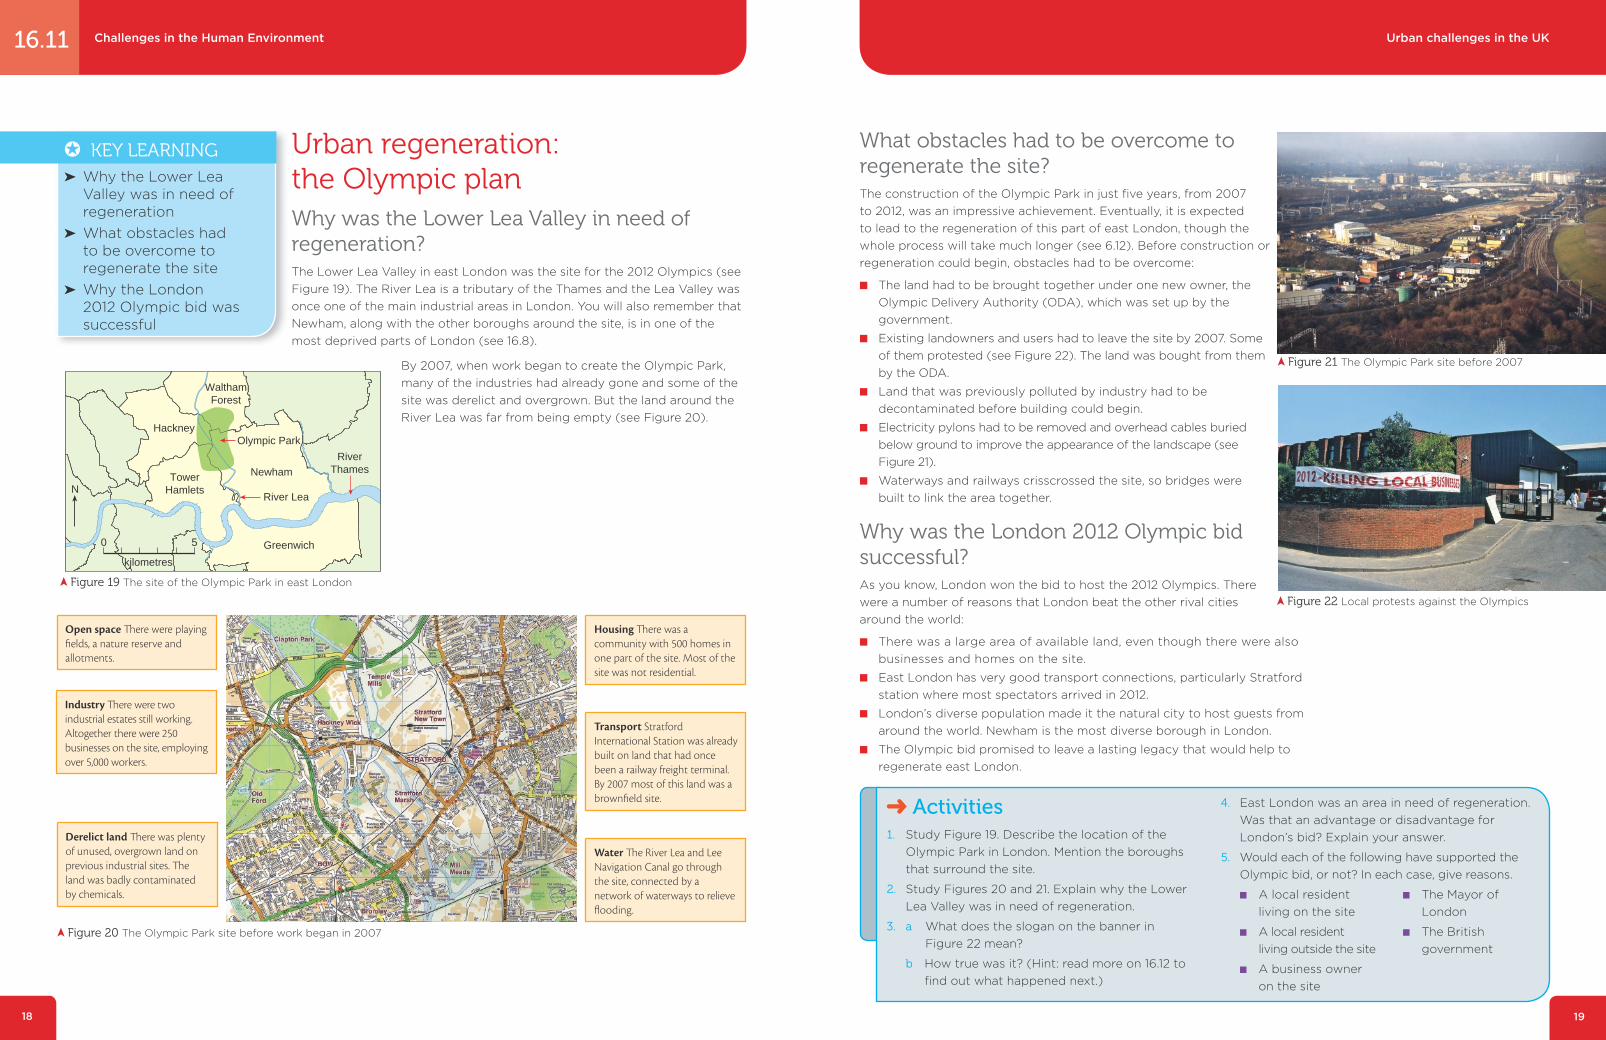
What obstacles had to be overcome to regenerate the site?The construction of the Olympic Park in just fi ve years, from 2007 to 2012, was an impressive achievement. Eventually, it is expected to lead to the regeneration of this part of east London, though the whole process will take much longer (see 6.12). Before construction or regeneration could begin, obstacles had to be overcome:
� The land had to be brought together under one new owner, the Olympic Delivery Authority (ODA), which was set up by the government.
� Existing landowners and users had to leave the site by 2007. Some of them protested (see Figure 22). The land was bought from them by the ODA.
� Land that was previously polluted by industry had to be decontaminated before building could begin.
� Electricity pylons had to be removed and overhead cables buried below ground to improve the appearance of the landscape (see Figure 21).
� Waterways and railways crisscrossed the site, so bridges were built to link the area together.
Why was the London 2012 Olympic bid successful?As you know, London won the bid to host the 2012 Olympics. There were a number of reasons that London beat the other rival cities around the world:
� There was a large area of available land, even though there were also businesses and homes on the site.
� East London has very good transport connections, particularly Stratford station where most spectators arrived in 2012.
� London’s diverse population made it the natural city to host guests from around the world. Newham is the most diverse borough in London.
� The Olympic bid promised to leave a lasting legacy that would help to regenerate east London.
� KEY LEARNING➤ Why the Lower Lea
Valley was in need of regeneration
➤ What obstacles had to be overcome to regenerate the site
➤ Why the London 2012 Olympic bid was successful
Urban regeneration: the Olympic planWhy was the Lower Lea Valley in need of regeneration?The Lower Lea Valley in east London was the site for the 2012 Olympics (see Figure 19). The River Lea is a tributary of the Thames and the Lea Valley was once one of the main industrial areas in London. You will also remember that Newham, along with the other boroughs around the site, is in one of the most deprived parts of London (see 16.8).
By 2007, when work began to create the Olympic Park, many of the industries had already gone and some of the site was derelict and overgrown. But the land around the River Lea was far from being empty (see Figure 20).
Challenges in the Human Environment Urban challenges in the UK16.11
Greenwich
Hackney
WalthamForest
Newham
River Lea
RiverThames
TowerHamletsN
0 5
kilometres
Olympic Park
Figure 19 The site of the Olympic Park in east London
Figure 20 The Olympic Park site before work began in 2007
Open space � ere were playing fi elds, a nature reserve and allotments.
Transport Stratford International Station was already built on land that had once been a railway freight terminal. By 2007 most of this land was a brownfi eld site.
Industry � ere were two industrial estates still working. Altogether there were 250 businesses on the site, employing over 5,000 workers.
Water � e River Lea and Lee Navigation Canal go through the site, connected by a network of waterways to relieve fl ooding.
Figure 21 The Olympic Park site before 2007
Figure 22 Local protests against the Olympics
Activities1. Study Figure 19. Describe the location of the
Olympic Park in London. Mention the boroughs that surround the site.
2. Study Figures 20 and 21. Explain why the Lower Lea Valley was in need of regeneration.
3. a What does the slogan on the banner inFigure 22 mean?
b How true was it? (Hint: read more on 16.12 to fi nd out what happened next.)
4. East London was an area in need of regeneration. Was that an advantage or disadvantage for London’s bid? Explain your answer.
5. Would each of the following have supported the Olympic bid, or not? In each case, give reasons.
■ A local resident living on the site
■ A local resident living outside the site
■ A business owner on the site
■ The Mayor of Londo n
■ The British government
Housing � ere was a community with 500 homes in one part of the site. Most of the site was not residential.
Derelict land � ere was plenty of unused, overgrown land on previous industrial sites. � e land was badly contaminated by chemicals.
20
Challenges in the Human Environment
✪ KEY LEARNING➤ How the environment of
the Lower Lea Valley has changed
➤ What social and economic changes there have been
Urban regeneration: the Olympic legacyHow has the environment of the Lower Lea Valley changed?The Queen Elizabeth Olympic Park has completely transformed the
environment of the Lower Lea Valley.
Gone are the:
n old factories, industrial estates and homes
n derelict and overgrown sites
n electricity pylons and overhead cables
n contaminated soil and polluted waterways
n the Olympic Delivery Authority.
In their place have appeared:
n stunning new sports venues, including the Aquatics
Centre (see Figure 23), stadium and velodrome
n a landscaped park with tourist attractions and natural habitats
n the Athletes’ Village, now converted into a residential community
n clean soil and waterways
n the London Legacy Development Corporation (LLDC)
(who have taken over from ODA).
16.12
Figure 23 The Aquatics Centre beside the River Lea
Here East � e new name for the Media Centre is now a hub for creative and media industries with 5,000 jobs.
LLDC � is organisation controls an area including the park and surrounding neighbourhoods to make the legacy a reality.
Queen Elizabeth Olympic Park With over 100 hectares of open space, this is the largest new park in London for over a century.
Olympic stadium � e new home of West Ham United FC but still an athletics stadium in the summer.
East Village � e new name for the Athletes’ Village, it now provides 2,800 homes for local people and newcomers.
� e Aquatics Centre and Velopark Two new sports venues open to the public and used by schools.
Westfi eld Stratford City Not really part of the Olympic legacy, but next door to the park and employs 10,000 people.
� e International Quarter A new commercial development of high-rise offi ces which will employ 25,000 people.
Figure 24 The legacy plan for the Olympic Park
Hackney
Waltham Forest
TowerHamlets
Newham
The International Quarter
OlympicStadium
QEOlympic
Park
Stratford City(Westfield)East Village
Here East
Waltham Forest
Velodrome
Newham
The International Quarter
AquaticsCentre
KeyLondon Legacy Development Corporation boundaryBorough boundariesMajor road
WaterwayGreen spaceNew housing
859922_AQA_GCSE_Geog_Ch_16_020-022.indd 20 01/12/15 8:52 am
21
Urban challenges in the UK
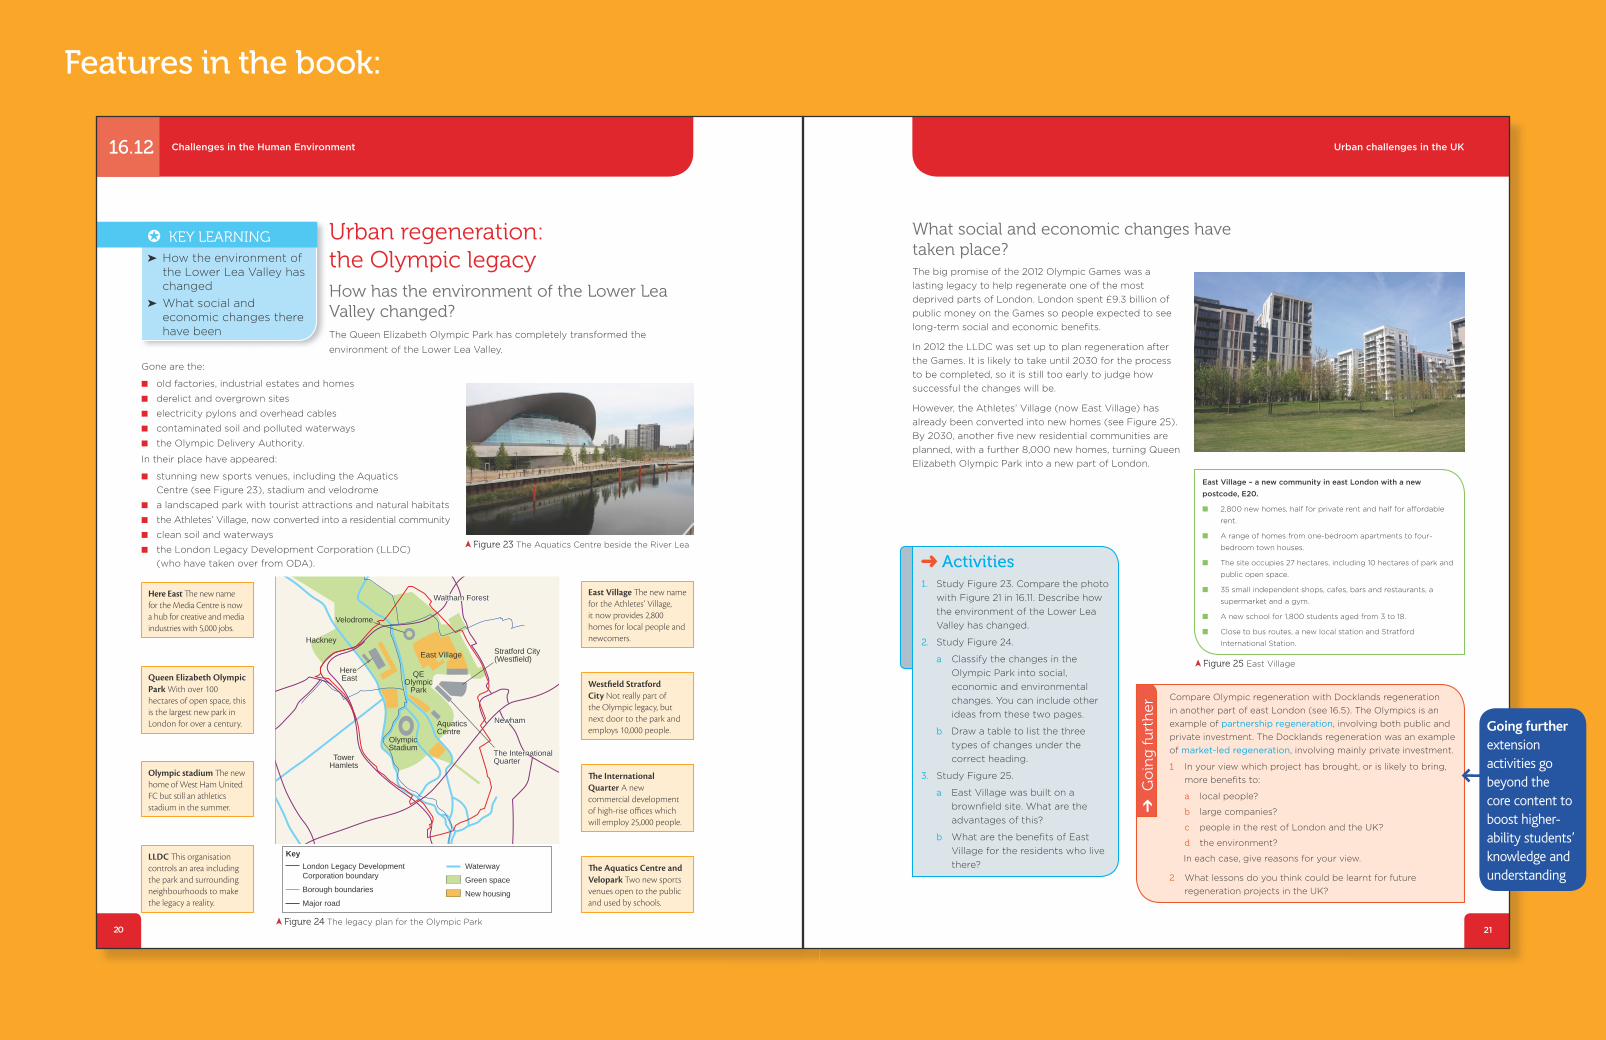
What social and economic changes have taken place?The big promise of the 2012 Olympic Games was a
lasting legacy to help regenerate one of the most
deprived parts of London. London spent £9.3 billion of
public money on the Games so people expected to see
long-term social and economic benefits.
In 2012 the LLDC was set up to plan regeneration after
the Games. It is likely to take until 2030 for the process
to be completed, so it is still too early to judge how
successful the changes will be.
However, the Athletes’ Village (now East Village) has
already been converted into new homes (see Figure 25).
By 2030, another five new residential communities are
planned, with a further 8,000 new homes, turning Queen
Elizabeth Olympic Park into a new part of London.
Activities1. Study Figure 23. Compare the photo
with Figure 21 in 16.11. Describe how
the environment of the Lower Lea
Valley has changed.
2. Study Figure 24.
a Classify the changes in the
Olympic Park into social,
economic and environmental
changes. You can include other
ideas from these two pages.
b Draw a table to list the three
types of changes under the
correct heading.
3. Study Figure 25.
a East Village was built on a
brownfield site. What are the
advantages of this?
b What are the benefits of East
Village for the residents who live
there?
Compare Olympic regeneration with Docklands regeneration
in another part of east London (see 16.5). The Olympics is an
example of partnership regeneration, involving both public and
private investment. The Docklands regeneration was an example
of market-led regeneration, involving mainly private investment.
1 In your view which project has brought, or is likely to bring,
more benefits to:
a local people?
b large companies?
c people in the rest of London and the UK?
d the environment?
In each case, give reasons for your view.
2 What lessons do you think could be learnt for future
regeneration projects in the UK?
➔ G
oin
g f
urt
her
East Village – a new community in east London with a new
postcode, E20.
n 2,800 new homes, half for private rent and half for affordable
rent.
n A range of homes from one-bedroom apartments to four-
bedroom town houses.
n The site occupies 27 hectares, including 10 hectares of park and
public open space.
n 35 small independent shops, cafes, bars and restaurants, a
supermarket and a gym.
n A new school for 1,800 students aged from 3 to 18.
n Close to bus routes, a new local station and Stratford
International Station.
Figure 25 East Village
859922_AQA_GCSE_Geog_Ch_16_020-022.indd 21 01/12/15 8:52 am
Features in the book:
Going further extension activities go beyond the core content to boost higher-ability students’ knowledge and understanding

Question practice
22
1. a) Study Figure 8 on page 12. Which two of the following statements are true?
A. London’s population has grown continuously since 1801.
B. London’s population declined from 1939 to 1991.
C. London’s population was five times bigger in 2015 than it was in 1801.
D. London’s population in 2015 was 8.6 million.
E. London reached its highest population in 1939 and has been declining
ever since.
b) Explain how the following factors have led to population growth in London.
i) Natural increase
ii) Net migration
c) Study Figure 11 on page 13. Brick Lane Mosque was once a French
Protestant church, then a Jewish synagogue, before becoming a mosque.
i) Explain how the building provides evidence of London’s ethnic diversity.
ii) Suggest two other examples of geographical evidence of ethnic diversity.
d) Describe how the character of one area in London has changed as a result
of either internal or international migration.
2. a) Study Figure 20 on page 18.
Give one piece of evidence from the map that the area was in need of
regeneration.
Give one piece of evidence from the map that the area already had
important functions
b) Study the data in Figure A below. Explain how it shows that Newham (where
the Queen Elizabeth Olympic Park is located) was in need of regeneration).
Measure of deprivation Kensington &
Chelsea
Newham
Male life expectancy
Female life expectancy
Unemployment
Pupils achieving five + good GCSE grades
Households with joint income under £15,000
Households with joint income above £60,000
83.7 years
87.8 years
3.9%
80%
9%
26%
75.7 years
79.8 years
9.4%
62%
26%
7%
Figure A Inequality between Kensington & Chelsea and Newham
c) Study Figure 24 on page 21.
Name two features of Queen Elizabeth Olympic Park that could help
to regenerate east London. For each one, suggest how it would help to
regenerate the area.
d) Evaluate Queen Elizabeth Olympic Park as a regeneration project.
To what extent will it help to improve:
i) social conditions?
ii) economic conditions?
iii) environmental conditions?
[2 marks]
[2 marks]
[2 marks]
[6 marks]
[2 marks]
[3 marks]
[3 marks]
[4 marks]
[3 marks]
[3 marks]
[1 mark]
[1 mark]
Look back at 16.4, pages
14–15, to help you answer
this question.
To evaluate, try to include in your answer
how the regeneration project has worked
to improve conditions, how it has not worked, and then write your final decision.
859922_AQA_GCSE_Geog_Ch_16_020-022.indd 22 01/12/15 8:52 am
Topic-specifi c Question Practice builds students’ skills responding to a range of question types
Practical advice from skilled teachers with examining experience prepares students for assessment
The Publishers would like to thank the following for permission to reproduce copyright material.
Photo credits:
p.6 bl Photo by Josh Smith. © 2015 Stars and Stripes. Used with permission, br © Matt Clark (2014); p.8 © Dan T alson – Fotolia; p.9 © A.P.S. (UK) / Alamy; p.10 © Alan Sorrell, Museum of London; p.13 © MS Bretherton / Alamy; p.14 t © Chris Ratcliffe/Bloomberg via Getty Images, b © Dan Kitwood/Getty Images; p.15 tl Artwork ©DALeast, photo © Dosfotos/PYMCA/REX Shutterstock, c © Andy Drysdale/REX Shutterstock, b © arsdigital – Fotolia; p.18 l © Anthony Shaw – Fotolia, r © John Widdowson; pp.19–21 all © John Widdowson.
Acknowledgements:
p.9 Figure 3 from Centre for Cities, Cities Outlook 2015; p. 16 Figure 16 ‘Lives on the Line’ © James Cheshire.
Every effort has been made to trace all copyright holders, but if any have been inadvertently overlooked, the Publishers will be pleased to make the necessary arrangements at the first opportunity.
Hachette UK’s policy is to use papers that are natural, renewable and recyclable products and made from wood grown in sustainable forests. The logging and manufacturing processes are expected to conform to the environmental regulations of the country of origin.
Orders: please contact Bookpoint Ltd, 130 Milton Park, Abingdon, Oxon OX14 4SB. Telephone: (44) 01235 827720. Fax: (44) 01235 400454. Email [email protected] Lines are open from 9 a.m. to 5 p.m., Monday to Saturday, with a 24-hour message answering service. You can also order through our website: www.hoddereducation.co.uk
ISBN: 978 1 4718 5992 2
© John Widdowson, Rebecca Blackshaw, Meryl King, Simon Oakes, Sarah Wheeler, Michael Witherick 2015
First published in 2015 by Hodder Education, An Hachette UK CompanyCarmelite House, 50 Victoria Embankment, London EC4Y 0DZ
All rights reserved. Apart from any use permitted under UK copyright law, no part of this publication may be reproduced or transmitted in any form or by any means, electronic or mechanical, including photocopying and recording, or held within any information storage and retrieval system, without permission in writing from the publisher or under licence from the Copyright Licensing Agency Limited. Further details of such licences (for reprographic reproduction) may be obtained from the Copyright Licensing Agency Limited, Saffron House, 6–10 Kirby Street, London EC1N 8TS.
Cover photo: © Frederic Bos - Fotolia.com
Illustrations by Aptara, Inc and Barking Dog Art

Dynamic Learning
AQA GCSE Geography Dynamic Learning is an online subscription solution that supports teachers and students with high quality content and unique tools. Dynamic Learning incorporates Teaching and Learning Resources, Revision and Question Practice and Whiteboard and Student eTextbook elements that all work together to give you the ultimate classroom and homework resource.
Sign up for a free, no obligation trial at www.hoddereducation.co.uk/dynamiclearning
� is sample material is taken from AQA GCSE Geography which has been selected for AQA’s offi cial approval process.
Stretch and challenge your students to achieve their full potential with learning materials that guide them through the new content and assessment requirements; developed by subject experts with examining experience and one of the leading Geography publishers.
� Enables students to learn and practise geographical, mathematical and statistical skills through engaging activities specifi cally designed for the strengthened 2016 curriculum
� Helps higher ability students boost their knowledge and understanding via suitably challenging extension tasks that go beyond the core content
� Develops students’ skills responding to a range of questions with topic-specifi c Question Practice in each section, supplemented by practical insight from skilled teachers with examining experience
� Incorporates possible fi eldwork enquiries throughout with unrivalled advice on the changed fi eldwork assessment from authors specialising in this key area
� Reduces your research time by providing a bank of contemporary case studies that includes numerous UK examples for the revised criteria
GEOGRAPHYAQAGCSE
For the 2016 specifi cation
Authors:
John Widdowson is the author of several successful Geography textbooks and an experienced teacher. He currently runs geography fi eldwork programmes in East London.
Simon Oakes is an experienced author and teacher with examining experience.
Rebecca Blackshaw, Meryl King, Sarah Wheeler and Michael Witherick are all experienced teachers with examining experience.
Textbook subject to change based on Ofqual feedback.
To request Inspection Copies or eInspection Copies and pre-order your class sets visit
www.hoddereducation.co.uk/Geography/GCSE/AQA
ALSO AVAILABLE
ISBN: 9781471859922