GBOF Summative Evaluation final - nc4il.org · with! opportunities! to! investigate! their! own!...
40
Great Balls of Fire: Comets, Asteroids, Meteors Summative Evaluation June 2012 Prepared for: Space Science Institute Prepared by: Sasha Palmquist Tammy Messick Cherry Kara Hershorin
-
Upload
truongcong -
Category
Documents
-
view
214 -
download
0
Transcript of GBOF Summative Evaluation final - nc4il.org · with! opportunities! to! investigate! their! own!...

Great Balls of Fire: Comets, Asteroids, Meteors Summative Evaluation
June 2012
Prepared for: Space Science Institute Prepared by:
Sasha Palmquist Tammy Messick Cherry Kara Hershorin

Copyright Institute for Learning Innovation 2012.
About the Institute for Learning Innovation:
Established in 1986 as an independent non-‐governmental not-‐for-‐profit learning research and development organization, the Institute for Learning Innovation is dedicated to changing the world of education and learning by understanding, facilitating, advocating and communicating about free-‐choice learning across the life span. The Institute provides leadership in this area by collaborating with a variety of free-‐choice learning institutions such as museums, other cultural institutions, public television stations, libraries, community-‐based organizations such as scouts and the YWCA, scientific societies and humanities councils, as well as schools and universities. These collaborations strive to advance understanding, facilitate and improve the learning potential of these organizations by incorporating free-‐choice learning principles in their work.

Space Science Institute Great Balls of Fire Summative Evaluation 1
Executive Summary
The Asteroids! project (NSF DRL: 0813528) is a multi-‐faceted informal education initiative that supports public engagement and understanding of the dynamic structure of the solar system through investigations of asteroids, comets, and meteors and their relationship to Earth. The exhibition was created by the National Center for Interactive Learning at the Space Science Institute under the direction of PI Paul Dusenbery. The project was highly collaborative and incorporated contributions from project partners that included: The Astronomical Society of the Pacific, Sunset Middle School, CO; New Mexico Museum of Natural History and Science, NM; and Catawba Science Center, NC as well as the exhibition planning and design firm Jeff Kennedy Associates, Inc. The Institute for Learning Innovation provided research and evaluation throughout this multi-‐year project.
The centerpiece of this project was the development of the traveling exhibition Great Balls of Fire: Comets, Asteroids, and Meteors (GBoF). The 3,000 sq.ft. exhibition began its national tour in May, 2011. The grand opening was held at the Science Museum of Virginia (SMV), in Richmond, VA. The exhibition was hosted by SMV through early January, 2012. The summative evaluation of GBoF was designed to explore the degree to which the exhibition achieved the following visitor outcomes:
• Increase excitement and interest in asteroids, comets, and meteors
• Increase awareness and understanding of asteroids, comets and meteors, their movements within the solar system, past impacts, and future risks to Earth
• Increase positive attitudes about science and scientists
Summative evaluation data was collected at the Science Museum of Virginia in Richmond, Virginia between August 13 and September 2, 2011. Two approaches were used to measure the visitor experience and outcomes associated with GBoF: Timing and tracking observations and exit interviews.
Conclusions
Summative evaluation of GBoF indicated that the exhibition successfully delivered on its primary design goals. Specific conclusions are described below, organized by visitor outcomes.
Excitement and interest in asteroids, comets, and meteors
• Visitors spent a relatively long period of time in the exhibition. During that time, they engaged with a smaller proportion of exhibit elements than might have been expected based on the size and composition of the exhibition. However, the level of visitor engagement at these components suggested that visitors were interested and invested in deeply exploring the experiences and learning activities.
• Information sharing is one indication of the topics that visitors find interesting. The majority of visitors shared information with members of their visitor group at some point during their exhibition experience (e.g. calling someone over, reading signage together, having conversations

2 June 2012
about the exhibit, and explaining the exhibits). These behaviors suggested that the exhibition supported situational interest among visitors that motivated social interaction.
• Repeat visitation of exhibit elements is another indicator of visitor interest in the topics and experiences provided in the exhibition. The design of interactive components provided visitors with opportunities to investigate their own questions through manipulating variables and observing outcomes. The fact that visitors chose to return to exhibit components both individually and to share the experience with others suggests that exhibits offered support for individual and situational interest.
• Data collected through observations and interviews indicated that visitors found GBoF to be a positive experience. Children and teens especially seemed interested and excited about exhibit elements suggesting that the exhibition design succeeded in serving the target audience. In addition, the majority of respondents to the exit interview provided positive reviews of their exhibition experience.
Awareness and understanding of asteroids, comets and meteors
• Visitors to the exhibition were able to describe characteristics of asteroids, comets, and meteors as well as the potential risks and implications of Earth impacts. Following their experiences in the exhibition, visitors commented on asteroid and comet composition, temperature, size, shape, movement, and location in the solar system. Respondents also indicated an increased awareness of the relationships between Earth and asteroids, comets, and meteors, citing meteor showers and the abundance of asteroids recently discovered by scientists.
• Although visitors frequently commented on the threat, risks, frequency, and effects of impacts on Earth, overall they were not particularly concerned about asteroid, comet, and meteor impacts. This suggested that the exhibition succeeded in balancing messages about the implications associated with different types of Earth impacts and the probability that an extinction-‐causing impact will occur.
Positive attitudes about science and scientists
• Experiences in the exhibition seemed to increase awareness of the range of tools, methods, and strategies that scientists use to study space objects. Visitors often mentioned very specific tools or scientific explorations used to learn about asteroids, comets, or meteors in exit interviews.
• Many visitors enjoyed the interactive exhibits that simulated scientific processes used to study asteroids and comets. Despite the popularity of exhibits like Blink and the Light Curve analysis it was unclear whether the majority of visitors made the connection between those activities and authentic scientific methods.
• Based on experiences in the exhibition, some visitors were reassured to learn that scientists are actively engaged in protecting Earth from a major asteroid or comet impact. This provided some indication that visitors recognize and appreciate the role scientists have in contributing to the safety of the planet.

Space Science Institute Great Balls of Fire Summative Evaluation 3
Table of Contents
Executive Summary ........................................................................................................................ 1
Introduction .................................................................................................................................... 4
Methods ......................................................................................................................................... 4
Observations & Tracking and Timing ....................................................................................................... 5
Exit Interviews ......................................................................................................................................... 6
Results ............................................................................................................................................ 6
Exhibition Observations ........................................................................................................................... 6
Overall Behavior at Great Balls of Fire ................................................................................................. 9
Overall Stops at Exhibit Elements ...................................................................................................... 11
15 Most-‐Visited Exhibit Elements ...................................................................................................... 12
Exhibition Exit Interviews ...................................................................................................................... 16
Recognition of the Main Idea of the Exhibition ................................................................................. 16
What Visitors Enjoyed about the Exhibition ...................................................................................... 17
What Visitors Learned ....................................................................................................................... 17
What Visitors Learned about how Scientists Study Space Objects .................................................... 19
Visitor Perception of Risk of an Impact ............................................................................................. 20
What Visitors found Difficult or Confusing ........................................................................................ 20
Suggestions for Improvement ........................................................................................................... 21
Conclusions ................................................................................................................................... 21
References .................................................................................................................................... 23

4 June 2012
Introduction
The Asteroids! project (NSF DRL: 0813528) is a multi-‐faceted informal education initiative that supports public engagement and understanding of the dynamic structure of the solar system through investigations of asteroids, comets, and meteors and their relationship to Earth. The exhibition was created by the National Center for Interactive Learning at the Space Science Institute under the direction of PI Paul Dusenbery. The project was highly collaborative and incorporated contributions from the following project partners: The Astronomical Society of the Pacific, Sunset Middle School, CO; New Mexico Museum of Natural History and Science, NM; and Catawba Science Center, NC as well as the exhibition planning and design firm Jeff Kennedy Associates, Inc. The Institute for Learning Innovation provided research and evaluation throughout this multi-‐year project.
The centerpiece of this project was the development of the traveling exhibition Great Balls of Fire: Comets, Asteroids, and Meteors (GBoF). The 3,000 square foot exhibition began its national tour in May, 2011. The grand opening was held at the Science Museum of Virginia (SMV), in Richmond, VA. The exhibition was hosted by SMV through early January, 2012. GBoF featured an engaging collection of interactive exhibit components, text, and graphics (See Appendix 1 for a full description of components included in the traveling exhibition). During the exhibition design phase, Student Asteroid Teams (SATs) supported the development of exhibition topics and experiences. Three SAT teams of middle-‐school aged teens from Sunset Middle School, CO; New Mexico Museum of Natural History and Science, NM; and Catawba Science Center, NC created a project deliverable focused on space science that allowed them to work through an authentic design, development, and fabrication process. In addition, SATs provided expert insight on how youth in the exhibitions’ target age group would respond to planned exhibit elements and assisted with formative evaluation for three components included in the final exhibition: Rubble Pile Simulation, Water Impact Test, and Light Curves Interactive.
The summative evaluation of GBoF was designed to explore the degree to which the exhibition supported the following visitor outcomes:
• Increase excitement and interest in asteroids, comets, and meteors
• Increase understanding of asteroids, comets and meteors and their movements within the solar system, past impacts, and future risks to Earth
• Increase positive attitudes about science and scientists
Methods
The Summative evaluation was conducted at the Science Museum of Virginia in Richmond Virginia between August 13th and September 2, 2011. Data were collected both weekdays and weekends by ILI researchers: Sasha Palmquist, Tammy Messick Cherry, and Kara Hershorin. The target audience for the exhibition was middle school youth. The data collection was designed to include as many participants in this audience as possible. Two approaches were used to measure the visitor experience and outcomes

Space Science Institute Great Balls of Fire Summative Evaluation 5
associated with GBoF: Timing and tracking observations and exit interviews. Independent Review Consulting (IRC) provided IRB review of these studies1.
Observations & Tracking and Timing
Researchers identified 34 distinct exhibit elements designed to communicate a specific message, or engage visitors in a specific activity. Researchers divided these exhibit elements into three types: interactive component defined as an exhibit element that visitors could touch, or manipulate in some way; text panel defined as a label with words and graphics; and murals defined as large photorealistic scenes displayed throughout the exhibition. In all, the exhibition consisted of 20 interactive components, 9 text panels2, and 5 murals.
Observation data was recorded on an aerial map of the exhibition and included levels of engagement with specific exhibit elements; presence of behaviors such as positive responses, sharing information, and taking photographs; overall time spent; number of exhibits stopped at; and demographic information. Preliminary observations revealed that repeat visitation to exhibit elements was a common behavior in this exhibition. As such, researchers noted any repeat visitations to exhibit elements.
Although the majority of those who visited the exhibition were in groups, researchers chose one person from each group to track as the target for the observation, and made notes of interactions with group members as well as group composition. Researchers alternated between observing the first adult and the first child that entered the exhibition, targeting children within the 8-‐18 age range whenever possible. In order to maximize data collection efficiency, once an observation was completed, researchers reviewed and verified their notes, returned to the exhibition entrance, and initiated observing the next available visitor or group of visitors. Stops were defined by either having both feet planted on the ground or looking at or engaging with a component for 5 seconds or more (Serrell, 1998). Repeat visits did not count as additional stops. Thus, the number of stops for a visitor is the same as the number of elements where visitors’ stopped.
The framework for observation was based on the Visitor Engagement Framework created by Barriault and Pearson (2010). This framework was designed to measure and interpret observable behaviors that are indicative of learning in exhibitions. The framework is made up of seven learning behaviors and grouped into three main categories: initiation, transition, and breakthrough behaviors. In Barriault and Pearson’s framework, visitors progress through the behaviors, with breakthrough as the highest possible achieved behavior on a continuum. ILI researchers adapted the framework to capture the visitor experiences within the GBoF exhibition. The design of the exhibition lent itself to a range of engagement types that were not necessarily linear. For example, researchers observed frequent shifts into and out of levels of engagement, and repeat visitation to specific elements. As a result, rather than measuring how visitors progressed through multiple levels of engagement at each exhibit element, researchers noted the highest level of engagement visitors achieved during each stop.. This allowed engagement levels to be mutually exclusive categories. See Appendix 2 for the modified Visitor Engagement Framework used for this evaluation.
1 IRC has merged with E&I review http://www.eandireview.com
2GBoF only includes 8 text panels. The Science Museum of Virginia added a text panels that is unique to their site that featured the Chesapeake Bay impact crater, evidence of local impact from over 35 million years ago.

6 June 2012
For the Visitor Engagement Framework, behaviors were defined based on types of activity observed:
1) Initiation behaviors include: spending time watching someone else engage with an activity; completing only part of the activity; completing activity without testing for outcomes.
2) Transition behaviors include: doing the activity a second time to attain a desired outcome, in order to better understand it, to master the functions, or to observe something different.
3) Breakthrough behaviors include: expressing curiosity; exploring a range of actions at the exhibit; repeating the activity three or more times; asking questions. In some cases, visitors can be so engaged in the activity that they are reluctant to transition to a new experience. When this occurred, researchers noted this as a level 2-‐breakthrough behavior.
Researchers also tracked whether the target visitor shared information or exhibited a positive response at each of the exhibit elements. Sharing information included calling someone over, reading signage together, having conversations about the exhibit, sharing experience and information with others by explanation, or recounting selected information from the exhibit. Examples of positive responses included laughter, verbal references to enjoyment, and obvious signs of eager disposition.
Observational data were analyzed using descriptive as well as inferential statistics. Any finding that exists at a critical p-‐value ≤ 0.05 is “significant.” The following report discusses findings of practical significance to the National Center for Interactive Learning at the Space Science Institute. Several statistical tests of hypotheses were conducted and researchers determined the most appropriate statistical test for the data. In some cases, standard statistical tests that were developed for quantitative (continuous) data with normal distributions (e.g., t-‐tests, analysis of variance), if applied to these data, may lead to invalid results. Consequently, researchers analyzed data using nonparametric statistical methods when appropriate. All statistical analyses were conducted using SPSS Statistics version 19.
Exit Interviews
Researchers approached the first adult or teen to exit the exhibition and asked that person to participate in the exit interview. If other members of the group also responded during the interview, their responses were recorded with a note indicating that their response was not from the target individual. Primary analysis of the interviews was conducted based on target responses.
Interviews consisted of 8 open-‐ended questions and 5 closed-‐ended questions, and focused on visitor learning, visitor enjoyment in the exhibit as well as previous experience visiting science centers. Analysis of the data consisted of coding open-‐ended questions to identify patterns of responses and generating descriptive statistics such as frequencies and medians.
Results
Exhibition Observations
A total of 81 un-‐cued visitors were tracked at Great Balls of Fire. Observations were conducted during the week and on weekend days, with 62% (n=50) of the observations conducted on a weekend day. As summarized in Table 1, about half of the sample was male and half was female. Half of participants (51%) were over 18 years of age, a third (33%) were teenagers between the ages of 11 and 17 years, and 16% were children. Age was estimated based on observations and not asked of visitors. Visitor groups

Space Science Institute Great Balls of Fire Summative Evaluation 7
primarily contained children and on average included 3 people. Researchers observed a wide range of visitor groups; from individuals visiting alone up to intergenerational groups of 8 visitors. A more detailed description of the sample can be found in Appendix 5. Table 1: Observation Sample Description (n=81)
n Percent Gender Male 42 52% Female 39 48% Age Children (5-‐10 years) 13 16% Teens (11-‐17 years) 27 33% Adults (18+ years) 41 51% Group Type Adult Only Groups 11 14% Groups with Children/Teens 70 87% Number of People in Group 1 person 2 3% 2 people 21 27% 3 people 20 26% 4 people 19 24% 5 or more people 16 20% When installed at the Science Museum of Virginia, GBoF was split into two distinct sections (see the map of the exhibition floor plan Appendix 3). This was a fairly unique arrangement and led to a clear separation of exhibition elements—those focused on asteroids were in one section and those focused on comets and meteors were in another. During observation, researchers took note of the overall visitor flow within the exhibit. Generally, there were many available exhibit elements that visitors could choose to stop at and explore. At a few points during the data collection, the exhibit became crowded which meant that visitors would have to wait in line, or had fewer options to choose from when selecting the next exhibit element to approach. Less than 10% of visits occurred when the gallery was full to this capacity. Time spent at the exhibit ranged from 2 minutes 25 seconds to just over an hour, with a median time of 14 minutes and 33 seconds (Table 2). Visitors spent significantly more time in the second half of the exhibit than in the first half (t=-‐4.755, n=81, p=0.000).
Table 2: Stay Time (n=81)
Stay Time Median St. Dev. Min Max
Overall Exhibit 14 min 33 sec sec
11 min 59 sec 2 min 25 sec 61 min 9 sec
First half 4 min 41 sec 6 min 28 sec 10 sec 43 min 10 sec
Second half 9 min 45 sec 8 min 17 sec 0 sec 39 min 9 sec
Analysis revealed that 33% (n=27) stayed in the exhibition for 20 minutes or longer while a slightly larger proportion 38% (n=31) remained in the exhibition between 11-‐20 minutes. Another 20% (n=16) of visitors explored the exhibition for 5-‐10 minutes and only 9% (n=7) spent less than 5 minutes. Stay time

8 June 2012
was not affected by factors like: gender, age group (adults and teens/children)3, group type, day of the week, exhibit status, or the presence of broken exhibit elements.
The number of exhibits visited at GBoF ranged from 1 to 21 exhibits with a median of 8 stops. The total number of exhibits stopped at has a strong positive correlation with time spent within the exhibition. The number of elements that visitors stopped at increased as they spent additional time in the exhibition. This is an expected linear relationship confirmed by Spearman’s test (Spearman’s correlation=.729, n=81, p=.000).
In many existing evaluations of how an exhibition is used, two metrics are reported: the Sweep Rate Index (SRI) and Diligent Visitor Index (%DV). The sweep rate index is calculated by dividing the exhibition’s square footage by the average total time spent. Lower sweep rates indicate that visitors spent more time in an exhibition. The Diligent Visitor Index (%DV) measures the percentage of visitors who stop at more than half of the exhibit elements. Higher percentages of diligent visitors mean that more people were paying attention to more components, and fewer exhibit elements were being ignored, skipped, or missed. Based on data from previous exhibitions, the average SRI is 432 and the average %DV is 26 (Serrell, 1998). As shown in Table 3, Great Balls of Fire had a sweep rate index of 171, much lower than the typical museum exhibition. This indicated that visitors to GBoF spent a longer duration of time per square foot of exhibition floor space. The Diligent Visitor Index was calculated based on visits to the 20 interactive components, which did not include the text panels or the murals. The GBoF exhibition’s %DV of 31 indicates that few visitors stopped at more than 50% of interactive components. These statistics indicate that visitors spent a relatively long period of time in the exhibition but were only engaged with a small proportion of the exhibit components. The high quality of engagement and the opportunities for learning that were observed when visitors did stop at exhibits will be discussed in subsequent sections. Table 3: Summary of measures of visitor use of GBoF
Mean time spent 17 min 28 sec Sweep Rate Index 171 % Diligent Visitors 31 Square Feet 3,000 # Components 20
To further contextualize these results, researchers reviewed evaluations of other exhibitions in science museums that feature a high percentage of interactive elements and also reported SRI and % DV. At Expedition Health, a permanent exhibition in the Denver Museum of Nature and Science, the SRI computed for visitors was 222 with a %DV of 46 (McNamara, 2010). Expedition Health is larger in scale (10,000 square feet) than GBoF. However it is interesting to note that visitors spend proportionally more time engaged with experiences in GBoF despite the fact that visitors to Exhibition and Health experience proportionally more of the exhibit components. One potential factor influencing the %DV in Expedition and Health is the presence of a card reader system that may provide added motivation to stop at the 3 Because so few children were observed (relative to the size of the teen and adult sample), the data from the children and teen are combined for analysis.

Space Science Institute Great Balls of Fire Summative Evaluation 9
elements activated by a card. In the Black Holes Experiment Gallery, a traveling exhibition that explored the nature of black holes, gravity, and scientific research, visitors spent an average of 25 minutes, for an SRI of 100 and calculated %DV of 40 (Londhe, Manning, Houseman & Goodman, 2010). Similar to Expedition Health, Black Holes also utilized a card reader system that may have encouraged visitors to be more thorough users of the exhibition space. These comparisons suggest that visitors to GBoF typically explored a smaller proportion of exhibition elements more deeply as opposed to visiting the majority of exhibits a more surface level.
Out of the 34 total exhibits, researchers identified 20 components with interactive elements, and analyzed the patterns of use among these elements. The number of exhibits visited ranged from 0 to 16, with a median of 7 stops. The GBoF exhibition comprised many computer-‐based interactives, which were at times unstable. Researchers observed several of these components that they needed to be re-‐started or closed for a period of time until a technician could fix the problem. Analysis indicated that 36% of the visitors experienced the exhibit when it was fully functional, 25% with one element not working and 39% with 2-‐3 elements not functioning. The exhibit elements that were non-‐functional most often were the Barringer Crater Computer (39%) and What If It Hit My Town? exhibit element (30%).
Table 4: Frequency and percentage of visitors who experienced non-‐functioning Exhibit Elements
n Percent Barringer Crater Computer 31 39% What If It Hit My Town? 24 30% Amateur Astronomer Cards 9 11% Comet and Asteroid Hunter 7 9% Water Impact Test 5 6% Light Curves Interactive 4 5% Rubble Pile Simulation 4 5%
Overall Behavior at Great Balls of Fire
In order to describe the visitor experience in Great Balls of Fire, researchers examined the following behaviors: engagement level, sharing information, and positive response. Compiling the overall engagement level included finding the mean engagement level for each individual observed. The average engagement for all visitors in the exhibition was 1.55 with a standard deviation of 0.413. Table 5 shows that the majority of visitors’ achieved transition behaviors during their experience in GBoF.
Table 5: Overall Level of Engagement (n=81)
n Percent
Initiation (1≤mean≤ 1.25) 23 28% Transition (1.26≤mean≤ 2.25) 54 67% Breakthrough (mean≥2.26) 4 5%

10 June 2012
Researchers observed that younger visitors (children and teens combined) were more engaged with GBoF than were older visitors (Mann-‐Whitney U=624, n=81, p=0.016).4 This was encouraging because it suggested that the presentation and design of the exhibition succeeded in reaching the target audience. Analysis also revealed that males obtained slightly higher overall levels of engagement with GBoF than females (t(79)=2.175, n=81, p=0.03). Several of the exhibit components were designed to encourage multiple iterations of the interactive experience. Researchers observed that visitors often repeated activities in order to manipulate different variables and in some cases moved onto other areas of the exhibition and later returned to activities to explore them more deeply. This repetitive behavior was especially present at the following exhibit elements: What Are the Odds? Quiz, Rubble Pile Simulation, Projectile Tests Video, and the Water Impact Test. Several visitors played the quiz show multiple times. One boy (11-‐13 years) played What Are the Odds? Quiz as both player 1 and player 2, allowing him to guess two different answers. He played the game in its entirety twice and even returned to the activity later during his museum visit. At the Rubble Pile Simulation, visitors who completed multiple iterations used these opportunities to test different methods or strategies (bombs, pushers, or impactors) in order to deflect an asteroid.
Researchers also measured the frequency that visitors shared information during their visit to the exhibition. Analysis indicated that 79% (n=64) of visitors shared information with members of their group at some point during their exhibition experience while 21% (n=17) explored the exhibit components without socializing with others. Both adults and children explained how to use exhibits, called attention to particular elements to notice, and talked about concepts featured in the exhibition. For example, at the Projectile Tests Video, two boys watched several of the videos and then talked about the explosions in great detail, identifying causes and effects and replaying segments. Analysis also revealed a correlation between stay time and the probability that visitors share information (Spearman’s correlation= 0.272, n=81, p=0.014). This suggested that increased stay times in the exhibition were associated with visitors who were observed talking while engaged with GBoF experiences.
Throughout the exhibition, data collectors noted the presence of positive responses: “This is really cool!” “Way cool!” “This is awesome.” “I love this one. It’s so cool.” Table 7 represents the frequency that visitors expressed a positive response. Over half of the visitors observed (54%) displayed a positive reaction. After successfully completing the Rubble Pile Simulation activity, one young visitor threw his arms up into the air and exclaimed, “I did it,” another yelled “Yay! I saved the planet.” Other positive responses included physical gestures such as a high five or thumbs up. In addition, some participants had visited GBoF before and expressed excitement when entering the gallery again. While 46% (n=37) did not display an overtly positive response while exploring the exhibition, this should not be interpreted as lack of interest or enjoyment. Analysis revealed that there was a relationship between age group and positive responses to experiences in the exhibition. Children and teenagers are more likely to display a positive response in GBoF than adults (χ2(2)= 8.385, n=81, p=0.015).5 In addition, there was a correlation between the amount of time spent in the exhibition and observed positive responses. This suggested that visitors who stayed longer in the exhibition were more likely to be observed expressing a positive response (Spearman’s correlation= 0.606, n=81, p=0.000).
4 To assess whether the means of two independent groups were statistically different from each other, the t-‐test analysis or the Mann-‐Whitney (U) test was performed. 5 Cross-‐tabulation tables were computed and the chi-‐square statistic (χ2) was used to test the significance of the relationship between two categorical variables. For two by two tables, Fisher’s Exact Test was also applied.

Space Science Institute Great Balls of Fire Summative Evaluation 11
Researchers took additional notes about behaviors throughout the exhibit in conjunction with the Visitor Engagement Framework rubric. These notes provided insight into the patterns of overall visitor behaviors measured throughout the exhibition. For example, many visitors expressed interest in the facts presented in the exhibition. During the What Are the Odds? Quiz a group was pleased to learn that the odds of a major impact were very low. “Phew, that’s good to know [smiles].” After seeing a dynamic illustration of asteroid discoveries in the last 30 years, one visitor was obviously amazed and impressed with the number “over a half million asteroids!”. Another visitor commented on the amount of space debris that falls to earth, “hmm, it’s little stuff, but that’s a lot.” Other visitors responded strongly to demonstration experiences in the exhibition like making the ball drop multiple times at the Water Impact Test and manipulating the speed of the Projectile Tests Video. At Is It a Rock or a Meteorite a young visitor made the connection that when the magnet “sticks” it is a meteorite and was eager to share this new knowledge with others in the group. These anecdotes highlighted the range of exhibition experiences that seemed to resonate with visitors.
In some cases, an experience at one exhibit shaped the remaining conversations shared by a visit group. For example, at Science Fact or Science Fiction, visitors watched clips from movies and television shows and then tried to answer the question, “Did Hollywood get the science right, partially right, or wrong?” After some visitor groups had watched multiple clips they would continue to make connections to those storylines throughout the rest of their visit. This was observed as they discussed murals, explored impact demonstrations, and commented on models of asteroids and comets.
Throughout the GBoF exhibition, visitors also made personal connections. At What If It Hit My Town? many visitors utilized the zip code function to explore how an impact would affect their hometown. Comments like, “Whoa, our house is toast!” and “This would so kill us.” at this interactive sparked conversations about the potentially dangerous consequences of impact. Other families made personal connections to locations featured in the exhibition. For example, one family at the Barringer Crater Computer recalled a family vacation to the southwest and a visit to Barringer Crater and how incredibly large it was in person.
Researchers also witnessed multiple examples of teamwork. Visitors showed or explained how to use exhibits, explained information to others in their group, and worked together as a group to complete interactive tasks. There was also evidence of visual referencing from the models to information provided in the text panels, labels or videos.
Overall Stops at Exhibit Elements
Researchers calculated the percentage of visitors who stopped at each of the 34 exhibit elements. Four exhibit elements prompted stops by more than 50% of visitors: Water Impact Test, Comet and Asteroid Hunter, What If It Hit My Town?, and Light Curves Interactive. As anticipated, interactive components were most often visited. Murals and introduction panels supported the fewest stops. In general, the exhibit elements with the most visitor stops were those that supported engagement through game play, encouraged observation of phenomena, and allowed visitors to manipulate variables and observe patterns of outcomes.

12 June 2012
Table 6: Stops at GBoF Exhibit Elements
Exhibit Element n Percent # Stops Repeat visits
Water Impact Test 52 64% 69 17 Comet and Asteroid Hunter 46 57% 59 13 What If It Hit My Town? 45 56% 54 9 Light Curves Interactive 40 50% 45 5 Projectile Tests Video 38 47% 48 10 Is it a Rock or a Meteorite? 38 47% 45 7 Itokawa Asteroid Video 38 47% 44 6 What Are the Odds? Quiz 35 43% 41 6 Blink Comparator Computer 34 42% 45 11 Itokawa Asteroid Model 34 42% 36 2 Barringer Crater Computer 33 41% 37 4 “Messengers from Space” Display 33 41% 38 5 Rubble Pile Simulation 32 40% 45 13 Light Curves Computer 25 31% 28 3 Science Fact or Science Fiction Computer 24 30% 26 2 Sizing Up Shooting Stars Display 19 24% 21 2 Temple 1 Comet Model 17 21% 17 0 Temple 1 Comet Video 17 21% 18 1 Barringer Crater Model 17 21% 17 0 Haley's Comet Display 14 17% 17 3 Local Impact 12 15% 13 1 Mural: Dinosaur Extinction Impact 11 14% 12 1 Video-‐-‐Shoemaker Levy/Jupiter 10 12% 11 1 Amateur Astronomer Cards 10 12% 11 1 Mural: Deep Impact Mission to Temple 1 9 11% 9 0 Mural: DAWN Mission to Ceres and Vesta 8 10% 8 0 Entry Sign 6 7% 6 0 Mural: WISE Telescope Finding Dark Asteroids 6 7% 6 0 Mural: Hyabusa Mission to Itokawa 2 3% 2 0 Asteroids Intro Panel 2 3% 2 0 Comparing Craters 1 1% 1 0 Impacts Intro Panel 1 1% 1 0 Origins Intro Panel 0 0% 0 0 Comets Intro Panel 0 0% 0 0
15 Most-‐Visited Exhibit Elements
When analyzing visitation to individual exhibit elements, researchers looked at the 15 most-‐visited elements, where more than 30% of visitors stopped. This set of exhibition components represent a consistent set of exhibition experiences that this sample of visitors shared. Visitors often went back and re-‐visited an exhibit element that they had previously been to before. Of the 15 most-‐visited elements, visitors returned most frequently to the Water Impact Test (n=17), Asteroid and Comet Hunter (n=13), and Rubble Pile Simulation (n=13).

Space Science Institute Great Balls of Fire Summative Evaluation 13
Out of the 15 most-‐visited exhibits, different age groups seemed to have preferences for different kinds of exhibit components. For adults, 68% visited the Itokawa Asteroid Model making it the most popular among this age group. In contrast, teens visited the Light Curves Computer the most (52%), and children visited the Rubble Pile Simulation the most (25%). Table 7 summarizes the percentages of visits by age group. Taking a closer look at these patterns, teenagers and children combined were significantly more likely than adults to stop at the following exhibit elements: Light Curves Computer (Fisher’s Exact Test, n=81, p=.008), What Are the Odds? Quiz (Fisher’s Exact Test, n=81, p=.045), and Rubble Pile Simulation (Fisher’s Exact Test, n=81, p=0.024). Teens alone more frequently visited What If It Hit my Town? than adults or children (χ2(2)= 6.02, n=81, p=0.049). Conversely, specific exhibit elements were more attractive for older visitors. Adults and teens stopped at Science Fact or Science Fiction Computer significantly more than children (χ2(2)= 5.997, n=81, p=0.05). And adults are also more likely to stop at the Itokawa Asteroid Model (Fisher’s Exact Test, n=81, p=.013). It is interesting to note that adults were most consistently drawn to a non-‐computer based exhibit element while teens and children were more interested in computer-‐based components that featured interactive games.
Table 7: Visitation to the 15 Most-‐Visited Exhibit Elements by Age Group
Element Name Total visitors
Adult Teen Child
n % n % n % Water Impact Test 52 26 50% 16 31% 10 19% Comet and Asteroid Hunter 46 21 48% 16 35% 9 20% What If It Hit My Town? 45 18 40% 20 44% 7 16% Light Curves Interactive 40 20 50% 15 38% 5 13% Itokawa Asteroid Video 38 20 53% 12 32% 6 16% Is it a Rock or a Meteorite? 38 19 50% 16 34% 6 16% Projectile Tests Video 38 20 53% 12 32% 6 16% What Are the Odds? Quiz 35 13 37% 14 40% 8 23% Blink Comparator Computer 34 17 50% 12 35% 5 15% Itokawa Asteroid Model 34 23 68% 5 15% 6 18% “Messengers from Space” Display 33 20 61% 7 21% 6 18% Barringer Crater Computer 33 20 61% 8 24% 5 15% Rubble Pile Simulation 32 11 34% 13 41% 8 25% Light Curves Computer 25 7 28% 13 52% 5 20% Science Fact or Science Fiction Computer
24 11 46% 12 50% 1 4%
Men and women also seemed to have different preferences for exhibition components. Researchers observed that male visitors stopped at the Comet and Asteroid Hunter the most (57%) and female visitors stopped at the Science Fact or Science Fiction Computer the most (58%). Table 8 summarizes patterns of exhibit engagement by gender.

14 June 2012
Table 8: Visitation for the 15 Most-‐Visited Exhibit Elements by Gender
Element Name Total visitors
Male Female
n % n % Water Impact Test 52 26 50% 26 50% Comet and Asteroid Hunter 46 26 57% 20 44% What If It Hit My Town? 45 25 56% 20 44% Light Curves Interactive 40 21 53% 19 48% Itokawa Asteroid Video 38 17 45% 21 55% Is it a Rock or a Meteorite? 38 17 45% 21 55% Projectile Tests Video 38 19 50% 19 50% What Are the Odds? Quiz 35 17 49% 18 51% Blink Comparator Computer 34 16 47% 18 53% Itokawa Asteroid Model 34 16 47% 18 53% “Messengers from Space” Display 33 17 52% 16 49% Barringer Crater Computer 33 16 49% 17 52% Rubble Pile Simulation 32 18 56% 14 44% Light Curves Computer 25 12 48% 13 52% Science Fact or Science Fiction Computer 24 10 42% 14 58%
In addition to analyzing visitation and stops at the most-‐visited exhibit elements, researchers also explored visitors’ behavior, including sharing information and positive response. Out of the 15 most-‐visited exhibit elements, visitors shared information the most at: What Are the Odds? Quiz (54%); Is it a Rock or a Meteorite? (50%); Water Impact Test (52%). Visitors showed the most positive responses at the Rubble Pile Simulation (56%), followed by What Are the Odds? Quiz (51%), and Comet and Asteroid Hunter (22%) (See Appendix 5 for a complete summary of visitor information sharing and positive responses).
In terms of engagement among the 15 most-‐visited exhibit elements, researchers observed and recorded the frequency of initiation, transition, and breakthrough behaviors. Researchers were particularly interested in whether patterns of these engagement levels might emerge across exhibit components. Analysis indicated that visitors most frequently engaged in initiation behaviors at the Itokawa Asteroid Model (88%), transition behaviors at the Light Curves Interactive and Rubble Pile Simulation (38%), and breakthrough behaviors at What Are the Odds? Quiz show (63%). Table 9 summarizes elements where visitors displayed the most breakthrough, transition, and initiation behaviors (See Appendix 5 for the distribution of engagement levels at the 15 most-‐visited elements).

Space Science Institute Great Balls of Fire Summative Evaluation 15
Table 9: Elements that supported the most Initiation, Transition, and Breakthrough Behaviors
Element Name Total visitors n %
Initiation Itokawa Asteroid Model 34 30 88% “Messengers from Space” Display 33 27 82% Barringer Crater Computer 33 25 76% Transition Light Curves Interactive 40 15 38% Rubble Pile Simulation 32 12 38% Is it a Rock or a Meteorite? 38 13 34% Projectile Tests Video 38 13 34% Breakthrough What Are the Odds? Quiz 35 22 63% Comet and Asteroid Hunter 46 12 26% Water Impact Test 52 13 19%
Occasionally visitors experienced “flow,” becoming fully immersed in an activity, having an energized focus, full involvement, and success in the process of the activity. These visitors were so engaged they completed the activity over and over without distraction. Researchers witnessed visitors so involved with an activity that they refused to leave even when prodded by other members of their visitor group. When this occurred, researchers noted this as Level 2 breakthrough behaviors. Visitors achieved “flow” at What Are the Odds? Quiz (17%) and the Projectile Tests Video (13%).
Using inferential statistics, researchers looked at how independent variables such as age and gender affected behaviors at the 15 most-‐visited exhibition elements. Findings by factor are described below.
Analysis indicated that there is a relationship between age and level of engagement at certain elements. There is a significant difference between engagement levels for the three distinct age groups (children, teenagers, and adults) at the Water Impact Test (Kruskall-‐Wallis χ2(2)= 8.218, n=52, p=0.016).6 Children and teens achieve significantly higher engagement levels than adults at this component (χ2(2)= 6.445, n=52, p=0.04). In addition, children achieve a higher level of engagement at Rubble Pile Simulation than adults (Mann-‐Whitney U=14, n=19, p=0.012). Analysis of the frequency of information sharing indicated the adults are significantly more likely to share information at the Blink Comparator Computer than children and teens (Fisher’s Exact Test, n=34, p=0.026). When comparing gender with visitation, engagement, or behaviors, one significant relationship emerged. Males exhibit a higher engagement level at the Rubble Pile Simulation than females do (Mann-‐Whitney U=60, n=32, p=0.011). It seemed that the video game interface held the attention male visitors more consistently than female visitors.
6 For three or more independent groups, the Kruskal-‐Wallis one-‐way analysis of variance by ranks was used.

16 June 2012
Exhibition Exit Interviews
A total of 73 visitor groups were invited to participate in an exit interview. Only 11 groups declined to be interviewed (15% refusal rate). The most frequent reason given was lack of time because they wanted to see other things in the museum such as an IMAX show. There were no consistent patterns for refusal in terms of gender, age, group type, or time of day.
The final sample included 62 complete exit interviews. Overall, adults were interviewed more often than teens, though the majority of groups were made up of at least one child or teen. Slightly more females were interviewed than males, and the most typical interview group size was two people.
Table 10: Exhibit Interview Sample Description (n=62)
n Percent Gender Male 27 44% Female 35 57% Age Teens (11-‐17 years) 13 21% Adults (18+ years) 49 80% Group Type Adult Only Groups 9 15% Groups with Children/Teens 52 86% Number of People in Group 1 person 3 5% 2 people 30 49% 3 people 7 11% 4 people 10 16% 5 or more people 12 20%
Recognition of the Main Idea of the Exhibition
Visitors were asked what they felt was the main idea of the exhibition. All of the answers were first coded by whether the response referred to asteroids, comets, or meteors. Most visitors mentioned asteroids (79%), approximately half mentioned comets (53%), and 18% mentioned meteors in their answers (Table 11). Visitor responses were then explored for whether any additional context was provided for how they interpreted the main idea of the exhibition. Approximately half of all visitor responses referenced asteroids, comets, or meteors with no additional context. Over a third of the responses referenced space (37%), with comments such as, “to educate people on space” and “it’s all about space….” A third of the responses (32%) were related to impacts—including impacts on Earth and mitigating the risk of impact with examples such as “Make you understand asteroids and interaction with the earth's surface” and “Asteroids, comets that sometimes hit earth make impacts.” Fifteen percent of responses were specifically focused on the characteristics of asteroids, comets, or meteors, such as “The difference between asteroids and comets” and “The weight of space rocks compared to regular earth rocks.”

Space Science Institute Great Balls of Fire Summative Evaluation 17
Table 11: Visitor Perceptions of the Main Idea of the Exhibition (n=62)
n Percent
General reference to asteroids, comets, or meteors
33 53%
Reference to space 23 37%
Reference to impacts 20 32% Characteristics of asteroids, comets, or meteors 9 15%
Other 6 10% *Multiple responses allowed. Percents may add up to more than 100.
What Visitors Enjoyed about the Exhibition
When asked what they enjoyed the most, 89% of the visitors mentioned a specific exhibit element, with the Comet and Asteroid Hunter mentioned most frequently (47%, n=26). The exhibit element What If It Hit My Town? was mentioned by 20% (n=11) of those who mentioned a specific exhibit element. Other exhibit elements that were mentioned less than 15% of the time include (in order): Rubble Pile Simulation, What Are the Odds? Quiz, Is it a Meteorite?, Science Fact or Science Fiction Computer, Water Impact Test, Barringer Crater, and Halley’s Comet Display.
Over half of the visitors (65%) mentioned that they enjoyed the interactivity of the exhibition the most, with visitors stating, “[There’s] a lot to do and it's interactive” and “The interactive games—the one I won—the Quiz Show and Comet Hunter, because you can actually interact with something and its fun!” Nearly a third enjoyed how the exhibition was educational or realistic, with reference to facts that they learned, or their experiences. One visitor said, “What if it hit my town—it shows what you could actually expect to happen to your neighborhood.” Ten percent of the visitors mentioned that they enjoyed the design aspects the most. One visitor referenced the murals and said, “The images—the big panels on the walls, they're beautiful.” Other responses included references to where the exhibition is located in the museum or explaining limited time spent in the exhibition. Overall, visitors tended to use adjectives like cool, neat, and fun to describe their experience in the exhibition.
Table 12: What Visitors Enjoyed the Most (n=62)
n Percent
Interactive 40 65%
Educational, realistic scenarios 17 27%
Design 6 10%
Other 5 8% *Multiple responses allowed. Percents may add up to more than 100.
What Visitors Learned
Visitors were asked a set of questions designed to measure what they learned after visiting the exhibition. Responses were coded into categories that reflected the topics that were most salient to visitors.

18 June 2012
What is one thing you never realized before?
Prior to being asked whether or not they learned something new, visitors were also asked to discuss one thing they “never realized before.” This question was asked in an open-‐ended format. As shown in Table 13, almost half of the respondents (48%) mentioned characteristics of asteroids, comets or meteors. Visitors referenced composition, temperature, size, movement, or location. Representative responses include:
That there are asteroids bigger than the empire state building Surface of comet could be dusty and powdery like snow Comets are ice and rock; Asteroids are rock and metal
Thirty-‐one percent of visitors commented on the threat, risks, frequency, and effects of impacts on earth. One respondent realized “that if a huge asteroid were to hit where we live, people would get sunburns all the way out to Ohio.” Respondents (15%) also indicated the presence of asteroids, comets, or meteors, citing meteor showers and their abundance in the sky. A few (12%) referenced the work of scientists and the study of space objects.
Table 13: Never Realized (n=61)
n Percent*
Characteristics 29 48%
Impacts 19 31% Presence 9 15% Scientists 7 12% Don’t know 8 13% Other 6 10% *Multiple responses allowed. Percents may add up to more than 100. Although the question did not ask visitors to recall a specific exhibit element, approximately 20% (n=12) of visiting groups described learning experiences connected to an exhibit element. Components mentioned included the Water Impact Test, Rubble Pile Simulation, Light Curves Interactive, Itokawa Asteroid Model, What If It Hit My Town?, Comet and Asteroid Hunter, Science Fact or Science Fiction Computer, and Blink Comparator Computer. While this is a relatively low percentage of visitor groups spontaneously describing a particular component, it is encouraging to note that the exhibits mentioned were typically those that were most frequently visited.
What was something you learned in the exhibit about asteroids, comets, or impacts?
Without a pre-‐visit measure of visitor knowledge about asteroids, comets, and meteors, our ability to assess visitor learning relied on self-‐report. When visitors were asked what they learned about asteroids, comets, or impacts, they most frequently mentioned impacts or the effect of impacts from asteroids, comets, or meteors (Table 14). Over half of the responses related to impacts (55%). Many responses (50%) also referenced characteristics of asteroids, comets, or meteors. This included comments related to size, shape or composition (e.g. “Asteroid is metal and comets are ice.”). A few responses discussed the role of scientists and presence of space objects in the sky.

Space Science Institute Great Balls of Fire Summative Evaluation 19
Table 14: What Visitors Learned about Asteroids, Comets, or Meteors (n=58)
n Percent
Impacts 32 55% Characteristics 29 50%
Scientists 6 10% Presence 3 5% Don’t know 5 9% Other 1 2% *Multiple responses allowed. Percents may add up to more than 100.
What Visitors Learned about how Scientists Study Space Objects
Great Balls of Fire thematically examined scientist stories whose work has furthered the study of asteroids and comets. Through interactive components, visitors could act as explorers and learn how scientists study asteroids, comets, and meteors. Components also simulated tools and processes used by astronomers. Based on the exhibit, visitors were asked what kinds of things scientists do to study asteroids, comets, and meteors. As shown in Table 15, the most common response was to collect and/or study samples (53%). These respondents described studying tangible materials from asteroids, comets, meteorites, or craters. Some examples of respondents’ comments include:
Collect samples when meteors fall and study them. Study the rocks. Are they magnetic and what kinds of materials are in them? They take samples. They visit asteroids and comets, and use impactors to study the dust.
Almost half of the respondents (48%) mentioned observation as a process that scientists use to study space objects. Responses included “close observation over long periods of time” and “monitor and take pictures to see the course it’s on to track meteor and asteroids.” Visitors also discussed space probes, a scientific space exploration mission where a spacecraft leaves Earth and explores space (41%), simulating impacts (22%), and using telescopes (19%) to study space objects.
Table 15: How Scientists Study Space Objects (n=58)
n Percent
Collect/study samples 31 53% Observations 28 48%
Space probes 24 41%
Impacts 13 22% Telescopes 11 19%
Other 10 17% *Multiple responses allowed. Percents may add up to more than 100. The majority of visitors (76%, n=44) responded to this question without referencing a specific exhibit element. Of those 24% (n=14) who mentioned a specific exhibit element when discussing how scientists study space objects, Blink and Light Curve were most frequently cited. Some adult respondents acknowledge the direct connection that interactive components illustrated the types of things scientists

20 June 2012
do to study asteroids, comets, or meteors. The Comet and Asteroid Hunter was also mentioned as a great example of how scientists do their work.
Visitor Perceptions of Risk of an Impact
On a scale from 1-‐7 where 1 is not concerned at all and 7 is extremely concerned, visitors overall were not that concerned about asteroid, comet, and meteor impacts. The median visitor rating was 2 (S.D.=1.76) on this 7-‐point scale.
Visitors were then asked to explain their rating about how concerned they were about potential impacts. Visitor responses mostly concentrated on how the probability or odds are not that great for an impact to occur (45%). A typical response was, “Because it is just not going to happen. Chances are slim,” Others focused on the range of consequences of potential impact (42%) with visitors saying, “It wiped out a population before, it's been a while since the last one. We are overdue for an impact,” and “The impact wouldn't be that big.”
Table 16: Explanation of Risk Rating (n=60)
n Percent
Probability/Odds not that great 27 45%
Consequences of impact 25 42%
Out of my control 12 20%
No explanation 9 15%
Mitigate the impact 9 13%
Other 5 8% *Multiple responses allowed. Percents may add up to more than 100.
What Visitors found Difficult or Confusing
Visitors were asked if there was anything they found difficult or confusing about GBoF. The majority of visitors (72%) found the exhibition to be clear, “straight forward,” user friendly, and commented that it provided an abundance of activities. A quarter of respondents felt that the exhibition was difficult or confusing. Respondents who found the exhibition difficult or confusing mentioned that some of the content seemed too sophisticated for younger children and commented on user difficulties with the interactive exhibits. Comments in the “other” category referenced concerns about the location of the exhibition and the ambiance of the gallery (e.g. lighting).
Table 17: Difficult or Confusing (n=60)
n Percent*
No 43 72% Yes 15 25% Other 3 5% *Multiple responses allowed. Percents may add up to more than 100.

Space Science Institute Great Balls of Fire Summative Evaluation 21
Suggestions for Improvement
Overall, visitors enjoyed their experience in Great Balls of Fire. When asked to share additional comments or suggestions, 60% of visitors found the exhibition to be great, interactive, educational, and fun (See table 18 for frequency and percentages). Some of the positive responses include:
It's really an awesome exhibit and we've spent a lot of time in it before. They did a good job. It was fun and interactive for everyone. It was really cool. Liked it. I'm glad we came to the museum today.
Twenty-‐eight percent of respondents had no additional comments or suggestions. For the 19% that made suggestions for improvements, ideas included making the content age appropriate for younger children and making specific improvements within components or text panels.
Possibly make it more for pre-‐k ages. Mix it up more on Quiz Show and Comet Hunter. I don’t know if there were descriptions with the screens, but sometimes when I touched the screens
the instructions went so fast. Sometimes I missed what it said before it went on. Table 18: Suggestions for Improvement (n=57)
n Percent*
Great exhibition 34 60%
None 16 28%
Suggest Improvements 11 19%
Other 1 2% *Multiple responses allowed. Percents may add up to more than 100.
Conclusions
Summative evaluation of GBoF indicated that the exhibition successfully delivered on its primary design goals. Specific conclusions are described below, organized by visitor outcomes.
Excitement and interest in asteroids, comets, and meteors
• Visitors spent a relatively long period of time in the exhibition. During that time, they engaged with a smaller proportion of exhibit elements than might have been expected based on the size and composition of the exhibition. However, the level of visitor engagement at these components suggested that visitors were interested and invested in deeply exploring the experiences and learning activities.
• Information sharing is one indication of the topics that visitors find interesting. The majority of visitors shared information with members of their visitor group at some point during their exhibition experience (e.g. calling someone over, reading signage together, having conversations about the exhibit, and explaining the exhibits). These behaviors suggested that the exhibition supported situational interest among visitors that motivated social interaction.
22 June 2012
• Repeat visitation of exhibit elements is another indicator of visitor interest in the topics and experiences provided in the exhibition. The design of interactive components provided visitors with opportunities to investigate their own questions through manipulating variables and observing outcomes. The fact that visitors chose to return to exhibit components both individually and to share the experience with others suggests that exhibits offered support for individual and situational interest.
• Data collected through observations and interviews indicated that visitors found GBoF to be a positive experience. Children and teens especially seemed interested and excited about exhibit elements suggesting that the exhibition design succeeded in serving the target audience. In addition, the majority of respondents to the exit interview provided positive reviews of their exhibition experience.
Awareness and understanding of asteroids, comets and meteors
• Visitors to the exhibition were able to describe characteristics of asteroids, comets, and meteors as well as the potential risks and implications of Earth impacts. Following their experiences in the exhibition, visitors commented on asteroid and comet composition, temperature, size, shape, movement, and location in the solar system. Respondents also indicated an increased awareness of the relationships between Earth and asteroids, comets, and meteors, citing meteor showers and the abundance of asteroids recently discovered by scientists.
• Although visitors frequently commented on the threat, risks, frequency, and effects of impacts on Earth, overall they were not particularly concerned about asteroid, comet, and meteor impacts. This suggested that the exhibition succeeded in balancing messages about the implications associated with different types of Earth impacts and the probability that an extinction-‐causing impact will occur.
Positive attitudes about science and scientists
• Experiences in the exhibition seemed to increase awareness of the range of tools, methods, and strategies that scientists use to study space objects. Visitors often mentioned very specific tools or scientific explorations used to learn about asteroids, comets, or meteors in exit interviews.
• Many visitors enjoyed the interactive exhibits that simulated scientific processes used to study asteroids and comets. Despite the popularity of exhibits like Blink and the Light Curve analysis it was unclear whether the majority of visitors made the connection between those activities and authentic scientific methods.
• Based on experiences in the exhibition, some visitors were reassured to learn that scientists are actively engaged in protecting Earth from a major asteroid or comet impact. This provided some indication that visitors recognize and appreciate the role scientists have in contributing to the safety of the planet.
Space Science Institute Great Balls of Fire Summative Evaluation 23
References
Barriault, C. & Pearson, D. (2010). Assessing exhibits for learning in science centers: A
practical tool. Visitor Studies, 13(1), 90-‐106.
Londhe, R. (2010). Summative Evaluation of Black Holes Exhibit Gallery [Goodman Research
Group] Harvard Smithsonian Center for Astrophysics. http://informalscience.org/
evaluation/show/276
McNamara, P. (2010). Expedition Health Summative Evaluation Report. Denver Museum of
Nature & Science. http://informalscience.org/evaluation/show/247
Serrell, B. (1998). Paying Attention: Visitors and Museum Exhibitions. Professional Practice
Series (Adams, R., Ed.). Washington, D.C.: American Association of Museums.

24 June 2012
Description of Components in the Great Balls of Fire! Exhibition
Visitors to this 3,000-square-foot exhibition can explore four thematic areas: Origins, Asteroids, Comets, and Impacts. The exhibition includes a variety of interactive multimedia experiences, ranging from straightforward computer-based activities to a larger scale, asteroid-shaped "pod" that showcases visitors' role as "explorers" - a role that threads throughout the exhibit. The following is a list of exhibit components and brief descriptions.
Origins
1.01 Entry Sign. 1.02 Origins Intro Panel. In addition to planets and moons, the solar system contains smallerobjects—asteroids and comets—that are usually found in specific regions. The panel introduces the idea that Earth is at risk of a future impact. 1.03 Asteroid Encounter. This is an immersive experience for visitors to engage in an interactive, role-playing activity. It includes visualization of the formation of the Solar System with a focus on why asteroids and comets formed, where they can be found, and how they periodically impact planets.
© 2011 Space Science Institute July 26, 2011 Page 2 I
Appendix 1 Exhibit Component Descriptions

Space Science Institute Great Balls of Fire Summative Evaluation 25
Asteroids 2.01 Asteroids Intro Panel. This panel provides an overview of asteroids, including a diagram of their primary locations in the Solar System. Visitors learn how close NEOs (near-Earth objects) sometimes come to Earth.
2.02 Itokawa Asteroid Model. A large replica of the Itokawa asteroid rotates with a model of the Hayabusa spacecraft on its surface. Rail panels and an embedded video describe the Hayabusa mission to and from Itokawa, and explains why this asteroid was chosen.
2.03 Itokawa Asteroid Video. This video describes the Itokawa Asteroid, tells the story of the Hayabusa mission to it, and shows the types of near Earth asteroids. 2.04 Blink Comparator Computer. Visitors will use the method astronomers employ to find asteroids and comets moving among the stars. They will align two photographs of the night sky and then "blink" the images to find the asteroid in the star field image. Through an arrangement with the Smithsonian Center for Astrophysics, visitors can also request that the center's automated telescope take photographs that night and email them to the visitor the next day. There is no cost (to museum or visitors) for this service. 2.05 Light Curves Interactive. Using a light sensor pointed at a rotating model of an asteroid, visitors generate an asteroid "light curve" in real-time, employing a process similar to one used by scientists. Experimenting with the light sensor and the irregularly shaped and moving asteroid models shows how the light curve changes and demonstrates the difficulty of determining the shape and movement of an object from a few pixels of light. 2.06 Light Curves Computer. Visitors try to figure out which of four rotating virtual asteroid models would create the light curve graph being shown on the screen. © 2011 Space Science Institute July 26, 2011 Page 3

26 June 2012
2.07 Rubble Pile Simulation Computer. On a computer-based simulation, visitors attempt to save Earth from an impact by moving an asteroid with bombs and rockets while trying not to break it into pieces. Comets
3.01 Comets Intro Panel. The panel provides an overview of comets and key facts about them, including diagrams of the Oort Cloud and Kuiper Belt. 3.02 Tempel 1 Comet Model. This is a model of Tempel 1's nucleus; its coma is shown in the accompanying graphics. The rail has several content panels and an embedded video about the Deep Impact mission to Tempel 1. 3.03 Tempel 1 Comet Video. The video features an animation of a comet going from the Kuiper Belt to the inner Solar System, showing how the coma and tail develop. 3.04 Comet Observations Story Panels. A display of art and artifacts tells the story of comet observations throughout human history that makes connections to modern science wherever possible. Also included is a video of the Jupiter impacts and an engineering test model of a Whipple Shield from the Stardust mission. 3.05 Sizing Up Shooting Stars Display. Replica meteoroids of various sizes are placed on agraphic panel of the Leonid meteor shower. Visitors are asked to select one that's the size of the average rock in a Leonids meteor event. Lifting a panel reveals the surprising answer. 3.06 Amateur Astronomer Cards. Visitors can obtain cards from a custom printer that list upcoming events related to asteroid and comet research, including meteor showers, local
© 2011 Space Science Institute July 26, 2011 Page 4 I

Space Science Institute Great Balls of Fire Summative Evaluation 27
amateur astronomy meetings, and NASA mission happenings. The content can be updated easily using a Web interface. Impacts 4.01 Impacts Intro Panel. The panel provides an overview of impact sites around the world. 4.02 Barringer Crater Model. A model of the Barringer crater with rail graphics and a computer display combine to tell the story of how Gene Shoemaker proved that an object from space (and not a volcano) caused the crater. 4.03 Barringer Crater Computer. Visitors can view a slow- motion simulation of the impact that created Barringer crater and use a custom interface from Google Earth to view the top 30 craters in the world. 4.04 What If It Hit My Town? Computer. Visitors select the size of an asteroid or comet and then enter the zip code of a place for the impact. The results appear on a Google Maps display. A second screen shows an animation of the impact with cross- sectional simulations.
4.05 Water Impact Test. This mechanical device allows visitors to shoot a small projectile into water. A high-speed camera captures the impacts, which can then be played back in slow motion, demonstrating how even small objects can release a lot of energy on impact. © 2011 Space Science Institute July 26, 2011 Page 5 I

28 June 2012
4.06 Projectile Tests Video. Visitors can access video of high- speed projectile tests conducted by scientists. Nearby are an artifact target and projectile with text comparing the speed of the test projectiles to that of the comet Shoemaker-Levy 9. 4.07 Is It a Rock or a Meteorite? Visitors examine a collection of rocks and use a series of tests (magnetism, color, density/relative weight) to determine which one is a meteorite. They can also touch a 22 pound metallic meteorite that impacted Earth 4,500 years ago, in what is now Buenos Aires, Argentina.
4.08 "Messengers From Space" Display Case. Visitors use a magnifying glass to examine a collection of real meteorites, Libyan glass, microtectites, shocked quartz, and two meteorite cross-sections. Each specimen is linked to a specific Earth crater and time period. A host venue may augment the exhibition by displaying its own meteorite collection or that of a local collector or institution. 4.09 Science Fact or Science Fiction Computer. Visitors watch clips from a variety of movies and television shows and then answer the question, "Did they get the science right, partially right, or wrong?" Their answers are compared to those of scientists and previous visitors. © 2011 Space Science Institute July 26, 2011 Page 6 I
Space Science Institute Great Balls of Fire Summative Evaluation 29
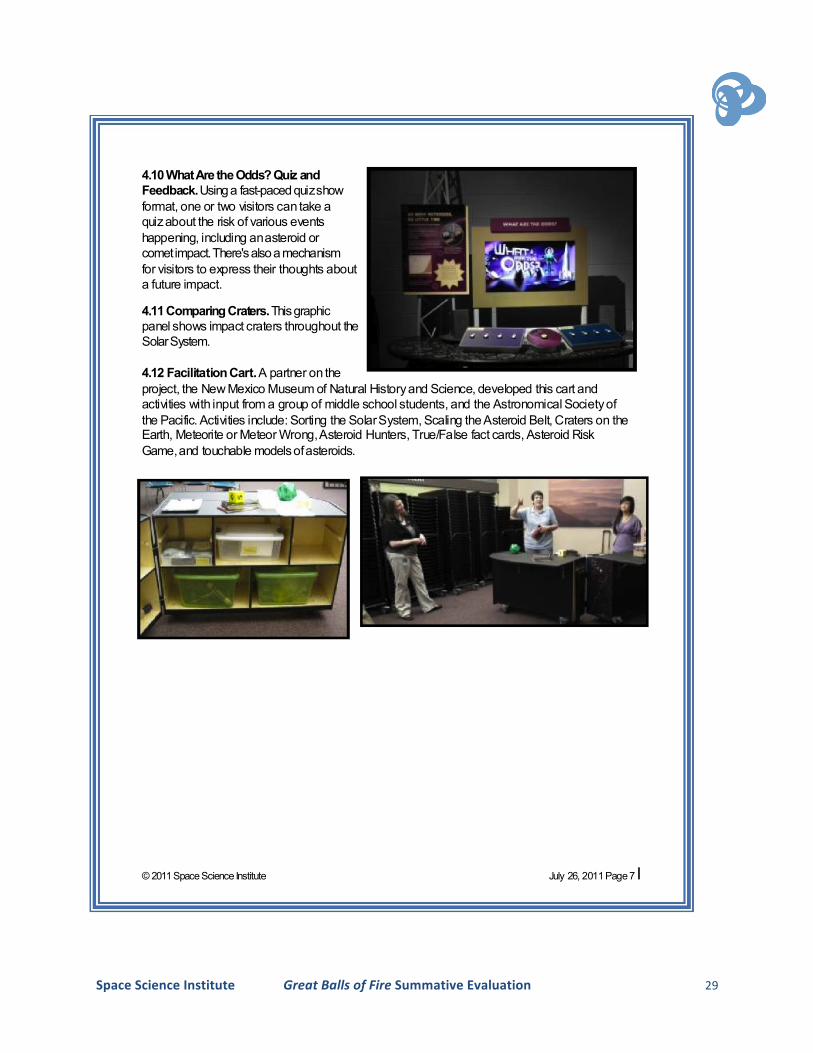
4.10 What Are the Odds? Quiz and Feedback. Using a fast-paced quiz show format, one or two visitors can take a quiz about the risk of various events happening, including an asteroid or comet impact. There's also a mechanism for visitors to express their thoughts about a future impact. 4.11 Comparing Craters. This graphic panel shows impact craters throughout the Solar System. 4.12 Facilitation Cart. A partner on the project, the New Mexico Museum of Natural History and Science, developed this cart and activities with input from a group of middle school students, and the Astronomical Society of the Pacific. Activities include: Sorting the Solar System, Scaling the Asteroid Belt, Craters on the Earth, Meteorite or Meteor Wrong, Asteroid Hunters, True/False fact cards, Asteroid Risk Game, and touchable models of asteroids. © 2011 Space Science Institute July 26, 2011 Page 7 I

30 June 2012
Backdrop Murals
5.01 Mural: Hayabusa Mission to Itokawa 5.02 Mural: DAWN Mission to Ceres and Vesta 5.03 Mural: WISE Telescope Finding Dark Asteroids 5.04 Mural: Deep Impact Mission to Temple 1 5.05 Mural: Dinosaur Extinction Impact © 2011 Space Science Institute July 26, 2011 Page 8 I

Space Science Institute Great Balls of Fire Summative Evaluation 31
Appendix 2 Framework and Observation Guide
Space Science Institute: Great Balls of Fire Exhibition Framework and Observation Guide Institute for Learning Innovation
September 2011 This framework is informed by Barriault and Pearson’s Visitor Engagement Profile (2010) and has been adapted to use for the Space Science Institute: Great Balls of Fire exhibit summative evaluation.
Initiation Behaviors
Doing the Activity Watching others do the activity
Types of Activity Exhibit Examples Types of Activity Exhibit Examples
Only completes part of the activity.
Complete activity without testing for outcomes
Ex: stops at component, touches a screen, walks away
Ex: Impact: Drop the ball, but don’t look at the video afterwards.
Looking at someone else doing an activity.
Expressed interested in doing the activity (verbal or visual)
Ex: Parent watching a child while they complete an activity
Ex: Interactive is in use, another visitor watches, gives advice, or reacts to the interactive.
Transition Behaviors
Transition behaviors focus on doing the activity in a more complete way than initiation behaviors—doing the activity a second time or looking for a difference in outcome.
Types of Activity Exhibit Examples
Doing the activity a second time to attain desired outcome, to master the exhibit experience.
Changing the variables once looking for a difference in outcome; becoming involved, engaged.
Ex: Play rubble pile game a second time to get better and faster.
Ex: Practice the light curve enough rounds to pass the “training.”
Ex: Drop the ball a second time to look at different angles of the drop each time, play it back each time.
Ex. Continues to Mission 2: Comets in the “Asteroid and Comet Hunter” Pod
Ex. Quiz show, visitors finish answering round 1 and continue to round 2

32 June 2012
Breakthrough Behaviors
Breakthrough behaviors have two levels: Level 1 and Level 2. These levels require engagement with the activity. NOTE: Breakthrough behaviors were removed from exhibit components that do not involve activities. These include text panels, murals, and artifact displays.
Types of Activity Exhibit Example
LEVEL 1
Engaging in inquisitive behavior, exploratory actions, repeating the activity three or more times
Reading signage, asking questions.
Ex. Answers trivia questions in the “Asteroids and Comet Hunter” pod
Ex. Finishes the Quiz show completely
Ex. Cycles through more than 2 impacts tests and varies speed (using spin browser) to more closely observe outcomes of the tests
LEVEL 2
So engaged in activity that it’s hard to break concentration, doesn’t want to leave to do anything else, repeats several times, and stays at the component for several minutes
Experimenting, testing different outcomes, or engaging with others about the various outcomes, or involved in activity for an extended period of time
Ex. Playing rubble pile game more than three times, varying strategy to save Earth with each round
Ex. Completing several impacts (more than 3) testing different variables and exploring the data associated with the impacts
Visitors in each category can also have additional “labels” of Seeking and Sharing Information and Positive Response.
Seeking and Sharing information Positive Response
Types of Activity Exhibit Example Types of Activity Exhibit Example
Calling someone over
Reading signage together, having conversations about the exhibit and related science with others.
Sharing experience and information with others by explaining the exhibit, or giving them details about gained information
Ex: Hey look at this!
Ex: Parent explains how to do an activity to reach the desired outcome.
Ex: Parent explains to a child that the blink interactive is how scientists find asteroids.
Smiling, pleased with exhibit
Laughter, verbal references to enjoyment.
Obvious signs of eager disposition.
Ex: Child exclaims with joy or pleasure when he/she achieves the goal of an interactive. (Yes! or Alright!)
Ex: Laughing about playing in the quiz game.
Ex: “This is so cool!” At any of the interactive.

Space Science Institute Great Balls of Fire Summative Evaluation 33
Appendix 3 Observation Instrument

34 June 2012
Subject # _____ Date: _________ Initials: _____ Time of Day: o Before Noon o Noon-‐3 o 3-‐5 Once visitors exit the GBoF, introduce yourself and invite them to participate in a short interview about their experience. "Hi my name is ______. Today I am helping to collect feedback on the exhibit you just visited. We're asking visito rs to sp end 5-‐10 minutes and answer a few questions about it. It would be great if you could help us out and tell us wha t you think. (If visitor says yes or no be sure to thank them)
Based on your observations of the target visitor: Total Group Size: ______
Age category: Group Information Sex Exhibit Status
o 11-‐13 o Adult visiting alone o Male o Empty o 14-‐17 o Adult only group oFemale oModerate o 18-‐30 o Adults with kids o Full o 31-‐50 o Adult with at least one teen o 51+ o Teens without adult
1-‐What would you say is the main idea of this exhibit? 2-‐ Now that you've been through the exhibit, what is one thing you never realized before? 3-‐What did you enjoy most about this exhibit? Why? 4-‐ The exhibition talks about asteroid, comet, and meteor impacts. On a scale from 1 to 7 where 1=Not concerned at all and 7= Extremely concerned how concerned are you about the risk of these kinds of impacts? Not concerned at all Extremely concerned
1 2 3 4 5 6 7
Why did you give that rating?
1
Appendix 4 Interview Instrument

Space Science Institute Great Balls of Fire Summative Evaluation 35
5-‐What was something you learned in the exhibit about asteroids, comets, or impacts? 6-‐Was there anything that you found difficult or confusing? 7-‐Based on the exhibit, what kinds of things do you think scientists do to study asteroids, comets, and meteors? 8-‐Do you have any other comments or suggestions that you would like to share? Demographics 9. Have you seen this [GboF] exhibit before? o Yes oNo
If yes, how many times have you visited GBoF? ____
10. How many times have you visited a science museum or science center in the last year? ____
Thank you!
2

36 June 2012
Appendix 5 Additional Data Tables
A1: Detailed Description of the Observation Sample (n=81)
n Percent Gender Male 42 52% Female 39 48% Age Children (5-‐10 years) 13 16% Teens (11-‐17 years) 27 33% 11-‐13 years 17 21% 14-‐17 years 10 12% Adults (18+ years) 41 51% 18-‐30 years 16 20% 31-‐50 years 20 25% 51+ years 5 6% Group Type Adult Only Groups 11 14% Adult visiting alone 2 3% Adult only group 9 11% Groups with Children/Teens 70 87% Adults with children 66 82% Children without adult 4 5% Number of People in Group 1 person 2 3% 2 people 21 27% 3 people 20 26% 4 people 19 24% 5 or more people 16 20%
A2: Detailed Description of the Interview Sample (n=62)
n Percent Gender Male 27 44% Female 35 57% Age Teens (11-‐17 years) 13 21% 11-‐13 years 8 13% 14-‐17 years 5 8% Adults (18+ years) 49 80% 18-‐30 years 9 15% 31-‐50 years 32 52% 51+ years 8 13% Group Type Adult Only Groups 9 15% Adult visiting alone 3 5% Adult only group 6 10%

Space Science Institute Great Balls of Fire Summative Evaluation 37
Groups with Children/Teens 52 86% Adults with children 40 65% Adult with at least one teen 12 19% Teen without adult 1 2% Number of People in Group 1 person 3 5% 2 people 30 49% 3 people 7 11% 4 people 10 16% 5 or more people 12 30%
A3: Distribution of engagement levels at the 15 most-‐visited exhibit elements
Element Name Total visitors
Initiation Transition Breakthrough n % n % n %
Water Impact Test 52 23 44% 16 31% 13 19% Comet and Asteroid Hunter 46 26 57% 8 17% 12 26% What If It Hit My Town? 45 25 56% 11 24% 9 20% Light Curves Interactive 40 22 55% 15 38% 3 8% Itokawa Asteroid Video 38 28 74% 6 16% 4 11% Is it a Rock or a Meteorite? 38 18 47% 13 34% 7 18% Projectile Tests Video 38 15 40% 13 34% 10 26% What Are the Odds? Quiz 35 9 26% 4 11% 22 63% Blink Comparator Computer 34 20 60% 9 27% 5 15% Itokawa Asteroid Model 34 30 88% 4 12% 0 0% “Messengers from Space” Display 33 27 82% 6 18% n/a n/a Barringer Crater Computer 33 25 76% 6 18% 2 6% Rubble Pile Simulation 32 10 31% 12 38% 10 31% Light Curves Computer 25 13 52% 5 20% 7 28% Science Fact or Science Fiction Computer 24 16 67% 4 17% 4 17%

38 June 2012
A4: Sharing Information at the 15 Most-‐Visited Exhibit Elements
Element Name Total visitors
Shares information
n % Water Impact Test 52 27 52% Comet and Asteroid Hunter 46 13 28% What If It Hit My Town? 45 15 33% Light Curves Interactive 40 8 20% Itokawa Asteroid Video 38 12 32% Is it a Rock or a Meteorite? 38 19 50% Projectile Tests Video 38 15 40% What Are the Odds? Quiz 35 19 54% Blink Comparator Computer 34 11 32% Itokawa Asteroid Model 34 11 32% “Messengers from Space” Display 33 5 15% Barringer Crater Computer 33 6 18% Rubble Pile Simulation 32 15 47% Light Curves Computer 25 4 16% Science Fact or Science Fiction Computer 24 10 42%
A5: Positive Responses at the 15 Most-‐Visited Exhibit Elements
Element Name Total visitors
Positive Response
n % Water Impact Test 52 8 15% Comet and Asteroid Hunter 46 10 22% What If It Hit My Town? 45 6 13% Light Curves Interactive 40 5 6% Itokawa Asteroid Video 38 0 0% Is it a Rock or a Meteorite? 38 2 5% Projectile Tests Video 38 6 16% What Are the Odds? Quiz 35 18 51% Blink Comparator Computer 34 7 21% Itokawa Asteroid Model 34 1 3% “Messengers from Space” Display 33 1 3% Barringer Crater Computer 33 3 9% Rubble Pile Simulation 32 18 56% Light Curves Computer 25 5 20% Science Fact or Science Fiction Computer 24 2 8%