GBG2015 2nd Interim-Analyst-Finalfile.irasia.com › listco › hk › gbg › cpresent ›...
21
2015 Second Interim Results Announcement for 12 Months Ended 31 Dec 2015 Analyst Meeting Feb 25, 2016
Transcript of GBG2015 2nd Interim-Analyst-Finalfile.irasia.com › listco › hk › gbg › cpresent ›...

2015 Second Interim
Results Announcement for 12 Months Ended 31 Dec 2015
Analyst Meeting Feb 25, 2016

Key Financial Highlights
• Adjusted turnover increased by over 6%, excluding the impact of US$188m from exiting underperforming brands along with the impact of US$45m from a decrease in the Euro exchange rate.
• Reached Three-Year Plan target for total margin percentage one year in advance
• Core operating profit was negatively impacted by the effect of US$5m in FX. In addition, Spyder’s performance was impacted by the warm winter in North America resulting in a swing of US$9m from 2014
• Operating costs increased largely due to investment in key Controlled Brands and the addition of new licenses
12 Months Ended 31 Dec
(US$m) 2014 2015 Change
Turnover 3,454 3,423 – 0.9 %
Total Margin 1,117 1,170 4.8 %% of Turnover 32.3% 34.2%
Operating Costs 963 1,000 3.8 %
Core Operating Profit 154 170 10.5 %% of Turnover 4.5% 5.0%
2

Net Profit Analysis
(1) Adjusted Net Profit: Excluding merger & acquisition costs, non-cash items and non-operational expenses, such as gain on remeasurement of contingent consideration payable, amortization of other intangible assets, non-cash interest expenses and non-operational expenses
(2) EBITDA is defined as net profit before net interest expenses, tax, depreciation and amortization. This also excludes share of results of joint ventures, material gains or losses which are of capital nature or non-operational related, acquisition related costs and non-cash gain on remeasurement of contingent consideration payable
12 Months Ended 31 Dec(US$m) 2014 2015 Change
Core Operating Profit 154 170 10.5 %Gain on Remeasurement of Contingent Consideration Payable 172 90Amortization of Other Intangible Assets (50) (60)One-off Reorganization and Listing Costs related to Spin-off (54) –Write-down of Disposal Group Held-for-sale (50) –Other Non-core Operating Expenses (3) (18)Non-cash Interest Expenses (19) (14)Cash Interest Expenses (26) (47)Share of Profits of Joint Ventures 1 6Tax (21) (10)
Net Profit for the Period 104 117 11.9 %Non-controlling Interest – (7)
Net Profit Attributable to Shareholders 104 110 5.6 %
Adjusted Net Profit (1) Attributable to Shareholders 108 112 3.8 %
EBITDA (2) 339 354 4.3 %
3
150
200
2013 2014 2015
170
154
134
(US$m)
1,050
1,350
2013 2014 2015
1,1701,117
1,010
(US$m)
Track Record
Total Margin Core Operating Profit
Three-Year Plan Targets (2014-2016)
‣Total margin returned to 2011 level (i.e. 33.9%)
▷COP doubles 2013’s level(i.e. US$134m)
4
% of Turnover30.7%32.3%
34.2%
% of Turnover4.1%
4.5%5.0%
CAGR 12.8%

•An inaugural US$1.2 billion syndicated credit facility was closed with a
consortium of nine leading international and local financial institutions
•Comprised of a US$500 million 3.5-year and a US$700 million 5.5-year
committed revolving credit facility
•An effective and flexible way to finance the Group’s capital needs
•One of the largest completed USD syndicated loans for a Hong Kong
corporate in 2015
Inaugural Syndicated Credit Facilities
5

Balance Sheet Highlights
• Entered into a new syndicated US$1.2 billion debt facility
• Facility extended maturity dates resulting in a current ratio of 1.22 compared to 0.87 at June 30, 2015
(1) Total debt includes bank loan
(2)Current assets divided by current liabilities
(US$m) Jun 2015 Dec 2015
Total Debt (1) 837 952
Cash 102 78
Net Debt 735 874
Current Ratio (2) 0.87 1.22
6

* Partial List
Licensed Brands

Segment Highlights - Licensed Brands
• Excluding the impact of a decrease in the Euro exchange rate US$43m and the tail end impact of exiting underperforming brands US$180m, adjusted turnover grew by approx 3%
• Core operating profit affected by the tail end impact of existing underperforming brands and FX impact
• Total margin percentage increase due to a better mix of businesses, although partially offset by FX impact on European business which is predominantly characters
• Characters business continued to perform well (e.g. Frozen, Star Wars, Ninja Turtles, Minions, and Paw Patrol)
12 Months Ended 31 Dec
(US$m) 2014 2015 Change
Turnover 2,839 2,688 – 5.3 %
Total Margin 903 876 – 3.0 %% of Turnover 31.8% 32.6%
Operating Costs 777 765 – 1.6 %
Core Operating Profit 126 111 – 11.4 %% of Turnover 4.4% 4.1%
8

Licensed Brands Business Highlights
• Footwear and accessories business continued to perform well
• Particularly our key brands in footwear, with Calvin Klein standing out, as a result of creating more fashion-driven products. Growth momentum expected to continue going forward, including in Europe & Asia
• Global leadership and growth momentum continued in characters business
• Frozen, Minions, Star Wars, Ninja Turtles and Paw Patrol were among the best selling characters
• Acquired PS Brands, doing business as Planet Sox, a leader in designing, marketing and distributing hosiery products
• Covers multiple categories including socks, legwear, baby shoes and related accessories. Licenses include Disney, Nickelodeon, Hasbro, Fila, Head Sport, Kate Spade, Nanette Lepore and Kensie
• A major accessories category which compliments and extends our leadership in areas such as kids and characters
9

Controlled Brands
* Partial List

Segment Highlights - Controlled Brands
• Strong topline growth by 20%
• Total margin percentage increased by over 500 basis points due to improvement in existing margins and growth in direct-to-consumer business
• Turnover and core operating profit from the newly added brands will be up considerably for the full period in FY 2016/17
• Operating costs increased due to investments in Frye and Spyder, and the addition of new licenses e.g. Jones New York, Joe’s and Buffalo
12 Months Ended 31 Dec
(US$m) 2014 2015 Change
Turnover 614 735 19.7 %
Total Margin 214 294 37.3 %% of Turnover 34.8% 39.9%
Operating Costs 186 235 26.6 %
Core Operating Profit 28 59 108.2 %% of Turnover 4.6% 8.0%
11
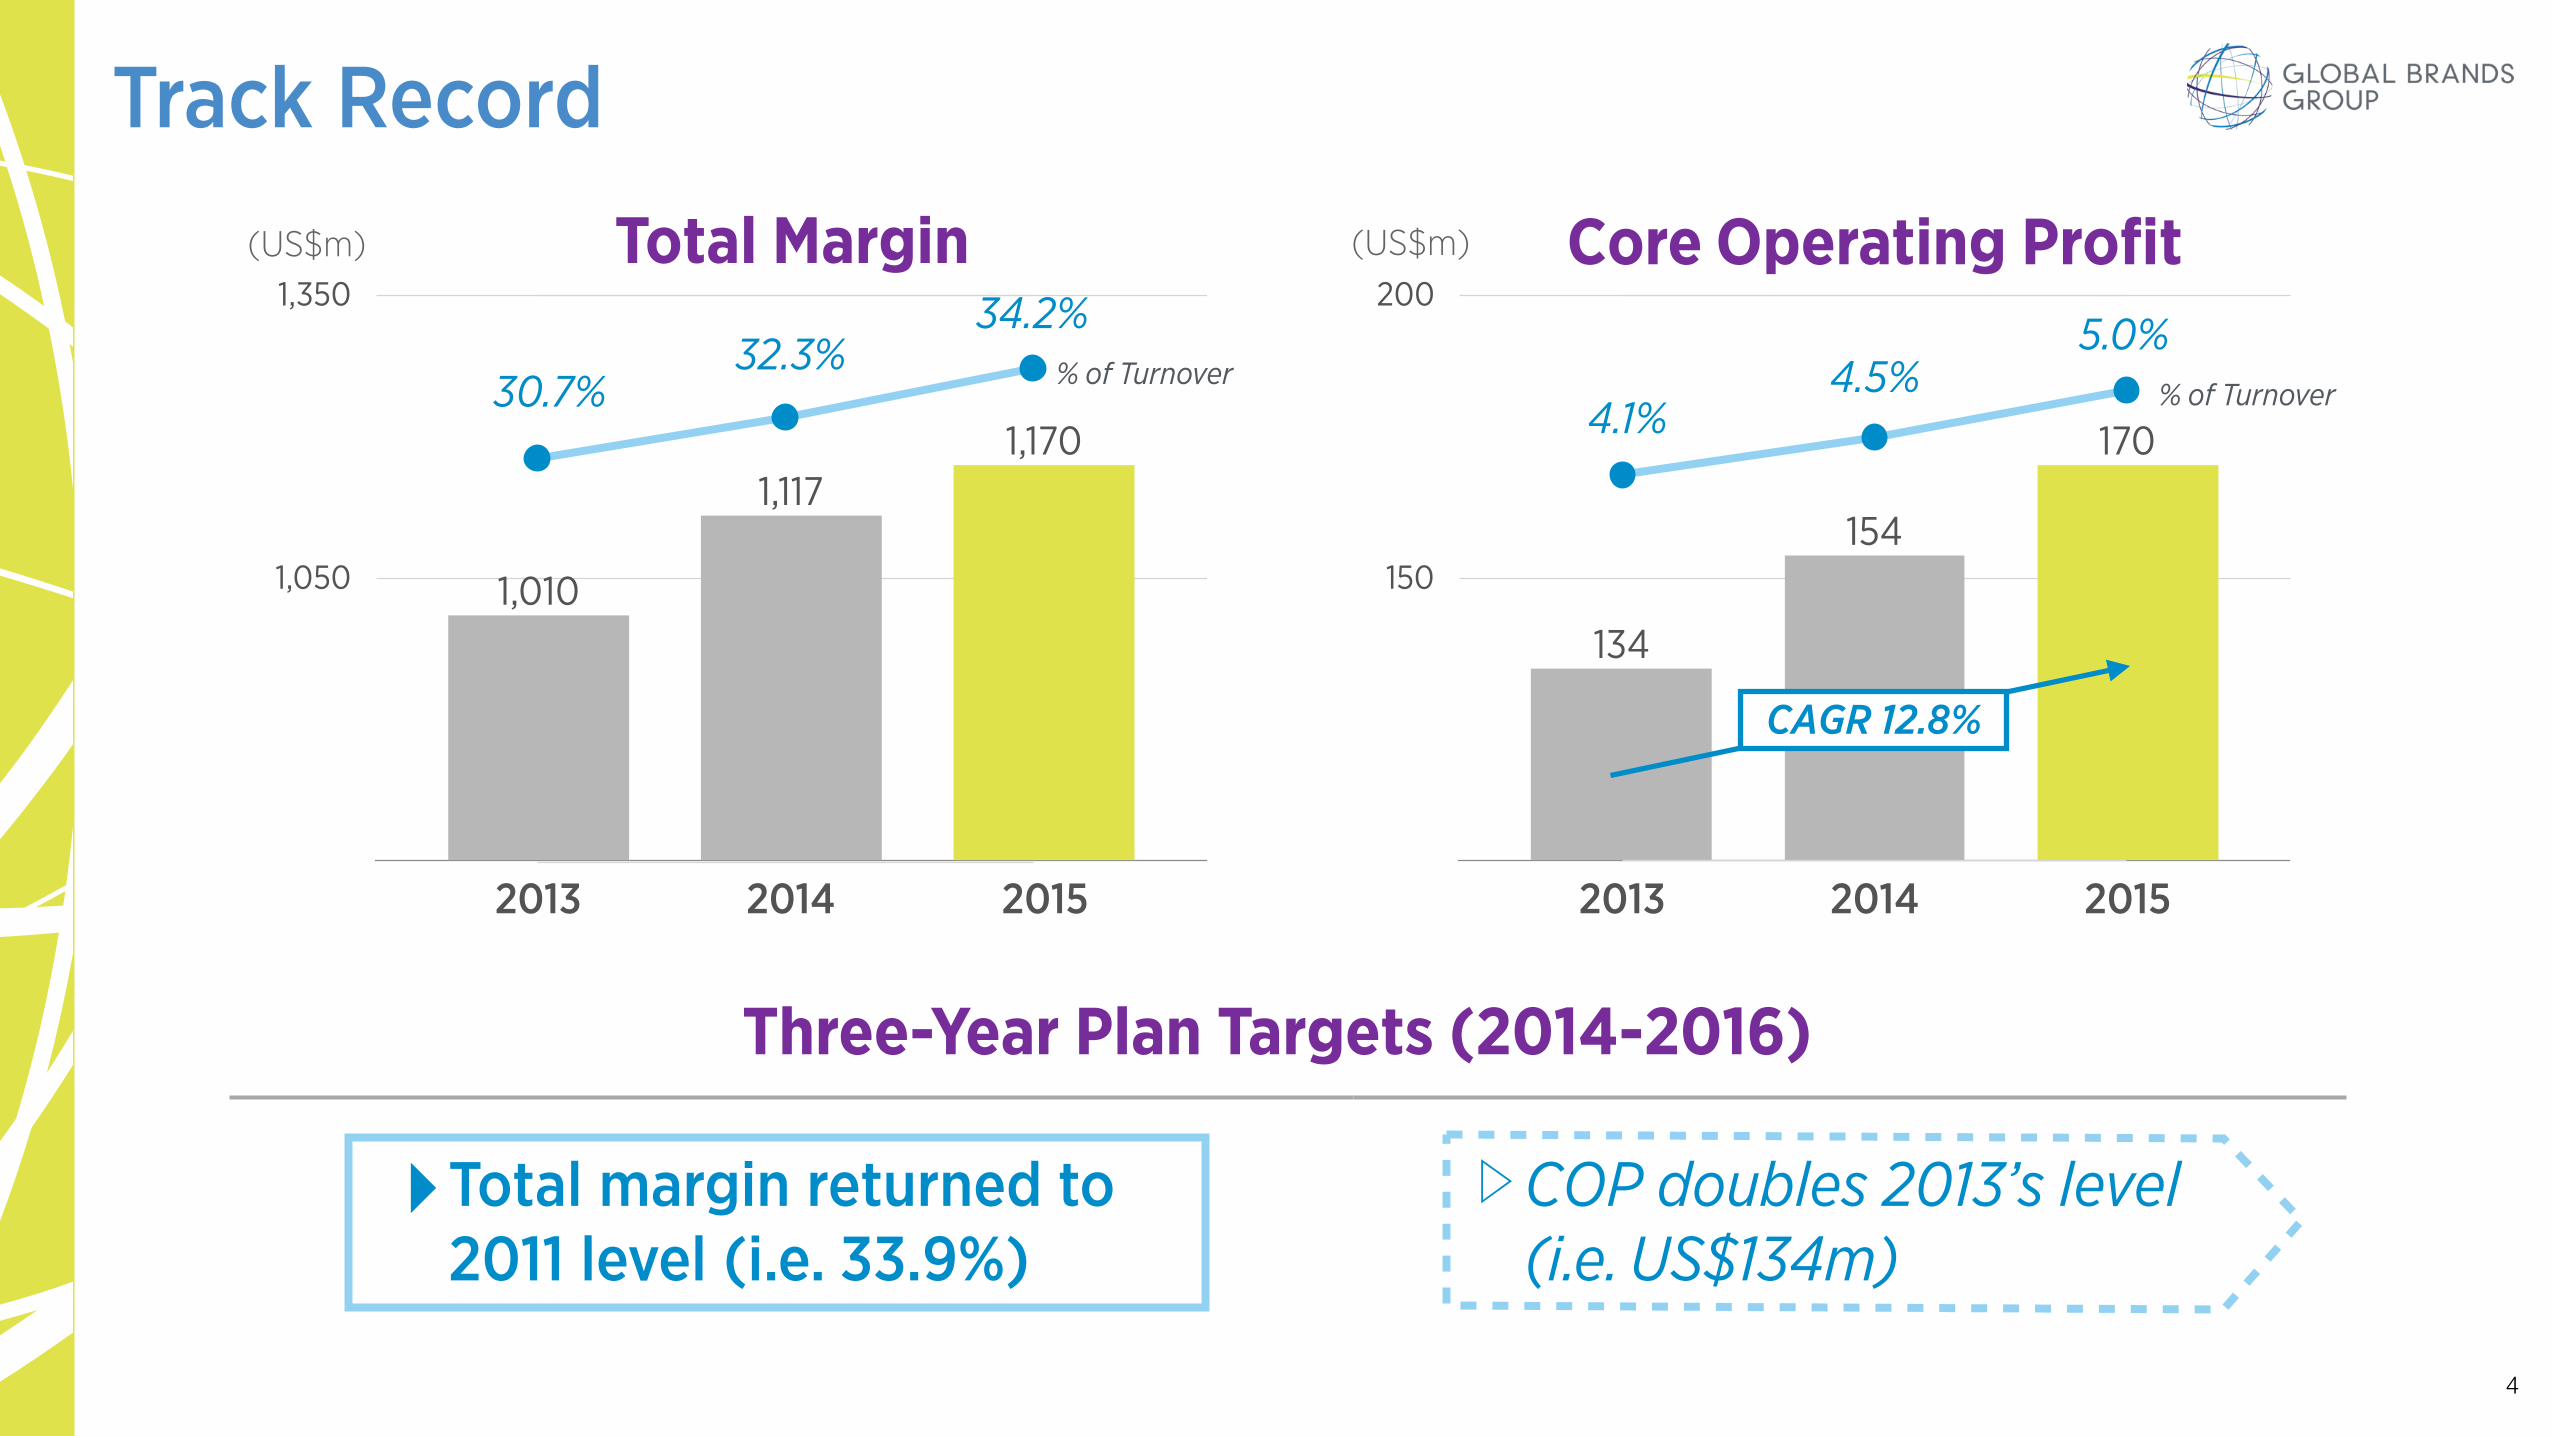
Brick & Mortar and Geographical Expansion
‣Added 100+ new points of sale, including South Korea, Japan and Mexico
‣Expecting to add 110+ new points of sale in FY 2016/17, including new markets such as Chile
‣Our retail partners opened 57 new stores, including 6 dedicated Juicy Girls stores, bringing the total to 240+ globally. New territories include India and South Africa. Expecting to open 35 additional stores in FY 2016/17, including 15 Juicy Girls stores
‣Enhanced distribution in the US and Europe. Expecting first retail store in FY 2016/17
‣ Launched new global e-commerce website as well as a Korean language platform. Also expecting strong demand from other online platforms in FY 2016/17
Growing Direct-to-Consumer Reach
‣Opened 4 additional stores, bringing the total to 8. Expecting to add 4 new stores in FY 2016/17
‣ Launched new e-commerce platform. Continued direct-to-consumer growth with web sales increasing by 44% in 2015. Named as one of the world’s most innovative e-tailers
‣Revamped e-commerce website with web sales increasing by 44% in 2015
Global E-commerce Growth
12

‣ Expanding new product offerings such as handbags which thrived across all sales channels and grew by 52% in 2015.
‣Cold weather accessories and belts planned for Fall 2016
‣Expanding spring/summer apparel and non-ski winter apparel.
‣ Started first season of separately designed and more fashion oriented products for South Korea
‣Debut of men’s collection in 2015.
‣ Launch of handbags planned for Fall 2016
Expanding Product Offering
‣Continues to expand girls-only category
‣Product collaboration with Swarovski. Other special collections to celebrate Juicy turning 21 in 2016
13
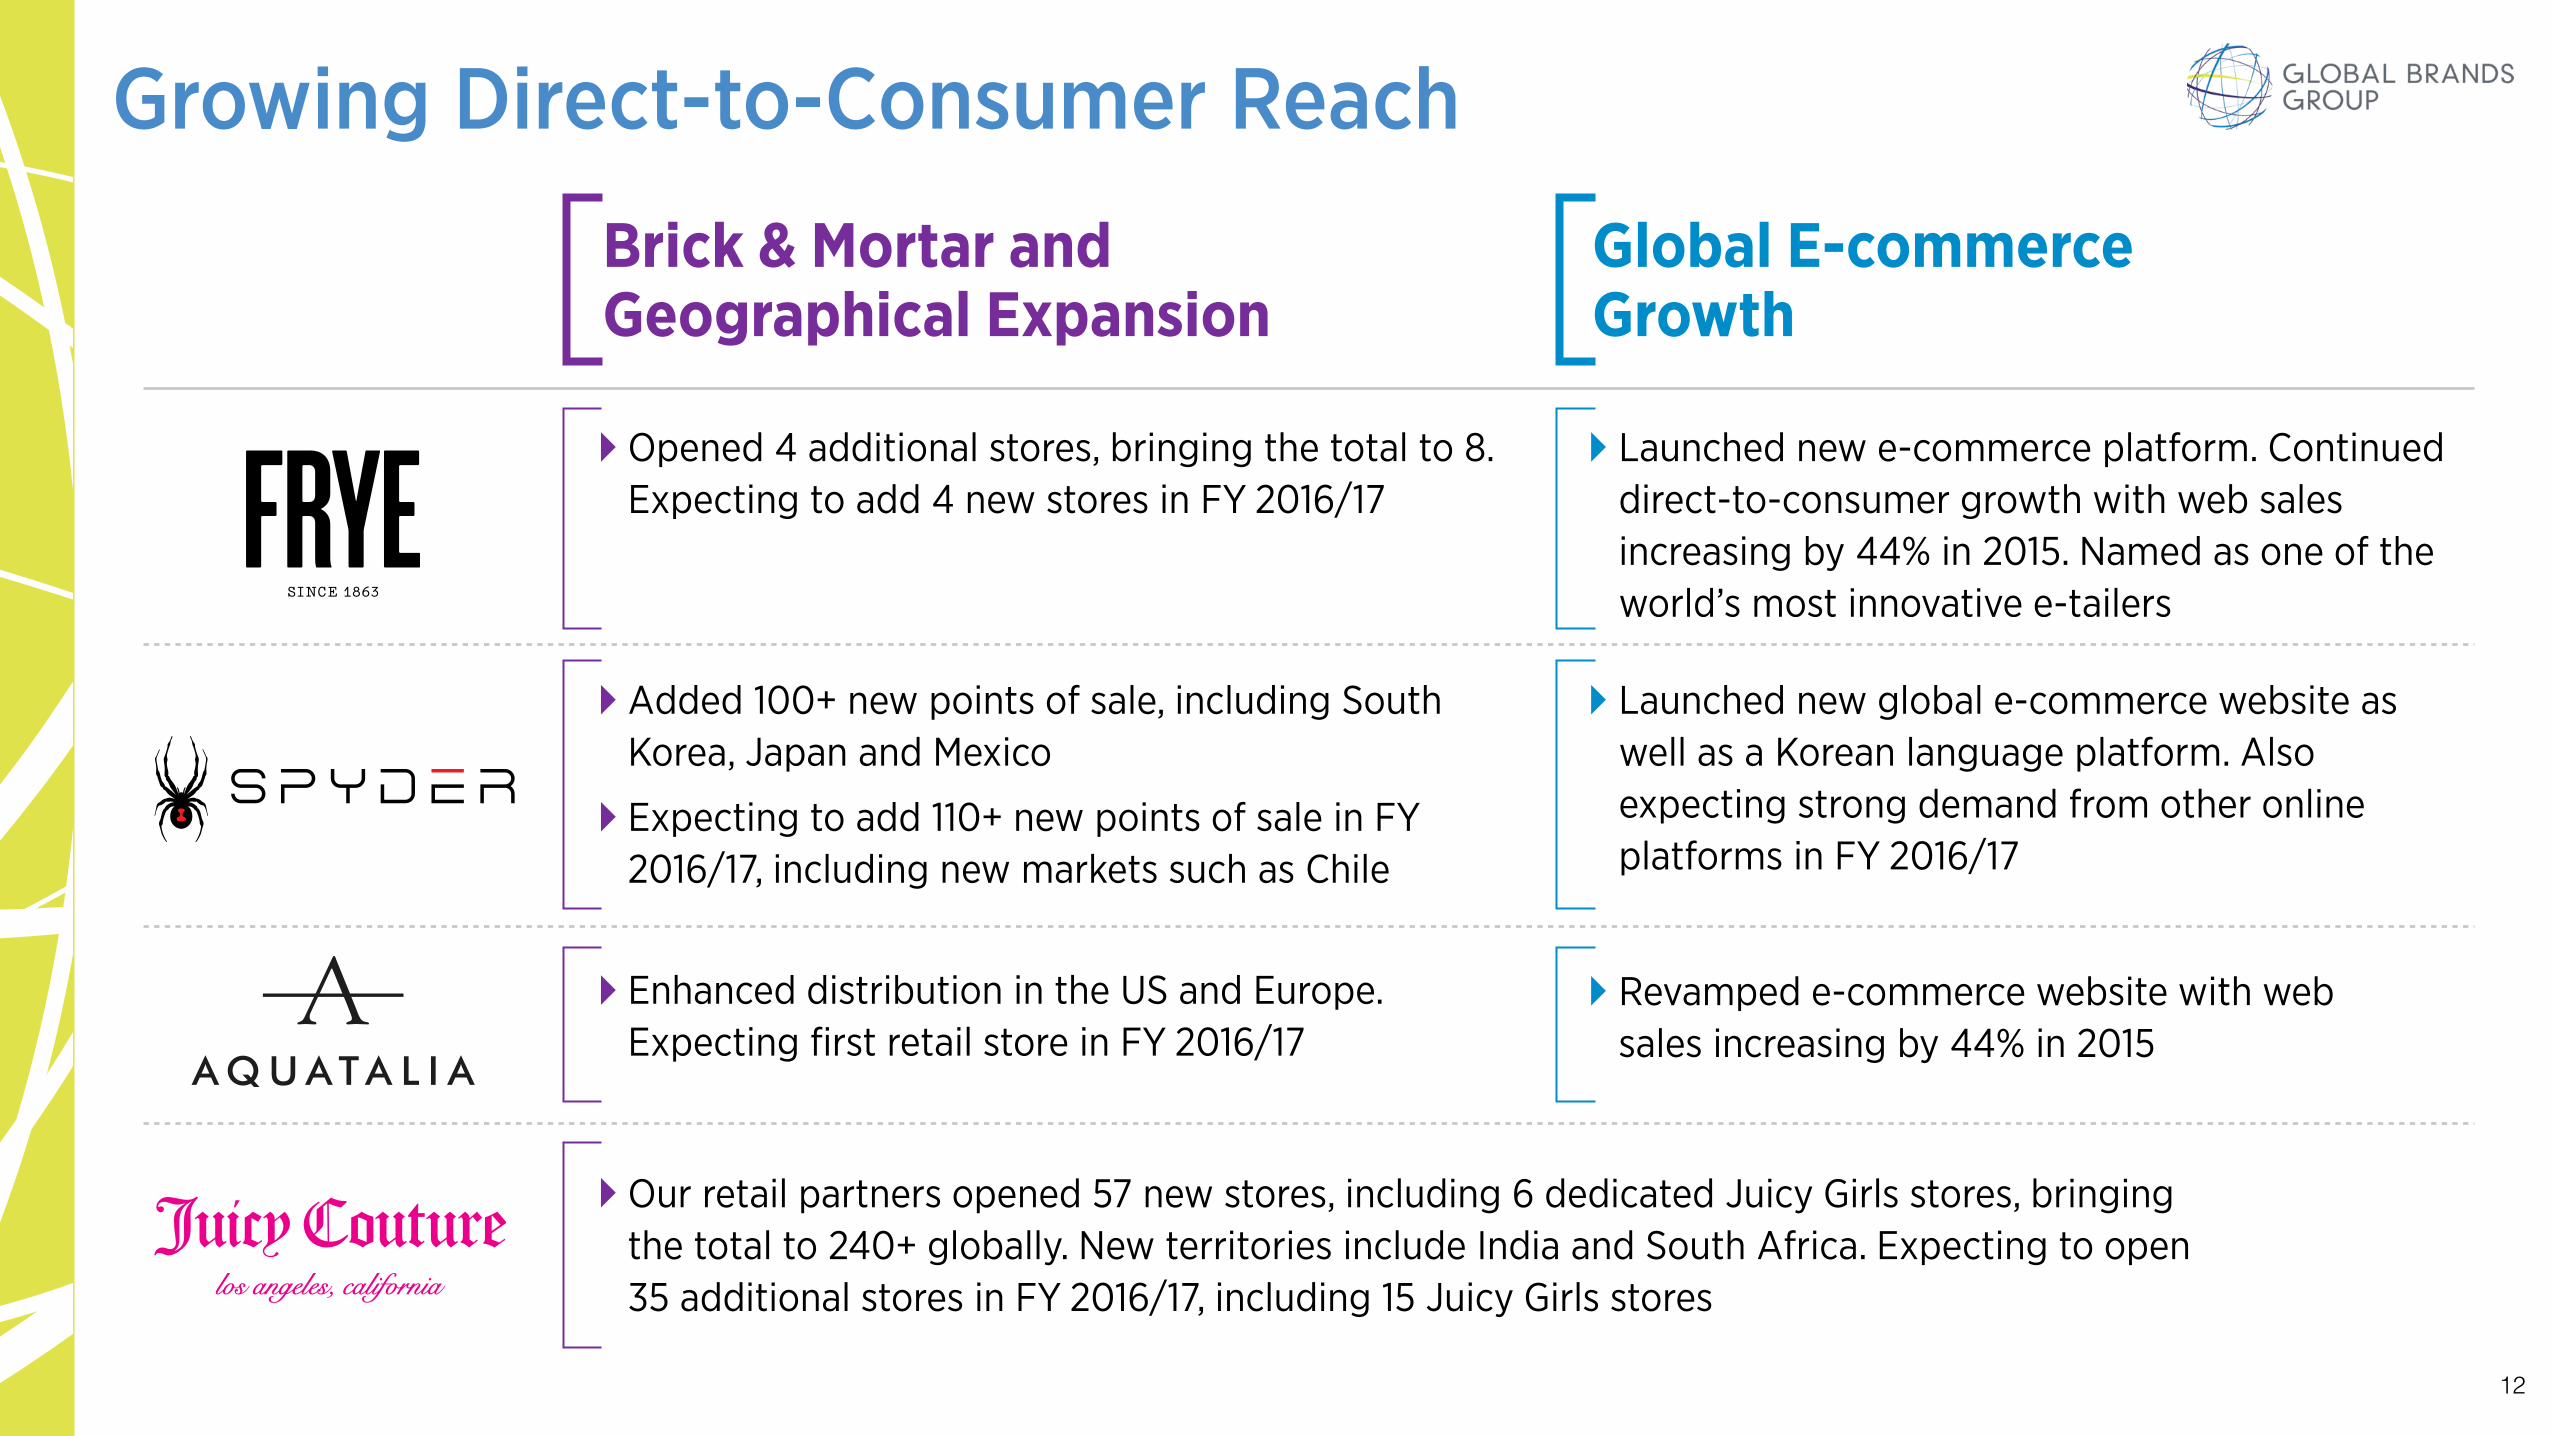
• A brand synonymous with classic, modernised wardrobe staples ranging from premium denim to handcrafted collection pieces
• Covering multiple categories, including womenswear and menswear
• The brand is available at fine department stores and specialty boutiques in the US and internationally
• First range of products produced in collaboration with Global Brands will launch in Spring 2016
• Buffalo David Bitton and i Jeans by Buffalo are both iconic denim brands with North American roots
• The brands offer multiple denim styles and a full fashion collection, including denim jeans, pants, shirts, sweaters, jackets, dresses and other apparel, as well as accessories
• Further strengthens our business in the US & Canada with growth potentially globally
Building out a New Denim Platform
14
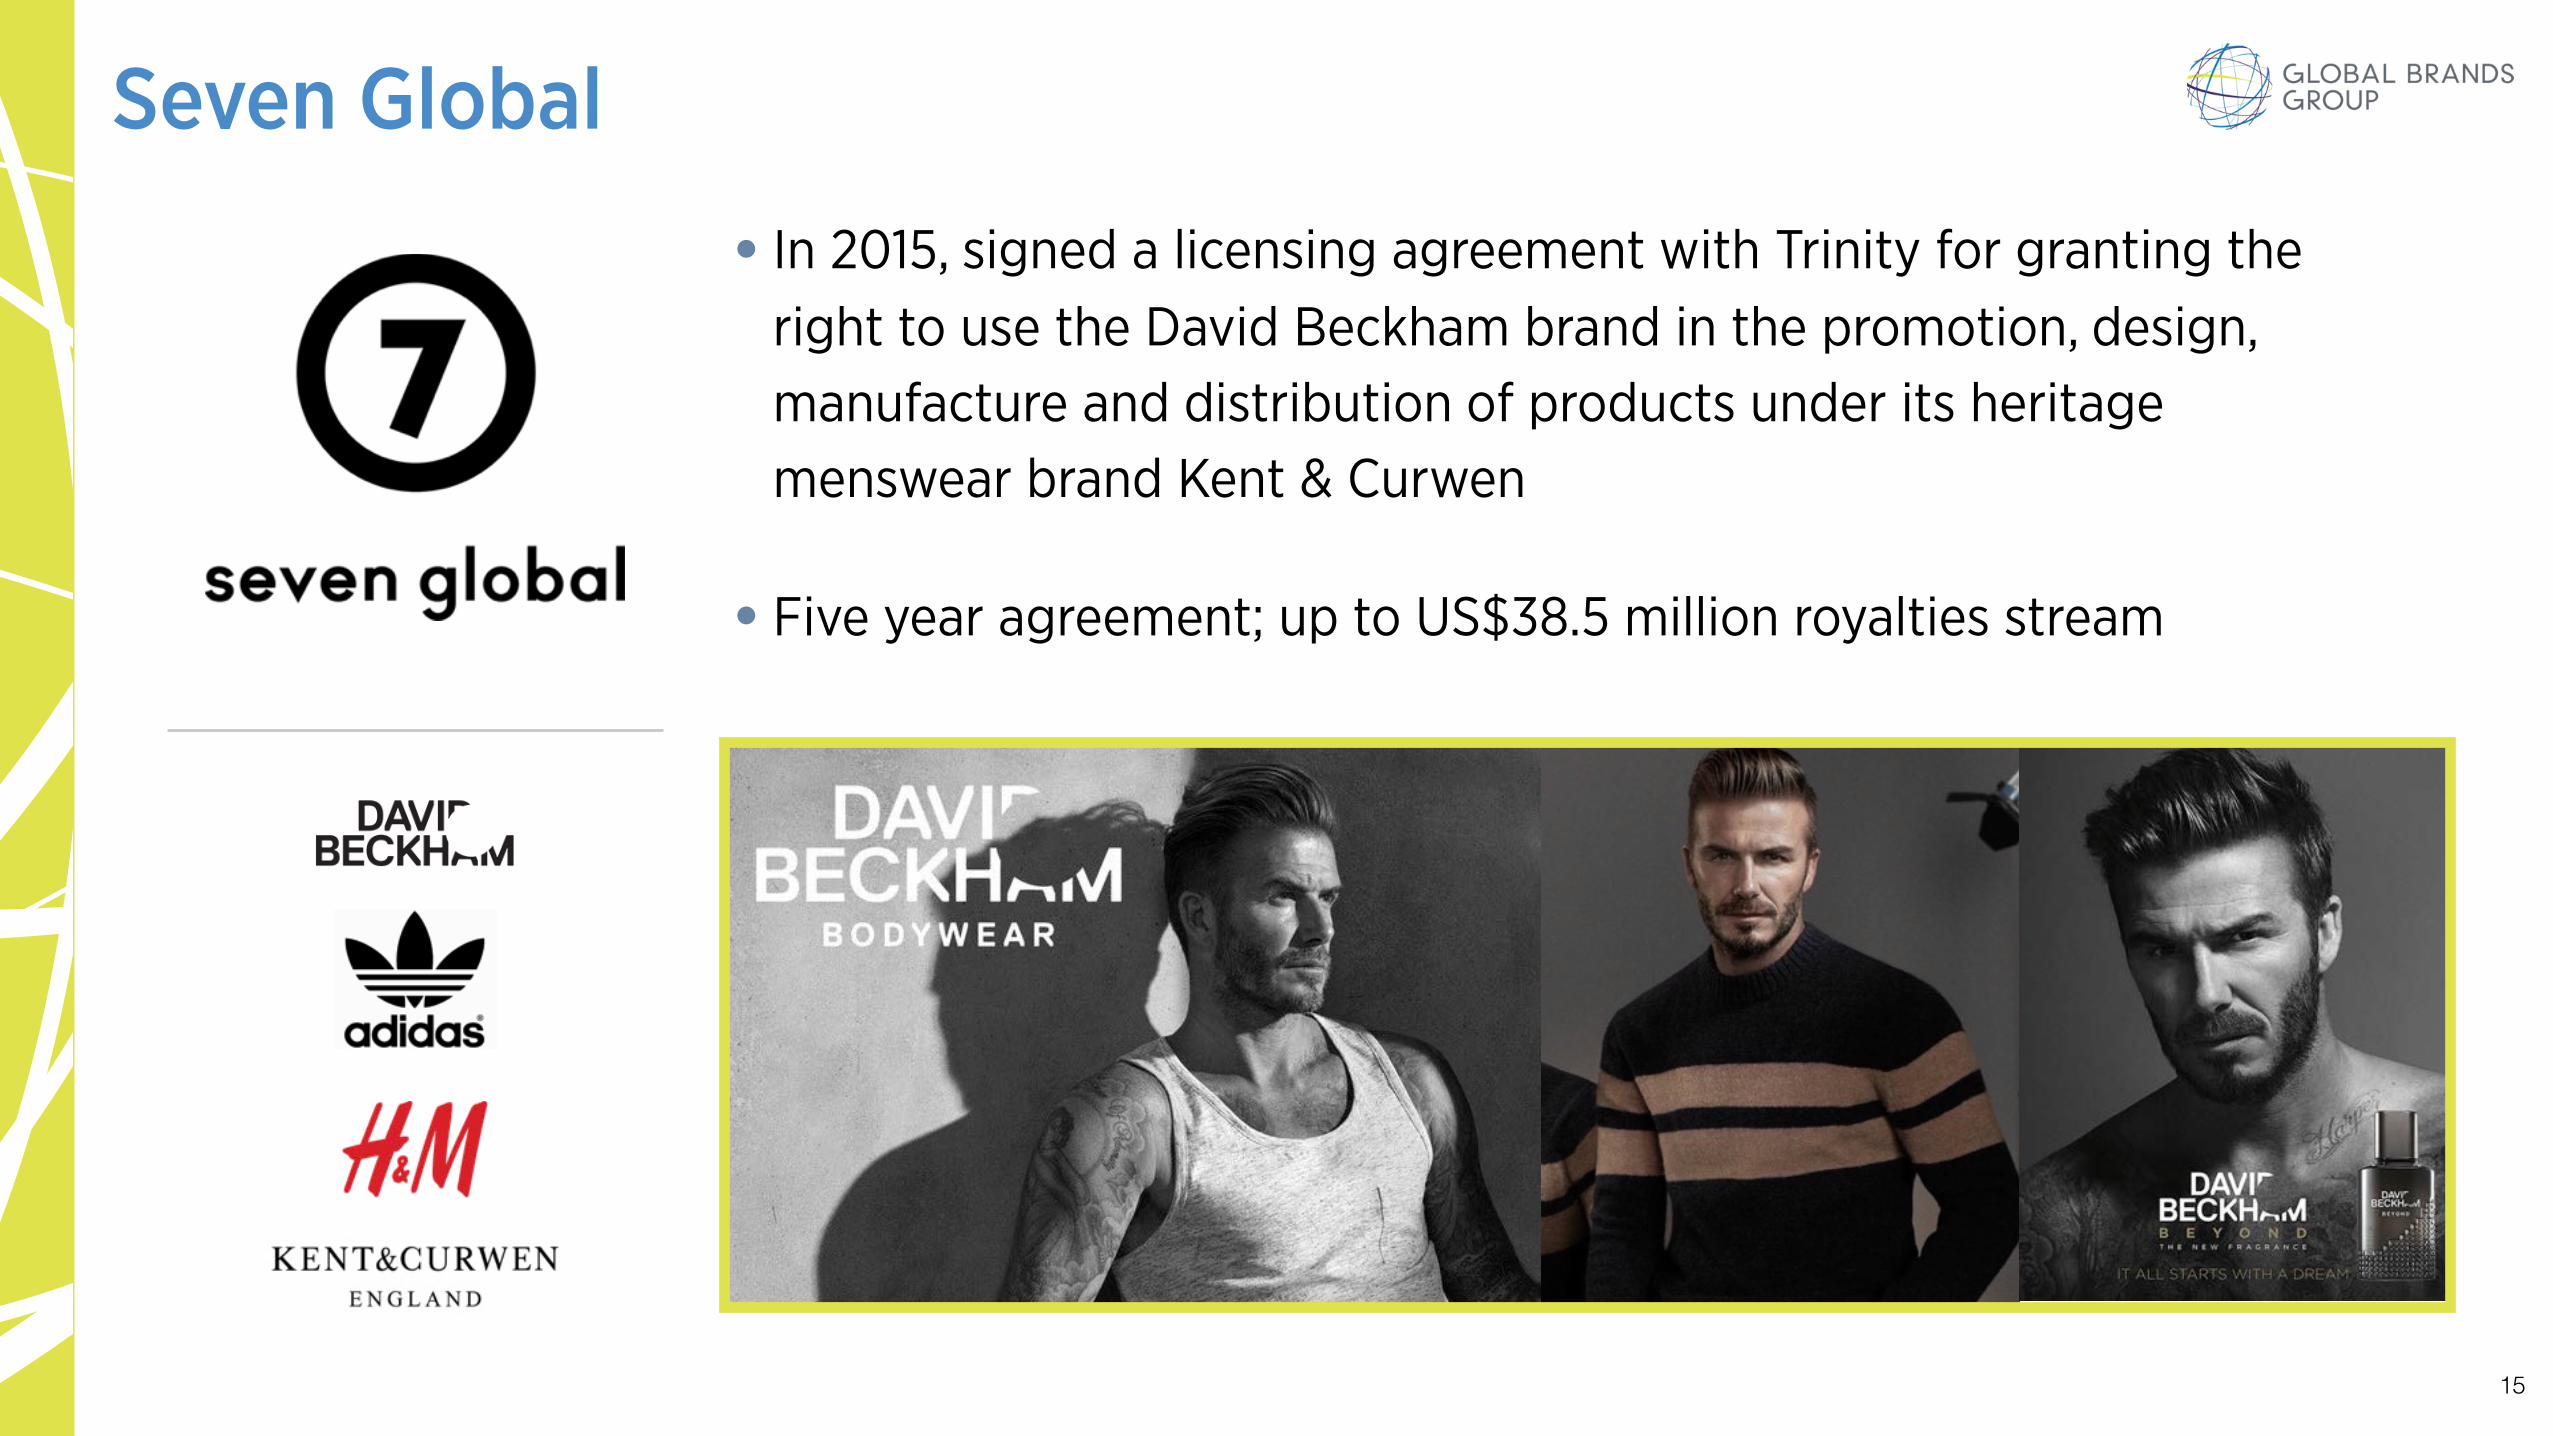
Seven Global
• In 2015, signed a licensing agreement with Trinity for granting the right to use the David Beckham brand in the promotion, design, manufacture and distribution of products under its heritage menswear brand Kent & Curwen
• Five year agreement; up to US$38.5 million royalties stream
15

Change of Year End
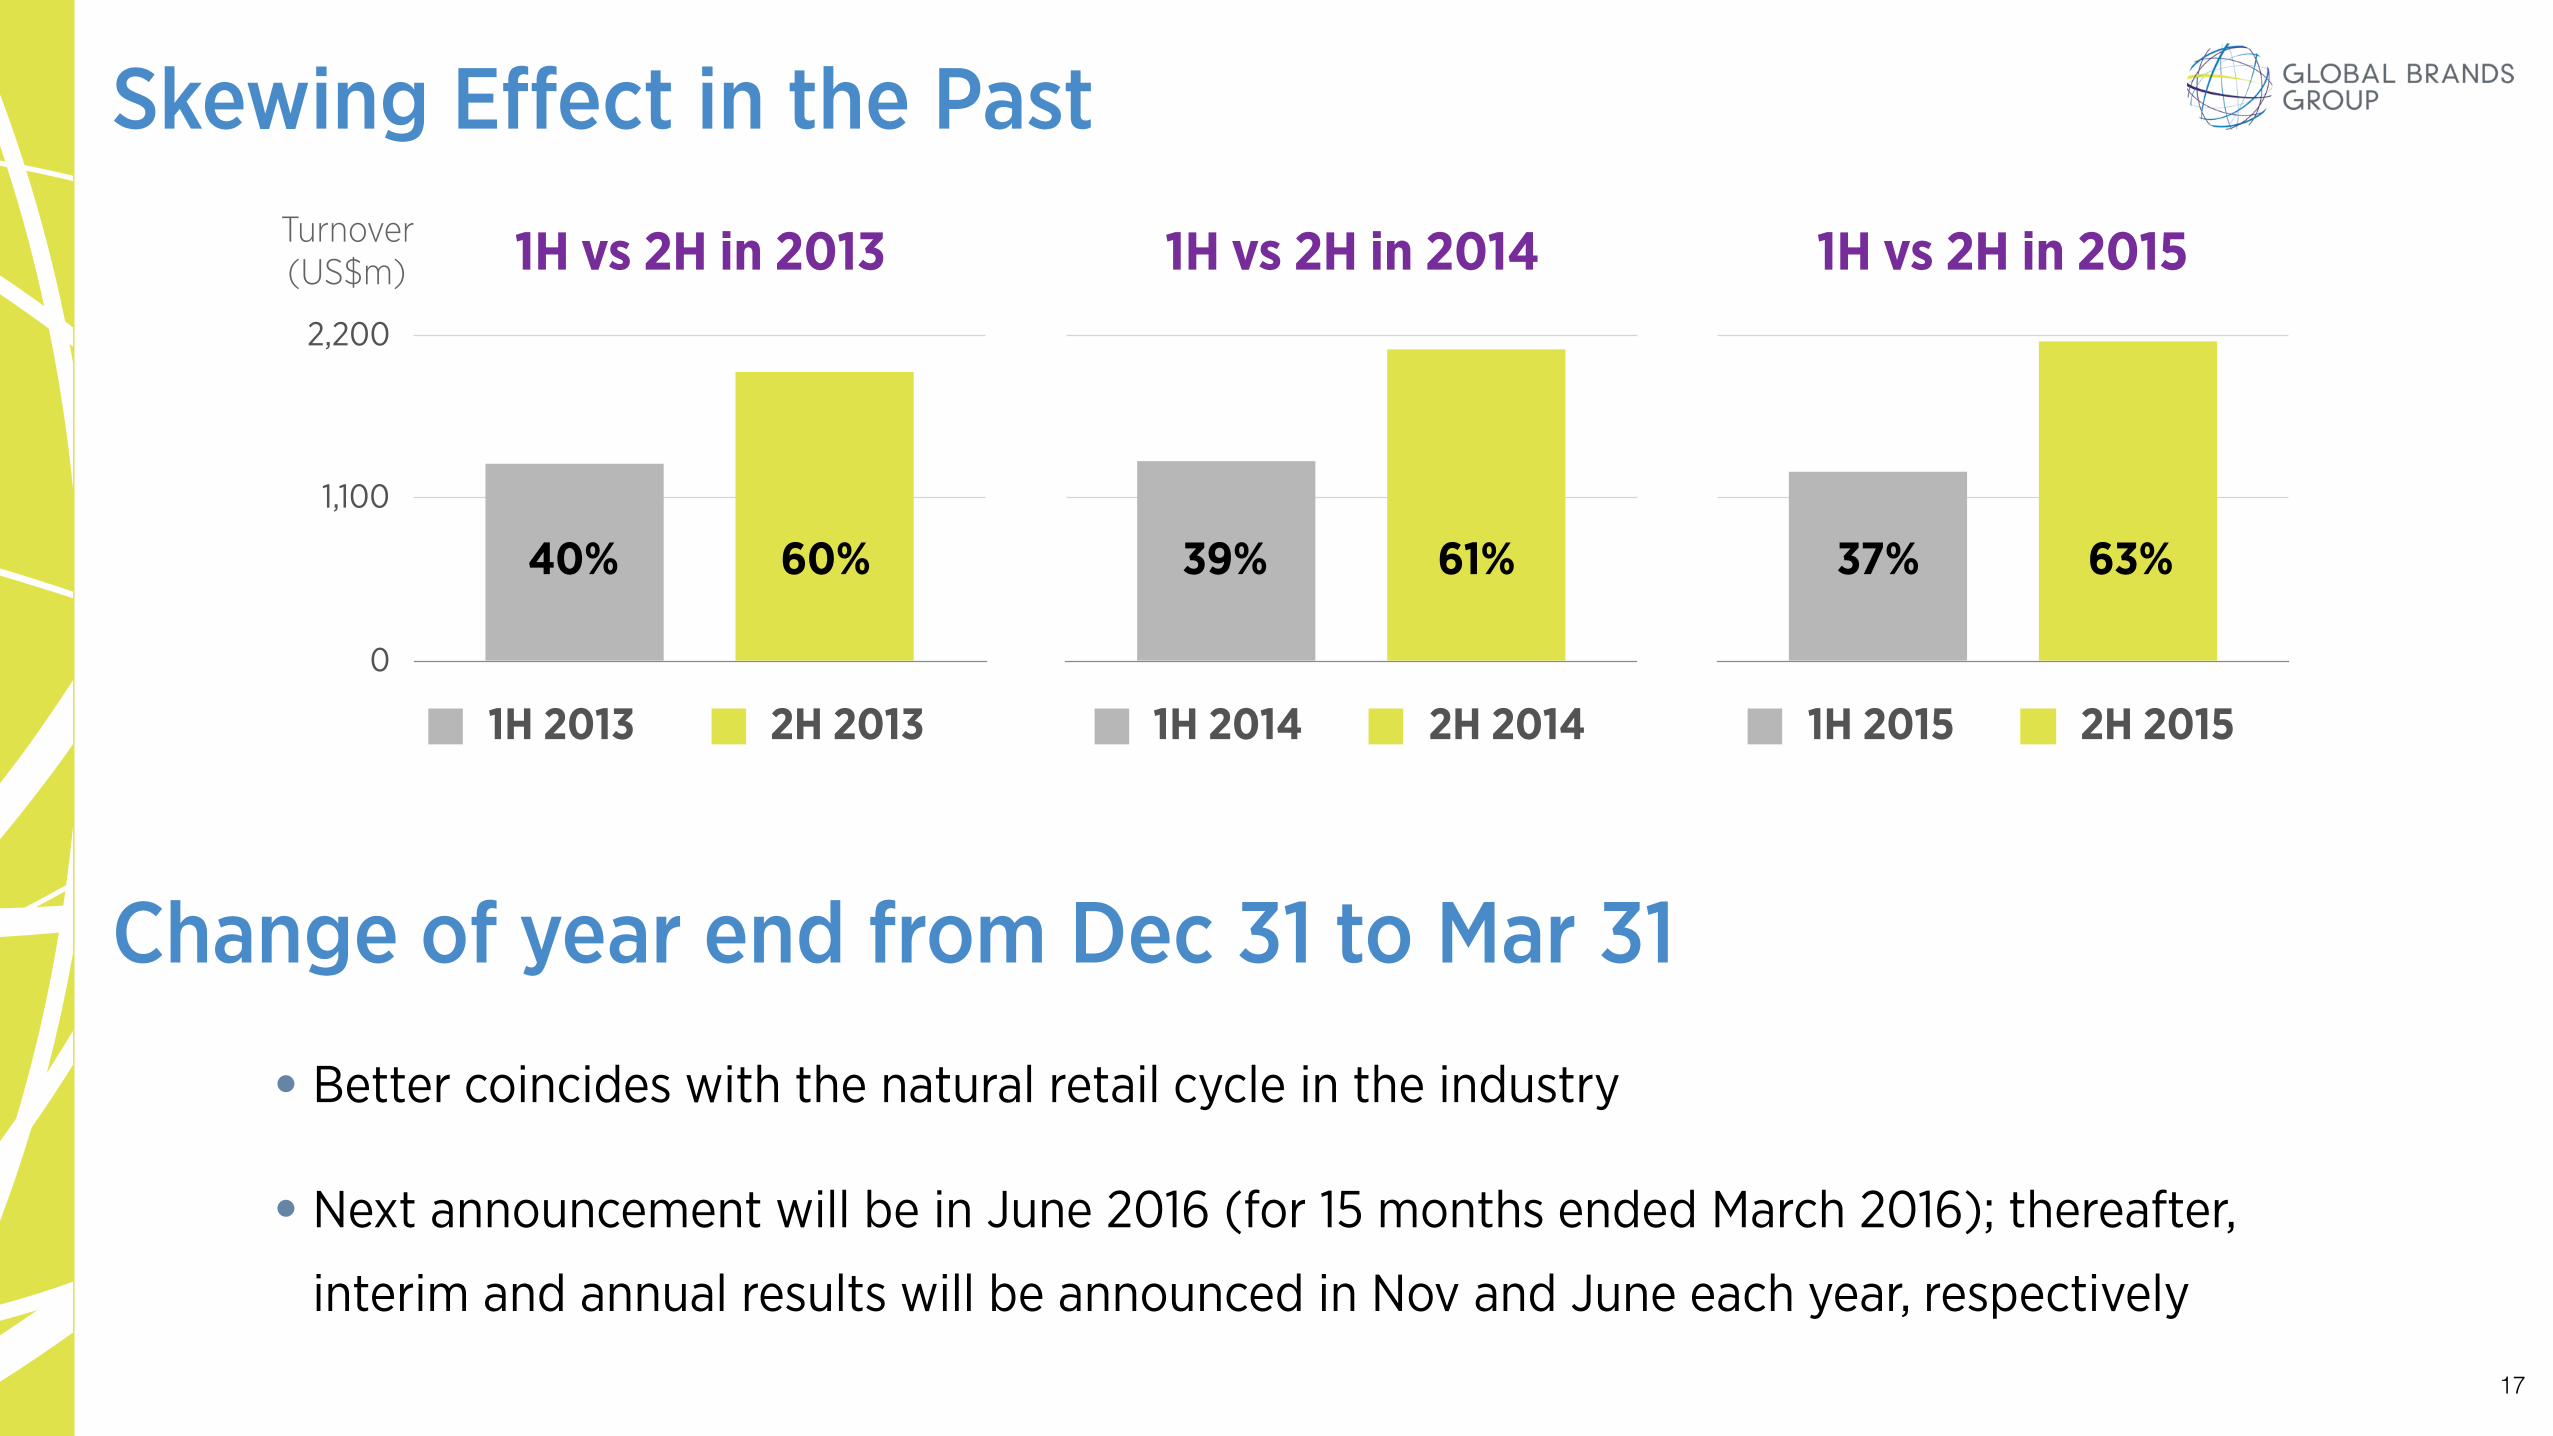
Skewing Effect in the Past
1H vs 2H in 2013 1H vs 2H in 2014 1H vs 2H in 2015
Change of year end from Dec 31 to Mar 31
0
1,100
2,200
1H 2013 2H 2013
Turnover (US$m)
40% 60%
1H 2014 2H 2014
39% 61%
1H 2015 2H 2015
37% 63%
• Better coincides with the natural retail cycle in the industry
• Next announcement will be in June 2016 (for 15 months ended March 2016); thereafter, interim and annual results will be announced in Nov and June each year, respectively
17

Outlook

•Macroeconomic conditions to remain challenging
- Consumer spending in the US affected by the unseasonably warm winter, and the effect continues into this year
- Europe faces ongoing political and economic structural challenges; however, continued stabilization of the Euro bodes well
- While slower growth in China likely to remain a focal point, overall underlying trends in Asia, including China, remain promising (e.g. healthy domestic consumption, growth of middle class, focus on children)
• Industry trends pointing towards increasing appetite for affordable luxury; further fueled by greater online and mobile access of consumers to a wide range of brands
• Topline expected to perform well due to no further impact from exit of underperforming brands, considerable contribution of new brands as well as organic growth
•Margins to continue to trend up, as operational synergies further improve cost efficiencies across our global platform
Outlook
19
Disclaimer
This document has been prepared by Global Brands Group Holding Limited (the “Company”) solely for selected recipients for information purposes only. These materials are given to you solely for your own use and information and no part of this document may be copied, reproduced, redistributed or passed on, directly or indirectly, to any other person (whether within or outside your organization/firm) or published, or otherwise disclosed, in whole or in part, in any manner and for any purpose without the prior consent of the Company. Any forwarding, distribution or reproduction of this document in whole or in part is unauthorized.
The information contained in this document has not been independently verified. No representation, warranty or undertaking, express or implied, is made by the Company or any of its affiliates, advisers or representatives as to, and no reliance should be placed on, the fairness, accuracy, completeness or correctness of such information or opinions presented or contained herein. The information contained in this document should be considered in the context of the circumstances prevailing at the time, is subject to change without notice and the Company makes no undertaking to update the information in this document to reflect any developments that occur after the date of the presentation. It is not the Company’s intention to provide, and you may not rely on these materials as providing, a complete or comprehensive analysis of the Company, or its financial or trading position or prospects. Neither the Company nor any of its affiliates, advisers or representatives accept any responsibility or have any liability whatsoever (in negligence or otherwise) for any loss howsoever arising from any use of this document or its contents or otherwise arising in connection with this document.
This document may contain statements that reflect the Company’s current intent, beliefs and expectations about the future as of the respective dates indicated herein. These forward-looking statements are not guarantees of future performance and are based on a number of assumptions about the Company’s operations and factors beyond the Company’s control and are subject to significant risks and uncertainties, and accordingly, actual results may differ materially from those described in these forward-looking statements. Neither the Company nor any of its affiliates, advisers or representatives has any obligation, nor do they undertake, to update these forward-looking statements for any events or developments including the occurrence of unanticipated events that occur subsequent to such dates.
This document does not constitute, in whole or in part, an offer for subscription or for sale or invitation to purchase or subscribe for any securities for sale in the United States, Hong Kong or anywhere else. No part of this document shall form the basis of or be relied upon in connection with any contract or commitment whatsoever. Specifically, and without limiting the foregoing, these materials do not constitute, nor are they intended to constitute (i) a “prospectus’ within the meaning of the U.S. Securities Act of 1933, as amended, and the regulations enacted thereunder, or (ii) a prospectus in connection with the offering for sale or subscription of shares pursuant to the Companies (Winding Up and Miscellaneous Provisions) Ordinance (Chapter 32 of the Laws of Hong Kong) or the Companies Ordinance (Chapter 622 of the Laws of Hong Kong). No securities may be sold in the United States without registration with the United States Securities and Exchange Commission except pursuant to an exemption from, or in a transaction not subject to, such registration. The Company has not registered and does not intend to register any shares or conduct a public offering of securities in the United States, Hong Kong or anywhere else. The distribution of this document in other jurisdictions may be restricted by law, and persons into whose possession this document comes should inform themselves of, and observe, any such restrictions.

2015 Second Interim
Results Announcement for 12 Months Ended 31 Dec 2015
Analyst Meeting Feb 25, 2016