GBE kompakt 1 2015 - RKI
21
KOMPAKT GBE Vol. 6, No.1 /2015 Facts and Trends from Federal Health Reporting Key messages ▶ The great majority of children and adolescents in Germany grow up healthy. ▶ With regard to physical illnesses that frequently occur in childhood and adolescence, only minor differences are to be determined depending on social status. ▶ Children and adolescents from the low status group have an increased risk of having an impaired general state of health and of mental health problems. ▶ Lack of exercise, obesity, smoking and other behaviour-related risks are more widespread in the low status group. ▶ Low social status goes hand-in- hand with low uptake of early illness detection programmes for children and dental check- ups. ▶ The differences specific to social status in the health of children and adolescents place great demands with regard to prevention, health promotion and health care. Growing up healthy – What significance does social status have? Germany is among the richest countries in the world and has a well-developed social security system. Nevertheless, even in this country, children and young people grow up under very different conditions. One example of this is that approximately 2.5 million children and adolescents in Germany are exposed to the risk of poverty, i. e. are living in households that have less than 60 % of national average income at their disposal. Therefore, almost a fifth of the population up to the age of 18 is growing up in poverty or is threatened by poverty (Der Paritätische Gesamtverband 2015; Statistische Ämter des Bundes und der Länder 2015). In addition, attention is to be drawn to the close relationship between social background and educational opportunities. The influence brought to bear by the parental home can already be seen in the choice of day nursery and is even more evident in subsequent transitions in the education system, particularly the change to a secondary school and the access to technical colleges and universities (Krüger et al. 2011; Autorengruppe Bildungsberichterstattung 2014). The social inequality of living conditions and opportunities to participate is reflected in the health of the younger generation. Already, early health problems and developmental delays are being established to an increasing degree in children from socially disadvantaged families (Landesamt für Umwelt, Gesundheit und Verbraucherschutz Brandenburg 2013; Senatsverwaltung für Gesundheit und Soziales Berlin 2013). The same is true for mental health problems and psychosomatic complaints (Richter 2005; Lampert 2011). With regard to health behaviour, it is to be observed, amongst other things, that socially disadvantaged children and adolescents engage in sport less often, have a less healthy diet and a higher proportion are overweight (Lampert, Kurth 2007; RKI 2010). Apart from this, they smoke more and are more exposed to passive smoking (Lampert 2008). These research results are to be viewed against the backdrop that health impairments and risks that occur in early years often have long-term effects and can still have a bearing on the chances of being healthy in middle and old age (Dragano et al. 2010; Lampert 2010). One important database for describing the state of health of young persons is the »German Health Interview and Examination Survey for Children and Adolescents (KiGGS)« (Kurth 2007; Kurth et al. 2008). More than 17.000 children and adolescents from the whole of Germany participated in the baseline survey conducted by the Robert Koch Institute (RKI) on behalf of the Federal Ministry of Health (BMG) and the Federal Ministry of Education and Research (BMBF) between 2003 and 2006. Since the study participants, who were aged between 0 and 17 years, were interviewed as well as examined physically in study centres set up for this particular purpose, it was possible to gain extensive information
Transcript of GBE kompakt 1 2015 - RKI

K O M P A K TGBE
Vol. 6, No.1 /2015
Facts and Trends from Federal Health Reporting
Key messages
▶ The great majority of children and adolescents in Germany grow up healthy.
▶ With regard to physical illnesses that frequently occur in childhood and adolescence, only minor differences are to be determined depending on social status.
▶ Children and adolescents from the low status group have an increased risk of having an impaired general state of health and of mental health problems.
▶ Lack of exercise, obesity, smoking and other behaviour-related risks are more widespread in the low status group.
▶ Low social status goes hand-in-hand with low uptake of early illness detection programmes for children and dental check-ups.
▶ The differences specific to social status in the health of children and adolescents place great demands with regard to prevention, health promotion and health care.
Growing up healthy –What significance does social status have?
Germany is among the richest countries in the world and has a well-developed social security system. Nevertheless, even in this country, children and young people grow up under very different conditions. One example of this is that approximately 2.5 million children and adolescents in Germany are exposed to the risk of poverty, i. e. are living in households that have less than 60 % of national average income at their disposal. Therefore, almost a fifth of the population up to the age of 18 is growing up in poverty or is threatened by poverty (Der Paritätische Gesamtverband 2015; Statistische Ämter des Bundes und der Länder 2015). In addition, attention is to be drawn to the close relationship between social background and educational opportunities. The influence brought to bear by the parental home can already be seen in the choice of day nursery and is even more evident in subsequent transitions in the education system, particularly the change to a secondary school and the access to technical colleges and universities (Krüger et al. 2011; Autorengruppe Bildungsberichterstattung 2014).
The social inequality of living conditions and opportunities to participate is reflected in the health of the younger generation. Already, early health problems and developmental delays are being established to an increasing degree in children from socially disadvantaged families (Landesamt für Umwelt, Gesundheit und Verbraucherschutz Brandenburg 2013; Senatsverwaltung für Gesundheit und Soziales Berlin 2013). The same is true for mental health problems and psychosomatic complaints (Richter 2005; Lampert 2011). With regard to health behaviour, it is to be observed, amongst other things, that socially disadvantaged children and adolescents engage in sport less often, have a less healthy diet and a higher proportion are overweight (Lampert, Kurth 2007; RKI 2010). Apart from this, they smoke more and are more exposed to passive smoking (Lampert 2008). These research results are to be viewed against the backdrop that health impairments and risks that occur in early years often have long-term effects and can still have a bearing on the chances of being healthy in middle and old age (Dragano et al. 2010; Lampert 2010).
One important database for describing the state of health of young persons is the »German Health Interview and Examination Survey for Children and Adolescents (KiGGS)« (Kurth 2007; Kurth et al. 2008). More than 17.000 children and adolescents from the whole of Germany participated in the baseline survey conducted by the Robert Koch Institute (RKI) on behalf of the Federal Ministry of Health (BMG) and the Federal Ministry of Education and Research (BMBF) between 2003 and 2006. Since the study participants, who were aged between 0 and 17 years, were interviewed as well as examined physically in study centres set up for this particular purpose, it was possible to gain extensive information
GBE kompakt – 1/2015 2
regarding the physical and psychosocial health of children and adolescents. A core finding of the KiGGS baseline study was the fact that social status has a considerable influence on state of health in childhood and adolescence. It was particularly striking that the influence of social status is noticeable in almost all relevant developmental and health-related areas in childhood and adolescence (RKI, BZgA 2008; RKI 2010; Lampert 2011).
Meanwhile the KiGGS study is being continued as a longitudinal study (Lange et al. 2014). To this end, the RKI conducted an initial telephone follow-up survey in the years 2009 to 2012 (KiGGS Wave 1), in which all participants of the KiGGS baseline study were invited to participate. In order to also be able to draw conclusions using the data from the recent survey with regard to children aged between 0 and 6 years, a new random sample was taken. That included, a total of 16.447 girls and boys aged between 0 and 24 years took part in KiGGS wave 1. For the age range 0 to 17 years old, information is available on 12.368 young girls and boys.
The first results from KiGGS Wave 1 were published in the summer of 2014 in a special issue of the journal »Bundesgesundheitsblatt – Gesundheitsforschung – Gesundheitsschutz« (Volume 57, Issue 7). In part, the contributions - which addressed specific topics regarding child and adolescent health - already reported on links with social status. The same is true of the topic-related KiGGS fact sheets published at regular intervals within the framework of federal health reporting (RKI 2015a). The aim of this issue of GBE kompakt is to show the significance of social status with regard to the health of children and adolescents on the basis of a synoptic and extended presentation of study results. To this end, numerous indicators regarding
physical and mental health, health behaviour and associated risk factors, as well as health-related care are examined. Since KiGGS Wave 1 was a telephone survey, results from the KiGGS baseline study, which in addition to the survey also included physical examination components allowing for more comprehensive analyses, are also included in part. Otherwise it would not have been possible to make reliable statements with regard to individual themes that are relevant from the point of view of public health, such as the prevalence of people being overweight and obese.
Result presentation is based on prevalences (relative frequencies expressed as a percentage) expressed separately for each of the three status groups. In the appendix there are results tables which show the 95 % confidence intervals relating to the prevalences stated in the text (Tables 1 – 3). In addition, age-adjusted odds ratios with 95% confidence intervals are also stated in the same, which express by which factor the statistical chance of the respective health outcome occurring is increased in the lower or middle status group in relation to the high status group, which is defined as reference category. Representative statements are possible because all analyses have been conducted using a weighting factor which corrects deviations within the random sample from the population structure (as of 31/12/2010) with regard to age, gender, residential region, nationality, community type and educational status of the head of the household (Lange et al. 2014).
Physical and Mental HealthGeneral State of HealthIn order to be able to make statements regarding the general state of health of children and adolescents, many surveys include the subjective opinion of the parents or even of the young persons themselves. The subjective judgement of health not only reflects existing illnesses and complaints
German Health Interview and Examination Survey for Children and Adolescents (KiGGS Wave 1)
Data owner: Robert Koch InstituteGoals: Provision of updated data on the
state of health of children and adolescents in Germany, analysis of temporal developments and trends, longitudinal observations
Survey method: Computer-assisted telephone interviews (CATI)
Population: Population of Germany aged 0 to 17 years (cross-sectional and trend analyses)
Sample: 12.368 (cross-section, trend)Response: 38,8 % (first-time invitees) or 72,9 %
(returning participants) Survey period: June 2009 to June 2012
For more Information visit www.kiggs-studie.de
Definition and Measurment of Social Status Social status describes the position within the social hierarchy or on the social stepladder. Low or high social status are respectively associated with either disadvantaged or favoured living conditions and chances of social participation (Hradil 2001; Lampert, Kroll 2009). In the KiGGS study, social status is measured multi-dimensionally and in addition, reference is made to details provided by parents regarding schooling and vocational qualification, their professional status and need-weighted, net household income.
Using an algorithm that is described in detail at another point, a status index is initially calculated in order to then define three status groups where the low and the high status group each comprise around 20 % of the study population with the medium status group comprising 60 % (Lampert et al. 2014a).

1/2015 – GBE kompakt 3
as well as well-being at school (Ellert et al. 2014). An index was formed based on the answers to ten individual questions, then the index values were transformed into t-values (mean value 50, standard deviation 10). Using the information provided by adolescents themselves as a basis, the vast majority indicate either a very good or good health-related quality of life. Girls and boys barely differ in their assessments. One exception to this does exist in that boys aged between 14 and 17 years assess their health-related quality of life as being better than girls of the same age do. Viewed overall, social status does not have a significant influence on health-related quality of life either among girls or boys. However, disparities to the disadvantage of the low status group are to be seen if the 11 to 13 year-old age group is examined separately (Ellert et al. 2014).
Physical illnessesPhysical illnesses were surveyed in KiGGS Wave 1 using a variety of instruments. Amongst other things, the parents of participating children and adolescents were asked whether their child had one or several long-term, chronic illnesses or health problems (Neuhauser et al. 2014). According to parental information, this is true in a total of 16.2 % of 0 to 17 year-olds with boys being more frequently affected than girls (17.9 % compared to 14.3 %). No significant differences can be established when comparing young persons from the low and high status groups. Girls from the medium status group, however, are somewhat more frequently concerned with long-term, chronic health problems than girls from the high status group.
In addition to the above, information on selected chronic and vaccine-preventable diseases was collected as part of KiGGS Wave 1 (Neuhauser et al. 2014). These include the allergic conditions of bronchial asthma, hay-fever and neurodermatitis, which often occur in children and adolescents and can have adverse effects upon health-related quality of life (Jernelöv et al. 2013; Schmitz et al. 2014). 6.3 % of children and adolescents aged between 0 and 17 years have already had bronchial asthma and 4.1 % have had it in the last 12 months. Hay fever and neurodermatitis are even more widespread, which can be seen from the lifetime prevalence (12.6 % and 14.3 %) as well as the 12-month prevalence (9.1 % and 6.0 %). Bronchial asthma and hay fever occur more frequently in boys than in girls, whilst with regard to the occurrence of neurodermatitis, no gender-specific differences can be observed.
Analyses taking social status into account reveal that children and adolescents from the high status group are more frequently affected by neurodermatitis than young persons from the medium and low status group. In contrast, it can be seen that children and adolescents from the low status group are affected to a greater degree by bronchial asthma. However this difference is only statistically significant when considering the 12-month prevalence.
In addition, the results from KiGGS Wave 1 indicate higher rates of measles in children and adolescents from
but is also based on perceptions and evaluations of health and health-related quality of life (Erhart et al. 2009). Furthermore, studies show that subjective evaluation of health influence health behaviour and the uptake of health services (Vingilis et al. 2007; Foti, Eaton 2010).
In KiGGS Wave 1, parental assessment of the general state of health of their children, as well as the self-assessment of 11 to 17 year-olds was part of the survey (Lampert et al. 2014a). In line with a formulation recommended by the WHO (De Bruin et al. 1996), parents were asked, »How would you describe the general health of your child?« For the purpose of surveying the children, the formulation of the question was adapted appropriately. The possible answers for each question were: »Very good«, »Good«, »Fair«, »Poor«, »Very Poor«. Using the parental assessments, 51.7 % of children and adolescents aged between 3 and 17 years have very good and a further 42.0 % have good general health. Only in 6.3 % of young persons was their health assessed as being fair, poor or very poor by the parents. The difference between girls and boys in this regard is very slight (6.5 % compared to 6.1 %).
Parents with low social status most frequently assess the health of their children as being only fair to very poor. This is evident for both girls and boys. Since clear differences also stand out in the estimation of parents in the medium and high status groups it is possible to speak of a »social gradient« with regard to general state of health: The lower the social status of the family, the more frequently the general state of health of the children is judged as being only fair, poor or very poor (Figure 1).
Health-related quality of lifeFor the purpose of recording health-related quality of life the KIDSCREEN-10-questionnaire was used in KiGGS Wave 1, which provides details regarding physical and mental well-being, relationships with parents and friends
Figure 1General health (»fair« to »very poor«) in 3 to 17 year-old children and adolescents according to social statusData source: KiGGS Wave 1 (2009 – 2012)
Percent
BoysGirls
low highmiddle
5
10
15
20
25
Social status

GBE kompakt – 1/2015 4
With regard to accidents in the past 12 months, no differences are to be observed between the status groups. No differences were to be established with regard to the locations in which the accidents occurred either. In all status groups, accidents occur most frequently at home, followed by care and education establishments and playgrounds/sports facilities. However, a greater proportion of children and adolescents from the low status group are treated in hospital and for a longer period - should they suffer accidental injury - than individuals of the same age from the high status group (Saß et al. 2014).
The results of the KiGGS baseline study in addition point to status-specific differences with regard to the measures taken to protect against accidents. 62.7 % of children and adolescents from families with high social status wear a helmet when cycling compared to 46.3 % of those of the same age from the low status group. There is also an equally clear expression of the status-specific differences in the use of protection for inline skating at 83.1 % compared to 61.9 % (Kahl et al. 2007; RKI, BZgA 2008).
Mental health problemsMental health problems are among those areas of the state of health of children and adolescents that have received increased attention in recent years. They are often linked with adverse effects on daily routine and social contact and can limit the developmental opportunities of the young person, for example with regard to schooling and vocational training (Hölling et al. 2007).
In KiGGS Wave 1, in order to record mental health problems, the »Strengths and Difficulties Questionnaire (SDQ)« was used, a screening instrument, which amongst other things, provides indications of »emotional symptoms«, »conduct problems«, »hyperactivity/inattention« and »peer relationship problems« (Goodman 1997). From the information gathered regarding these four areas, it is possible to calculate a total difficulties score. Children and adolescents whose total difficulty score means that they can be classified as borderline or abnormal using the cut-off values of a German norm sample (Woerner et al. 2002) are summarised to a risk group (Hölling et al. 2014). According to this it can be assumed that in 20.2 % of 3 to 17 year-old children and adolescents there is a risk of mental health problems. At 23.4 % boys are more frequently affected than girls at 16.9 %. One third of children and adolescents from the low status group are to be assigned to the risk group, whereas this is only true of one fifth of young persons from the medium and one tenth of those from the high status group (33.5 %, 19.0 %, and 9.8 %). This social gradient is the same for both girls and boys (Figure 2).
For information about Attention Deficit Hyperactivity Disorder (ADHD) it is possible to refer back to parental statements regarding a diagnosis of their child by a doctor or psychologist as well as using the details from the SDQ questionnaire (Schlack et al. 2014). ADHD has been diagnosed at some point in 5.0 % of children and adolescents
the low status group. Young persons from the medium status group are also more frequently affected than those from the high status group. Chickenpox on the other hand occurs less frequently in the low status group than in the high status group. With regard to the distribution of whooping cough there are no significant differences between the status groups. In KiGGS Wave 1, epilepsy, febrile convulsions, migraine, heart disease and diabetes were investigated as additional illnesses (Neuhauser et al. 2014). To date, however, no analyses are available regarding status-specific differences on these illnesses, which occur far less often than those mentioned beforehand.
An even more comprehensive list of childhood and adolescent illnesses was surveyed within the scope of the KiGGS baseline study (Kamtsiuris et al. 2007; Schlaud et al. 2007). With regard to a multitude of acute and chronic diseases parents were asked whether these had ever occurred in the children, whether they had also occurred in the past 12 months and if applicable how frequently the children had to deal with the illnesses. For most acute diseases it was not possible to establish a link to social status as part of the KiGGS baseline study.
In line with KiGGS Wave 1 the exceptions were chickenpox, which occurred somewhat more frequently in children and adolescents from the high status group; the same being true of colds, conjunctivitis and scarlet fever. In contrast, however, young persons from the low status group were affected to a greater extent by measles and tonsillitis. With regard to chronic diseases it was only possible to establish an influence of social status for neurodermatitis and scoliosis. Both diseases occurred more among children and adolescents from the high status group.
Accidental injuriesAccidents and the resulting injuries represent the most frequent reason for hospitalisation and by far the most significant cause of death in childhood and adolescence (Varnaccia et al. 2014). From the point of view of public health, accident prevention is therefore of great importance - not least because of the potential preventability of numerous accidents (BAG 2007; Saß et al. 2014).
KiGGS Wave 1 made it possible to gain a comprehensive picture of accident occurrence amongst children and adolescents in Germany, whereby the emphasis of the survey was on recording accidental injuries that occurred within the last 12 months and required medical treatment. In this context, enquiries were also made regarding accident location, accident events and the duration of any hospital treatment (Saß et al. 2014).
In the last 12 months leading up to the survey, 15.5 % of the children and adolescents aged between 1 and 17 years had suffered at least one accidental injury requiring medical attention, whereby boys were somewhat more frequently affected at 17.0 % than girls at 14.0 %. Of those children and adolescents who suffered an injury requiring medical treatment, 12.3 % had to spend at least one night in hospital (girls: 13.5 %, boys: 11.4 %).

1/2015 – GBE kompakt 5
between 3 and 17 years-old. This clearly affects boys more frequently at 8.0 % than it does girls at 1.7 %. As is the case with the prevalence of mental health problems in general, clear social differences can be seen with regard to the lifetime prevalence of ADHD. For children and adolescents from the low status group this figure is 8.1 %. The comparative values for young persons from the medium and high status group are 4.5 % and 3.0 % respectively.
Eating disorders represent a separate subgroup within mental and behavioural disorders. Even though different syndromes such as anorexia and bulimia nervosa may be hiding behind the term »eating disorder«, the common factor is that for those affected, the immediate need to eat has become a problem with often serious physical and social consequences (Gerlinghoff, Backmund 2006). In conjunction with the screening instrument used as part of the KiGGS baseline study (SCOFF questionnaire) indications of eating disorder behaviours can be identified (Hölling, Schlack 2007). Of the 11 to 17 year-old adolescents, a total of 21.9 % displayed symptoms of eating disorders. This clearly affected girls at 28.9 % more frequently than boys at 15.2 %. Overall adolescents of low social status were almost twice as likely to be affected as those from the high status group (27.6 % compared to 15.6 %). The social variations were similarly significant for girls and boys (Hölling, Schlack 2007).
Experiences of violenceIn the KiGGS baseline study, 11 to 17 year-old adolescents were also surveyed with regard to experiences of violence in the past 12 months. Experiences of violence rank among those serious risk factors to health development in childhood and adolescence both with regard to physical and mental health (Schlack, Hölling 2007). A distinction is to be made here between experience as a perpetrator and experience as a victim, even though many perpetrators
are also victims of violence and vice versa. According to the data of the KiGGS baseline study, around a quarter of adolescents had experienced violence within the past 12 months. At 32.4 % compared with 17.5 % the proportion of boys was almost twice that of girls. The analyses differentiated according to social status clearly show that girls and boys of low social status not only perpetrated violence more frequently than their contemporaries from the high status group, they were also more frequently the victims of violence (Schlack, Hölling 2007).
Health behaviour and associated risk factorsDietA balanced supply of energy and nutrients is an important prerequisite for growing up healthy (Mensink et al. 2007). In this context the regular consumption of fruit and vegetables is important since these foodstuffs contain large quantities of vitamins, trace elements, minerals, dietary fibre and secondary plant substances (Boeing et al. 2012).
In KiGGS Wave 1 the parents of 3 to 10 year-old children were asked details regarding the fruit and vegetable consumption of their children. Adolescents aged between 11 and 17 years were surveyed directly. 61.1 % - the majority of children and adolescents in Germany eat fruit daily and 43.5 % of young persons eat vegetables daily. Girls will eat daily fruit and vegetables more often than boys. Whilst in total 49.3 % of children and adolescents from the low status group eat fruit daily, this is true of 75.3 % of persons of the same age from the high status group. Also with regard to daily vegetable consumption there are clear status differences in favour of children and adolescents with high social status.
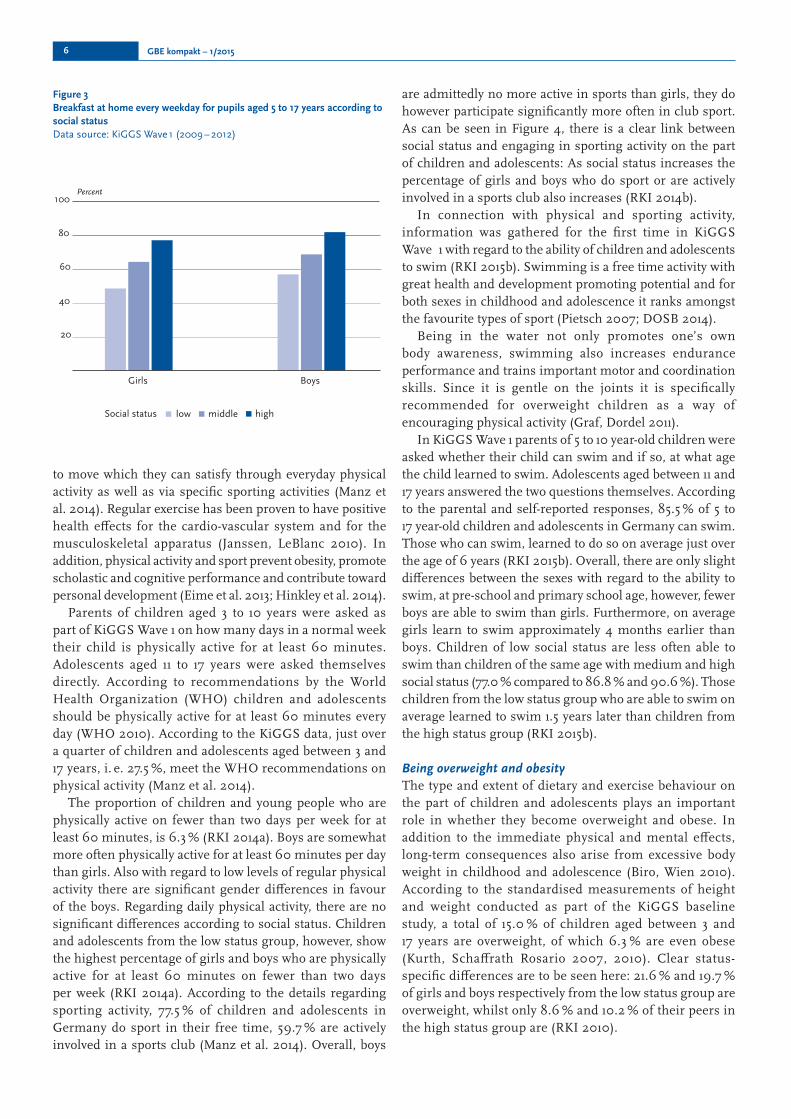
Daily breakfast with a preferably healthy selection of foods is another important component of a healthy diet (HBSC-Team Germany 2011). For children of school-age a regular breakfast is also important because it has been proven to help with attention and memory performance (Wesnes et al. 2003). In KiGGS Wave 1 the parents of school-aged children between the age of 5 and 10 were asked whether - and if yes, how often, their child would eat breakfast at home on weekdays. Pupils aged 11 to 17 years were asked directly themselves.
Two thirds of 5 to 17 year-old pupils report that they have breakfast at home every weekday. There are no considerable differences between the sexes. There is a clear social gradient with regard to the frequency of breakfast consumed at home: whilst only 53.2 % of pupils of low social status ate breakfast at home every weekday, this is true of 66.7 % of pupils of the same age with medium social status and 79.9 % of those with high social status (Figure 3).
Physical activity and sportIn addition to a balanced diet, sufficient physical activity plays an important role with regard to healthy development in childhood and adolescence. Children have a natural urge
Figure 2Mental health problems in 3 to 17 year-old children and adolescents according to social statusData source: KiGGS Wave 1 (2009 – 2012)
Percent
BoysGirls
10
20
30
40
50
low highmiddleSocial status
GBE kompakt – 1/2015 6
to move which they can satisfy through everyday physical activity as well as via specific sporting activities (Manz et al. 2014). Regular exercise has been proven to have positive health effects for the cardio-vascular system and for the musculoskeletal apparatus (Janssen, LeBlanc 2010). In addition, physical activity and sport prevent obesity, promote scholastic and cognitive performance and contribute toward personal development (Eime et al. 2013; Hinkley et al. 2014).
Parents of children aged 3 to 10 years were asked as part of KiGGS Wave 1 on how many days in a normal week their child is physically active for at least 60 minutes. Adolescents aged 11 to 17 years were asked themselves directly. According to recommendations by the World Health Organization (WHO) children and adolescents should be physically active for at least 60 minutes every day (WHO 2010). According to the KiGGS data, just over a quarter of children and adolescents aged between 3 and 17 years, i. e. 27.5 %, meet the WHO recommendations on physical activity (Manz et al. 2014).
The proportion of children and young people who are physically active on fewer than two days per week for at least 60 minutes, is 6.3 % (RKI 2014a). Boys are somewhat more often physically active for at least 60 minutes per day than girls. Also with regard to low levels of regular physical activity there are significant gender differences in favour of the boys. Regarding daily physical activity, there are no significant differences according to social status. Children and adolescents from the low status group, however, show the highest percentage of girls and boys who are physically active for at least 60 minutes on fewer than two days per week (RKI 2014a). According to the details regarding sporting activity, 77.5 % of children and adolescents in Germany do sport in their free time, 59.7 % are actively involved in a sports club (Manz et al. 2014). Overall, boys
are admittedly no more active in sports than girls, they do however participate significantly more often in club sport. As can be seen in Figure 4, there is a clear link between social status and engaging in sporting activity on the part of children and adolescents: As social status increases the percentage of girls and boys who do sport or are actively involved in a sports club also increases (RKI 2014b).
In connection with physical and sporting activity, information was gathered for the first time in KiGGS Wave 1 with regard to the ability of children and adolescents to swim (RKI 2015b). Swimming is a free time activity with great health and development promoting potential and for both sexes in childhood and adolescence it ranks amongst the favourite types of sport (Pietsch 2007; DOSB 2014).
Being in the water not only promotes one’s own body awareness, swimming also increases endurance performance and trains important motor and coordination skills. Since it is gentle on the joints it is specifically recommended for overweight children as a way of encouraging physical activity (Graf, Dordel 2011).
In KiGGS Wave 1 parents of 5 to 10 year-old children were asked whether their child can swim and if so, at what age the child learned to swim. Adolescents aged between 11 and 17 years answered the two questions themselves. According to the parental and self-reported responses, 85.5 % of 5 to 17 year-old children and adolescents in Germany can swim. Those who can swim, learned to do so on average just over the age of 6 years (RKI 2015b). Overall, there are only slight differences between the sexes with regard to the ability to swim, at pre-school and primary school age, however, fewer boys are able to swim than girls. Furthermore, on average girls learn to swim approximately 4 months earlier than boys. Children of low social status are less often able to swim than children of the same age with medium and high social status (77.0 % compared to 86.8 % and 90.6 %). Those children from the low status group who are able to swim on average learned to swim 1.5 years later than children from the high status group (RKI 2015b).
Being overweight and obesityThe type and extent of dietary and exercise behaviour on the part of children and adolescents plays an important role in whether they become overweight and obese. In addition to the immediate physical and mental effects, long-term consequences also arise from excessive body weight in childhood and adolescence (Biro, Wien 2010). According to the standardised measurements of height and weight conducted as part of the KiGGS baseline study, a total of 15.0 % of children aged between 3 and 17 years are overweight, of which 6.3 % are even obese (Kurth, Schaffrath Rosario 2007, 2010). Clear status-specific differences are to be seen here: 21.6 % and 19.7 % of girls and boys respectively from the low status group are overweight, whilst only 8.6 % and 10.2 % of their peers in the high status group are (RKI 2010).
Figure 3Breakfast at home every weekday for pupils aged 5 to 17 years according to social statusData source: KiGGS Wave 1 (2009 – 2012)
Percent
BoysGirls
20
40
60
80
100
lowSocial status highmiddle

1/2015 – GBE kompakt 7
Use of electronic mediaThe significance of changes in the free time behaviour of children and adolescents is being discussed in connection with lack of exercise and being overweight. Particular attention is being attached here to electronic screen media which are shaping the living environment of many young people to an increasing extent (mpfs 2014). According to the available study results, usage patterns of electronic screen media among children and adolescents are of significance to health, above all with regard to excessive duration of use, the type of use (passive v. interactive media usage), certain media content and due to the associated physical and mental consequences (Lampert et al. 2007; Finne, Bucksch 2014; Schlack et al. 2015).
In KiGGS Wave 1, adolescents aged between 11 and 17 years were surveyed with regard to time spent daily using television/video, computer/internet and games consoles. The respective response categories were: none at all; up to 1 hour; up to 2 hours; up to 3 hours; up to 4 hours and more than 4 hours (Manz et al. 2014). For the evaluations an additive index was formed which shows the daily overall usage time on screen media expressed in hours (Schlack et al. 2015).
The KiGGS data indicates that 23.1 % of 11 to 17 year-olds spend more than 5 hours per day using screen media. A significantly higher percentage of boys compared to girls display this kind of intensive usage behaviour (29.2 % to 16.7 %). 30.9 % - almost a third - of adolescents of low social status use screen media for more than 5 hours per day. The comparative values in the medium and especially in the high status group are significantly lower at 23.5 % and 10.8 % respectively. Further evaluations confirm that status-specific variations in use of electronic media can clearly be seen in earlier childhood (Schlack et al. 2015).
Alcohol and tobacco consumptionIn adolescence a majority of girls and boys have their first contact with psychoactive substances such as alcohol and tobacco. Excessive and frequent alcohol consumption, as well as any form of tobacco consumption endanger health and go hand-in-hand with an increased risk of a whole multitude of physical diseases and mental abnormalities (Anderson et al. 2012; USDHHS 2014). Children and adolescents are the most important target group in alcohol and tobacco prevention since at an early age the course is set for the consumption of substances in later life and many adolescents underestimate the consequences to health of alcohol and tobacco consumption (Langness et al. 2005; Lampert, Thamm 2007; Lampert et al. 2014b).
In KiGGS Wave 1, adolescents aged between 11 and 17 years were surveyed in detail with regard to their alcohol and tobacco consumption. In order that it was possible to provide details with regard to hazardous alcohol consumption and binge drinking the screening instrument AUDIT-C (Saunders et al. 1993) was used, which is comprised of three individual questions and which has often been deployed internationally (Lampert et al. 2014b). Regular binge drinking is assumed if adolescents stated they consumed 6 or more alcoholic drinks on one occasion at least once a month or more often.
According to the results of KiGGS Wave 1, hazardous alcohol consumption was established in 15.8 % of adolescents and 11.5 % of young persons indulged in regular binge drinking. (Lampert et al. 2014b). In terms of the frequency of alcohol consumption, barely any differences exist between the sexes; only the group of 14 to 17 year-olds reveals that boys have a tendency to binge drink more frequently likely than girls. No significant differences are to be seen between the social status of the young persons and the indicators used for hazardous alcohol consumption and binge drinking. There are no gender-
Figure 4Sporting activity among 3 to 17 year-old children and adolescents according to social statusData source: KiGGS Wave 1 (2009 – 2012)
Percent
BoysGirlsBoysGirls
20
40
60
80
100
Practice sport Active in sports club
low highmiddleSocial status

GBE kompakt – 1/2015 8
specific differences with regard to tobacco consumption either. In total 12.0 % of adolescents currently smoke in Germany, almost half of them (5.4 %) do so daily. Adolescents of low social status smoke more often than those of high social status (Figure 5). This is true for girls as well as boys and especially with regard to daily tobacco consumption (Lampert et al. 2014b).
Whilst the general smoking rate and therefore above all cigarette smoking amongst adolescents in Germany has declined significantly in recent years (BZgA 2013; Lampert et al. 2014b), waterpipe smoking has become established as an alternative form of consuming tobacco (Kuntz et al. 2015). Contrary to the assumption that consuming tobacco using a waterpipe (shisha) is less harmful to health than smoking cigarettes due to a filter effect attributed to the water (Martinasek et al. 2011; Maziak 2014), a series of studies exists in the meantime that suggest a correlation between waterpipe smoking and consequential damage to health (Akl et al. 2010; Aslam et al. 2014).
In KiGGS Wave 1 adolescents aged between 12 and 17 years were asked whether they had ever smoked a shisha and if yes, whether they had also done this within the past 30 days (Kuntz et al. 2015). According to the self-reports, 28.9 % of adolescents had smoked a shisha at some time and 10.0 % had also done this within the period of 30 days prior to the survey. Boys take up waterpipe smoking significantly more often than girls. Adolescents of low social status admittedly smoke shishas a little more frequently than their peers of higher social status, however the differences are not statistically significant (Kuntz et al. 2015).
Passive smoke exposurePassive smoking refers to the intake of tobacco smoke from the ambient air. Since this smoke contains numerous toxic, in part carcinogenic substances, in addition to active smokers, non-smokers, who are regularly exposed to tobacco smoke
are also at risk (DKFZ 2005; USDHHS 2006). Children and adolescents are particularly at risk from passive smoking because they inhale more harmful substances due to their respiratory rate being higher in comparison to that of adults. Additionally, their organs and organ systems are not completely mature and therefore particularly sensitive to tobacco smoke. Children and adolescents who are regularly exposed to passive smoking, more frequently suffer from inflammation of the middle ear, respiratory infections and bronchial asthma (DKFZ 2005; Lampert, List 2010). Passive smoke exposure is furthermore a key risk factor for sudden infant death syndrome (cot death) (DKFZ 2005).
In KiGGS Wave 1, adolescents aged between 11 and 17 years were asked how often they stay in rooms that are being smoked in. If only those young persons are taken into account who do not smoke themselves, it appears that 18.7 % of girls and 19.0 % of boys are regularly exposed to passive smoking, i. e. at least several times per week or even daily. Of those adolescents of low social status who do not smoke themselves, a significantly higher percentage stay in rooms that are being smoked in than non-smokers of the same age of high social status (26.4 % compared to 8.2 %) (Figure 5).
The parents of children aged 0 to 17 years were asked in addition whether there is smoking in the presence of the child within the parental home. According to this, a total of 11.1 % of children and adolescents who do not smoke themselves are exposed to passive smoking in the parental home. Of the children and adolescents of high social status this affects only 3.3 %, whereas the comparative values for their peers in the medium and low status groups are significantly higher at 9.9 % and 23.2 % respectively.
Perinatal influencing factorsSmoking by the mother during pregnancy is also to be viewed in connection with exposure to passive smoking as
Figure 5Smoking and passive smoke exposure* in 11 to 17 year-old adolescents according to social statusData source: KiGGS Wave 1 (2009 – 2012)
* only refers to non-smoking adolescents
Percent
BoysGirlsBoysGirls
10
20
30
40
50 Currently smoking Passive smoke exposure
(several times per week/daily)
low highmiddleSocial status

1/2015 – GBE kompakt 9
Supplementary feeding should not begin before the end of the fourth month and no later than the end of the sixth months.
In KiGGS Wave 1 breastfeeding behaviour was surveyed using the following questions in the parental interview: »Was your child ever breastfed?«, »Up to which month was your child breastfed? »In which month did you begin to add in water, tea or juice?« and »In which month did you start to bottle-feed, give porridge, jars or other supplementary foods?«. If the child was still being breastfed at the point of the survey, the question regarding breastfeeding duration was not asked. Using the data it was established whether the child was ever breastfed (breastfeeding rate) and how long the child was breastfed for (breastfeeding duration) (von der Lippe et al. 2014). In addition to the general breastfeeding rate, this also made it possible to establish the percentage of children that were exclusively breastfed for at least 4 months. Under the term »complete breastfeeding« the WHO groups the terms »exclusive breastfeeding« (infants are only fed breast milk) and »predominant breastfeeding« (in addition to breast milk infants receive water and water-based drinks).
The data from KiGGS Wave 1 indicate that 82.1 % of children aged 0 to 6 years were breastfed at some point. 34 % were exclusively breastfed for at least 4 months. Children of low social status were much more likely never to have been breastfed than children of medium and high social status (Figure 6). A social gradient also stands out with regard to breastfeeding duration: Whilst at 48.9 % almost half of children of high social status are exclusively breastfed for at least four months, this is only true of 32.3 % of children of medium status and 19.4 % of children of low social status.
Health-related careUtilization of outpatient medical careChild and adolescent health care in Germany is mainly provided via outpatient medical services. The most important role in medical primary care is assumed by paediatricians. As children get older, doctors in general practice and additional medical specialists’ groups are also consulted to an increasing degree (Rattay et al. 2014).
In KiGGS Wave 1, based on the details provided by parents of 0 to 13 year-old children and the details provided by 14 to 17 year-old adolescents themselves, it is possible to show the 12-month prevalence regarding the utilization of overall outpatient medical care (not including dentists and orthodontists) as well as for paediatricians as specialist’s group individually (Rattay et al. 2014). At 91.9 % the vast majority of 0 to 17 year-olds had attended a registered doctor’s practice within the past year. 67.9 % - around two thirds of children and adolescents, had received paediatric or adolescent medical treatment in the 12 months prior to the survey. There are no evident differences between girls and boys in the use of outpatient medical care services and
it represents a considerable risk to the development of the unborn child (DiFranza et al. 2004; Dudenhausen 2009). The toxins contained in tobacco smoke such as nicotine and carbon monoxide find their way into the bloodstream of the embryo or fetus, impair the supply of oxygen and nutrients and thus inhibit its growth. The consequence can be pregnancy complications through to miscarriage and premature birth (Jaddoe et al. 2008; Mund et al. 2013). Smoking by the mother during pregnancy has a negative effect on the birth weight of the child and increases the risk of a series of developmental disorders and diseases (Jaakkola, Gissler 2004; DKFZ 2010).
As part of the parental survey for study participants aged 0 to 6 years, it was asked in KiGGS Wave 1 whether the mother of the child had smoked during the pregnancy. According to the parental responses 12.1 % of children aged 0 to 6 years had already been subjected in the womb to the effects of maternal smoking. The differences depending on the social origin of the children are severe; whilst the percentage of mothers who smoked during pregnancy in the high status group is 2.2 %, the prevalences in the medium and low status groups are 11.1 % and 28.4 % respectively (Figure 6).
Figure 6Maternal smoking in pregnancy and breastfeeding behaviour in 0 to 6 year-old children according to social statusData source: KiGGS Wave 1 (2009 – 2012)
Percent
10
20
30
40
50 Maternal smoking
(in pregnancy)Breastfeeding behaviour
(never breastfed)
low highmiddleSocial status
Nursing with breast milk is associated with many health benefits. Consequently breastfed children have, for example, a lower risk of developing various diseases, amongst them infectious diseases, asthma and allergies. The same is true for obesity and other parameters of metabolic syndrome in adulthood (Heinig, Dewey 1996; American Academy of Paediatrics Section on Breast-feeding 2012). In Germany, in 2004, the National Breastfeeding Committee issued official breastfeeding recommendations based on the recommendations of the World Health Organization (WHO) (Nationale Stillkommission am BfR 2004). In these it recommends that for infants, the best nutrition in the first year of life is exclusive breastfeeding.

GBE kompakt – 1/2015 10
detection examinations did you make use of for your child? « Information was gathered with regard to examinations U1 through to U9; information on children, who were younger than the upper temporal tolerance limit for examination U9, were not taken into account. In the following the percentage of 7 to 13 year-olds who were born in Germany and who fully completed the early detection programme from U3 through to U9 (without U7a) is reported (Rattay et al. 2014).
At 82.2 % around four out of five children have fully participated in all disease screening examinations. This is the case for girls and boys equally. As can be seen in Figure 7, the social status of the children plays an ever increasing role as the observed complete series of examinations U3 to U9 progresses. On the whole, it can be seen that children of high social status at 87.3 % are more likely to take full advantage of the screening programme than children from the low status group at 74.1 %. The social differences can be observed in both sexes but they are even more pronounced in girls than in boys.
VaccinationsIn addition to screening examinations, vaccinations also rank amongst the most important preventive measures in childhood and adolescence because of their effectiveness and favourable risk-benefit ratio (Poethko-Müller et al. 2007). Recommendations for conducting vaccinations are issued annually by the German Standing Committee on Vaccination (STIKO) at the Robert Koch Institute (STIKO 2014).
As part of the KiGGS baseline study, vaccination rates regarding a total of nine vaccine-preventable diseases were reported on the basis of the vaccination cards brought to interview by the parents (Poethko-Müller et al. 2007). The highest vaccination rates were to be found among 2 to 17 year old children and adolescents of medium social status. Peers of high social status were less often vaccinated against measles, mumps and rubella. Since March 2007 it is recommended that girls between 12 and
also no significant differences between the social status of the children and adolescents and the use of registered specialist doctors in general and registered paediatricians.
HospitalisationsIn cases of serious disease, accidental injuries, poisonings or surgical procedures a stay in hospital is often needed, in order to ensure optimum medical and nursing care of the affected child. In KiGGS Wave 1 the parents of 0 to 10 year-old children were asked how many nights their child had spent in hospital in the last 12 months. Adolescents aged 11 to 17 years were asked themselves directly.
According to the parental and self-responses, 9.6 % of children aged 0 to 17 years spent at least one night in hospital. There are no differences between the sexes. On average a hospital stay for the children affected was 6.3 nights. Children and adolescents of low social status had to be admitted to hospital twice as often as their peers from the high status group, i. e. 13.8 % compared to 7.0 %. In addition, a hospital stay for them lasted around 2 nights longer.
Early detection examinations/screeningThe conducting of screening examinations for the early detection of illnesses in children (U1 to U9) ranks among the most important preventive measures in childhood. The aim of the early detection programme (screening programme), which is part of the services funded by the statutory health insurers, is to identify early any developmental disorders and diseases and if required to introduce the measures needed to treat them (Gemeinsamer Bundesausschuss 2011). Whilst examinations U1 and U2 are generally performed as a routine measure in the maternity clinic, the subsequent examination appointments U3 to U9, which take place up to the age of six, are mostly conducted in a registered paediatric practice or at general practitioner’s (Rattay et al. 2014).
In KiGGS Wave 1, participation in child screening was established by asking the parents the question, »Which early
Figure 7Complete uptake of early detection examinations U3 to U9 (without U7a) in 7 to 13 year-old children according to social statusData source: KiGGS Wave 1 (2009 – 2012)
Percent
Complete series of examinations
U3 U4 U5 U6 U7 U8 U9
100
80
60
40
20
low highmiddleSocial status

1/2015 – GBE kompakt 11
social discrepancies in the state of health of children and adolescents. In addition to the general state of health, this can also be said for mental health problems, including ADHD and eating disorders, health behaviour - such as eating habits and sporting activity, as well as protective and risk factors in early childhood including breastfeeding, participation in childhood screening examinations and maternal smoking during pregnancy. For these areas it can be said that the risk of health problems in children and adolescents from families of low social status is higher than for their peers from the medium and especially from the high status group. In comparison to this, the social differences in the prevalence of acute and chronic diseases are rather small. Among the few exceptions are some individual diseases such as neurodermatitis, which occur more often in young persons from high status families.
With respect to the important question as to what extent the correlations between social status and the state of health of those growing up in Germany have changed over time, the results presented do not provide any answers as yet. The various evaluations of data from KiGGS Wave 1 have to date concentrated on cross-sectional observations, which allow for statements to be made concerning the years 2009 to 2012. In the next step comparisons are now to be made with the results from the KiGGS baseline study relating to the years 2003 to 2006, so that the temporal development over a period of approximately six years can be observed. Future longitudinal analyses will be a further focus of the work and are possible since the majority of participants in KiGGS Wave 1 also took part in the KiGGS baseline study. These longitudinal analyses will, amongst other things, provide information as to how the health and health behaviour of the study participants has developed over the course of six years i. e. between the age of 6 and 12 or 12 and 18, and what bearing social status has on this.
Meanwhile the Robert Koch Institute is carrying out a further survey in the KiGGS study in the shape of KiGGS Wave 2. The field work started in 2014 and is expected to last until 2016. Since, as was the case with the baseline study, KiGGS Wave 2 also includes physical examinations in addition to the interviews, examination and measurement data will again be available for example with regard to anthropometry, physical fitness, and maturity. With regard to trend analyses this means that development can be examined over a period of about 10 years. Also, extended time frames will result for longitudinal analyses.
Consequently, upon conclusion of KiGGS Wave 2, it will be possible to track study participants who at the time of the baseline study were 6 years old, right through to the age of 16 and those who were 16, right through to the age of 26, i. e. into young adulthood.
Regardless of the perspective possibilities associated with the KiGGS study, the results already presented clearly show the importance of social status with regard to health in childhood and adolescence. From a public health and health policy point of view there is a resulting requirement
17 years in Germany be vaccinated against the human papilloma virus (HPV) (Poethko-Müller et al. 2014). HPV plays an important role in the cause of cervical cancer. In August 2014 the recommendation was revised and the time window for HPV vaccination was shifted forward to the 9 to 14 year-old age range (STIKO 2014).
Based on the data from KiGGS Wave 1 it can be shown that at the time of the survey, 52.6 % of the girls surveyed aged between 14 and 17 years had been vaccinated at least once against HPV, 39.5 % had received 3 doses and therefore been fully vaccinated (Poethko-Müller et al. 2014). Whilst 52.9 % of girls of low and 55.9 % of girls with medium social status stated they had been vaccinated at least once against HPV, the corresponding lifetime prevalence amongst girls in the high status group was significantly lower at 39.2 %. Girls of high social status were also least likely to report having received the full course of 3 HPV vaccination doses. Whilst 41.0 % of girls of low and medium social status respectively had been completely vaccinated against HPV, this was only true of 32.1 % of girls from the high status group.
Dental check-upsNumerous measures have led to a significant improvement in the oral and dental health of children and adolescents in Germany. These include the increase in the degree of group prophylactic care measures in kindergarten and schools, a comprehensive, well-developed dental healthcare system and individual prophylactic measures, increased information on nutrition for maintaining healthy teeth, fluoride supply via toothpaste and table salt, as well as measures to improve oral hygiene (Micheelis, Schiffner 2006; Schenk, Knopf 2007). In order to already have a positive influence on oral and dental health in the early years, having regular dental check-ups is recommended even when free of symptoms. In KiGGS Wave 1, the parents of 3 to 10 year-old children were asked at what intervals they go to the dentist with their child for check-ups. Adolescents aged between 11 and 17 years were surveyed directly.
Overall it was revealed that at 4.8 % only a small minority of children and adolescents go to the dentist for check-ups less often than once a year or never. Whilst no significant differences between the sexes are to be observe in this regard, there are differences according to social status. The percentage of 3 to 17 year-olds who go to the dentist less than once a year for a check-up is 9.9 % in the low status group and in contrast in the medium and high groups the figures are only 3.5 % and 3.2 % respectively.
DiscussionOverall, the results of the KiGGS study on the one hand show that the vast majority of children in Germany are growing up healthy. This is also true with regard to children and adolescents from families of low social status. On the other hand, they do in part indicate strongly pronounced

GBE kompakt – 1/2015 12
for preventive and health promoting measures that start as early in life as possible and which also extend to socially disadvantaged population groups and contribute toward social balance in health opportunities (RKI, BZgA 2008; BZgA 2011). It must also be taken into account with regard to health-related care, that for children and adolescents from families of low social status there is a greater and in part more specific care requirement. This appears to be the case particularly in relation to mental and psycho-social health.
These requirements have already had an impact on the Federal Government Strategy to Promote Child Health (BMG 2008), in that with regard to the results of the KiGGS baseline study, the guarantee of equal opportunities in health in childhood and adolescence is highlighted as an important health policy objective. In addition, attention is to be drawn to the national health targets process and the revised objective »Growing up healthy: life skills, nutrition, exercise«, which suggests measures to help achieve the targets, which children and adolescents from all population groups should meet (BMG 2010). The same is true for the cooperation network »Equal Opportunities in Health« coordinated by the Federal Centre for Health Education (BZgA) the work of which in recent years has been increasingly directed at childhood and adolescence and which always views measures such as »Early Assistance« or the setting up of »prevention chains« in communities from the point of view of reducing health inequalities (BZgA 2011; Landesvereinigung für Gesundheit und Akademie für Sozialmedizin Niedersachsen e. V., BZgA 2013). Further impulses might be provided by the planned »Prevention Act« designed to support a strengthening of prevention and health promotion whilst emphasising the significance of environmental and setting-related measures for children, for example with regard to families, child day care facilities and schools.
The reduction of health-related inequality in the young population can however not be the sole task of health policy but requires an overall political strategy and activities spread across the entire policy field whilst including for example social, family and educational policy.
The great impact of poverty on children and adolescents mentioned at the beginning and the continuing strong dependency of educational opportunities on social origins indicate concrete starting points in this regard.
PD Dr. Thomas Lampert, Dr. Benjamin Kuntz, KiGGS Study Group
Robert Koch InstituteDepartment for Epidemiology and
Health Monitoring

1/2015 – GBE kompakt 13
environmental tobacco smoke exposure and children's health.
Pediatrics 113 (4 Suppl): 1007–1015
Dragano N, Lampert T, Siegrist J (2010) Wie baut sich soziale
und gesundheitliche Ungleichheit im Lebenslauf auf? In:
Sachverständigenkommission 13. Kinder- und Jugendbericht (Hrsg)
Materialien zum 13 Kinder- und Jugendbericht. Mehr Chancen für
gesundes Aufwachsen. Verlag Deutsches Jugendinstitut, München,
S 11–50
Dudenhausen JW (Hrsg) (2009) Rauchen in der Schwangerschaft:
Häufigkeit, Folgen und Prävention. Urban & Vogel, München
Eime RM, Young JA, Harvey JT et al. (2013) A systematic review of the
psychological and social benefits of participation in sport for adults:
informing development of a conceptual model of health through
sport. Int J Behav Nutr Phys Act 10: 135
Ellert U, Brettschneider A-K, Ravens-Sieberer U et al. (2014)
Gesundheitsbezogene Lebensqualität bei Kindern
und Jugendlichen in Deutschland. Ergebnisse der
KiGGS-Studie – Erste Folgebefragung (KiGGS Welle 1).
Bundesgesundheitsbl – Gesundheitsforsch – Gesund heitsschutz 57
(7): 798–806
Erhart M, Wille N, Ravens-Sieberer U (2009) Die Messung der subjektiven
Gesundheit: Stand der Forschung und Herausforderungen. In:
Richter M, Hurrelmann K (Hrsg) Gesundheitliche Ungleichheit.
Grundlagen, Probleme, Perspektiven. 2. aktualisierte Auflage. VS
Verlag für Sozialwissenschaften, Wiesbaden, S 335–352
Finne E, Bucksch J (2014) Gesundheitliche Effekte der
Mediennutzung. In: Hurrelmann K, Baumann E (Hrsg) Handbuch
Gesundheitskommunikation. Verlag Hans Huber, Bern, S 214–227
Foti K, Eaton D (2010) Associations of selected health risk behaviors
with self-rated health status among U.S. high school students. Public
Health Rep 125 (5): 771–781
Gemeinsamer Bundesausschuss (2011) Richtlinien des
Bundesauschusses der Ärzte und Krankenkassen über die
Früherkennung von Krankheiten bei Kindern bis zur Vollendung
des 6. Lebensjahres (»Kinder-Richtlinien«).
www.g-ba.de (Stand: 20.02.2015)
Gerlinghoff M, Backmund H (2006) Essstörungen. In: Stier B,
Weissenrieder N (Hrsg) Jugendmedizin – Gesundheit und
Gesellschaft. Springer, Heidelberg, S 219–229
Goodman R (1997) The Strengths and Difficulties Questionnaire: a
research note. J Child Psychol Psychiatry 38 (5): 581–586
Graf C, Dordel S (2011) Therapie der juvenilen
A d i p o s i t a s a u s s p o r t m e d i z i n i s c h /
sportwissenschaftlicher Sicht. Bundesgesundheitsbl –
Gesundheitsforsch – Gesundheitsschutz 54 (5): 541–547
HBSC-Team Deutschland (2011) Studie Health Behaviour in School-
aged Children – Faktenblatt »Häufigkeit des Frühstücks bei Kindern
und Jugendlichen«. WHO Collaborating Centre for Child and
Adolescent Health Promotion, Bielefeld
Heinig MJ, Dewey KG (1996) Health advantages of breast feeding for
infants: a critical review. Nutr Res Rev 9 (1): 89–110
Hinkley T, Teychenne M, Downing KL et al. (2014) Early childhood
physical activity, sedentary behaviors and psychosocial well-being: a
systematic review. Prev Med 62: 182–192
Hölling H, Erhart M, Ravens-Sieberer U et al. (2007)
Verhaltensauffälligkeiten bei Kindern und Jugendlichen. Erste
LiteratureAkl EA, Gaddam S, Gunukula SK et al. (2010) The effects of waterpipe
tobacco smoking on health outcomes: a systematic review. Int J
Epidemiol 39 (3): 834–857
American Academy of Pediatrics Section on Breastfeeding (2012)
Breastfeeding and the use of human milk. Pediatrics 129 (3): e827–
841
Anderson P, Moller L, Galea G (Hrsg) (2012) Alcohol in the European
Union. Consumption, harm and policy approaches. World Health
Organization Regional Office for Europe, Copenhagen
Aslam HM, Saleem S, German S et al. (2014) Harmful effects of shisha:
literature review. Int Arch Med 7 (1): 16
Autorengruppe Bildungsberichterstattung (Hrsg) (2014) Bildung in
Deutschland 2014. Ein indikatorengestützter Bericht mit einer
Analyse zur Bildung von Menschen mit Behinderungen. W.
Bertelsmann Verlag, Bielefeld
BAG – Bundesarbeitsgemeinschaft. Mehr Sicherheit für Kinder
e. V. (2007) Empfehlungen zur Weiterentwicklung der
Kinderunfallprävention in Deutschland. Grundlagen und
strategische Ziele. BAG, Bonn
www.kindersicherheit.de (Stand: 20.02.2015)
Biro FM, Wien M (2010) Childhood obesity and adult morbidities. Am
J Clin Nutr 91 (5): 1499S–1505S
BMG – Bundesministerium für Gesundheit (2008) Strategie der
Bundesregierung zur Förderung der Kindergesundheit. BMG,
Berlin
BMG – Bundesministerium für Gesundheit (2010) Nationales
Gesundheitsziel Gesund aufwachsen: Lebenskompetenz,
Bewegung, Ernährung. BMG, Berlin
Boeing H, Bechthold A, Bub A et al. (Hrsg) (2012) Gemüse und Obst in
der Prävention ausgewählter chronischer Krankheiten. In: Deutsche
Gesellschaft für Ernährung e. V. (DGE) Bonn
BZgA – Bundeszentrale für gesundheitliche Aufklärung (Hrsg) (2011)
Kriterien guter Praxis in der Gesundheitsförderung bei sozial
Benachteiligten. Ansatz – Beispiele – Weiterführende Informationen
(5. erweiterte und überarbeitete Auflage). BZgA, Köln
BZgA – Bundeszentrale für gesundheitliche Aufklärung (Hrsg) (2013) Der
Tabakkonsum Jugendlicher und junger Erwachsener in Deutschland
2012. Ergebnisse einer aktuellen Repräsentativbefragung und
Trends. BZgA, Köln
De Bruin A, Picavet HSJ, Nossikov A (Hrsg) (1996) Health interview
surveys: towards harmonization of methods and instruments. WHO
Regional Publications. European Series No. 58. WHO, Copenhagen
Der Paritätische Gesamtverband (Hrsg) (2015) Die zerklüftete Republik.
Bericht zur regionalen Armutsentwicklung in Deutschland 2014.
Eigenverlag, Berlin
www.der-paritaetische.de/armutsbericht (Stand: 20.02.2015)
DOSB – Deutscher Olympischer Sportbund (2014) Bestandserhebung
2014. DOSB, Frankfurt am Main
DKFZ – Deutsches Krebsforschungszentrum (Hrsg) (2005)
Passivrauchen – ein unterschätztes Gesundheitsrisiko. Rote Reihe
Tabakprävention und Tabakkontrolle, Band 5. DKFZ, Heidelberg
DKFZ – Deutsches Krebsforschungszentrum (Hrsg) (2010) Schutz
der Familie vor Tabakrauch. Rote Reihe Tabakprävention und
Tabakkontrolle, Band 14. DKFZ, Heidelberg
DiFranza JR, Aligne CA, Weitzman M (2004) Prenatal and postnatal

GBE kompakt – 1/2015 14
health survey: design of the German KiGGS-Study. BMC Public
Health 8: 196
Kurth BM, Schaffrath Rosario A (2007) Die Verbreitung
von Übergewicht und Adipositas bei Kindern und
Jugendlichen in Deutschland. Ergebnisse des bundesweiten
Kinder- und Jugendgesundheitssurveys (KiGGS).
Bundesgesundheitsbl – Gesundheitsforsch – Gesundheitsschutz 50
(5/6): 736–743
Kurth BM, Schaffrath Rosario A (2010) Übergewicht und
Adipositas bei Kindern und Jugendlichen in Deutschland.
Bundesgesundheitsbl – Gesundheitsforsch – Gesundheitsschutz
53 (7): 643–652
Lampert T, Kurth BM (2007) Socioeconomic status and health in
children and adolescents — results of the German Health Interview
and Examination Survey for Children and Adolescents (KiGGS).
Dtsch Arztebl Int 104 (43): 2944–2949
Lampert T, Sygusch R, Schlack R (2007) Nutzung elektronischer Medien
im Jugendalter. Ergebnisse des Kinder- und Jugendgesundheitssurveys
(KiGGS) Bundesgesundheitsbl – Gesundheitsforsch –
Gesundheitsschutz 50 (5/6): 643–652
Lampert T, Thamm M (2007) Tabak-, Alkohol- und
Drogenkonsum von Jugendlichen in Deutschland. Ergebnisse
des Kinder- und Jugendgesundheitssurveys (KiGGS).
Bundesgesundheitsbl – Gesundheitsforsch – Gesundheitsschutz 50
(5/6): 600–608
Lampert T (2008) Smoking and passive smoking exposure in young
people — Results of the German health interview and examination
survey for children and adolescents (KiGGS). Dtsch Arztebl Int 105
(15): 265–271
Lampert T, Kroll LE (2009) Die Messung des sozioökonomischen
Status in sozialepidemiologischen Studien. In: Richter M,
Hurrelmann K (Hrsg) Gesundheitliche Ungleichheit. Grundlagen,
Probleme, Perspektiven. 2., aktualisierte Auflage. VS Verlag für
Sozialwissenschaften, Wiesbaden, S 309–334
Lampert T (2010) Frühe Weichenstellung. Zur Bedeutung der
Kindheit und Jugend für die Gesundheit im späteren Leben.
Bundesgesundheitsbl – Gesundheitsforsch – Gesundheitsschutz 53
(5): 486–497
Lampert T, List SM (2010) Gesundheitsrisiko Passivrauchen. GBE
kompakt 3/2010. RKI, Berlin
Lampert T (2011) Soziale Ungleichheit und Gesundheit im Kindes- und
Jugendalter. Paediatrie up2date 6 (2): 119–142
Lampert T, Müters S, Stolzenberg H et al. (2014a) Messung des
sozioökonomischen Status in der KiGGS-Studie. Erste Folgebefragung
(KiGGS Welle 1). Bundesgesundheitsbl – Gesundheitsforsch –
Gesundheitsschutz 57 (7): 762–770
Lampert T, Kuntz B, KiGGS Study Group (2014b) Tabak- und
Alkoholkonsum bei 11- bis 17-jährigen Jugendlichen. Ergebnisse
der KiGGS-Studie – Erste Folgebefragung (KiGGS Welle 1).
Bundesgesundheitsbl – Gesundheitsforsch – Gesundheitsschutz 57
(7): 830–839
Landesamt für Umwelt Gesundheit und Verbraucherschutz
Brandenburg (2013) Ergebnisse der Schuleingangsuntersuchungen
zum Zusammenhang von Sozialstatus und Gesundheit
www.gesundheitsplattform.brandenburg.de (20.02.2015)
Landesvereinigung für Gesundheit und Akademie für Sozialmedizin
Ergebnisse aus dem Kinder- und Jugendgesundheitssurvey (KiGGS).
Bundesgesundheitsbl – Gesundheitsforsch – Gesundheitsschutz 50
(5/6): 784–793
Hölling H, Schlack R (2007) Essstörungen im Kindes- und Jugendalter. Erste
Ergebnisse aus dem Kinder- und Jugendgesundheitssurvey (KiGGS).
Bundesgesundheitsbl – Gesundheitsforsch – Gesundheitsschutz 50
(5/6): 794–799
Hölling H, Schlack R, Petermann F et al. (2014) Psychische Auffälligkeiten
und psychosoziale Beeinträchtigungen bei Kindern und
Jugendlichen im Alter von 3 bis 17 Jahren in Deutschland – Prävalenz
und zeitliche Trends zu 2 Erhebungszeitpunkten (2003 – 2006 und
2009 – 2012). Ergebnisse der KiGGS-Studie – Erste Folgebefragung
(KiGGS Welle 1). Bundesgesundheitsbl – Gesundheitsforsch –
Gesundheitsschutz 57 (7): 807–819
Hradil S (2001) Soziale Ungleichheit in Deutschland. 8. Auflage. Leske
+ Budrich, Opladen
Jaakkola JJ, Gissler M (2004) Maternal smoking in pregnancy, fetal
development, and childhood asthma. Am J Public Health 94 (1):
136–140
Jaddoe VW, Troe EJ, Hofman A et al. (2008) Active and passive maternal
smoking during pregnancy and the risks of low birthweight and
preterm birth: the Generation R Study. Paediatr Perinat Epidemiol
22 (2): 162–171
Janssen I, LeBlanc AG (2010) Systematic review of the health benefits of
physical activity and fitness in school-aged children and youth. Int J
Behav Nutr Phys Act 7: 40
Jernelöv S, Lekander M, Almqvist C et al. (2013) Development of atopic
disease and disturbed sleep in childhood and adolescence — a
longitudinal population-based study. Clin Exp Allergy 43 (5): 552–559
Kahl H, Dortschy R, Ellsäßer G (2007) Verletzungen bei
Kindern und Jugendlichen (1 – 17 Jahre) und Umsetzung
von persönlichen Schutzmaßnahmen. Ergebnisse des
bundesweiten Kinder- und Jugendgesundheitssurveys (KiGGS).
Bundesgesundheitsbl – Gesundheitsforsch – Gesundheitsschutz 50
(5/6): 718–727
Kamtsiuris P, Atzpodien K, Ellert U et al. (2007) Prävalenz von somatischen
Erkrankungen bei Kindern und Jugendlichen in Deutschland.
Ergebnisse des Kinder- und Jugendgesundheitssurveys (KiGGS).
Bundesgesundheitsbl – Gesundheitsforsch – Gesundheitsschutz 50
(5/6): 686–700
Krüger H-H, Rabe-Kleberg U, Kramer R-T et al. (Hrsg) (2011)
Bildungsungleichheit revisited. Bildung und soziale Ungleichheit
vom Kindergarten bis zur Hochschule. 2., durchgesehene Auflage.
VS Verlag für Sozialwissenschaften, Wiesbaden
Kuntz B, Lampert T, KiGGS Study Group (2015) Wasserpfeifenkonsum
(Shisha-Rauchen) bei Jugendlichen in Deutschland. Ergebnisse
der KiGGS-Studie – Erste Folgebefragung (KiGGS Welle 1).
Bundesgesundheitsbl – Gesundheitsforsch – Gesundheitsschutz 58:
DOI 10.1007/s00103-00015-02128-00103
Kurth BM (2007) Der Kinder- und Jugendgesundheitssurvey (KiGGS):
Ein Überblick über Planung, Durchführung und Ergebnisse unter
Berücksichtigung von Aspekten eines Qualitätsmanagements.
Bundesgesundheitsbl – Gesundheitsforsch – Gesundheitsschutz 50
(5/6): 533–546
Kurth BM, Kamtsiuris P, Hölling H et al. (2008) The challenge of
comprehensively mapping children's health in a nation-wide

1/2015 – GBE kompakt 15
Papillomviren (HPV) bei Mädchen in Deutschland. Ergebnisse
der KiGGS-Studie – Erste Folgebefragung (KiGGS Welle 1).
Bundesgesund heitsbl – Gesundheitsforsch – Gesundheitsschutz 57
(7): 869–877
Rattay P, Starker A, Domanska O et al. (2014) Trends in der
Inanspruchnahme ambulant-ärztlicher Leistungen im Kindes-
und Jugendalter. Ergebnisse der KiGGS-Studie – Ein Vergleich
von Basiserhebung und erster Folgebefragung (KiGGS Welle 1).
Bundesgesundheitsbl – Gesundheitsforsch – Gesundheitsschutz 57
(7): 878–891
Richter M (2005) Gesundheit und Gesundheitsverhalten im
Jugendalter: Der Einfluss sozialer Ungleichheit. VS Verlag für
Sozialwissenschaften, Wiesbaden
RKI – Robert Koch-Institut (Hrsg) (2010) Gesundheitliche Ungleichheit
bei Kindern und Jugendlichen in Deutschland. Beiträge zur
Gesundheitsberichterstattung des Bundes. RKI, Berlin
RKI – Robert Koch-Institut (Hrsg) (2014a) Körperliche Aktivität.
Faktenblatt zu KiGGS Welle 1: Studie zur Gesundheit von
Kindern und Jugendlichen in Deutschland – Erste Folgebefragung
2009 – 2012. RKI, Berlin
www.rki.de (Stand: 20.02.2015)
RKI – Robert Koch-Institut (Hrsg) (2014b) Sport. Faktenblatt zu KiGGS
Welle 1: Studie zur Gesundheit von Kindern und Jugendlichen in
Deutschland – Erste Folgebefragung 2009 – 2012. RKI, Berlin
www.rki.de (Stand: 20.02.2015)
RKI – Robert Koch-Institut (2015a) Faktenblätter zur KiGGS Welle 1
www.rki.de (Stand: 22.02.2015)
RKI – Robert Koch-Institut (Hrsg) (2015b) Schwimmfähigkeit.
Faktenblatt zu KiGGS Welle 1: Studie zur Gesundheit von
Kindern und Jugendlichen in Deutschland – Erste Folgebefragung
2009 – 2012. RKI, Berlin
www.rki.de (Stand: 20.02.2015)
RKI, BZgA – Robert Koch-Institut, Bundeszentrale für gesundheitliche
Aufklärung (Hrsg) (2008) Erkennen – Bewerten – Handeln: Zur
Gesundheit von Kindern und Jugendlichen in Deutschland. RKI,
Berlin/Köln
Saß AC, Poethko-Müller C, Rommel A et al. (2014) Das
Unfallgeschehen im Kindes- und Jugendalter – Aktuelle
Prävalenzen, Determinanten und Zeitvergleich. Ergebnisse
der KiGGS-Studie – Erste Folgebefragung (KiGGS Welle 1).
Bundesgesundheitsbl – Gesundheitsforsch – Gesundheitsschutz 57
(7): 789–797
Saunders JB, Aasland OG, Babor TF et al. (1993) Development of
the Alcohol Use Disorders Identification Test (AUDIT): WHO
Collaborative Project on Early Detection of Persons with Harmful
Alcohol Consumption – II. Addiction 88 (6): 791–804
Schenk L, Knopf H (2007) Mundgesundheitsverhalten von
Kindern und Jugendlichen in Deutschland. Erste Ergebnisse
aus dem Kinder- und Jugendgesundheitssurvey (KiGGS).
Bundesgesundheitsbl – Gesundheitsforsch – Gesundheitsschutz 50
(5/6): 653–658
Schlack R, Hölling H (2007) Gewalterfahrungen von Kindern und
Jugendlichen im subjektiven Selbstbericht. Erste Ergebnisse
aus dem Kinder- und Jugendgesundheitssurvey (KiGGS).
Bundesgesundheitsbl – Gesundheitsforsch – Gesundheitsschutz 50
(5/6): 819–826
Niedersachsen e.V., BZgA (2013) Gesund aufwachsen für alle Kinder!
Werkbuch Präventionskette. Herausforderungen und Chancen
beim Aufbau von Präventionsketten in Kommunen
www.gesundheit-nds.de (20.02.2015)
Lange M, Butschalowsky HG, Jentsch F et al. (2014)
Die erste KiGGS-Folgebefragung (KiGGS Welle 1).
Studiendurchführung, Stichprobendesign und Response.
Bundesgesundheitsbl – Gesundheitsforsch – Gesundheitsschutz 57
(7): 747–761
Langness A, Richter M, Hurrelmann K (2005) Gesundheitsverhalten
im Jugendalter: Ergebnisse der internationalen "Health Behaviour
in School-aged Children"-Studie. Gesundheitswesen 67 (6): 422–431
Manz K, Schlack R, Poethko-Müller C et al. (2014) Körperlich-
sport l iche Aktivität und Nutzung elektronischer
Medien im Kindes- und Jugendalter. Ergebnisse der
KiGGS-Studie – Erste Folgebefragung (KiGGS Welle 1).
Bundesgesundheitsbl – Gesundheitsforsch – Gesundheitsschutz (7):
840–848
Martinasek MP, McDermott RJ, Martini L (2011) Waterpipe (hookah)
tobacco smoking among youth. Curr Probl Pediatr Adolesc Health
Care 41 (2): 34–57
Maziak W (2014) The waterpipe: A new way of hooking youth on
tobacco. Am J Addict 23 (2): 103–107
Mensink GBM, Kleiser C, Richter A (2007) Lebensmittelverzehr
bei Kindern und Jugendlichen in Deutschland. Ergebnisse des
Kinder- und Jugendgesundheitssurveys (KiGGS). Bundesgesund-
heitsbl – Gesundheitsforsch – Gesundheitsschutz 50 (5/6): 609–623
Micheelis W, Schiffner U (2006) Vierte Deutsche Mundgesundheitsstudie
(DMS IV). IDZ Materialreihe Band 31. Deutscher Zahnärzte Verlag,
Köln
mpfs – Medienpädagogischer Forschungsverbund Südwest (Hrsg)
(2014) JIM-Studie 2014. Jugend, Information, (Multi-) Media.
Basisuntersuchung zum Medienumgang 12- bis 19-Jähriger in
Deutschland. mpfs, Stuttgart
Mund M, Louwen F, Klingelhoefer D et al. (2013) Smoking and
pregnancy – a review on the first major environmental risk factor
of the unborn. Int J Environ Res Public Health 10 (12): 6485–6499
Nationale Stillkommission am Bundesinstitut für Risikobewertung
(2004) Stilldauer – Empfehlung der Nationalen Stillkommission
www.bfr.bund.de (Stand: 20.02.2015)
Neuhauser H, Poethko-Müller C, KiGGS Study Group (2014) Chronische
Erkrankungen und impfpräventable Infektionserkrankungen
bei Kindern und Jugendlichen in Deutschland. Ergebnisse
der KiGGS-Studie – Erste Folgebefragung (KiGGS Welle 1).
Bundesgesundheitsbl – Gesundheitsforsch – Gesundheitsschutz 57
(7): 779–788
Pietsch P (2007) Schwimmen – eine universelle Sportart. Lebensretter-
Spezial. 2. Symposium Schwimmen. Gesundheit – Kinder – Sicherheit
(Kongress-Dokumentation): 14–15
Poethko-Müller C, Kuhnert R, Schlaud M (2007) Durchimpfung
und Determinanten des Impfstatus in Deutschland. Ergebnisse
des Kinder- und Jugendgesundheitssurveys (KiGGS).
Bundesgesundheitsbl – Gesundheitsforsch – Gesundheitsschutz 50
(5/6): 851–862
Poethko-Müller C, Buttmann-Schweiger N, KiGGS Study Group
(2014) Impfstatus und Determinanten der Impfung gegen humane

GBE kompakt – 1/2015 16
Von der Lippe E, Brettschneider A-K, Gutsche J et al. (2014) Einflussfaktoren
auf Verbreitung und Dauer des Stillens in Deutschland. Ergebnisse
der KiGGS-Studie – Erste Folgebefragung (KiGGS Welle 1).
Bundesgesundheitsbl – Gesundheitsforsch – Gesundheitsschutz 57
(7): 849–859
Wesnes KA, Pincock C, Richardson D et al. (2003) Breakfast reduces
declines in attention and memory over the morning in schoolchildren.
Appetite 41 (3): 329–331
Woerner W, Becker A, Friedrich C et al. (2002) Normierung und
Evaluation der deutschen Elternversion des Strengths and
Difficulties Questionnaire (SDQ): Ergebnisse einer repräsentativen
Felderhebung. Z Kinder Jugendpsychiatr Psychother 30 (2): 105–111
WHO – World Health Organization (Hrsg) (2003) Diet, nutrition and
the prevention of chronic diseases. Report of a joint WHO/FAO
Expert Consultation. WHO Technical Report Series 916. WHO, Genf
WHO – World Health Organization (2010) Global recommendations on
physical activity for health. WHO, Genf
Schlack R, Mauz E, Hebebrand J et al. (2014) Hat die Häufigkeit
elternberichteter Diagnosen einer Aufmerksamkeitsdefizit-/
Hyperaktivitätsstörung (ADHS) in Deutschland zwischen
2003–2006 und 2009–2012 zugenommen? Ergebnisse
der KiGGS-Studie – Erste Folgebefragung (KiGGS Welle 1).
Bundesgesundheitsbl – Gesundheitsforsch – Gesundheitsschutz 57
(7): 820–929
Schlack R, Kuntz B, Lampert T (2015) Bildschirmmediennutzung
und Gesundheit von Kindern und Jugendlichen. Ergebnisse aus
KiGGS Welle 1: Erste Folgebefragung der Studie zur Gesundheit
von Kindern und Jugendlichen in Deutschland (KiGGS) In:
Dadaczynski K, Schiemann S, Paulus P (Hrsg) Gesundheit
spielend fördern? Potentiale und Herausforderungen von digitalen
Spieleanwendungen für die Gesundheitsförderung und Prävention.
Beltz Juventa, Weinheim (in print)
Schlaud M, Atzpodien K, Thierfelder W (2007) Allergische Erkrankungen.
Ergebnisse aus dem Kinder- und Jugendgesundheitssurvey (KiGGS).
Bundesgesundheitsbl – Gesundheitsforsch – Gesundheitsschutz 50
(5/6): 701–710
Schmitz R, Thamm M, Ellert U et al. (2014) Verbreitung häufiger
Allergien bei Kindern und Jugendlichen in Deutschland. Ergebnisse
der KiGGS-Studie – Erste Folgebefragung (KiGGS Welle 1).
Bundesgesundheitsbl – Gesundheitsforsch – Gesundheitsschutz 57
(7): 771–778
Senatsverwaltung für Gesundheit und Soziales Berlin (Hrsg) (2013)
Grundauswertung der Einschulungsdaten in Berlin 2012
www.berlin.de (Stand: 20.02.2015)
Statistische Ämter des Bundes und der Länder (2015)
Armutsgefährdungsquote nach soziodemografischen Merkmalen
in % gemessen am Bundesmedian. Ergebnisse des Mikrozensus
www.amtliche-sozialberichterstattung.de (Stand: 20.02.2015)
STIKO (2014) Empfehlungen der Ständigen Impfkommission (STIKO)
am Robert Koch-Institut/Stand: August 2014. Epidemiologisches
Bulletin 25. August 2014 / Nr. 34: 304–340
USDHHS – U.S. Department of Health and Human Services (2006)
The health consequences of involuntary exposure to tobacco smoke:
a report of the Surgeon General. U.S. Department of Health and
Human Services, Centers for Disease Control and Prevention,
Coordinating Center for Health Promotion, National Center for
Chronic Disease Prevention and Health Promotion, Office on
Smoking and Health, Atlanta
USDHHS – U.S. Department of Health and Human Services (2014) The
health consequences of smoking-50 years of progress. A report of the
Surgeon General. U.S. Department of Health and Human Services,
Centers for Disease Control and Prevention, National Center for
Chronic Disease Prevention and Health Promotion, Office on
Smoking and Health, Atlanta
Varnaccia G, Saß AC, Rommel A (2014) Das Unfallgeschehen bei Kindern
und Jugendlichen in Deutschland. Datenquellen und Ergebnisse.
Bundesgesundheitsbl – Gesundheitsforsch – Gesundheitsschutz 57
(6): 613–620
Vingilis E, Wade T, Seeley J (2007) Predictors of adolescent health care
utilization. J Adoles 30 (5): 773–800

1/2015 – GBE kompakt 17Ta
ble
1Ph
ysic
al a
nd m
enta
l hea
lth o
f chi
ldre
n an
d ad
oles
cent
s ac
cord
ing
to s
ocia
l sta
tus.
Pre
vale
nces
/mea
n va
lues
and
age
-adj
uste
d od
ds ra
tios
with
95%
con
fiden
ce in
terv
als
Dat
a so
urce
(20
09 –
201
2)
Topi
cIn
dica
tor(
s)A
geG
irls
Boy
sTo
tal²
Soci
al s
tatu
sSo
cial
sta
tus
Soci
al s
tatu
s
low
m
iddl
e hi
ghlo
w
vs. h
igh
mid
dle
vs. h
igh
low
m
iddl
e hi
ghlo
w
vs. h
igh
mid
dle
vs. h
igh
low
m
iddl
e hi
ghlo
w
vs. h
igh
mid
dle
vs. h
igh
%(9
5 % –
CI)
%(9
5 % –
CI)
%(9
5 % –
CI)
OR
(95 %
– C
I)O
R(9
5 % –
CI)
%(9
5 % –
CI)
%(9
5 % –
CI)
%(9
5 % –
CI)
OR
(95 %
– C
I)O
R(9
5 % –
CI)
%(9
5 % –
CI)
%(9
5 % –
CI)
%(9
5 % –
CI)
OR
(95 %
– C
I)O
R(9
5 % –
CI)
Subj
ectiv
e
heal
thPr
eval
ence
(»f
air
to v
ery
poor
«)3
– 17
10.0
(6.9
– 1
4.3)
6.5
(5.4
– 7
.8)
3.2
(2.3
– 4
.4)
3.18
¹ (1
.86
– 5.
45)
2.03
¹(1
.40
– 2.
95)
11.2
(8.1
– 1
5.2)
5.2
(4.3
– 6
.4)
3.2
(2.4
– 4
.4)
3.63
¹(2
.15
– 6.
11)
1.62
¹ (1
.10
– 2.
40)
10.6
(8
.3 –
13.
6)5.
9 (5
.1 –
6.7
)3.
2 (2
.5 –
4.1
)3.
42¹
(2.3
1 –
5.04
)1.
83¹
(1.3
7 –
2.43
)
Hea
lth-
rela
ted
qu
ality
of l
ifeKI
DSC
REE
N - 1
0 (M
W)
11 –
17
50.9
(49.
4 –
52.4
)52
.1(5
1.4
– 52
.7)
52.9
(52.
0 –
53.7
) –
–
53
.5(5
2.5
– 54
.4)
54.4
(53.
9 –
55.0
)54
.7(5
4.0
– 55
.5)
–
–
52.3
(5
1.4
– 53
.2)
53.2
(52.
8 –
53.7
)53
.8
(53.
2 –
54.4
) –
–
Chr
onic
co
nditi
ons
Prev
alen
ce o
f at l
east
on
e ch
roni
c di
seas
e or
lo
ng-s
tand
ing
heal
th
com
plai
nts
0 –
1713
.0(9
.7 –
17.
2)15
.5
(13.
9 –
17.3
)12
.3(1
0.6
– 14
.2)
1.01
(0
.69
– 1.
47)
1.26
¹(1
.03
– 1.
55)
18.8
(14.
4 –
24.1
)18
.0(1
6.3
– 19
.8)
16.8
(15.
0 –
18.9
)1.
03
(0.7
2 –
1.49
)1.
05
(0.8
7 –
1.26
)16
.0
(13.
1 –
19.2
)16
.8
(15.
6 –
18.0
)14
.6
(13.
4 –
16.0
)1.
02
(0.7
9 –
1.32
)1.
13
(0.9
9 –
1.30
)
Bro
nchi
al
asth
ma
Life
time
prev
alen
ce0
– 17
4.8
(2.9
– 7
.9)
5.6
(4.6
– 6
.8)
4.2
(3.3
– 5
.5)
1.07
(0
.57
– 2.
00)
1.29
(0
.92
– 1.
81)
8.8
(6.2
– 1
2.2)
7.3
(6.3
– 8
.4)
6.4
(5.0
– 8
.0)
1.30
(0
.82
– 2.
05)
1.12
(0
.82
– 1.
52)
6.8
(5.1
– 9
.1)
6.5
(5.7
– 7
.3)
5.3
(4.5
– 6
.4)
1.20
(0
.83
– 1.
76)
1.18
(0
.93
– 1.
50)
12-m
onth
-pre
vale
nce
0 –
174.
2 (2
.4 –
7.1
)3.
6(2
.9 –
4.5
2.4
(1.7
– 3
.5)
1.72
(0
.86
– 3.
46)
1.48
(0
.96
– 2.
28)
6.0
(3.8
– 9
.4)
4.5
(3.7
– 5
.6)
3.7
(2.8
– 4
.9)
1.57
(0
.86
– 2.
87)
1.22
(0
.84
– 1.
76)
5.1
(3.6
– 7
.3)
4.1
(3.5
– 4
.8)
3.1
(2.5
– 3
.9)
1.63
¹(1
.02
– 2.
61)
1.32
(1
.00
– 1.
74)
Hey
feve
r
Life
time
prev
alen
ce0
– 17
8.1
(5.8
– 1
1.4)
11.8
(10.
2 –
13.5
)10
.0(8
.4 –
11.
8)0.
72
(0.4
5 –
1.15
)1.
11(0
.87
– 1.
43)
17.7
(14.
3 –
21.8
)13
.9(1
2.6
– 15
.3)
13.1
(11.
0 –
15.4
)1.
20
(0.8
8 –
1.65
)1.
02(0
.81
– 1.
28)
13.1
(1
0.8
– 15
.7)
12.8
(11.
9 –
13.9
)11
.6
(10.
3 –
13.1
)1.
00
(0.7
7 –
1.29
)1.
06
(0.9
0 –
1.25
)
12-m
onth
-pre
vale
nce
0 –
175.
9(3
.9 –
8.9
)8.
6(7
.3 –
10.
0)7.
3(5
.9 –
9.0
)0.
72
(0.4
2 –
1.24
)1.
11
(0.8
4 –
1.47
)10
.2(7
.5 –
13.
6)10
.6(9
.4 –
11.
99.
6(7
.8 –
11.
7)0.
90
(0.6
0 –
1.34
)1.
05
(0.8
1 –
1.38
)8.
1 (6
.3 –
10.
4)9.
6 (8
.8 –
10.
5)8.
5 (7
.4 –
9.8
)0.
82
(0.6
0 –
1.13
)1.
08
(0.9
0 –
1.29
)
Neu
ro-
derm
atiti
s
Life
time
prev
alen
ce0
– 17
10.0
(7.1
– 1
4.0)
15.1
(13.
6 –
16.7
)16
.6(1
4.8
– 18
.5)
0.54
¹ (0
.36
– 0.
81)
0.86
(0
.73
– 1.
01)
14.1
(10.
7 –
18.5
)13
.4(1
2.1
– 14
.9)
17.2
(15.
1 –
19.6
)0.
75
(0.5
2 –
1.07
)0.
73¹
(0.6
1 –
0.88
)12
.2
(9.7
– 1
5.1)
14.3
(1
3.3
– 15
.3)
16.9
(15.
5 –
18.4
)0.
64¹
(0.4
9 –
0.83
)0.
79¹
(0.7
1 –
0.89
)
12-m
onth
-pre
vale
nce
0 –
174.
9(3
.1 –
7.7
)6.
6(5
.6 –
7.8
)7.
0(5
.8 –
8.4
)0.
71
(0.4
2 –
1.19
)0.
96(0
.75
– 1.
23)
6.2
(3.8
– 9
.9)
4.8
(4.1
– 5
.6)
7.9
(6.5
– 9
.5)
0.88
(0
.50
– 1.
52)
0.61
¹(0
.47
– 0.
79)
5.6
(3.9
– 7
.9)
5.7
(5.0
– 6
.3)
7.4
(6.5
– 8
.4)
0.78
(0
.52
– 1.
16)
0.77
¹ (0
.65
– 0.
91)
Infe
ctio
us
dise
ases
Mea
sles
: Li
fetim
e pr
eval
ence
0 –
1711
.0(7
.9 –
15.
2)6.
8(5
.5 –
8.3
)3.
4(2
.6 –
4.5
)3.
15¹
(1.9
0 –
5.22
)1.
86¹
(1.3
0 –
2.66
)12
.1(8
.8 –
16.
5)6.
4(5
.4 –
7.5
)3.
6(2
.5 –
5.1
)2.
89¹
(1.6
5 –
5.05
)1.
70¹
(1.1
1 –
2.60
)11
.6
(9.1
– 1
4.7)
6.6
(5.7
– 7
.5)
3.5
(2.8
– 4
.3)
3.02
¹(2
.08
– 4.
38)
1.77
¹ (1
.35
– 2.
30)
Chi
cken
pox:
Life
time
prev
alen
ce0
– 17
49.7
(43.
2 –
56.1
)55
.8(5
3.4
– 58
.1)
51.7
(49.
1 –
54.3
)0.
61¹
(0.4
0 –
0.92
)0.
95
(0.7
9 –
1.15
)53
.3(4
7.7
– 58
.8)
51.6
(49.
2 –
54.0
)51
.3(4
8.3
– 54
.3)
0.54
¹ (0
.39
– 0.
75)
0.80
¹ (0
.65
– 0.
97)
51.5
(4
7.0
– 56
.0)
53.7
(5
1.8
– 55
.6)
51.5
(4
9.4
– 53
.6)
0.57
¹ (0
.43
– 0.
74)
0.87
(0
.75
– 1.
00)
Who
opin
g co
ugh:
Life
time
prev
alen
ce0
– 17
3.1
(1.7
– 5
.4)
4.1
(3.3
– 5
.1)
4.0
(2.8
– 5
.6)
0.68
(0
.33
– 1.
37)
0.95
(0.6
3 –
1.45
)7.
4(4
.9 –
10.
9)3.
7(3
.0 –
4.6
)4.
3(3
.1 –
5.9
)1.
63
(0.9
0 –
2.95
)0.
84(0
.56
– 1.
26)
5.3
(3.7
– 7
.4)
3.9
(3.4
– 4
.6)
4.1
(3.3
– 5
.2)
1.15
(0
.71
– 1.
86)
0.90
(0
.67
– 1.
22)
Men
tal h
ealth
pr
oble
ms
SDQ
- To
tal d
ifficu
lties
sco
re3 –
17
29.4
(23.
9 –
35.6
)15
.7(1
4.0
– 17
.7)
8.0
(6.6
– 9
.6)
4.76
¹ (3
.36
– 6.
74)
2.15
¹ (1
.66
– 2.
77)
37.0
(31.
2 –
43.3
)22
.1(2
0.1
– 24
.3)
11.6
(9.6
– 1
4.0)
4.66
¹ (3
.28
– 6.
61)
2.20
¹ (1
.74
– 2.
78)
33.5
(29.
6 –
37.6
)19
.0
(17.
5 –
20.6
)9.
8 (8
.6 –
11.
3)4.
69¹
(3.6
7 –
5.99
)2.
18¹
(1.8
1 –
2.62
)
AD
HD
Life
time
prev
alen
ce3 –
17
2.6
(1.2
– 5
.4)
1.6
(1.2
– 2
.2)
1.2
(0.7
– 2
.0)
1.96
(0
.74
– 5.
22)
1.27
(0
.69
– 2.
34)
13.1
(9.3
– 1
8.1)
7.3
(6.0
– 8
.9)
4.8
(3.6
– 6
.2)
2.68
¹(1
.65
– 4.
35)
1.53
¹ (1
.07
– 2.
17)
8.1
(5.9
– 1
1.1)
4.5
(3.8
– 5
.4)
3.0
(2.4
– 3
.9)
2.53
¹ (1
.63
– 3.
94)
1.47
¹ (1
.08
– 2.
00)
Acc
iden
tal
inju
ries
12-m
onth
-pre
vale
nce
1 – 1
715
.1(1
1.4
– 19
.9)
13.6
(12.
1 –
15.2
)14
.1(1
2.3
– 16
.0)
1.08
(0
.75
– 1.
55)
0.95
(0
.78
– 1.
16)
15.6
(11.
9 –
20.3
)17
.7(1
6.0
– 19
.6)
16.4
(14.
4 –
18.6
)0.
92
(0.6
4 –
1.32
)1.
09
(0.8
9 –
1.34
)15
.4
(12.
6 –
18.6
)15
.7
(14.
5 –
17.0
)15
.3(1
3.8
– 16
.8)
0.99
(0
.76
– 1.
29)
1.03
(0
.88
– 1.
20)
At l
east
one
nig
ht in
ho
spita
l due
to th
e la
st
acci
dent
1 – 1
718
.9(9
.6 –
33.
8)13
.3(9
.7 –
17.
8)8.
4(5
.3 –
13.
0)2.
51
(0.9
2 –
6.85
)1.
65
(0.9
0 –
3.04
)17
.8(9
.0 –
32.
2)11
.1(8
.8 –
14.
0)6.
2(3
.7 –
10.
2)3.
44¹
(1.2
4 –
9.55
)1.
90¹
(1.0
3 –
3.53
)18
.3
(11.
4 –
28.2
)12
.0(1
0.0
– 14
.4)
7.2
(5.1
– 9
.9)
2.92
¹ (1
.41
– 6.
07)
1.78
¹(1
.17
– 2.
72)
OR
= O
dds
Rat
io; C
I = C
onfid
ence
Inte
rval
l,¹ s
tatis
tical
ly s
igni
fican
t (p<
0,05
), ²
The
odd
s ra
tios
are
also
adj
uste
d ac
cord
ing
to g
ende
r.

GBE kompakt – 1/2015 18Ta
ble
2H
ealth
beh
avio
ur o
f chi
ldre
n an
d ad
oles
cent
s ac
cord
ing
to s
ocia
l sta
tus.
Pre
vale
nces
/mea
n va
lues
and
age
-adj
uste
d od
ds ra
tios
with
95%
con
fiden
ce in
terv
als
Dat
a so
urce
: KiG
GS
Wav
e 1
(200
9 –
2012
)
Topi
cIn
dica
tor(
s)A
geG
irls
Boy
sTo
tal²
Soci
al s
tatu
sSo
cial
sta
tus
Soci
al s
tatu
s
low
m
iddl
e hi
ghlo
w
vs. h
igh
mid
dle
vs. h
igh
low
m
iddl
e hi
ghlo
w
vs. h
igh
mid
dle
vs. h
igh
low
m
iddl
e hi
ghlo
w
vs. h
igh
mid
dle
vs. h
igh
%(9
5 % –
CI)
%(9
5 % –
CI)
%(9
5 % –
CI)
OR
(95 %
– C
I)O
R(9
5 % –
CI)
%(9
5 % –
CI)
%(9
5 % –
CI)
%(9
5 % –
CI)
OR
(95 %
– C
I)O
R(9
5 % –
CI)
%(9
5 % –
CI)
%(9
5 % –
CI)
%(9
5 % –
CI)
OR
(95 %
– C
I)O
R(9
5 % –
CI)
Frui
t co
nsum
ptio
nD
aily
con
sum
ptio
n3
– 17
53.4
(46.
9 –
59.7
)64
.9(6
2.4
– 67
.4)
80.2
(7
7.6
– 82
.6)
0.30
¹(0
.22
– 0.
41)
0.48
¹ (0
.39
– 0.
58)
45.7
(4
0.2
– 51
.3)
56.4
(5
4.0
– 58
.8)
70.7
(6
7.2
– 74
.0)
0.38
¹ (0
.28
– 0.
52)
0.54
¹ (0
.45
– 0.
65)
49.3
(45.
2 –
53.4
)60
.7(5
8.8
– 62
.5)
75.3
(73.
0 –
77.5
)0.
34¹
(0.2
7 –
0.43
)0.
51¹
(0.4
5 –
0.58
)
vege
teab
le
cons
umpt
ion
Dai
ly c
onsu
mpt
ion
3 –
1742
.3(3
6.3
– 48
.5)
43.5
(40.
8 –
46.1
)61
.2(5
8.0
– 64
.4)
0.48
¹(0
.36
– 0.
63)
0.50
¹(0
.42
– 0.
59)
33.7
(28.
6 –
39.1
)38
.0(3
5.3
– 40
.7)
55.1
(51.
9 –
58.3
)0.
43¹
(0.3
4 –
0.56
)0.
51¹
(0.4
3 –
0.60
)37
.8(3
3.6
– 42
.1)
40.7
(38.
6 –
42.9
)58
.1(5
5.6
– 60
.5)
0.45
¹(0
.37
– 0.
55)
0.50
¹(0
.44
– 0.
57)
Bre
akfa
st
at h
ome
Ever
y w
eekd
ay (
only
sc
hool
pup
ils)
5 –
1748
.7(4
2.0
– 55
.4)
64.5
(61.
7 –
67.2
)77
.4(7
3.9
– 80
.6)
0.30
¹(0
.21
– 0.
43)
0.56
¹(0
.44
– 0.
72)
57.1
(50.
8 –
63.3
)69
.0(6
6.1
– 71
.7)
82.2
(79.
2 –
84.8
)0.
31¹
(0.2
2 –
0.43
)0.
48¹
(0.3
8 –
0.61
)53
.2(4
8.0
– 58
.4)
66.7
(64.
5 –
68.9
)79
.9(7
7.5
– 82
.0)
0.31
¹(0
.24
– 0.
40)
0.52
¹(0
.44
– 0.
62)
Phys
ical
ac
tivity
Phys
ical
ly a
ctiv
e at
leas
t 60
min
utes
dai
ly3
– 17
28.5
(22.
6 –
35.3
)24
.3(2
2.0
– 26
.7)
26.9
(24.
2 –
29.9
)1.
43(0
.98
– 2.
09)
1.00
(0.8
2 –
1.21
)28
.0(2
3.2
– 33
.4)
30.0
(27.
5 –
32.5
)30
.2(2
7.3
– 33
.2)
1.12
(0.8
1 –
1.56
)1.
06(0
.89
– 1.
27)
28.3
(24.
2 –
32.7
)27
.1(2
5.3
– 29
.0)
28.6
(26.
6 –
30.7
)1.
26(0
.97
– 1.
63)
1.03
(0.9
0 –
1.18
)
Act
ive
less
oft
en th
an o
n 2
days
per
wee
kv3
– 17
13.1
(9.4
– 1
8.1)
8.0
(6.7
– 9
.4)
3.3
(2.3
– 4
.7)
3.91
¹(2
.35
– 6.
51)
2.34
¹(1
.56
– 3.
52)
10.9
(7.4
– 1
5.7)
3.7
(3.0
– 4
.7)
1.3
(0.8
– 2
.1)
9.02
¹(4
.69
– 17
.34)
2.92
¹(1
.72
– 4.
96)
11.9
(9.2
– 1
5.3)
5.8
(5.1
– 6
.7)
2.3
(1.7
– 3
.1)
5.43
¹(3
.64
– 8.
10)
2.54
¹(1
.83
– 3.
52)
Spor
ting
ac
tivity
Act
ive
in s
port
3 –
1762
.0(5
5.3
– 68
.2)
78.0
(75.
8 –
80.0
)86
.5(8
3.9
– 88
.7)
0.24
¹(0
.17
– 0.
33)
0.54
¹(0
.43
– 0.
67)
70.4
(64.
3 –
75.8
)78
.8(7
6.6
– 80
.8)
87.7
(85.
6 –
89.6
)0.
26¹
(0.1
8 –
0.37
)0.
48¹
(0.3
9 –
0.59
)66
.4(6
1.7
– 70
.8)
78.4
(76.
8 –
79.9
)87
.1(8
5.4
– 88
.6)
0.25
¹(0
.20
– 0.
33)
0.50
¹(0
.43
– 0.
59)
Spor
t in
a cl
ub3
– 17
36.0
(30.
0 –
42.4
)59
.7(5
6.9
– 62
.5)
70.1
(66.
5 –
73.4
)0.
24¹
(0.1
8 –
0.33
)0.
64¹
(0.5
4 –
0.75
)48
.7(4
2.3
– 55
.2)
62.2
(59.
5 –
64.9
)77
.9(7
5.0
– 80
.5)
0.24
¹(0
.18
– 0.
34)
0.45
¹(0
.37
– 0.
55)
42.8
(38.
5 –
47.2
)61
.0(5
8.9
– 63
.0)
74.1
(71.
7 –
76.3
)0.
25¹
(0.2
0 –
0.31
)0.
54¹
(0.4
7 –
0.61
)
Abi
lity
to
swim
Abl
e to
sw
im5
– 17
78.2
(71.
7 –
83.5
)88
.8(8
6.8
– 90
.5)
91.5
(89.
3 –
93.3
)0.
16¹
(0.0
8 –
0.30
)0.
57¹
(0.4
1 –
0.80
)76
.0(6
9.7
– 81
.4)
84.8
(82.
3 –
86.9
)89
.8(8
7.5
– 91
.6)
0.12
¹(0
.07
– 0.
21)
0.45
¹(0
.33
– 0.
62)
77.0
(72.
4 –
81.0
)86
.8(8
5.1
– 88
.3)
90.6
(89.
0 –
92.0
)0.
14¹
(0.0
9 –
0.21
)0.
50¹
(0.3
9 –
0.64
)
Age
whe
n le
arne
d to
sw
im
(mea
n)5
– 17
6.8
(6.5
– 7
.1)
5.9
(5.8
– 6
.0)
5.3
(5.2
– 5
.4)
–
–
7.3
(7.0
– 7
.7)
6.2
(6.0
– 6
.3)
5.7
(5.5
– 5
.8)
–
–
7.1¹
(6.8
– 7
.3)
6.0¹
(5.9
– 6
.1)
5.5¹
(5.4
– 5
.6)
–
–
Elec
tron
ic
med
ia u
se
Dur
atio
n of
use
of s
cree
n m
edia
(TV
/ vi
deo,
gam
e co
nsol
es, P
C /
Inte
rnet
) m
ore
than
5 h
rs /
day
11 –
17
24.7
(18.
2 –
32.6
)16
.2(1
4.0
– 18
.7)
8.1
(5.7
– 1
1.3)
3.48
¹(2
.05
– 5.
90)
2.12
¹(1
.43
– 3.
14)
36.1
(28.
8 –
44.3
)31
.1(2
7.8
– 34
.6)
13.4
(10.
7 –
16.6
)3.
57¹
(2.3
2 –
5.50
)2.
97¹
(2.1
9 –
4.03
)30
.9(2
6.1
– 36
.2)
23.5
(21.
4 –
25.7
)10
.8(8
.9 –
13.
1)3.
56¹
(2.5
5 –
4.98
)2.
62¹
(2.0
6 –
3.32
)
Alc
ohol
co
nsum
ptio
n
haza
rdou
s co
nsum
ptio
n
(AU
DIT
-C)
11 –
17
15.6
(10.
5 –
22.7
)17
.7(1
5.2
– 20
.5)
14.5
(11.
3 –
18.2
)0.
80(0
.43
– 1.
50)
1.13
(0.7
6 –
1.67
)15
.1(1
0.7
– 20
.7)
15.0
(12.
7 –
17.7
)16
.1(1
2.6
– 20
.3)
0.66
(0.3
7 –
1.19
)0.
85(0
.56
– 1.
31)
15.3
(11.
7 –
19.8
)16
.4(1
4.4
– 18
.5)
15.3
(13.
0 –
17.9
)0.
73(0
.49
– 1.
09)
0.98
(0.7
3 –
1.32
)
regu
lar
bing
e dr
inki
ng11
– 1
78.
0(4
.4 –
13.
9)11
.3(9
.2 –
13.
8)7.
4(5
.3 –
10.
3)0.
85(0
.40
– 1.
81)
1.47
(0.9
4 –
2.31
)12
.9(9
.0 –
18.
2)13
.8(1
1.6
– 16
.2)
12.0
(9.0
– 1
5.9)
0.86
(0.4
8 –
1.52
)1.
20(0
.78
– 1.
84)
10.7
(7.8
– 1
4.3)
12.5
(10.
9 –
14.4
)9.
8(7
.9 –
12.
2)0.
86(0
.56
– 1.
32)
1.31
(0.9
4 –
1.82
)
Toba
cco
co
nsum
ptio
n
Smok
ing
now
l11
– 1
713
.9
(9.2
– 2
0.5)
12.3
(1
0.1
– 15
.0)
7.5
(5.2
– 1
0.5)
1.70
(0
.90
– 3.
22)
1.64
¹ (1
.02
– 2.
64)
14.8
(1
0.2
– 20
.9)
11.3
(9
.6 –
13.
3)10
.3
(7.9
– 1
3.2)
1.31
(0
.74
– 2.
35)
1.10
(0
.75
– 1.
62)
14.4
(1
1.1
– 18
.5)
11.8
(1
0.4
– 13
.4)
8.9
(7.1
– 1
1.1)
1.48
(1
.00
– 2.
19)
1.33
(0
.97
– 1.
82)
Smok
ing
daily
11 –
17
7.7
(4.7
– 1
2.3)
5.6
(4.0
– 7
.7)
1.0
(0.3
– 3
.4)
7.02
¹ (1
.87
– 26
.41)
5.41
¹ (1
.54
– 19
.01)
8.5
(5.3
– 1
3.4)
5.1
(3.9
– 6
.6)
3.1
(2.0
– 4
.7)
2.65
¹ (1
.31
– 5.
36)
1.70
¹ (1
.01
– 2.
85)
8.1
(5.8
– 1
1.3)
5.3
(4.3
– 6
.5)
2.1
(1.4
– 3
.2)
3.71
¹ (2
.05
– 6.
69)
2.61
¹ (1
.57
– 4.
32)
OR
= O
dds
Rat
io; C
I = C
onfid
ence
Inte
rval
l,¹ s
tatis
tical
ly s
igni
fican
t (p<
0,05
), ²
The
odd
s ra
tios
are
also
adj
uste
d ac
cord
ing
to g
ende
r.Co
ntin
ued
on n
ext p
age

1/2015 – GBE kompakt 19Ta
ble
2, c
ontin
ued
Hea
lth b
ehav
iour
of c
hild
ren
and
adol
esce
nts
acco
rdin
g to
soc
ial s
tatu
s. P
reva
lenc
es/m
ean
valu
es a
nd a
ge-a
djus
ted
odds
ratio
s w
ith 9
5% c
onfid
ence
inte
rval
s D
ata
sour
ce: K
iGG
S W
ave
1 (2
009
– 20
12)
Topi
cIn
dica
tor(
s)A
geG
irls
Boy
sTo
tal²
Soci
al s
tatu
sSo
cial
sta
tus
Soci
al s
tatu
s
low
m
iddl
e hi
ghlo
w
vs. h
igh
mid
dle
vs. h
igh
low
m
iddl
e hi
ghlo
w
vs. h
igh
mid
dle
vs. h
igh
low
m
iddl
e hi
ghlo
w
vs. h
igh
mid
dle
vs. h
igh
%(9
5 % –
CI)
%(9
5 % –
CI)
%(9
5 % –
CI)
OR
(95 %
– C
I)O
R(9
5 % –
CI)
%(9
5 % –
CI)
%(9
5 % –
CI)
%(9
5 % –
CI)
OR
(95 %
– C
I)O
R(9
5 % –
CI)
%(9
5 % –
CI)
%(9
5 % –
CI)
%(9
5 % –
CI)
OR
(95 %
– C
I)O
R(9
5 % –
CI)
Wat
erpi
pe
cons
umpt
ion
Life
time
prev
alen
ce12
– 1
727
,3
(20,
3 –
35,7
)27
,3
(24,
1 –
30,7
)22
,7
(18,
4 –
27,7
)1,
16
(0,7
0 –
1,92
)1,
17
(0,8
3 –
1,64
)40
,5
(33,
5 –
47,9
)27
,2
(24,
2 –
30,3
)29
,2
(24,
8 –
33,9
)1,
49
(0,9
9 –
2,25
)0,
82
(0,6
0 –
1,12
)34
,3
(29,
1 –
39,9
)27
,2
(24,
9 –
29,7
)26
,1
(22,
9 –
29,6
)1,
33
(0,9
7 –
1,84
)0,
97
(0,7
8 –
1,21
)
30-d
ay-p
reva
lenc
e12
– 1
79,
7 (5
,5 –
16,
5)8,
6 (6
,8 –
10,
9)4,
9 (2
,9 –
8,1
)1,
97
(0,8
4 –
4,60
)1,
73
(0,9
8 –
3,06
)14
,7
(10,
0 –
21,1
)10
,3
(8,2
– 1
2,9)
9,6
(7,0
– 1
3,2)
1,41
(0
,81
– 2,
45)
1,03
(0
,64
– 1,
68)
12,4
(8
,8 –
17,
1)9,
5 (8
,0 –
11,
2)7,
4 (5
,6 –
9,8
)1,
60
(0,9
9 –
2,59
)1,
26
(0,9
0 –
1,78
)
Pass
ive
smo-
king
exp
osur
e
(onl
y no
n-sm
okin
g ch
ildre
n an
d ad
oles
cent
s)
Stay
ing
in r
oom
s, th
at
are
smok
ed in
(at
leas
t se
vera
l tim
es p
er w
eek)
11 –
17
26,8
(2
0,2
– 34
,4)
19,0
(16,
2 –
22,2
)9,
1 (6
,9 –
11,
8)3,
44¹
(2,1
2 –
5,58
)2,
31¹
(1,5
9 –
3,34
)26
,1
(19,
9 –
33,4
)19
,6
(16,
8 –
22,7
)7,
4 (5
,2 –
10,
4)4,
33¹
(2,5
3 –
7,41
)3,
14¹
(2,0
4 –
4,83
)26
,4
(21,
9 –
31,5
)19
,3
(17,
2 –
21,5
)8,
2 (6
,5 –
10,
3)3,
84¹
(2,6
4 –
5,57
)2,
67¹
(1,9
9 –
3,60
)
Smok
ing
at h
ome
in
pres
cenc
e of
chi
ld0
– 17
22,3
(1
7,6
– 27
,8)
10,6
(9
,0 –
12,
4)3,
4 (2
,5 –
4,7
)7,
87¹
(5,0
4 –
12,2
7)3,
23¹
(2,2
5 –
4,63
)24
,1
(19,
2 –
29,8
)9,
1 (7
,6 –
10,
9)3,
1 (2
,2 –
4,4
)8,
97¹
(5,6
9 –
14,1
5)3,
02¹
(2,0
0 –
4,57
)23
,2
(19,
6 –
27,3
)9,
9 (8
,8 –
11,
0)3,
3 (2
,5 –
4,2
)8,
42¹
(6,0
0 –
11,8
2)3,
13¹
(2,3
8 –
4,12
)
Mat
erna
l sm
okin
g in
pr
egna
ncy
Prev
alen
ce0
– 6
29,8
(2
0,5
– 41
,1)
10,1
(7
,4 –
13,
6)2,
6 (1
,4 –
5,0
)16
,05¹
(6
,77
– 38
,03)
4,17
¹ (2
,07
– 8,
43)
26,7
(1
7,2
– 39
,1)
12,0
(9
,3 –
15,
4)1,
9 (1
,1 –
3,4
)19
,11¹
(8
,23
– 44
,38)
7,02
¹(3
,58
– 13
,75)
28,4
(2
1,6
– 36
,3)
11,1
(9
,1 –
13,
4)2,
2 (1
,5 –
3,4
)17
,33¹
(9
,67
– 31
,07)
5,43
¹(3
,39
– 8,
70)
Bre
astf
eedi
ng
beha
viou
r
Bre
astf
eedi
ng r
ate
(e
ver
brea
stfe
d)0
– 6
73,4
(6
2,1
– 82
,3)
83,0
(7
9,5
– 86
,0)
93,4
(9
0,5
– 95
,5)
0,19
¹ (0
,10
– 0,
38)
0,34
¹ (0
,22
– 0,
53)
66,7
(5
4,9
– 76
,7)
80,2
(7
6,2
– 83
,7)
91,2
(8
8,1
– 93
,5)
0,20
¹(0
,11
– 0,
36)
0,39
¹ (0
,27
– 0,
58)
70,4
(6
2,3
– 77
,3)
81,5
(7
8,9
– 83
,9)
92,2
(9
0,1
– 93
,9)
0,20
¹ (0
,13
– 0,
31)
0,37
¹ (0
,28
– 0,
50)
Excl
usiv
e gr
east
feed
ing
for
at le
ast 4
mon
ths
0 –
625
,6
(16,
3 –
37,7
)35
,4
(31,
5 –
39,4
)49
,2
(44,
7 –
53,7
)0,
35¹
(0,1
9 –
0,63
)0,
57¹
(0,4
3 –
0,74
)11
,2
(6,9
– 1
7,7)
29,5
(2
6,0
– 33
,4)
48,7
(4
4,2
– 53
,3)
0,13
¹(0
,08
– 0,
23)
0,44
¹ (0
,34
– 0,
56)
19,4
(1
3,4
– 27
,0)
32,3
(2
9,6
– 35
,1)
48,9
(4
5,7
– 52
,2)
0,24
¹ (0
,15
– 0,
37)
0,49
¹(0
,41
– 0,
59)
OR
= O
dds
Rat
io; C
I = C
onfid
ence
Inte
rval
l,¹ s
tatis
tical
ly s
igni
fican
t (p<
0,05
), ²
The
odd
s ra
tios
are
also
adj
uste
d ac
cord
ing
to g
ende
r.

GBE kompakt – 1/2015 20Ta
ble
3H
ealth
car
e pr
ovis
ion
for c
hild
ren
and
adol
esce
nts
acco
rdin
g to
soc
ial s
tatu
s. P
reva
lenc
es/m
ean
valu
es a
nd a
ge-a
djus
ted
odds
ratio
s w
ith 9
5% c
onfid
ence
inte
rval
sD
ata
s0ur
ce: K
iGG
S W
ave
1 (2
009
– 20
12)
Topi
cIn
dica
tor(
s)A
geG
irls
Boy
sTo
tal²
Soci
al s
tatu
sSo
cial
sta
tus
Soci
al s
tatu
s
low
m
iddl
e hi
ghlo
w
vs. h
igh
mid
dle
vs. h
igh
low
m
iddl
e hi
ghlo
w
vs. h
igh
mid
dle
vs. h
igh
low
m
iddl
e hi
ghlo
w
vs. h
igh
mid
dle
vs. h
igh
%(9
5 % –
CI)
%(9
5 % –
CI)
%(9
5 % –
CI)
OR
(95 %
– C
I)O
R(9
5 % –
CI)
%(9
5 % –
CI)
%(9
5 % –
CI)
%(9
5 % –
CI)
OR
(95 %
– C
I)O
R(9
5 % –
CI)
%(9
5 % –
CI)
%(9
5 % –
CI)
%(9
5 % –
CI)
OR
(95 %
– C
I)O
R(9
5 % –
CI)
Visi
t to
regi
ster
ed
doct
or
12-m
onth
-pre
vale
nce
of u
tiliz
atio
n0
– 17
90.8
(86.
6 –
93.8
)92
.6(9
1.3
– 93
.7)
90.7
(88.
9 –
92.3
)1.
09(0
.66
– 1.
79)
1.37
¹(1
.04
– 1.
79)
91.3
(88.
1 –
93.8
)92
.1(9
0.8
– 93
.2)
92.6
(90.
7 –
94.0
)1.
03(0
.65
– 1.
63)
1.00
(0.7
5 –
1.34
)91
.1
(88.
6 –
93.1
)92
.4(9
1.4
– 93
.2)
91.7
(90.
3 –
92.8
)1.
06(0
.76
– 1.
46)
1.17
(0.9
6 –
1.43
)
Paed
iatr
icia
n vi
sits
12-m
onth
-pre
vale
nce
of u
tiliz
atio
n0
– 17
67.2
(61.
6 –
72.3
)65
.9(6
3.4
– 68
.4)
70.9
(67.
8 –
73.8
)1.
04
(0.7
4 –
1.46
)0.
92(0
.76
– 1.
09)
65.8
(60.
5 –
70.6
)68
.9(6
6.2
– 71
.5)
71(6
7.9
– 73
.9)
1.19
(0.8
9 –
1.61
)1.
03(0
.85
– 1.
25)
66.4
(62.
5 –
70.2
)67
.4(6
5.2
– 69
.5)
70.9
(6
8.6
– 73
.2)
1.11
(0.8
8 –
1.40
)0.
97(0
.85
– 1.
11)
Hos
pita
lisa-
tion
12-m
onth
-pre
vale
nce
0 –
1716
.5(1
2.4
– 21
.5)
8.2
(7.1
– 9
.4)
7.8
(6.2
– 9
.6)
2.35
¹ (1
.57
– 3.
52)
1.06
(0.8
0 –
1.41
)11
.2(7
.9 –
15.
8)9.
9(8
.7 –
11.
1)6.
3(5
.1 –
7.8
)2.
01¹
(1.2
4 –
3.26
)1.
65¹
(1.2
7 –
2.16
)13
.8(1
1.1
– 16
.9)
9.0
(8.2
– 9
.9)
7.0
(6.0
– 8
.2)
2.18
¹(1
.67
– 2.
85)
1.33
¹(1
.10
– 1.
62)
Aver
age
num
ber
of
nigh
ts in
chi
ldre
n w
ith
hosp
ital s
tay
in la
st 1
2 m
onth
(m
ean)
0 –
177.
2(2
.2 –
12.
1)6.
1(4
.8 –
7.3
)5.
4 (2
.7 –
8.1
) –
–
7.
7(4
.8 –
10.
7)6.
0(4
.8 –
7.1
)5.
3(4
.0 –
6.7
) –
–
7.
4 (4
.3 –
10.
5)6.
0 (5
.2 –
6.8
)5.
4 (3
.9 –
6.9
) –
–
Early
de
tect
ion
ex-
amin
atio
ns/
Scre
enin
g
Com
plet
e se
ries
(U
3 to
U9)
7 –
1370
.7(6
0.4
– 79
.2)
83.4
(79.
9 –
86.4
)89
.2(8
6.0
– 91
.7)
0.29
¹ (0
.17
– 0.
51)
0.61
¹(0
.42
– 0.
91)
76.9
(68.
1 –
83.8
)82
.5(7
9.4
– 85
.3)
85.5
(81.
0 –
89.0
)0.
57¹
(0.3
3 –
0.99
)0.
80(0
.55
– 1.
17)
74.1
(6
7.8
– 79
.6)
83.0
(80.
7 –
85.1
)87
.3(8
4.7
– 89
.5)
0.42
¹(0
.29
– 0.
61)
0.71
¹ (0
.54
– 0.
93)
HPV
- va
ccin
atio
n
ever
vac
cina
ted
14 –
17
52.9
(41.
9 –
63.7
)55
.9
(51.
0 –
60.6
)39
.2(3
2.2
– 46
.7)
1.72
(0
.97
– 3.
05)
1.98
¹(1
.33
– 2.
94)
–
–
–
–
–
–
–
–
–
–
com
plet
e H
PV
vacc
inat
ed (
3 do
ses)
14 –
17
41.0
(3
1.3
– 51
.4)
41.0
(35.
9 –
46.2
)32
.1(2
5.3
– 39
.8)
1.45
(0.8
2 –
2.54
)1.
47(0
.95
– 2.
28)
–
–
–
–
–
–
–
–
–
–
Che
ck u
p vi
sit a
t the
de
ntis
t
Less
oft
en th
an
annu
ally
3 –
1710
.5(6
.7 –
16.
0)3.
1(2
.3 –
4.2
)3.
4(2
.4 –
4.9
)3.
81¹
(2.0
3 –
7.16
)0.
97(0
.62
– 1.
50)
9.4
(5.7
– 1
5.3)
3.9
(2.9
– 5
.2)
3.1
(2.2
– 4
.4)
4.03
¹(2
.06
– 7.
86)
1.34
(0
.87
– 2.
05)
9.9
(7.1
– 1
3.7)
3.5
(2.8
– 4
.3)
3.3
(2.6
– 4
.1)
3.91
¹(2
.54
– 6.
04)
1.15
(0.8
5 –
1.55
)
OR
= O
dds
Rat
io; C
I = C
onfid
ence
Inte
rval
l,¹ s
tatis
tical
ly s
igni
fican
t (p<
0,05
), ²
The
odd
s ra
tios
are
also
adj
uste
d ac
cord
ing
to g
ende
r.

1/2015 – GBE kompakt 21
ImprintGBE kompakt
Published byRobert Koch Institute
Nordufer 2013353 Berlin
Editors Martina Rabenberg, Dr. Livia Ryl
Robert Koch InstituteDepartment of Epidemiology and Health Monitoring
General-Pape-Straße 6212101 Berlin
Tel.: 030-18 754-3400Email: [email protected]
www.rki.de/gesundheitsberichterstattung
How to quoteLampert T, Kuntz B, KiGGS Study Group (2015)
Growing up healthy –What significance does social status have?
Eds. Robert Koch Institute, Berlin. GBE kompakt 6(1)
www.rki.de/gbe-kompakt (Accessed: 01.03.2015)
ISSN 2191-4974
The Robert Koch Institute is a Federal Insitute within theportfolio of the German Federal Ministry of Health


![ARDUINO UNO R3 BASED 20A ROBOT CONTROL BOARD [RKI-1580]robokits.download/datasheets/RKI-1580(User_Manual).pdf · ARDUINO UNO R3 BASED 20A ROBOT CONTROL BOARD [RKI-1580] Page 1](https://static.fdocuments.us/doc/165x107/5b0413617f8b9a4e538d2c10/arduino-uno-r3-based-20a-robot-control-board-rki-1580-usermanualpdf-arduino.jpg)