GBB sensor talk - NERACOOS | weather | ocean | marine...
17
Great Bay Nutrient Sensor Stakeholder Workshop 1. Oceanography 2. Nutrient dynamics 3. Great Bay Buoy – turbo edi@on Joe Salisbury Gopal Mulukutla Chris Hunt Tom Gregory
Transcript of GBB sensor talk - NERACOOS | weather | ocean | marine...

Great Bay Nutrient Sensor Stakeholder Workshop
1. Oceanography 2. Nutrient dynamics 3. Great Bay Buoy – turbo edi@on
Joe Salisbury Gopal Mulukutla Chris Hunt Tom Gregory


NHEP, 2000


Seasonal Cycle of Nitrate in Great Bay
Ru Morrison

The GBB Satlan@c ISUS NO3 from the 2011 deployment
05/01 06/01 07/01 08/01 09/01 10/01 11/01 12/010
0.05
0.1
0.15
0.2
0.25
Nitr
ate
(mg
N /L
)
Sensor DerivedGrab Data
7.346 7.3465 7.347 7.3475 7.348 7.3485x 10⁵
0
0.05
0.1
0.15
0.2
0.28
Nitra
te(N
O3−
N m
g/L
)
7.346 7.3465 7.347 7.3475 7.348 7.3485x 10⁵
0
10
20
30
40
50
LR
flo
w(m
3 /s)
GBB−NO3−filtered
River inflow
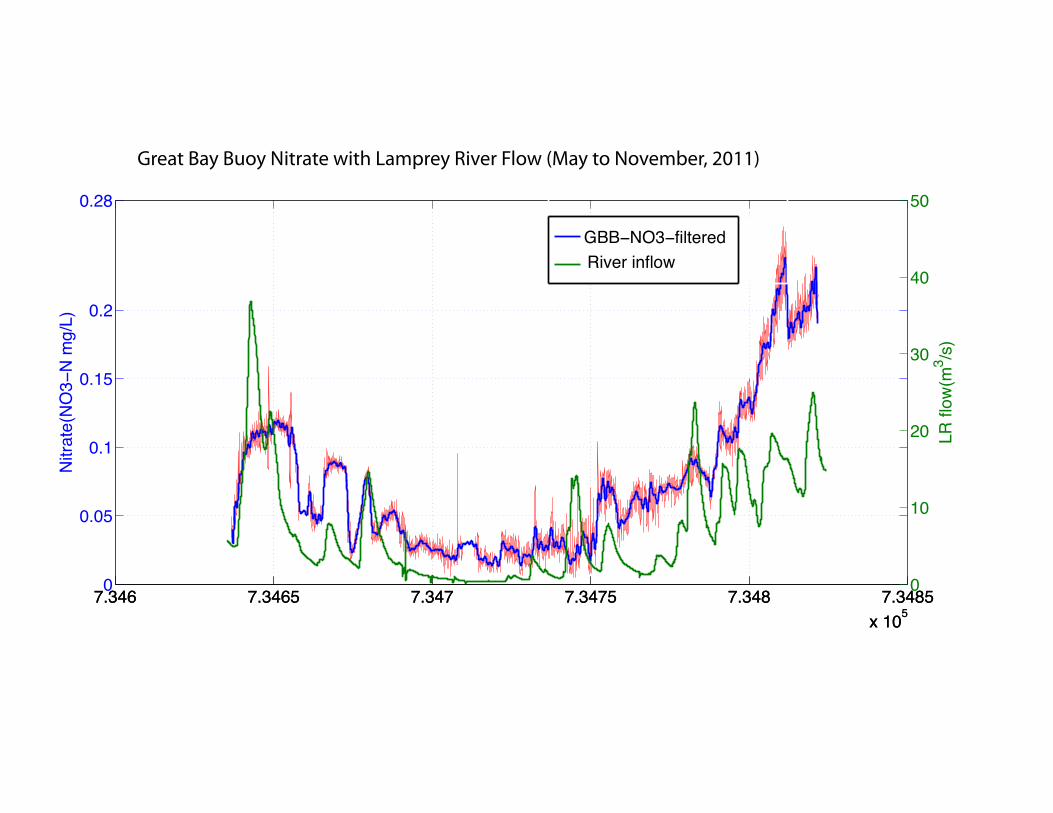
Great Bay Buoy Nitrate with Lamprey River Flow (May to November, 2011)

7.346 7.3465 7.347 7.3475 7.348 7.3485x 10⁵
0
0.05
0.1
0.15
0.2
0.28
Nitra
te(N
O3
−N
mg
/L)
7.346 7.3465 7.347 7.3475 7.348 7.3485x 10⁵
0
10
20
30
40
50
LR
flo
w(m
3 /s)
River−NO3
River inflow
Lamprey River Flow and Nitrate (May to November, 2011)

7.346 7.3465 7.347 7.3475 7.348 7.3485x 10⁵
0
0.05
0.1
0.15
0.2
0.28
Nitra
te(N
O3
−N
mg
/L)
7.346 7.3465 7.347 7.3475 7.348 7.3485x 10⁵
0
10
20
30
40
50
LR
flo
w(m
3 /s)
GBB−NO3−filtered
River inflow
Great Bay Buoy Nitrate with Lamprey River Flow (May to November, 2011)
7.346 7.3465 7.347 7.3475 7.348 7.3485x 10⁵
0
0.05
0.1
0.15
0.2
0.28N
itra
te(N
O3−
N m
g/L
)
7.346 7.3465 7.347 7.3475 7.348 7.3485x 10⁵
0
10
20
30
40
50
LR
flo
w(m
3 /s)
River−NO3
River inflow
Lamprey River Flow and Nitrate (May to November, 2011)
Several dilu@on events
Apparent land subsidy events

Spa@al NO3-‐ distribu@ons throughout the Bay
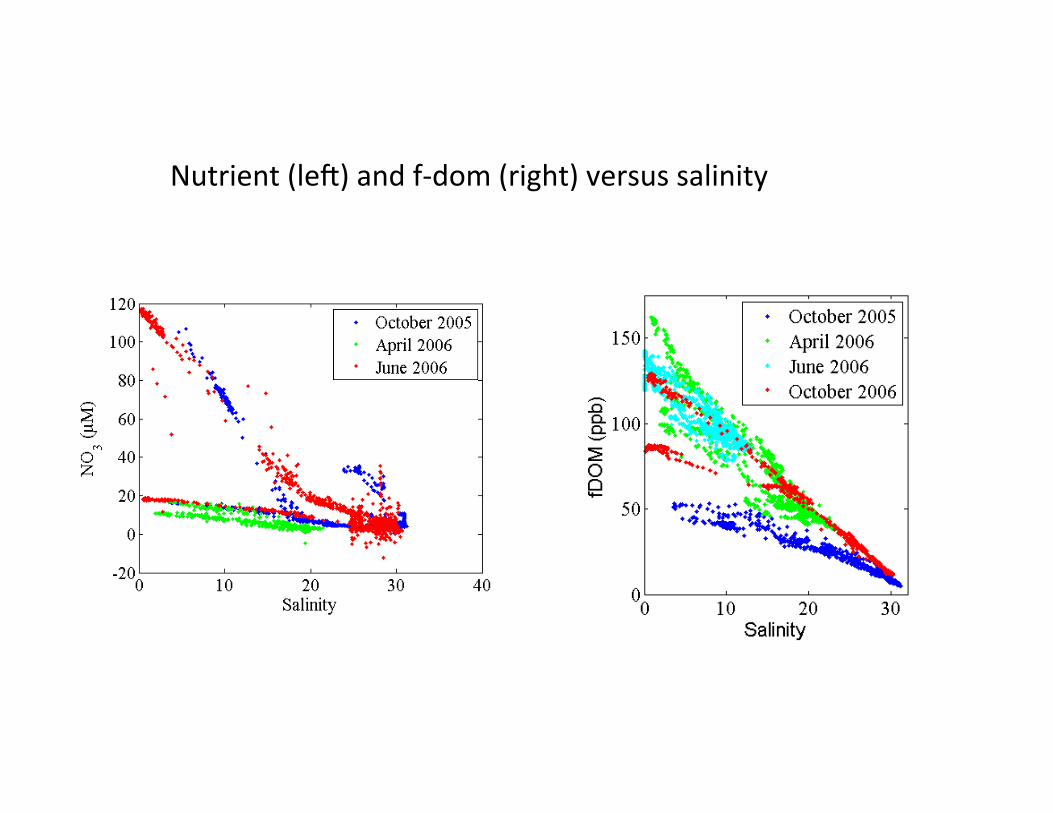
Nutrient (leR) and f-‐dom (right) versus salinity

Great Bay Buoy: a tool for nutrient management
Sensors: Salinity, temperature Dissolved oxygen, Chlorophyll fluorescence Organic maXer fluorescence Turbidity Downwelling light (PAR) at surface and 1 m Upwelling light at 1m Wind speed and direc@on Air temp and pressure
New Turbo edi0on Wetlabs Cycle PO4 Wetlabs Cycle NH3 (July) Satlan@c SUNA NO3
-‐
Sunburst SAMI CO2

6
7
8
9
10
11
12
05/03 05/10 05/17 05/24 05/3116
18
20
22
24
26
28
Recent Great Bay Buoy Nitrate (red) and Salinity (blue)
NO
3- (um
ol)
Salin
ity

The Satlan@c SUNA V2 UV nitrate sensor
New instrumenta0on on the GBB
The Wetlabs Cycle PO4
The Sunburst Instruments SAMI CO2

hXp://www.neracoos.org/real@me_map
Great Bay Buoy data on the web
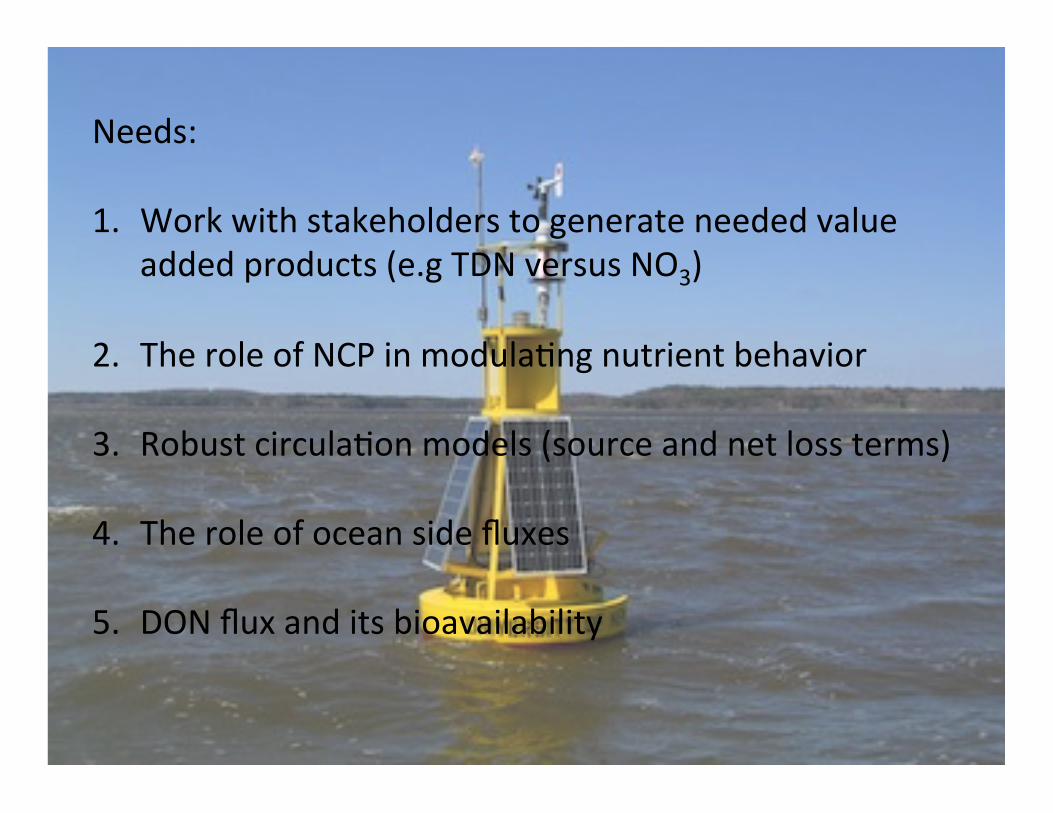
Needs: 1. Work with stakeholders to generate needed value
added products (e.g TDN versus NO3)
2. The role of NCP in modula@ng nutrient behavior 3. Robust circula@on models (source and net loss terms)
4. The role of ocean side fluxes
5. DON flux and its bioavailability
Thanks! NERACOOS NOAA – IOOS NOAA-‐ OAP UNH