
Gavesana Journal of Management - vjim.edu.in · 1997; Kusumo et al., n.d.). Review of Literature...
92
Gavesana Journal of Management Owner’s Name : Vignana Jyothi Institute of Management Published by : Vignana Jyothi Institute of Management Vignana Jyothi Nagar, Bachupally, Via Kukatpally, Hyderabad - 500090. Andhra Pradesh. Ph:040-23044901/02 E-mail: [email protected] Website: vjim.edu.in Editor : Dr. Kamal Ghosh Ray Printer : Mr. P. Narendra Printed at : Pragati Offset Pvt. Ltd., No.17, Red Hills, Hyderabad - 500004. Andhra Pradesh. Phone: 040-23304837. (i) Vol. 5 Issue. 1 January 2013 - June 2013 Editorial Environmental Reporting Practices : A Study of Yagnesh Dalvadi and 1 Select Indian Companies Tejas Gandhi Positive and Critical Classification Stakeholders: The Case of Bayer AG Germany Sangita Ghosh Ray 10 India’s Competitiveness in a Globalised Economy: A Jagannatha Reddy 18 Issues and Challenges for Pharmaceutical Sector Y. Ramakrishna B. Krishna Reddy Aryasri Co-Movements of the Indian Stock Market with Select Emerging Markets P. Bhanu Sireesha 32 Moral Appeals for Brand Positioning – Issues and Perspectives A.Ramesh 47 Income Status of Migrant Labours at Alang Ship Breaking Yard Hrudanand Misra 59 Finding Frequent Item Sets on Post Mining data Using Jayanti Mukhopadhyay, 64 Normalized Mutual Information Prof. Rohit Kamal Chatterjee Integrating Soft Skills with Business English: Value Creation for Management Students I.Padmini 71 Leadership Styles and Emotional Intelligence among Arif Syed 78 Hospital Managers ChandraSekhar, S.F Abstract of Ph.D Thesis Workplace Stress among Women in IT Sector A.Sandhya Rani 86
Transcript of Gavesana Journal of Management - vjim.edu.in · 1997; Kusumo et al., n.d.). Review of Literature...

Gavesana
Journal of Management
Owner’s Name : Vignana Jyothi Institute of Management
Published by : Vignana Jyothi Institute of ManagementVignana Jyothi Nagar, Bachupally, Via Kukatpally,Hyderabad - 500090. Andhra Pradesh.Ph:040-23044901/02E-mail: [email protected]: vjim.edu.in
Editor : Dr. Kamal Ghosh Ray
Printer : Mr. P. Narendra
Printed at : Pragati Offset Pvt. Ltd.,No.17, Red Hills, Hyderabad - 500004. Andhra Pradesh.Phone: 040-23304837.
(i)
Vol. 5 Issue. 1 January 2013 - June 2013
Editorial
Environmental Reporting Practices : A Study of Yagnesh Dalvadi and 1
Select Indian Companies Tejas Gandhi
Positive and Critical Classification Stakeholders:
The Case of Bayer AG Germany Sangita Ghosh Ray 10
India’s Competitiveness in a Globalised Economy: A Jagannatha Reddy 18
Issues and Challenges for Pharmaceutical Sector Y. Ramakrishna
B. Krishna Reddy
Aryasri
Co-Movements of the Indian Stock Market
with Select Emerging Markets P. Bhanu Sireesha 32
Moral Appeals for Brand Positioning – Issues and Perspectives A.Ramesh 47
Income Status of Migrant Labours at Alang Ship Breaking Yard Hrudanand Misra 59
Finding Frequent Item Sets on Post Mining data Using Jayanti Mukhopadhyay, 64
Normalized Mutual Information Prof. Rohit Kamal Chatterjee
Integrating Soft Skills with Business English:
Value Creation for Management Students I.Padmini 71
Leadership Styles and Emotional Intelligence among Arif Syed 78
Hospital Managers ChandraSekhar, S.F
Abstract of Ph.D Thesis
Workplace Stress among Women in IT Sector A.Sandhya Rani 86


(ii)
EDITORIAL
The present economic and regulatory environment in India is on the porch of a major revision aiming at amendment
and adaptation of simplified legal system which suit the demands of modern times. India has passed through a
long span since the first Companies Act 1956 was enacted. The increasing demand for high amount of investor
protection and varied customer interests urges the Indian economy to be globally compliant. In this context,
August 2013 marks a historic moment resulting in the beginning of new Indian corporate era, as it is expected
that the new Companies Act 2013 will contribute to the growth and development of the corporate sector giving
space for business friendly corporate regulation, good corporate governance, corporate social responsibility
(CSR), enhanced disclosure norms, audit accountability, protection for minority shareholders, investor protection
and activism, stricter enforcement and a better framework for insolvency regulation and institutional structure.
One of the highlighting features of the new Companies Act are that the corporate should spend 2% on Corporate
Social Responsibility (CSR) and the Act empowers investors against any frauds committed by promoters to
ensure greater transparency in corporate governance matters.
In this connection, I take this opportunity to invite researchers, academicians, corporate managers from various
disciplines to contribute high quality papers for better understanding and application of the rules under New
Companies Act 2013.
Dr. Kamal Ghosh RayEditor


Gavesana Journal of Management / Vol. 5. Issue 1. January 2013 - June 2013. 1
Environmental Reporting Practices : A Study of SelectIndian Companies
Dr. Yagnesh Dalvadi* and Mr. Tejas Gandhi**
Abstract
Growing pressures on the environment and increasing environmental awareness have generated the needto account for the manifold interactions between all sectors of the economy and the environment. Conventionalnational accounts focus on the measurement of economic performance and growth as reflected in marketactivity. Environmental Accounting and Reporting is therefore, a thrust area for our country. India is consideredto be the fastest developing country. But, we still need much work in the area of preserving our environment andmost of all reporting the means and methods of preserving it. Now, gradually our country has moved a stepahead in this area, but a lot is to be done still. It’s the responsibility of each and every head of our country and notjust the few companies which have taken such initiative. This paper attempts to clarify what environmentalaccounting is all about focusing on the reporting practices and measurement of the selected Indian companies.The objective of this study is to understand the quantity and quality of voluntary environmental disclosures in theannual reports or sustainability reports through Global Reporting Initiatives (GRI) guidelines as a base for fewselected Indian companies. The result may serve a base or the path towards better environmental disclosuresin India.
Key Words: Environmental Accounting and Reporting (EAR), Environmental Management Accounting,Sustainability, Global Reporting Initiatives (GRI).
Introduction
Environmental accounting is an important tool for understanding the role played by the natural environmentin the economy. Environmental accounts provide data which highlight both the contribution of natural resourcesto economic well-being and the costs imposed by pollution or resource degradation.
The incorporation of environmental benefits and costs into economic decision making often refers specificallyto incorporating the depreciation of natural resources and the environment into estimates of net domestic productor net national product. Sometimes it is also referred to as Green-Accounting or Natural Resource Accounting.For this reason, IUCN (The International Union for Conservation of Nature) has launched a new programme,the Green Accounting Initiative, to help its members understand how this tool can help them improve environmentalmanagement.
Meaning
The term “Environment” includes everything in all its manifest forms; on the earth, beneath the earth andabove the earth. All over the world, there has been much concern regarding management of environment forensuring sustainable economic development.
A system in which economic measurements take into account the effects of production and consumptionon the environment is called “Environment Accounting”.
What Environmental Accounting is - and is not?
It is a set of aggregate national data linking the environment to the economy, which will have a long-runimpact on both economic and environmental policy-making. It is not: valuation of environmental goods or services,
*Asst. Professor, Post Graduate Department of Business Studies, Sardar Patel University, Vallabh Vidyanagar-388120 GujaratEmail: [email protected]
**Research Scholar, Post Graduate Department of Business Studies, Sardar Patel University, Vallabh Vidyanagar-388120 Gujarat.

2. Gavesana Journal of Management / Vol. 5. Issue 1. January 2013 - June 2013
social cost-benefit analysis of projects affecting the environment, or disaggregated regional or local data aboutthe environment. There are, however, close links between environmental accounting and these three activities,which is why they are frequently discussed together and occasionally confused.
Valuation of environmental assets, goods, or services: “Valuation” refers to the process of deriving amonetary value for things which are not sold in a market; for example, fuel wood gathered in the forest, waterfiltration provided by a wetland, or biodiversity resources which could provide new medicines in the future.Valuation is an essential input into both social cost-benefit analysis and some approaches to environmentalaccounting. However valuation is only one element in the construction of environmental accounts; it is not thesame as the construction of the accounts.
Disaggregated regional or local data about the environment sometimes is linked to a geographic informationsystem. Questions often arise about the scale of environmental data; do they pertain to a village, a province, awatershed, or the whole country? Because the SNA is national, and most countries maintain their economic dataat the national (rather than the regional or local) level, environmental accounts are primarily national accounts.For example, they might tell us how much energy was consumed nationwide, not how much was consumed ineach village or province. Sometimes national figures are obtained by aggregating local data, though; for example,national data on timber harvests might originate with a survey of individual logging camps. Thus accountssometimes can provide local as well as national data. Where local data are not available, however, it is ofteneasier to estimate national data directly than it is to collect local data and sum them. For this reason the accountswill always provide national figures, but only sometimes will the data underlying them tell us about local areas aswell.
What is Environmental Reporting?
� It’s reporting your environmental performance back to the people you do business with.
� The way you present this information can take many different forms, including:
• Pages on your website;
• Information on product packaging, a simple statement (perhaps included with tender submissions, orforwarded to your local council to support your business’s application for their preferred supplier list); or
• A bound report.
� The three stage process of compiling your business’s environmental history involves:
• planning what the form and content of your document will be;
• analyzing your environmental performance; and
• distributing the information to the needed parties.
Reasons for Environment Reporting
� Reporting information about environmental performance benefits your business in a number of ways. Ithelps you:
• lower your operating costs;
• generate marketing opportunities;
• widen your customer base and set market trends;
• improve the competitiveness of your tender applications;
• provide input into strategic positioning;
Environmental Reporting Practices and Measurement of the Selected Companies of India
Gavesana Journal of Management / Vol. 5. Issue 1. January 2013 - June 2013. 3
• increase your scope to assess and plan for business performance over time;
• facilitate the risk assessment work of your finance and insurance suppliers, and decrease your insurancepremiums; and
• better manage your business. You can’t manage what you don’t measure.
Increasing in importance is reporting your environmental performance as a smart strategic move. Surveysconsistently report growing awareness and concern about environmental issues by consumers. This is motivatingboth large and small organizations, to ensure they are following best environmental practice. They, in turn, arerequesting their suppliers to do so too.
Supplying environmental information gives your business a competitive advantage in doing business withthese organizations, and puts you ahead of the game with the regulators. It’s an investment in your business’sfuture with a guaranteed positive return!
Environmental Reporting Through Global Reporting Initiatives (GRI) Guidelines as a Base
The GRI was established in late 1997 with the mission of developing globally applicable guidelines forreporting on all these three areas, i.e., economic, social and environmental performance, initially for corporationsand eventually for any business, governmental, or non-governmental organization (NGO). Convened by theCoalition for Environmentally Responsible Economies (CERES) in partnership with the United Nations EnvironmentProgramme (UNEP), the GRI incorporates the active participation of corporations, NGOs, accountancyorganizations, business associations, and other stakeholders from around the world. The GRI’s SustainabilityReporting Guidelines were released in exposure draft form in London in March 1999.
However, GRI guidelines are voluntary reporting initiatives; hence companies are not obliged to informGRI of their reporting confirmation. It is, however, to be noted that the GRI guidelines are dynamic and theExposure Draft issued in March 1999 represents only a primary step in the development of a framework forsustainable reporting. Companies may take it as a way towards better reporting practices.
Objectives of the Study
The prime objective of this study is to measure the Environmental Reporting Disclosures of the selectedIndian companies. In order to evaluate the environmental reporting practices, the categorization contained in theGlobal Reporting Initiatives (GRI) guidelines has been used to some extent. However, it also mainly throws lightupon the quantity and quality analysis of the environmental reporting practices of the selected companies whereby,better environmental reporting practices in India can be arrived at.
The objective of the study was to determine the following in the annual reports (sustainability reports orcorporate social responsibility reports) and separate environmental reports (if prepared by the selected Indiancompanies):
� Quantity of disclosure, using a sentence based approach (Hackston and Milne, 1996; Buhr, 1998) whichwere then accumulated into page proportions; and
� Quality of disclosures (Gamble et al., 1995; Wiseman, 1982; Guthrie and Parker, 1990; Walden and Schwartz,1997; Kusumo et al., n.d.).
Review of Literature
Environmental Reporting is the key ingredient of the TBL (Triple Bottom Line) concept. One need to studyall the three areas of Triple Bottom Line Reporting, viz., Economic (Financial), Environmental and Social.
TBL may be an emerging concept for the Indian corporate, but it was coined way back. Discussion of thequantification of social and environmental performance is not entirely new and predates Elkington’s (1997)
Environmental Reporting Practices and Measurement of the Selected Companies of India

4. Gavesana Journal of Management / Vol. 5. Issue 1. January 2013 - June 2013
book. In 1972, David Rockfeller said that he ‘can foresee the day when, in addition to the annual financialstatements certified by independent accountants, corporations may be required to publish a social audit similarlycertified’ (cited in Gray, Owen, et al, 1987, pix).
In 1992, the European Union Fifth Action Programme called for a redefinition of accounting concepts andmethods to account for inclusion into product market prices (EU, 1992). In 1977, the American Institute ofCertified Public Accountants published a book entitled The Measurement of Corporate and Social Performance(AICPA, 1977).
Elkington’s book reinforced the view that corporations were accountable for their impact on sustainabilitythrough TBL and that accountants had a substantial role in measuring, auditing, reporting, risk rating andbenchmarking it (Elkington, 1997).
Under the leadership of Swiss business entrepreneur Stephan Schmidheiny, a coalition of around 50international companies formed the Business Council for Sustainable Development (Timberlake, 2006). TheBCSD prepared a “Declaration of the Business Council on Sustainable Development” and a book, ChangingCourse (Schmidheiny, 1992). “Gathering the expertise of more than 50 leaders of multinational corporations andbacked by an array of case studies showing existing best practices”, the book claimed to provide “an extensiveanalysis of how the business community can adapt and contribute to the crucial goal of sustainable development- which combines the objectives of environmental protection and economic growth.” After UNCED, the ICCformed the World Industry Council on the Environment, which merged with BCSD on 1 January 1995 to formthe World Business Council on Sustainable Development (WBCSD).
This triple bottom line conception of corporate sustainability is now widely used among business practitioners.For example, the WBCSD claims to bring together its 180 member international companies “in a sharedcommitment to sustainable development through economic growth, ecological balance and social progress.”This is made more significant by the fact that, in 2006, the WBCSD was rated by sustainability experts worldwideas the business organisation most likely to play a “major role” in advancing sustainable development over thenext five years (Globescan, 2006).
According to Holsti (1969), content analysis categorises narrative matter into themes, a method consistentlyused in Corporate Social Reporting research (Adams and Roberts, 1995), Zeghal and Ahmed (1990), Gamble et.al. (1995). Hackston and Milne (1996) and Krippendorff (1980. p. 21) define content analysis as “a researchtechnique for making replicable and valid inferences from data according to their context”.
Methodology
The nature of the said research work is analytical. This study is based on the Primary Data collected fromannual reports/ sustainability/ corporate social responsibility reports downloaded from the websites of the selectedcompanies. The study is based for the year 2011-12. Out of the 30 Sensex based companies, 5 companies arerandomly selected for the purpose of this study viz., ITC Ltd., Hindalco Industries Ltd. (HI Ltd.), HindustanUnilever Ltd. (HU Ltd.), Reliance Industries Ltd. (RI Ltd.) and Maruti Suzuki Ltd. (MS Ltd.).
In order to measure the environment reporting practices by the selected Sensex based Indian companies,GRI guidelines were taken as a base. Analysis of the data is based on a few selected categories comprised ofin GRI guidelines to have a better measurement.
Quantitative Measurement of Environmental Reporting Practices
Freedman and Jaggi (1986), Kelly (1981) and Roberts (1992) are of the opinion that the use of annualreports as a primary communication vehicle for environmental performance serves a better measurement tool.For the purpose of this study also, annual reports or sustainability/ environmental reports are used as a datasource.
Environmental Reporting Practices and Measurement of the Selected Companies of India

Gavesana Journal of Management / Vol. 5. Issue 1. January 2013 - June 2013. 5
The point of commencement was to determine if the annual reports included disclosure on environmentissues.
The annual report information was initially analyzed using a dichotomous variable (Yes=1; No=0). Once itwas ascertained that the environmental information was present in the reports, it was necessary to determinehow it was to be coded.
Table 1: Environmental Information
Information ITC Ltd. HI Ltd. HU Ltd. RI Ltd. MS Ltd.
Present 1 1 1 1 1
It is clear from Table 1 that all the selected companies included environment related information in theirreports which is resembled by “1” as per dichotomous variable, i.e., Yes.
Table 2: Quality and Quantity definitions of the Content Analysis
Quantity of Disclosures Quality of Disclosure Quality definitions
“How Much” “How measured”
1 = sentence 1 = Monetary Disclosure in monetary/currency terms
2 = paragraph 2 = Non-monetary Quantified in numeric terms of weight,
volume, size, etc. but not financial/currency
3 = half A4 page 3 = Qualitative only Descriptive prose only
4 = 1 A4 page 4 = Qualitative and Monetary Descriptive prose and currency
5 = >1 A4 page 5 = Qualitative and Descriptive prose and numeric terms
Non- Monetary
6 = Monetary and A combination of currency and numeric terms
Non- monetary
7 = Qualitative, Monetary Descriptive prose, financial and numeric terms
and Non-monetary
Table 2 above has further been divided into two categories in order to have a clear insight into the content,viz.: Table 3 which shows the quantity of disclosures “How much” and a score to the content present. WhileTable 4 shows the quality of disclosures “How measured” and a score thereof of the selected companies.
Score Board
Each category of Table 3 (viz., sentence, paragraph, half A4 page, 1 A4 page and >1 A4 page) has beenallotted 10 points each, which makes an overall score of 50 points.
However, the content (excluding the figures, pictures, charts, diagrams, etc.) was taken into considerationin the “Quantity” aspect of the study.
Environmental Reporting Practices and Measurement of the Selected Companies of India

6. Gavesana Journal of Management / Vol. 5. Issue 1. January 2013 - June 2013
Table 3: Quantity of Disclosures “How much” of the selected companies (Score Board)
Quantity of Disclosures”How Much” ITC Ltd. HI Ltd. HU Ltd. RI Ltd. MS Ltd.
1 = sentence —— —— —— —— ——
2 = paragraph —— —— —— —— ——
3 = half A4 page —— —— —— —— ——
4 = 1 A4 page —— —— —— —— �
5 = >1 A4 page � � � � ——
Total Points 50 50 50 50 40
We can observe from Table 3, that almost all the companies have reported >1 A4 page and scored full(maximum) points i.e., 50 points, except Maruti Suzuki Ltd. (which excluding its pictures, figures, etc.) whichhas reported nearly about 1 A4 page and scored 40 points on the score board. This in fact, is a positive signtowards a better environmental disclosure practices.
Qualitative Measurement of Environmental Reporting Practices
A firm providing a combination of discussion on environmental goals and objectives, and outcome in qualitative,non-monetary and monetary terms was considered to be more meaningful to aid stakeholder decisions by linkingdisclosure, environmental performance, and economic performance (Belkaoui and Karpik, 1989).
Each category of Table 4 (viz., monetary, non-monetary, qualitative only, qualitative and monetary, qualitativeand non-monetary, monetary and non-monetary and qualitative, monetary and non-monetary) has been allotted10 points each, which makes the highest score of 70 points and the lowest of 10 points.
Table 4: Quality of Disclosures “How measured” of the selected companies (Score Board)
Quality of Disclosure”How measured” ITC Ltd. HI Ltd. HU Ltd. RI Ltd. MS Ltd.
1 = Monetary —— —— —— —— ——
2 = Non-monetary —— —— —— —— ——
3 = Qualitative only —— —— —— —— ——
4 = Qualitative and Monetary —— —— —— —— ——
5 = Qualitative and Non- Monetary —— —— —— —— ——
6 = Monetary and Non- monetary —— —— —— —— ——
7 = Qualitative, Monetary and
Non-monetary � � � � �
Total Points 70 70 70 70 70
It is observed from Table IV that all the selected companies have presented their environmental informationin qualitative, monetary and non-monetary terms to more or less extent and have scored full 70 points.
Environmental Indicators Measured
Once we have known about the status of the environmental information present in the annual/ sustainability/corporate social responsibility reports, few selected environmental indicators which play a major role in environmentpreservation were selected for the measurement purpose.
Environmental Reporting Practices and Measurement of the Selected Companies of India

Gavesana Journal of Management / Vol. 5. Issue 1. January 2013 - June 2013. 7
Following environmental indicators were selected for this study purpose:
Table 5: Environmental Indicators Measured
Sr. No. Environmental Indicators Measured
1. Air/ Air Emissions
2. Water Management/ Conservation
3. Recycling and Waste Management
4. Climate Change/ Ecological Balance
5. Material Sustainability/ Clean and Eco-friendly Products
6. Green House Gas
7. Energy Conservation
8. Land Resources (Maintenance)
9. Bio Diversity
10. Managing Mining Environment
11. Sustainable Sourcing (Agriculture)
12. Creating Wealth from Waste
13. Efficient Plastic Recycling
The above are few indicators which contribute for a better environment balance and preservation. Theywould be analyzed on the basis of the information present in the reports in Table 6. Each such indicator has beenallotted 10 points (individually) making the total score to be 130 points.
Table 6: Environmental Indicators Measured (Score Board)
Environmental Indicators ITC Ltd. HI Ltd. HU Ltd. RI Ltd. MS Ltd.
Air/ Air Emissions 10 10 00 10 00
Water Management/ Conservation 10 10 10 10 10
Recycling and Waste Management 10 10 10 10 10
Climate Change/ Ecological Balance 10 10 10 10 00
Material Sustainability/ Clean and
Eco-friendly Products 10 00 00 10 00
Green House Gas 00 10 10 00 00
Energy Conservation 10 10 10 10 10
Land Resources (Maintenance) 00 10 00 00 00
Bio Diversity 00 10 00 10 00
Managing Mining Environment 00 10 00 00 00
Sustainable Sourcing (Agriculture) 00 00 10 00 00
Creating Wealth from Waste 10 00 00 10 00
Efficient Plastic Recycling 00 00 00 10 00
TOTAL 70 90 60 90 30
From Table 6, which exhibits the information on the environmental indicators, it is clear that both HidalcoIndustries and Reliance Industries Ltd. have scored the highest 90 points. However, ITC Ltd. has scored thesecond highest points, i.e., 70 points followed by Hindustan Unilever Ltd. scoring 60 points and Maruti SuzukiLtd. scoring the lowest 30 points.
Environmental Reporting Practices and Measurement of the Selected Companies of India

8. Gavesana Journal of Management / Vol. 5. Issue 1. January 2013 - June 2013
Environmental Management Best Practices (Certification)
The introduction of the ISO 14000 series for Environmental Management Best Practice has introducedenvironmental issues as part of “Business as usual”. So, it has now become an urge for the companies worldwideto report on the Environmental issues and their contribution in safeguarding the Environment.
Over and above the indicators studied, it was also checked whether the companies selected had beenissued ISO 14000 series of certificate pertaining specially to the environment management which is shownthrough Table 7. The companies which had procured the said certificate were given 10 points and the oneswhich did not were not given any points.
Table 7: Environmental Management Best Practice (Score Board)
ITC Ltd. HI Ltd. HU Ltd. RI Ltd. MS Ltd.
ISO 14000 Series 10 10 10 10 ——
Table 7 above shows that every company has obtained ISO 14000 Series meant for EnvironmentalManagement Best Practice and scored 10 points, but no such information of ISO 14000 series certification incase of Maruti Suzuki Ltd. was found in the annual reports during the year 2011.
Overall Performance in Disclosing Environmental Information in the Reports of the SelectedCompanies
Overall score is made up of the qualitative and quantitative information disclosed pertaining to environmentalinformation content, indicators of environmental reporting and best environmental management practices (exhibitedby Tables 3, 4, 6 and 7) of the selected companies.
Table 8: Overall Score
ITC Ltd. HI Ltd. HU Ltd. RI Ltd. MS Ltd.
Total Score 200 220 190 220 140
Scores Out of 260 260 260 260 260
Combining the overall score of 260 points, both Hindalco Industries Ltd. and Reliance Industries Ltd. havescored equally, i.e., 220 points, while next scorer is ITC Ltd. with 200 points, followed by Hindustan UnileverLtd. scoring 190 points and finally Maruti Suzuki Ltd. with the lowest score of 140 points.
Overall Findings
The said study gives a clear idea that all the selected Indian companies have to an extent disclosedenvironmental information and taken keen steps in the area to preserve the same, which is a positive and aprogressive sign, indeed.
Further, there have been differences in the disclosures of the indicators exhibited by both HI Ltd. and RILtd. despite of their equal scores. While, the other companies are on their way towards better environmentaldisclosures.
No matter, no company scored full scores which show that each company needs to move ahead andcompare with each other and disclose the fullest information which they still have not, so far.
Limitations of This Study
The study considers only few randomly selected index based companies which just gives a brief view ofthe environmental reporting practices carried out in India. It does not purport to demonstrate the exact resultsand reporting practices which can be considered as an ideal measure for such reporting.
Environmental Reporting Practices and Measurement of the Selected Companies of India

Gavesana Journal of Management / Vol. 5. Issue 1. January 2013 - June 2013. 9
Also, the study has been taken on for only one year (2011) which gives a very brief view of the environmentalreporting practices of the selected companies.
Though efforts were undertaken to ensure coding reliability, there remains a degree of subjectivity in thedetermination and undertaking of coding practices in content analysis research.
References
Adams, C.A. and Kuasirikun, N. (2000), “A comparative analysis of corporate reporting on ethical issuesby UK and German chemical and pharmaceutical companies”, The European Accounting Review, Vol. 9No. 1, pp. 53-80.
Adrian Henriques & Julie Richardson (2004), “A Book on- The Triple Bottom Line: Does it all add up?”,Earthscan Publications Ltd., UK, pp. 17-25.
Buhr, N. (1998), “Environmental performance, legislation and annual report disclosure: the case of acidrain and Falconbridge”, Accounting, Auditing & Accountability Journal, Vol.33 No.1, pp. 69-87.
Craig Deegan (Spring 2000), “The Triple Bottom Line”, JASSA , Issue 3, , pp. 12-14.
John Elkington(1994), “Towards the Sustainable Corporation: Win-Win-Win Business Strategies forSustainable Development,” California Management Review 36, No. 2: pp. 90–100.
Kolk A. (2004), “A Decade of Sustainability Reporting: Developments and Significance”, InternationalJournal of Environment and Sustainable Development, Vol.3, No. 1, pp. 51-64.
Pahuja S., “Environmental Accounting and Reporting (EAR) Standards”, Indian Journal of Accounting, Vol.XXXIX(2) June 2009, pp. 37-43.
Raar, J. (2002), “Environmental initiatives: Towards triple-bottom line reporting”, Corporate Communications:An International Journal, Vol. 7 No. 2, pp. 169-83.
Sehgal A. & Sehgal D., Advanced Accounting-I, Taxmann’s Edition, pp.3.316-3.321.
Stephen Ashkin and Cynthia Schultz (2009), “The Triple Bottom Line- The rise of the Sustainability Concept”,ISSA Today, pp. 1-7.
Sumati Reddy (July 2007), “Sustainability Reporting in Asia”, the ICFAI Journal of Accounting Research,Vol. VI., No. 3, pp.39-52.
The Earthscan Reader in Business and Sustainable Development : Edited By Richard Starkey and RichardWelford, Earthscan Publications Ltd., London and Sterling, VA. p-37.
Wayne Visser (2007), “Corporate Sustainability and the Individual: A Literature Review”, University ofCambridge Programme for Industry Research Paper Series: No. 1, pp. 3 – 20.
Willamson, Imelda., April 2001, “Environmental Reporting: handbook for small and medium size businesses”,Star Printing Pty Limited, pp.1-28.
Environmental Reporting Practices and Measurement of the Selected Companies of India

10. Gavesana Journal of Management / Vol. 5. Issue 1. January 2013 - June 2013
Positive and Critical Classification Stakeholders:The Case of Bayer AG Germany
Sangita Ghosh Ray *
Abstract
The philosophy of corporate social responsibility (CSR) has accentuated a perceived rivalry betweenshareholder model versus stakeholder model of business. The shareholder model promotes shareholder valuewhile stakeholder model serves a wide range of interests (Jensen, 2001). Traditionally, shareholders or stockholderswere assumed to be the very important stakeholders but in the modern time’s corporate philosophy, many morestakeholders have emerged who are success agents of the corporations (Scott and Lane, 2000). A stakeholderanalysis helps identify a company’s key or important stakeholder, their interests and how their interests affect thesuccess of the company (Shankman, 1999). Such analysis also needs social analysis along with the company andindustry appraisal in order to enhance stakeholder participation. This work is mainly a descriptive analysis of thestakeholders’ importance to corporate. An effort has been made to identify the key stakeholders of the 147 yearold company Bayer AG, Germany to understand the extent of partnership between the company and its keystakeholders.
Key Words: Success agent, CSR, Bayer AG.
Stakeholders and Management Principles
Traditionally the stakeholders of a firm used to be the customers, suppliers, employees and owners. Butduring the last two decades, due to the emergence of environmentalists, media, governments, consumers’ advocates,etc., the concept of stakeholders has changed. Stakeholders are persons or groups (can be institutions) whohave interests in the company and who can affect or be affected by the degree of achievements of the firm’spurpose (Frooman, 1999). Therefore there is a need to develop a generic stakeholder map irrespective of thefirm’s nature of business, size and involvement in the society. Figure: 1 suggests a typical stakeholder map.There can be variations in stakeholders’ maps amongst industries, companies at a specific stakeholder level like;high-end customers & low-end customers, national political group & regional political group, long-term owners& short-term owners, etc.(Donaldson, 1999). Construction of a rational stakeholder map is not an easy taskeven though it has been oversimplified in figure: 1, because a particular group may change over time dependingupon various strategic issues. There are also conflicting roles of some of the members of each of the stakeholdergroups (Freeman and Reed, 1983). For example; an employee may be the customer of a company andsimultaneously be a member of the employee union of the same company as well as an active member of apowerful political party, while being a member of customers’ advocate group. Therefore, a stakeholder can haveconflicting expectations from corporate actions and as a result coalition of stakeholders’ groups may emerge tocontest a particular stakeholder action. Simultaneously, a firm may influence a particular group of stakeholder toultimately influence other group or groups of stakeholders.
* Fellow of the Institute of Cost Accountants of India and a Management Accounting Consultant.

Gavesana Journal of Management / Vol. 5. Issue 1. January 2013 - June 2013. 11
Figure 1: Typical Stakeholder Map
The stakeholders can be classified into ‘primary’, ‘secondary’ and ‘key’ categories. The primary stakeholdersare those who are ultimately affected positively or negatively by the corporate decisions and actions. Secondarystakeholders are generally the intermediaries who are the winners or losers and either involved or excluded inthe decision making process. The key stakeholders are those who can belong to both the groups and are in aposition to significantly ‘influence’ the company or are ‘important’ to the company for its success. Here, ‘influence’refers to the ‘power’ of the stakeholders to influence corporate actions and ‘importance’ implies the needs,interests and priority of stakeholders to be delivered by the company. Mitchell, Agle and Wood (1997) observedthree prime characteristics of the stakeholders like ‘power’, ‘legitimacy’ and ‘urgency’. Generally speaking,stakeholders’ powers remain ‘dormant’, their legitimacy is ‘discretionary’ and urgency connotes ‘demanding’.Different combinations of characteristics of stakeholders create different groups of stakeholders, who cancreate huge counter impacts on the performance of the companies (Gartner Group, 1996). These combinationsare depicted in table 1.
Table 1: Classification of Stakeholders
Combinations of characteristics Types of stakeholders
Power + Legitimacy Dominant Stakeholders
Legitimacy + Urgency Dependent Stakeholders
Urgency + Power Dangerous Stakeholders
Power + Legitimacy + Urgency Definitive Stakeholders
Therefore, stakeholders need to be managed and tackled strategically. Stakeholder management has becomean important corporate management action in the complex business setting. Clarckson (1999) suggests that as amatter of stakeholder management principles, the management should:
1. Acknowledge and actively monitor the concerns of all legitimate stakeholders and consider their interestsin decision-making.
2. Communicate with stakeholders about the risks that they assume because of their involvement with thecorporation.
3. Become sensitive to the concerns of stakeholder constituency.
4. Work in cooperation with other public & private entities to minimise the risks and harms arising from thecorporate activities and any harms caused are either avoided or adequately compensated.
5. Attempt to make a fair distribution of the benefits and burdens of corporate activities amongst thestakeholders.
Positive and Critical Classification Stakeholders: The Case of Bayer AG Germany

12. Gavesana Journal of Management / Vol. 5. Issue 1. January 2013 - June 2013
6. Resolve and communicate the conflicts between their own role as stakeholders, and their legal and moralresponsibilities to the other stakeholders, which should be subject to third party review.
Stakeholder Analysis
A firm has to serve as a vehicle for coordinating stakeholders’ multiple interests, may be far away frommere financial and economic criteria (Carroll, 1989). But the problem is that it is very difficult to assure multiplestakeholders that their interests are being coordinated by the firm to achieve most favorable results. As statedearlier, stakeholder analysis refers identifying key stakeholders, assessing their interests, and evaluating howtheir interests can affect the riskiness and performances of the firm and vice versa (Chandler, 1962). It isnecessary to brainstorm who are the key stakeholders of the firm and accordingly prioritize and understand thekey stakeholders from the long list of people and organizations that are affected corporate actions and decisions(Chandler, 1962). Some of them may have the power either to block or advance corporate decisions, whileothers may be interested in what the firm is doing and at the same time there may be others who may not care.Figure 2 shows the power and interest of stakeholders as was mapped by Clarckson(1999).
Figure 2: Power-Interest Grid of Stakeholders
The matrix suggests that ‘high power-high interest’ stakeholders must be fully engaged with, and thecompany should make greatest efforts to satisfy them.
Bayer Aggermany1
The Bayer AG (Bayer) was founded in 1863 in Barmen, Germany. Its head quarters are currently situatedin Leverkusen, Germany. After being in business for nearly 150 years, Bayer is today operating in 150 countries.The simple corporate structure of Bayer is shown in figure 3.
Figure 3: Bayer AG’s Corporate Structure
The health care segment consists of the following:
Pharmaceuticals: general medicine, speciality medicine, women’s healthcare, diagnostic imaging. Consumerhealth: consumer care, medical care and animal health.
The crop science segment has crop protection (herbicides fungicides, insecticides, seed treatment),environmental science and bio science.
Positive and Critical Classification Stakeholders: The Case of Bayer AG Germany

Gavesana Journal of Management / Vol. 5. Issue 1. January 2013 - June 2013. 13
Material science segment comprises polyurethanes, polycarbonates, coatings, adhesives specialities andindustrial operations. Bayer group has three service companies, viz; ‘Bayer business services’, which is thegroup’s international competence centre for IT – based services. ‘Bayer technology services’ is the globaltechnological backbone and major innovation driver of the Bayer Group and ‘Currenta’ offers services to thechemical industry in terms of utility supply, waste management infrastructure, safety, security, analytics andvocational training.
Stakeholders of Bayer
Bayer claims in its Sustainable Development Report, 2009 that it is an essential part of their policy toclosely interact with the various stakeholders by engaging in active dialogue with them and that it takes thefeedback of these stakeholders very seriously. The company’s stakeholder map is depicted in figure 4.
Figure 4: Bayer’s Stakeholder Map
Bayer’s policy1 towards the various stakeholders and some ways in which it interacts with these stakeholdersis briefly discussed below:
Society and Neighbourhood: The company has made its commitment towards the well being of mankind andclimate change amply clear. In 2009 the company invested • 2.75 billion for research and development. It iscommendable that research is directed towards devising innovative methods of growing crops on arable landand thereby working towards ensuring food security. For example Bayer is trying to come up with seeds andcultivation methods whereby crops can be grown in varying and extreme weather conditions. Arize Dhani®2, ahybrid variety of rice, launched in India in 2008 is resistant to bacterial leaf blight. Their research in the field ofpharmaceuticals is directed towards development of effective drugs for the prevention and cure of thrombosis,heart diseases and hypertension. The materials science segment is engaged in harnessing wave energy intoelectricity besides building ‘Eco Commercial Building’ in a bid to reduce greenhouse gas emissions. Bayer haslaunched eight lighthouse programs towards its efforts to promote sustainability. It engages in discussions withneighbours, public authorities and elected officials on different topics, neighbourhood dialogues with localrepresentatives as a part of its stakeholder engagement.
Employees: Bayer had a workforce of 108,400 employees in 2009. Its personnel expenses amounted to • 7,776million in 2009. The company believes in respecting employee rights world-wide by contributing to social welfareand engaging in an open and efficient employee communication. It has an excellent policy of flexible workinghours in order to help employees to take care of their personal commitment they can even take a break up toseven years to bring up their children.
Positive and Critical Classification Stakeholders: The Case of Bayer AG Germany

14. Gavesana Journal of Management / Vol. 5. Issue 1. January 2013 - June 2013
Investors/Analysts: The Bayer stock appreciated by nearly 40% in 2009 in comparison to DAX which wentup by 24%. The company engages in a direct dialogue with investors and analysts, podium discussions/events onthe subject of sustainable investment.
NGOs: It supports various programmes like ‘HOPE’ in India in the area of diabetes, project with Germanfoundation for World Population(DSW), Germany, cooperation with Vignana Jyothi (an Indian educational trust)on the ‘learning for life initiative’ in its rural development institute.
Customers: Engagement with customers take the form of participation in the Global Automotive StakeholderGroup, Customer satisfaction survey for farmers in Poland, Austria and the Netherlands, etc.
Government: Participation in ‘Nano Dialog’ between German Government and Industry, Anti-cancer workshopfeaturing the E.U.Health Commissioner and E.U parliamentarians.
Suppliers: Procurement for different segments is done from different sources. The company follows a verystringent procurement policy to avoid bottlenecks and maintains a high standard of quality, safety and environmentalprotection across the globe. Suppliers Days 2009 e.g. Bayer HealthCare in China and Germany, Logisticssuppliers workshop on transport safety in China, etc. ensure engagement with suppliers.
Science and Research Organisations: Cooperation with the Commonwealth Scientific and Industrial ResearchOrganisation on wheat research, Cooperation with the China National Rice Research Institute, participation invarious forums ,etc.
International Initiatives and Public Private Partnerships: Cooperation with the UN, collaboration withWHO in the area of neglected tropical disease ‘chagas’, cooperation on malaria issues, etc.
Apart from this Bayer is also actively involved with Schools with a view to promote science and withIndustry Associations.
Critical Stakeholder Analysis of Bayer AG.
The foregoing discussions about the company’s operations would lead one to believe that all the stakeholdersare equally important for the company. For any business the most important stakeholder is undoubtedly thecustomer. A company would cease to exist as a going concern without a strong customer base and everythingelse, employees, research, suppliers, etc. would become meaningless, if the company did not have a market forits products. It is commendable that Bayer is directing its research towards discovering innovative ways to fightclimate change, to ensure better health and to contribute towards food security. But undeniable is the fact that,it is through these activities that Bayer is capturing new markets for its products and that sustainability is a happyby product of its main business. The company’s strategy of capturing the Asian market by promoting innovativemethods in the rapidly growing economies like India and China has given it an edge over its competitors. It is awisely thought out strategy of killing two birds with one stone i.e to find market for its products and to promotesustainability.
Although the Government is considered to be a secondary stakeholder by most authors of stakeholdertheory, for companies operating in certain industries like the pharmaceutical and chemical industries, governmentbecomes a very important stakeholder, because once again the company would have to operate within stringentregulations. Moreover for a company like Bayer which has operations in 150 countries, apart from confirming tothe rules of their own country they would also have to abide by the laws and regulations of the other country inwhich they operate. In such a scenario the role of Government/Governments become very crucial for thecompany’s well being.
Next and equally important to the company are its suppliers. Although suppliers like customers form thebackbone of any company, the role of suppliers becomes overtly important for companies like Bayer, because of
Positive and Critical Classification Stakeholders: The Case of Bayer AG Germany

Gavesana Journal of Management / Vol. 5. Issue 1. January 2013 - June 2013. 15
the very nature of their business. A defective raw material in their healthcare segment dealing with medicinesfor humans and animals could have serious repercussions. For example a spurious anticoagulant medicine couldcause irreparable damage and could even lead to death, which in some cases could lead to litigations and evenbanning the product. This scenario could be contrasted with an automobile manufacturing company where theautomobile company could easily replace a defective automobile or undertake free repairs in a bid to keep thecustomers happy. But for a pharmaceutical and chemical company it could cause severe damage to its goodwill.Bayer has therefore made it very clear that they follow a very stringent procurement policy considering the factthat the Health Care segment contributes 51.3% to its total revenue and offers more than 20,000 products toconsumers.
A successful business enterprise seldom encounters problems from investors. Bayer would be seen by theinvestors as a company operating in the right direction in terms of business, profits and corporate socialresponsibility activities which does not leave much scope for the investors to complain. The Bayer stock appreciatedby nearly 40% in 2009 in comparison to DAX which went up by 24%. Engagement with the investors andanalysts form time to time should be enough to keep them happy.
The business of Bayer makes it very much employee dependent. To remain above its competitors Bayerwould have to invest in continuous research which would invariably make its researchers very much indispensable.•460 million were earmarked for bonuses and short term incentives alone during 2009. Even during the economicdownturn the company introduced a ‘solidarity pact’, which involved a reduction in pay and working hours tocompensate for the effects of reduction in orders. The existing policy of the company not to dismiss employeesfor operational reasons , was extended till 2012. Employee expenses as a % of sales was 24.95% and Researchand Development expenses as a % of sales was 8.81% for 2009. Its acquisition of research facilities in othercountries also enhances its research opportunities.
Bayer is a global enterprise and Corporate Social Responsibility (CSR) is an integral part of its corporatephilosophy. Its mission statement states ‘Bayer: Science for a Better Life’. It can be reiterated that the companyis pursuing a very healthy policy for promotion of its CRS activities. The company was successful in reducingGreenhouse gas emissions by 6.5% from the previous year. Although it actively promoted CSR activities likepromoting education and research, sports and culture , minimising waste generation , developing solutions tooptimize resource utilisation and energy consumption, protecting biodiversity and recycling to name a few, itsexpenditure on these activities was only 0.14% of net sales for 2009. Its commitment to sustainability can begauged from its participation in a number of initiatives and projects world over. Apart from being a foundingmember of the UN Global Compact initiative of the United Nations, Bayer featured as the world’s best companyin the Carbon Disclosure Leadership Index. Since 1994 the company has followed the practice of voluntaryresponsible care initiative of the chemical and pharmaceutical industry. It has set new standards in public-private partnerships with its partnership with the United Nations Environment Programme (UNEP). Bayer’ssustainability reporting is based on the guidelines of the Global Reporting initiative. Based on the discussionsabove, the author imagines that the Bayer’s stakeholder map can be redrawn as depicted in figure 5 in order ofimportance.
Positive and Critical Classification Stakeholders: The Case of Bayer AG Germany

16. Gavesana Journal of Management / Vol. 5. Issue 1. January 2013 - June 2013
Stakeholders of Bayer
Customers Employees/ Research and Development Partners
Suppliers Governments
Investors Sustainability and CSR
Others
Figure 5: Redrawn Stakeholder Map of Bayer AG.
To sum up, for Bayer, customers and employees along with their research partners across the globe play apivotal role in ensuring the success of the company and as such are the most important stakeholders. Lowemployee morale in the case of Bayer may prove detrimental for the health of the company. Second in line arethe suppliers and the respective Governments where Bayer operates including the government of their owncountry. Third in importance are the investors and the company’s engagement with society and its development.All others fall in the fourth category.
Conclusion
Stakeholder theory is basically an extension of the CSR theory, which suggests that if a company affectsindividuals or groups to achieve its goals, then these individuals and groups have legitimate interests in thatcompany (McGuire, Sundgren and Schneeweis, 1988). Depending upon the degree of how they are affected,the various stakeholders have varying ‘stakes’ in the company and thereby they can demand appropriate corporateaction for their happiness, wellbeing, interests, safety and comfort. Therefore, who is a Key stakeholder isdependent upon what is the extent of effects of the corporate actions. For example, a product may occasionallylead to injury or death of a small fraction of the customers and the company may find it cheaper to pay damagesthan to redesign the product. In such a case, as per traditional managerial model, shareholder interest comes firstand customer interest comes second. But the stakeholder model would insist that customer health representsmore legitimate stake than financial stake of shareholders (Gioia, 1999). If the customers are not satisfied withrespect to quality, price, utility, availability and so on, there is no point of being in business (Rumelt, 1984). It maybe concluded that there may not be a set rule to identify which stakeholder is most important to the firm. It willdepend on the degree of positive or negative effects of corporate behavior on individuals or groups. Therefore,mission, goal, nature of the product, manufacturing process, education & awareness, moral sensitivity of firm tosociety, etc. have bigger roles to play to identify the most important group or groups of stakeholders.
References
Clarckson, Max B. E.(1999), Principles of Stakeholder Management, Clarckson Centre for Business Ethics,Toronto, ON.
Carroll, A. B. (1989), Business and Society: Ethics and Stakeholder Management. Cincinnati, OH: South-western.
Chandler, A. A. (1962), Strategy and Structure, Cambridge, MA: MIT Press.
Donaldson, T. (1999), Making stakeholder theory whole. Academy of Management Review, 24: 237-241.
Freeman, R. E. and D. L. Reed (1983), Stockholders and stakeholders: A new perspective on corporate governance,California Management Review, 25 (3): 88-106.
Frooman, J. (1999), Stakeholder influence strategies, Academy of Management Review, 24: 191-205.
Gartner Group, (1996), Project Management Skills: Avoiding Management by Crisis.
Positive and Critical Classification Stakeholders: The Case of Bayer AG Germany

Gavesana Journal of Management / Vol. 5. Issue 1. January 2013 - June 2013. 17
Gioia, D. (1999), Practicability, paradigms and problems in stakeholder theorizing, Academy of ManagementReview, 24: 228-232.
Jensen, M. C. (2001), Value maximization, stakeholder theory, and the corporate objective function, Journal ofApplied Corporate Finance, 14 (3): 8-21.
McGuire, J. B., A. Sundgren and T. Schneeweis (1988), Corporate social responsibility and firm financialperformance, Academy of Management Journal, 31 (4): 854 – 877.
Mitchell, R. K., B. R. Agle and D. J. Wood (1997), Toward a theory of stakeholder identification and salience:Defining the principle of who and what really counts, Academy of Management Review, 22: 853-896.
Rumelt, R. P. (1984), Toward a strategic theory of the firm. In R. Lamb (Ed.), Competitive Strategic Management,Englewood Cliffs, NJ: Prentice Hall, pp. 556-570.
Scott, S. and V. Lane (2000), Stakeholder approach to organizational identity, Academy of Management Review,25 (1): 43-62.
Shankman, N. A. (1999), Reframing the debate between agency and stakeholder theories of the firm, Journal ofBusiness Ethics, 19 (4): 319-334.
Further Readings
Blowfield, Michael and Alan Murray (2009), Corporate Responsibility: A Critical Introduction, Oxford UniversityPress, NY.
Blair, M. M. (1998), For whom should corporations be run? An economic rationale for stakeholder management,Long Range Planning, 31 (2): 195-200.
Freeman, R. E. (1984), Strategic Management: A Stakeholder Approach, Englewood Cliffs, Prentice Hall, NJ.
Jones, T. M. (1995), Instrumental stakeholder theory: A synthesis of ethics and economics: A survey, Academyof Management Review, 20 (2): 404-437.
Logsdon, J. M. and K. Yuthas (1997), Corporate social performance, stakeholder orientation and organizationalmoral development, Journal of Business Ethics, 16: 1213-1226.
Orts, E. W. and A. Strudler (2002), The ethical and environmental limits of stakeholder theory, Business EthicsQuarterly, 12: 215-233.
Scholes, E. and D. Clutterback (1998), Communication with stakeholders: An integrated approach, Long RangePlanning, 31 (2): 227-238.
End Notes1 Information, facts and a nalysis have been sourced from Bayer Annual Report 2009 and Bayer SustainableDevelopment Report 2009.
2 Sourced from Bayer AG.’s annual report, 2009 and sustainable development report, 2009.
3 Registered trade mark
Positive and Critical Classification Stakeholders: The Case of Bayer AG Germany

18. Gavesana Journal of Management / Vol. 5. Issue 1. January 2013 - June 2013
India’s Competitiveness in a Globalised Economy:Issues and Challenges for Pharmaceutical Sector
A.Jagannatha Reddy1 Y.Ramakrishna 2 Dr. B.Krishna Reddy3 & Dr. Aryasri4
Abstract
What are the issues and challenges in the global competitiveness of the Indian pharmaceutical industry?Where does this industry stand when compared to global peers on pharmaceutical value-added, productivity,research and development and trade performance? What are the new strategies that Indian pharmaceuticalcompanies are adopting to become global players? These questions are addressed in this paper based on secondarydata and the author’s experience in pharma sector. It is found that strategic government policies were the mainfactors that transformed the status of the Indian pharmaceutical industry from a mere importer and distributor ofdrugs and pharmaceuticals to an innovation-driven cost-effective producer of quality drugs. India emerged asone of the fast growing pharmaceutical industry in the world with growing trade surpluses and exports. However,there are certain limitations that the government policies need to address, like low productivity and R&D intensity.A host of competitive strategies, like Greenfield direct investment, overseas acquisitions, strategic alliances andcontract manufacturing have emerged as favorites to Indian pharmaceutical firms recently.
Key Words: Competitiveness, Competitive strategies, Productivity, Contract manufacturing.
Background
The global pharmaceutical industry can be divided into innovators, generic companies and independentSupply organizations. Innovator companies focus on developing innovative drugs and formulations that enjoypatent protection for a defined period of time, usually 20 years. Generic players focus on manufacturing versionsof off-patent drugs, which are similar in dosage, safety, strength, method of consumption, performance andintended use. After patent expiry Emerging Opportunities in Pharmaceutical Contract Manufacturing of a drug,several generic versions are launched, which are available for a fraction of the price of the original patenteddrug. The global pharmaceutical industry is projected to grow at 6% annually from US$700-bn in 2007 to aboutUS$940-bn by 2012. The generics segment is expected to grow faster at 11% CAGR, compared to the innovatorsegment at 5% CAGR during this period. This is mainly driven by governments of various developed anddeveloping countries increasingly promoting the shift to generics in an effort to control their rising healthcarebudgets. Globally US$ 80-bn worth of drugs is expected to go off-patent by 2010.
Indian Pharmaceutical Industry
Pharmaceutical Industry in India has history for more than 60 years. Govt. of India has promoted IndianDrugs and pharmaceuticals Ltd. (IDPL) for bulk drugs, injectables and medical devices. IDPL has showndeclining in the manufacturing activities from 1985. Today, in India, in general, the pharmaceutical industry iscontrolled by the private sector. The growth of pharmaceutical industry in Govt. of A.P has really taken momentumfrom 1980 onwards.
In the state of A.P, the pharmaceutical industry has really grown and seen the heights of achievement.Today, A.P. state is the bulk drug capital of India. In the State of A.P. there are about 5,000 manufacturing units,
1Research Scholar from JNTU, Hyderabad & Vice President, Mylan Laboratories Limited, Hyderabad. Email: [email protected],2Research Scholar, JNTUH, Hyderabad & Associate Professor, Vignana Jyothi Institute of Management, Hyderabad.
Email: [email protected] & Head, Department of Business Management, Osmania University, Hyderabad.4Director, School of Management Studies, JNTU, Hyderabad.

Gavesana Journal of Management / Vol. 5. Issue 1. January 2013 - June 2013. 19
out of which about 4,500 Active Pharmaceutical Ingredients (API) Manufacturing, about 300 drug formulationunits and about 200 other products.
Changing industry dynamics
Many stereotypes are being broken in the pharmaceutical industry today due to changing realities of themarketplace. Innovator companies are increasingly acquiring generics companies (e.g., Daiichi-Ranbaxy deal)or striking strategic alliances (e.g., GSKAspen deal) in order to participate in the fast growing generics market.Innovators and generics companies are both increasingly facing pressure on their bottom line. EBIT (earningsbefore interest and taxes) margins for most global pharmaceutical companies have been stagnating or decliningover the past few years. This has forced companies to relook at optimizing their cost structure and increasedfocus on outsourcing less critical activities to more cost competitive locations/ options. Manufacturing, whichrepresents about 30% of the annual cost base for a typical global pharmaceutical company, offers good opportunityfor significant cost savings, while simultaneously enabling the company to focus all efforts on research andmarketing. Innovator companies like Pfizer, Merck and Astra Zeneca have already announced intentions tocontain production costs by increasing outsourcing of manufacturing activities to emerging economies. This isexpected to lead to an increase in pharmaceutical contract manufacturing globally from US$20-bn in 2006 toUS$40-bn by 2012.
Implications for Indian CMOs
The changes in the global pharmaceutical industry have far-reaching implications for their outsourcingpartners. The generic companies spawned the first wave of contract manufacturing in India, led primarily by theneed to be globally cost competitive and to protect their margins. At last count, there were over 1,500pharmaceutical contract manufacturing firms in India, most of them focusing on basic APIs and intermediates.However, with the generics segment across the world increasingly under pressure due to increased competition,their outsourcing partners are now feeling the heat. Mushrooming of a large number of CMOs in emergingeconomies has also decreased their bargaining power to an extent.
Objectives
• To address the issues and challenges in the global competitiveness of the Indian pharmaceutical industry.
• To comment on the position of this industry when compared to global peers on pharmaceutical value-added, productivity, research and development and trade performance.
• To address the new strategies that Indian pharmaceutical companies are adopting to become global players.
• Strategic government policies were the main factors that transformed the status of the Indian pharmaceuticalindustry from a mere importer and distributor of drugs and pharmaceuticals to an innovation-driven cost-effective producer of quality drugs.
Research Methodology
The whole study can be termed as a desk research. Hence there is no field work and collection ofprimary data for this research.
Secondary data collection: Information pertaining to India’s Competitiveness in a Globalised Economy-Issuesand Challenges for Pharmaceutical Sector was obtained by referring to journals, books; internet and otherpublished materials for collection of necessary data.
Limitations of Study
The study is purely based on the secondary data. All the limitations suffered by the secondary data areapplicable to this paper.
India’s Competitiveness in a Globalised Economy: Issues and Challenges for Pharmaceutical Sector

20. Gavesana Journal of Management / Vol. 5. Issue 1. January 2013 - June 2013
Literature Review
The literature review is done in four main categories dealing with different topics, such as How IndianCMOS can stay competitive? Budding biotechnology, India: The big shot in vaccines, Mitigation Strategies toImplement by Pharma Companies.
Literature on How Indian CMOS can stay competitive: The opportunity to service generics companiescontinues to offer significant potential, whereas increasing interest in contract manufacturing by innovatorcompanies opens up another rapidly growing segment. India, with the largest number of US-FDA certifiedplants outside the US, maximum number of DMF filings (more than twice its closest competitor) and huge poolof highly trained technical manpower is uniquely positioned to take advantage of this opportunity. This sectionaddresses sub topics on shift in business model, developing additional capabilities, offering end-to-end services,and increasing risk profile.
Literature on Budding Biotechnology: There are 380 Biotech organizations in India; Bangalore alone hasover 190 establishments which roughly contribute to 30% of the Indian revenue sector by means of exports.Therefore this section concludes Southern India as a budding biotechnology hub.
Literature on India: The big shot in vaccines: Current statistics reveal that over 60% of the world’svaccine requirement is fulfilled by India, which in turn accounts for an almost $60 million market. Thereforeapart from being a major production unit of bulk drugs, India is fast emerging as a leading manufacturer ofvaccines too.
Literature on Mitigation Strategies to Implement by Pharma Companies: Western pharmaceuticalcompanies can apply several mitigation strategies to avoid a significant profit and loss impact from these trends.A robust risk analysis and quantification of exposure will be critical before developing a mitigation strategy. Ittakes 18 to 36 months to move drug manufacturing sources, creating barriers to both entry and exit. Hence,acting before a cost advantage erodes will differentiate market leaders from the rest.
How Indian CMOs can stay competitive?
While the opportunity to service generics companies continues to offer significant potential, increasinginterest in contract manufacturing by innovator companies opens up another rapidly growing segment. India,with the largest number of US-FDA certified plants outside the US, maximum number of DMF filings (morethan twice its closest competitor) and huge pool of highly trained technical manpower is uniquely positioned totake advantage of this opportunity (Pradhan, 2006)
Both innovators and generics offer different opportunities and the age of one-size-fits-all strategy is nolonger valid. While the generics segment will continue to bring in the volumes, the innovator segment is likely tobe more profitable. Focusing on innovators will enable current Indian CMOs to move from plain toll manufacturingto value-added offerings with higher margins. Focusing on innovators would, however, require basic changes inthe DNA of an existing CMO. Adherence to regulations, FDA certifications and GMP will no longer suffice asa differentiating edge. Focusing on innovators would require different capabilities to be built and a differentmindset, business model and risk appetite, as enumerated hereunder:
Change in critical success factors: Scale and size are no longer competitive weapons. Adherence to IP,world class quality standards and managing client relationships are the new determinants of success.
Shift in business model: Innovators prefer a company with a non conflicting business model
— A partner who would always assist in its operations, rather than launch a competing product.
— A number of domestic firms offering contract manufacturing services today reinvest the revenues indeveloping their own compounds.
India’s Competitiveness in a Globalised Economy: Issues and Challenges for Pharmaceutical Sector

Gavesana Journal of Management / Vol. 5. Issue 1. January 2013 - June 2013. 21
This model is no longer preferred due to increased sensitivities around IP. As the market matures further,these two business models will separate out completely. For e.g., Indian companies like Divi’s Laboratories andJubilant Organosys with non conflicting business models have been able to successfully attract global innovatorcompanies.
Developing additional capabilities: The CMO should support the client in his future growth areas, e.g., highpotency drugs, which may require additional investment or dedicated facilities. Business development and managingclient relationships is critical. Acquisitions or strategic alliances may need to be actively considered to gainaccess to technology or increasing global market reach (Fagerberg, 1987). For example, Dishman Pharmaceuticalsacquired Carbogen AMCIS, a Swiss company, in 2006 for its high potency manufacturing capability. Thisacquisition enabled the company to broaden its technological base and also gave it an European interface withthe global pharmaceutical community.
Offering end-to-end services: Innovators prefer partners who can assist them across the entire value chain.This could mean extending services from drug discovery and development, at one end, to manufacturing offormulations and injectables, at the other. This could lead to eventually transforming itself into an end-to-endCRAMS (contract research and manufacturing) player. For e.g., Divi’s Laboratories offers services in customchemical synthesis to several global pharmaceutical companies and enjoys one of the highest EBITDA marginsin the industry.
Increasing risk profile: Risk sharing agreements with innovator companies for custom synthesis and milestonebased royalty payments exposes it to the risk of non-commercialization of a potential new drug. For example,Indian companies such as Nicholas Piramal, Jubilant Organosys and Suven Life Sciences have entered into risk-and-reward-sharing agreements with Eli Lilly. The compounds, initially made available by Lilly, have to bebrought forward by the Indian companies by investing their own financial and human resources. Eventually, ifthe drug gets commercialized, Eli Lilly would pay the companies royalty on its global sales. Similarly, AdvinusTherapeutics, a Tata Group company, has entered into a deal with Ortho-McNeil-Janssen Pharmaceuticals Inc,a subsidiary of Johnson & Johnson, to develop two drug candidates for various disease targets. Advinus willreceive an upfront payment, as well as milestone payment of up to US$247-mn, upon successful development ofthe two targets. Advinus is also eligible for royalties on the sales of any drug products resulting from thecollaboration.Succeeding profitably in the new environment The Indian contract manufacturing market is expectedto grow at 38% annually from less than US$1-bn currently to reach US$4.2-bn by FY 2012. Both the innovatorsand generics segments offer huge potential for Indian CMOs going forward. Critical success factors forparticipating in the opportunity offered by each segment are different and accordingly merit serious considerationby senior management. Indian CMOs will do well if they identify their target segments, develop necessarycapabilities and redefine their value proposition accordingly, failing which they may risk falling by the wayside asthe industry consolidates and new entrants jump into the fray.
Budding biotechnology
In 1986, the government of India set up the Department of Biotechnology, after which public funding in thissector has steadily been on the rise. Of the 380 Biotech organizations in India, Bengaluru alone has a majorchunk of over 190 establishments, which roughly contributes to 30% of the Indian revenue sector by means ofexports. Biocon, the giant of Indian biotech is based in Bengaluru, along with other major players Aurigene,Astra-Zeneca, Advinus and MetaHelix. GBI statistics show that of the Rs.1000 crore investment in this sector,approximately Rs.140 crores has been from venture capitalists alone.
The current day and age looks at Bengaluru (India) as the emerging Biotechnology headquarter for bothIndian, as well as global pharmaceutical firms. Alexandria Real Estate Equities Inc. in July 2011, laid the foundationstone for a Rs. 5500 crore Biotech Knowledge park ‘Bengaluru Helix’, spread over 106 acres of land, which is
India’s Competitiveness in a Globalised Economy: Issues and Challenges for Pharmaceutical Sector

22. Gavesana Journal of Management / Vol. 5. Issue 1. January 2013 - June 2013
expected to be complete in phases, and operational by the end of 2014. This impressive set up of science-research parks all over India will undoubtedly play a major role in enhancing global biotechnology research anddevelopment, facilitate technology transfer and improve the country’s in-licensing potential.
India: The big shot in vaccines
Apart from being a major production unit of bulk drugs, India is fast emerging as a leading manufacturer ofvaccines too. Current statistics reveal that over 60% of the world’s vaccine requirement is fulfilled by India,which in turn accounts for an almost $60 million market. Currently, there are 60 vaccines being produced inIndia, spanning 10 disease conditions. Clinical trial centers for evaluation of the efficacy of vaccines are thusconstantly on the rise. With current development, production and export of vaccines, the biological sector isexpected to grow rapidly and bring in revenues of $2 billion by the end of this year. Thus, this diverse andversatile portfolio of biological by manufacturers in India has kept competition at bay, with just a handful ofglobal pharmaceutical organizations showing presence, including Sanofi-Aventis, Wyeth and Merck. Approximately70% of the vaccines produced in India are exported and UNICEF is one of India’s largest clients, which suppliesvaccines to over 140 countries and accounts for 40% of the global requirement.
The position of this industry when compared to global peers on pharmaceutical productivity, Researchand Development and Trade performance.
Financial performance of the Drugs and Pharmaceutical Industry: The financial performance of theDrugs and Pharmaceutical industry for the year 2009-10, 2010-11 and the forecast for the year 2011-12 aregiven in Table 1 below:-
Table 1 : Drugs and Pharmaceuticals: Growth and Profitability in the year 2010-11
(%age Change over year ago)
S.No. Particulars Quarterly Annual
June’11 Sept’11 Dec’11 March’12 2009-10 2010-11 2011-12
Estimates Forcast Forcast Forcast
1 Income 10.9 10.0 17.0 17.4 15.0 10.9 14.1
2 Net sales 9.2 11.0 17.1 16.3 11.9 12.4 13.6
3 Total expenses 11.6 -1.8 18.8 14.8 3.1 19.2 10.3
4 Raw materials 13.6 14.0 19.0 16.8 8.0 14.8 15.9
5 Salaries & wages 15.5 13.0 13.3 13.6 19.2 21.1 13.8
6 Power & fuel 10.2 24.0 24.0 10.0 2.5 20.1 17.1
7 Selling & marketing 9.0 15.1 10.0 9.0 0.1 11.9 10.7
8 Other expenses 2.8 28.0 11.1 12.1 -19.3 15.9 13.7
9 Depreciation 9.1 13.0 1.5 12.0 14.3 12.4 11.4
10 Interest expenses 15.8 20.0 25.0 18.0 -0.3 6.6 19.411 Tax provision 37.5 -78.5 90.6 75.9 108.8 73.6 -37.212 PBDIT 17.3 -4.3 19.9 18.9 105.7 -1.1 12.613 PAT 15.7 - 7.1 25.8 210.8 -31.6 55.614 PBDIT/Net Sales (%) 18.8 17.2 21.5 17.1 21.4 19.0 18.715 PBDIT/Income (%) 22.8 20.8 24.9 20.9 25.4 22.7 22.416 PAT/Income (%) 13.7 11.4 14.5 10.9 15.0 9.2 12.6
Source: Center for Monitoring Indian Economy (CMIE) Report November 2011.
Net sales of the Drugs & Pharmaceuticals sector are expected to grow by 17.1 percent y-o-y in theDecember 2011 quarter as against an estimated 11 per cent growth in the September 2011 quarter. The
India’s Competitiveness in a Globalised Economy: Issues and Challenges for Pharmaceutical Sector

Gavesana Journal of Management / Vol. 5. Issue 1. January 2013 - June 2013. 23
improvement in sales growth will be largely driven by higher realization of export oriented Pharma companies.The sector generates around 40 percent of its sales from exports. A sharp depreciation in the rupees is expectedto result in higher export realizations, which will enhance the overall growth of the sector.(From Table 2 to 6)
I. Growth in Indian Pharmaceutical Industry
Table-2: Export and Domestic Growth (Rs. in crore)
Year Exports Growth% Domestic Growth% Total Growth%%
Mar 2006 21230 23.23 39989 17.17 61219 19.21
Mar 2007 25666 20.89 45367 13.45 71033 16.03
Mar 2008 29354 14.37 50946 12.30 80300 13.04
Mar 2009 39821 35.66 55454 8.85 95275 18.65
Mar 2010 42154* 5.86 62055 11.90 104209 9.38
Source: Indian Pharma Industry’s annual report
Table – 3: International sales on consolidated basis
Consolidated International Exports as % of net salesnet sales sales 2010-11
Ranbaxy Labs 8960.77 6771.74 75.6
Dr. Reddy’s Labs 7236.80 5940.70 82.1
Lupin 5706.82 3983.08 69.8
Cipla 6130.31 3361.49 54.8
Sun Pharma 5721.43 2898.20 50.7
Wockhardt 3751.24 2709.91 72.2
Jubilant Lifescience 3433.40 2369.11 69.0
Cadila Healthcare 4464.70 2288.70 51.3
Biocon 2300.52 1956.79 85.1
Glenmark Pharma 3089.59 1955.83 63.3
Sinde Arcolab 1695.84 1637.67 96.6
Plethico Pharma 1535.20 1367.22 89.1
Piramal Healthcare 2509.86 1280.58 51.0
Divi’s Labs 1307.11 1204.95 92.2
Aurobindo Pahrma 4381.48 1112.06 25.4
Torrent Pharma 2121.97 1101.57 51.9
Dishman Pharma 990.84 911.56 92.0
Orchid Chemicals 1781.79 725.85 40.7
Shasun Chemicals 799.42 676.78 84.7
Panacea Biotec 1143.78 610.44 53.4
Source: Indian Pharma Industry’s annual report
Table-4: Projected Growth (Value in Rs crs / Growth in %)
Year Domestic Exports Total
Value Growth Value Growth Value Growth
2016-17 130.000 21% 158.000 16% 288.000 18%
2019-20 233.000 22% 248.000 17% 481.000 19%
India’s Competitiveness in a Globalised Economy: Issues and Challenges for Pharmaceutical Sector

24. Gavesana Journal of Management / Vol. 5. Issue 1. January 2013 - June 2013
Table-5: Export Growth
Year Exports Growth %
(Rs. crores)
Mar 2007 25666 20.89
Mar 2008 29354 14.37
Mar 2009 39821 35.66
Mar 2010 42154 6.6
Mar 2011 45746 7.7
Table-6: Top Global Generic Players
Rank Company
1 Teva
2 Sandaz
3 Mylan/Merck Gx
4 Watson Andrx
5 Barr
6 Actavis
7 Ratiopharm
8 Stada
9 Ranbaxy
10 Perrigo
Source: Indian Pharma Industry’s annual report
II. Trade performance
Table-7: Share in National Trade
Item/Years 2006/07 2007/08 2008-09 2009-10 2010-11
A: Total National Exports 571779 655864 840755 845534 1142649
(a) Drugs Pharmaceuticals and
Fine chemicals
Share in Total Export % 4.5 4.5 4.7 5.0 4.2
B: Total National Imports 840506 1012312 1374436 1363736 1683467
(b) Medicinal and 5866 6734 8649 9959 10937
Pharmaceutical Products
Share in Total Import % 0.7 0.7 0.6 0.7 0.6
(c) Trade Balance (a)-(b) 19800 22620 31172 32497 36614
The share of Exports of the “Drugs Pharmaceuticals and Fine Chemicals” in the total National Exportsdeclined from 4.50% to 4.20% during the period 2006- 07 to 2010-11, However in the absolute terms there isgrowth in Exports. The share of imports is declined 0.7% to 0.6% in the corresponding period. (Table 7). TheTable 8 reflect the expenditures on Research and Development.
India’s Competitiveness in a Globalised Economy: Issues and Challenges for Pharmaceutical Sector

Gavesana Journal of Management / Vol. 5. Issue 1. January 2013 - June 2013. 25
III. Research and Development
Table 8: Research and Development Expenditure
Year Growth in R&D Expenditure - Rs Cr R&D Expenditure As % of Sales
Domestic Companies Foreign Companies Domestic Companies Foreign Companies
Mar 1995 80.61 64.13 1.34 0.77
Mar 1996 142.00 83.37 1.71 0.91
Mar 1997 148.12 89.41 1.55 0.95
Mar 1998 154.15 90.65 1.43 0.88
Mar 1999 218.66 70.78 1.56 0.70
Mar 2000 256.80 90.17 1.56 0.66
Mar 2001 435.07 109.81 2.30 0.72
Mar 2002 597.91 110.04 2.64 0.65
Mar 2003 686.74 232.73 2.93 0.71
Mar 2004 1084.26 346.69 3.81 1.10
Mar 2005 1527.24 510.50 4.98 1.63
Mar 2006 1850.97 816.02 5.35 2.39
Mar 2007 2371.79 695.62 5.01 2.67
Mar 2008 2772.63 700.18 4.78 2.86
Mar 2009 3316.14 846.05 4.89 3.84
Mar 2010 3342.32 934.40 4.50 4.01
Source: Indian Pharma Industry’s annual report
III. New strategies that Indian pharmaceutical companies are adopting to become global players.
The annual turnover of the Indian Pharmaceutical Industry is estimated to be about Rs.1, 04,944.351Crores during the year 2010-11. The share of export of Drugs, Pharmaceuticals and Fine Chemicals is morethan Rs. 47551.26 crore. This segment of Industry has shown tremendous progress in terms of infrastructuredevelopment, technology base and wide range of products. The industry has developed excellent GMP (GoodManufacturing Practices) compliant facilities for the production of different dosage forms. The strength of theindustry is in developing cost effective technologies in the shortest possible time for drug intermediates and bulkactivities without compromising on quality. This is realized through the country’s strengths in organic chemicals’synthesis and process engineering. The domestic Pharma Industry has recently achieved some historic milestonesthrough a leadership position and global presence as a world class cost effective generic drugs’ manufacturer ofAIDS medicines. Many Indian companies are part of an agreement where major AIDS drugs based onLamivudine, Stavudine, Zidovudine, Nevirapine are supplied to Mozambique, Rwanda, South Africa and Tanzaniawhich have about 33% of all people living with AIDS in Africa. Many US Schemes are sourcing Anti Retroviralsfrom Indian companies whose products are already US FDA approved. Many Indian companies maintain higheststandards in Purity, Stability and International Safety, Health and Environmental (SHE) protection in productionand supply of bulk drugs even to some innovator companies. This speaks of the high quality standards maintainedby a large number of Indian Pharma companies as these bulk actives are used by the buyer companies inmanufacture of dosage forms which are again subjected to stringent assessment by various regulatory authoritiesin the importing countries. More of Indian companies are now seeking regulatory approvals in USA in specializedsegments like Antiinfectives, Cardiovasculars, CNS group. Along with Brazil & PR China, India has carved aniche for itself by being a top generic Pharma player.
Many Indian companies have got various international regulatory approvals for their plants, from agencieslike USFDA, MHRA-UK, TGA-Australia, MCC-South Africa etc. Outside USA India is the only country
India’s Competitiveness in a Globalised Economy: Issues and Challenges for Pharmaceutical Sector

26. Gavesana Journal of Management / Vol. 5. Issue 1. January 2013 - June 2013
having the highest number of USFDA approved plants for generic drugs’ manufacture outside USA. Majorshare of Indian Pharma exports is going to developed western countries and it speaks not only about excellentquality of Indian pharmaceuticals but also about the reasonableness of the prices. Some of the leading IndianPharma companies derive 50% of their turnover from International business.
Government Initiative
100 per cent foreign direct investment (FDI) is allowed under the automatic route in the drugs andpharmaceuticals sector including those involving use of recombinant technology. (DIPP) The Government plansto set up a US$ 639.56 million venture capital (VC) fund to give a boost to drug discovery and strengthen thepharma infrastructure in the country. The Government had issued an expression of interest (EoI) for technicaland financial bids for the selection of a global level consultant (GLC) for the preparation of a detailed projectreport (DPR) in order to develop India as a drug discovery and pharma innovation hub by 2020. The Drugs andPharmaceuticals Manufacturers Association has received an in-principle approval for its proposed specialeconomic zone (SEZ) for pharmaceuticals, bulk drugs, active pharmaceutical ingredients (APIs) and formulationsto be located at Nakkapalli mandal in Visakhapatnam district. The Department of Pharmaceuticals has prepareda “Pharma Vision 2020” for making India one of the leading destinations for end-to-end drug discovery andinnovation and for that purpose provides requisite support by way of world class infrastructure, internationallycompetitive scientific manpower for pharma research and development (R&D), venture fund for research inthe public and private domain and such other measures.
The government plans to open 3,000 Jan Aushadhi stores, which sell unbranded generic drugs at heavydiscounts to branded drugs, in the next two years.
Issues and Challenges
Noncompliance of regulatory norms: Most of the health care units in different municipal areas do not havea proper Bio Medical Waste Management system. BMW Management is done mostly through agreement withcompetent practices and state PCB is very rigid and strict about the enforcement of BMW. All the hospitals areaware about BMW management and handling rules. The professionals formulate regulations to operate privatenursing homes and hospitals. Otherwise, the government will have to participate in laying down guidelines,directives or regulations to ensure quality care. There is lack of continuous medical education programmes forhealthcare providers. A continuous education programme for physicians may be introduced to improve qualitycare. CSR is a good concept. But the organizations or business enterprises is not ready to implement because itinvolves direct and indirect cost. It needs a dedicative approach to perform CSR not only one angle that isbusiness and profit.
Survey covered in Pharma. The large except few small scale industries do comply with current. Goodmanufacturing practices (GMP) requirements to the required level meeting with the stringent requirements fromdomestic and international customers for the supply of quality product on continuous basis. Pharmaceuticalindustry representing Govt of AP have really taken the challenges as opportunities to contribute significantgrowth in the overall GDP. Government and Industry come together to stop $75 billion drug counterfeit ring.Typically, compliance requires major modifications to hardware such as packaging lines and labeling or printingequipment as well as IT-based planning systems extending from internal Enterprise Resource Planning (ERP)systems through the company’s distribution and logistics processes. In essence, each individual unit of sale mustnow become a ‘batch of one’ with additional data tracking requirements in order to create chain of custody or‘pedigree’ from point of production through to the point of dispensing or administration. All stakeholders in thesupply chain are investing significant time and money to comply with the various anti-counterfeiting regulationsaround the world and are collaborating with each other to realign their business process accordingly.
India’s Competitiveness in a Globalised Economy: Issues and Challenges for Pharmaceutical Sector

Gavesana Journal of Management / Vol. 5. Issue 1. January 2013 - June 2013. 27
While both globally and in India we are still far from a meaningful recovery in economic growth, there areindicators suggesting that some recovery is on the horizon. Macro indicators like purchasing managers’ index(PMI) and gross domestic product ( GDP) growth, which point to some recovery. Even on the commodity front,there are indications that things are looking up. Overall Good Manufacturing Practices (GMP) understandinglevel and implementation to the required regulatory requirements in Zone-I & Zone-III sectors is almost about80 to 85% satisfactory level. About 15 to 20 %, though understanding is fairly satisfactory found gap in theimplementation. This observation is mostly applicable in the small to medium scale industries.
The information reveals that, the practices that : being currently followed is about 50% satisfactory levelonly, the practices that are being currently followed is about 30% satisfactory level only. The poor environmentalmanagement practices implementation from small to medium scale industries is mainly due to financial constraints.The pharmaceutical industry of Govt.of A.P is struggling hard with commitment to fulfill the stringent environmentalregulations framed by Ministry of Environment and forest (MOEF), monitoring of the implementation is beingcarried out by APPCB in association with the central pollution control board (CPCB) guidance and directions.The common disposal of waste from small to medium organizations through these common treatment plants isnot only a great relief but also justified for huge capital investment otherwise required. The manufacturing ofdrug products and distribution to ultimate customers (human beings) as required is generally being carried outthrough marketing net work and medical representatives in the front line. The every organization’s target tomaximize sales and increase customer base with an ultimate aim to achieve maximum profit while gaining theproduct reputation in the market and establish the product brand.
Take, for instance, the recent rise in metal prices on the London Metal Exchange ( LME). Tin, aluminumand zinc have gained between 11%-13% since the start of November 2012, while nickel, lead and copper are upbetween 3%-8% during the same period. Gains across a section of commodities have led to the US-based CRBAll Commodities Index rising 1.5 per cent in the last one and a half months.
“The present challenge calls for bold and innovative measures”.
While in 2008-09 imports had reduced considerably due to fall in international crude oil prices, the situationat present is different as, while exports are declining, imports continue to remain high mainly on account of crudeand gold. With rapid globalization of economy, external sector is becoming more vulnerable. World Bank maypeg India’s GDP at 5.5% in 2012, 6% in 2013. The Bank may also peg India’s GDP to grow by little less than 6%next year 7% in 2014 and 2015. The next year would also be very hard for India’s growth trajectory primarilybecause of global slowdown. Very few countries such as Indonesia and Thailand are growing at 6-7% rate.
The European situation will remain very difficult up to the end of 2014 and may be in the beginning of 2015.That is going to rub-off on India but if it can begin to move up to 6-7% in this difficult situation that would begood. The global climate is tough so its not going to happen that we will bounce back to the 9% growth that wehad before 2008. But we should be able to buck the global trend and have India move up with the reforms andfew more. Give India 2-3 years. India has enough fundamental strength that if you work towards these, thenreally there is no reason why India can’t get back to 8-9% growth, Stressing that the present challenge isdifferent from the one faced in 2008, Mr. Chidambaram said: “The present challenge calls for bold and innovativemeasures”.
The new National Pharmaceutical Pricing policy (NPPP), which is proposed to be implemented in the nearfuture, could change the structure and dynamics of the Indian pharmaceutical industry. The new policy proposesto move to a mechanism wherein the ceiling price for the 348 drugs covered under the National List of EssentialMedicines (NLEM) 2011 will be based on the simple average price (SAP) vis-à-vis the weighted average price(WAP) proposed earlier. This would be applicable for all brands with a market share of more than 1%. Atpresent, 74 drugs and formulations are under price control, and their price fixation is on a cost-plus formula.”Today,
India’s Competitiveness in a Globalised Economy: Issues and Challenges for Pharmaceutical Sector

28. Gavesana Journal of Management / Vol. 5. Issue 1. January 2013 - June 2013
the span of price difference for the same product sold by different companies is 20 times in some cases. Withthe ceiling price, the differential could come down to 5-7 times,’’.
The profitability of pharmaceutical companies could be impacted “at an average of around 27% or morethan one-fourth. Analysts felt that the impact could conservatively range from 10% to 20% on profitabilitydepending on the product portfolio. In 2011, the Indian government passed a $5.4 billion dollar (US) policy, whichwould provide free medicines to the citizens and residents of India, and called for its mandatory implementation.This was undoubtedly a major source of relief for the impoverished and underprivileged who were unable tobear the expense of some drugs, quoted by some of the major branded players in our country. On the flip side,this could potentially lead to a loss of Indo- foreign pharmaceutical collaborations, especially since this bill isrigorously being pushed since July 2012.
It is widely expected that when it comes into effect, the policy could effect a change in the industrystructure. The mid-size and smaller companies could find the going tough, and, as a result, Mr. Shah said, “in thelonger term, there could be increased M&A’s and market exits but patients will be the beneficiaries as cheaper,good quality products will be available.” For clinical trials-In recent years, India is being globally recognized asthe ideal hub for conducting clinical trials. Today, the global clinical research outsourcing figures are at anestimated whopping $50 billion and major players in the field of healthcare- Sanofi-Aventis, Novo Nordisk,Nicholas Piramal and
Dr. Reddy’s choose to conduct their clinical research in India. Over the past decade there are more than2000 studies which have either been completed, or are still underway in the country, as reported on clinicaltrials.gov.
Some of the noteworthy trials currently being pursued across India by multinationals are:
- The Dengue seroprevalence study by Sanofi-Aventis,
- Immunogenicity and safety study of GSK’ s Infanrix Hexa vaccine,
- 2 dose HPV Gardasil vaccination trial by Merck
With such lucrative benefits, and the encouraging Indian government, it’s given, that India would bag asubstantial 15% chunk in the global clinical trials pie by the end of 2014! Government approves FDI in Pharmafor over 1,400 crores. The government has cleared more than 20 Foreign Direct Investment proposals includingeight from the Pharama sector which alone totals to Rs. 1842.55 Crores. Though, a senior Health Ministry hastold the press on Monday that foreign pharma companies looking for acquisition of Indian pharma companieswill face stiffer rules to ensure availability of affordable medicines for the general public in the Indian market. Thisis an extremely noble gesture by the government, who postulate that by the year 2017, almost 0.6 million peoplewould benefit by the newly conceptualized scheme.
IMS health, a healthcare information specialist predicts that emerging global pharmaceutical firms wouldaccount for almost 28% of drug sales in India by 2015, which is more than a 200% growth from the statistics ofthe year 2005, but with this unexpected turn in introduction of generic drugs, the figures could now be in peril.IMS adds that of the 600 Billion rupees of drugs are sold annually in India and almost 60% of drugs would becovered under the new doctrine.
Although this well laid out plan has been on the horizons for more than a year, it will be very stringentlyimplemented and in place by December 2012. Despite being a major blow to the biggies such as Pfizer, GlaxoSmithkline and Merck, it’s a boom for the generic wizards Dr. Reddy’s, Cipla and the likes. Brand protection isa relatively new business discipline that is here to stay in the life sciences industry. If your products are good,they will be subjected to the threats of counterfeiting and diversion to the gray market. Instead of ignoring thesebrand attacks we must build organizational capabilities, competencies, and operational processes that mitigate
India’s Competitiveness in a Globalised Economy: Issues and Challenges for Pharmaceutical Sector

Gavesana Journal of Management / Vol. 5. Issue 1. January 2013 - June 2013. 29
the risks of counterfeits entering the supply chain. Most importantly, though, we must share best practicesamong all stakeholders. Our patients and customers rightfully expect our best efforts in this endeavor.
The industry and trade associations have been highly proactive in their efforts to help safeguard the supplychain, primarily in coalescing members’ perspectives around public-private sector initiatives and proposedlegislation. The challenges of detecting and preventing counterfeit healthcare products demand alignment amongall stakeholders. Due to the serious consequences that counterfeits have on our patients and consumers, industryand trade associations such as PhRMA, EFPIA, Advamed, Euromed, NACDS, HMDA, and CHPA have beeninstrumental in raising awareness to the issue and organizing actions within their memberships. Furthermore, thespread of counterfeiting around the world combined with the globalization of healthcare product production andcommerce has resulted in increased cross-border alliances among regulators and other government agencies.Such international cooperation is vital to sustainable global success against counterfeiters rather than taking alocal or regional approach. Simply stated, our best defense against the counterfeiters of healthcare products is tomobilize the respective talents, expertise, and best practices of all stakeholders across industry segmentsworldwide.
China is currently actively promoting its pharmaceutical export industry by providing significant VAT (valueadded tax) rebates (averaging 13%) to pharmaceutical exporters. Even though these export tax rebates are adirect way for the Chinese government to support pharmaceutical companies through short-term downturns, itdoes not help the industry to stay competitive in the long term. It is likely that these rebates will start going downas China’s domestic market matures and growth picks up. Currently most pharmaceutical companies are movinggeneric and low-cost APIs to China where the VAT rebates are more likely to be slashed first. For example, inJuly 2007, the rebate on low value-added APIs was reduced from 9% to 5% as part of the Chinese government’sattempt to cut down on these API exports (though the rebates went back up to 13% to fuel growth duringrecession).
With these changes China’s current gross cost advantage of 30% to 50% could easily go down to 13% to25%. Factor in supply chain complexity (lead times and inventory implications), rising costs of quality assurance,and upcoming stringent environmental regulations, and Western pharmaceutical companies will start to rethinktheir China outsourcing strategies. Accommodating for these factors, the net cost advantage for somepharmaceutical firms could easily vanish. The supply chain strategy, manufacturing and distribution network,and supply chain policies of individual companies will determine the net-cost advantage and the business casefor sourcing/manufacturing in China.
Mitigation Strategies To Implement by Pharma Companies
Western pharmaceutical companies can apply several mitigation strategies to avoid a significant profit andloss impact from these trends. First, the companies need to acknowledge these trends as they develop their long-term sourcing strategies. Outsourcing business cases need to be updated by building scenarios for different costdrivers to allow sound decision making. Western pharmaceutical companies will need to understand the riskprofile in the context of their own supply chains. A robust risk analysis and quantification of exposure will becritical before developing a mitigation strategy. This will involve developing scenarios which reflect a company’scurrency exposure, breakdown of cost structure of outsourced supplies, and supply chain specifics (e.g. inventorypolicies, lead times etc.).
A shift in mindset is necessary to be able to ensure sustainable low-cost sources. The key will be toconsider these strategic manufacturers/suppliers from China as an extension of a company’s network ratherthan low-cost country sources. Western pharmaceutical companies have a range of options which can beapplied to counter these macro trends and stay cost-competitive. The solution they choose will need to bealigned with their strategy, supply chain capabilities, and the product / supplier portfolio. The options will have
India’s Competitiveness in a Globalised Economy: Issues and Challenges for Pharmaceutical Sector

30. Gavesana Journal of Management / Vol. 5. Issue 1. January 2013 - June 2013
varying degrees of reward and implementation complexity. Favorable Terms and Conditions – Companies canreduce their immediate exposure by establishing terms and conditions which protect the firm against anymovements in currency/inflation. Working collaboratively with strategic suppliers, companies should establishclear guidelines on how these risks will be shared. As a first step, companies can start by reviewing currentcontracts with the large Chinese suppliers and engage them in negotiations to establish clarity on sharing currencyexchange risks.
Using financial hedging strategies – In the short term, companies also can use financial instruments tohedge currency risk exposure. While this may be relatively quick to implement, there is a definite cost involvedin establishing these hedges. External manufacturing and procurement groups should work closely with thefinance department at these companies to better understand these instruments and mitigate financial risks.
Collaboration beyond qualification - It is often observed that pharmaceutical firms engage heavily with thesuppliers in the qualification phase, but the collaboration diminishes once the supply chain is established.Collaborating closely with suppliers to ensure productivity improvements can counter the increasing costs.Pharmaceutical companies can work closely with strategic suppliers to share technical know-how, capitalexcellence methodologies and best practices for production processes/quality assurance to help them withproductivity improvements.
Diversifying supply sources – Western pharmaceutical companies can reduce their exposure to China, forexample, by sourcing new API/Intermediates/formulations from other countries or validating alternative countrysources for current Chinese supplies. Currently China has a relative cost advantage over other low-cost countriesin low-value API/generic production. Based on how some of the above discussed macro trends play out, thebalance may tilt in favor of other countries. Diversifying the portfolio of suppliers across multiple low-costcountries can also be helpful in minimizing overall risks. India and several countries in South-east Asia (e.g.Singapore, Thailand, Philippines) and Eastern Europe can be promising candidates for broadening the supplybase for western pharmaceutical companies that are currently heavily weighted on China. Companies need tostart developing facts based on suppliers specific to their needs in these alternative low-cost countries. They canstart developing relationships with these suppliers by involving them on smaller projects and including them in thesourcing exercises.
Making sourcing decisions based on product category and future outlook of cost advantages – Companiesneed to conduct a robust analysis to identify which products can be outsourced. When doing this analysis, thecompanies need to forecast the price advantages that will exist long term as compared to the present sincesource changes are time consuming (can take years) and difficult in this industry. For example, final productformulations where labor is an important driver for price competitiveness may enjoy this advantage for a longerduration as compared to APIs where the labor component is relatively small.
Aligning sourcing decisions with Revenue Streams - Companies can mitigate currency and inflation risksby aligning low-cost country sourcing decisions with the revenue stream in those emerging markets. For example,companies with substantial revenues in India could look at developing supply sources in India to counter anysuch risks. To pursue this path, companies need to start by developing a future revenue outlook by country basedon their market participation strategy. Next, they need to review the supply base capabilities available in differentcountries aligned with their external manufacturing needs. Having a good fact base around these two topics willallow companies to take steps toward aligning sourcing decisions with revenue streams.
While the reward potential and the implementation ease will be different for different options, all of thesewill require significant cross-functional collaboration. For example, aligning sourcing decisions with revenuestreams will require significant collaboration between strategy, marketing, sales, supply chain and procurementfunctions. Also, there is a need to actively monitor the supply chain strategy in light of an actively changing
India’s Competitiveness in a Globalised Economy: Issues and Challenges for Pharmaceutical Sector

Gavesana Journal of Management / Vol. 5. Issue 1. January 2013 - June 2013. 31
market landscape. Firms need to understand the risk exposure and be well prepared to utilize different levers tomaintain cost competitiveness. It takes 18 to 36 months to move drug manufacturing sources, creating barriersto both entry and exit. Hence, acting before a cost advantage erodes will differentiate market leaders from therest.
Recommendations
To improve upon the GMP practices and environmental management practices in the pharma sector (Whichis mandatory), has to be promoted by frequent free training programmes from state and central drug departmentpersonnel to enlighten the need and depth of these requirements.
Environmental pollution caused by the pharma industry and the associated negative impacts on the societyin general, the surrounding localities in particular is an un-ending and un-resolved issue. May be Govt. of India,with revised industrial policies may insist and implement strictly by not promoting the creation of housing colonieswith in the vicinity of the industries at any cost. Govt. of India may control and provide the critical resourcessuch as, coal, water, power and land at affordable prices to make small to medium scale industries viable andhealthy. Upon creation of such a healthy environment, Govt. as well as local NGO’s and voluntary organisationscan insist to contribute their mite for social cause to up lift the society for better living and social status.
The current un-quantified and un-specified un-ethical practices in the marketing distribution chain, if identifiedand eliminated in a positive perspective can result in affordability for a common man for better health.
The associations and NGO’s do feel that Govt. should recognize such bodies as arbitrators to create aconducive environment between industry, regulator and Govt. authority.
The associations should voice out on critical issues facing by the industry such as power, VAT increase,coal etc., to reduce the in put cost with an expectation to arrive a possible solution to the problem.
References
Pradhan, Jaya Prakash, (2006). “Global Competitiveness of Indian Pharmaceutical Industry: Trends andStrategies,”MPRA Paper 12340, University Library of Munich, Germany.
Pradhan, Jaya Prakash, (2006). “The Pradhan, Jayaprakash (2007), Strengthening Intellectual PropertyRights Globally: Impact On India’S Pharmaceutical Exports,”The Singapore Economic Review (SER)World Scientific Publishing Co. Pvt. Ltd., Vol. 52 (02), pp 233-250
National Voluntary Guidelines in Health Care Industry, IDEAS, Research Division of Federal ReserveBank of St. Louis
Fagerberg, (1987), “A technology gap approach to why growth differ,”, Research Policy, Elsevier, Vol.16 (2-4),pp 87-99
Indian Pharma Industry Annual Report, (2012)
Center of Monitoring Indian Economy (CMIE), (2011)
India’s Competitiveness in a Globalised Economy: Issues and Challenges for Pharmaceutical Sector

32. Gavesana Journal of Management / Vol. 5. Issue 1. January 2013 - June 2013
Co-Movements of the Indian Stock MarketWith Select Emerging Markets
P. Bhanu Sireesha *
Abstract
The study is carried out to test the co-movements of Indian stock market with select major emergingmarkets over the globe. Various techniques like the Unit Root test, Co-integration test, Causality test, VectorAuto Regression, Impulse Responses, Variance Decomposition and Vector Error Correction are conducted onthe sample. India has been influenced by and is influencing most of the countries selected for the study. Thisproves the impact of co-integration among the global markets.
Key Words : Unit Root, Co-integration, Granger Causality, Vector Auto Regression, Impulse Response, VarianceDecomposition, VECM
Introduction
It is well known from the standard portfolio diversification theory, if the returns on assets in a portfolio havea correlation of less than unity, then diversification can reduce risk. In the extreme case, where the returns areperfectly negatively correlated, then diversification can, in theory, eliminate risk entirely. Grubel (1968) gaveone of the earliest expositions of how these benefits could be extended by diversifying a portfolio internationally.Investment in foreign equity markets became a popular practice in the 1980s as investors became aware thatinternational portfolio diversification helps in reducing their portfolio risk since securities happen to be lesscorrelated across the countries than within a country. The economic, political and institutional factors affectingsecurities returns tend to vary a great deal across countries resulting in a relatively low correlation amonginternational securities.
Economists are now seeking further guidance on policy-making that looks beyond the standard argumentthat stock market liberalization leads to better risk-sharing and hence improves welfare. There is more interestin the effects of stock market liberalization on stock market volatility, correlation among markets, and the prospectof international portfolio diversification (Bailey and Stulz, 1990). Hence the suitability of hedging one’s portfolioby international diversification has been investigated as to: Do the markets move together over time so thatbenefits from cross border diversification get exhausted? How much of the movement in one market can beattributed to innovations in another?
The cross border movement of funds has posed an opportunity for the investors to maximize their returnsby international diversification. But, if stock markets move together, then investing in various markets would notgenerate any long-term gains from the diversification. Therefore, it is essential for both active investors andacademicians to probe into the fact whether stock markets are inter-linked. The issue is also important to thepolicy makers because of the reason that if stock markets are found to be closely linked, then there is a dangerthat shocks in one market will spill over to the other markets.
The stock market crash in October 1987 has lead to several changes in the capital markets over the globe.Both the developed as well as the emerging markets initiated the introduction of innovative financial productslike American Depository Receipt, Global Depository Receipt, Foreign Currency Convertible Bonds, Options,Futures, Participatory Notes, etc. These innovations have opened up various opportunities for investors inaccessing investments across global markets. The fund managers from across the globe found emerging markets
* Research Scholar, Department of Commerce, Osmania University, Hyderabad. E-mail: [email protected]

Gavesana Journal of Management / Vol. 5. Issue 1. January 2013 - June 2013. 33
as an opportunity for their portfolio diversifications. The homogeneous financial innovations in capital marketsacross the globe coupled with gradual dismantling of regulatory barriers created interest among researchers totest for the integration of capital markets.
Review of Literature
Ross Levine (1997) observed in his study that countries with relatively liquid stock markets in 1976 grewmuch faster over the next 18 years than countries with illiquid markets, even after adjusting for differences inother factors that influence growth, like education levels, inflation rates and openness to trade. He also indicatedthat in promoting economic growth, a liquid stock market complements a strong banking system, and that loweringof international investment barriers significantly enhances the liquidity of stock markets, with positive effects oneconomic growth.
YagneshThakkar (1998) in his article on the Indian stock exchanges notified that the people in the marketare as keen to know about what happens in New York or what is happening in Hong Kong or Tokyo, as they areabout BSE or NSE. He concluded that there is no one-to-one cause and effect relationship between the Indianand any other market.
PratipKar et al (2000) studied the price return volatility in its technical and statistical sense and identifiedand compared trends and patterns of volatility, asymmetries in volatility, in a sample of 13 developed and emergingmarkets over a 15 year period. They applied various statistical tools under both homoskedasticity andheteroskedasticity to measure volatility and tested for auto correlation under variant conditions in the sample.
Eizaguirre et al (2002) tested whether volatility in six emerging markets has changed significantly over theperiod January 1976 to March 2002, by using alternative methodologies of endogenous breakpoints detectionthat estimate the dates at which the behaviour of the stock market volatility changed. The authors observed thatvolatility has behaved in a different manner over the period.
Nadal Rashid Sabri (2002) indicated in his study that there were significant positive increases in the degreeof correlation between the majorities of selected stock markets. Increasing linkages suppose to increase datadissemination, thus increase stock market efficiency, but with the existing cross markets volatility transmissionphenomenon, increasing linkages should be scrutinized carefully.
Narayan et al (2004) examined the dynamic linkages between the stock markets of India, Bangladesh,Pakistan and Sri Lanka using a temporal Granger Causality approach by binding the relationship among thestock price indices within a multivariate cointegration framework. They concluded that stock prices in Bangladesh,India and Sri Lanka Granger-cause stock prices in Pakistan.
VenkataSeshaiah S (2006) empirically investigated into the long run equilibrium relationship and short rundynamic linkage between the Indian stock market indices and stock markets of 7 developed and 7 emergingmarkets. He used Cointegration Approach, Granger Causality, Variance Decomposition Analysis and VECMmodels on daily data of indices for an 8 year period. He found that the Asian stock markets have a long termrelationship with Indian stock market. He also found that the Indian stock market exhibited certain short termunidirectional as well as bidirectional causal relationship with the different capital markets chosen. According tothe variance decomposition analysis, he observed that most of the markets are more endogenous in nature,except Japan, UK, Germany and Switzerland, for a more lucrative destination for international investors toinvest and diversify their portfolio risks.
Meric et al (2011) studied the effects of the 2008 global financial / economic crisis on the co-movementpatterns of the Indian stock market with those of US, UK, Germany, Japan, Australia, Hong Kong, Indonesia,Malaysia, New Zealand, China, Singapore, South Korea and Taiwan and identified a time-varying volatility inthe correlation among all the markets selected.
Co-Movements of the Indian Stock Market With Select Emerging Markets

34. Gavesana Journal of Management / Vol. 5. Issue 1. January 2013 - June 2013
Gagandeep et al (2013) studied the inter linkages between stock markets of Brazil, Russia, India, China andSouth Africa (BRICS) with the help of benchmark indices of these stock exchanges. Daily closing levels of thebenchmark indices in the five countries were taken for a period from April 1, 2005 to March 31, 2010. Linecharts and unit-root tests were applied to check the stationary nature of the series; Regression Analysis, Granger’sCausality Model, Vector Auto Regression (VAR) Model, and Variance Decomposition Analysis were performedto find out the linkages between the markets under study. The analysis revealed that the stock markets understudy were influenced by each other, but not to a great extent. It implies that there exists opportunities fordiversification of the investors among the stock exchanges of BRICS. The paper also observed that there aredomestic factors (macro-economic variables) that influence the stock markets.
Most of these studies relate to the investigation of integration of stock markets within India and theirconvergence with the world markets, specifically the emerging markets, pointing out the existence of cointegrationamong the countries studied. A need is felt to examine the long run equilibrium relationship and short rundynamic linkage between the Indian stock market and selectemerging markets, using daily data and recent timeseries techniques. The present study is an attempt in this direction.
Objectives ofthe Study
The overall objective of the present study is to analyze the impact of the co-movements of the Indian stockmarket with select major emerging markets over the globe. However, the following objectives are set in specificfor the study:
• To investigate the short run dynamic linkage between the Indian stock market and the select emergingmarkets.
• To identify the long run equilibrium relationship between India and the select emerging markets.
Sample
In order to attain the objectives of the study, a sample of prominent indices of 9 countries have beenselected along with India for comparison. These countries have been selected according to the IMF rankings ofcountries on the basis of GDP. All the emerging countries including Indiahave a GDP below 20000 InternationalDollars. The indices selected include (a) MERVAL Index (Argentina); (b) IBovespa Index (Brazil); (c) JakartaComposite Index (Indonesia); (d) Shanghai Composite Index (China); (e) FTSE/JSE All Share Index (SouthAfrica); (f) IPC Mexico Index (Mexico); (g) RTS Index (Russia); (h) FTSE Bursa Malaysia KLCI (Malaysia);(i) SET Index (Thailand) and (j) CNX Nifty (India).
Data
The study comprises daily stock market indices at closing times as collected from the home sites of differentstock exchanges, where available, and partly from the websites of yahoo finance and wall street journal. Whenthe stock markets were closed due to national holidays, bank holidays or for some other reasons (on other thanSaturdays and Sundays), the index price was taken as the arithmetic mean of the previous business day and thenext business day. Daily data for a period of 20 years from 4 January 1993 to 31 December 2012 are used. Forthe indices of countries Argentina, Brazil and Russia, data is available from later dates. Daily data started from27 April 1993 for Brazil, from 6 June 1994 for Argentina and from 1 September 1995 for Russia. The data isconsidered to the extent available for comparisons of these countries.
Research Methodology
The empirical exercise of finding whether a long-run relationship exists among the stock markets understudy comprises of two parts:
(a) Testing for a unit root I(1) in each series; and
Co-Movements of the Indian Stock Market With Select Emerging Markets

Gavesana Journal of Management / Vol. 5. Issue 1. January 2013 - June 2013. 35
(b) Testing for the cointegrationamong the markets provided the null hypothesis of unit root in each of thetime series being studied cannot be rejected.
For the unit root testing, Augmented Dickey-Fuller (ADF) test, Phillips-Perron (PP) test and KPSS test areused.
For studying cointegration among markets, Johansen’s Cointegration test is used on pair-wise and multivariatebases.
For finding whether a short-run dynamic linkage exists among the stock markets under study, GrangerCausality test using lags of 2, 10 and 30 days is applied.
For studying the long run equilibrium across markets, Vector Error Correction Model (VECM) is applied.
To identify the short term and long term impact of each market on the other, Impulse Responses andVariance Decomposition Analysis is adopted.
All these tests are performed on the statistical package ‘E Views 6’.
Unit Root Test
The presence of unit root in a time series is tested with the help of Augmented Dickey-Fuller (ADF) Test,which tests for a unit root in the univariate representation of time series. The Phillips–Perron (PP) Test (namedafter Peter C. B. Phillips and Pierre Perron) is a unit root test, which is used in time series analysis to testthe null hypothesis that a time series is integrated of order 1. Kwiatkowski–Phillips–Schmidt–Shin (KPSS) Testis used for testing a null hypothesis that an observable time series is stationary around a deterministic trend.ADF, PP and KPSS tests are used to find the existence of a unit root in each of the time series with and withouttrend at both Level and First Difference forms.
The null hypothesis is set as “The variables are non-stationary” or “The variables have unit root”.
Table 1: Unit Root Tests at Level
ADF Test Results PP Test Results KPSS Test Results
Country without with without with without withtrend trend trend trend trend trend
Argentina -0.42354 -2.35754 -0.32788 -2.22451 7.074087 1.032168
Brazil -2.33196 -2.74937 -2.24898 -2.65203 3.851927 1.152740
China -1.66093 -2.12413 -1.58884 -1.93087 5.121560 0.233494
India -0.23448 -2.10905 -0.17322 -2.05252 7.769855 1.581977
Indonesia 1.29319 -0.73877 1.42650 -0.64426 7.024225 1.917976
Malaysia -0.72444 -1.36658 -0.77929 -1.42197 4.048951 1.453735
Mexico 0.87063 -1.64162 1.11986 -1.44985 8.300538 1.737009
Russia -1.12521 -1.98931 -1.14210 -2.02020 6.427362 0.501975
S Africa 0.64678 -1.58643 0.85645 -1.39478 8.276209 1.524870
Thailand -0.65534 -0.51939 -0.54867 -0.51205 1.663742 1.622920
Due to the high p-values, at Level form, the null hypothesis could not be rejected. Hence data has beenconverted to First Difference form by calculating the logarithmic returns of all the variables (Table 1).
Co-Movements of the Indian Stock Market With Select Emerging Markets

36. Gavesana Journal of Management / Vol. 5. Issue 1. January 2013 - June 2013
Table 2: Unit Root Tests at First Difference
ADF Test Results PP Test Results KPSS Test Results
Country without with without with without withtrend trend trend trend trend trend
Argentina -63.68356 -63.68391 -63.66724 -63.66709 0.111545 0.059920
Brazil -70.00474 -70.06618 -70.03588 -70.07504 0.585113 0.305001
China -29.29691 -29.29365 -73.42432 -73.41891 0.052277 0.040977
India -64.81941 -64.81427 -64.74363 -64.73837 0.068670 0.050646
Indonesia -61.18746 -61.18491 -61.12320 -61.17484 0.124030 0.075972
Malaysia -31.80301 -31.80159 -69.58027 -69.57491 0.085819 0.063996
Mexico -64.70187 -64.69579 -64.52896 -64.52261 0.031843 0.031224
Russia -58.12000 -58.11711 -58.15146 -58.14729 0.087149 0.067289
S Africa -70.93334 -70.92695 -70.93497 -70.92858 0.048046 0.048980
Thailand -45.69155 -45.71518 -65.56243 -65.53407 0.309840 0.082532
The unit root tests have been performed again on the first difference form where the significance values(p-values) are observed to be below 0.05 for all these values, which implies that the null hypothesis is rejected.Hence it could be concluded that for all the countries under observation, stationarity has been obtained at thefirst difference form at 5% level of significance. Thus all the variables were found to be integrated of order 1,i.e. I(1) Table 2.
Cointegration Test
To investigate the existence of a long term relationship between the stock market returns of India and theselect major markets, the significance of the relationship among the variables is explored. If the variables understudy are found to be cointegrated, it will provide statistical evidence for the existence of a long run relationship.Though, a set of economic series are not stationary, there may exist some linear combination of the variableswhich exhibit a dynamic equilibrium in the long run (Engle and Granger, 1987). Hence, the maximum likelihoodtest procedure established by Johansen and Juselius (1990) and Johansen (1991) is used.
Hence, basing on the results of the unit root tests, the Johansen’s Cointegration test was performed to seewhether any combinations of the variables were cointegrated.
• Pair-wise evaluation of the existence of cointegration was examined for India with select emerging markets.
• The null hypothesis is framed as “There is no long run association between the two countries”.
• It was found that Indian capital market shows a long run relationship only with Mexico as its null hypothesisalone was rejected.
Co-Movements of the Indian Stock Market With Select Emerging Markets

Gavesana Journal of Management / Vol. 5. Issue 1. January 2013 - June 2013. 37
Table 3: Pair-wise Johansen’s Cointegration
Pair Hypothesized Eigen Trace 5% Critical 1% Critical
No. of CE(s) value Statistic Value Value
India - Argentina None 0.002408 11.67032 15.49471 19.93711
At most 1 1.91E-07 0.000923 3.841466 6.634897
India - Brazil None 0.002125 10.97492 15.49471 19.93711
At most 1 1.24E-05 0.063511 3.841466 6.634897
India - China None 0.000924 4.965398 15.49471 19.93711
At most 1 2.85E-05 0.148338 3.841466 6.634897
India - Indonesia None 0.002029 10.82125 15.49471 19.93711
At most 1 4.57E-05 0.238378 3.841466 6.634897
India - Malaysia None 0.001045 5.46701 15.49471 19.93711
At most 1 3.24E-06 0.016858 3.841466 6.634897
India - Mexico None * 0.00337 18.62394 15.49471* 19.93711
At most 1 0.000199 1.034956 3.841466 6.634897
India - Russia None 0.001145 5.253444 15.49471 19.93711
At most 1 1.76E-05 0.07968 3.841466 6.634897
India - South Africa None 0.00255 13.84154 15.49471 19.93711
At most 1 0.000103 0.534526 3.841466 6.634897
India - Thailand None 0.000505 2.718315 15.49471 19.93711
At most 1 1.62E-05 0.084198 3.841466 6.634897
* denotes rejection of the hypothesis at the 0.05 level
• Multivariate Cointegration test (Table 3) was performed for the group consisting of emerging markets andIndia. The null hypothesis is framed as “There is no long run association between India and the select emergingmarkets”.
Table 4: Multivariate Cointegration between India, Argentina, Brazil, China, Indonesia, Malaysia,Mexico, Russia, South Africa and Thailand
Lags interval (in first differences): 1 to 4
Unrestricted Cointegration Rank Test (Trace)
Hypothesized No. of CE(s) Eigen value Trace Statistic 0.05 Critical Value Prob.**
None * 0.018274 292.4693 239.2354 0.0000
At most 1 * 0.012558 209.1625 197.3709 0.0113
At most 2 0.009345 152.0774 159.5297 0.1183
At most 3 0.007678 109.6688 125.6154 0.3078
At most 4 0.007024 74.85180 95.75366 0.5489
At most 5 0.003549 43.01423 69.81889 0.8875
At most 6 0.003233 26.95574 47.85613 0.8559
At most 7 0.001520 12.32730 29.79707 0.9199
At most 8 0.000977 5.454072 15.49471 0.7589
At most 9 0.000230 1.037761 3.841466 0.3083
Trace test indicates 2 cointegratingeqn(s) at the 0.05 level
* denotes rejection of the hypothesis at the 0.05 level
**MacKinnon-Haug-Michelis (1999) p-values
Co-Movements of the Indian Stock Market With Select Emerging Markets

38. Gavesana Journal of Management / Vol. 5. Issue 1. January 2013 - June 2013
It was observed that the null hypothesis was rejected and there were two cointegrating equations at the 5%level of significance. Thus it could be concluded that India showed a long run association with the selectemerging markets as a group (Table 4).
Granger Causality Test
If two or more variables are cointegrated, there is causality in at least one direction (Engle and Granger,1987). This causality can be assessed in two ways: short run and long run.
- For the short run, lag of 2 days, 10 days and 30 days are used.
- The long run relationship of Indian market with the other markets under study is determined by usingVector Error Correction Model (VECM).
After confirming the long run cointegration among the markets selected for study, the short run causalitywas tested by using the Granger Causality Test. Experiments were performed with a lag of 2 days, 10 days and30 days hoping that such lag periods would be adequate to get effects of one market to the other.
For Granger Causality Test when a lag of 2 days is taken, the null hypothesis is set as “Country 1 does notGranger Cause Country 2 within 2 days time”.
Table 5: Granger Causality Test with Lag of 2 days
Null Hypothesis Obs. F-Statistic Probability
INDIA does not Granger Cause ARGENTINA 4843 1.90575 0.1488
ARGENTINA does not Granger Cause INDIA 25.8296 7.00E-12*
INDIA does not Granger Cause BRAZIL 5132 2.20126 0.1108
BRAZIL does not Granger Cause INDIA 11.9521 7.00E-06*
INDIA does not Granger Cause CHINA 5214 4.45633 0.0116*
CHINA does not Granger Cause INDIA 2.96062 0.0519
INDONESIA does not Granger Cause INDIA 5214 0.11941 0.8874
INDIA does not Granger Cause INDONESIA 15.3864 2.00E-07*
MALAYSIA does not Granger Cause INDIA 5214 0.06566 0.9364
INDIA does not Granger Cause MALAYSIA 15.3525 2.00E-07*
MEXICO does not Granger Cause INDIA 5214 71.2283 3.00E-31*
INDIA does not Granger Cause MEXICO 1.0864 0.3375
RUSSIA does not Granger Cause INDIA 4519 8.23768 0.0003*
INDIA does not Granger Cause RUSSIA 2.75391 0.0638
SAFRICA does not Granger Cause INDIA 5214 18.3677 1.00E-08*
INDIA does not Granger Cause SAFRICA 4.66838 0.0094*
THAILAND does not Granger Cause INDIA 5214 0.18647 0.8299
INDIA does not Granger Cause THAILAND 6.91806 0.001*
* denotes rejection of the hypothesis at the 0.05 level
The following observations could be made (Table 5):
• A unidirectional causal influence on the Indian stock index from the stock indices of Argentina, Brazil,Mexico andRussia with a lag of 2 days. This indicates influence of operations of these indices on the Indianindex within 2 days.
• A unidirectional causal influence of the Indian stock index on the stock indices of China, Indonesia, MalaysiaandThailand with a lag of 2 days. This indicates influence of operations of the Indian index on these indiceswithin 2 days.
Co-Movements of the Indian Stock Market With Select Emerging Markets

Gavesana Journal of Management / Vol. 5. Issue 1. January 2013 - June 2013. 39
• A bidirectional causal influence of the Indian stock index with the stock indices of South Africa with a lagof 2 days also exists. This indicates that India and South Africa exchange influence on each other within2 days.
For Granger Causality Test when a lag of 10 days is taken, the null hypothesis is set as “Country 1 does notGranger Cause Country 2 within 10 days time”.
Table 6: Granger Causality Test with Lag of 10 days
Null Hypothesis Obs. F-Statistic Probability
INDIA does not Granger Cause ARGENTINA 4835 1.25415 0.2508
ARGENTINA does not Granger Cause INDIA 6.31834 1.00E-09*
INDIA does not Granger Cause BRAZIL 5124 1.68406 0.0783
BRAZIL does not Granger Cause INDIA 3.38113 0.0002*
INDIA does not Granger Cause CHINA 5206 1.0789 0.3744
CHINA does not Granger Cause INDIA 1.12358 0.3397
INDONESIA does not Granger Cause INDIA 5206 0.59959 0.8155
INDIA does not Granger Cause INDONESIA 3.99041 2.00E-05*
MALAYSIA does not Granger Cause INDIA 5206 1.43571 0.1577
INDIA does not Granger Cause MALAYSIA 4.38389 4.00E-06*
MEXICO does not Granger Cause INDIA 5206 16.5473 8.00E-30*
INDIA does not Granger Cause MEXICO 0.83695 0.5928
RUSSIA does not Granger Cause INDIA 4511 2.42009 0.0072*
INDIA does not Granger Cause RUSSIA 1.43643 0.1574
SAFRICA does not Granger Cause INDIA 5206 4.86678 5.00E-07*
INDIA does not Granger Cause SAFRICA 2.23451 0.0136*
THAILAND does not Granger Cause INDIA 5206 1.27404 0.2389
INDIA does not Granger Cause THAILAND 3.55328 0.0001*
* denotes rejection of the hypothesis at the 0.05 level
The following observations could be made (Table 6):
• A unidirectional causal influence on the Indian stock index from the stock indices of Argentina, Brazil,Mexico and Russia with a lag of 10 days. This indicates influence of operations of these indices on theIndian index within 10 days.
• A unidirectional causal influence of the Indian stock index on the stock indices of Indonesia, Malaysia, andThailand with a lag of 10 days. This indicates influence of operations of the Indian index on these indiceswithin 10 days.
• A bidirectional causal influence of the Indian stock index with the stock indices of South Africa with a lagof 10 days also exists. This indicates that India and South Africa exchange influence on each other within10 days.
For Granger Causality Test when a lag of 30 days is taken, the null hypothesis is set as “Country 1 does notGranger Cause Country 2 within 30 days time”.
Co-Movements of the Indian Stock Market With Select Emerging Markets

40. Gavesana Journal of Management / Vol. 5. Issue 1. January 2013 - June 2013
Table 7: Granger Causality Test with Lag of 30 days
Null Hypothesis Obs. F-Statistic Probability
INDIA does not Granger Cause ARGENTINA 4815 1.19537 0.2136
ARGENTINA does not Granger Cause INDIA 2.63526 3.00E-06*
INDIA does not Granger Cause BRAZIL 5104 1.23478 0.1768
BRAZIL does not Granger Cause INDIA 1.8543 0.0031*
INDIA does not Granger Cause CHINA 5186 1.31402 0.1175
CHINA does not Granger Cause INDIA 0.90775 0.6109
INDONESIA does not Granger Cause INDIA 5186 1.38616 0.0785
INDIA does not Granger Cause INDONESIA 1.71338 0.0091*
MALAYSIA does not Granger Cause INDIA 5186 1.51296 0.0361*
INDIA does not Granger Cause MALAYSIA 2.1589 0.0003*
MEXICO does not Granger Cause INDIA 5186 6.85864 2.00E-27*
INDIA does not Granger Cause MEXICO 0.87885 0.6561
RUSSIA does not Granger Cause INDIA 4491 2.03854 0.0007*
INDIA does not Granger Cause RUSSIA 1.68339 0.0113*
SAFRICA does not Granger Cause INDIA 5186 2.4843 1.00E-05*
INDIA does not Granger Cause SAFRICA 2.09689 0.0004*
THAILAND does not Granger Cause INDIA 5186 1.31463 0.1171
INDIA does not Granger Cause THAILAND 1.88237 0.0025*
* denotes rejection of the hypothesis at the 0.05 level
The following observations could be made (Table 7):
• A unidirectional causal influence on the Indian stock index from the stock indices of Argentina, Brazil andMexico with a lag of 30 days. This indicates influence of operations of these indices on the Indian indexwithin 30 days.
• A unidirectional causal influence of the Indian stock index on the stock indices of Indonesia and Thailandwith a lag of 30 days. This indicates influence of operations of the Indian index on these indices within 30days.
• A bidirectional causal influence of the Indian stock index with the stock indices of Malaysia, Russia, andSouth Africa with a lag of 30 days also exists. This indicates that India and these countries exchangeinfluence on each other within 30 days.
From the observations of the Granger Causality test with lag of 2 days, 10 days and 30 days, it may beconcluded that
• The Chinese stock market factors out the influence of Indian stock market within 2 days
• Malaysia and Russia take 30 days to share the bidirectional causal relationship with India
• Argentina, Brazil andMexico do not in any way get influenced by the Indian stock index operations
• Indian market does not in any way get influenced by the markets of Indonesia and Thailand
• South Africa shares a uniform bidirectional causal relationship with India during all the lag periods
Vector Auto-Regression (VAR) Model
In order to examine the dynamic interrelationships among world stock indices, the study estimates VARcoefficients using daily rate of return on the stock market indices selected for the study. The VAR model
Co-Movements of the Indian Stock Market With Select Emerging Markets

Gavesana Journal of Management / Vol. 5. Issue 1. January 2013 - June 2013. 41
contains simultaneous equations in which all the variables are considered to be endogenous. However, eachendogenous variable is explained by its lagged or past values and the lagged values of the other endogenousvariables included in the system.
By using simulated responses of the estimated VAR system, the following possibilities can be observed:
• Trace out the dynamic responses of one market to innovations in another, through the calculation of ImpulseResponses
• Locate all the main channels of interactions among national stock markets through the calculation ofVariance Decompositions
Impulse Responses
To obtain additional insight into the mechanism of transmission of stock price movements, the patterns ofdynamic responses of each of the select stock markets to innovations in a particular market are examined usingthe stimulated responses of the estimated VAR system. A closer look at the magnitudes of the innovationsamong the stock markets led to the conclusion that the response of each stock market to its own shocks is higheron the first day and it gradually died out thereafter (Table 8).
A closer examination of the information furnished revealed the following points of consideration:
• The response of every country to its own shock is higher on the first day which gradually dies out thereafter
• Most of the emerging markets show a higher level of response to the shock from their own markets on firstday
• The markets over the globe also respond to the shocks from each of the countries on first day
• The number of other markets responding for each country increased by the second day
• For all the countries the impulse responses from the other markets over the globe have gradually died downto zero by the fourth or fifth day
From these observations it can thus be concluded that the dynamic response patterns are found to begenerally consistent with the notion of informationally efficient international stock markets.
Table 8: Impulse Responses of all Stock Markets
Country Response to own Markets responding Markets respondingshock on day 1 to country’s shock on day 1 to country’s shock on day 2
Brazil 3.86 Rus, Ind Ind, Rus, Mex
Russia 2.35 Ind Rus, Arg, Mex, Braz
Argentina 1.80 Braz, Rus Arg, Mex, Rus
China 1.64 - Rus, Arg, SA
India 1.39 Indo, Chi Mex, Arg, Braz
Indonesia 1.34 - Indo, Mex, Arg, Braz
Thailand 1.33 Indo Mex, Rus, Arg, Braz
Malaysia 1.30 - Indo, Mex, Arg, Rus, Braz
Mexico 1.07 Arg, Braz, Rus Mex, Rus, Ind, Braz, Indo
SA 0.99 Rus Mex, Arg, Braz
Co-Movements of the Indian Stock Market With Select Emerging Markets

42. Gavesana Journal of Management / Vol. 5. Issue 1. January 2013 - June 2013
Variance Decomposition Test
Variance decomposition technique helps in identifying the percentage of fluctuation in a time series attributableto other variables at select time horizons (Table 9). It is used
• To identify the endogenous nature of the stock markets of the countries in the sample under consideration.
• To identify the percentage of influence of each market on every other market in the sample underconsideration
The major findings observed are as follows:
• The percentage of fluctuation in the time series of one stock market that is attributable to the other variablesin the select sample is observed to be stable since the 5th day onwards for all the countries.
• The variations in the stock markets of China and Brazil are explained by more than 90% from the behaviorof their domestic markets. This indicates that these markets are highly endogenous in nature as they arethe highest among the sample selected.
• The variations in the stock markets of the balance nations are explained moderately, i.e. about 50% to 90%from the behavior of their domestic markets. This indicates that these markets are moderately endogenousin nature as these markets fall within the two extremes for the sample selected.
• The variations in the indices of China, Brazil, Malaysia, Russia, India, Argentina and Indonesia, have beengreatly explained by themselves. These markets are said to be moderately independent of each other asthey are explained by more than 70% from their domestic markets.
• Due to this moderate endogenous nature, there exists a possibility of minimization of risk by diversificationof investment in these countries.
• Whereas, the markets of South Africa, Mexico and Thailand, which are explained by less than 70% fromtheir domestic markets, show more interdependence on global markets, making it difficult for risk minimizationof investments in these countries.
• The variance in the Indian stock market is meagerly explained by the stock market of Indonesia.
Table 9: Endogenous nature of Stock Markets
Country % at 10th day Rank Influenced by *
China 95.29 1
Brazil 92.89 2
Malaysia 82.89 3
Russia 80.51 4
India 78.00 5 INDO (1.10)
Argentina 76.71 6 BRAZ (4.28), RUS (2.93)
Indonesia 71.74 7
Thailand 69.39 8 INDO (2.14)
S Africa 58.78 9 RUS (5.19), MEX (2.11)
Mexico 51.96 10 ARG (7.81), BRAZ (4.71), RUS (3.02)
* Markets other than those specified here, influence the country by less than 2.00, hence are ignored
Granger Causality using Vector Error Correction Model
Using the vector error correction model (VECM), the causality relationship of various countries with India isidentified. India is taken as the Dependent Variable with each of the other countries as Independent Variablesindividually for this test. This test can be implemented in two forms (a) pairwise and (b) multivariate analysis.
Co-Movements of the Indian Stock Market With Select Emerging Markets

Gavesana Journal of Management / Vol. 5. Issue 1. January 2013 - June 2013. 43
• Pair wise Granger Causality using VECM :The null hypotheses are set as
• Independent Variable does not have long run causality on the Dependent Variable
• Independent Variable of lag 2 does not jointly influence Dependent Variable in short run
For the short run analysis, Wald test χ2 values are observed in order to decide the acceptance or rejectionof the null hypothesis.
Table 10: Granger Causality using VECM for India
Pair Long run Causality Short run Causality
Co eff. Prob. Wald Test χ2 Prob.
India - Argentina -0.002005 0.0974 128.638200 0.0000*
India - Brazil -0.000122 0.7661 38.433520 0.0000*
India - China -0.000155 0.5932 28.814190 0.0000*
India - Indonesia -0.000916 0.3822 4.624737 0.0990
India - Malaysia -0.000246 0.6666 0.347066 0.8407
India - Mexico -0.007253 .0001* 361.180400 .0000*
India - Russia -0.000276 0.7487 27.786600 .0000*
India - South Africa -0.005187 .0017* 27.954620 .0000*
India - Thailand -0.000040 0.9049 0.159794 0.9232
* denotes rejection of the hypotheses at 0.05 levelIt was observed that the null hypothesis ‘a’ is rejected for Mexico and South Africa, which can be concluded
to have long run causality with India. It was also observed that the null hypothesis ‘b’ is rejected for Argentina,Brazil, China, Mexico, Russia and South Africa, through which it can be concluded that these are the independentvariables each with lag 2 that are influencing India in the short run (Table 10).
The long run causality is tested for every country with each of the other select countries. The null hypothesisis stated as “Independent Variable does not have long run causality on the Dependent Variable”.
Table 11: Granger Causality using VECM for all countries
Country Long run equilibrium from (Independent Variables)
Argentina India, Mexico
Brazil All Countries
China —
India Mexico, South Africa
Indonesia Argentina, India, Mexico, South Africa
Malaysia Argentina, Brazil, India, Indonesia, Mexico, South Africa
Mexico —
Russia Argentina, South Africa
South Africa Mexico
Thailand Argentina, Russia
Accordingly, it could be observed that (Table 11)
1. India holds only unidirectional long run causality from Mexico and South Africa.
2. India shows unidirectional long run causality towards Argentina, Brazil, Indonesia and Malaysia.
3. No country shows long run causality towards Mexico and China.
4. Every country shows long run causality towards Brazil.
Co-Movements of the Indian Stock Market With Select Emerging Markets

44. Gavesana Journal of Management / Vol. 5. Issue 1. January 2013 - June 2013
• Multivariate Granger Causality using VECM: As it was already found that India is cointegrated withEmerging Markets at lag 2 and Trace test identified 2 cointegrated vectors, Vector Error Correction Model wasestablished on the same set of countries with 2 cointegrating vectors at lag 2. According to the establishedmodel, it is found that the adjustment towards long run equilibrium (C1) takes place at about 0.47% per day. Asthe probability of C(1) is less than 0.05, it can be stated that C(1) is significant in depicting the long run equilibriumbetween the countries selected in the group (Table 12).
Table 12: Vector Error Correction Estimates for India Vs. Emerging Markets
Coefficient Std. Error t-Statistic Prob.
C(1) -0.004681 0.000996 -4.700664 0.0000
C(2) -0.000817 0.003118 -0.261868 0.7934
C(3) 0.029599 0.017105 1.730493 0.0836
C(4) -0.021923 0.017102 -1.281865 0.2000
C(5)** 0.097798 0.033659 2.905539 0.0037*
C(6)** 0.032325 0.03414 0.946865 0.3438
C(7) 0.000488 0.000508 0.96089 0.3367
C(8) 7.98E-05 0.000508 0.157213 0.8751
C(9)** -0.08683 0.018541 -4.683066 0.0000*
C(10)** 0.065749 0.018588 3.537162 0.0004*
C(11) -0.050443 0.03607 -1.398467 0.1620
C(12) 0.020745 0.035267 0.588229 0.5564
C(13) -0.057298 0.064166 -0.892969 0.3719
C(14) -0.055394 0.063582 -0.87122 0.3837
C(15)** 0.047897 0.003642 13.15098 0.0000*
C(16)** 0.004977 0.003783 1.315541 0.1884
C(17) 0.008429 0.045443 0.185485 0.8529
C(18) 0.036864 0.045205 0.815477 0.4148
C(19)** -0.010296 0.004038 -2.549723 0.0108*
C(20)** 0.00747 0.003972 1.880805 0.0601
C(21) -0.13552 0.081406 -1.664748 0.0960
C(22) -0.024686 0.081194 -0.304041 0.7611
C(23) 0.59263 0.683059 0.867611 0.3857
R-squared 0.089799 Mean dependent var 1.09414
Adjusted R-squared 0.085345 S.D. dependent var 47.88768
S.E. of regression 45.79863 Akaike info criterion 10.49146
Sum squared resid 9430425 Schwarz criterion 10.52412
Log likelihood -23682.46 Hannan-Quinn criter. 10.50297
F-statistic 20.16211 Durbin-Watson stat 2.007209
Prob(F-statistic) 0.0000
(*) represents individual significance of variable in explaining Dependent variable
(**) represents significance in jointly influencing the Dependent variable
The vectors C(3) to C(22) are the short run coefficients of the Vector Error Correction Model. Thesignificance of influence of both lags of each country is checked on India by using Wald chi square values. It isfound that the two lagged values of Argentina [C(5), C(6)], China [C(9), C(10)], Mexico[C(15), C(16)] andSouth Africa [C(19), C(20)] are found significant. Thus it can be concluded that these countries show a shortrun causality running into India.
Co-Movements of the Indian Stock Market With Select Emerging Markets

Gavesana Journal of Management / Vol. 5. Issue 1. January 2013 - June 2013. 45
The decision for this model is
1. There is Long run causality running from all Emerging markets selected to India.
2. There is Short run causality running from Argentina, China, Mexico and South Africa to India.
Conclusions
The study is carried out to test the co movements of India with select major emerging markets over theglobe. Various techniques like the Unit Root test, Cointegration test, Causality test, Vector Auto Regression,Impulse Responses. Variance Decomposition and Vector Error Correction are conducted on the sample. Thestudy leads to the following conclusions:
1. In the Unit Root Test, stationarity among the observations of all the variables was obtained at first differenceform at 5% level of significance. Thus all the variables were integrated of order 1.
2. The Johansen’s cointegration test proved a long run integration of India with Mexico.
3. When the variables were taken as a group, India with the emerging markets, the Cointegration test provedthat there existed long run association of India with the emerging markets.
4. According to the Granger Causality Test the unidirectional causal relationship of countries with Indiagradually converted to bidirectional relation through the span of 2 days to 30 days.
5. Bidirectional causal relationship for India existed with 1 country for lag of 2 days, which increased to 3countries for lag of 30 days.
6. Indian market shows a unidirectional causal relationship toward s China for a lag of 2 days after whichthere is no effect either ways. With this it can be concluded that the Chinese stock market factors out theinfluence of Indian stock market within 2 days and also isolates itself from further influence.
7. The response of every country to its own shock is higher on the first day which gradually dies out thereafter
8. Most of the emerging markets showed a higher level of response to the shock from their own markets onfirst day
9. For all the countries the impulse responses from the other markets over the globe have gradually died downto zero by the fourth or fifth day
10. The dynamic response patterns are found to be generally consistent with the notion of informationallyefficient international stock markets.
11. All the emerging markets selected were found to be endogenous in nature enabling the minimization of riskthrough diversification of investment, which is not possible for the exogenous markets.
12. Variations in the indices of all the emerging markets are explained by themselves. All the countries selectedare affected by each other in some way or the other depicting their efficiency to link up globally.
13. According to VECM, only Mexico and South Africa show long run causality towards India, but most of thecountries show short run causality.
14. India shows unidirectional long run causality towards Argentina, Brazil, Indonesiaand Malaysia.
15. India has been influenced by and is influencing most of the countries selected for the study. This proves theimpact of cointegration among the global markets.
16. Depicting its global interlink with these countries, India is strengthening its prominence in the universalscenario.
Co-Movements of the Indian Stock Market With Select Emerging Markets

46. Gavesana Journal of Management / Vol. 5. Issue 1. January 2013 - June 2013
References
AnindyaChakrabarty, Dr. Bidyut Kumar Ghosh, 2011, Long Run Financial Market Cointegration and its Effecton International Portfolio Diversification, Indian Journal of Finance, 5(4), April, 27-37
Bailey W., Stulz R.M., 1990, Benefits of International Diversification: The case of Pacific Basin Stock Markets,Journal of Portfolio Management, 16, 57-61
Bhargava A., 1986, On the Theory of Testing for Unit Roots in Observed Time Series, The Review of EconomicStudies, 53 (3), 369–384
Dr. GulserMeric, Dr. NiranjanPati, Dr. IlhanMeric, 2011, Co-Movements of the Indian Stock Market with otherStock Markets: Implications for Portfolio Diversification, Indian Journal of Finance, 5(10), October, 13–20
Eizaguirre J.C., Biscarri J.G. and Hidalgo F.P.G., 2002, Financial Liberalization and Emerging Stock MarketVolatility, www.citeseerx.ist.psu.edu
Gagandeep Sharma, MandeepMahendru, Sanjeet Singh, 2013, Are the Stock Exchanges of Emerging EconomiesInterlinked? : Evidence from BRICS, Indian Journal of Finance, 7(1), January, 26-37
Grubel H., 1968, Internationally Diversified Portfolios: Welfare Gains and Capital Flows, American EconomicReview, 58(5), 1299-1314
Kwiatkowski D., P.C.B. Phillips, P. Schmidt, Y. Shin, 1992, Testing the Null Hypothesis of Stationarity againstthe Alternative of a Unit Root, Journal of Econometrics, 54, 159–178
Mishra R.K., Mukherjee K.N., 2007, Stock Market Integration and Efficiency: Evidence from Inter andIntra Market Relationship, Excel Books, New Delhi
Nadal Rashid Sabri, 2002, Increasing linkages of Stock Markets and Price Volatility, Financial Risk and FinancialRisk Management, 16, 349-373
Paresh Narayan, Russel Smith, Mohan Nandha, 2004, Interdependence and Dynamic Linkages between theEmerging Stock Markets of South Asia
Prashant Joshi, 2011, Volatility in Indian Stock Markets, Himalaya Publishing House, Mumbai
PratipKar, Raju M.T., Prabhakar R. Patil, KiranKarande, 2000, Stock Market Volatility: A Comparative Study ofSelected Markets, Working Paper Series No.2, SEBI, January
Raju M.T., Ghosh A., 2004, Stock Market Volatility: An International Comparison, Working Paper Series No.8,SEBI
Robert F. Engle and C.W.J. Granger, 1987, Cointegration and Error Correction: Representation, Estimation andTesting, Econometrica, 55(2), March, 251-276
Ross Levine, 1997, Perspective, occasional paper, Investment Company Institute, 3(5), December
Seshaiah S. Venkata, 2006, Indian Capital Market Integration with Select Developed and Developing Countries,1997-2006, Applied Econometrics and International Development (AEID), 6(2), 227-248
YagneshThakkar, 1998, Tracking the Global Trends?, Capital Market, October 5–18, pp 4-7
Co-Movements of the Indian Stock Market With Select Emerging Markets

Gavesana Journal of Management / Vol. 5. Issue 1. January 2013 - June 2013. 47
Moral Appeals for Brand Positioning – Issues and PerspectivesA.Ramesh *
Abstract
Brands have upped their ante, as new breed of brands and advertisements are exhorting, educating andengaging the consumer though moral appeals and user imagery addressing various issues as part of corporatesocial responsibility. The consumer perspectives and the impact of the programme are important. The researchpaper attempts to explore underlying dimensions of communication of select brands using moral appeals byfactor analysis and also develops a conceptual model for the same. There is a paradigm shift from what you areand what you buy, to what you do. Charity should begin at home, the fundamental question of being goodcorporate citizen arises, and consumer’s perception of the social responsible advertisements and perceptiontowards advertisements is to be examined. The social issues raised and solution shown, linkages with usage andusage imagery as part of the communication have to be examined we observe that fit between brand and socialissue and feasible solution are important to influence the consumer.
Key Words: Moral appeal, Corporate Social responsibility, Social issues
Introduction
“It is not always the same thing to be a good man and a good citizen.”
-Aristotle
Organizations spend enormously for brand differentiation and brand preference; it is imperative for them tospend on the social responsibility. Brands have enormous cultural and financial clout, and the growing importanceof the triple bottom line, offer lot of opportunity for social responsibility at corporate and brand level. CorporateSocial Responsibility (CSR) is discharged through exclusive responsibility programmes taken by the companyand cause related marketing. CSR can discharge at brand and corporate level. Typically CSR programmes arefrom the organization using their own resources. The social responsibility may involve consumer’s participation.However some brands are using advertisements using moral appeals and usage imagery to indicate socialresponsibility and also in subtle manner highlighting the key features of the brand. To talk about good things, orbefore preaching values, charity should begin at home. Therefore, the fundamental question of being goodcorporate or brand citizen arises, and whether consumers are aware of company CSR, given the premise thatcompany has performed CSR activities. Consumers although may perceive it as a social responsibleadvertisements but has persuasive brand communication in it’s there a degree of deceptively in advertisements.Hence, it is important to measurement consumer perception of CSR communication delivered using brands.Moral appeals influence brand personality, and are similar to citizenship branding.
Morsing and Schultz (2006) argued that managers need to move from ‘informing’ and ‘responding’ to‘involving’ stakeholders in CSR communication itself. They conclude that managers need to expand the role ofstakeholders in CSR communication processes if they want to improve their efforts to build legitimacy, a positivereputation and lasting stakeholder relationships. Levy (1959) captured the essence of symbolism when he suggestedthat “people buy things not only for what they can do, but also for what they mean” (p. 118). The concept ofbrands as social signals is now well accepted with congruity between brand and user self-image regarded as akey motivational factor in consumer choice (Belk, 1983; Sirgy, 1982). Lannon and Cooper (1983) suggested that:Brands are used as a sort of language. Brands tell you a great deal about who you are, where you are in life,what you are and where you are going. Brand choices are as much a part of ourselves as the way we speak, the
* Sr assistant professor, Vignana Jyothi Institute of Management, Bachupally, Hyderabad. Email: [email protected].

48. Gavesana Journal of Management / Vol. 5. Issue 1. January 2013 - June 2013
words we use, our dialect, dress, gestures and language. Brands are part of ourselves and we are part of ourbrands. Durgee (1988) suggested somewhat simplistically, “advertising has two purposes: to excite and to inform”(p. 21). Johar and Sirgy (1991) distinguished between advertising based on value expressive (image) or symbolicappeals and utilitarian (functional) appeals. The image strategy involves building a “personality” for the productor creating an image of the product user. The utilitarian appeal involves informing consumers of the productbenefits that are perceived to be highly functional and important to the consumer. Based on this classificationthey suggest that there are two different routes to persuasion: self-congruity and functional congruity. “The self-congruity route to persuasion can be viewed as a psychological process in which the audience focusses onsource cues and matches these cues to their self-concept...The greater the match of the source cues, thegreater the probability of persuasion, and vice versa. Functional congruity, on the other hand, is defined as amatch between the beliefs of product utilitarian attributes (performance-related) and the audience’s referentattributes” (p. 26). They further suggest that “a self-congruity route to persuasion can be viewed as a form ofperipheral processing, whereas the functional congruity route is likely to be a form of central processing.”
Raphael Bemporad opines (co-founder of Bemporad Baranowski Marketing Group (BBMG), a NewYork-based marketing agency dedicated to helping socially responsible businesses and organizations that harnessthe laws of branding to stand out, build relationships, and inspire action) that citizenship has manifold meanings.From a branding perspective, the only way to bring the unique promise of citizenship to life is by closing theauthenticity gap between our aspirations and our actions. Beyond a series of attributes or actions, citizenshipspeaks to soul. It’s a way of being in the world. Issac et.,al (2009) examined the theories of citizenship and roleof leadership and possibility of ethical society. Theories of citizenship involved in two directions personal andsocial perspectives. Research into commercial organisations (Collins, 2001; Collins and Porras, 2005; Jensen,2002; Kakabadse and Kakabadse, 2007) indicated that lack of ethics carries dire economic consequences andmight eventually lead to the disintegration of the organisation. In addition, behaving unethically might seriouslydamage the psychological integrity of the practitioner ranging from moral deterioration, emotional paralysis anddisengagement (Diamond and Allcorn, 1984) to other psychopathological phenomena such as neuroses, depressionand schizophrenia (Frankl, 1986).
Ethical issue is not exclusively the problem of citizenship theories; we can find it elsewhere, such asleadership (Mostovicz et al., 2009b), organisation (Ashforth et al., 2008) and marketing (Gummesson, 1996).Copper and Gulick (1984) observed that the wide view moved beyond the legal definition and saw the citizengetting involved in building the social fabric and sustaining community through voluntary organizations andcommunity involvement. The long-term view is theoretical only and is advocated by some scholars who definethe ultimate goal of citizenship theory to be sustainability (Porter and Kramer, 2006; Schaefer, 2004) or meetingthe current needs of the society without compromising the needs of generations to come. Based on ethicalconsiderations, it holds that a citizen’s responsibility should be past, present and future-oriented (Weiss, 2005).Jhon Potter (2002) summarizes the purpose and education of citizenship in schools and its implication forgovernment, education sector and schools. Crick report (1998) reinterprets Marshall’s definition and describescitizenship education comprising three things, related and mutually dependent i.e., social and moral responsibility,community involvement, and political literacy. Sana-ur-Rehman Sheikh and Rian Beise-Zee (2011) comparedthe effect of CSR And CRM on Consumer attitude. They also observed, however, that while CRM might bemore cost efficient, its positive effect is limited to customers with high cause affinity. In contrast, CRM has anegative effect on customers with low cause affinity, or who oppose the cause. A major finding is that CRM cancompensate for negative CSR to a high degree in the cause affinity segment of the market. Therefore, a highdegree of cause specificity of CSR might only be preferable if the market is characterized by broad causeaffinity, or if a firm is facing negative public sentiment caused, for instance, by a product harm crisis. MichaelJay Polonsky and Colin Jevons (2006) observed that it is essential to understand CSR issue complexity and to
Moral Appeals for Brand Positioning – Issues and Perspectives

Gavesana Journal of Management / Vol. 5. Issue 1. January 2013 - June 2013. 49
consider carefully CSR-linked brand positioning. Basically, the implementation of CSR activities requires somethingsubstantial and communicable in the first place.
Deception in advertising has always sustained criticism. An ad or ad campaign is considered deceptivewhen it leaves consumers with other than reasonable knowledge (required to make an informed purchasingdecision) about the product in question (Carson et al., 1985). It tends to mislead the viewer by providing incorrector insufficient information, with the deliberate initiative to result in a sale. Advertisers increasingly try to immersetheir commercial messages in other forms of communication, thus obfuscating the distinction betweencommunication whose primary function is information, and communication whose primary objective is persuasion(Jeurissen and Veen, 2006). Immersive advertising is many a time deceptive as it misleads consumers intothinking that advertising material presented to them as content is indeed information, because the characteristicsit displays correspond with what a reasonable person expects from content, but not necessarily from advertising(Spence and Heekeren, 2005).
Objectives
1. To study the use of moral appeals in advertisements of select brands and map brand appeals with respectto two dimensions of usage and involvement.
2. To develop a model for measuring impact of moral appeal based brand advertisement.
3. To empirically study the IDEA campaign and discuss managerial implications.
Brands and the moral appeals
The following brands used moral appeals in their advertisements
XXX Detergent brand
XXX Detergent popular detergent brand in Andhra Pradesh is manufactured by Bharati soaps. Brandcommunication conveys that “while you focus on humanity and our soap focuses on the stains”. It shows in oneof the advertisements, a person lies on the road and is bleeding, nobody comes forward to help and take him tohospital and finally a young man arrives and takes him to hospital. The voice over says “you focus on humanityand we (our soap) focuses on stains, XXX detergent a soap with values”. The brand and its communicationexhort to discharge our duty.
Nokia C2-OO
Television commercial – one student gets a message in his mobile Nokia C2-00, that question paper isleaked. His friend is very happy and gives him the paper. However, he dislikes the idea of using leaked questiona paper and admits we lose self respect and sends it to press. The exam is cancelled and both friends feel happy.The TVC depicts features of 3G application for the benefit of society.
Mahindra Duro Gearless power scooters
The friends driving on Mahindra Duro find somebody dropping the water bottle from the car and leaving.However the duro drivers chase them and drop the bottle in his car. The brand subtly depicts the power, grip andbreak functioning of the vehicle...
Saffola advertisement – The advertisement shows thief runs away from the couple, husband runs for a whileand gives up. He could not run, later they decide to switch to saffola gold edible oil.
Tata Tea jaago re campaign
Tata Tea, India’s largest tea company by volume, today has joined hands with Janaagraha, a Bangalorebased not-for-profit organisation that has been doing pioneering work in the areas of urban advocacy and
Moral Appeals for Brand Positioning – Issues and Perspectives

50. Gavesana Journal of Management / Vol. 5. Issue 1. January 2013 - June 2013
governance. The Jaago Re! One billion votes campaign which was initiated (with Janaagraha Bangalore basedNGO) to create a platform that will motivate the vast numbers of Indian youth to participate actively in theelectoral process of the country. From challenging the qualifications of a politician to run the country, the campaignnow seeks to empower the youth to influence polity by exercising their right to vote. For the first time in India,www.jaagore.com will host an online voter registration engine to allow citizens across the country to fill theirvoter registration forms in 5 minutes and also get driving directions to submit this form in their city. Hence, theJaago Re One! Billion Votes campaign is not only a call to action but a platform which provides any potentialvoter all the information and facilitation he or she needs to become part of the electoral process. While thiscampaign caters to the entire nation, certain services of the website will initially be available for those residing inthe top 35 Indian cities and towns (7 Metros and 28 Class 1 towns), which account for 30% of the urbanpopulation. Going forward these services will be made available across the country in a phased manner. Thecampaign seeks to partner with other corporates, media groups, academic institutions and civil society organizationsto make this India’s largest ever effort on voter registration. The initiative will be strongly supported by onground activities in the form of institutional outreach, which will span more than 11 key cities and will serve todirectly communicate with the target audience in college campuses as well as corporates. NGOs such as LokSatta Aandolan and PRIA are partnering for outreach of this campaign.
IDEA Cellular
Idea Cellular initiated the following campaigns
1. Walk and talk campaign
2. Education for all
3. Governance
4. Save paper campaign
IDEA Cellular, the leading GSM service provider, has launched a new campaign Walk & Talk, to bringforward people across different walks of life, age-groups and societies and get them to walk for fitness. IDEAplans to initiate a countrywide movement on Walking & Talking, and expects that ‘Ek Idea pe chal padegaIndia’. In its new commercial Abhishek Bachchan is playing a Doctor this time, who quotes how people can getfit by simply Walking while Talking and provoke this idea to the general public. According to IDEA cellular, TheIdea brand campaigns have always celebrated Champion Ideas which have the power to change the society andthe way we live. This time, the Champion Idea is around ‘Walking & Talking’ for staying fit. The precedingcampaigns around ‘Participative Governance’; ‘Education for All’; ‘Championing a world in which no onesuffers from the disability to communicate’; and ‘Championing a world without Caste’ have been huge hitsamongst the audiences. One advertisement communicates “use of mobile to save paper, with the tagline ‘Whatan Idea, Sirji!. The campaigns – ‘Championing a world without caste’; ‘Championing a world in which no onesuffers from the disability to communicate’; ‘Education for All’ , ‘Participative Governance’, ‘Walk WhenYou Talk’, and the recent ‘Use Mobile, Save Paper’ campaign – all abide by the essential brand promise ofproviding a simple, fresh and imaginative solution to a complex problem of the society.
IDEA’s ad campaigns based on the theme of ‘Democracy’; ‘Championing a world without caste’;‘Championing a world in which no one suffers from the disability to communicate’; and ‘Education for All’, havebeen a huge success amongst all categories of audience. In all these campaigns, the Brand Ambassador hasplayed a protagonist who connects with both the masses, and the classes. Be it the ‘close aide’ of the politicalleader in our Democracy campaign; or the ‘Sarpanch’ trying to get rid of caste wars; or the ‘Tourist Guide’ witha foreigner at Taj; or even the ‘Priest’ who has the vision of Educating One and All—each time the characterhas sprung up with an innovative ‘Idea’ which provides a simple yet effective solution to a problem, by using themobile phone. The testimony of the success of the campaign is reflected from the rapid growth of IDEA’s
Moral Appeals for Brand Positioning – Issues and Perspectives

Gavesana Journal of Management / Vol. 5. Issue 1. January 2013 - June 2013. 51
subscriber base in the country. The Aditya Birla Group Company has grown to become the 3rd largest privateGSM operator with over 43 million subscribers across 16 service areas, nationally. See Table1 for brandadvertisments and moral appeals.
Table 1: Brand Advertisements and moral appeals
Company/brand Social issue Company CSR Advertisement/message content
Idea Education for all, casteless High Usage imagery using moral appeal
society, governance, save
paper, family planning
XXX detergent Human values low Usage imagery using moral appeal
Tata jagoore Franchising education high User imagery and moral appeal
Mahindra Duro Civic responsibility high Usage imagery and moral appeal
Nokia c2-00 Leakage of question papers high Usage and user imagery and moral
appeal
Saffola Health high Usage and user imagery and social
issue
Mapping the brand responsibility : Mapping can be done by considering the three dimensions, brand purchaseand usage and degree of consumer involvement. The brands (XXX detergent, IDEA service, Nokia C2-00,Mentos and Saffola) in their communication explicitly show, role of the brand in discharging social responsibility.Tata Jagore involves consumers but their message is not linked to purchase. See Figure 1
HIG
H
Lin
ked
to B
rand
pur
chas
e &
usa
ge XXXDetergentIDEA,
Nokia C2-00
MAHINDRA
Tata Jaagoore
low Degree of consumer involvement high
Figure 1: Brand purchase and consumer involvement for social change
Model development : Model is developed by considering dependent, independent, moderating and mediatingvariables. Variables considered are derived from literature review and discussion with consumers and experts.See Figure 2 for model development
Moral Appeals for Brand Positioning – Issues and Perspectives

52. Gavesana Journal of Management / Vol. 5. Issue 1. January 2013 - June 2013
Independentvariable
Brandadvertisement
Dependentvariables
Attitudetowards thebrand
Moderating variables
Like the moral appeals in theadvertisement
Sensitizes him/her to the issue
Social issue raised is important
Social Issue can be solved
He/she is part of the solution
Solution is believable and feasible
Company is known for CSR activities
Brand delivers good quality orperformance
Advertisement helps in choosing thebrand/purchase decision making
There is fit o between social issueraised and brand core values
Message
(Mediating variables)
Linked to brand purchase orbrand usage /features
Linked to socialresponsibility -informative,persuasive messages
Brand and social orientedmessage
Brand information
Social message
Brand and social message
Figure 2: Model for brand Advertisement and social Responsibility. Model 1
Empirical study of Idea cellular
IDEA’s ad campaigns based on the theme of ‘Democracy’; ‘Championing a world without caste’;‘Championing a world in which no one suffers from the disability to communicate’; and ‘Education for All’, havebeen a huge success amongst all categories of audience. In all these campaigns, the Brand Ambassador hasplayed a protagonist who connects with both the masses, and the classes. Be it the ‘close aide’ of the politicalleader in our Democracy campaign; or the ‘Sarpanch’ trying to get rid of caste wars; or the ‘Tourist Guide’ witha foreigner at Taj; or even the ‘Priest’ who has the vision of Educating One and All—each time the characterhas sprung up with an innovative ‘Idea’ which provides a simple yet effective solution to a problem, by using themobile phone. Idea cellular uniquely adopted CSR strategy for brand building, it uses usage imagery and moral
Moral Appeals for Brand Positioning – Issues and Perspectives

Gavesana Journal of Management / Vol. 5. Issue 1. January 2013 - June 2013. 53
appeals consistently. It portrays simple solutions to complex problems. But the solutions are ideal and difficult toapply though not impossible. The messages use moral appeals but not directly convey the benefits of the brand.The recent advertisements of 3G go overboard as it links 3g services with family planning. All the campaigns arehugely successful in increasing the customer base of the brand. Some of the advertisements may look deceptivewhich need to be tested.
The campaigns launched by IDEA include:
1. Walk and talk campaign
2. Education for all
3. Governance
4. Save paper campaign delete the matter in brackets. This was already mentioned in the first paragraph ofthe section “IDEA Cellular” above.
After showing advertisements the questionnaire is administered to college students (120) who are pursuingPGDM programme in Hyderabad.
Variables and data analysis .
Eleven variables are selected which convey consumer perception on the advertisements of IDEA. Afterdata collection, descriptive statistics and factor analysis are used for analysis.
The data analysis are given in Appendices 1 and 2.
(The matter below in red is shifted from Appendix 2 and redrafted.)
The KMO measure of sampling adequacy is 0.686 which is more than 0.5 indicating that factor analysis isappropriate. Four factors have been extracted from the data as mentioned below.
Factor 1 is a combination of four variables viz., (1) I am sensitized to social issue; (2) I think the issue canbe solved; (3) I am motivated to contribute to the cause; and (4) advertisement gives direct opportunity forconsumers to discharge social responsibility. This factor can be named as Impact on the individual withrespect to social issue.
Factor 2 is combination of three variables viz., (1) I think solution shown to the problem is feasible andbelievable; advertisement shown helps to take purchase decision; (2) I find the advertisement inform aboutbrand features; and (3) I like the celebrity endorser shown in the advertisement. This factor can be named aspersuasive ability and social problem solving ability of advertisement.
Factor 3 combines three variables viz., (1) Brand delivers quality; (2) there is a relationship between socialissue raised and brand; and (3) I am aware of the company CSR. This factor can be named as Brand qualityand brand fit with social issue and company CSR.
Factor 4 covers two variables viz., (1) I like the moral appeals used in advertisements; and (2) I find thesocial issue is relevant. This factor can be named as relevance of social issue and moral appeal used inadvertisement. The scree plot shows the number of factors extracted. i.e. four after which the slope of theplot becomes flat.
Conclusion and Managerial Implications
Brands use moral appeal in advertisments as a means to sensitize the target audience to the relevantsocial issues accompanied with the brand and usage imagery. How ever, the degree of influence depends onseveral medating varibles such as social issue relelvance,brand fit etc.The empirical study of IDEA campaign isdone to examine the perception. The four factors emerged from exploratory factor analysis 1. Impact of social
Moral Appeals for Brand Positioning – Issues and Perspectives

54. Gavesana Journal of Management / Vol. 5. Issue 1. January 2013 - June 2013
issue on the individual 2. Persuasive and social problem solving ability of the advertisement and celebrity endorser3. Brand quality and brand fit with social issue and company CSR 4. Relevance of social issue & moral appealused in advertisement. Descriptive statistics indicate that advertisements of (IDEA) scored low on brand featuresand practical solution to the problem. The positive aspect is advertisments are able to sensitize the targetaudience to the relevant social issue and exhort them to play their role in the society. Surprisingly, though theperception is that advertisement did not help them to take purchase decision but the sales impact was high aftercampaign. Organizations and brand managers should consider the fit between social issue and brand, and relevanceof the social issue, and ensure that consumers are aware of the CSR. The communication should show thefeasible solution to the problem; otherwise it may be perceived seen as puffery.
References:
Ashforth, B.E., Gioia, D.A., Robinson, S.L. and Trevino, L.K. (2008), “Re-viewing organizational corruption”,Academy of Management Review, Vol. 33 No. 3, pp. 670-84.
Belk, R.W. (1983), “Explanations for congruence between patron stereotypes and patronselfconcepts”,Proceedings of the American Psychological Association Conference, American PsychologicalAssociation, Los Angeles, CA.
Crick.B (1998) Citizenship And Teaching Of Democracy In Schools ,Dfee London Weiss, J.W. BusinessEthics: Stakeholder and Issues Management Approach, 4th ed., SouthWestern College, Chulla Vista, CA(2005).
Cooper, T.L. and Gulick, L. (1984), “Citizenship and professionalism in public administration/response”, PublicAdministration Review, Vol. 44, pp. 143-9.
Collins, J. (2001), Good to Great: Why Some Companies Make the Leap . . . and Others Don’t, HarperCollins,New York, NY.
Collins, J. and Porras, J.I. (2005), Built to Last: Successful Habits of Visionary Companies, Random HouseBusiness Books, New York, NY.
Carson, T. L., Wokutch, R. E., & Cox Jr., J. E. (1985). An Ethical Analysis of Deception in Advertising. Journalof Business Ethics, 4(2), 93-104.
Diamond, M.A. and Allcorn, S. (1984), “Psychological barriers to personal responsibility”,OrganizationalDynamics, Vol. 12 No. 4, pp. 66-77.
Durgee, J.F. (1988), “Understanding brand personality”, Journal of Consumer Marketing, Vol. 5 No. 3, pp.21-5.
Frankl, V.E. (1986), The Doctor and the Soul, Vintage Books, New York, NY.
Gummesson, E. (1996), “Relationship marketing the Emperor’s new clothes or a paradigm shift?”, ResearchMethodologies for the New Marketing, ESOMAR Publication Series, ESOMAR, Amsterdam, pp. 3-19.
Issac Mostovicz , Nada K. Kakabadse and Andrew Kakabadse(2009) “Is an ethical society possible” ,Societyand Business Review Vol. 4 No. 3, 2009 pp. 246-264
Jhon poter (2002) “The challenge of education for active cititizenship”,Education +training,”vol44,No2,57-66
Johar, J.S. and Sirgy, M. J. (1991), “Value-expressive versus utilitarian advertising appeals: when and why to usewhich appeal”, Journal of Advertising, Vol. 20 No. 3, pp. 23-33.
Kakabadse, A.P. and Kakabadse, N. (2007), Leading the Board, Palgrave, London.
Levy, S. (1959), “Symbols for sale”, Harvard Business Review, Vol. 37, July/August, pp. 117-24.
Moral Appeals for Brand Positioning – Issues and Perspectives

Gavesana Journal of Management / Vol. 5. Issue 1. January 2013 - June 2013. 55
Mostovicz, E.I. (2008), “Understanding of consumers’ needs for luxury: the mechanism of interpretation and itsrole in knowledge creation”, unpublished PhD thesis, University of Northampton, Northampton
Mette Morsing and Majken Schultz (2006) “Corporate social responsibility communication: stakeholder information,response and involvement strategies” Business Ethics: A European Review Volume 15, Issue 4, pages 323–338
Michael Jay Polonsky and Colin Jevons (2006) “Understanding issue complexity when building a sociallyresponsible brand” European Business Review” Vol. 18 No. 5, 2006 pp. 340-349
Porter, M.E. and Kramer, M.R. (2006), “Strategy and society: the link between competitive advantage andcorporate social responsibility”, Harvard Business Review, Vol. 84 No. 12, pp. 78-92.
Schaefer, A. (2004), “Corporate sustainability – integrating environmental and social concerns?” CorporateSocial Responsibility & Environmental Management, Vol. 11 No. 4, pp. 179-87.
Sana-ur-Rehman Sheikh and Rian Beise-Zee (2011) “Corporate social responsibility or cause-related Marketing?The role of cause specificity of CSR” Journal of Consumer Marketing Vol 28 No 1 (2011) 27–39
Spence, E. & Heekeren, B. v. (2005). Advertising Ethics. 1. ed. Upper Saddle River: Pearson Prentice Hall.
Sirgy, J.M. (1982), “Self-concept in consumer behavior: a critical review”, Journal of Consumer Research,Vol. 9, pp. 287-300.
http://telecomtalk.info/ideas-abhishek-bachchan-campaign/3382/ visited on 18/7/11
http://telecomtalk.info/idea-cellulars-new-idea-walk-when-you-talk/6016/ visited on 18/7/11
http://creativebits.org/opinion/socially_responsible_advertising visited on 18/7/11
http://www.tata.com/media/releases/inside.aspx?artid=oJbaL9LmLPs visited on 18/7/11
mtalk.info/idea-cellular-launches-new-campaign-break-the-language-barrier/38635/visited on 18/7/11
Appendix 1
Descriptive Statistics for the variables (measured on likert scale among 120 respondents)
V1 v2 v3 v4 v5 v6 v7 v8
4.183333 3.591667 3.191667 3.608333 3.208333 2.975 3.933333 3.575 Mean
0.88 0.90 0.97 0.98 1.11 1.14 0.91 0.96 SD
4 4 3 4 3 3 4 4 Median
0.68169 0.876854 -0.36938 0.158742 -0.72887 -0.85643 0.496739 -0.00559 Kurtosis
V9 v10 v11
3.55 3.3 2.866667 Mean
1.02 1.01 1.11 SD
4 3 3 Median
-0.23197 -0.55211 -0.95523 Kurtosis
Appendix 2: Factor Analysis -Kmo And Bartlett’s Test
Kaiser-Meyer-Olkin Measure of Sampling Adequacy. .686
Bartlett’s Test of Sphericity Approx. Chi-Square 304.638
df 78
Sig. .000
Moral Appeals for Brand Positioning – Issues and Perspectives

56. Gavesana Journal of Management / Vol. 5. Issue 1. January 2013 - June 2013
Appendix 3 : CommunalitiesInitial Extraction
Moral appeal 1.000 .681
Aware of CSR 1.000 .496
Informs about brand features 1.000 .517
Sensitized to social issue 1.000 .537
Issue can be solved 1.000 .638
Problems feasible, believable 1.000 .649
Social issue is relevant 1.000 .625
Motivated to contribute to the cause 1.000 .591
Brand delivers quality 1.000 .562
Relationship between social issue and brand 1.000 .663
Advertisementshowntotakepurchasedecision 0 .565
Opportunity todischargesocialresponsibility 1.000 .420
Likethecelebrityendorsershowninadvertisement 1.000 .483
Extraction Method: Principal Component Analysis.
Appendix 4: Total Variance Explained
Component Initial Eigenvalues Extraction Sums of Rotation Sums of
Squared Loadings Squared Loadings
Total % of Cumulative Total % of Cumulative Total % of Cumulative
Variance % Variance % Variance %
1 3.358 25.827 25.827 3.358 25.827 25.827 2.208 16.986 16.986
2 1.613 12.409 38.236 1.613 12.409 38.236 2.042 15.705 32.691
3 1.426 10.970 49.206 1.426 10.970 49.206 1.603 12.328 45.019
4 1.030 7.924 57.131 1.030 7.924 57.131 1.575 12.112 57.131
5 .956 7.354 64.485
6 .900 6.922 71.407
7 .760 5.847 77.255
8 .690 5.307 82.561
9 .600 4.617 87.178
10 .511 3.934 91.112
11 .451 3.470 94.582
12 .392 3.015 97.597
13 .312 2.403 100.000
Extraction Method: Principal Component Analysis.
Moral Appeals for Brand Positioning – Issues and Perspectives
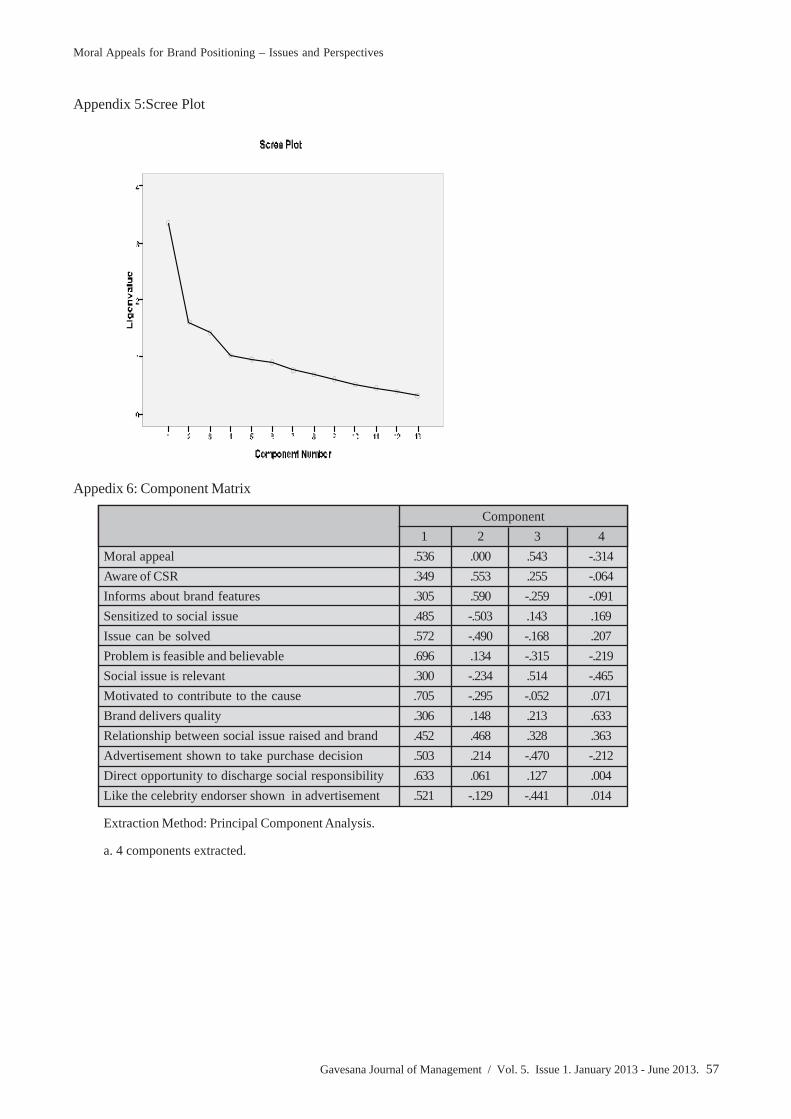
Gavesana Journal of Management / Vol. 5. Issue 1. January 2013 - June 2013. 57
Appedix 6: Component Matrix
Component
1 2 3 4
Moral appeal .536 .000 .543 -.314
Aware of CSR .349 .553 .255 -.064
Informs about brand features .305 .590 -.259 -.091
Sensitized to social issue .485 -.503 .143 .169
Issue can be solved .572 -.490 -.168 .207
Problem is feasible and believable .696 .134 -.315 -.219
Social issue is relevant .300 -.234 .514 -.465
Motivated to contribute to the cause .705 -.295 -.052 .071
Brand delivers quality .306 .148 .213 .633
Relationship between social issue raised and brand .452 .468 .328 .363
Advertisement shown to take purchase decision .503 .214 -.470 -.212
Direct opportunity to discharge social responsibility .633 .061 .127 .004
Like the celebrity endorser shown in advertisement .521 -.129 -.441 .014
Extraction Method: Principal Component Analysis.
a. 4 components extracted.
Moral Appeals for Brand Positioning – Issues and Perspectives
Appendix 5:Scree Plot

58. Gavesana Journal of Management / Vol. 5. Issue 1. January 2013 - June 2013
Appendix 7: Rotated Component Matrixa
Component
1 2 3 4
Moral appeal .153 .093 .226 .773
Aware of CSR -.232 .320 .494 .309
Informs about brand features -.223 .626 .272 -.045
Sensitized to social issue .688 -.095 .077 .221
Issue can be solved .788 .132 .015 .018
Problem is feasible and believable .306 .719 .071 .182
Social issue is relelvant .129 -.077 -.097 .770
Motivated to contribute to the cause .672 .274 .132 .219
Brand delivers quality .259 -.106 .682 -.134
Relationship between social issue raised and brand .020 .148 .787 .144
Advertisement shown to take purchase decision .155 .735 -.018 -.009
Direct opportunity to discharge social responsibility .330 .311 .327 .327
Like the celebrity endorsers inadvertisement .477 .494 -.042 -.096
Extraction Method: Principal Component Analysis. Rotation Method: Varimax with Kaiser Normalization.
a. Rotation converged in 8 iterations.
Moral Appeals for Brand Positioning – Issues and Perspectives

Gavesana Journal of Management / Vol. 5. Issue 1. January 2013 - June 2013. 59
Income Status of Migrant Labours at Alang Ship Breaking YardDr. Hrudanand Misra *
Abstract
The process of migration is as old as human history. In the process of migration economic factors dominatethe decision to migrate. The decision to migrate is also influenced by the difference in income at the place oforigin and place of destination. Individuals belonging to lower income have a greater propensity to migrate thanothers. Alang ship breaking yard employs 90 percent of migrant labours and they are largely from backwardstates of U.P, Bihar, Orissa and Jharkhand. Only a small fraction around 5-10 percent originates from Gujaratstate. In the study of migration income plays important role, which decide the decision to migrate. The income ofthe labour determined by varies factors such as skill level, experience, age, education etc. The aim of the presentpaper is focus on the determinants of income of the migrants employed at Alang ship breaking yard. The resultsshow that workers present income is three or four time higher than previous income shown by pair t-test. Theregression result also shows that skill level and experience of the migrants are important determinants in presentincome.
Key Words: Income, Migrant Labour, Ship Breaking
Introduction
The process of breaking ships for the extraction of steel scrap for supply to the steel rolling mills has led tothe beginning of an industrial activity. Ship breaking is the process of dismantling an obsolete vessel’s structurefor scrap. The process includes wide range of activities from removing all gear and equipment to cutting downas well as recycling the ship’s structure.
On average a ship has an active life span of 25 to 30 years. After it fails to meet the safety requirement, itis sent for breaking. The ship is sold through international broker or via cash buyers. Until 1960’s, ship breakingactivities was highly mechanized and concentrated in industrialized countries like United States, the UnitedKingdom, Germany and Italy. The United Kingdom accounted for 45 percent of ship breaking industry. During1960’s and 1970’s ship breaking activities shifted to semi-industrialized countries, such as Spain, Turkey andTaiwan mainly because of availability of cheaper labour and also the existence of re-rolling mills in these countries.About 79 countries were involved in ship breaking activity. Asian yards come into existence during 1980’s.Despite their late establishment, at present this region account for over 95 percent of the industry. Alang shipbreaking yard of India has become eminent industry holding first position in Asia and also in world market.Bangladesh holds second position after India.
At present, India has large share in ship breaking industry (OCED, 2001) and most of the activity isconcentrated in Alang and Sosiya, the two villages situated in the coast of Arabian Sea in the district of Bhavnagarin Gujarat.
Alang is a small coastal village as the district of Bhavnagar in Gujarat, dominated by a small population offishermen and farmers. Presently, it has turned out to be one of the largest ship breaking yard not only in Indiabut in the world. The yard stretches over 15 Km and actually covers two yards (Alang and Sosiya). The Alangship breaking yards have the capacity to break VLCCs* and ULCCs** vessels, a facility not available to anyother ship breaking countries in the world. Furthermore, unlike other countries where the ship breaking activitiesis capital intensive in India it is labour intensive. Being a labour surplus country labour is available in plenty andthat too at competitive rate. Alang ship breaking yard provides large number of employment opportunities tonumber of skilled and unskilled labours. Moreover, there are many other activities and industries which aredirectly and indirectly dependent on Alang ship breaking yard, and the number of such workers directly andindirectly employed is estimated to be in between 1.5 to 1.6 lakhs (International Federation of Human Rights,
I/c Director & Associate Professor, K.P Patel School Management & Computer Science, Gujarat

60. Gavesana Journal of Management / Vol. 5. Issue 1. January 2013 - June 2013
2000: 56). This also includes the downstream industries generated by the ship breaking industry such as re-rolling mills, foundries, oxygen plants, local scrap store, transportation companies and other small local businessmenand upstream activity such as brokers, service sectors etc. A survey conducted by the International Federationof Human Rights (FIDH) found that 100 re-rolling mills are functioning in the area and each generally employsbetween 80-120 and thus employing about 8,000-10,000 workers.
It is found that a large proportion of labours employed at Alang ship breaking yard are migrants fromdifferent states. They are largely from backward states of Uttar Pradesh, Bihar, Orissa and Jharkhand. Only asmall proportion of workers are from Gujarat state i.e. 5-10 percent. Large proposition of the workers areoriginate from the backward or most backward districts of these states. Out of 18 districts from which respondentsoriginate 4 are developed, 3 are industrially backward, 8 are backward and 3 are most backward as classified byplanning commission. The next section focus on the various factors affects the income of the migrants employedat Alang.
Payments and Wages
Various occupations are covered by the Central Government and the State Government for theimplementation of Minimum wages Act. For the payment of Minimum wages, labours are divided into threecategories as per their skill however all labours are covered under skilled or unskilled category. The minimumwages paid to the labour constitutes the basic wage and special allowance. The special allowances is linked withthe cost of living index and revised twice in a year. Hence, minimum wages of labours are revised at an intervalof every six months. But the wages of the labours are fixed either on the basis of time or piece rate. Accordingto contractors that piece rate is not revised with the revision of the special allowance of minimum wages at theinterval of six months. It is found that in many industries that contractors do not pay wages according to theprovision of Minimum Wages Act. Contractors seem to recognize only the basic wage component of minimumwages.
There are various studies conducted by researchers on the payments and wages to the labour in Indianindustries. The researchers cover wide range of industries viz, Carpet weaving, Glassware, Beedi industry,Construction, Brassware wherein labour face exploitative conditions. These industries also cover length andbreadth of India. Various studies on construction industry analysed the Minimum Wages legislation. The analysisof the Minimum Wages with respect to employment in the construction or building operation is on the basis of therecommendation of Labour Commissioner The average wage rate prevailing in construction industry in mostcases far below the Minimum Wages fixed under the Act (Subrahmanian, Veena and Parikh 1982: 137-141). InAlang ship breaking yard wage rates especially for unskilled workers are found to be below the Minimum wagesas mentioned in the Minimum Wages Act. According to data available on minimum wages by Gujarat Government,the minimum wage fixed in April 2002 for skilled workers at Rs.89 and for unskilled workers at Rs.79 per day.The results of the survey suggest that wages at Alang ship breaking yard are higher than those earned byworkers at their native place, but labours are receiving wages less than the prescribed minimum wages. Infact,section 13 of the Inter-State Migrant Workmen Act, 1979 provides that the wage rates of the inter-state migrantworkmen should be same as those applicable to such other workmen and also the inter-state migrant workmenshould not be paid less than the wages fixed under the Minimum Wages Act.
At Alang ship breaking yard many workers do not know even their wage rate because they never askedthe muqadams or labour contractors due to fear of being fired from the job. Some workers reported to theresearcher that they would not know their exact wage rate until they get the money in their hand. This practiceviolates the article 7 of the Payment of Wages Act, 1936 which states that there are no deductions from thewage except in very precise circumstances. Thus, such practices are contrary to article 21 of the ContractLabour Act which states that in case the contractor fails to make payment of wages within the prescribed time
Income Status of Migrant Labours at Alang Ship Breaking Yard

Gavesana Journal of Management / Vol. 5. Issue 1. January 2013 - June 2013. 61
period or make short payment then the principal employer is responsible to make payment of wages in full or theunpaid balance.
In Alang ship breaking yard wages of the workers are paid on the basis of a daily rate but paid monthly.Each and every worker is handed with an attendance card at the start of the each month. Everyday Workershave to get the card filled with arrival and of departure details from the plot. The payment is either on the basisof task or piece rate. For instance, loaders whose work is to load and unload gas cylinders on the truck are paidbetween Rs.5 to 5.50 per cylinder. The wages ranges from Rs.60 to 70 a day for helpers and Rs.150 to 170 forexperienced gas cutters. As compared to other labours, muqadams are paid approximately Rs 300 per day andpay slip is given to them but not to others.
Table 1 presents the average monthly incomes of the respondents in Alang ship breaking yard. Averagepresent income of the respondents is Rs. 2888.88 which is three times higher than the average previous incomeof respondents (i.e. Rs 843.00). The previous income of the respondents in the present study refers to theincome from the last occupation. In all the categories of workers wages earned are three times or higher thanthe previous income with the exception of skilled workers. Previous income of the workers is significantly lowerthan the workers present earning in Alang. To test this hypothesis the study uses paired t-test. The averagepresent income is significantly higher than previous income of the workers and is significant at 1 percent criticallevel.
Table: 1 Nature of Work and Income of the Respondent per month
Nature of Work Average Previous Income Average Present income Paired t-test
Manual 760.47 2866.51 24.487*
Semi-Skilled 730.41 2566.62 22.284*
Skilled 916.98 2853.11 23.105*
Highly Skilled 1066.18 3758.35 17.985*
t-test is significant at 1% level
Present Income: Determinants
There can be many factors determining the income of the respondents. To understand their significance anincome function would be great help. To estimate the income function regression technique is made use of.Various alternative models are fitted using both qualitative and quantitative variables. The present income of therespondents is determined by diverse factors such as skill of the individual, previous experience, age, educationof the respondents. The present exercise uses the relevant variables to estimate the income function. Though,many variables are included in the model but it is found that some variables do not explain variations in incomefunction significantly. Therefore, for the analysis of the income of the respondents bivariate and multivariateregression functions have been fitted. The following income function was considered for explaining variation inincome.
Present Income = f (Years of Experience, Previous Income, Skill, Work at Ship/Yard, Experience2)
Out of the explanatory variables skill and work at ship/yard are qualitative dummy variables and othervariables are quantitative in nature. To explain the relation three equations are fitted and the results are presentedin table 2. The models are
Present Income = f (Years of Experience, Experience2) —————————————— (1)
Present Income = f (Years of Experience, Previous Income, Skill) ——————————— (2)
Present Income= f (Years of Experience, Previous Income, Skill, Work at Ship/Yard,
Experience2) —————————————————————————— (3)
Income Status of Migrant Labours at Alang Ship Breaking Yard

62. Gavesana Journal of Management / Vol. 5. Issue 1. January 2013 - June 2013
It was found that for the sample data the income function is best explained through the variables such asyears of experience and skill. In Model-1 years of experience and years of experience square are the explanatoryvariable. This model explains 9 percent of variations in the dependent variable. To test a model for its explanatoryR2 is not a confirmation test. To test whether the independent variables explain the variations in the dependentvariables significantly, F-test is made use of. The coefficients of years of experience and years of experiencesquare have expected sign in the model. In view of the fact that there exists a tendency that the income ofrespondent increases with the increase in years of experience at a diminishing rate which is explained throughnegative sign of the years of experience square but the coefficient is not statistically significant. A study conductedby Banerjee on Delhi city found that the years of experience have significant positive but diminishing effect onearning (Banerjee, 1986: 198-199).
In Model-2, previous income, experience and skill, a dummy variable are the explanatory variables. Frommodel 1 to model 2 the result improves marginally. All the three independent variables including one dummyvariable show positive sign but two variables are statistically significant as indicated by their t-values. Years ofexperience explain variations in present income significantly and the skill of the respondent’s leads to higherincome and has a positive coefficient and is statistically significant. The model is a good fit as the F-ratio isstatistically significant at 5 level. A study done by Mehta found that earning function shows the importance ofworkers skill as income determinant (Mehta, 1990: 150-159). Therefore, it can be concluded that in the presentstudy income is significantly higher for the respondents who have more years of experience and are skilled. Inthis model previous income of the respondents is not statistically significant, which show that the income ofrespondents are lower before opting present occupation at Alang ship breaking yard.
Model 3 includes five explanatory variables and it is found that four of them have positive coefficient andexperience square has a negative coefficient but it is not statistically significant. Years of experience are themost significant explanatory variable as it is significant at 1 percent level. The skill of the respondent leads tohigher income on an average and is statistically significant at 5 percent level. The respondent’s work on shipleads to relatively higher income; however it is not significantly higher. The model explains the variation inpresent income significantly as the F-ratio is statistically significant at 5 percent level. Combining the threemodels it can be concluded that years of experience and skill level are the most important determinants ofpresent income.
Table: 2 Regression Result of Respondents Income at Alang Ship Breaking Yard DependentVariable: Present Income
Variable Model 1 Model 2 Model 3
Constant 2528.544 2432.513 2444.099
Years of Experience 41.8897(5.461)** 35.0603(4.479)** 34.7619(4.398)***
Ship/Yarda 119.3687(0.986)
Previous Income 0.03218(0.405) 0.0357(0.447)
Skillb 242.8937(2.929)* 233.798(2.792)**
Experience2 -0.2194(-0.466) -0.2914(-0.623)
N 300 300 300
R2 0.091 0.119 0.122
F-Ratio (14.917)** (13.294)** (8.206)**
* Significant at 10%** Significant at 5%*** Significant at 1%
Note: Figures in bracket are t-value
Income Status of Migrant Labours at Alang Ship Breaking Yard

Gavesana Journal of Management / Vol. 5. Issue 1. January 2013 - June 2013. 63
a Ship/Yard = 1 workers working inside ship otherwise 0 if workers working in yard.
bSkill = 1 for skilled workers otherwise 0
Conclusion
The study shows that the economic factors dominate the decision to migrate. The decision to migrate isalso influenced by the difference in income at the place of origin and place of destination. Individuals belongingto lower income have a greater propensity to migrate than others. The present study shows that the previousincome of the respondents is significantly much lower as compared to present earnings at Alang, which is shownby Pair t-test. The overall average present income of the respondents is higher (i.e. Rs. 2888.88) as comparedto their previous income (Rs. 843.00). The regression analysis shows that the skill and years of experience arethe important variables determining the income level of the migrants at Alang ship breaking yard.
The ship breaking industry after functioning for more than 20 years, workers are still getting wages lessthan prescribed minimum wages. Wage structure of the workers at Alang is very well known to employers aswell as Government, but both the players are still silent and nobody is taking initiative to improve or revised wagesystem in ship breaking industry of Alang.
References
Banerjee. B (1986). Rural to Urban Migration and Urban Labour Market: A Case Study of Delhi, NewDelhi: Himalaya Publishing House,.
International Federation of Human Rights (2000). Where do the Floating Dustbin ends up, Labour Rights inShip-breaking Yards in South Asia: The Cases of Chittagong (Bangladesh) and Alang (India), Netherlands:International Federation of Human Rights.
Mehta. M (1990). Employment, Income and the Urban Poor: A Case of Lower Strata Workers in anIndian Metropolis, New Delhi: Harman Publishing House.
Subrahmanian. K. K, Veena. D. R and Parikh. B. K (1982). Construction Labour Market: A Study inAhemdabad, New Delhi: Concept Publishing House.
Footnotes* I/C Director & Associate Professor, K.P. Patel School of Management & Computer Studies, Kapadwanj-387620, Gujarat. Email: [email protected]
* Very Large Crude Carrier: Tanker of 160,000-320,000 Dead Weight Tonnage.
**Ultra Large Crude Carrier: Tanker of 320,000 Dead Weight Tonnage.
Income Status of Migrant Labours at Alang Ship Breaking Yard

64. Gavesana Journal of Management / Vol. 5. Issue 1. January 2013 - June 2013
Finding Frequent Item Sets on Post Mining data usingNormalized Mutual Information
Jayanti Mukhopadhyay* and Prof. Rohit Kamal Chatterjee**
Abstract
Buyers’ Basket Analysis (BBA or Market Basket Analysis) is a typical example of frequent item setmining that leads to the discovery of association and correlations among items in large transactional or relationaldata sets to help retailers to develop marketing strategies by gaining insight into which items are frequentlypurchased together by customers. Association rules are considered interesting if they satisfy both a minimumsupport threshold and minimum confidence threshold, set by domain experts. Many efficient algorithms likeApriori, Partitioning, Sampling, Eclat etc. are available to generate large number of associated frequent itemsets. Additional analysis can be performed to discover interesting statistical correlations between associateditems. But the above mentioned correlation measures works in linear relationship between two variables withrandom distribution; this value alone may not be sufficient to evaluate a system where these assumptions are notvalid. Finally we propose a new measure i.e. mutual information that will show dependency between frequentitem sets of linear and parabolic datasets and generate stronger associated frequent item sets.
Key Words: Frequent Item sets, Association rules, mutual information.
Introduction
Buyers’ Basket Analysis (BBA or Market Basket Analysis) is a well known technique of data mining toanalyze customer behavior. It is based on association rule mining. The goal of BBA is to identify relationship (i.e.association rules) between groups of products, items or category taken from a large dataset (Silverstien, C.,Brin, S. & Motwani, R., 1998). It helps in increasing sales and maintain inventory by focusing on the point ofsale transaction data. Association rule mining is a two step approach i.e. first it finds all frequent item sets usingminimum support threshold and then generate strong association rules that satisfy minimum support and minimumconfidence. Frequent item set mining and association rule induction (Agrawal, R., Imielinski, T. & Swami, A.,1993) are powerful methods for Buyers’ Basket Analysis. The main problem of association rule induction is thatthere are many possible rules (McNicholas Paul, D. & Yanchang, Z., 2009). It is obvious that such a vastamount of rules cannot be processed by inspecting each one in turn. Therefore efficient algorithms are neededwhich restrict the search space and check only a subset of all rules, but, if possible, without missing importantrules. One such algorithm is the Apriori algorithm which was developed by R. Agrawal & R. Srikant (Agrawal,R. & Srikant, R., 1994) for mining frequent item sets for boolean association rules. But the problem of Apriorialgorithm is that it requires many scans to generate a large number of frequent item sets. Many other algorithms(partitioning, sampling, Eclat etc.) are present which focus on improving the efficiency of the original Apriorialgorithm. But the use of only support and confidence measures to mine associations may generate huge numbersof frequent item sets which can be uninteresting to users (Feelders, C. R. & Siebes, A., 2001). Overviews ofmeasures (subjective and objective) of interestingness are also used to find frequent item sets (Boettcher, M.,Ruß, G., Nauck, D. & Kruse, R., 2009). There are some additional analysis of post mining data that can beperformed to discover interesting statistical correlation (lift, all_confidence, Cosine etc.) between frequentlyassociated items. But all the above mentioned correlation measures works on linear data sets. In this paper we
*Dept. of BCA. The Calcutta Anglo Gujarati college, Kolkatta. Email ID: [email protected]
** Dept. of Computer Sc. & Engineering College, BIT, Mesra, Kolkata. [email protected]

Gavesana Journal of Management / Vol. 5. Issue 1. January 2013 - June 2013. 65
propose a new measure like mutual information to find frequently associated item sets not only from linear datasets but also from parabolic data sets.
Background
Buyers’ Basket Analysis (BBA) is based upon association rule mining. Let I = {I 1, I
2, … ,I
m} be a set of
Items. Let D, be a set of database transactions where each transaction T is a set of items such that T I. Anassociation rule is an implication of the form A B, where A I, B I, and A B = Ø (Han, J., Kamber, M.and Pei, J., 2011). The two measures of association rule mining is Support and confidence.
...(1)
...(2)
The concept of binary association rules represent presence of item denoted by 1 and absence of itemdenoted by 0 (Savasere, A., Omiecinski, E. & Navathe, S. B., 1998). But association rule mining often generatesa huge number of rules, and a majority of them either are redundant or do not reflect the true relationship amongdata objects (Silverstien, C., Brin, S. & Motwani, R., 1998). To overcome this difficulty, correlation has beenadopted as interesting measures. This leads to correlation rules of the form
A B [support, confidence, correlation].
There are many different correlation measures for mining large data sets:-
Lift :-The lift between the occurrence of item sets A and B can be measured by computing
...(3)
Positively correlated : lift > 1.
Negatively correlated: lift < 1.
No Correlation : lift = 1.
Chi-Square( X 2):-
...(4)
All confidence:-
...(5)
1. Cosine:-
...(6)
2. Kulczynski:-
...(7)
Finding Frequent Item Sets on Post Mining data using Normalized Mutual Information

66. Gavesana Journal of Management / Vol. 5. Issue 1. January 2013 - June 2013
3. Max-confidence:-
...(8)
(In the above formulae, A, B, X are the data item sets, P represent probability)
Each of the above six co-relation measure value range from 0 to 1 and higher the value, the closer therelationship between A and B (Han, J., Kamber, M. & Pei, J., 2011).
Problems with Subjective and Objective Measures
Objective measures rely on user’s ability to choose the right measure for a given scenario out of a huge setof available measures. Some measures produce similar rankings while others almost reverse the order. Thisposes the problem of choosing the right measure for a given scenario (Agrawal, R. & Psaila, G., 1995). Moreover,due to their rather mathematical foundations most measures lack interpretability and meaningfulness becausethe rule properties they measure rarely reflect the practical considerations of a user. For a user it is often unclearwhich measure to choose and how to link its results to his application scenario. Objective measures do notmemorize the past and they are unable to identify patterns which have already been discovered multiple times inthe past, which are diminishing or emerging (Agarwal, C. C. & Yu, P. S., 1998).
Subjective measures, on the other hand, require user’s domain knowledge. A lot of effort is necessary tocollect, organize and finally incorporate domain knowledge into a knowledge base against which associationrules will be compared. Moreover, domain experts often forget certain key aspects or may not remember otherswhich come into play under rarer circumstances. This problem can be termed ‘expert dilemma’ (Linoff S. G. &Berry, M. J., 2011). Building a knowledge base can also become a task that can never be finished. Consequently,there is a risk that patterns are regarded as interesting based on outdated knowledge while a user is being leftuninformed about the out datedness itself (Boettcher, M., et al, 2009) .
Here our propose measure i.e. using mutual information, we can get most frequent item set more accuratelythan using correlation measures.
The correlation co-efficient indicates the strength of a linear relationship between two variables withrandom distribution; this value alone may not be sufficient to evaluate a system where these assumptions are notvalid. The mutual information measures the general dependency while the correlation function measures thelinear dependency. Another major difference between mutual information and correlation function is that theformer can be applied to symbolic sequences as well as numerical sequences, but the latter can only be used onnumerical sequences. For example, we can have zero value of correlation function at some distance d, while themutual information function at that distance can be any value.
Information Theory
Information theory is a branch of computer science involving quantification of information. Informationtheory was developed by Claude E Shannon (Shannon, C. E., 1948). Information theory is based on probabilitytheory and statistics (Hartley, R. V. L., 1928). A key measure of information is entropy which is usually expressedby the average number of bits needed to store or communicate one symbol in a message. The entropy quantifiesuncertainty involved in predicting the value of a random variable (Kolmogorov, A., 1968). Since its inception ithas broadened to find applications in many other areas, including statistical inference (Cover, T. M. & Thomas,J. A., 2009). The entropy H, of a discrete random variable X is a measure of the amount of uncertainty associatedwith the value of X. If X is the set of all messages {x
1, ….., x
n} that X could be, and p(X) is the probability of
some x belongs to X, then the entropy, H, of X is defined as
...(9)
Finding Frequent Item Sets on Post Mining data using Normalized Mutual Information

Gavesana Journal of Management / Vol. 5. Issue 1. January 2013 - June 2013. 67
Here I(x) is the self information, which is the entropy contribution of an invalid message, and Ex is the
expected value. An important property of entropy is that it is maximized when all the messages in the messagespace are equiporable p(x) = 1/n, i.e. most unpredictable in which case H(X) = log n.
MUTUAL INFORMATION: Mutual information (also referred to as trans-information) is a quantitativemeasurement of how much one random variable (Y) tells us about another random variable (X). In this case,information is thought of as a reduction in the uncertainty of a variable (Latham P. E. & Roudi, Y., 2009). Thus,the more mutual information between X and Y, the less uncertainty there is in X knowing Y or Y knowing X(Fraser A. & Swinney, H., 1986).
Mutual information is most commonly measured in logarithms of base 2 (bits) but it is also found in base e(nats) and base 10 (bans).
The mathematical representation for mutual information of the random variables X and Y are as follows:
...(10)
where, p(x,y) = joint probability distribution function of X and Y.
p(x) = marginal probability distribution function of X.p(y) = marginal probability distribution function of Y.
KULLBACK-LEIBLER DIVERGENCE THEORY: Mutual information can also be expressed as aKullback-Leibler distance. The mutual information between a random variable X and Y is the Kullback-Leiblerdistance between the joint distribution P(X,Y) and the product of the marginal P(X) and P(Y):
...(11)
If X and Y are independent, so that P(X,Y) = P X) P(Y), then
...(12)
I(X;Y) = 0. That is Y tells no information at all about X (Cover, T.M. & Thomas, J. A., 2009).
Properties of Mutual Information
1. A basic property of the mutual information is that I(X;Y) = H(X) – H(X | Y). That is, knowing Y, we cansave an average of bits in encoding X compared to not knowing Y.
2. Mutual information is symmetric (i.e. I(X;Y) = I(Y;X)).
3. Mutual information I (X;Y) can never be negative(i.e. I(X;Y) > 0;). [ D(P || Q) >=0 ]
From the above discussion it is clear that though Mutual information is a measure of the dependencybetween two variables, if the two variables are independent, the mutual information between them is zero. If thetwo are strongly dependent, e.g., one is a function of another; the mutual information between them is large.
Normalized variants of the mutual information are provided by the coefficients of constraint or uncertaintycoefficient. The two coefficients are not necessarily equal. In some cases a symmetric measure may be desired,such as the following redundancy measure:
...(13)
Finding Frequent Item Sets on Post Mining data using Normalized Mutual Information

68. Gavesana Journal of Management / Vol. 5. Issue 1. January 2013 - June 2013
Experiment and Result
We collect a transactional data (File Test data) and using Matlab version 9.0, we generate frequent itemsets using association rule mining algorithm. .Calculation of correlation was done over frequent item setsgenerated from Test data using (1),(2),..(6) equations. The correlation data analysis has already been done ontest data and P(A) and P(B) [ Probability of item A and Probability of item B] are calculated. From the aboveexample, all the possible combination of two items such as ITEM A 23232 and ITEM B 12221 are taken to makea contingency Table 1 as below:
Table 1. Contingency table of Item A 23232 and Item B 12221
12221 12221 � row
23232 97 68 165
23232 18 20 38
� col 115 88 203
Table 2. Calculation of Mutual Information
12221 12221 � row
23232 97/203 68/203 165/203
=0.47783 =0.33497 =0.81280
23232 18/203 20/203 38/203
=0.88669 =0.98522 =0.18719
� col 115/203 88/203 203/203
=0.56650 =0.43349 =1
I(23232, 12221) 0.47783
= 0.47783 log ----------------------------0.81280 * 0.566500.33497
+0.33497 log ----------------------------0.81280 * 0.4334970.88669
+0.88669 log ----------------------------0.18719 * 0.566500.98522
+0.98522 log ----------------------------0.18719 * 0.433497
= 0.025539618+(-0.024432419) +2.716621827+3.548636264 =6.266365289 ... (14)
From the above calculation we see that the value of mutual information is large i.e. the above two items arestrongly related. We can calculate the mutual information values taking other items of Test data such as (1000112221; 23232) or (10001 12221 12345; 23232) or (10001 10005 12221 12345 ; 23232) in the same way to findthe dependency between two variables. From (9), we get the value of H(X)=0.695567444 and H(Y)= 0.987204565.So, H(X) + H(Y)=1.682772009. Using (13) and from (14), we get R=6.266365289/1.682772009=3.72385which is normalized mutual information value of the above calculation.
Finding Frequent Item Sets on Post Mining data using Normalized Mutual Information

Gavesana Journal of Management / Vol. 5. Issue 1. January 2013 - June 2013. 69
Finding Frequent Item Sets on Post Mining data using Normalized Mutual Information
Conclusion
So from this above discussion we can say, Correlation measures which is used in the linear relationship(Pearson’s correlation) or monotonic relationship between two variables, X and Y, where as mutual informationis more general and measures the reduction of uncertainty in Y after observing X. Mutual information is basedon information theory and it works not only in linear data but also in parabolic datasets. Mutual information helpsreduce the range of the probability density function (reduction in the uncertainty) for a random variable X if thevariable Y is known. The value of I(X; Y) is relative, and the larger its value, the more information that is knownof X. It is generally beneficial to try to maximize the value of I(X; Y), thus minimizing uncertainty. So, if weimply mutual information as a measure to get stronger associated frequent item sets in linear and parabolic itemsets, it will work more accurately than other measures which we discussed earlier.
Acknowledgement
Many people have co-operated with us during the process of translating a collection of ideas into thisresearch. So, we take this opportunity to thank all for giving us the opportunity to complete this paper.
References
Agrawal, R., Imielinski, T. & Swami, A. (1993) Mining association rules between sets of items in very largedatabases. In: proceedings of the ACM SIGMOD Conference on Management of data, Washington, USA.PP. 207-216.
Agrawal, R. & Srikant, R. (1994) Fast Algorithms for Mining Association Rules in Large Databases. In:Proceedings of the 20th International Conference on Very Large Data Bases, Santiago, Chile. PP. 478-499.
Agrawal, R. & Psaila, G. (1995) Active data mining. In : Fayyad, U. M. & Uthurusamy, R. (eds.), Proceedingsof the 1st ACM SIGKDD International Conference on Knowledge Discovery and Data Mining, Montreal,Quebec, Canada. AAAI Press, Menlo Park, CA, USA. pp. 3–8.
Agarwal, C. C. & Yu, P. S.(1998) Mining Large Item sets for Association Rules. In Bulletin of the TechnicalCommittee, IEEE Computer Society, 21(1), 23-31.
Boettcher, M., Ruß, G. Nauck, D. & Kruse, R.(2009) From Change Mining to Relevance Feedback: A UnifiedView on Assessing Rule Interestingness.
Brin, S., Motwani, R. & Silverstein, C. (1997) Beyond market basket: Generalizing association rules to correlations.In: Proc. SIGMOD.
Cover, T. M. & Thomas, J. A. (2009) Elements of Information Theory. Wiley India publishing.
Fogel, D. B. (1997) The advantages of evolutionary computation. In: Lundh, D., Olsson, B. & Narayanan, A.(eds.), Bio-Computing and Emergent Computation, World Scientific Press, Singapore.
Feelders, C. R. & Siebes, A. (2001) MAMBO:Discovering association rules based on conditional independencies.In: Proceedings of4th International Symposium on Intelligent Data Analysis, Cascais, Portugal.
Fraser A. & Swinney, H. (1986) Independent coordinates for strange attractors from mutual information, Phys.Rev, 33.
Han, J., Kamber, M. and Pei, J. (2011) Data Mining Concepts and Techniques. 3rd edition, USA, MorganKaufmann Publishers (An imprint of Elsevier).
Han, J., Pei, J. & Yin, Y. (2000) Mining frequent patterns without candidate generation. In: Proc. SIGMOD.
Hartley, R. V. L. (1928) Transmission of Information. Bell System Technical Journal, July 1928.

70. Gavesana Journal of Management / Vol. 5. Issue 1. January 2013 - June 2013
Kolmogorov, A.(1968) Three approaches to the quantitative definition of information. International Journalof Computer Mathematics.
Latham P. E. & Roudi, Y. (2009) Mutual information. Scholarpedia.
Linoff S. G. & Berry, M. J. (2011) Data Mining Techniques: For Marketing, Sales, and CustomerRelationship Management. 3rd edition.
McNicholas Paul, D. & Yanchang, Z.(2009) Association Rules: An Overview.
Moon, T. K. (2005) A Context for Error Correction Coding: Mathematical Methods and Algorithms. John Wiley& Sons, Inc., Hoboken, NJ, USA.
Savasere, A., Omiecinski, E. & Navathe, S. B. (1998) Mining for strong negative associations in a large databaseof customer transactions. In: Proceedings of the 14th International Conference on Data Engineering,Washington DC, USA. PP. 494–502.
Silverstien, C., Brin, S. & Motwani, R. (1998) Beyond Market Baskets: Generalizing Association Rules toDependence Rules. Data Mining and Knowledge Discover, 2(1), 39-68.
Shannon, C. E. (1948) A Mathematical Theory of Communication. Bell System Technical Journal, 27, 379–423 & 623–656.
Finding Frequent Item Sets on Post Mining data using Normalized Mutual Information

Gavesana Journal of Management / Vol. 5. Issue 1. January 2013 - June 2013. 71
Integrating Soft Skills with Business English:Value Creation for Management Students
I.Padmini *
Abstract
For years, research studies and articles have emphasized the importanceof communicationskills. Todaythese communication skills have become more essential in obtaining employment andfor advancing in amanagement career. A large part of being an effective manager involves being an effective communicator.Many top managers concede that, as one climbs the organizational ladder, the relative importance of technicalskills declines while that of communication skills increases. Therefore, business schools all over the world havealtered their course curricula to add a focus on acquiring communication skills along with the regular quantitativeand technical skills. However, despite these changes, communication courses in India are often perceived bystudents as being ‘soft’ or ‘easy’ courses, and are in general yet to receive their attention. The perception ofbusiness communication as a subject is still low in terms of academic importance. Management students do nottake it as important as their core subjects. The B-school curriculum in India does not emphasize on developingthe English language skills of the students.
The objective of a Business English course at tertiary level is to enable students to communicate efficientlyin international business and to be able to work in different cultures. Designing a Business English coursekeeping in view the business situations, corporate expectations and students’ mindset is a challenging task. Asthe industry expectations from the ‘B-School products’ are increasingly about ‘soft skills’ there is a need tointegrate soft skills with Business English course and make the course an important component of the B Schoolcurriculumthrough improved pedagogy and evaluation system.
Key Words: Business English, Soft Skills, career, management students, integration, pedagogy, evaluation.
Introduction
“People skills” or “Soft Skills” make someone a good employee and a compatible coworker. Soft skills canbe said to incorporate all aspects of generic skills that include the cognitive elements associated with non-academic skills. Soft skills are identified to be the most critical skills in the current global job market especially ina fast moved era of technology. The reorientation of education for sustainability also relates to the importance ofthese so-called soft skills.
Soft skills are at the very heart of creating capability in employees and leaders. We certainly expectindividuals in all job families to have (and continue to develop) the technical skills required for their uniquejobs—whether they are crafts workers in a maintenance department or payroll specialists in accounting. However,even at the individual employee level it soon becomes apparent that little work gets done in isolation. Allemployeesmust be skilled at participating in team projects and affirming others. They must be adept at managing conflictand creating inclusive relationships that improve team performance and launch ideas. Indeed, the soft skills ofnegotiating solutions or taking a systems view in revamping work processes are the essential tools of effectivecontributors everywhere. Moreover, for those in formal leadership roles, being proficient in “soft skills” is evenmore critical. Thinking systemically and acting strategically is the linchpin of effective leaders, but superb softskills are necessary to actually implement—to articulate a vision; to enroll others in possibilities; and to communicatevalues, standards, and expectations. People support what they help create, and “soft skills” are the essentialtools for helping them contribute to their full potential.
*Sr.Asst.Professor, Vignana Jyothi Institute of Management, Bachupally, Hyderabad. Email:[email protected]

72. Gavesana Journal of Management / Vol. 5. Issue 1. January 2013 - June 2013
The online encyclopedia “Wikipedia” gives a very broad definition of soft skills, “Soft skills refer to thecluster of personality traits, social graces, facility with language, personal habits, friendliness, and optimism thatmark people to varying degrees. Soft skills complement hard skills, which are the technical requirements of ajob.” (Wikipedia, 2007)”Soft skills” can be said to incorporate all aspects of generic skills that include thecognitive elements associated with non-academic skills. They are personal qualities and attributes of a personthat set him or her apart from other individuals who may have similar skills and experience. Soft skills characterizecertain career attributes that individuals may possess like the ability to work on a team, communication skills,leadership skills, customer service, and problem solving skills.
While there are many soft skills listed in different studies the present study focuses on communication skillsin different forms, as it is rated as the most important soft skill for management graduates.
Need and Importance of Research Problem
The twenty-first century workforce has experienced tremendous changes due to advances in technology;consequently, the “old way” of doing things may be effective but not efficient. The National Business EducationAssociation (NBEA) indicated that the shortage of skills confronting today’s dynamic workforce goes beyondacademic and hands-on occupational skills. Therefore, the best way to prepare potential employees for tomorrow’sworkforce is to develop not only technical but also human-relation abilities.
Current thinking has broadened the definition of employability skills to include not only many foundationalacademic skills, but also a variety of attitudes and habits. In fact, in recent usage, the term “employability skills”is often used to describe the preparation or foundational skills upon which a person must build job-specific skills(i.e., those that are unique to specific jobs). Among these foundational skills are those which relate tocommunication, personal and interpersonal relationships, problem solving, and management of organizationalprocesses.Soft skills are identified to be the most critical skills in the current global job market especially in a fastmoved era of technology. The reorientation of education which is one trust of education for sustainability alsorelates the importance of these so-called soft skills.
Literature Review
Over the past 40 years, many surveys and articles have confirmed the idea that effective communicationis essential for success and promotion in business. Evidence of the importance of communication in business isfound in numerous surveys of executives, recruiters, and academicians. Without exception, these surveys havefound that communication ranks at or near the top of the business skills needed for success.
According to the Job Outlook 2012 survey of National Association of Colleges and Employers “When itcomes to the importance of candidate skills/qualities, employers are looking for team players and candidateswho have strong verbal communication skills. Employers are also looking for graduates with adept technical andanalytical skills supported by strong writing abilities. One employer from a large products and services companystated they need business hires to have the “ability to sort through the data, find story in the data, andpropose [well-written] solutions supported by data.” Employers also need applicants with strongcommunication skills—both written and verbal.
The Skills Gap Survey (2011:1) presents employers’ views on MBA graduates recruited mainly in thebanking and insurance sector in India. “They expect new MBAs to come to the corporate world with the properattitude…they must possess strong analytic, listening and communication skills…”Surveys have shown that alarge number of MBAs remain unemployed as they lack the requisite communication skills.
The National Business Education Association (NBEA) believes that “Business educators have traditionallybeen successful in teaching the technical skills. While technical skills are effective tools to accomplish a task,they must be complemented by the soft skills to enhance productivity. In the high performance work place it is
Integrating Soft Skills with Business English: Value Creation for Management Students

Gavesana Journal of Management / Vol. 5. Issue 1. January 2013 - June 2013. 73
the human factors that impact the ability of organizations to succeed”(Policies Commission for Business andEconomic Education Statement No.67,n.d., p.1). To ensure success, students entering the twenty-first centuryworkforce must possess non- technical soft skills along with technical competence (PCBEE Statement No.67).
In academia, research has shown faculty and administrators perceive that communication skills are veryimportant to students’ eventual career success (National Association of Colleges and Employers, 2001; Gray,2010)
Graddol (2009: 106) observes that: “a part of the unemployment problem emanates from the mismatchbetween the skill requirements of the market and the skill base of the job seekers. English is a vocational skillwhich substantially improves labour mobility and improves employment outcomes.” He goes to state that theConfederation of Indian Industries (CII) have demanded that accelerated English learning classes must beincluded.
A recent survey conducted by FICCI and the World Bank (November 2009) revealed that 64 per cent ofthe surveyed employers felt that recruits lack basic communication skills like reading, listening and writing, andhigher order communication skills which would include influencing, negotiation, etc both written and non-written.According to the FICCI survey, the three most important general skills are integrity, reliability and teamwork,and English communication.
According to NASSCOM-McKinsey report (April 2009) approximately 75 per cent of fresh graduatesfrom India are not directly employable as they lack communication skills.
Jaderstrom and Schoenrock (2008) noted that clear, concise communication is vital for success in theglobal business environment. The ability to effectively communicate permeates every aspect of life and appliesto all disciplines.They agreed that essential basic communication skills include the ability to speak, signal, listen,write, and read. Further, Lehman and DuFrene stated that attending meetings, writing reports, presentinginformation, explaining and clarifying management procedures, coordinating the work of various employees, andpromoting the company’s image are all described as ways to communicate.
Sutton (2002) found that soft skills are so important that employers identify them as “the number onedifferentiator” for job applicants in all types of industries.
Objectives
The study aims at examining how education and training can create assets and increase the productivecapacity of management graduates. While there are nearly 64 soft skills listed in different studies, the presentstudy focuses on communication skills in different forms as it tops the list of soft skills which are essential formanagers.
The main objectives of the study are:
• To evaluate the role of Business English in enhancing the soft skills of the management graduates.
• To explore different methods of integrating soft skills with Business English course and grooming the futuremanagers for corporate environment.
Methodology
The study is analytical and comprises both primary and secondary data. For collecting primary data a fieldstudy is undertaken by conducting a sample survey using questionnaires and a series of interviews. The surveyinstrument was developed in phases. In the first phase, a few faculty members were informally interviewed toassess their perceptions about communication skills. From the interview notes, a survey questionnaire wasdesigned. The questionnaire is administered online to employees and to VJIM alumni working in different
Integrating Soft Skills with Business English: Value Creation for Management Students

74. Gavesana Journal of Management / Vol. 5. Issue 1. January 2013 - June 2013
organizations..Secondary data has been collected from books and periodicals, journals, surveys conducted byvarious management consultancies, reports by Nasscom, FICCI,Skill Gap Survey report etc.
Data Analysis and Results:
1. The participants were asked to rank the subjects in order of importance (1-themost important) and (10- theleast important)
Table 1: Analysis of importance of Subjects
N Minimum Maximum Mean Std. Deviation
Business Strategy 128 1 5 3.94 .970
Human Resource Management 127 1 5 3.80 .952
General Management 128 1 5 3.89 1.021
Business/English communication 129 1 5 4.16 .900
Marketing/Sales 129 1 5 4.09 .893
Finance/Accounting 126 1 5 3.69 1.016
Technical Skills 127 1 5 3.49 1.053
Business Ethics 128 1 5 3.91 1.143
Operations Management 126 1 5 3.70 .932
Organization Behaviour 125 1 5 3.80 1.063
Valid N (listwise) 120
Based on the mean values the most important subject that should be taught to management graduates isBusiness communication with a mean value of 4.16 and Marketing /Sales was found to be the subject withsecond preference with a mean value of 4.09. The next preference was given to Business strategy, ethics,general management with mean values of 3.94, 3.91 , 3.89.Subjects such as organization behavior, HRM,operations management were considered subjects with least importance with mean values of 3.80, 3.70, 3.69.(Table 1)
2. Skills: Participants are to rate the following from 1 (least important) to 5 (most important) as per their levelof importance for Management Graduate
Table 2: Analysis of importance of Skills
Skills No. Minimum Maximum Mean Std.Deviation
Conceptual Knowledge 126 1 5 3.94 .941
Logical Ability 127 1 5 4.23 .821
Analytical Ability 126 1 5 3.98 .959
Communication Skills 126 1 5 4.40 .821
Presentation Skills 127 1 5 4.25 .826
Spontaneity 127 1 5 4.07 .875
General Awareness 126 1 5 4.01 .821
Creative Thinking 126 1 5 4.02 .894
Confidence 125 1 5 4.61 .759
Valid N (Listwise)
Confidence, communication skills, presentation skills and logical ability are considered to be essential in theorder of importance with mean values of 4.61, 4.40, 4.25, and 4.23. Skills that were considered to be of moderatevalue are spontaneity, general awareness creative thinking are 4.07, 4.02, 4.01.(Table 2)
Integrating Soft Skills with Business English: Value Creation for Management Students

Gavesana Journal of Management / Vol. 5. Issue 1. January 2013 - June 2013. 75
3. Facts: The following facts were considered to be very important based on the basis of mean values.
Table 3: Facts of importance
Communication increases chances of employability among management graduates 4.22
Effective communication enhances job performance and faster career success 4.12
Soft skills are essential for employment 4.11
Candidates with good communication make more effective presentations 3.98
Role of Business English
Business English has attracted increasing interest and awareness in the last two or three decades withcourse books and other teaching and learning materials proliferating. Almost all the students who study business,trade, or commerce have to take some courses in Business English Communication. Communicative activitieslike role-play, simulation, projects and case study have become the most important Business English task-basedlearning techniques nowadays as they develop communicative competence by putting students in real-life situations,where they can use language actively and practice and develop communication skills. The facilitator role of ateacher helps create a partnership in learning between the teacher and students, thus greatly enhancing thelearning experience.
The academic needs of business students include understanding complex texts (reading comprehension),note-taking, academic writing, conference presentations, while professional needs require writing reports,commercial presentations, meetings, negotiations. The most highly rated course topics in the Business Englishcourse are making presentations, writing memos and letters, listening and interpersonal communication, impromptuspeaking, and business report formats. The most frequently suggested additional topics are job interviews, teambuilding, and writing manuals/policies/procedures.
Case Study
Case study is a powerful learning tool for Business English students as it simulates an authentic workexperience requiring them to get involved in work-or business-related communications. It provides a high motivationfor English learners as they are put into real-life situations and find themselves in the position of authority todecide how to solve business problems. . Case study provides the framework for a task-based learning with thefocus on the solution of the problem as the outcome of the task. Case study method allows the students topractice and develop their communication and management skills, such as presentation, meeting, negotiationskills, as well as problem-solving, decision-making, teamwork, critical thinking, all of which are required in amodern business context. Case-based learning is a core feature of business education since it enables studentsto discover and develop their unique framework for dealing with business problems. In tune with the theme offormal functions in any organization, students work through cases chosen and taught by faculty members fromsuch functional areas as marketing, finance, and HR. Then the English faculty members can help studentsenhance their skills in writing the various business genres, like reports, letters, e-mail, and proposals. The situationsfor communication are derived from functional areas of the firm, drawn from cases and articles, especially thosestudied in other subject areas. In this way, communication is seen as an integral part of the core managementstudies rather than a subject to be pursued independently in a theoretical manner. For instance, a case studied bya student group in accountancy can be used in the communication module to develop a broader perspective onother concepts in the case that would interest a decision maker rather than just the “cost” aspect. This is howCommunication Skills can be integrated with Business English course.
Presentations
Delivering presentations is an inherent part of work environment. It is imperative that students understandthe benefits and disadvantages of giving presentations. They are aware of their own individual strengths and
Integrating Soft Skills with Business English: Value Creation for Management Students

76. Gavesana Journal of Management / Vol. 5. Issue 1. January 2013 - June 2013
weaknesses the presenting, and of how they can use their own style to best advantage. There should be a focuson the preparation and delivery of a good presentation based on current news stories about firms and theirmarkets. Students choose their own topics in support of other modules that provide, for example, a social orbehavioral or legal or financial or microeconomic perspective on the theme. Student groups give their presentationswhich are videotaped, and are reviewed during the feedback session.
Discussions
Students can participate in a dialogue on a socially relevant issue and hold a meeting where they have toconfront a troublemaker who is purposely planted to disrupt the discussion. Through such exercises, studentslearn about passive, assertive, and aggressive behavior. They also discuss cases that center on difficult decision-making situations and engage in role-plays based on the case. As an assignment students can interviewentrepreneurs, and this makes them realize how significant communication skills are in the workplace.
Internships
We need to prepare business students to become more attuned to the importance of soft skills in the “realworld” that they will soon enter. They should be encouraged to grab every chance to work in organizations,particularly in roles that require interdependence with others. They can work in market research, assist incommunity events, and work on publications. Internships remain a traditional and wise way for students to bringtheir initiative, insight, and energy to companies. Additionally, the need for collaborative student work is reinforcedhere. Teamwork and interpersonal activities are fundamentally inherent in promoting soft skill development.Language and expression have to be significant components of every assignment.
Activities
Methods of small group activities, case studies and cooperative student projects give the opportunity toactively participate in the learning process by talking, reading, writing and reflecting. Business EnglishCommunication should be presented not as a subject to be learned in isolation from real use, nor as a mechanicalskill or habit to be developed. On the contrary, Business English Communication should be presented in authenticcontexts acquaint the learners with the particular ways in which the language is used in function. This meansthat they will need to perform in their fields of specialty or jobs. Within Business English Communication, thelecturers have greater freedom to create different “scenarios” or ideas for role-playing, using a text as a point ofdeparture. Much of the language is functional, which means it is applicable to many situations. Depending on theproficiency of students, the lecturers can expand or limit the scope or complexity of any lesson, by picking andchoosing what is appropriate for the class.
Conclusion
Numerous studies suggest that business schools are failing to help students develop communicativecompetencies and skills essential to the new workplace and yet the efforts to overcome this failure have provedfruitful only to a limited extent. The content of a business communication programme, the nature of its curriculumand how it meets the needs of business life distinguishes a B-school from its competitors. This curriculum iscrucial to all the stakeholders- the employers, the business school, the faculty and the students. Given theimportance of curriculum content to all the stakeholders and given the dramatic changes in the workplaceenvironment, it is essential for language teachers to incorporate changes in their curriculum in order to meet thechanging workplace demands.
Integrating Soft Skills with Business English: Value Creation for Management Students

Gavesana Journal of Management / Vol. 5. Issue 1. January 2013 - June 2013. 77
References
Carol.M.Lehman, Debbie D.Dufrene (2008).Business Communication, Cengage Publsishing.
Federation of Indian Chamber of Commerce and Industry ( FICCI) and World Bank (2009) Report.
Graddol, D (2009). English Next. India. The British Council.
Jaderstrom and Schoenrock(2008). Teaching the NBEA Communication Standards. Business Education Forum,62(4)
Job Outlook 2012: A survey of National Association of Colleges and Employers, The Higher Education Forumsupported by 1SOS and Westat.
Klaus Peggy, (2008): The Hard Truth about Soft Skills: Workplace Lessons Smart
People wish they’d learned Sooner,Collins
NASSCOM-McKinsey report (2009)
Sutton, N (2002): Why can’t we all just get along? Computing Canada.
The Skills Gap Survey- Survey for the Indian Banking, Financial Services, and Insurance Sector. India(2010): 1-18. Web. 3 Dec. 2011.
Integrating Soft Skills with Business English: Value Creation for Management Students

78. Gavesana Journal of Management / Vol. 5. Issue 1. January 2013 - June 2013
Leadership Styles and Emotional Intelligence amongHospital Managers
Dr. Arif Syed* & Dr.ChandraSekhar, S.F**
Abstract
Hospital environment is most complex unlike other workplaces owing to the critical care, wide spread ofspecialists – medical and non-medical, intensively working for saving the patients battling between life anddeath. Such environment demands emotionally intelligent workface and also leadership on the part of them.Despite such prominence of the theme, studies are sparse on addressing leadership and emotional intelligenceamong hospital managers in the literature, leaving a serious gap in understanding the nature of such managers’work lives. Encouraged by such thought, this study is initiated in two large public and private hospitals in the twincities of Hyderabad and Secunderabad in which 200 hospital managers participated. When analysed, the datasuggest that people centered styles of leadership among managers, predominated both public and private hospitals,besides managers from private hospitals were more emotionally intelligent than their counterparts. Implicationsare drawn for practice and future research directions.
Key Words: Leadership Styles, emotional intelligence, Hospitals, Hospital Managers
Introduction
Health care institutions are known for their complexity since quite a large number of professionals includingmedical, clinical, paramedical,and administrative and the supportive specialists, all working for the preventive,palliative and promotive health services to a wide constituent of people from the general community. All of themare either performing lead roles or roles led by seniors.These roles are integrated in order to provide betterquality of services to the patient community, often challenging the hospital managers for designing and redesigningan effective leadership function (Riggio & Reichard, 2008).
Besides, leadership in hospitals is a shared phenomenon since a group of diverse professionals cater to thehealthcare needs of the patient community geared towards becoming patient-centered, patient-focused, andpatient-driven, rather than doctor-driven. Such leaders are emotionally intelligent for hospital jobs. Such leadershipis of cardinal concern to the effectiveness of hospitals in general and effective treatment outcomes in specific(Bass, 1985). This calls for understanding the prevalence of leadership.
On the other hand, working in a hospital not only calls for designing and implementing leadership roles butit is also essential for such leadership to possess emotional intelligence. Such leadership operates with a wellunderstood emotional state of self and also that of the people around it. Besides, managing emotions of self andregulating social relationships which influence treatment outcomes. Thus, emotional intelligence can differentiatebetween good and poor leaders (Carmeli, 2003). But, despite the high interest regarding the influence of emotionalintelligence in effective leadership, there is still paucity of research works which examined such relationship(Palmer, Walls, Burgess, &Stough, 2001).To that effect, the present study addresses two of these serious issuesnamely leadership, emotional intelligence and their relationships.
Emotional Intelligence and Leadership
The research is compelling that emotional intelligence is a powerful enabler for enhanced leadershipeffectiveness.
* Naturopathy Consultant and Hospital administrator, Healing Hands – Naturopathy and Yogacenter, 7-1-65/b, 501, penthouse,
Lumbini Apartments, D.K.Road, Ameerpet, Hyderabad, Andhra Pradesh – 500016. E-mail: [email protected]
** Professor and Chair (HR Area), Siva Sivani Institute of Management,NH7, Secunderabad 500014, E-mail: [email protected]

Gavesana Journal of Management / Vol. 5. Issue 1. January 2013 - June 2013. 79
Salovey and Mayer (1990) had generated sufficient ground for accepting the term “emotionalintelligence”(EI). They defined it as a set of skills: relevant to the accurate appraisal and expression of emotionin oneself and in others, theeffective regulation of emotion in self and others, and the use of feeling to motivate,plan, and achieve in one’s life (Salovey and Mayer, 1990, p. 185.
Leadership is a process of social interaction where the leader’s ability to influence the behaviour of theirfollowers can strongly influence performance outcomes (Humphrey,2002; Pirola-Merlo et al., 2002).Humphrey(2002) also suggests that leadership process is essentially an emotional process and process of recognizing andevoking emotional states in the followers and their consequent management for realization of business purpose.
Despite the popularity of the concept, most of the research works published investigated EI and performanceoutcomes in laboratory settings, using student sample populations (Lopeset al., 2004)
Shankman and Allen (2008) suggest that leaders must be conscious of three fundamental facets of leadership:context, self, and others. Further they state that leaders should develop competencies in all these areas whilepaying attention, including group savvy, optimism, initiative, and teamwork. Being one of the most importantleadership abilities or traits, emotional intelligence appears to be an important construct. The underlying themesuggests that people who are more sensitive to their emotions and the impact of their emotions on others will bemost effective leaders distinguished from the less effective ones.
Weinberger’s (2002) found that the relationship between EI andtransformational leadership, using found nosignificant correlations within asample group of 138 managers. Rosete and Ciarrochi (2005) studied publicservice managers to explore the relationship between ability based EI, personality, cognitive intelligence andleadershipeffectiveness. He found that higher EI scores were associated with higher leadershipeffectiveness.However, such results, being scanty, are not sufficient to warrant the relationshipsparticular the dichotomy ofemotional intelligence and the leadership effectiveness which is a combination of task centered style and thepeople centered style.
Present Study
Hospital jobs require performing leadership roles in various services offered to the patient community.Besides, in every healthcare situation in hospitals, employee in such roles deals with wide ranges of emotions inhandling various patients and their attendants. When all efforts result in positive outcomes, there is alwaysstability in relationships. However, there will be instability of the treatment outcomes are adverse. Many Peoplewill employ wide range of emotions. Therefore, leadership not only calls for addressing the situations wherethere is stability, but much more in situations where there is instability.
Thus, all of these situations are characteristicsby people who bring in various kinds of healthy and unhealthyemotions. Research themes on leadership suggest that leaders and the followers operate in situations. Therefore,these three elements of leadership namely leaders, followed and the situation are wrapped up in a frame calledemotional intelligence. Emotionally intelligent managers in hospitals are equipped to understand the needs oftheir subordinates in general and patients in specific and the opposite is probable in case they are not emotionallyintelligent which is acquired through consciously designed training (Bass, & Avolio, 2000).
This study has three fold purposes. Firstly, the leadership styles among hospital managers are studied toknow the particular emerging style among them. Secondly, their emotional intelligence isassessed to know howintelligent they are in understanding and managing emotions at work place. Lastly, relationships among emotionalintelligence and leadership are examined.
Leadership Styles and Emotional Intelligence among Hospital Managers

80. Gavesana Journal of Management / Vol. 5. Issue 1. January 2013 - June 2013
Objectives
1. To assessleadership styles among hospital managers from select hospitals and analyse it according to typeof hospital, age, and experience of the hospital managers.
2. To assess emotional intelligence among hospital managers from select hospitals.
3. To assess the relationships between leadership styles and emotional intelligence.
Hypotheses
It is hypothesized that,
i) Hospital managers do not vary intheir leadership styles according totype of hospitals.
ii) Hospital managers do not vary in their leadership styles according to their personal background variables
iii) There is no relationship between hospital manager’semotional intelligence and their leadership styles.
The Method
200 hospital mangers from largest public and large private hospitals from the twin cities of Hyderabad andSecunderabad have participated in this study. They were administered with a structured questionnaire whichincluded three sections namely profile, standardized scale for assessment of leadership styles and anotherstandardized scale to measure emotional intelligence. For assessing leadership styles, a standardized 20-itemscale developed by Northouse (2012) was adopted. For measuring emotional intelligence, a 20-tem scale developedby Northouse (2012) was adopted. Coefficients of alpha of the scales is 0.92 and 0.87 respectively, indicatingthat both the scales internally consistent.
Results and Discussion
The results are presented according to the testing of the hypotheses. To begin with, firstly, the resultspertaining to the leadership are presented, followed by results pertaining to emotional intelligence. Lastly, therelationships between leadership styles and emotional intelligence are presented.
Leadership Styles and Type of Hospital
It was hypothesized that “the leadership styles do not vary among hospital mangers according to the typeof hospitals in which they are employed”. In order to test this hypothesis, means, SDs and f-values are computed.Results in this regard are presented in table 1.
Table 1: Leadership Styles and Type of Hospital
Leadership Styles Type of Hospital N Mean Std. Dev F value Df Sig.
Task Centered Style Public Hospital 100 33.02 2.75 6.616 1,199 0.011
Private Hospital 100 33.91 2.10
People Centered Public Hospital 100 39.76 4.07 7.492 1,199 .007
Private Hospital 100 41.46 4.69
Table 1 presents that the managers from private hospital scored more (33.91) than the mangers of publichospital (33.02). Interestingly, the mean variation is statistically significant as evident from the F value (6.61), d.f(1; 199), p (0.011).
Similarly, with regard to the people-centered style of leadership, the managers of private hospital scoredmore (41.46) than the mangers of public hospital (39.76). Interestingly, the mean variation is statistically significantas evident from the F value (7.492), d.f (1; 199), p (0.007). This indicates that on both task and people centered
Leadership Styles and Emotional Intelligence among Hospital Managers

Gavesana Journal of Management / Vol. 5. Issue 1. January 2013 - June 2013. 81
style of leadership, hospital managers from private hospitals are very high on the styles than the managers ofpublic hospitals.
Thus, the null hypothesis”the leadership styles do not vary among hospital mangers according to the type ofhospitals in which they are employed” stands rejected and the alternative hypothesis stands accepted. In otherwords, hospital managers from private hospitals are expected to be high on both task centeredness and peoplecenteredness in their hospitals as opposed to their counterparts in public hospitals.
Leadership Styles by Personal Characteristics
It was hypothesized that “hospital managers do not vary in their leadership styles according to their personalbackground variables. Results relating tothe testing of the hypothesis arepresented in the following sections.
Table 2: Leadership Style by Age Group
Leadership styles Age group (in years) N Mean Std. Dev. F-value d.f. Sig.
Task Centered Style 29-44 48 33.58 2.39
45-49 100 32.97 2.76 4.329 2,199 0.014
50+ 52 34.31 2.78
People Centered 29-44 48 41.00 2.06
45-49 100 40.15 2.05 5.085 2,199 0.007
50+ 52 41.13 2.02
Table 2 presents the data pertaining to leadership style of Hospital managers by age whose mean scoresfor task center type and people centered type have been obtained and further presented to analyse the styles. Itcan be observed from the means scores that older hospital managers (mean=34.31), have obtained higher meanscores than the others. Interestingly, the mean variation is statistically significant as evident from the table (Fvalue=4.32, d.f.2,199, p=0.014).
With regard to people-centered leadership style,it can be observed from the means scores that older andthe younger hospital managers have equal mean scores of 41.13 and 41.00 respectively which is higher meanscores than the middle age managers. Interestingly, such mean variation is statistically significant as evidentfrom the F value (5.085), d.f (2; 199), p (0.007). This means that on both the Task centered style and the people-centered style of leadership of hospital managers differ according to the age groups. More specifically, the olderthe managers, they are balancing both task-centered and people centered styles of leadership.
Table 3: Leadership Style by Experience
Leadership styles Experience (in years) N Mean Std. Dev F-value d.f Sig.
Task Centered Style 1-9 50 33.66 2.81
9-17 96 32.97 2.03 4.258 2,199 0.015
18-59 54 34.17 2.85
People Centered 1-9 50 41.52 4.22
9-17 96 39.67 3.98 4.263 2,199 0.015
18-59 54 41.44 5.17
Table 3presents the data pertaining to leadership style of Hospital managersaccording to their experience.It is clear from the table that those managers who worked for more than 18 years are known for using taskcenter style than the less experienced (33.66) and moderately experienced managers (32.96).Further, the meanvariation is also statistically significant as evident from the F value (4.25), d.f (2,199), p (0.015).
As regards people-centered style of leadership a similar trend is observed. That is, Hospital managerswhohave worked for more than 18 years, scored higher mean scores on people centered type (41.44) than others.
Leadership Styles and Emotional Intelligence among Hospital Managers

82. Gavesana Journal of Management / Vol. 5. Issue 1. January 2013 - June 2013
Further, the mean variation is statistically significant as evident from the F value (4.26), d.f (2, 199), p (0.015).This means more experienced manages are known for balancing both task centered and people-centered leadershipstyles.
Table 4: Leadership Styles and Type of Function
Leadership Styles Type of Function
N Mean Std. Dev F value Df Sig.
Task Centered Style Medical 100 34.11 4.28
Non-Medical 100 32.82 3.48 5.476 1,199 0.020
Total 200 33.47 3.94
People Centered Medical 100 41.15 2.78
Non-Medical 100 40.07 2.08 9.676 1,199 0.002
Total 200 40.61 4.46
Table 4shows the data pertaining to leadership style of Hospital managersaccording to the type of hospitalto which they belong. It can be observed from the table that the hospital managers in Medical function haveobtained higher mean score (34.11), than the Non-Medical managers (32.82). Interestingly, mean variation isstatistically significant as evident from the F value (5.47), d.f (1; 199), p (0.020).
Further, with regard to people centered it is found that Medical managers (41.15) scored more than theNon-Medical managers (40.07).Interestingly, such mean variation is statistically significant as evident from theF value (9.676), d.f (1; 199), p (0.002). This indicates that on both task centered and people centered styles ofleadership medical managers are doing better than the non-medical managers.
From the preceding sections, it is noticed that thenull hypothesis”the leadership styles do not vary amonghospital mangers according to their personal background variables” stands rejected and the alternative hypothesisstands accepted.
Emotional Intelligence and Leadership Effectiveness
It was hypothesized that “there is no relationship between emotional intelligence and leadershipeffectiveness”. In order to test this null hypothesis, Pearson’s’ correlation coefficients were computed, followedby regression analysis. Results in this regard are presented in table 5.
Table 5:Regression Analysis
Model Unstandardized Coefficients Standardized Coefficients
R B Std. Error Beta t Sig.
1 (Constant) 33.117 3.989 8.302 .000
Personal
Competence .491** .327 .154 .180 2.126 .035
Social
Competence .560** .688 .136 .430 5.072 .000
Model R R Square Adjusted R Square F-value d.f P=
1 .574a .329 .322 48.332 2,99 .000
It is quite clear from the table that both the styles of leadership namely task centers and people centeredare positively and significantly correlated with emotional intelligence of the hospital managers which are evidentfrom the R values presented. Since, both the variables are significantly correlated, regression analysis has beencarried. Results reveal that social competence emerged as a strongest correlate of emotional intelligence amonghospital mangers (beta = .43, t-value=5.07, p=.000).In other words, social competence will improve .43 units of
Leadership Styles and Emotional Intelligence among Hospital Managers

Gavesana Journal of Management / Vol. 5. Issue 1. January 2013 - June 2013. 83
change in emotional intelligence; similarly, personal competence will only improve around .18 units which arequite meager. The coefficient of determination yielded a value of 0.32 which is statistically significant. Thisindicates that around 32 percent of variance in leadership effectiveness is explained by both the personal andsocial competence. The remaining 68 percent of emotional intelligence might be accounted for by many otherextraneous variables like socialization, personality traits, and organizational processes like, communication,influence, decision making and the like.
Thus, the null hypothesis “there is no relationship between leadership styles and emotional intelligence”,stands rejected and the alternative hypothesis is accepted.
Discussions
This study brought to light an important finding pertaining to the leadership styles in hospitals today. Mostinteresting issue is that the hospital managers from private hospitals are more tasks-centered and more people-centered in their leadership styles. Blake and Mouton (1985) in their managerial grid theory suggested that suchcombination of both leadership styles on a higher plane is characterized by team leadership. Managers in privatehospitals in general operate in a highly interdependent fashion since accountability is more owing to the patientswho normally pay for their treatment more than their counterparts in public hospitals. Besides, the managers aremore conscious of protecting the image of the private hospitals as a matter of their future survival. Therefore,they are increasingly focused on their team members who cater to the needs of the patient community.
Another interesting finding is that the older and more experienced hospital mangers also were found higheron task-centered and people-centered styles of leadership. In other words, such combination is called team-leadership. By and large, the older people are known for providing direction to the younger ones. Similarly, theemployees in hospitals are supervised by the managers who are older and more experienced. This may be alsodue to the fact that as managers grow older and more experienced, they might have realized that they asindividuals alone cannot influence treatment outcomes. Therefore, they need to build the teams which provideconstant support to the patients. As such they are more task-centered and people-centered as well (Bureau ofHealth Professions, 2000).
Another interesting outcome of this study is that the medical hospital managers were found more on taskand people-centered styles than the non-medical managers. This may be due to the fact that managers who areresponsible for medical management involving direct dealing with the patients on one hand and mobilizing theenergies of their team of subordinates, who support all the treatment outcomes, need to be more on task-centered and people-centered styles.On the other hand, non-medical managers are more administrative in nature,involving more in day-to-day activities like planning, billing, purchasing, financing, HR and other supportiveactivities which are not life-threatening to the patients as such services are only supportive in nature, to themedical managers.
Lastly, this study highlighted the fact that emotional intelligence contributes to the emotional intelligence ofhospital managers. More so, social competence was more impacting for leadership effectiveness of the managers.But, both styles put together contributed one-third of improvement in the leadership effectiveness. Thus, suchfinding is also in harmony with the theories of emotional intelligence. Golman suggests that leaders who aremore people focused are also known for managing social relationships more effectively. In other words, leaderswho are aware of emotions played by the people around are also more effective in understanding people andalso managing relationships convenient to both people themselves and also to the effectiveness of the organizationsin which they work (Bozell, 2001). Thus, hospital managers exactly resemble such leaders who are known forunderstanding employees and patients more empathetically.
Leadership Styles and Emotional Intelligence among Hospital Managers

84. Gavesana Journal of Management / Vol. 5. Issue 1. January 2013 - June 2013
Implications
The results are quite encouraging from the context of development of leadership and emotional intelligencein hospitals. Firstly, there is a need for improving upon emotional intelligence of the managers, followed byimproving leadership effectiveness among them. Hospitals need to have learning and development divisionwhich takes care of continuous training of their employees throughout the year. These programmes could coverleadership development, emotional intelligence and quite other programmes which improve the competencies ofthe managers. Such competences will help in delivering effective services to the patient community.Therefore,to improve such competences of managing self and relationships in their work places, hospital managers needemotional intelligence workshops wherein they will have hands-on experiential learning about their leadershipstyles and also their emotional competences.
Further, their leadership styles need to be improved more towards team-based leadership orientation ashospital jobs involve more team-based work systems wherein people from diverse specializationscome togetherand work towards patients’ recovery in a more tight and interdependent fashion. In sum, understanding emotionsand managing emotions may well be that, as Matthewset al. (2002) propose, the ability to understand emotionsand the ability to act effectually on this understanding may only be marginally related. Future research shouldattempt to understand more in-depth issues of leadership effectiveness in relations to the dimensions of emotionalintelligence particularly making comparisons across specializations in hospitals since such understanding willpave a great path towards excellence in healthcare services.
Conclusion
This study addressed three important aspects of hospital managers’ work lives. Firstly, the emotionalintelligence among hospital managers has been addressed particularly in relating to the managers personalbackground variables and type of hospitals under study. Secondly, leadership effectiveness among hospitalsmanages has been assessed. Thirdly, the relationships between emotional intelligence and leadershipeffectivenesshave been analyzed and reported in this study. Thus, all the null hypotheses have been rejected andalternative hypotheses have been accepted. Further, implications were drawn for improving upon leadershipstylesand emotional intelligence among hospital managers for effective services to the patient community.
References
Bass, B. (1985). Leadership and performance beyond expectations New York, NY: The Free Press.
Bass, B., & Avolio, B. (2000).The Multifactor Leadership Questionnaire (2nd.ed)Redwood City, CA: MindGarden, Inc.
Blake & Mouton (1985) The managerial grid III: The key to leadershipexcellence.
Bozell, J. (2001). Breaking the vicious cycle Nursing Management, 32 (1), 26-28.
Bureau of Health Professions (2000).HRSA state health workforce profiles (DHHS Publication No. 230-BHPr-26). Washington, DC: Government Printing Office.Carmeli, A. (2003) The relationship between emotionalintelligence and work attitudes, behavior and outcomes.
Humphrey, R.H. (2002) ‘The many faces of emotional leadership’,The Leadership Quarterly, Vol. 13 No. 5,pp. 493-504.
Lopes, P.N., Brackett, M.A., Nezlek, J.B., Schutz, A., Sellin, I. and Salovey, P. (2004), ‘Emotional intelligenceand social interaction’,Personality and Social Psychology Bulletin, Vol. 30 No. 8, pp. 1018-34.
Northouse, P.G (2013). Leadeship : Theory and Practice, New Delhi:Sage Publications.
Leadership Styles and Emotional Intelligence among Hospital Managers

Gavesana Journal of Management / Vol. 5. Issue 1. January 2013 - June 2013. 85
Palmer, Walls, Burgess &Stough (2001) ‘Emotional intelligence and effective leadership’,Leadership andOrganization Development.
Pirola-Merlo, A., Hartel, C., Mann, L. and Hirst, G. (2002), ‘How leaders influence the impact of affectiveevents on team climate and performance in R&D teams’, The Leadership Quarterly, Vol. 13, pp. 561-81.
Ronald E. Riggio and Rebecca J. Reichard (2008), ‘The emotional and social intelligences of effective leadershipAn emotional and social skill approach’, Journal of Managerial Psychology,Vol. 23 No. 2, ,pp. 169-185
Rosete, E. and Ciarrochi, F. (2005), ‘Emotional intelligence and its relationship to workplace performance outcomesof leadership effectiveness’, Leadership & Organization Development Journal, Vol. 26 No. 5, pp. 388-99.
Salovey, P. and Mayer, J. (1990), Emotional intelligence, Imagination, Cognition, and Personality, Vol. 9No. 3, pp. 185-211
Shankman, M. L., & Allen, S. J. (2008).Emotionally intelligent leadership: A guide for college students,San Francisco, CA: Jossey-Bass.Weinberger, L.A. (2002), ‘Emotional intelligence: its connection to HRD theoryand practice’,Human Resource Development Review, Vol. 1 No. 2, pp. 215-43.
Leadership Styles and Emotional Intelligence among Hospital Managers

86. Gavesana Journal of Management / Vol. 5. Issue 1. January 2013 - June 2013
Abstract of Ph.D Thesis
Workplace Stress Among Women in IT SectorDr. A.Sandhya Rani *
Abstract
Today’s work environment and the culture have seen a sea change. The nature of work is changing at awhirl wind speed. The introduction of MNC Culture and women entering the workforce and competing withmen has not only increased the pressure and need for performance in the workplace but has also resulted inincreased stress among the women employees of IT Sector. My study focuses on the growth and working of ITIndustry with particular reference to women, to identify the reasons for the workplace stress among women inthe selected companies in IT Industry in Hyderabad.
Key Words: Workplace stress, Women, IT Industry, Worklife balance.
Review of Litreature
Akinboye et al., (2002)1 identified causes of stress in workplace: New management technique, officepolicies, long work hours, redundancies, Bullying, Harassment, etc. he argued that though stress plays importantrole on both women’s physical and mental health yet it is an unhealthy and ineffective response pattern tochange.
Workplace stress is a major problem, and it has been suggested that gender may be an important demographiccharacteristic to consider in the experience of stress. Jick TD, Mitz LF (1985)
With respect to the IT field specifically, women tend to enter the professional workforce with less trainingFrancis, (2000)37, but tend to demonstrate no significant differences in productivity among high-performing menand women.
In 2008, Yu 79 found that work life balance policies are positively associated with the job tenure of thefemale employees, and moreover the practices of such policies have a great effect on the turnover rate ofemployees.
Sikthingnanavel (2006) 88 explored the effect of select yogic practices on stress of working women of 15normal female volunteers. The suitable parameters were used before and after 10 days training programme.The results show that there is a greater improvement in the reduction of stress in the experimental group thanthe control group.
Objectives of the Study
1. To identify the factors causing work place stress and examine the consequences among women employeesin IT Industry
2 To study various training programs adopted by the IT companies for women employees.
3. To examine the significance of work-life balance and job stress among women in IT Industry
4 To study the workplace stress in relation to career progress.
5. To study the various organizational policies for privileged women employees
6. To study various stress management strategies adopted by IT Industry
* Associate Professor, Sreenidhi Institute of Science and Technology, Ghatkesar, Hyderabad. Email:[email protected]

Gavesana Journal of Management / Vol. 5. Issue 1. January 2013 - June 2013. 87
Hypotheses of the Study:
� H1: Work place stress has greater influence on the marital status of women in IT Industry.
� H2: Training program has significant influence on reducing stress
� H3: Job stress has Significant influence on work-life balance in relation to type of the
family.
� H4:Organizational policies will increase the stress levels of employees
� H5: Workplace stress has negative impact on career progress
Methodology of the Study:
Sample: The present study is exploratory in nature. Four IT companies have been selected from Hyderabadconsisting of 400 respondents from TCS, Infosys, COGNIZANT and Wipro. (TCS – 90, Infosys – 90, Wipro –100 and Cognizant – 120), covering Category level employees of select IT sector using a Stratified RandomSampling method.
Sources of Data Collection
Primary Data: Through questionnaire method and unstructured interview method.400 women employees ofthe select IT companies were selected and questionnaire was circulated among the employees at the participant’swork place
Secondary Data: HR Policies, Procedures for women employees, Organization’s Stress ManagementSystems(SMS) ,Employee Satisfaction Surveys conducted by the Organization and survey consultants, InnovativeHR Practice , White Papers of the companies, National and International Journals. Women forum details andprocess
Statistical Tools and Techniques used in the Study
For analyzing the primary data, statistical tools have been used in the Research Study, which included thefollowing: 1. Chi-square test; 2. Factor analysis The SPSS software package 17 version has been used for thepurpose of analysis.
Major Findings
1. Through Chi square analysis working time feasibility, Role Ambiguity, Women Development and networkingforum,Relationship with superiors, peers, Biased, Discrimination are identified as contributing to the major extentand have a significant impact on the workplace stress are contributing to the major extent as a source ofworkplace stress.
2. Through Chi square analysis it is proved that Training program has significant influence on reducing stresswith respect to Age and Experience among the women Employees in the select companies.
3. Among all other factors influencing work-life balance among women employees, Work Schedule, jobsharing, family are contributing to the major extent and have a significant impact on the workplace stress.
4. Effect of work place stress on career development is the highest in the group with the more than six yearsexperience indicating that the respondents agree to the effect of stress on career progress.
5. Women reveal that the Organizational policies (women specific). seem to favor all the women employeeswith various experiences uniformly.
6. (97.9%) Observed, that organization should adopt some more stress management strategies
Workplace Stress Among Women in it Sector

88. Gavesana Journal of Management / Vol. 5. Issue 1. January 2013 - June 2013
Suggestions
1. These sectors can come up with effective stress management strategies for organizational effectivenessby designing programs that provide social support such as mentoring and building networking programs.
2. IT and BPO sectors must reinforce policies on Training, further education by conducting Reintegration,Internship program, Workshops on self-defense and financial planning to effective parenting which rejuvenatesthe leadership opportunities for women in the workforce and encourage them in Participation, discussions in thenetworking forum, allow them to voice their feedback and complaints by installing booths for anonymous complaint.
3. The provision of Affordable and accessible hygiene and comfortable childcare support, and Family gettogether in the organization can be conducted periodically. Social support will be extended by the family membersand organization understanding individual’s responsibility.
Workplace Stress Among Women in it Sector


![INDEX [vjim.edu.in]](https://static.fdocuments.us/doc/165x107/61fa5f5078f24615456a2d6d/index-vjimeduin.jpg)
