GasLog Ltd. Q4 2016 Results · general LNG shipping market ... Execution Of Our ... Additional...
26
Not For Redistribution GasLog Ltd. Q4 2016 Results 17 February 2017
Transcript of GasLog Ltd. Q4 2016 Results · general LNG shipping market ... Execution Of Our ... Additional...

Not For Redistribution
GasLog Ltd. Q4 2016 Results
17 February 2017
All statements in this presentation that are not statements of historical fact are “forward-looking statements” within the meaning of the U.S. Private Securities Litigation Reform Act of 1995. Forward-looking statements include statements that address activities, events or developments that the Company expects, projects, believes or anticipates will or may occur in the future, particularly in relation toour operations, cash flows, financial position, liquidity and cash available for dividends or distributions, plans, strategies and business prospects, and changes and trends in our business and the markets inwhich we operate. We caution that these forward-looking statements represent our estimates and assumptions only as of the date of this press release, about factors that are beyond our ability to controlor predict, and are not intended to give any assurance as to future results. Any of these factors or a combination of these factors could materially affect future results of operations and the ultimateaccuracy of the forward-looking statements. Accordingly, you should not unduly rely on any forward-looking statements.
Factors that might cause future results and outcomes to differ include, but are not limited to the following:
general LNG shipping market conditions and trends, including spot and long-term charter rates, ship values, factors affecting supply and demand of LNG and LNG shipping and technological advancements;
continued low prices for crude oil and petroleum products; our ability to enter into time charters with new and existing customers; increased exposure to spot market and fluctuations in spot charter rates; increased exposure to spot market and fluctuations in spot charter rates; changes in the ownership of our charterers; our customers’ performance of their obligations under our time charters; our future operating performance, financial condition, liquidity and cash available for dividends and distributions; our ability to obtain financing to fund capital expenditures, acquisitions and other corporate activities, funding by banks of their financial commitments, and our ability to meet our restrictive covenants
and other obligations under our credit facilities; future, pending or recent acquisitions of or orders for ships or other assets, business strategy, areas of possible expansion and expected capital spending or operating expenses; the time that it may take to construct and deliver newbuildings and the useful lives of our ships; number of off-hire days, drydocking requirements and insurance costs; fluctuations in currencies and interest rates; our ability to maintain long-term relationships with major energy companies; our ability to maximize the use of our ships, including the re-employment or disposal of ships not under time charter commitments; environmental and regulatory conditions, including changes in laws and regulations or actions taken by regulatory authorities; the expected cost of, and our ability to comply with, governmental regulations and maritime self-regulatory organization standards, requirements imposed by classification societies and standards
imposed by our charterers applicable to our business; risks inherent in ship operation, including the discharge of pollutants; availability of skilled labor, ship crews and management; potential disruption of shipping routes due to accidents, political events, piracy or acts by terrorists; potential liability from future litigation; any malfunction or disruption of information technology systems and networks that our operations rely on or any impact of a possible cybersecurity breach; and other risks and uncertainties described in the Company’s Annual Report on Form 20-F filed with the SEC on March 14, 2016 and available at http://www.sec.gov.
We undertake no obligation to update or revise any forward-looking statements contained in this press release, whether as a result of new information, future events, a change in our views or expectations or otherwise, except as required by applicable law. New factors emerge from time to time, and it is not possible for us to predict all of these factors. Further, we cannot assess the impact of each such factor on our business or the extent to which any factor, or combination of factors, may cause actual results to be materially different from those contained in any forward-looking statement.
The declaration and payment of dividends are at all times subject to the discretion of our board of directors and will depend on, amongst other things, risks and uncertainties described above, restrictions in our credit facilities, the provisions of Bermuda law and such other factors as our board of directors may deem relevant.
Forward-Looking Statements2
3
2
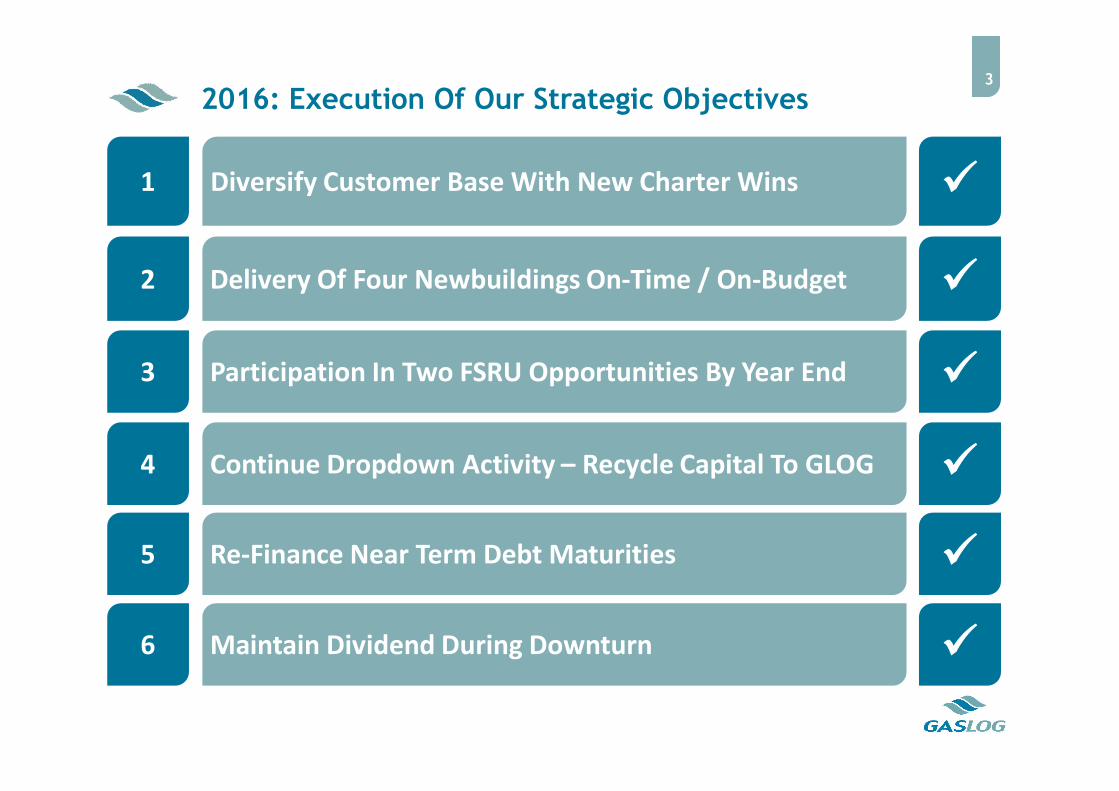
2016: Execution Of Our Strategic Objectives
3 Participation In Two FSRU Opportunities By Year End
Delivery Of Four Newbuildings On-Time / On-Budget
1 Diversify Customer Base With New Charter Wins
4 Continue Dropdown Activity – Recycle Capital To GLOG
6 Maintain Dividend During Downturn
5 Re-Finance Near Term Debt Maturities
Financial Highlights4
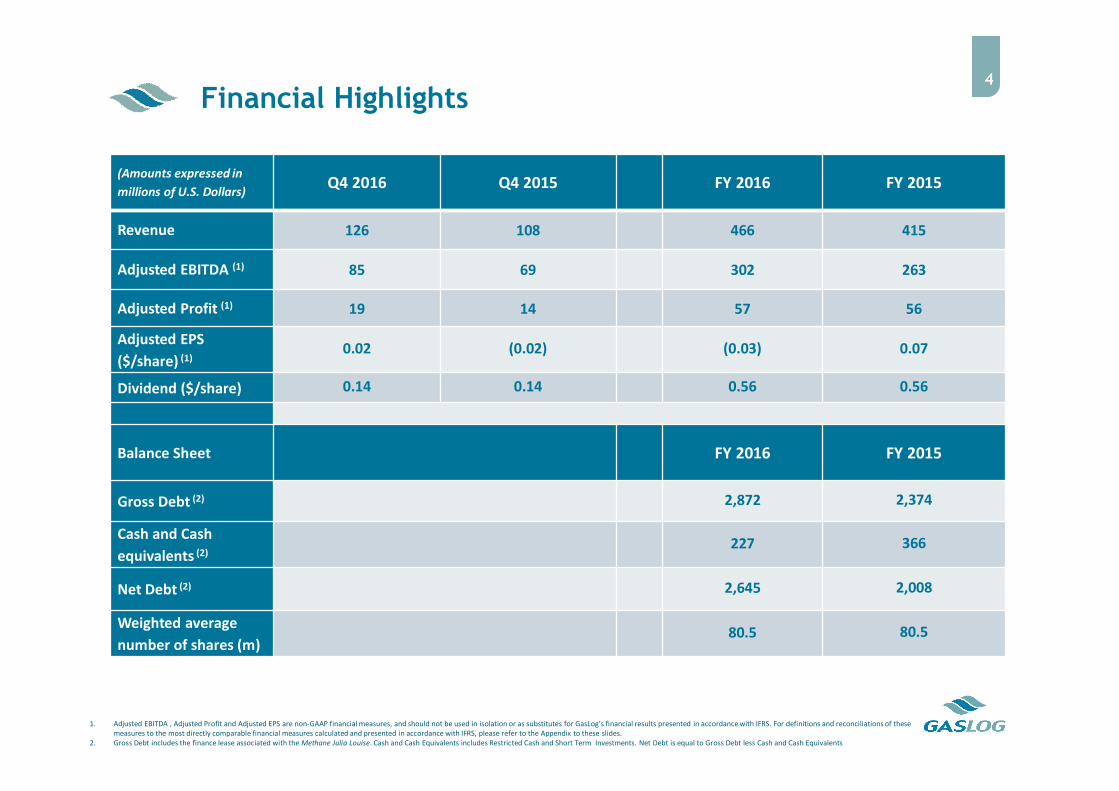
(Amounts expressed in
millions of U.S. Dollars)Q4 2016 Q4 2015 FY 2016 FY 2015
Revenue 126 108 466 415
Adjusted EBITDA (1) 85 69 302 263
Adjusted Profit (1) 19 14 57 56
Adjusted EPS
($/share) (1)0.02 (0.02) (0.03) 0.07
Dividend ($/share) 0.14 0.14 0.56 0.56
Balance Sheet FY 2016 FY 2015
Gross Debt (2) 2,872 2,374
Cash and Cash
equivalents (2)227 366
Net Debt (2) 2,645 2,008
Weighted average
number of shares (m)80.5 80.5
1. Adjusted EBITDA , Adjusted Profit and Adjusted EPS are non-GAAP financial measures, and should not be used in isolation or as substitutes for GasLog’s financial results presented in accordance with IFRS. For definitions and reconciliations of these measures to the most directly comparable financial measures calculated and presented in accordance with IFRS, please refer to the Appendix to these slides.
2. Gross Debt includes the finance lease associated with the Methane Julia Louise. Cash and Cash Equivalents includes Restricted Cash and Short Term Investments. Net Debt is equal to Gross Debt less Cash and Cash Equivalents

100
200
300
400
500
Q1 Q2 Q3 Q4 Q1 Q2 Q3 Q4 Q1 Q2 Q3 Q4 Q1 Q2 Q3 Q4
2017 2018 2019 2020
($m
)
Amortization Other Balloon Repayment NOK Bond Maturity
Limited Refinancing Requirements To 20215
Source: Company information
Scheduled Debt Payments
$450m GLOP Level Facility c. 50% LTV on inception $338m bullet due Q4-2019 100% held at GLOP
Junior Tranche of Five Vessel Refinancing $180m bullet due Q2-2018 50% held at GLOG 50% held at GLOP

6
Date November 1, 2016
Price $189 million, including $1 million of positive net working capital
Size / Propulsion 155,000 cbm / tri-fuel diesel electric (“TFDE”)
Time Charter Period December 2020 with Shell; Shell has two consecutive 5-year extension options
Estimated NTM EBITDA(1) $20 million
Multiple 9.4x Estimated NTM EBITDA(2)
Distribution Increase Per Unit Approximately 5% annualized
Dropdown Pipeline 13 Vessels (includes Centrica charter awarded during Q416)
Dropdown Of GasLog Seattle To GasLog Partners
1. For the first 12 months after the closing. Estimated NTM EBITDA and distributable cash flow are non-GAAP financial measures. Please refer to appendix for a definition of these measures2. Acquisition multiple is calculated using net purchase price of $188 million
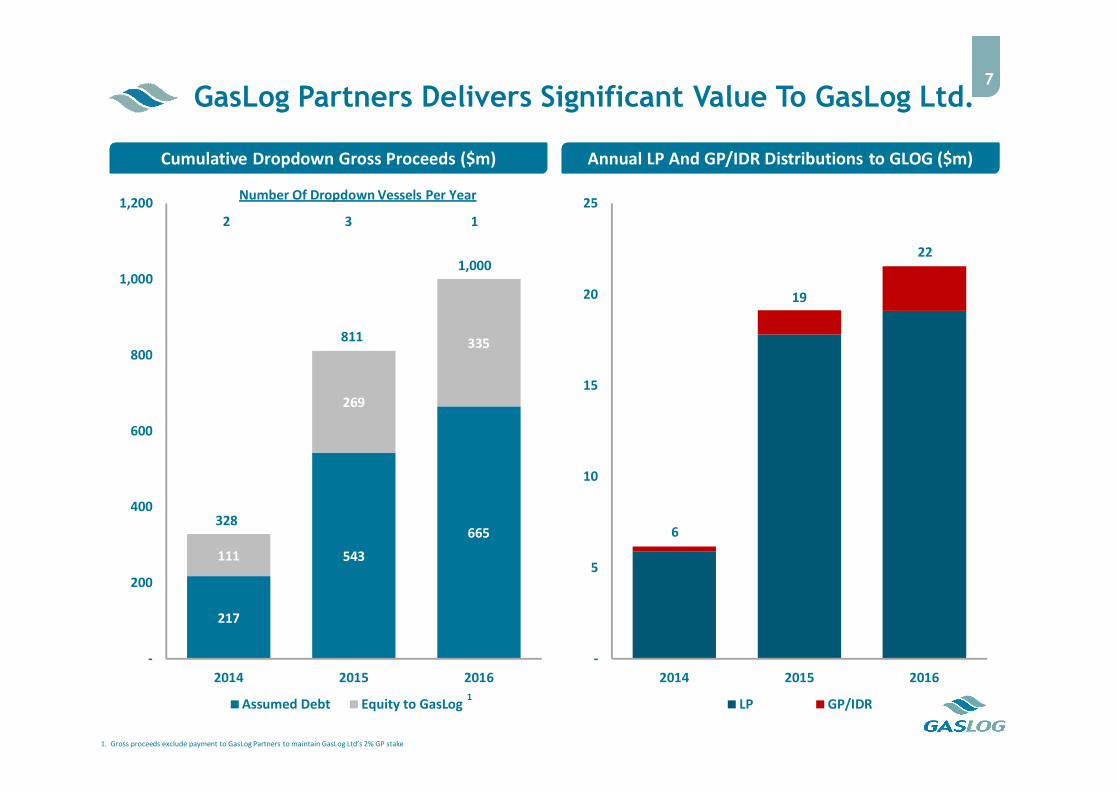
Number Of Dropdown Vessels Per Year
2 3 1
217
543
665
111
269
335
-
200
400
600
800
1,000
1,200
2014 2015 2016
Assumed Debt Equity to GasLog
-
5
10
15
20
25
2014 2015 2016
LP GP/IDR
GasLog Partners Delivers Significant Value To GasLog Ltd.7
Cumulative Dropdown Gross Proceeds ($m) Annual LP And GP/IDR Distributions to GLOG ($m)
1,000
811
3286
19
22
1. Gross proceeds exclude payment to GasLog Partners to maintain GasLog Ltd’s 2% GP stake
1
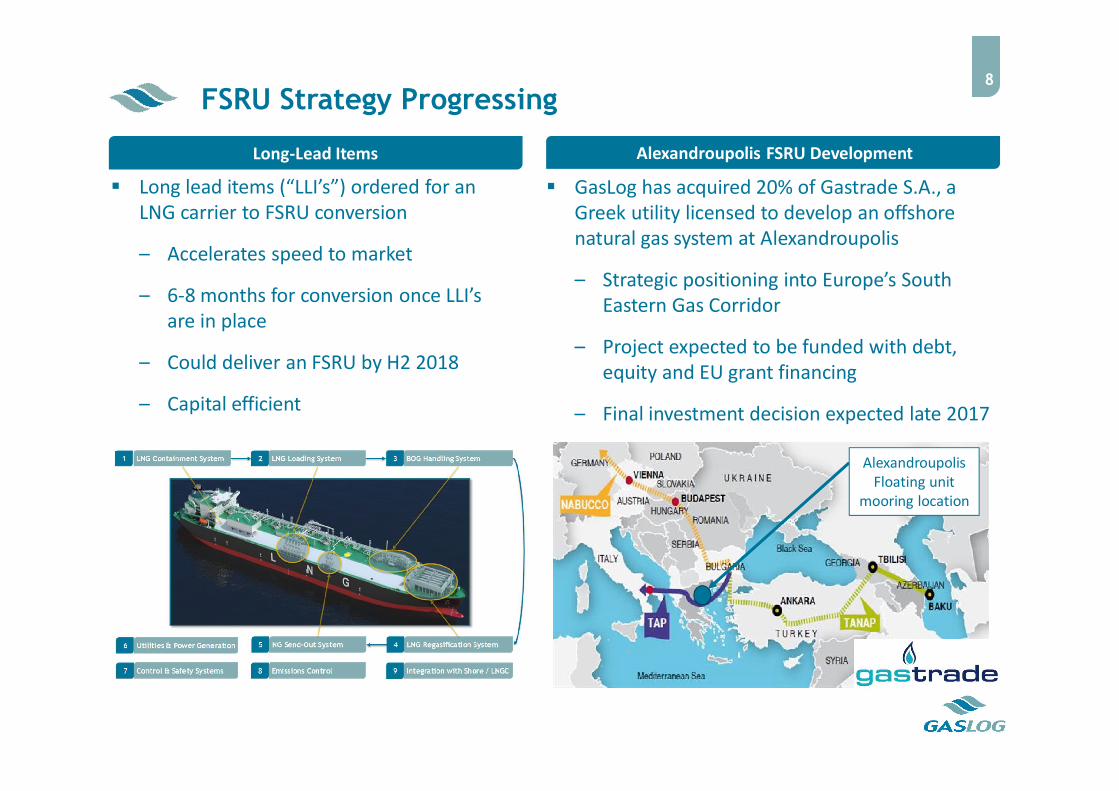
FSRU Strategy Progressing8
Alexandroupolis FSRU DevelopmentLong-Lead Items
Long lead items (“LLI’s”) ordered for an LNG carrier to FSRU conversion
– Accelerates speed to market
– 6-8 months for conversion once LLI’s are in place
– Could deliver an FSRU by H2 2018
– Capital efficient
GasLog has acquired 20% of Gastrade S.A., a Greek utility licensed to develop an offshore natural gas system at Alexandroupolis
– Strategic positioning into Europe’s South Eastern Gas Corridor
– Project expected to be funded with debt, equity and EU grant financing
– Final investment decision expected late 2017
Alexandroupolis Floating unit
mooring location
9
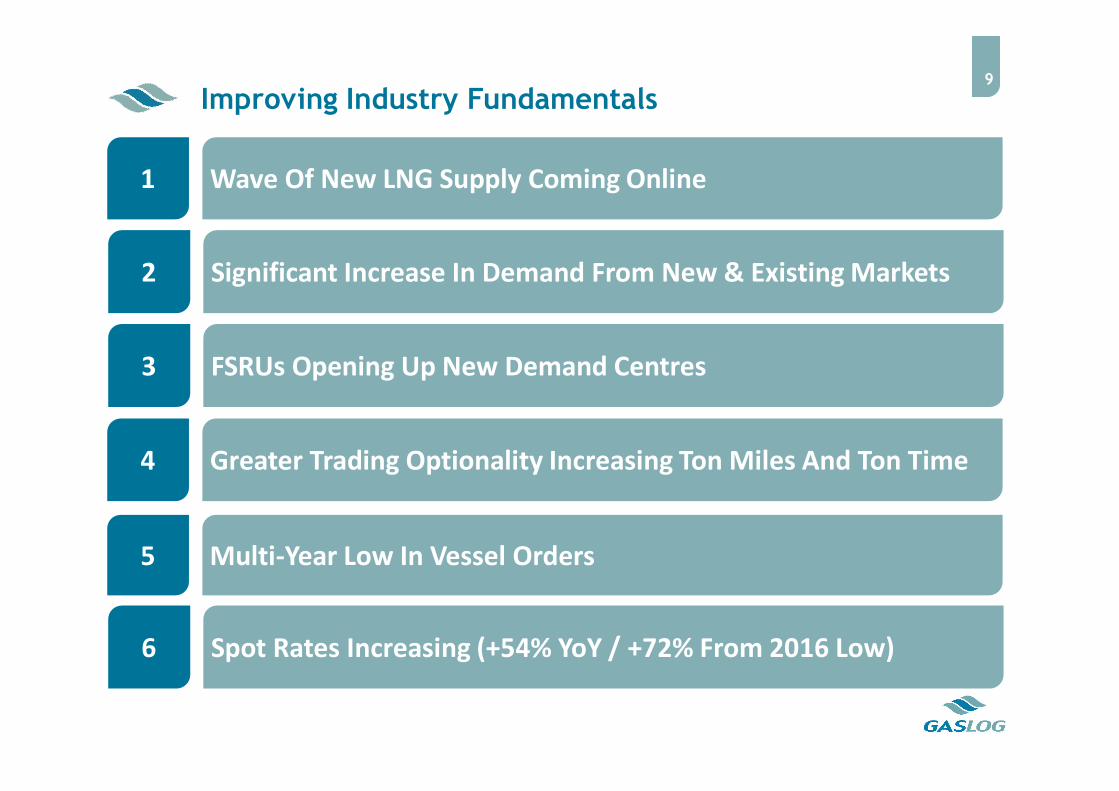
Improving Industry Fundamentals
1 Wave Of New LNG Supply Coming Online
4 Greater Trading Optionality Increasing Ton Miles And Ton Time
5 Multi-Year Low In Vessel Orders
2 Significant Increase In Demand From New & Existing Markets
6 Spot Rates Increasing (+54% YoY / +72% From 2016 Low)
3 FSRUs Opening Up New Demand Centres

0
30
60
90
120
150
0
2
4
6
Au
stralia
Pacific T
1
Au
stralia
Pacific T
2
Gla
dsto
ne
Sab
ine P
ass T1
Go
rgon
Ma
laysia
LNG
T9
Petro
na
s FLNG
1
Sab
ine P
assT2
Go
rgon T2
Go
rgon T3
Ichth
ys T1
Sab
ine P
ass T3
Sen
gkan
g LNG
Whe
atstone
T1
Cam
ero
n LN
G T1
Cam
ero
on
Go
FLNG
Co
ve Poin
t T1
Ichth
ys T2
Pre
lud
e FLNG
Sab
ine P
ass T4
Whe
atstone
T2
Elba
Island
Yam
al T1
Cam
ero
n T2
Cam
ero
n T3
Co
rpu
s Ch
risti T1
Free
po
rt T1
Free
po
rt T2
Sab
ine P
ass T5
Yam
al T2
Co
rpu
s Ch
risti T2
Free
po
rt Train T
3
Yam
al T3
Tanggu
h T3
Petro
na
s FLNG
2
Mill
ion
to
nn
es
pe
r a
nn
um
Mill
ion
to
nn
es
pe
r a
nn
um
2016 2017 2018 2019 2020 Cumulative (Right hand axis)
An LNG Train Every Two Months On Average (2016-20)10
Source: Wood Mackenzie; Poten
~146 million tons per annum of new FID’d liquefaction production coming online 2016-20
All LNG facilities due to start up in 2016 came online during the year
New LNG Supply By Project Start Date
2016 Facilities Operational 2017 Progress
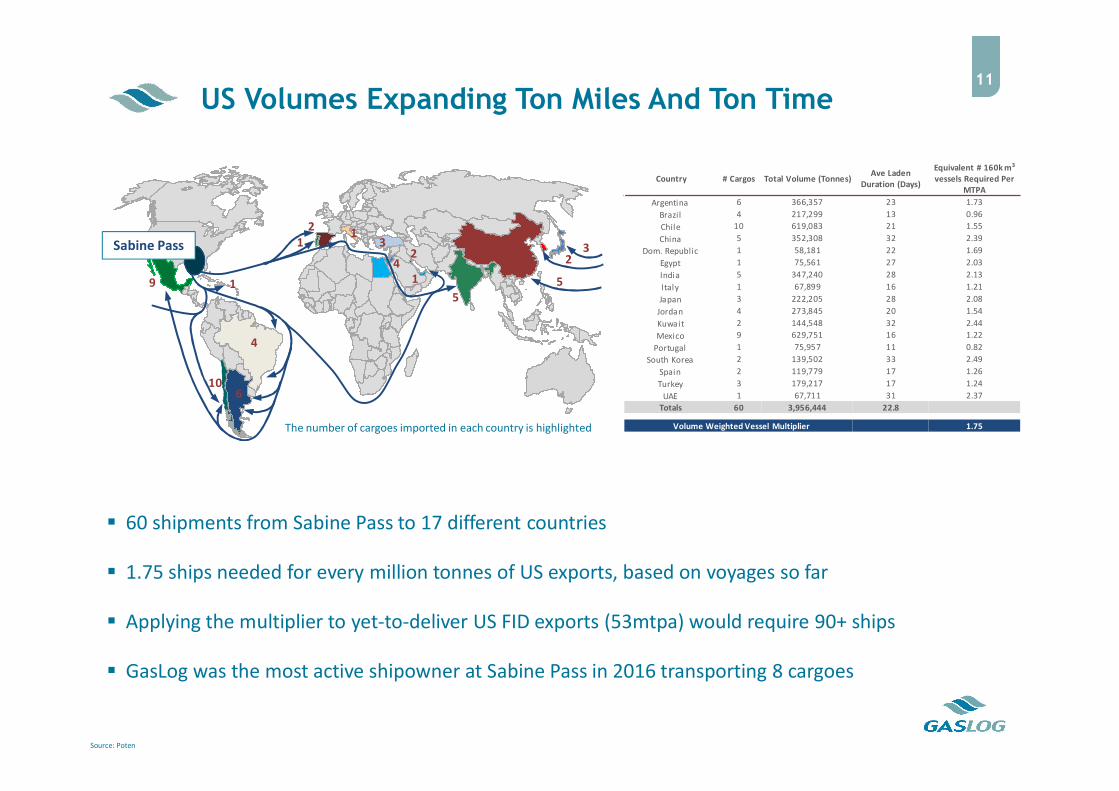
US Volumes Expanding Ton Miles And Ton Time11
Source: Poten
60 shipments from Sabine Pass to 17 different countries
1.75 ships needed for every million tonnes of US exports, based on voyages so far
Applying the multiplier to yet-to-deliver US FID exports (53mtpa) would require 90+ ships
GasLog was the most active shipowner at Sabine Pass in 2016 transporting 8 cargoes
The number of cargoes imported in each country is highlighted
1
4
5
6
2
2
59
10
31
1
41
13
2
Country # Cargos Total Volume (Tonnes)Ave Laden
Duration (Days)
Equivalent # 160k m3
vessels Required Per MTPA
Argentina 6 366,357 23 1.73
Brazil 4 217,299 13 0.96
Chile 10 619,083 21 1.55
China 5 352,308 32 2.39
Dom. Republic 1 58,181 22 1.69
Egypt 1 75,561 27 2.03
India 5 347,240 28 2.13
Italy 1 67,899 16 1.21
Japan 3 222,205 28 2.08
Jordan 4 273,845 20 1.54
Kuwait 2 144,548 32 2.44
Mexico 9 629,751 16 1.22
Portugal 1 75,957 11 0.82
South Korea 2 139,502 33 2.49
Spain 2 119,779 17 1.26
Turkey 3 179,217 17 1.24
UAE 1 67,711 31 2.37
Totals 60 3,956,444 22.8
Volume Weighted Vessel Multiplier 1.75
Sabine Pass
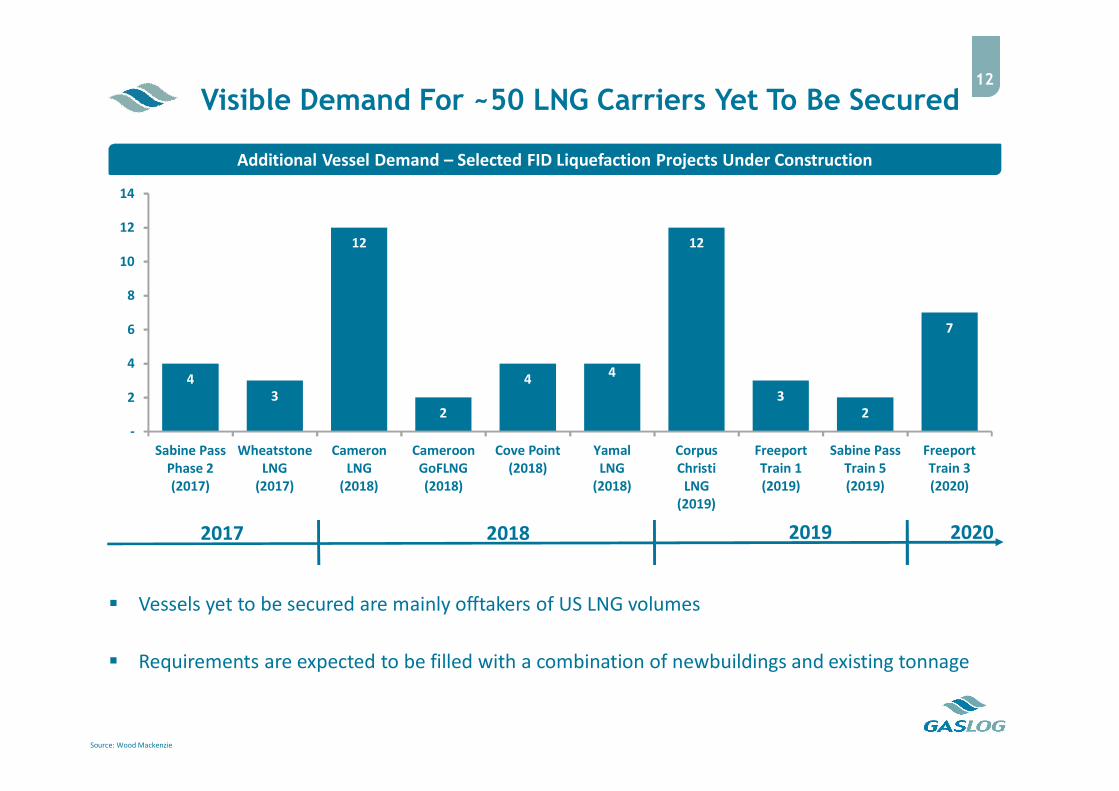
Visible Demand For ~50 LNG Carriers Yet To Be Secured
Vessels yet to be secured are mainly offtakers of US LNG volumes
Requirements are expected to be filled with a combination of newbuildings and existing tonnage
Source: Wood Mackenzie
Additional Vessel Demand – Selected FID Liquefaction Projects Under Construction
12
2017 2018 2019 2020
43
12
2
4 4
12
32
7
-
2
4
6
8
10
12
14
Sabine PassPhase 2(2017)
WheatstoneLNG
(2017)
CameronLNG
(2018)
CameroonGoFLNG(2018)
Cove Point(2018)
YamalLNG
(2018)
CorpusChristi
LNG(2019)
FreeportTrain 1(2019)
Sabine PassTrain 5(2019)
FreeportTrain 3(2020)

13
Source: Poten
Five new LNG carrier orders placed since September 2015
LNG vessels take ~2.5 years to build: An order placed now likely delivers H2 2019+
Some vessel deliveries being pushed back to match project start-up dates
FiveNew LNG
Carrier OrdersSince Sep 2015
New LNG Carrier Orders Placed
New Vessel Orders Continue At Multi-Year Low
57
28
40
66
21
5 --
20
40
60
80
2011 2012 2013 2014 2015 2016 2017 YTD

173
273
0
50
100
150
200
250
300
350
2015 2016
The LNG Spot Market Is Growing And Evolving14
Spot Fixtures
Cool Pool Customers
The LNG shipping spot market continues to evolve as more spot cargoes become available
273 LNG shipping spot fixtures in 2016
– An increase of 53% over 2015 (173 fixtures)
– 88% over 2014 (146 fixtures)
~40 different charterers active in the spot market in 2016
– O&G majors, traders, and LNG projects have all been participants
– More participants expected in 2017

15
Outlook And Objectives For 2017
3 Well Positioned For Market Recovery
1 Grow Revenue Backlog With New And Existing Customers
4 Continue To Access Capital Using GLOP As A Funding Vehicle
2 Further FSRU Progress / FID Of Alexandroupolis
Ongoing Execution Of Our Strategic Objectives

APPENDIX
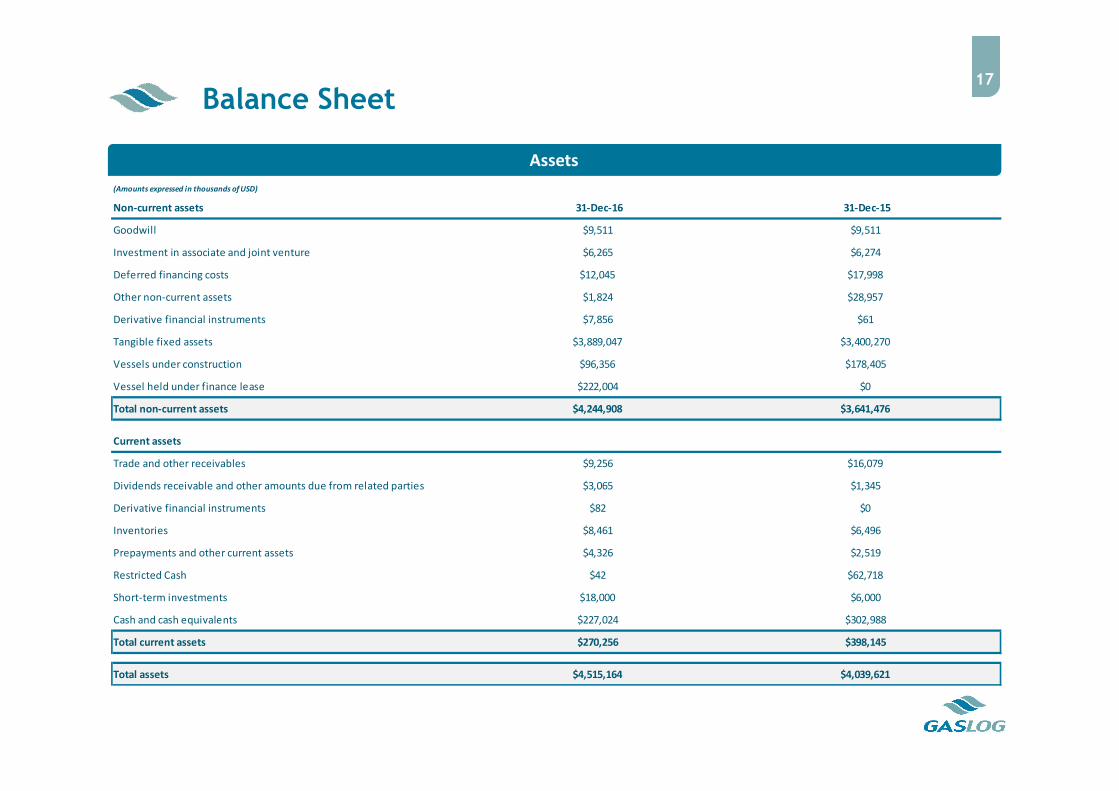
17
(Amounts expressed in thousands of USD)
Non-current assets 31-Dec-16 31-Dec-15
Goodwill $9,511 $9,511
Investment in associate and joint venture $6,265 $6,274
Deferred financing costs $12,045 $17,998
Other non-current assets $1,824 $28,957
Derivative financial instruments $7,856 $61
Tangible fixed assets $3,889,047 $3,400,270
Vessels under construction $96,356 $178,405
Vessel held under finance lease $222,004 $0
Total non-current assets $4,244,908 $3,641,476
Current assets
Trade and other receivables $9,256 $16,079
Dividends receivable and other amounts due from related parties $3,065 $1,345
Derivative financial instruments $82 $0
Inventories $8,461 $6,496
Prepayments and other current assets $4,326 $2,519
Restricted Cash $42 $62,718
Short-term investments $18,000 $6,000
Cash and cash equivalents $227,024 $302,988
Total current assets $270,256 $398,145
Total assets $4,515,164 $4,039,621
Assets
Balance Sheet
18
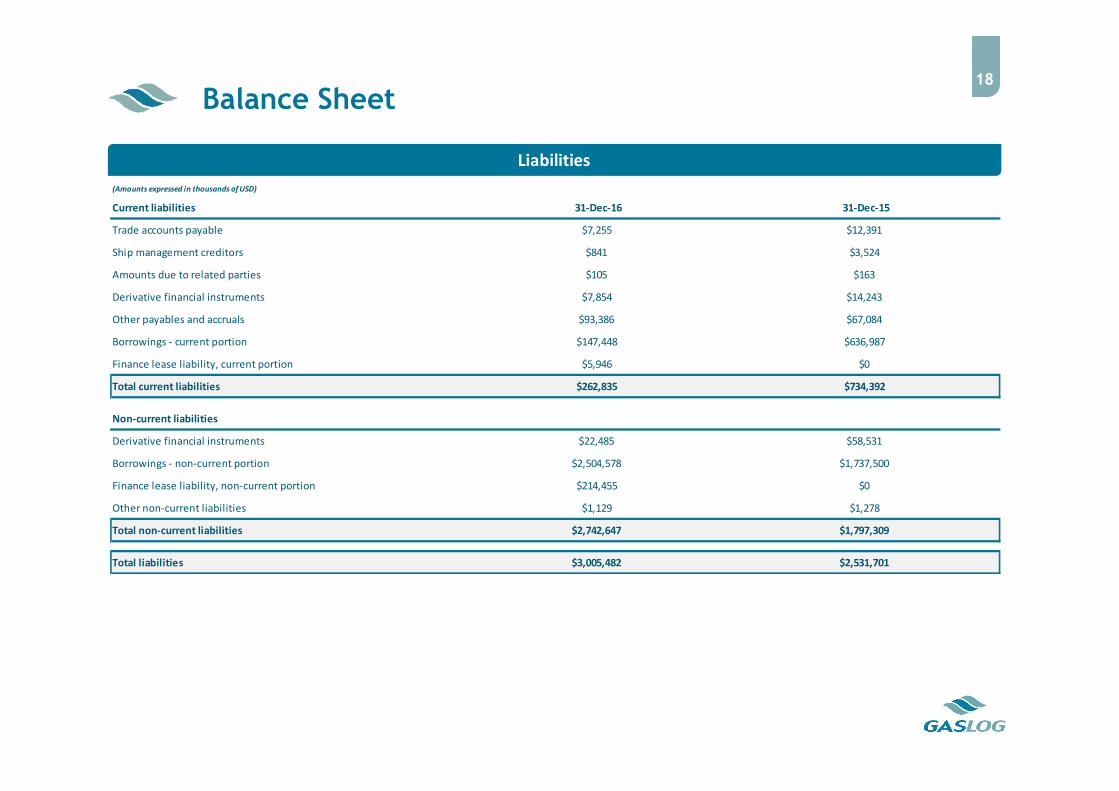
(Amounts expressed in thousands of USD)
Current liabilities 31-Dec-16 31-Dec-15
Trade accounts payable $7,255 $12,391
Ship management creditors $841 $3,524
Amounts due to related parties $105 $163
Derivative financial instruments $7,854 $14,243
Other payables and accruals $93,386 $67,084
Borrowings - current portion $147,448 $636,987
Finance lease liability, current portion $5,946 $0
Total current liabilities $262,835 $734,392
Non-current liabilities
Derivative financial instruments $22,485 $58,531
Borrowings - non-current portion $2,504,578 $1,737,500
Finance lease liability, non-current portion $214,455 $0
Other non-current liabilities $1,129 $1,278
Total non-current liabilities $2,742,647 $1,797,309
Total liabilities $3,005,482 $2,531,701
Liabilities
Balance Sheet
Balance Sheet19
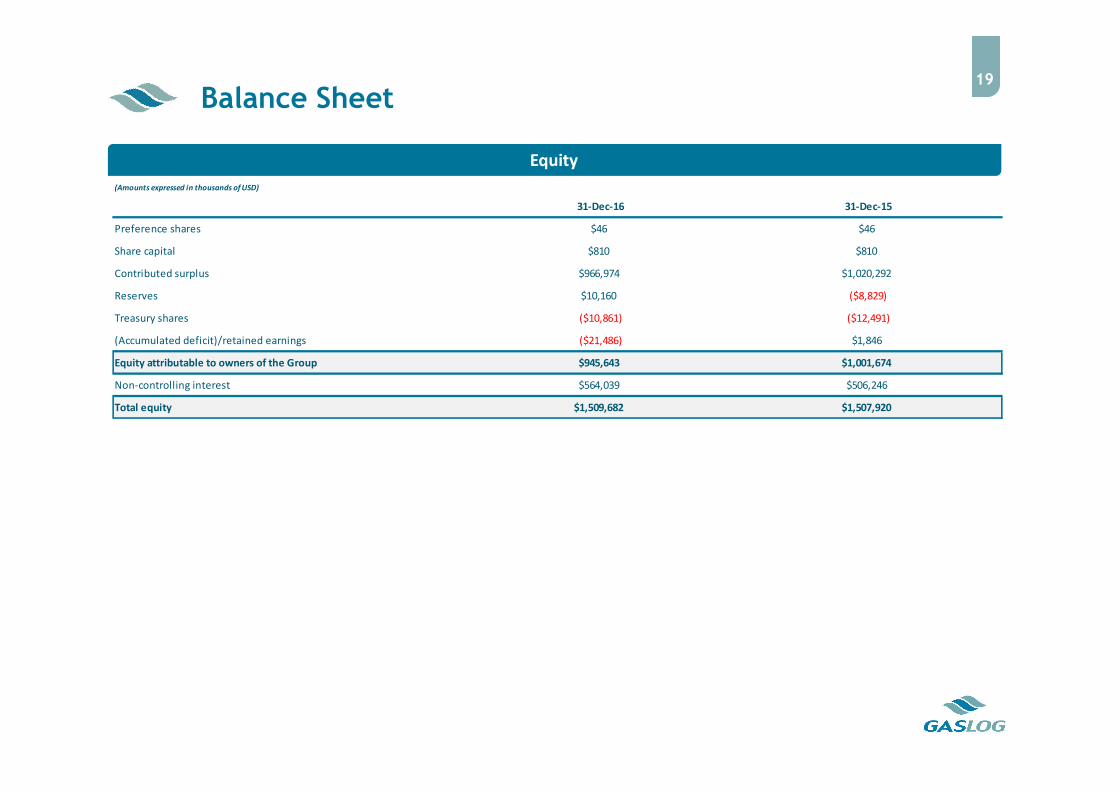
(Amounts expressed in thousands of USD)
31-Dec-16 31-Dec-15
Preference shares $46 $46
Share capital $810 $810
Contributed surplus $966,974 $1,020,292
Reserves $10,160 ($8,829)
Treasury shares ($10,861) ($12,491)
(Accumulated deficit)/retained earnings ($21,486) $1,846
Equity attributable to owners of the Group $945,643 $1,001,674
Non-controlling interest $564,039 $506,246
Total equity $1,509,682 $1,507,920
Equity
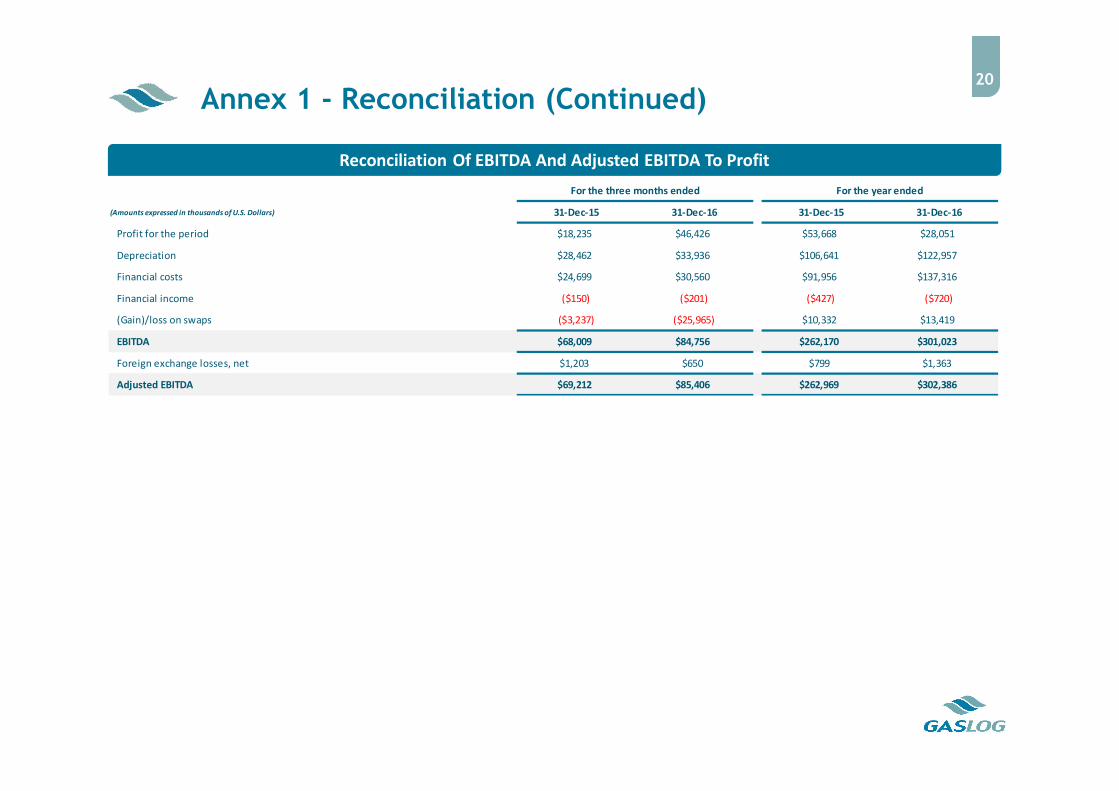
Reconciliation Of EBITDA And Adjusted EBITDA To Profit
Annex 1 - Reconciliation (Continued)20
For the three months ended For the year ended
(Amounts expressed in thousands of U.S. Dollars) 31-Dec-15 31-Dec-16 31-Dec-15 31-Dec-16
Profit for the period $18,235 $46,426 $53,668 $28,051
Depreciation $28,462 $33,936 $106,641 $122,957
Financial costs $24,699 $30,560 $91,956 $137,316
Financial income ($150) ($201) ($427) ($720)
(Gain)/loss on swaps ($3,237) ($25,965) $10,332 $13,419
EBITDA $68,009 $84,756 $262,170 $301,023
Foreign exchange losses, net $1,203 $650 $799 $1,363
Adjusted EBITDA $69,212 $85,406 $262,969 $302,386
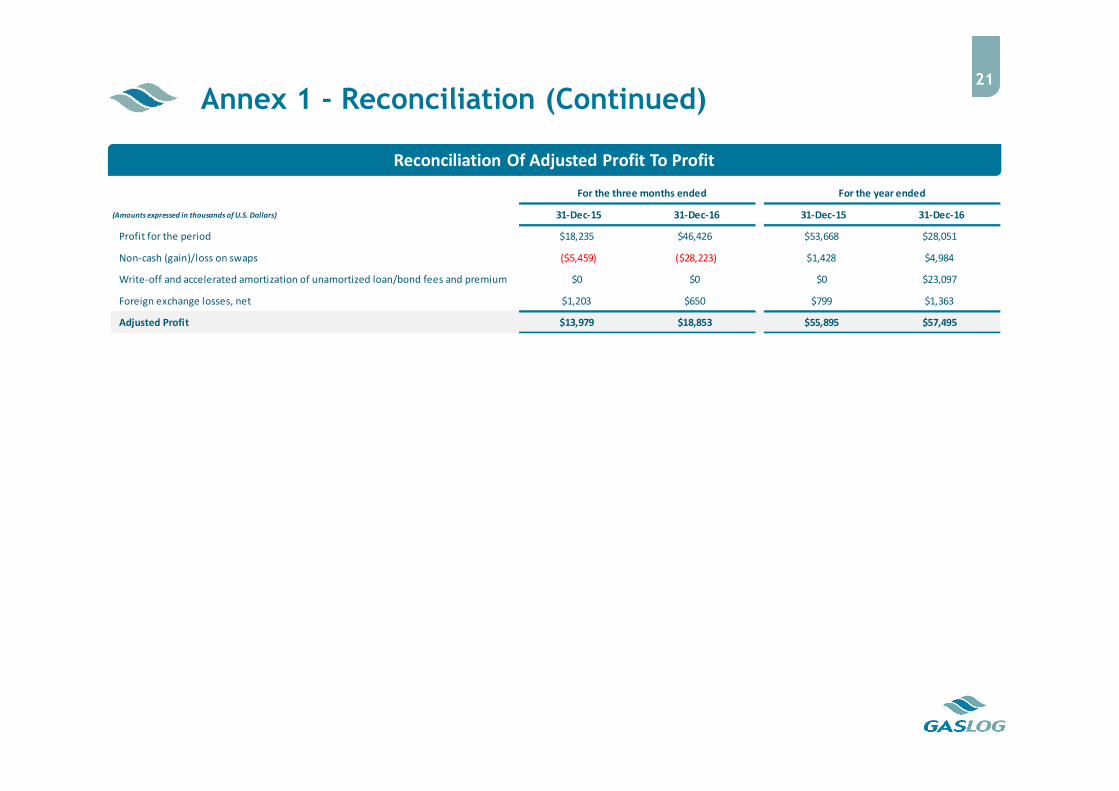
Reconciliation Of Adjusted Profit To Profit
Annex 1 - Reconciliation (Continued)21
For the three months ended For the year ended
(Amounts expressed in thousands of U.S. Dollars) 31-Dec-15 31-Dec-16 31-Dec-15 31-Dec-16
Profit for the period $18,235 $46,426 $53,668 $28,051
Non-cash (gain)/loss on swaps ($5,459) ($28,223) $1,428 $4,984
Write-off and accelerated amortization of unamortized loan/bond fees and premium $0 $0 $0 $23,097
Foreign exchange losses, net $1,203 $650 $799 $1,363
Adjusted Profit $13,979 $18,853 $55,895 $57,495
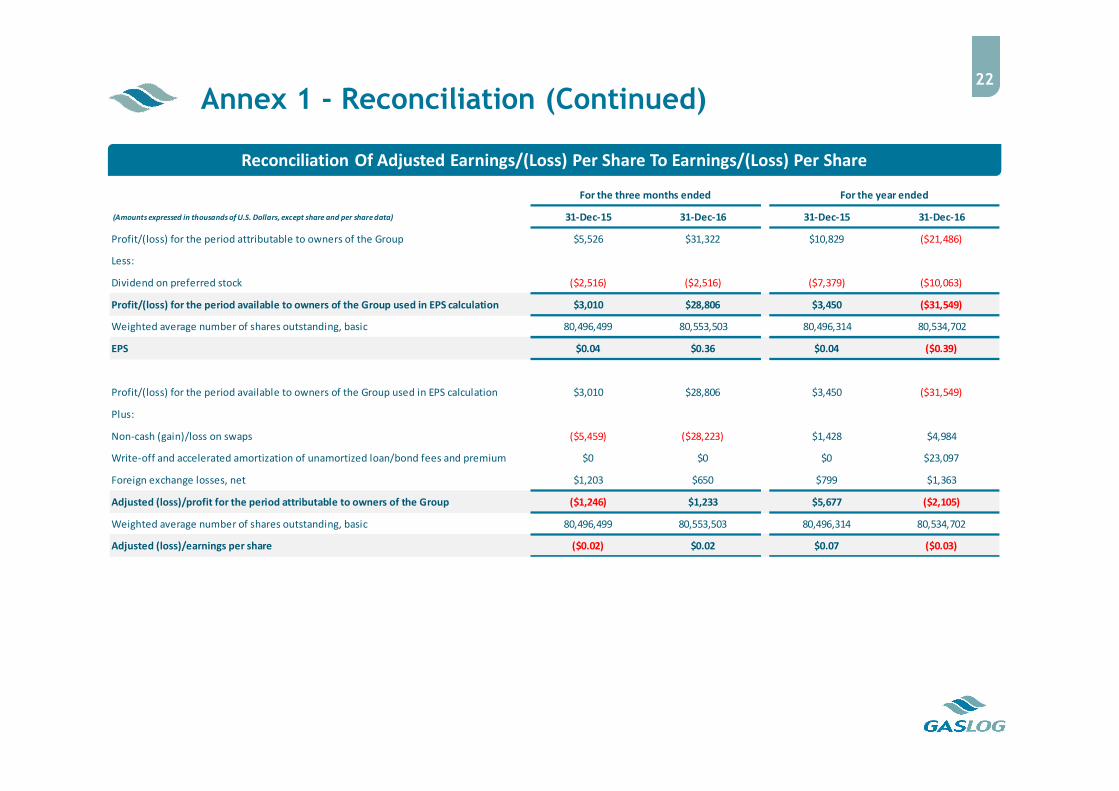
Reconciliation Of Adjusted Earnings/(Loss) Per Share To Earnings/(Loss) Per Share
Annex 1 - Reconciliation (Continued)22
(Amounts expressed in thousands of U.S. Dollars, except share and per share data) 31-Dec-15 31-Dec-16 31-Dec-15 31-Dec-16
Profit/(loss) for the period attributable to owners of the Group $5,526 $31,322 $10,829 ($21,486)
Less:
Dividend on preferred stock ($2,516) ($2,516) ($7,379) ($10,063)
Profit/(loss) for the period available to owners of the Group used in EPS calculation $3,010 $28,806 $3,450 ($31,549)
Weighted average number of shares outstanding, basic 80,496,499 80,553,503 80,496,314 80,534,702
EPS $0.04 $0.36 $0.04 ($0.39)
Profit/(loss) for the period available to owners of the Group used in EPS calculation $3,010 $28,806 $3,450 ($31,549)
Plus:
Non-cash (gain)/loss on swaps ($5,459) ($28,223) $1,428 $4,984
Write-off and accelerated amortization of unamortized loan/bond fees and premium $0 $0 $0 $23,097
Foreign exchange losses, net $1,203 $650 $799 $1,363
Adjusted (loss)/profit for the period attributable to owners of the Group ($1,246) $1,233 $5,677 ($2,105)
Weighted average number of shares outstanding, basic 80,496,499 80,553,503 80,496,314 80,534,702
Adjusted (loss)/earnings per share ($0.02) $0.02 $0.07 ($0.03)
For the year endedFor the three months ended
-
100
200
300
400
500
-
100
200
300
400
500
Q4 Q1 Q2 Q3 Q4 Q1 Q2 Q3 Q4 Q1 Q2 Q3 Q4
2016 2017 2018 2019
Cu
mu
lati
ve P
aym
ents
Fro
m C
ash
($
m)
Cap
ital
Pay
me
nts
In-Q
ua
rte
r ($
m)
Payments From Cash
Anticipated Debt Financing
Committed Debt Financed
Cumulative Payments From Cash
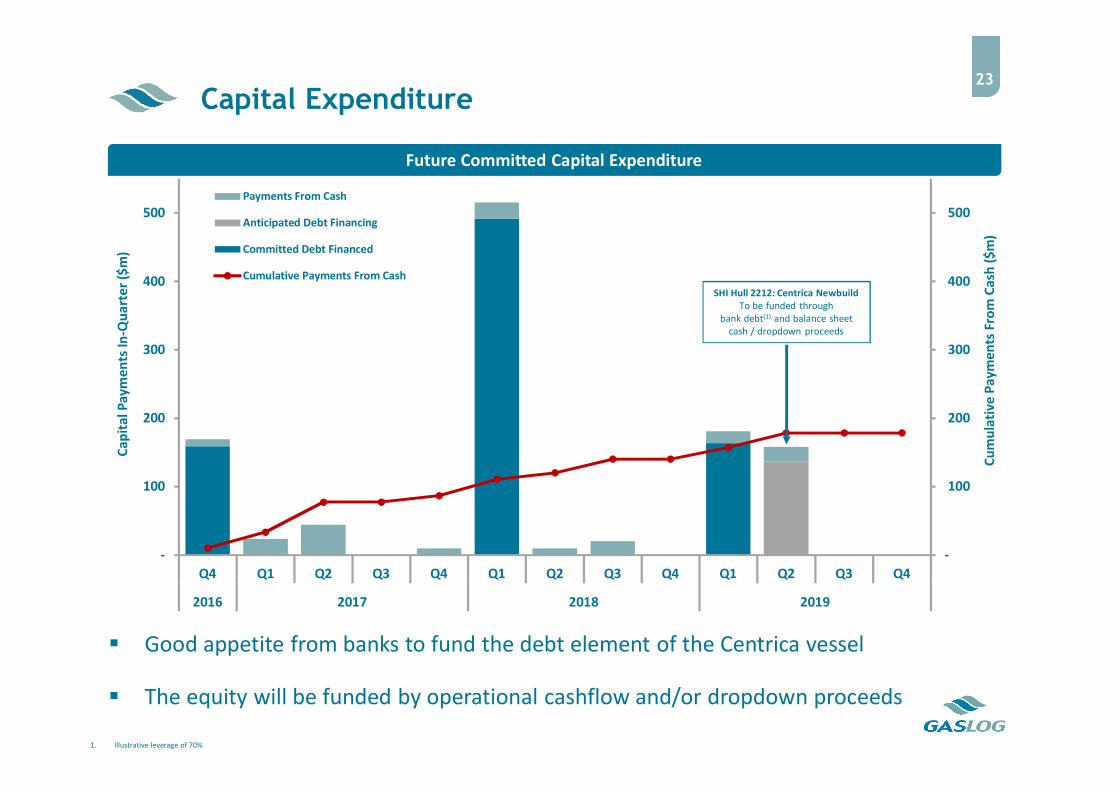
Capital Expenditure23
SHI Hull 2212: Centrica NewbuildTo be funded through
bank debt(1) and balance sheetcash / dropdown proceeds
Good appetite from banks to fund the debt element of the Centrica vessel
The equity will be funded by operational cashflow and/or dropdown proceeds
1. Illustrative leverage of 70%
Future Committed Capital Expenditure
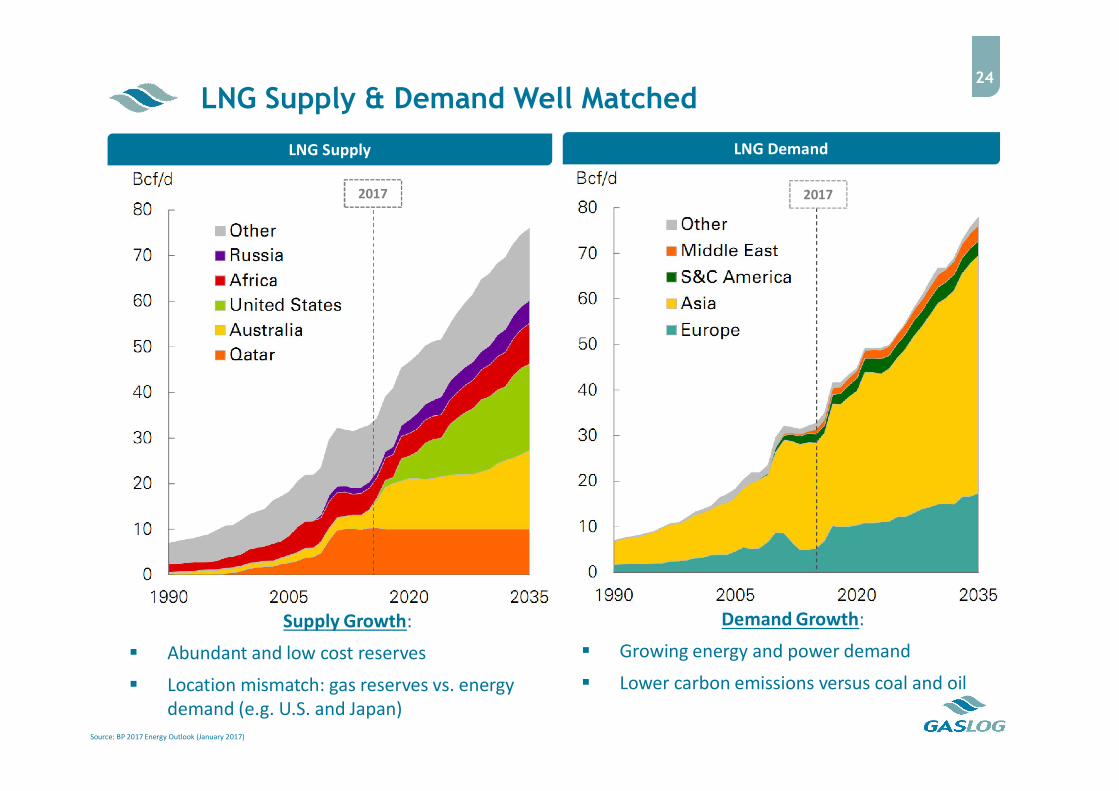
LNG Supply & Demand Well Matched24
Source: BP 2017 Energy Outlook (January 2017)
Supply Growth:
Abundant and low cost reserves
Location mismatch: gas reserves vs. energy demand (e.g. U.S. and Japan)
Demand Growth:
Growing energy and power demand
Lower carbon emissions versus coal and oil
LNG Supply LNG Demand
2017 2017

-
10
20
30
40
50
60
70
2006 2016 2026
Nu
mb
er
of
LN
G I
mp
ort
ing
Na
tio
ns
Number Of Importers Expected To Rise Sharply25
LNG is becoming an increasingly attractive alternative to coal and oil (climate/emissions targets)
Significant increases in LNG demand from China (+40%) and India (+29%) in 2016
New importers in the last 2 years: Poland, Lithuania, Pakistan, Jordan, Egypt, Columbia, Jamaica
Expected importers in the near future include Bahrain, South Africa, Bangladesh etc.
Source: Wood Mackenzie; Poten
Already Identified
Risked potential
LNG Importing Countries

Pipeline Of Future Projects Support Long Term Demand
Pipeline of future projects supports further additional shipping requirement in the future
North America and Africa will be areas of development
Mix of greenfield and expansion projects; or debottlenecking of existing projects
Source: Wood Mackenzie
Vessel Demand – Future FID Liquefaction Projects (Pre-FID)
26
1
3
21
2 2
6
12
4
1
11
10
21
5
-
2
4
6
8
10
12
Asi
aPac
De
bo
ttle
ne
ckin
g
Afr
ica
FLN
G
Afr
ica
FLN
G
Asi
aPac
De
bo
ttle
ne
ckin
g
Asi
aPac
Exp
an
sio
n
N A
me
rica
Gre
en
fie
ld
N A
me
rica
Gre
en
fie
ld
Ru
ssia
Exp
an
sio
n
Asi
aPac
Exp
an
sio
n
N A
me
rica
Exp
an
sio
n
Asi
aPac
De
bo
ttle
ne
ckin
g
Afr
ica
Gre
en
fie
ld
N A
me
rica
Gre
en
fie
ld
Afr
ica
FLN
G
Afr
ica
FLN
G
N A
me
rica
Exp
an
sio
n
![· @e] fid\ XelXc](https://static.fdocuments.us/doc/165x107/5c04b62e09d3f2183a8c24fe/-e-fid-xelxc-.jpg)