GASIFICATION TECHNOLOGIES ADVANCEMENT SESSION · $2 M for coal distribution after feeder 40%...
31
SUCCESSFUL CONTINUOUS INJECTION OF COAL INTO GASIFICATION SYSTEM OPERATING PRESSURES EXCEEDING 500 PSI - DOE FUNDED PROGRAM RESULTS Authors: Authors: Derek Aldred, Timothy Saunders Derek Aldred, Timothy Saunders - - Stamet Inc., Stamet Inc., Michael Michael Rutkowski Rutkowski – – Parsons Inc. Parsons Inc. Gasification Technology Council Conference Gasification Technology Council Conference October 9-12, 2005 GASIFICATION TECHNOLOGIES ADVANCEMENT SESSION
Transcript of GASIFICATION TECHNOLOGIES ADVANCEMENT SESSION · $2 M for coal distribution after feeder 40%...
SUCCESSFUL CONTINUOUS INJECTION OF COAL INTO GASIFICATION SYSTEM
OPERATING PRESSURES EXCEEDING 500 PSI -DOE FUNDED PROGRAM RESULTS
Authors:Authors: Derek Aldred, Timothy Saunders Derek Aldred, Timothy Saunders -- Stamet Inc., Stamet Inc., Michael Michael RutkowskiRutkowski –– Parsons Inc. Parsons Inc.
Gasification Technology Council ConferenceGasification Technology Council Conference
October 9-12, 2005
GASIFICATION TECHNOLOGIES ADVANCEMENT SESSION

DOE Advanced Gasification Objectives:DOE Advanced Gasification Objectives:
• Expanding Coal-based power production.
• Efficient use of fossil-fuel resources, particularly coal.
• Minimizing emissions.
• Higher operating pressures for improved performance.
• Commercial acceptance.

Gasification Feed System Objectives:Gasification Feed System Objectives:
• Simple, accurate and reliable.
• Controlled and continuous delivery of fuel.
• Minimized gas losses.
• Eliminate high maintenance costs and downtime risks of existing feed systems.
• Inject at pressures at and beyond 500 PSI (34 Bar).

Stamet Stamet ““PosimetricPosimetric®”®” Pump TechnologyPump Technology
• Unique concept named for “Positive Metering” of solids. Invented for oil shale gasifier feeding.
•One simple continuously rotating element, comprising two discs and a hub, and providing precise solids flow control.
•Configured machines can deliver solids directly into atmospheric or pressurized environments.

Posimetric Pressure Pump ConfigurationPosimetric Pressure Pump Configuration

First Posimetric First Posimetric Pressure FeederPressure Feeder
•Development Funded by US DOE Clean Coal Program (1994)
•Feeder achieved then record coal injection pressure - over 250 PSI (17 Bar) gas environment
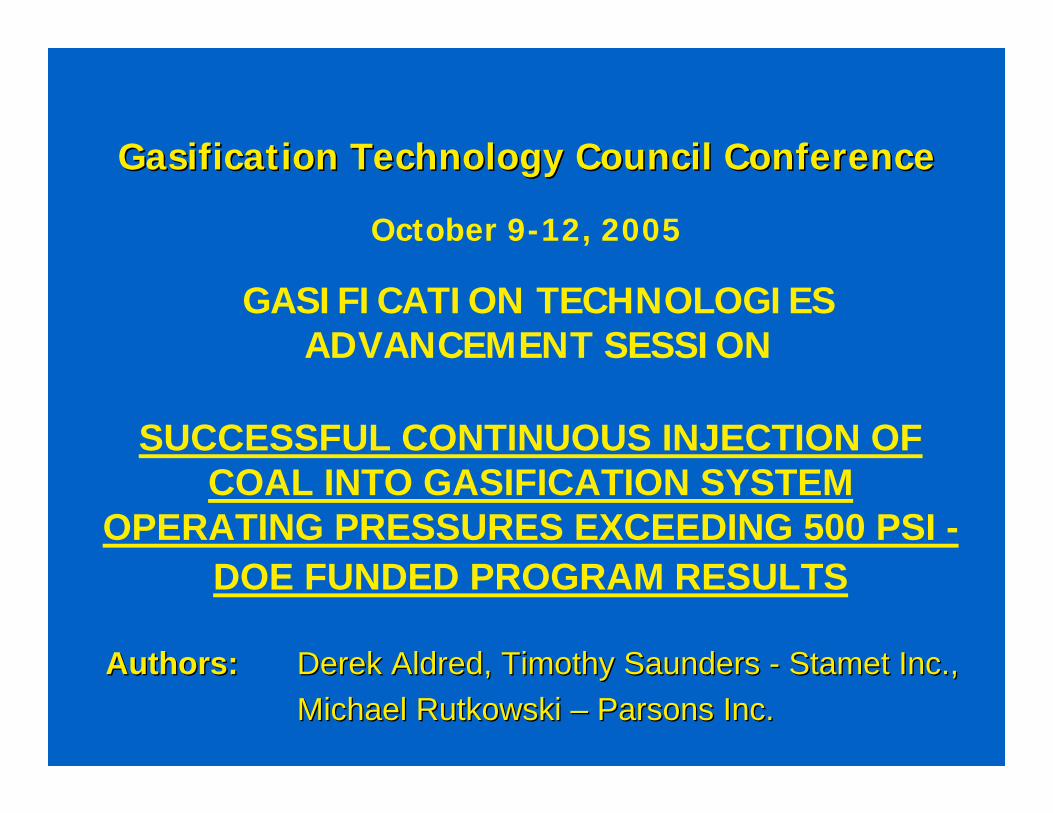
DOE Research ProgramDOE Research Program
• Three Phase Program, Five Year Schedule
Phase 1 - Define industry needs- Identify typical coal specifications- Select commercial fuel for feeder tests – PRB!- Develop semi-scale 300 PSI pressure feeder
Phase 2 - Develop semi-scale 500 PSI pressure feeder- GA design for commercial 500 PSI feeder
Phase 3 - Develop 1000 PSI pressure feeder

Test Feeder Spool AssemblyTest Feeder Spool Assembly
• Shaft
• 2 Discs (18” ø)
• Hub Spacer (1.25”)
• 1 Bearing (of 2)

Test Feeder Rig AssemblyTest Feeder Rig Assembly
• Compact for portability
• Tested at multiple locations
• 600 Psi (40 Bar) Vessel pressure rating

Phase 1 Successful Gas Pressure RunPhase 1 Successful Gas Pressure Run
First Run to 300psi
0
50
100
150
200
250
300
350
0 10 20 30 40
Time
Pres
sure
, psi
g
0
5000
10000
15000
20000
25000
30000
Torq
ue
Pout psiTorque ft/lb 300psi Achieved
24 Bar >
<33900 Nm
Torque

Phase 1 AchievementsPhase 1 Achievements
• Successful Feed into 300psi (20 Bar) Gas Pressure
• Torque Reduced 25%
• Linear Delivery across Full Pressure Range
• Design Achieved High Grip - Potential for Reduced Machine Size

Phase 2 Flow AnalysisPhase 2 Flow Analysis
• Clear outboard disc
• Beads used to identify internal flow patterns
• Visual confirmation of outlet modification effects

Phase 2 Outlet ChangesPhase 2 Outlet Changes
• 3D techniques used to produce smooth flow transition for coal exiting discs
• Outlet length reduced progressively to determine effect on torque
• Close monitoring of gas leak-rate for each change

Phase 2 Success!Phase 2 Success!

Phase 2 FlowPhase 2 Flow--rate Linearityrate Linearity02-113 DOE Pressure Injection -
Test 216. Feeding at 500 psi
010
20304050
607080
90100
0 10 20 30 40 50
Cumulative Revs
Wei
ght P
umpe
d, lb
s
0
100
200
300
400
500
600
700
Out
let P
ress
ure,
psi
/ %
Sp
eed
.
Outlet Pressure
Weight Pumped
% Speed
< 48 Bar45 Kg >

Phase 2 Gas ConsumptionPhase 2 Gas Consumption
Make-up Gas Consumption vs Outlet Pressure
0
0.25
0.5
0.75
1
1.25
1.5
200 250 300 350 400 450 500 550Outlet Pressure, psi
Mak
e-up
Gas
Con
sum
ptio
n, s
cfm
^38 Bar
0.04 M3 >

Phase 2 Geometry Optimization ResultsPhase 2 Geometry Optimization Results
Outlet Pressure vs Drive Torque Requirements
02000400060008000
100001200014000160001800020000
0 100 200 300 400 500 600Outlet Pressure, psig
Driv
e To
rque
, ft.l
bs.
Phase 1 Start
Phase 1 Final
Phase 2
^41 Bar
27000 Nm>

Phase 2 Fuel Flexibility TestsPhase 2 Fuel Flexibility Tests
• Gasifiers have capability for wide range of coal/fuels.
• Feeder must have similar capability.
• Fuel samples successfully tested;– PRB
– Eastern Bituminous
– Lignite

Lignite TestLignite Test
<24000 Nm41 Bar >

Phase 2 AchievementsPhase 2 Achievements
• Record pressure level achieved – 560 PSI (38 Bar).
• Very consistent coal feed performance.
• Torque reduced 70% over Phase 1.
• Continued linear output against pressure.
• No problems stopping or starting against pressure.
• Coal at outlet little changed from that at inlet.
• Fuel flexibility confirmed with PRB, Bit and Lignite

Phase 2 DeliverablesPhase 2 Deliverables
• Commercial feeder design produced.
• Semi-commercial test location arranged.
• Test feeder hopper & sensors upgraded for longer term test

Economic Benefit AnalysisEconomic Benefit Analysis
• Pump Performance data Provided to DOE
• DOE/Parsons Produced Benefits Analysis
• Study of Capital and operating cost Savings for Transport and Oxygen Blown (Shell) Gasifiers

Economic BenefitsEconomic Benefits
• Eliminate Coal Slurrying/Drying
• Lower Equipment Costs
• Lower Plant Height, Less Structural Cost
• Eliminate Make-up Gas Consumption
• Simplified Control System, Higher Reliability
• Stabilized Gasifier Operation

Plant Capital Cost AnalysisPlant Capital Cost Analysis
Shell Gasifier IGCC
Design Basis: Single Train GasifierCapacity to Fuel GE 7FA Gas Turbine$2 M for coal distribution after feeder40% engineering contingency for Stamet case
Dry Feed StametPrep & Feed Aux Power, kW 770 1,000
Plant Net Power Rating, Mwe 259 260
Coal Feed Type: Pittsburgh No. 8 Pittsburgh No. 8
Coal Feed Rate: 164,337 lb/hr 163,821 lb/hr
Operating Pressure: 450 psig 450 psig

Plant Capital Cost AnalysisPlant Capital Cost Analysis
Shell Gasifier IGCC
Plant Area ($000’s) Design W/Stamet
Coal Prep and Feed 35,670 11,856Engineering & Contingency 8,918 4,742Auxiliary Power 1,001 1,300TOTAL CAPITAL COSTS 45,589 17,898
Balance of Gasifier Island 112,661 112,661Total Gasifier Island 158,249 130,559
TOTAL GASIFIER ISLAND ($/kW) 611 501

Plant Capital Cost AnalysisPlant Capital Cost Analysis
Transport Gasifier
Design Basis: Dual Train GasifiersCapacity to Fuel GE 7FA Gas Turbine$1 M/gasifier added internal equipment cost40% engineering contingency for Stamet case
Dry Feed Stamet
Prep & Feed Aux Power, kW 3,140 7,283
Plant Net Power Rating, Mwe 302 301
Coal Feed Type: Wyodek-Anderson PRB Wyodek-Anderson PRB
Coal Feed Rate: 301,407 lb/hr 299,663 lb/hr
Operating Pressure: 450 psig 450 psig

Plant Capital Cost AnalysisPlant Capital Cost Analysis
Transport Gasifier
Plant Area ($000’s) Design W/Stamet
Coal Prep and Feed 44,409 17,008Engineering & Contingency 11,102 6,803Auxiliary Power 4,082 9,468TOTAL CAPITAL COSTS 59,594 33,279
Balance of Gasifier Island 72,774 72,774Total Gasifier Island 132,368 106,054
TOTAL GASIFIER ISLAND ($/KW) 438 352

Plant Operating Cost AnalysisPlant Operating Cost Analysis
Shell Gasifier IGCC
Plant Output (kWe) Design W/StametGas Turbine Power 197,000 197,000
Steam Turbine Power 105,292 107,600
Auxiliary Load 43,150 44,240
Net Plant Power 259,142 260,360
Net Plant Efficiency (HHV) 40.6% 40.9%
Net Plant Heat Rate (HHV) 8,411 8,345

Plant Operating Cost AnalysisPlant Operating Cost Analysis
Transport Gasifier
Plant Output (kWe) Design W/StametGas Turbine Power 197,000 197,000
Steam Turbine Power 140,540 144,000
Auxiliary Load 35,770 39,923
Net Plant Power 301,770 301,077
Net Plant Efficiency (HHV) 40.5% 40.7%
Net Plant Heat Rate (HHV) 8,416 8,386

Phase 3 ProgramPhase 3 Program
• Work commenced July 2005
• 1000 PSI (69 Bar) target.
• Further torque reductions from optimization
program.
• Sensor/controls upgrades for near-commercial
operation

Commercial ProgramCommercial Program
• Operating plant test with 500 PSI (34 Bar)
feeder late 2005, early 2006.
• 1300 PSI (90 Bar) commercial feeder
requested, delivery 2007.