Gas Turbines waste heat/power recovery in tropical climate ...
14
M: 58 Mansoura Engineering Journal, (MEJ), Vol. 40, Issue 4, December 2015 Received: 23 June, 2015 – Revised – 14 July - Accepted: 1 November, 2015 Gas Turbines waste heat/power recovery in tropical climate zones: Case study ارةدة الحرستعا ا/ ى تعمل فى التلغازيتث التربينا القذرة المبذدة فى است حالترة : درالحاطق المنا اA.M.K. El-Ghonemy High Institute of Engineering and Textile Technology, Egypt Email: [email protected] ملخص ال) طح انجىفيح( ح انسؼىديحهكح انؼشتيح تاننكائطح انرىنيذ انكهشتيح ا يححث ػه ذى ذطثيق هزا انث– ي ذركى7 اخ غاصيح تطاقح ذشتي52 زم ي ذؼ واخ نهىحذج انىاحذج وانريجا ي8991 - ضاف تا تطاقحذي وحذ ح ان15 واخ نهىحذجيجا ينضاغظ اثشيذ انهىاء انذاخم انظىيح ذ انىاحذج يضودج ت– ز ي ذؼ5007 نغاصيح فخ اااخ انرشتيىنيذ رخ انر يحطاهيح ػهء قياساخ ػطىاخ اجشا كيفيح وخ ػه ػ تياحث انذف هزا انث يه انرشغثم يىاقغ– داط وذقييى ا تغشض قيايىره تانرص ء نها ويقاس انقذسج انكهشتيحثهح فح ينغاصيخ ااخ انرشتيحطاداء ن قيى ا ػهرائحهد ان نقذ اشر– ضافح تانكيهى ويؼذل انحشاسج انطححخرهفح نهل اناحذ اخ ساػح ػم كيهىوا جىل نك. وايحي انرصذهاظيشاداء انفؼهيح تخ ااح تياضا ذى يقاس أي نريى انرص انجى ػع حشاسجسذفا تسثة ااههحىظا تيػذا ي أوضحد ذثا. ذطح ػحاسح تأفضهيح ذشغيم ان أوصد انذس أيضا يشذفؼح قشيثحال ي أح800 رنكا أيكقرصاديح كهب اسثا % - ح انرثشيذظىيضافح يح تضشوسج ااس أخيشا أوصد انذسدو انرشتيو ػاسرخذانجىي تاهىاء ا نه اننؼادوع حشاسج اسرشجازنك ا فقذ انقذسج وكشنك نرح ور – نرثاػذ اش ذكذئز ي ػنحاسجطق اا ان فيداء انرصصيح وانغاخ اا نهرشتيداء انفؼه اهحىظ تي ان. Abstract The present study is applied on the gas turbines power plant that is currently under operation in northern kingdom of Saudi Arabia (KSA) since 1998. The plant consists of 7 gas turbine of 25MW each without inlet air cooling. More 2 gas turbine of 82MW each with inlet air cooling were added in Dec 2007. In this area, during summer season, the ambient temperature may reach 50 °C, or higher in July and August. The objective is to present field results of this gas turbines power plant operation in order to measure and evaluate the performance. The results showed that, operating the plant at higher loads near to 100% is recommended for economic considerations, heat /power recovery by cooling the inlet air is advised, to overcome the problem of electricity black-out. Finally the results showed that disagreement between design and measured performance values is mainly due to higher ambient temperatures. Key words Gas turbines, power plant, Case study 1-Introduction The gas‐turbine (GT) operates on the principle of the Brayton cycle, where the mixture of compressed air and fuel (natural gas or fuel oil) is burned at constant pressure. The resultant hot gas is used to expand through a turbine to get work. More than 50 percent of the turbine power is consumed by the air compressor [1]. The simple cycle gas turbine is the most common type with efficiencies ranging from 30 to 40 percent (8968‐11606 kJ/kWh) [1-9]. The GT plant performance is indicated by two Parameters, Power output ( ̇ ) and Heat rate (HR in kJ/kWh [1-9]. At present, GT efficiencies are in the range of 45-50% (a heat rate of 8000KJ/KWh to 7199KJ/KWh). Using a new metallurgy,
Transcript of Gas Turbines waste heat/power recovery in tropical climate ...

M: 58 Mansoura Engineering Journal, (MEJ), Vol. 40, Issue 4, December 2015
Received: 23 June, 2015 – Revised – 14 July - Accepted: 1 November, 2015
Gas Turbines waste heat/power recovery in tropical
climate zones: Case study
القذرة المبذدة فى التربيناث الغازيت التى تعمل فى /استعادة الحرارة
المناطق الحارة : دراست حالت
A.M.K. El-Ghonemy
High Institute of Engineering and Textile Technology, Egypt
Email: [email protected]
الملخص 7ذركىٌ يٍ –ذى ذطثيق هزا انثحث ػهً يحطح انرىنيذ انكهشتيح انكائُح تانًًهكح انؼشتيح انسؼىديح )يحطح انجىف (
ييجا واخ نهىحذج 15ح انً وحذذيٍ تطاقح تالاضاف - 8991ييجا واخ نهىحذج انىاحذج وانرً ذؼًم يُز 52ذشتيُاخ غاصيح تطاقح
5007ذؼًلاٌ يُز –انىاحذج يضودج تًُظىيح ذثشيذ انهىاء انذاخم انً انضاغظ
يهذف هزا انثحث انً تياٌ ػًهً ػٍ كيفيح وخطىاخ اجشاء قياساخ ػًهيح ػهً يحطاخ انرىنيذ راخ انرشتيُاخ انغاصيح فً
ء نها ويقاسَره تانرصًيى تغشض قياط وذقييى الأدا –يىاقغ انرشغثم
ويؼذل انحشاسج انًضافح تانكيهى –نقذ اشرًهد انُرائح ػهً قيى الأداء نًحطاخ انرشتيُاخ انغاصيح يًثهح فً انقذسج انكهشتيح
نرً أيضا ذى يقاسَح تياَاخ الأداء انفؼهيح تُظيشاذها انرصًيًيح وا .جىل نكم كيهىواخ ساػح ػُذ الأحًال انًخرهفح نهًحطح
أيضا أوصد انذساسح تأفضهيح ذشغيم انًحطح ػُذ .أوضحد ذثاػذا يهحىظا تيُهًا تسثة اسذفاع حشاسج انجى ػٍ انرصًيى
أخيشا أوصد انذساسح تضشوسج اضافح يُظىيح انرثشيذ -% لأسثاب اقرصاديح كهًا أيكٍ رنك 800أحًال يشذفؼح قشيثح يٍ
ػُذئز يًكٍ ذلاشً انرثاػذ –ُح ورنك نرلاشً فقذ انقذسج وكزنك اسرشجاع حشاسج انؼادو انً نههىاء انجىي تاسرخذاو ػادو انرشتي
.انًهحىظ تيٍ الأداء انفؼهً نهرشتيُاخ انغاصيح والأداء انرصًيًً فً انًُاطق انحاسج
Abstract The present study is applied on the gas turbines power plant that is currently under operation in northern
kingdom of Saudi Arabia (KSA) since 1998. The plant consists of 7 gas turbine of 25MW each without inlet air
cooling. More 2 gas turbine of 82MW each with inlet air cooling were added in Dec 2007. In this area, during
summer season, the ambient temperature may reach 50 °C, or higher in July and August. The objective is to present
field results of this gas turbines power plant operation in order to measure and evaluate the performance. The results
showed that, operating the plant at higher loads near to 100% is recommended for economic considerations, heat
/power recovery by cooling the inlet air is advised, to overcome the problem of electricity black-out. Finally the
results showed that disagreement between design and measured performance values is mainly due to higher ambient
temperatures.
Key words Gas turbines, power plant, Case study
1-Introduction The gas‐turbine (GT) operates on the
principle of the Brayton cycle, where the
mixture of compressed air and fuel (natural
gas or fuel oil) is burned at constant
pressure. The resultant hot gas is used to
expand through a turbine to get work. More
than 50 percent of the turbine power is
consumed by the air compressor [1]. The
simple cycle gas turbine is the most common
type with efficiencies ranging from 30 to 40
percent (8968‐11606 kJ/kWh) [1-9].
The GT plant performance is indicated
by two Parameters, Power output ( ̇) and
Heat rate (HR in kJ/kWh [1-9]. At present,
GT efficiencies are in the range of 45-50%
(a heat rate of 8000KJ/KWh to
7199KJ/KWh). Using a new metallurgy,

A.M.K. El-Ghonemy M: 59
advanced thermal barrier coating and
advanced cooling system for blades, the
fired inlet temperatures can be high as
1427C and PRs of 40:1[1-5, 31].
Site conditions especially ambient
temperature has a strong influence on the gas
turbine performance. However, in tropical
climate zones, about up to 20% loss in
power is possible due to the high ambient
temperature. So, some researches [10-22]
were directed to GT power augmentation by
cooling the inlet air. The power output gain
of 1% is achievable for every 1.5-2.0 °C
drop in the inlet air temperature using water
chillers as reported by researchers and
manufacturers [1-3, 10-22].
Other researches [23-30] were focused
on environmental issues like NOx reduction
using bypass air and catalyst systems. The
new GTs also utilize low NOx combustors to
reduces the NOx emissions, where The use
of NG fuel and the use of the new dry low
NOx combustors have reduces NOx levels
below 10 PPm. New research in combustors
such as catalytic combustion have great
promise and values of 2 ppm can be
achieved in the future. Also for future plants
CO2 capture and storage system are
included.
Finally, integration between renewable
energy (solar energy) and GTs were studied
for future applications [32-36].
1.1-Main components of the present
GT The present GT is identified as single
shaft, simple open cycle mechanical power
generator consisting of [2]:
1. Air filtration system: to avoid
compressor fouling, erosion and
corrosion that may cause by dirty and
sandy air.
2. Eighteen stage axial compressor
3. A combustion chamber equipped
with eight combustors arranged in
circular array around the GT axis
4. A three stage reaction type turbine.
The complete package of gas turbine can be
divided into four major assemblies:
a. Inlet section assembly
b. Compressor/ combustor section
assembly
c. Turbine section assembly
d. Exhaust section assembly.
1.2-Gas path description: Atmospheric air is drawn through the
inlet manifold and filtration system into the
compressor where it is pressurized up to
about 11 atmospheres and forced into the
combustor chamber and baskets in a steady
flow. Fuel is injected into the combustors
burners, raising the temperature of the
mixture of air and combustion products.
Then the compressed and heated gas flows
through the turbine, dropping in temperature
and pressure as the heat energy is converted
into mechanical work. A portion of the
power produced by the turbine is used for
driving the compressor and the balance of
power is used to drive the generator. The gas
is then discharged through the exhaust
diffuser and axial exhaust manifold into the
exhaust stack.
To assure good starting characteristics,
two bleeds are fitted at the 6th
and 11th
stage
of the compressor. They remain open during
the starting cycle up to 90% of the design
speed.
1.3-Inlet guide vanes: The first stage of the compressor vanes
is a flow distributer conveying the air
towards the first stage of rotating blades
according to a suitable angle. A variable
setting mechanism permits to select the
proper incidence of the air entering the first
rotor. This arrangement improves starting
acceleration and prevents compressor surge
or stall.
1.4-Thrust bearing: It is housed in the inlet casing. it is
capable of transmitting the full designed

M: 60 Mansoura Engineering Journal, (MEJ), Vol. 40, Issue 4, December 2015
thrust load in either direction. Thrust bearing
shoes on both sides of the shaft thrust ring
are equipped with thermocouples for
monitoring bearing temperature by the
control system. Continuous oil flow is
admitted to the bearings for lubrication
purpose.
1.5-Combustion system The combustion system is contained in
a carbon steel casing which is part of the
compressor-combustor shell and provides
housing for the following components:
Combustor baskets, fuel nozzles, spark plug
igniters, flame detectors, and cross flame
tubes.
1.6-Turbo-set configuration: Figure (1) shows the block diagram of
the turbo-set configuration. In this diagram
the main two auxiliaries groups are: the
starting package and the reduction gear unit.
1.7-starting package A gas turbine, like other internal
combustion engines, cannot produce torque
at zero speed. Therefore a starting device
must be used to crank the turbine for startup.
The main components of the starting
package are: the driving motor, the torque
converter, the electro-brake, the turning gear
with relevant clutch, and the double toothed
coupling. The turbo-set starting diagram is
given in Fig. (2).
1.8-Lubricating oil system: The basic requirement of all rotating
equipment is a reliable lubricating system.
Such a system must supply cooled, cleaned
and pressurized oil to the bearings. The GT
lube oil system consists of: oil reservoir,
pumps to pressurize the oil, heat exchanger
to remove the heat absorbed by the oil, a
filtering system to remove contaminants, a
system of valves to regulate at the proper
pressure, oil vapor extractor, and oil heaters.
A block diagram for the oil system is shown
in Fig. (3).
1.9-Air system The air system is divided into 5 portions:
-Instruments air, Fig. (4): Used for
operating the pneumatic control system
(valves and actuators). This is during the
startup and shutdown.
-Atomizing air, Fig. (5): it is needed during
running on fuel oil only. The requested
supply is taken from a bottle filled by
pressurized air from reciprocating
compressor.
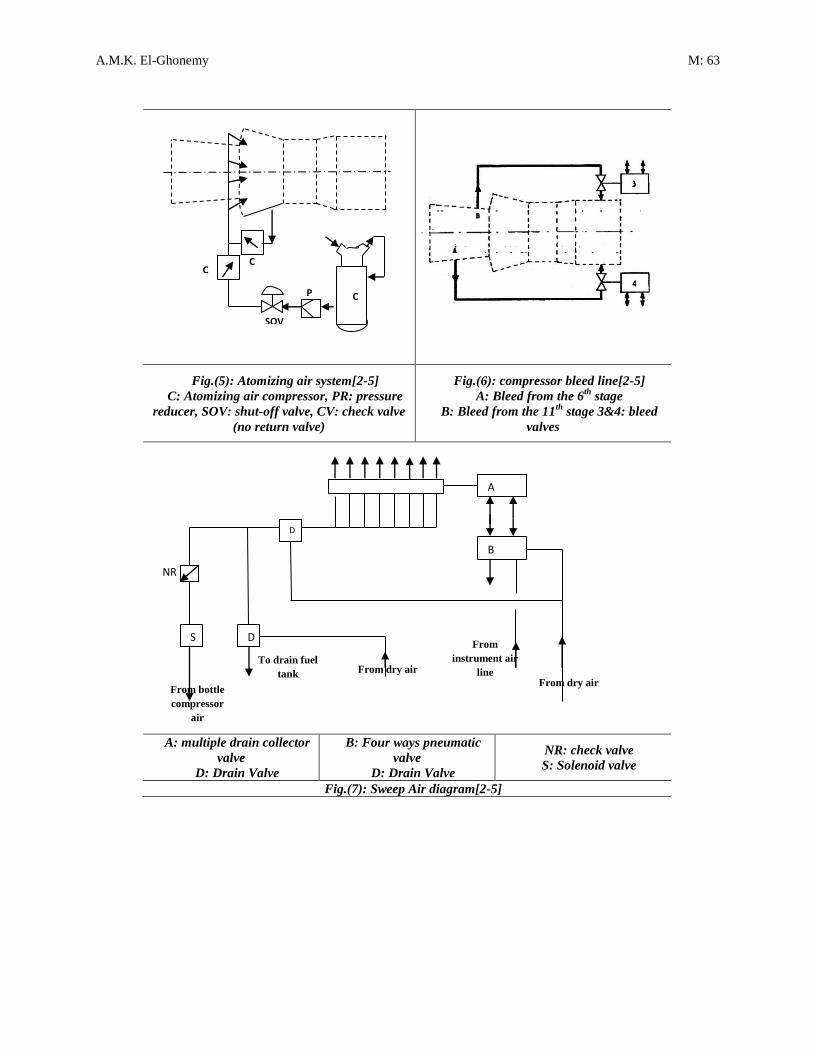
-Compressor bleed, Fig. (6): is used to
avoid compressor surge during starting
phase of the unit. For the same reason during
shutdown. The air is discharged from the
axial compressor to the exhaust of the unit
through two bleed valves. During the
starting phase the bleeds remain open up to
90% of rated speed. The source is from 6th
and 11th
axial compressor stage.
-Sweep air, Fig. (7) Is used to clean the
liquid injectors for removing the liquid fuel
from flow-divider and injectors themselves.
It operates only at the end of change-over
from liquid fuel to gas fuel.
-Cooling system: The turbine is provided of
separate cooling paths for the rotor and
stationary parts. Compressor discharge air,
bled at the combustor casing, is used for
both the rotor and the stator cooling after
having been filtered and cooled into an air-
to-air cooler externally to the machine. As
shown in Fig. (8).
The rotor cooling flow enters the
machine at the torque tube section. The first
rotor blades has been constructed with air
passage to allow cooling air-flow through
the blade before it is discharged in the gas
stream at the tip of the blades.
The stator cooling air serves many
functions. All the cooling air is supplied to
the blade ring cavity by a single air box. A
percentage of the air enters the first row
vanes through wall span wise holes and is

A.M.K. El-Ghonemy M: 61
discharged into the gas stream through the
trailing edge slots, Fig.(9). The air cooling
system has been designed to ensure long life
and reliability of the working parts. A
continuous monitoring system for
temperature supervision was supplied.
Fig.(1):block diagram for turbo-set configuration[2-5]
Figure (2): Turbo-set starting diagram [2-5].
Turning gear with
automatic clutch
Reduction gear
package
Double
toothed
automatic
clutch for
starting Starting
package
main reduction
gear Automatic clutch for Generator
disconnection
Gas turbine
Generator
Torque
converter
Electromagnet Brake
Prime
mover
Oil
pump
Speed % of normal speed
Torque at
generator
shaft
62%
Turbo-set absorbed torque
21% 50%
GT
ignition
End of starting
Starting package Outlet torque

M: 62 Mansoura Engineering Journal, (MEJ), Vol. 40, Issue 4, December 2015
AOP: Auxiliary oil pump, driven by A.C motor EOP: Emergency oil pump, driven by
D.C. motor MOP: Main oil pump, driven mechanically by the unit N/R: non return
(check) valve
Fig.(3): oil system block diagram[2-5]
Fig.(4): Instruments air
C: service air compressor, DF: Drain filter, PR: pressure reducer, NR: check valve, AD:
Air drier.
N/R
N/R
N/R
AOP
Main tank
MOP
Cooler Filter
To
bearing
EOP
Auxiliary
tank
Instrument Cabinet
DF
DF
NR
NR
PR
Feeding
From combustor shell
From combustor shell
PS
AD
C
A.M.K. El-Ghonemy M: 63
Fig.(5): Atomizing air system[2-5]
C: Atomizing air compressor, PR: pressure
reducer, SOV: shut-off valve, CV: check valve
(no return valve)
Fig.(6): compressor bleed line[2-5]
A: Bleed from the 6th
stage
B: Bleed from the 11th
stage 3&4: bleed
valves
A: multiple drain collector
valve
D: Drain Valve
B: Four ways pneumatic
valve
D: Drain Valve
NR: check valve
S: Solenoid valve
Fig.(7): Sweep Air diagram[2-5]
CC
P
SOV
C
NR
From dry air
From bottle
compressor
air
To drain fuel
tank From dry air
From
instrument air
line
A
B
D
D S
To fuel oil injectors

M: 64 Mansoura Engineering Journal, (MEJ), Vol. 40, Issue 4, December 2015
Fig. (9): air inlet and air outlet for blade
cooling [2-5].
Fig.(8): Turbine air cooling
C:compressor delivery
S:Stator air cooling
R: Rotor air cooling
1.10-Testing objectives: The present test objective is to
determine the power output and the heat rate
of a single gas turbine generating plant
compared to the design ones at different
loads.
2-Testing steps 2.1-Test preparation
Before the tests are carried out, it is
necessary to perform the following actions
before testing:
1. cleaning of gas turbine: compressor
has to be washed wet and/or dry
cleaning, using agent approved by the
turbine manufacturer.
2. Check and clean inlet air filters, and
check that the inlet duct, elbows,
expansion joints, silencers, are in order
and not obstructed.
3. Take-off the injectors and clean them
carefully and thoroughly.
4. Check the instruments conditions and
update its calibration before the tests.
During the test the main operating
parameters of the gas turbine are given
below:
a. Barometric pressure: it is measured
by a precision mercury barometer. The
reading accuracy is 0.25 mmHg.
b. Compressor inlet temperature: it is
measured by three precision
mercury-in-glass thermometers
scaled 1/10 0C, placed in the air flow
near the compressor inlet filters.
c. Power output: it is measured by
using standard calibrated three phase
KWh meter. This meter is connected
to the transformer (current and
voltage).
d. Turbine speed: it is measured using
electronic taco-meter connected to
the turbine control system.
e. Combustor shell pressure: it is
measured by transducer supplied
with the turbine control system.
f. Exhaust manifold temperature: it is
measured by thermocouples which
are mounted and connected to the
control system.
g. Fuel temperature: it is measured by a
thermometer immersed in the
flowing fluid,
h. Distillate oil fuel flow: it is measured
by a turbine type flow meter
i. Fuel analysis: it is done by the local
laboratories.
j. Auxiliaries power absorption is
measured by means of a KWh meter.
Symbols and units are summarized in table
(1).

A.M.K. El-Ghonemy M: 65
2.2-Test procedure: To achieve the objective of the present
study, operating parameters are recorded at
part loads (50%, 75%), maximum
continuous load or base load (100%), and
peak load (120%), in the following
sequence:
a. after calibration of instruments and
preparation
b. the unit will be started and brought
directly to base load exhaust temperature
control
c. After the unit has reached base load
it will be allowed to stabilize for at least
3 hrs.
d. all reading will be taken and
recorded. Three sets of data will be
obtained. The duration of each set of
measurements will be 20 minutes (5:20
according to ISO standard). A sample of
test data sheet that was recorded during
the test is summarized in tables (2 and
3).
Table (1): symbols and units.
Symbol parameter unit
Pamb Ambient pressure mmHg
Tamb Ambient temperature oC
FCST Fuel counter at start test Liter
FCET Fuel counter at end test Liter
Gfuel Fuel flow L/hr
Tfuel Fuel temperature oC
fuel Fuel flow density at flow
temperature Kg/Liter
LHV Lower heating value KJ/Kg
n Revolution per minute rpm
Time time S
WGros Gross power at generator
flange KW
Caux Current for auxiliary
consumption A
Vaux Voltage for auxiliary
consumption V
WAux Auxilary power KW
WNet Net power KW
HRNet Net heat rate KJ/KWhr
WCorr Corrected net power to
design conditions KW
Table (2): Average data recorded during the test with distillate fuel oil.
Base load 100% 75% base Load 50% base load Peak Load
Parameter Run1 Run2 Run3 Run4 Run5 Run6 Run7 Run8 Run9 Run10 Run11 Run12
Pamb 701.7 701.7 701.7 702.6 702 701.4 701 701 701 701 701 701
Tamb 34.38 34.86 35.6 35.76 36.1 38.96 40.2 39.9 39.54 40.12 40.88 41.04
FCST 31500 36700 41900 50600 54800 89700 17400 20800 23800 99200 4200 9000
FCET 35145 40331 45515 53701 57904 92810 19880 23284 26285 102949 7930 12730
Gfuel
(L/hr) 10935 10893 10845 9303 9312 9330 7440 7452 7455 11247 11190 11190
Tfuel 48.8 49.8 49.5 50.2 51 52.6 52.8 53 53 52.6 52.6 52.8
fuel 0.8159 0.8153 0.8155 0.8150 0.8145 0.8134 0.8133 0.8132 0.8132 0.8134 0.8134 0.8133
LHV 42578 KJ/kg
N 37.72 37.48 37.25 29.56 29.555 29.53 19.81 19.82 19.82 38.95 38.67 38.66
Time(s) 1200
Caux (A) 500 505 520 510 530 520 500 480 510 525 540 520
Vaux (V) 380 380 379 379 378 382 380 385 385 380 380 380

M: 66 Mansoura Engineering Journal, (MEJ), Vol. 40, Issue 4, December 2015
Table (3): Correction factors and corrected values @ standard conditions
Run
1
Run
2
Run
3
Run
4
Run
5
Run
6
Run
7
Run
8
Run
9
Run
10
Run
11
Run
12
Wn
et
28818.56 28630.62 28445.56 22518.86 22504.62 22487.84 15002.27 15017.64 15000.64 29753.43 29529.04 29532.51
HR
net
KJ
/KW
h
13181.62 13207.46 13238.06 14335.72 14349.86 14368.89 17173.23 17181.21 17207.61 13091.49 13124.12 13120.96
λ
1.1238 1.1199 1.1139 1.1126 1.1099 1.087 1.0771 1.0795 1.0823 1.0777 1.0717 1.0704
λ2
1.0039 1.0039 1.0039 1.0052 1.0043 1.0035 1.0029 1.0029 1.0029 1.0029 1.0029 1.0029
β
0.9578 0.959 0.9608 0.9612 0.9621 0.9695 0.9727 0.919 0.971 0.9725 0.9746 0.9725
W
co
rr
32512.6 32188.48 31809.09 25184.77 25085.29 24529.84 16205.81 16258.56 16282.27 32158.26 31738.04 31703.28
HR
co
rrec
ted
12625.35 12665.96 12719.12 13779.49 13806 13930.64 16704.4 15789.53 16708.59 12731.47 12790.77 12760.14
3-Data reduction and
Calculations [1-5]: To study the plant performance at site
operating conditions (heat rate and output
power), the operating data are measured and
recorded at different loads. Then, the
performance can be calculated as follows:
I-Computation of power output,
and heat rate -power output is calculated as follows:
.
Where:
WI: gross power output at generator
terminals, KW
Wn : net power output at generator terminals,
KW
Waux : auxiliaries power consumption, KW
n : revolution number counted on the KWh-
meter.
t : time during which the KWh-meter
reading has been made, S
KC : KWh-meter constant, revs/KWh
KA : ratio of current transformers
KV : ratio of voltage transformers
-Heat Rate is calculated as follows:
Where:
HR: heat rate, KJ/KWh
V: fuel volume read on the flow-meter
during the time t
t: time during which the measurement of fuel
consumption has been carried out, Seconds .
: fuel density at the temperature of fuel
during test, Kg/L.
LHV: lower heating value of the fuel oil,
KJ/kg
Wn : net power output at generator terminals,
KW
II-Computation of the power output
and heat rate corrected to reference
conditions A-corrected net power output, WCorr
Where λ =λ1.λ2
λ1: factor taking into account the compressor
inlet temperature

A.M.K. El-Ghonemy M: 67
λ2: factor taking into account the
atmospheric pressure
B-corrected heat rate, HRcorr
Where β: factor taking into account the
compressor inlet temperature.
4-Results and discussion As discussed above, to obtain and
investigate the performance of the existing
GT plant, the following steps are taken:
Step-1: recording all measured parameters in
the test data sheet and calculating the
average value for each parameter as given in
table (2). The load variation steps are
50%,75%, 100%, 125% as shown in table(2)
Step-2: calculating the net power and net
heat rate at different loads. Then making
correction as summarized in table (3)
4.1-Variation of plant performance
at different loads (net power and
heat rate)
Variation of both of Power output and
HR are plotted in Fig.(10) against load
variation compared with design (ISO)
conditions. It is clear that, the higher
operating load the most economic operation
is. As example operating the plant at 100%
load instead of 50%, can decrease the HR
from 13930 down to 12625 and from 17173
to 13181 KJ/KWh at ISO and actual
conditions respectively.
4.2-Comparison of actual power
output and heat rate with the design
ones. In order to compare the actual
performance results with the design ones,
The plant performance at both actual and
design conditions are plotted in Fig.(10). It is
noticed that the HR actual results are higher
than design ones (as increase percentage of
4.4%, 4.03%, 2.8% at load of 100%, 75% ,
50% respectively).
In general, a disagreement between
design and measured performance values is
due to high ambient temperatures.
40 60 80 100 120
Load, %
12000
16000
20000
24000
28000
32000
36000
Po
we
r, K
W
ISO conditions
Actual
40 60 80 100 120
Load, %
12000
13000
14000
15000
16000
17000
18000
HR
, K
J/K
Wh
Iso conditions
Actual
Fig. (10a): Variation of design and actual Power
output at different loads. Fig. (10b): Variation of design and actual HR at
different loads.

M: 68 Mansoura Engineering Journal, (MEJ), Vol. 40, Issue 4, December 2015
40 60 80 100 120
Load, %
Po
we
r, K
W
12000
13000
14000
15000
16000
17000
18000
0
5
10
15
20
25
HR
, M
J/K
Wh
Power, Iso conditions
Power, actual
HR, ISO condition
HR, actual
Fig. (11): comparison between actual and
design performance results at different loads.
5- Recommendation for adding
absorption chiller as a
heat/power recovery system As depicted from Figures(10 and
11)The increase in air temperature at inlet of
GT compressor, causes a significant
reduction in output power as shown in
table(7).
Currently, there are two basic systems
available for compressor inlet cooling:
Evaporative cooler and absorption chiller
systems when the ambient temperature is
extremely high with low relative humidity
the chiller is the more suitable cooling
solution [1-3].
Table. (4): influence of compressor inlet
temperature on power output (base rating) [1-3].
T1 C Power change
factor
10 1.03
15 1
20 0.965
30 0.9
40 0.8375
50 0.775
From table (4), for decrease in inlet air
temperature from 50 C to 15 C, the net
output power increases around 22%.
Consequently, 22% increase in power means
adding of 0.22x7x25=38.5 MW of power
output to overcome the blackout problem
during peak load.
6-Conclusion The performance of Al-Jouf power
plant is studied and compared with the
design at 50, 75%, 100, 120% loads. It is
concluded that:
1. For the single GT cycle the actual
HR is between 17173.23, 14335.72,
13181.62 KJ/KW.hr at loads of 50%,
75%, 100% respectively. While the
corresponding designs ones are 16704.4,
13779.49, 12625.35 at loads of 50%,
75%, 100% respectively. So, operating
the plant at higher loads near to 100% is
recommended.
2. As a simple solution, heat/power
recovery by cooling the inlet air, is
recommended for economic
considerations and to overcome the
problem of electricity black-out.
3. As noticed, the flue gases is
exhausted at higher temperatures (about
410C), so heat recovery system is
recommended.
4. 4-New technologies for low Gas
emissions should be considered in future
projects ( NOx , CO and CO2 capture
and storage system).
Nomenclature Aaux: Current for auxiliary consumption, A
FCET: Fuel counter@ end of test, L
FCST : Fuel counter@ start of test, L
GFuel: fuel flow, L/hr
HR: Heat rate, KJ/KWh.
HRNet: net heat rate, KJ/KWh
LHV: Lower heating value of fuel, KJ/Kg
: mass flow rate (kg/s)
n : revolutions, rpm
p : pressure (bar)
Pamb: ambient pressure, mmHg,
PR: pressure ratio
Tamb: Ambient temperature, C
TFuel: fuel temperature, C

A.M.K. El-Ghonemy M: 69
TIT: Turbine inlet temperature (0C)
Vaux: voltage for auxiliary consumption, V
W : power output (MWe)
WAux: auxiliary power, KW
WCorr: corrected net power, KW
WGross: Gross power @ generator Flange,
KW
WNet: Net power, KW
Greek Symbols 𝛒Fuel: fuel flow density, Kg/L
η : efficiency
Subscripts e: electricity
exp: expander
hp: high-pressure
lp: low-pressure
max: maximum
References [1.] Meherwan, P,B, 2002‖Gas turbine
engineering handbook‖ the boyce
consultancy, Fellow, American society
of mechanical engineers and Institute
of Diesel and gas turbine engineers,
UK.
[2.] Fiat Avio , TG20 gas turbine technical
and training manual.
[3.] General Electric- Model PG7111(EA)
"Gas Turbine operation and
maintenance manuals".
[4.] Frank J. Brooks " GE Gas Turbine
Performance Characteristics" GE
Power Systems, Schenectady, NY,
GER-3567H.
[5.] J. H. HorlockF.R.Eng., F.R.S., 2003‖
Advanced Gas Turbine Cycles‖
Whittle Laboratory Cambridge, U.K.
[6.] M. M. Rahman, Thamir K. Ibrahim
and Ahmed N. Abdalla,
2011‖Thermodynamic performance
analysis of gas-turbine power-plant‖
International Journal of the Physical
Sciences Vol. 6(14), pp. 3539-3550, 18
July.
[7.] P. Centeno, I. Egido, C. Domingo, F.
Fernández, L. Rouco , M. González,
―Review of Gas Turbine Models for
Power System Stability Studies‖
Universidad Pontificia Comillas,
[8.] KAWASAKI, 2003 ‖Gas turbines‖
Texas Technology Showcase, 17 - 19
March, 2003 Houston, TX
[9.] www.kawasaki.com/gtd
[10.] Y.S.H. Najjar, "Enhancement of
Performance of the Gas Turbine
Engines by Inlet Air Cooling and
Cogeneration System". Applied
Thermal Engineering, Vol. 16, 1996,
163-173.
[11.] M.M. Alhazmy, Y.S.H. Najjar, 2004
"Augmentation of Gas Turbine
Performance Using Air Coolers".
Applied Thermal Engineering, Vol. 24,
415-429.
[12.] Amell, F.J. Cadavid, 2002"Influence of
the Relative Humidity on the Air
Cooling Thermal Load in Gas Turbine
Power Plant". Applied Thermal
Engineering, Vol. 22, 1529-1533.
[13.] Mohanty, J. Paloso, 1995"Enhancing
Gas Turbine Performance by Intake
Air Cooling Using an Absorption
Chiller". Heat Recovery Systems, Vol.
15, 41-50.
[14.] J.S. Andreppont, 2000 "Combustion
Turbine Inlet Air Cooling, Benefits,
Technology Options and Applications
for District Energy". International
District Energy Association (IDEA)
91st Annual Conference, Montreal.
[15.] M. Ameri, K. Montaser, 2002"The
Study of Capacity Enhancement of a
37.5 MW Gas Turbine Using Chilled
Water Thermal Energy Storage
System". Proceedings of the 15th
International Conference of Efficiency
Costs, Optimization, Simulation and
Environmental Impact of Energy
Systems (ECOS, 2002), Berlin,
Germany.

M: 70 Mansoura Engineering Journal, (MEJ), Vol. 40, Issue 4, December 2015
[16.] M. Ameri, H. Nabati, A. Keshtgar,
2004 "Gas Turbine Power
Augmentation Using Fog Inlet Air-
cooling System". Proceedings of
ESDA04, 7th
Biennial Conference on
Engineering Systems Design and
Analysis, Manchester, United
Kingdom.
[17.] R.S. Johanson, 1998 "The Theory and
Operation of Evaporative Coolers for
Industrial Gas Turbine Installations".
Gas Turbine and Aeroengine Congress
and Exposition, June 5-9, Amsterdam,
The Netherlands, Paper No. 88-GT-41.
[18.] I.S. Ondryas, D.A. Wilson, M.
Kawamoto, G.L. Haub, 1991 "Options
in Gas Turbine Power Augmentation
Using Inlet Air Chilling". Engineering
for Gas Turbine and Power,
Transaction of the ASME, Vol. 113,
203- 211.
[19.] M. Mercer, 2002 "One-Stop Shop for
Inlet Cooling Systems". Diesel and Gas
Turbine Worldwide, June Issue, 10-13.
[20.] A.M. Bassily, 2001 "Effects of
Evaporative Inlet and After cooling on
the Recuperated Gas Turbine Cycle".
Applied Thermal Engineering, Vol. 21,
1875- 1890.
[21.] D.A. Kolp, W.M. Flye, H.A. Guidotti,
1995 "Advantages of Air Conditioning
and Supercharging an LM6000 Gas
Turbine Inlet". Engineering for Gas
Turbine and Power, Transactions of the
ASME, Vol. 117, 1995, 513-527.
[22.] M.Jonsson, J. Yan, 2005‖ Humidified
gas turbines—a review of proposed
and implemented cycles‖ Energy 30 ,
1013–1078.
[23.] Roger E. Anderson, Scott MacAdam,
Fermin Viteri, 2008‖ ADAPTING
GAS TURBINES TO ZERO
EMISSION OXY-FUEL POWER
PLANTS‖ Proceedings of ASME
Turbo Expo 2008: Power for Land, Sea
and Air GT 2008 June 9-13, Berlin,
Germany.
[24.] C.Y. Liu, G. Chen, M. Assadi, X.S.
Bai, 2011‖characteristics of Oxy-fuel
combustion in gas turbines‖ El-sevier,
2011
[25.] Hanne M. Kvamsdal1, Ola Maurstad1,
Kristin Jordan, and Olav Bolland‖
BENCHMARKING OF GAS-
TURBINE CYCLES WITH CO2
CAPTURE‖ 1SINTEF Energy
Research, N-7465 Trondheim, Norway
[26.] Hanne M. Kvamsdal1, Olav Bolland,
Ola Maurstad, and Kristin Jorda‖ A
qualitative comparison of gas turbine
cycles with CO2 capture‖ The
Norwegian University of Science and
Technology (NTNU), N-7491
Trondheim, Norway
[27.] Shinji, K. and Nobuhide, K., 2002―
performance evaluation of gas turbine
–fuel cell hybrid micro generation
system‖ proceedings of ASME
TURBO EXPO 2002, Amsterdam ,
The Netherlands.
[28.] A. Boudghene Stambouli and E.
Traversa, 2002‖ Solid oxide fuel cells
(SOFCs): a review of an
environmentally clean and efficient
source of energy‖ Renewable and
Sustainable Energy Reviews 6 (2002)
433–455
[29.] M J Moore, 1997‖ Nox emission
control in gas turbines for combined
cycle gas turbine plant‖ Proc Instn
Mech Engrs Vol 211 Part A
[30.] [30] Christian Kaufmann, 2010
‖INDUSTRIAL APPLICATIONS OF
GAS TURBINES, Session #7
‟Emission Reduction Case Study‖ Fall
2010 Course.
[31.] Mitsubishi Heavy Industries Technical
Review (Mar. 2010) "Development of
Key Technology for Ultra-high-
temperature Gas Turbines" Vol. 47 No.
1
[32.] AQUA-CSP 2007: Trieb, F.,
Schillings, C., Viebahn, P., Paul, C.,
Altowaie, H., Sufian, T., Alnaser, W.,

A.M.K. El-Ghonemy M: 71
Kabariti, M., Shahin, W., Bennouna,
A., Nokraschy, H., Kern, J., Knies, G.,
El Bassam, N., Hasairi, I., Haddouche,
A., Glade, H., Aliewi, A.,
"Concentrating Solar Power for
Seawater Desalination" German
Aerospace Center (DLR), Study for the
German Ministry of Environment,
Nature Conversation and Nuclear
Safety, Stuttgart 2007,
(www.dlr.de/tt/aqua-csp)
[33.] J.O. Jaber, S.D. Odeh, S.D. Probert,
2003"Integrated PV and gas turbine
system for satisfying peak-demands".
Applied Energy, Vol. 76, 2003, 305-
319.
[34.] J.O. Jaber, O.O. Badran, N. Abu-
Shikhah, 2004 "Sustainable energy and
environmental impact: role of
renewables as clean and secure source
of energy for the 21st century in
Jordan". Clean Technologies and
Environment Policy, Vol. 6, 174-186.
[35.] J.O. Jaber, A. Al-Sarkhi, B. Akash, M.
Mohsen, 2004"Medium-range planning
economics of future electrical power
generation". Energy Policy, Vol. 32,
357- 366.
[36.] Peter Schwarzbo¨zl, 2006 "Solar gas
turbine systems: Design, cost and
perspectives"Solar Energy 80 (2006)
1231–1240.
Appendix-A:
Example of calculations: Run 1 with distillate fuel oil:
1-Gross power=
.
= (37.72*3600/1200)*(
3000*120/1400)=29098.3 KW
2-WAux=√ Aaux .Vaux . Cosф=
√ 500*380*0.85=279.7KW
where ,Cosф is assumed equal to 0.85
3-WNet =Gross power-Aux. Power
=29098.3-279.7=28818.6KW.
Net HR=
10935*0.8159*42578/
28818.6 = 13181.6 KJ/KWh
Where, Gfuel(Kg/hr) = Gfue(L/hr)* δFuel
(kg/L)= 10935* 0.8159 kg/hr
Note: λ1=1.1238 using an ambient
temperature equal to 34.38C
λ2 = 1.0039 using an ambient pressure equal
to 701.7 mmHg
β=0.9578 using an ambient temperature
equal to 34.38 C
4-Power Corrected=
KW
5-HR corrected=
= 13181.6/ 0.9578=
13762.4 KJ/KWh
Table (A1): Sample of actual test data.
Fuel type Distillate fuel oil
load 50%
Time at start run 17:26
Time at stop run 17:46
Test time 20 minutes
Active power at
generator terminals 15.284MW
Current for auxiliary
consumption 500 A
Voltage auxiliary 380V
Compressor inlet
temperature 40.3,40.2, 40.1 C
Ambient pressure 701 mmHg.
Compressor inlet static
loss -176 mmH2O
Exhaust turbine static
loss -20 mmH2O
Combustor shell
pressure 8.2 bar
Compressor discharge
temperature 371.9, 371.3, 371.1 C
Cooler discharge
temperature 152.7,152.2, 152.7 C
Exhaust gas
temperature 410.2, 410.5, 410.4 C
GT speed rpm 3611, 3614, 3613
rpm
Liquid fuel
temperature 52.8 C
Liquid fuel (Liters) 17,400, 18,800
time 1200 seconds


![PUMPS USED AS TURBINES Power Recovery, Energy Efficiency ... · PDF filePUMPS USED AS TURBINES Power Recovery, Energy Efficiency, CFD Analysis by Jasmina B. BOGDANOVI]-JOVANOVI]a*,](https://static.fdocuments.us/doc/165x107/5aae5f267f8b9adb688c3d84/pumps-used-as-turbines-power-recovery-energy-efficiency-used-as-turbines-power.jpg)