Gas to Power - South East Asia and Australasia to Power South... · GAS TO POWER IN SOUTHEAST ASIA...
55
2006 International Gas Union Union Internationale de l’Industrie du Gaz Gas to Power - South East Asia and Australasia Shell Gas & Power
-
Upload
nguyencong -
Category
Documents
-
view
213 -
download
0
Transcript of Gas to Power - South East Asia and Australasia to Power South... · GAS TO POWER IN SOUTHEAST ASIA...
2006
International Gas UnionUnion Internationale de l’Industrie du Gaz
For more information, please contact:
International Gas Union Office of the Secretary GeneralP.O. Box 550 c/o DONG Energy A/S Agern Alle 24-26 DK-2970 HoersholmDenmark
Website: www.igu.org
Gas to Power - South East Asia and Australasia
Sh e ll Ga s & Po w e r

TRI-ZEN December 2005
Title: Gas to Power – South East Asia and Australasia
Author: Mr Steve Puckett, Managing Director of Tri-Zen International PTE LTD., Singapore
on assignment by Shell Gas & Power
Project advisor International Gas Union: Dick de Jong, Senior Fellow Clingendael
International Energy Programme, The Hague, The Netherlands
Published by: International Gas Union / Energy Delta Institute, Groningen, The Netherlands
Copyright 2006© : International Gas Union / Energy Delta Institute, Shell Gas & Power and Tri-Zen
For more information, please contact:
International Gas Union Office of the Secretary General P.O. Box 550 c/o DONG Energy A/S Agern Alle 24-26 DK-2970 Hoersholm Denmark e-mail: [email protected] phone: +45 4517 1200 website: www.igu.org
GAS TO POWER - SOUTH EAST ASIA
AND AUSTRALASIA
March 2006

GAS TO POWER IN SOUTHEAST ASIA AND AUSTRALASIA
SHELL January 2006
2
GAS TO POWER IN SOUTHEAST ASIA AND AUSTRALASIA
SHELL January 2006
3
FOREWORD
The International Gas Union (IGU) is a non-profit organization registered in Vevey, Switzerland, with the secretariat located in Hoersholm, Denmark. Founded in 1931, it currently has 89 members in 67 countries. The members of IGU are generally national associations of the gas industries or companies with assets in the gas industry.
The main objective of IGU is to promote the technical and economic progress of the gas industry worldwide mainly by facilitating the exchange of information of both a technological nature and of a more general, business-oriented nature.
To that end, IGU organises the World Gas Conference, which takes place every three years. The preparatory programme for the World Gas Conference is implemented by Working and Programme Committees, which study all aspects of the gas industry from the wellhead to the burner tip.
In preparation for the 2006 World Gas Conference, the IGU Dutch Presidency has launched three special projects: Gas to Power, Regulation and Sustainability. For all three, the aim was to engage governments, industry and other stakeholders in a dialogue on gas-related issues to achieve the best solutions for society at large.
The Gas to Power Project has been set up in view of the pivotal role that power is likely to play in the development of new gas markets and the realization that it will take enormous effort to achieve the projected growth. It aimed to identify possible obstacles and to address them by inviting the governments and the power industry to discuss them jointly with the gas industry. Clearly, the Regulation project is closely related to the Gas to Power Project.
IGU expresses its gratitude to Shell Gas & Power who assigned this study to Mr Steve Puckett of TRI-ZEN consultants in Singapore.
International Gas Union
GAS TO POWER IN SOUTHEAST ASIA AND AUSTRALASIA
SHELL January 2006
4
ACKNOWLEDGEMENTS
Shell welcomes the opportunity to contribute this report on Gas to Power in South East Asia and Australasia to the IGU
Working Group on Global Power for issue at the forthcoming World Gas Conference in Amsterdam in June 2006.
Shell Gas & Power (Shell) would like to acknowledge the major contribution made by Tri-Zen International (Tri-Zen) to the
data research, analysis, and editorial work carried out in relation to the production of this report.
Data used in this report are drawn from the following published data sources: BP Statistical Review of World Energy; CIA;
EIA; EIU; APERC; ASEAN Centre for Energy and from information published by individual country’s agencies and their
utility businesses. Projected figures for gas and power demands largely reflect published plans where these are available and
otherwise have been estimated based on projected economic growth rates and factors expected to influence development. In
the Country Profiles, pie-charts showing Power Demand by Sector and Power Generation Fuel Mix and other power data
listed are sourced from government agencies, or utility published materials.
DISCLAIMER
No representations or warranties express or otherwise, are made by Shell or Tri-Zen concerning the accuracy or
completeness of the information in this report and Shell or Tri-Zen shall not be liable in anyway to the IGU for receipt or use
of the information contained in this report
Shell Gas & Pow erShell Gas & Pow er
GAS TO POWER IN SOUTHEAST ASIA AND AUSTRALASIA
TRI-ZEN December 2005
1
CONTENTS
1.0 EXECUTIVE SUMMARY..............................................................................................................................2
2.0 REGIONAL OUTLOOK ................................................................................................................................4
Demand ............................................................................................................................................. 4 Gas Supply ........................................................................................................................................ 6 Affordability ...................................................................................................................................... 7 Policy issues...................................................................................................................................... 7 Environmental impacts...................................................................................................................... 8 Technical influences.......................................................................................................................... 9
3.0 TRENDS AND ISSUES .................................................................................................................................10
Investment ....................................................................................................................................... 10 Drivers ............................................................................................................................................ 10 Barriers ........................................................................................................................................... 10 Other Fuels ..................................................................................................................................... 11
4.0 REGIONAL INITIATIVES..........................................................................................................................12
Power Grids .................................................................................................................................... 12 Gas Grids ........................................................................................................................................ 13
5.0 COUNTRY PROFILES.................................................................................................................................14
Australia.......................................................................................................................................... 14 New Zealand ................................................................................................................................... 16 Brunei.............................................................................................................................................. 17 Cambodia ........................................................................................................................................ 18 Indonesia......................................................................................................................................... 19 Laos................................................................................................................................................. 21 Malaysia.......................................................................................................................................... 22 Philippines ...................................................................................................................................... 24 Singapore ........................................................................................................................................ 26 Thailand .......................................................................................................................................... 27 Vietnam ........................................................................................................................................... 29
6.0 CONCLUSIONS ............................................................................................................................................30
7.0 APPENDICES ................................................................................................................................................31
Abbreviations and Acronyms
GAS TO POWER IN SOUTHEAST ASIA AND AUSTRALASIA
SHELL January 2006
2
1.0 EXECUTIVE SUMMARY
The region encompassing South East Asia and Australasia is diverse and in particular the economies and the energy situation in individual countries are widely divergent. The region includes for example Australia - a large resource rich OECD country that is a significant energy exporter, Singapore - a highly developed city-state economy that imports all its energy resource needs, Indonesia - a large and resource rich developing country of more than 13,000 islands stretching across 5,000km, and Cambodia - a smaller country developing from a very low economic base. A country such as Vietnam, at an early stage of economic development, is experiencing double-digit growth in its energy demand and has a strong appetite for gas. However a common feature of all these economies is that they are all experiencing significant growth. In many South East Asia economies, urbanisation is occurring rapidly and several countries are building manufacturing bases and looking to develop industries all of which results in more gas being required to supply power demand growth and also city gas and industrial gas applications.
Natural gas fulfils about one quarter of the primary energy needs in the region that encompasses South East Asia and Australasia. Gas consumption in the region was about 140 Bcm (billion cubic metres) in 2004 and most of the gas consumed, of the order of 52% or 74 Bcm, was used for power generation. Gas consumption is expected to increase to more than 230 Bcm over the next 10 years, with the proportion of gas used for power expected to increase from current levels, to reach 56%, or about 130 Bcm, by 2015. Gas offers a clean, economic and flexible fuel option for power generation.
While the main use for gas in the region is power generation, countries such as Australia, Thailand and Indonesia, are growing their industrial and city gas markets for gas. In countries such as Brunei, the Philippines and Vietnam, gas is used almost entirely for power. Malaysia has grown its gas-fired power generation and about 70% of power is now generated from gas and it has constructed a Peninsular Gas Utilisation grid to extend gas supply to industry and commerce. In Indonesia there is also potential for significantly increased demand for gas beyond what it is currently able to supply. Indonesia is at a critical point where more gas is required to support both domestic development for power and industrial use and to maintain liquefied natural gas (LNG) exports. To meet these increased needs it will be necessary to progress the development of gas supply and distribution projects.
The region has significant potential to increase its gas to power usage and develop its gas pipeline infrastructure which is limited when compared with the developed regions of North America and Europe with their extensive pipeline grids. South East Asia has limited but growing commercial cross-border trade of pipeline gas. Singapore receives gas supply from Indonesia and Malaysia. Thailand receives gas from Myanmar to supplement its domestic production and gas is supplied to Malaysia from the joint Thai-Malaysia development area. A project is being developed to transport gas via a 3,000 km pipeline from Papua New Guinea to Queensland, Australia. In several countries demand for gas for power is growing strongly, and Thailand and Singapore are among a number of countries in the region that are considering future LNG imports to supplement pipeline supplies.
A critical factor in the growth of gas for power will be that gas remains affordable while pricing structures should recognize the importance of attracting the necessary investment to develop gas and power infrastructure. In some countries in the region, the pricing of gas and power is an issue in that the low level of pricing does not meet thresholds to sustain profitability and encourage investment. A balance needs to be achieved which both maintains the affordability of gas to consumers and satisfies growing demand, while at the same time prices gas at a level which encourages investment.
Investment in gas and power projects continues to be a challenge in countries where policy or regulatory issues have yet to be clarified and where off-takers are unable to maintain commitments or meet the expected levels of creditworthiness. Clear and integrated energy policies and solid commercial frameworks are essential to attract private and institutional funding that could be used to meet the requirements for investment in gas and power.
Gas needs to compete with alternative energy sources as a fuel for power. Several of the countries in the region, such as Australia, Indonesia and the Philippines, have abundant coal reserves and several other countries have developed hydroelectric power. These alternatives however are unable to combine both the flexibility and efficiency of gas with its clean fuel characteristics.
Hydroelectric power is prevalent in countries such as New Zealand where it meets the majority of power demand and in Laos which generates hydroelectric power for export to Thailand. However hydroelectric power has to overcome major capital investment, environmental and social hurdles. New Zealand has faced opposition to further hydroelectric projects from lobby groups and environmentalists and gas is the favoured alternative, as long as it is seen to be affordable. Coal is the dominant fuel competing with gas and coal fired power generation will remain an economic alternative for those areas where supply is readily available. Clean coal technology and bio-fuels have yet to establish a significant presence in the region and, while they will be welcome alternatives, and in the future they may be likely to be a factor impacting the uptake of gas for power. Geothermal power is a further, somewhat country-specific, alternative that is being developed in the Philippines and New Zealand.
GAS TO POWER IN SOUTHEAST ASIA AND AUSTRALASIA
SHELL January 2006
3
The region is resource rich, with significant gas reserves. South East Asia and Australasia have proven gas reserves of about 9 Tcm (trillion cubic metres) concentrated in Indonesia, Malaysia, Brunei and Australia. Current annual production is about 206 Bcm while regional consumption in 2004 was 140 Bcm. Much of the production is exported outside the region as LNG and currently about 83 Bcm goes mostly to Japan, Korea and Taiwan. The Philippines has brought in offshore Malampaya gas to fuel power generation, but beyond this the country needs further investment to develop gas reserves and build gas supply and power generation infrastructure.
An outcome from the regional growth of natural gas usage, particularly for electricity generation, has been the development of plans for liberalization and privatisation to make both gas and power markets more competitive and attractive for investment. While in some countries such as, New Zealand, Australia and Singapore, liberalization and privatization of the markets has progressed to varying degrees, in other countries plans are underway but have had limited implementation to date.
In a further aspect of privatization, Independent Power (IPP) is making a return to the region. Several countries in the region had success in the 1990’s in attracting private investment and independent operation of power generation facilities. These programmes stalled during the financial crisis of 1997/8 and are now being encouraged and attracting interest once more, particularly in countries such as Thailand and Vietnam where demand is surging ahead and where past issues arising during the crisis were well managed.
A further outcome of regional growth in gas and power has been in interest among countries, particularly within the ASEAN framework, to cooperate either bi-laterally or as a group to develop both power transmissions and gas pipeline infrastructure. The growing demand for gas has prompted the development of ambitious plans to link most of the gas producing and consuming countries. Regional initiatives have been developed for an ASEAN power grid, though progress requires the commitment to overcome the many inter-country barriers that exist.
The overall pattern of gas supply to meet growing power demands will evolve over the next ten years, with countries continuing to develop their gas markets based on supply from domestic and joint development areas. Gas supplies will be supplemented with further pipeline supplies from neighbouring countries where these are available, for example from Myanmar to Thailand. Countries such as Indonesia and Malaysia need significant investment in gas and power supply for growth to proceed as needed, while the proposed power projects themselves will be challenged to secure the commitment and finance necessary to proceed.
The increasing needs for gas to fuel clean and efficient power generation could impact many countries in the South East Asia and Australasia region. Thailand has developed its gas markets rapidly and has become a substantial gas consumer and LNG would provide a useful alternative supply source for the planned power generation growth. LNG for the Philippines can be expected to progress only if future gas-fired power plants can be developed successfully. Singapore is expected to proceed with LNG imports to provide diversity and security of supply, both compelling drivers. Both Indonesia and Malaysia, should it prove challenging to replenish indigenous gas reserves may turn to LNG to fuel their power growth requirements.
Australia has ambitious plans for expanding LNG production and is expected to increase supplies over the next 10 years to become possibly the largest supplier in Asia. However, for LNG to begin to be consumed within the South East Asia region, it needs to be priced at a level where its premium over alternative fuels is considered of value for the flexibility and efficiencies associated with clean gas, while the region would have to compete with established export markets for its supplies.
GAS TO POWER IN SOUTHEAST ASIA AND AUSTRALASIA
SHELL January 2006
4
2.0 REGIONAL OUTLOOK
The countries in the region of South East Asia and Australasia are expected to experience robust economic growth and are planning to utilize natural gas increasingly to meet a significant proportion of their fast growing energy and power generation needs over the next 10 years. Natural gas provides both a readily available and a clean energy source to meet the region’s long-term needs for increased energy consumption. The majority of the growth in gas demand and increased gas usage will be for power generation. Gas consumption in power generation is expected to increase from about 74 Bcm to about 130 Bcm a year over the next ten years.
Currently gas-consuming countries in the region use indigenously produced, or imported pipeline supplied gas, for their domestic needs. Several countries are also LNG exporters mostly to countries in North Asia. Gas usage is expected to grow significantly over the coming years, with some countries considering importing LNG to meet their future additional gas requirements, though they will have to compete with the established North Asia markets and the emerging US West Coast and China markets for supplies. A critical issue driving demand will be affordability of gas; however some countries in the region will also be driven by a desire to diversify supply sources in order to increase their security of supply and to secure long-term reliable energy supply at a reasonable cost. The critical issues driving supply are the development of gas resources, the development of infrastructure for gas delivery and power generation, and in some countries the enhancement of regulatory and commercial frameworks and conditions that will attract the necessary investment across the gas to power value chain.
Demand
Gas currently represents about 26% of primary energy demand in the region. The main use for gas is power generation, while in some countries, such as Brunei, the Philippines and Vietnam, gas is used almost solely for power. Demand growth is particularly strong in countries such as Thailand, which in addition to gas for power, is also developing its industrial markets for gas. In Indonesia, gas demand for power, industrial gas consumption and city gas is growing strongly. In Australia demand for industrial and city gas is also growing steadily.
Australia is energy resource rich and is a world scale exporter of gas, but its domestic use of natural gas is relatively small and represents less than 20% of the energy mix, with coal being the main fuel for power. Gas consumption has however been growing steadily and is expected to grow twice as fast as other energy sources over the next ten years. Australia’s pipeline infrastructure is fragmented and was originally developed for bringing gas from the centre of the country to the coastal areas. With increasing offshore gas supplies, significant investment in pipelines will be required. A project is currently being developed to bring an estimated 4 Bcm a year of gas, with potential to increase eventually to 6 Bcm, from Papua New Guinea via a 3,000 km pipeline to Queensland and NSW. Gas-fired power makes up about 15% of total power generation; with most of the gas used in power generation in Western and South Australia. Australia’s power industry is fragmented, as control of the industry is with individual States, however with the development of its plentiful gas resources it is expected that gas-fired power will consolidate its position in the generation mix. Australia is already a significant exporter of LNG and exports are expected to increase substantially as demand for gas, and particularly gas for power, grows within the region and beyond.
New Zealand produces about 3.6 Bcm of gas more than half of which is consumed for power. Hydroelectric power is dominant with over 60% of the generation mix, while gas-fired power currently represents about 16% of the mix. Some decline in gas to power was seen recently, though this has turned around and new gas-fired capacity is expected to come on stream over the next 10-15 years. Gas consumption for power is expected to steadily increase while gas maintains its share of the generation fuel mix.
Indonesia gas consumption and power generation is concentrated in Java and consumption, as in several countries in the region, is constrained by supply. About 14% of total gas consumption is for power generation and gas represents about 12% of the overall power generation fuel mix. Indonesia commissioned the first section of the gas Integrated Transmission System (ITS national gas distribution grid) in 1998 and is currently constructing the South Sumatra to West Java pipeline which is proceeding in phases, with the first phase due for completion in 2006. Other sections of the ITS will be built between 2006 and 2010 but the most ambitious is the plan to extend its pipeline system with a 1200 km long connection from East Kalimantan to Java, eventually to supply some 10 Bcm of gas a year to meet Java’s increasing demand. Elsewhere in Java various schemes have been suggested for the construction of LNG and CNG receiving terminals. There is emerging demand for gas as CNG as a clean transport fuel in major cities, such as Jakarta and CNG is also being reviewed for power generation in Bali and Sulawesi.
Malaysia continues to experience robust growth and has constructed a 1,700 km Peninsular Gas Utilisation grid to extend gas supply to industry and commerce. The country relies heavily on natural gas for power generation and the proportion of gas being supplied for power generation has risen over recent years to more than 50% of total consumption to about 70% of the power generation fuel mix. The government has now adopted a policy to increase the share of generation that is fuelled by coal. Gas consumption in power generation is however expected to continue to grow however, albeit at a lower rate than previously experienced. Malaysia’s large gas reserves and steadily increasing production and its position as major LNG exporter have contributed to its key role in the region. Current gas developments include the promising Malaysia-Thailand Joint Development Area (JDA).
GAS TO POWER IN SOUTHEAST ASIA AND AUSTRALASIA
SHELL January 2006
5
Philippines successfully launched its gas industry with indigenous gas from Malampaya to Batangas in Luzon and is now developing plans to build onshore pipelines to also supply gas to Manila and Bataan. It is now also considering importing LNG to Luzon, the main island, where a number of locations have been proposed for a prospective LNG receiving terminal. Enhancement of the regulatory environment and the general level of creditworthiness of potential off-takers would be necessary before an LNG receiving terminal could be financed and built.
Singapore receives pipeline gas supply from Indonesia at 6.15 Bcm and Malaysia at 1.6 Bcm a year which has replaced oil in power generation. Gas pipeline imports already, by the end of 2005 were supplying fuel for about 80% of Singapore’s electricity generation needs and it is now conducting a feasibility study to review the options for importing LNG. In addition to providing diversity and security of supply in meeting Singapore’s future gas needs, the storage of LNG for possible re-export is being considered.
Thailand is a large power producer and major consumer of gas and imports 20% of its needs from Myanmar. Over the next 10 years, gas is expected to increase from 31% to 36% of the primary energy mix. PTT currently operates the offshore and onshore gas transmission network and a second pipeline from Myanmar is planned. PTT is planning to expand gas production in the Gulf of Thailand and is constructing a third submarine pipeline to transport gas to Rayong. Currently about 80% of gas consumed is used for power generation and gas-fired power represents about 70% of the generation mix. Much of the additional 20 GW of power planned over the next 10 years will be gas-fired. Thailand is investigating LNG imports which it may need to supplement the supply of gas it from its pipeline supply program. Thailand is also upgrading its power transmission systems and continuing to progress its interconnections with neighbouring countries. Thailand takes 7.5 Bcm of gas from Myanmar in a typical cross-border transaction resulting from bilateral agreements to jointly develop fields to supplement its domestic production.
Vietnam expects power demand growth of 12-15%, which would require the addition of up to 1.5 GW of generation capacity per year over the next 5 years, much of which demand will be met by gas-fired power. In the Phu My area, new power plants will be supplied by gas from the Nam Con Son basin, while the South West basin is being developed to supply projects in that area. Vietnam has substantial hydroelectric potential and is developing both large and small-scale projects. It also has substantial coal reserves which it intends to develop for power. Vietnam is also building a national power transmission and distribution system and expects to complete a national grid by 2020.
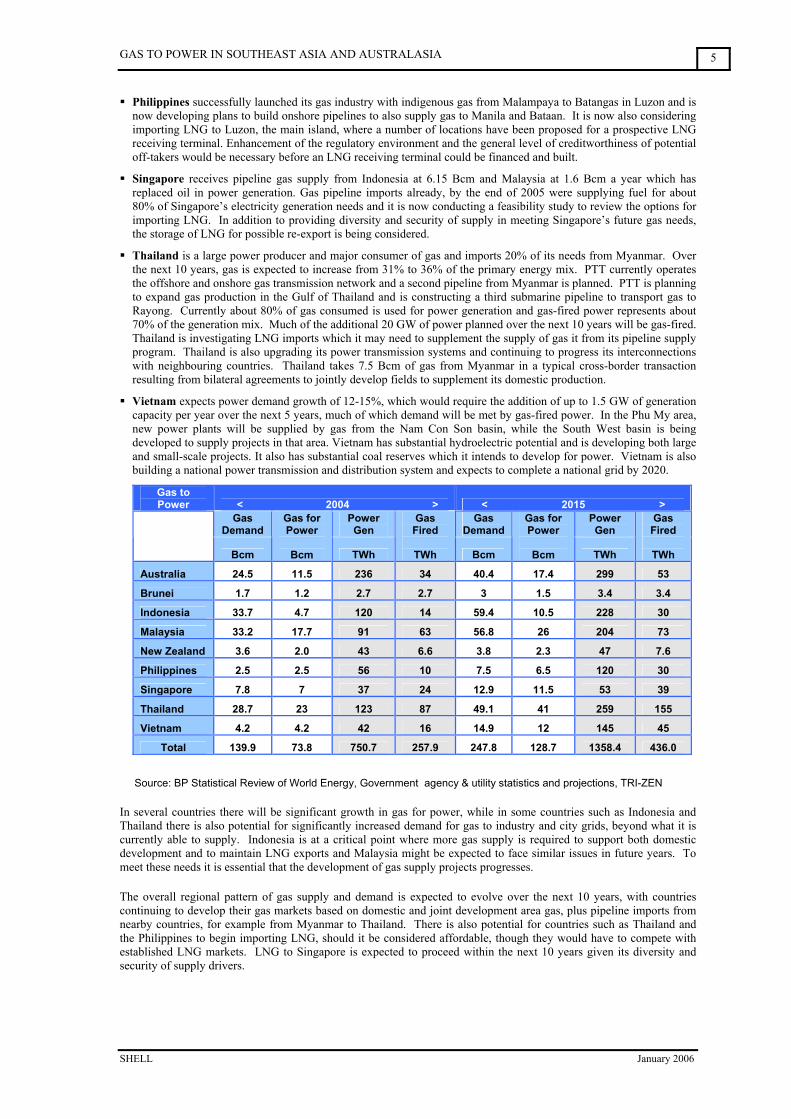
Gas to Power < 2004 > < 2015 >
Gas Demand
Power Gen
Gas Demand
Power Gen
Bcm
Gas for Power
Bcm TWh
Gas Fired
TWh Bcm
Gas for Power
Bcm TWh
Gas Fired
TWh
Australia 24.5 11.5 236 34 40.4 17.4 299 53
Brunei 1.7 1.2 2.7 2.7 3 1.5 3.4 3.4
Indonesia 33.7 4.7 120 14 59.4 10.5 228 30
Malaysia 33.2 17.7 91 63 56.8 26 204 73
New Zealand 3.6 2.0 43 6.6 3.8 2.3 47 7.6
Philippines 2.5 2.5 56 10 7.5 6.5 120 30
Singapore 7.8 7 37 24 12.9 11.5 53 39
Thailand 28.7 23 123 87 49.1 41 259 155
Vietnam 4.2 4.2 42 16 14.9 12 145 45
Total 139.9 73.8 750.7 257.9 247.8 128.7 1358.4 436.0
Source: BP Statistical Review of World Energy, Government agency & utility statistics and projections, TRI-ZEN
In several countries there will be significant growth in gas for power, while in some countries such as Indonesia and Thailand there is also potential for significantly increased demand for gas to industry and city grids, beyond what it is currently able to supply. Indonesia is at a critical point where more gas supply is required to support both domestic development and to maintain LNG exports and Malaysia might be expected to face similar issues in future years. To meet these needs it is essential that the development of gas supply projects progresses.
The overall regional pattern of gas supply and demand is expected to evolve over the next 10 years, with countries continuing to develop their gas markets based on domestic and joint development area gas, plus pipeline imports from nearby countries, for example from Myanmar to Thailand. There is also potential for countries such as Thailand and the Philippines to begin importing LNG, should it be considered affordable, though they would have to compete with established LNG markets. LNG to Singapore is expected to proceed within the next 10 years given its diversity and security of supply drivers.
GAS TO POWER IN SOUTHEAST ASIA AND AUSTRALASIA
SHELL January 2006
6
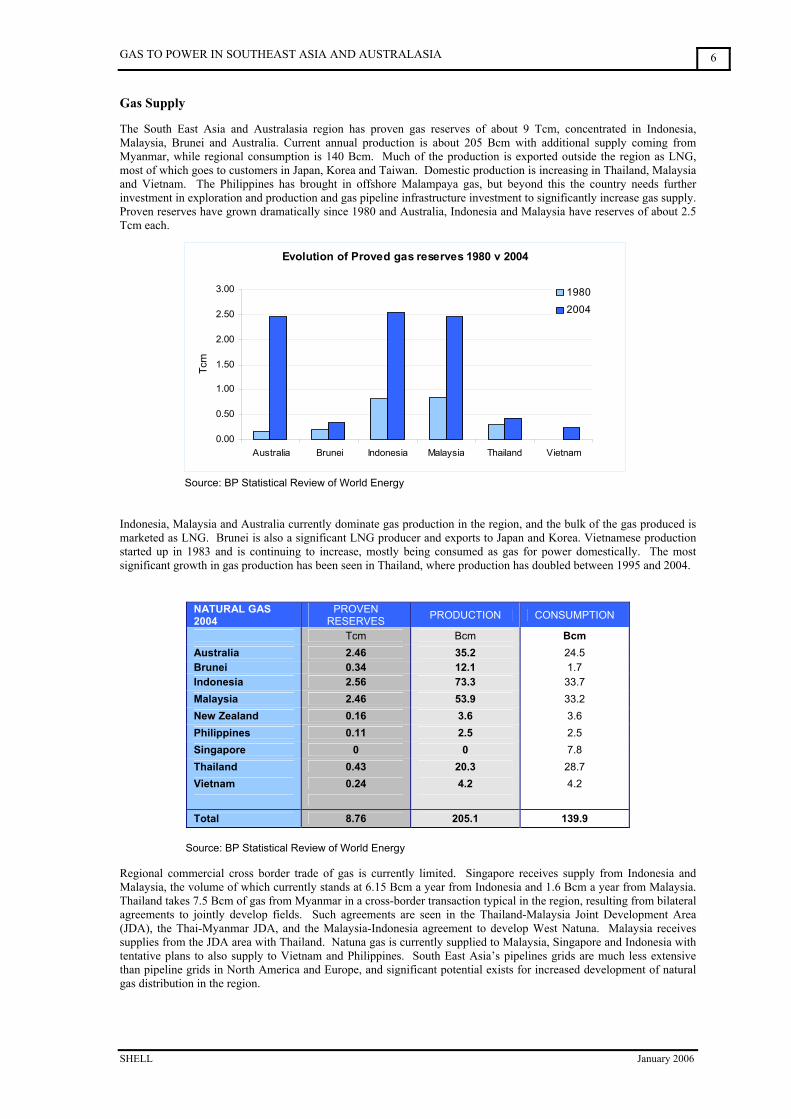
Evolution of Proved gas reserves 1980 v 2004
0.00
0.50
1.00
1.50
2.00
2.50
3.00
Australia Brunei Indonesia Malaysia Thailand Vietnam
Tcm
1980
2004
Gas Supply
The South East Asia and Australasia region has proven gas reserves of about 9 Tcm, concentrated in Indonesia, Malaysia, Brunei and Australia. Current annual production is about 205 Bcm with additional supply coming from Myanmar, while regional consumption is 140 Bcm. Much of the production is exported outside the region as LNG, most of which goes to customers in Japan, Korea and Taiwan. Domestic production is increasing in Thailand, Malaysia and Vietnam. The Philippines has brought in offshore Malampaya gas, but beyond this the country needs further investment in exploration and production and gas pipeline infrastructure investment to significantly increase gas supply. Proven reserves have grown dramatically since 1980 and Australia, Indonesia and Malaysia have reserves of about 2.5 Tcm each.
Source: BP Statistical Review of World Energy
Indonesia, Malaysia and Australia currently dominate gas production in the region, and the bulk of the gas produced is marketed as LNG. Brunei is also a significant LNG producer and exports to Japan and Korea. Vietnamese production started up in 1983 and is continuing to increase, mostly being consumed as gas for power domestically. The most significant growth in gas production has been seen in Thailand, where production has doubled between 1995 and 2004.
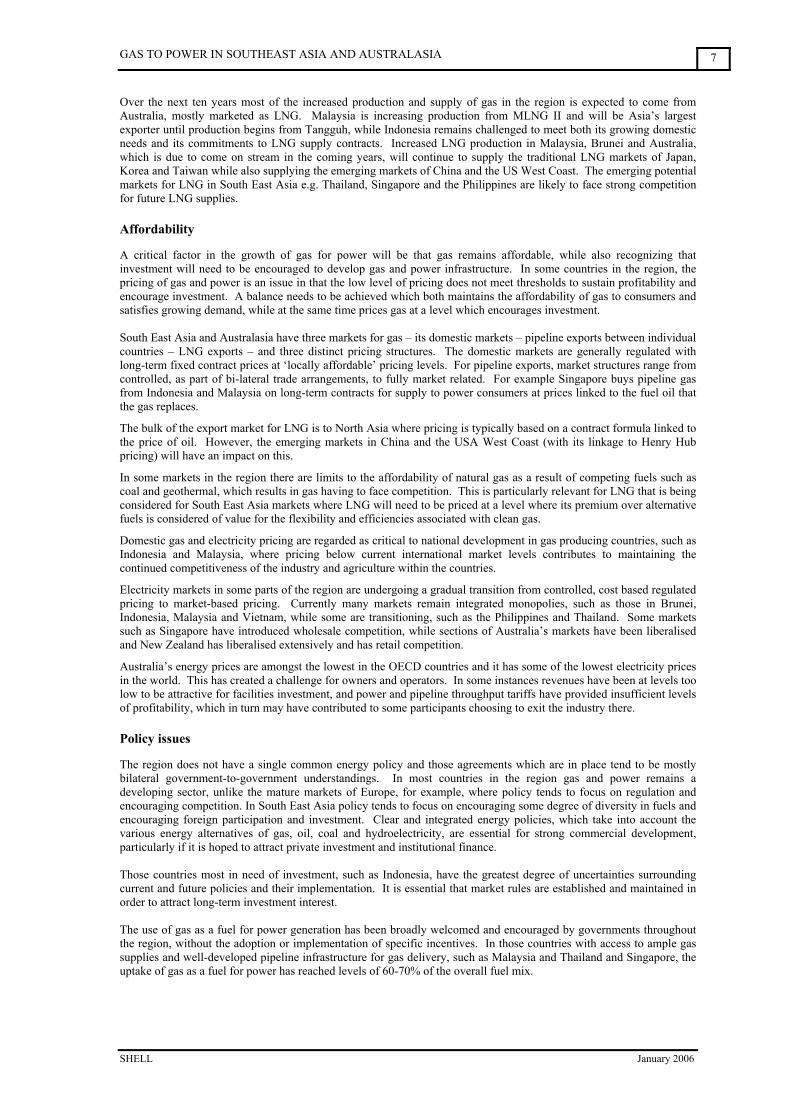
NATURAL GAS 2004
PROVEN RESERVES PRODUCTION CONSUMPTION
Tcm Bcm Bcm Australia 2.46 35.2 24.5 Brunei 0.34 12.1 1.7 Indonesia 2.56 73.3 33.7 Malaysia 2.46 53.9 33.2 New Zealand 0.16 3.6 3.6 Philippines 0.11 2.5 2.5 Singapore 0 0 7.8 Thailand 0.43 20.3 28.7 Vietnam 0.24 4.2 4.2
Total 8.76 205.1 139.9 Source: BP Statistical Review of World Energy Regional commercial cross border trade of gas is currently limited. Singapore receives supply from Indonesia and Malaysia, the volume of which currently stands at 6.15 Bcm a year from Indonesia and 1.6 Bcm a year from Malaysia. Thailand takes 7.5 Bcm of gas from Myanmar in a cross-border transaction typical in the region, resulting from bilateral agreements to jointly develop fields. Such agreements are seen in the Thailand-Malaysia Joint Development Area (JDA), the Thai-Myanmar JDA, and the Malaysia-Indonesia agreement to develop West Natuna. Malaysia receives supplies from the JDA area with Thailand. Natuna gas is currently supplied to Malaysia, Singapore and Indonesia with tentative plans to also supply to Vietnam and Philippines. South East Asia’s pipelines grids are much less extensive than pipeline grids in North America and Europe, and significant potential exists for increased development of natural gas distribution in the region.
GAS TO POWER IN SOUTHEAST ASIA AND AUSTRALASIA
SHELL January 2006
7
Over the next ten years most of the increased production and supply of gas in the region is expected to come from Australia, mostly marketed as LNG. Malaysia is increasing production from MLNG II and will be Asia’s largest exporter until production begins from Tangguh, while Indonesia remains challenged to meet both its growing domestic needs and its commitments to LNG supply contracts. Increased LNG production in Malaysia, Brunei and Australia, which is due to come on stream in the coming years, will continue to supply the traditional LNG markets of Japan, Korea and Taiwan while also supplying the emerging markets of China and the US West Coast. The emerging potential markets for LNG in South East Asia e.g. Thailand, Singapore and the Philippines are likely to face strong competition for future LNG supplies.
Affordability
A critical factor in the growth of gas for power will be that gas remains affordable, while also recognizing that investment will need to be encouraged to develop gas and power infrastructure. In some countries in the region, the pricing of gas and power is an issue in that the low level of pricing does not meet thresholds to sustain profitability and encourage investment. A balance needs to be achieved which both maintains the affordability of gas to consumers and satisfies growing demand, while at the same time prices gas at a level which encourages investment. South East Asia and Australasia have three markets for gas – its domestic markets – pipeline exports between individual countries – LNG exports – and three distinct pricing structures. The domestic markets are generally regulated with long-term fixed contract prices at ‘locally affordable’ pricing levels. For pipeline exports, market structures range from controlled, as part of bi-lateral trade arrangements, to fully market related. For example Singapore buys pipeline gas from Indonesia and Malaysia on long-term contracts for supply to power consumers at prices linked to the fuel oil that the gas replaces.
The bulk of the export market for LNG is to North Asia where pricing is typically based on a contract formula linked to the price of oil. However, the emerging markets in China and the USA West Coast (with its linkage to Henry Hub pricing) will have an impact on this.
In some markets in the region there are limits to the affordability of natural gas as a result of competing fuels such as coal and geothermal, which results in gas having to face competition. This is particularly relevant for LNG that is being considered for South East Asia markets where LNG will need to be priced at a level where its premium over alternative fuels is considered of value for the flexibility and efficiencies associated with clean gas.
Domestic gas and electricity pricing are regarded as critical to national development in gas producing countries, such as Indonesia and Malaysia, where pricing below current international market levels contributes to maintaining the continued competitiveness of the industry and agriculture within the countries.
Electricity markets in some parts of the region are undergoing a gradual transition from controlled, cost based regulated pricing to market-based pricing. Currently many markets remain integrated monopolies, such as those in Brunei, Indonesia, Malaysia and Vietnam, while some are transitioning, such as the Philippines and Thailand. Some markets such as Singapore have introduced wholesale competition, while sections of Australia’s markets have been liberalised and New Zealand has liberalised extensively and has retail competition.
Australia’s energy prices are amongst the lowest in the OECD countries and it has some of the lowest electricity prices in the world. This has created a challenge for owners and operators. In some instances revenues have been at levels too low to be attractive for facilities investment, and power and pipeline throughput tariffs have provided insufficient levels of profitability, which in turn may have contributed to some participants choosing to exit the industry there.
Policy issues
The region does not have a single common energy policy and those agreements which are in place tend to be mostly bilateral government-to-government understandings. In most countries in the region gas and power remains a developing sector, unlike the mature markets of Europe, for example, where policy tends to focus on regulation and encouraging competition. In South East Asia policy tends to focus on encouraging some degree of diversity in fuels and encouraging foreign participation and investment. Clear and integrated energy policies, which take into account the various energy alternatives of gas, oil, coal and hydroelectricity, are essential for strong commercial development, particularly if it is hoped to attract private investment and institutional finance. Those countries most in need of investment, such as Indonesia, have the greatest degree of uncertainties surrounding current and future policies and their implementation. It is essential that market rules are established and maintained in order to attract long-term investment interest. The use of gas as a fuel for power generation has been broadly welcomed and encouraged by governments throughout the region, without the adoption or implementation of specific incentives. In those countries with access to ample gas supplies and well-developed pipeline infrastructure for gas delivery, such as Malaysia and Thailand and Singapore, the uptake of gas as a fuel for power has reached levels of 60-70% of the overall fuel mix.
GAS TO POWER IN SOUTHEAST ASIA AND AUSTRALASIA
SHELL January 2006
8
Malaysia has a National Fuel Policy to promote consumption of indigenous gas and the utility TNB is focused on growing efficient gas-fired generation. The strategic focus is now on improving generation efficiencies by conversion or adoption of combined-cycle generation in place of open-cycle gas turbines. Thailand is committed to a program of gas as fuel for power. It has seen steady high growth in gas-fired power generation and is now turning its attention to using gas within the industrial and transport sectors. In order to enhance energy supply security and maintain low cost efficient gas supplies, Thailand is focused on developing bi-lateral supply arrangements with neighbouring countries. Singapore’s major energy concern is security of supply and, with its recent increased dependence on gas for power generation and a number of instances of interrupted pipeline supply in past years, it has now embarked on detailed studies for the import of LNG as an alternative source of gas supply. Policy in the Philippines in recent years has been to expand the use of natural gas for power. However this has to be set against the relatively high cost and limited supply of gas and the low regulated tariffs for power. Exploration for gas and the development of ‘stranded’ gas supplies in the Philippines is predicated on its eventual use and monetization in power generation. Indonesia faces a number of challenges in further developing gas-fired power generation, largely related to limited gas supply availability and infrastructure for delivery. However new policies allowing flexible negotiations for gas producers and World Bank financial support, part of which is allocated for the provision of technical assistance to restructure the gas and power industries, are addressing some of the key issues. Further, the development of independent power projects is again being actively encouraged. Vietnam has opened its energy sectors to foreign participation to attract investment and to encourage development. It has extensive and ambitious plans for gas-fired power to match its projections for high levels of economic growth. Australia has no single defined policy on fuel for electricity generation and currently gas makes up less than 20% of the mix of fuel for power. In New Zealand the proportion of gas in the fuel mix is similarly limited and, while gas firing is supported by the power generators, it remains to be seen from where the future source of gas for fuelling power will be developed. Certain countries have also adopted policies to promote particular fuels in order to ensure an adequate degree of diversification of fuels for power and to avoid over dependency on any particular source. Malaysia, for example, has a five-fuel policy which seeks to maintain a balance between hydro, coal, oil, gas and more recently renewable energy. It is aiming to generate 5% of the country’s electricity from ‘renewables’, however little progress has been made to date. Thailand is also promoting some fuel diversification, with efforts focussed on environmentally friendly ‘renewables’ such as solar energy. While some countries within the region recognize the Kyoto and Montreal accords, most countries are considered to be emerging economies and as such CO2 emissions will unlikely be a factor in their power investment policies. However recognizing the importance of limiting emissions, some countries have begun converting public transport in major cities to run on gas, such as in Bangkok and Jakarta. New Zealand is a signatory to the Kyoto accord and with its high proportion of hydroelectric power should have little difficulty meeting future emissions targets.
Environmental impacts Gas is a clean and efficient fuel for power. Gas-fired power has generally lower emissions than equivalent coal-fired power. Lower emissions of particulates reduce the incidence of health effects. Lower emissions of nitrogen oxide and sulphur dioxide reduce the potential for regional production of acid rain. Lower emissions of carbon dioxide reduce greenhouse gases and potential global warming. However, while many of the countries of South East Asia are signatories to the Kyoto accord, CO2 emissions have yet to feature significantly in the debate in the region over the choices available for gas and power infrastructure development.
There are potential environmental benefits of increased power trade between countries. Power grid interconnections and increased electricity trade among countries with different energy resources, can offer benefits for the environment. Hydroelectric power has lower emissions of atmospheric pollutants than fossil-fuelled power. Power generation from gas reserves in Malaysia, Indonesia and Brunei could be used to displace coal-fired generation elsewhere.
Hydroelectric power generation in Laos has been constructed specifically for export to neighbouring Thailand. However hydroelectric power brings its own environmental concerns, due in part to the destruction of ecosystems and the displacement of natural habitats. In New Zealand, where the majority of electricity is generated from hydroelectric power, planned new hydroelectric investments have been shelved due to opposition over environmental concerns
Except where dictated by policy and except where “clean-coal” technology is adopted, coal-fired electricity generation growth is expected to attract growing concerns over emissions. Generation from natural gas and renewable energy is increasingly preferred, where the option is available.
GAS TO POWER IN SOUTHEAST ASIA AND AUSTRALASIA
SHELL January 2006
9
Technical influences
Continued advances in gas turbine and generator design have led to highly energy efficient gas fired power generation, with a minimal footprint for land requirements and flexible operability.
Older coal-fired power plant technologies may produce high amounts of particulates, however in modern coal plants, particulates and sulphur dioxide are minimised, while nitrogen oxides are also substantially reduced. So the net environmental benefits of displacing coal-fired power with gas-fired or renewable power depend on the technology assumed for new coal plants.
In general, emissions reductions can be achieved through a combination of reductions in energy demand, shifts from coal-fired electricity generation to natural gas and renewable generation, and by employing additional emissions control technology. However technologies to capture and sequester CO2 have found limited application to date, due to the cost involved, although progress is now being made to make this economic.
GAS TO POWER IN SOUTHEAST ASIA AND AUSTRALASIA
SHELL January 2006
10
3.0 TRENDS AND ISSUES
Investment
In South East Asia, ownership of power generation and gas pipeline facilities is largely with government owned or controlled companies, whereas in Australia ownership of facilities is in the hands of the private sector. Several countries in South East Asia are looking for resurgence in private investment in power development IPP’s to match the interest that was shown in the early 1990’s. Thailand and Vietnam in particular benefited in the past from private investment in the power sector before the Asian financial crisis of 1997/8 and now, with economies having recovered, are looking again for private investment.
In Indonesia, a considerable amount of private and foreign investment went into the power generation sector in the early 1990’s prior to the 1997/8 financial crisis. However the fall out from the crisis which resulted in back-tracking on, or renegotiation of, commercial agreements with the private power producers, caused a severe loss of investor confidence. Commitment to allow PLN to restructure and raise tariffs sufficiently to allow the elimination of subsidies and to secure its financial viability long-term has yet to be seen. Investor concerns remain in spite of new legislation to reform the industry and no significant new private investment has been made in the power sector.
One of the largest factors influencing development and investment in power in the region is the process of privatisation. Privatisation had a degree of momentum some ten years ago and opened up opportunities for investment at that time. The process has advanced only slowly however, and at differing speeds and levels of success. Before this effort, in many countries, government-owned monopolies controlled the whole of the electricity industry, with the entire flow, beginning from fuel supply to generation and ending at metered billing, controlled by state monopolies. Further privatisation and increased transparency in regulations and tariff structures would significantly encourage investment.
Gas to Power – Drivers
Power is the largest and most readily monetized market for gas throughout the region, whether it is gas for domestic generation of power, or gas for export to neighbouring countries in the region for power generation, or gas as LNG exports to North Asia and the emerging US West Coast market. Power demand, and particularly gas-fired power demand, is growing strongly in many of South East Asia’s developing nations and there remains substantial potential for further increases in the use of gas-fired power in the region.
Energy resources, such as oil, gas and coal are indigenous to South East Asia and Australasia. While gas has
been available to fuel the growing demands of power generation, more is needed. Currently developed gas reserves are insufficient to meet the regions long-term needs. Governments and industry in the region are cooperating to develop reserves, but this needs to be accelerated.
Efficiencies and the flexibility associated with gas-fired power contribute to its economic attractiveness.
Continued advances in generator design have led to highly energy efficient installations, with a minimal footprint for land requirements and flexible operability. The handling of gas versus alternative fuels is also more efficient and flexible.
Environmental benefits of clean burning gas are an increasing driver in the region. Not only is gas-fired
generation preferred to coal and oil, because of its lower emissions, particularly when located in the vicinity of urban areas, there is increasing awareness of the environmental and social costs associated with alternatives such as large hydro electricity generation projects.
Gas to Power – Barriers
Developing economies, such as those of several of the countries in the region, have unfulfilled demand for electricity and limited infrastructure. Investment is therefore needed at all value chain stages to implement gas for power generation, whether it is for gas transportation, power generation, transmission or distribution.
Security of supply of gas is becoming less of a barrier to development as more pipelines are constructed, however
latent demand for gas exists in several countries and several gas markets are supply constrained.
Diversity of fuels for power is a policy requirement where some countries have a strategic requirement to use indigenous fuels and maintain a degree of diversity. This is not however expected to have a significant impact on the continued uptake of gas for power.
Affordability of gas for power will be required to maintain growth. Currently, gas for domestic consumption and power generation in the region is priced in most countries at levels significantly below what might be achieved at export market prices if the gas was exported. At current export market prices, gas would lose its attractiveness for domestic consumption versus alternative fuel options.
GAS TO POWER IN SOUTHEAST ASIA AND AUSTRALASIA
SHELL January 2006
11
Pricing of gas and power is an issue in parts of the region not because the price is currently unaffordable or prohibitively high, rather that the low level of pricing does not meet threshold to attract investment or sustain profitability in some of the countries where investment is most in need.
Policy and regulatory issues, or rather the lack of a clear and integrated energy policy, with well established
regulation and the appropriate economic drivers in place is a significant barrier to the private investment and institutional investment that is needed to promote growth in several countries in the region.
Financing of gas and power projects continues to be a challenge in countries where policy or regulatory issues
have yet to be resolved and where creditworthy off-takers are unable to make commitments.
Other Fuels – Nuclear, Clean Coal Gasification and Renewables
Nuclear
South East Asia and Australasia have yet to embrace nuclear fuelled power; however several countries have active research programmes. Indonesia and Vietnam have developed plans for commercial reactors for power generation. Indonesia has three research reactors and the government has plans to commission commercial facilities from 2015. Vietnam has a research reactor and has outlined plans for commercial development. Thailand has a single research reactor and a second one under construction and is considering a commercial programme. Malaysia and the Philippines at this stage have research programmes. While countries in the region are preparing for future nuclear power, it remains a long-term option and is not expected to feature in the foreseeable outlook.
Clean Coal
Rising energy prices have brought renewed emphasis on coal. Coal meets much of Asia’s primary energy demand and coal will remain dominant in the energy mix for a long time. While technological advances have made coal fired power more environmentally acceptable, coal gasification projects have emerged as viable alternatives in recent years.
Coal gasification is the cleanest and most efficient method available to produce synthesis gas for use in fertiliser or clean fuels production that can be used for power. It brings emission levels of key pollutants down near to natural gas utilisation levels. Coal gasification also provides an option for producing hydrogen, and it also opens the possibility for coal utilization without emission of carbon dioxide to the atmosphere because it offers a cost effective way of capturing CO2.
Shell has developed coal gasification technology which had its first commercial application in the NUON Integrated Gasification Combined Cycle plant 253 MW power generation plant in The Netherlands in 1994. Although this technology has yet to be adopted in South East Asia or Australasia, there are currently several coal gasification projects underway in China.
Renewables
Hydroelectric power is already well established in the region and interest in renewable energy, in the form of bio-mass, wind power and geothermal energy, is growing in various parts of the region. There are many emerging initiatives for bio-mass in South East Asia’s agricultural economies in countries such as Malaysia, Indonesia, the Philippines and Vietnam. These provide energy, often in the form of gas and often on a small scale; however larger industrial applications are also being developed for cogeneration from bio-waste fuel, for example in the sugar plants in the Philippines. Wind power is well established in New Zealand and is being developed in other countries in the region, such as Malaysia and the Philippines. Geothermal energy is being utilized for power in New Zealand and in the Philippines, where it is believed potential might ultimately exist to tap up to 5 GW of geothermal fuelled power. The Philippines expects to become the world’s largest producer of geothermal power in future years.
GAS TO POWER IN SOUTHEAST ASIA AND AUSTRALASIA
SHELL January 2006
12
4.0 REGIONAL INITIATIVES
The use of natural gas is expanding rapidly in South East Asia and Australasia, particularly for electricity generation. A result of this has been the development of plans for liberalisation or privatisation to make both gas and power markets more competitive. A further outcome of the rapid development of electricity and gas consumption has been in interest among countries within South East Asia to cooperate, either bi-laterally or as a group, to develop both power transmission and gas transportation infrastructure.
Power Grids
As in most developing regions, demand for power in South East Asia has outpaced the development of transmission grids. Electricity power grids can improve power supply reliability, lower electricity costs, and reduce environmental impacts. Power grids improve supply reliability by enabling the system to cope better with the outage of specific generating units or types of generating units, and by limiting the scope of power outages.
Power grids can lower fuel costs by allowing generation from hydro and coal-fired power plants to displace higher cost generation. In South East Asia, gas-fired power from Indonesia and Malaysia could displace oil-fired power elsewhere. Hydropower from China, Laos and Myanmar could reduce emissions from fossil-fuelled generation in Thailand and Vietnam. Thailand is already being supplied with hydro power from Laos. The expansion of power transmission grids is more cost effective than expansion of gas pipeline grids, unless large amounts of gas are being moved. Gas pipelines have relatively high fixed costs and relatively low operating costs per kilometre or cubic metre.
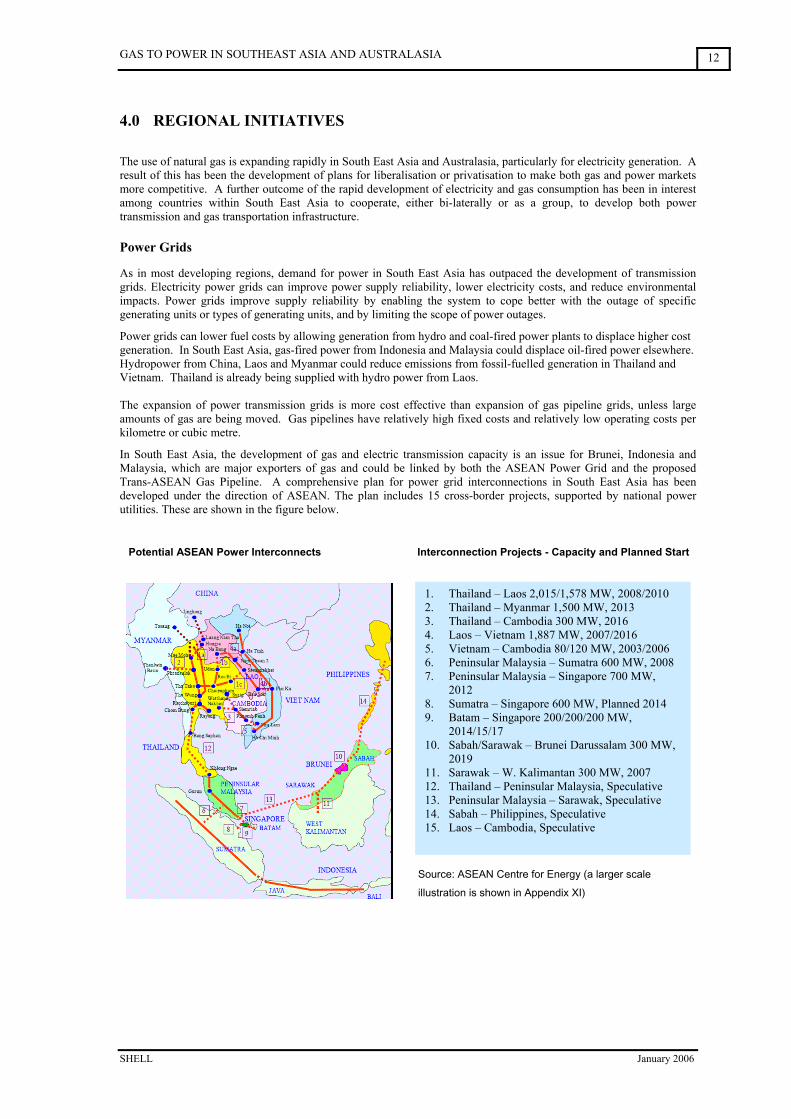
In South East Asia, the development of gas and electric transmission capacity is an issue for Brunei, Indonesia and Malaysia, which are major exporters of gas and could be linked by both the ASEAN Power Grid and the proposed Trans-ASEAN Gas Pipeline. A comprehensive plan for power grid interconnections in South East Asia has been developed under the direction of ASEAN. The plan includes 15 cross-border projects, supported by national power utilities. These are shown in the figure below.
Potential ASEAN Power Interconnects Interconnection Projects - Capacity and Planned Start
1. Thailand – Laos 2,015/1,578 MW, 2008/2010 2. Thailand – Myanmar 1,500 MW, 2013 3. Thailand – Cambodia 300 MW, 2016 4. Laos – Vietnam 1,887 MW, 2007/2016 5. Vietnam – Cambodia 80/120 MW, 2003/2006 6. Peninsular Malaysia – Sumatra 600 MW, 2008 7. Peninsular Malaysia – Singapore 700 MW,
2012 8. Sumatra – Singapore 600 MW, Planned 2014 9. Batam – Singapore 200/200/200 MW,
2014/15/17 10. Sabah/Sarawak – Brunei Darussalam 300 MW,
2019 11. Sarawak – W. Kalimantan 300 MW, 2007 12. Thailand – Peninsular Malaysia, Speculative 13. Peninsular Malaysia – Sarawak, Speculative 14. Sabah – Philippines, Speculative 15. Laos – Cambodia, Speculative
Source: ASEAN Centre for Energy (a larger scale
illustration is shown in Appendix XI)

GAS TO POWER IN SOUTHEAST ASIA AND AUSTRALASIA
SHELL January 2006
13
While transmission links are already successfully in operation bi-laterally to bring, for example, hydro electricity from Laos to Thailand, the power grid master plan is ambitious when compared to the current transmission capacity. The planned 700 MW link between Singapore and Peninsular Malaysia, to be completed by 2010, will complement an existing 500 MW link. The planned interconnections between Thailand and Laos, 2,015 MW of transmission capacity in 2008 and another 1,578 MW in 2010, will build on earlier links of 75 MW in 1972, 45 MW and 214 MW in 1998 and 126 MW in 1999.
Gas Grids The growing demand for gas in South East Asia for power generation has prompted the development of ambitious plans to link most of the gas producing and consuming countries in the region. There are currently six bi-lateral agreements for the supply of gas between countries, the first of these was between Malaysia and Singapore in 1992. Myanmar has two pipelines to supply Thailand. Indonesia has two pipelines to supply Singapore, while a third pipeline supplies Malaysia. Indonesia has plans for several pipelines to transport gas from South Sumatra and East Kalimantan to Java. The development of the Association of South East Asian Nations (ASEAN) gas grid has been discussed for many years. Although the number of pipelines in South East Asia is increasing, most are designed to supply gas from one location to another, without onward transmission.
South East Asia Existing and Planned Gas Pipeline Infrastructure
Source: ASEAN Centre for Energy and TRI-ZEN
There remain a number of substantial practical constraints to completing a gas grid. Many of the pipelines are designed for a specific volume based on a long-term contract of generally 20 years between a single supplier and off-taker. Thus, the pipelines generally do not have extra capacity to allow for additional hook-ups. Additional issues include:
Limited commercial incentive to “fill in the gaps”, particularly the pipeline to the Philippines
Lack of open access agreements
Absence of common agreements among national legal and regulatory frameworks, as well gas pricing schedules
Absence of common technical standards
An assumption that Indonesia will be the major supplier into the grid
ASEAN is working on these issues, but they will receive medium to long-term review and therefore it may be more than the projected ten years before an effective commercial ASEAN gas grid will be established.
OperatingUnder constructionPlanned
GAS TO POWER IN SOUTHEAST ASIA AND AUSTRALASIA
SHELL January 2006
14
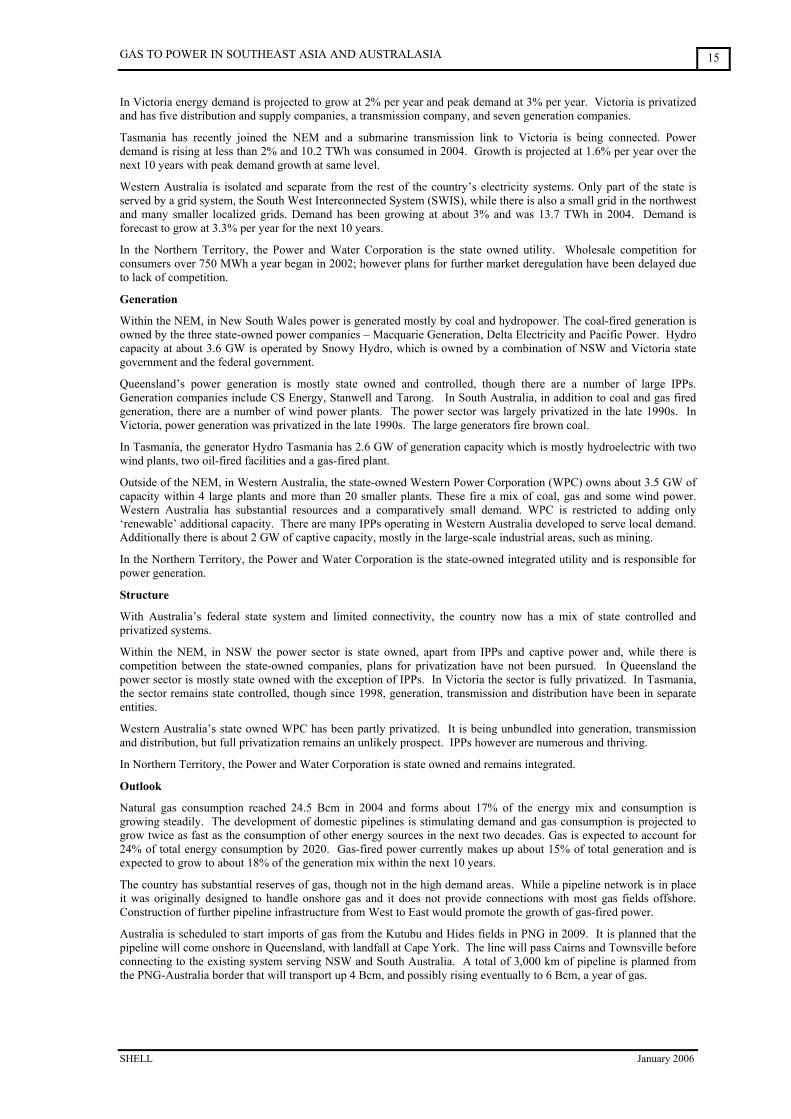
Power Demand by Sector
Residential 27%
Industrial 50%
Other 9%Commercial
24%
Power Generation by fuel mix
Coal 75%
Gas 15%
Hydro 7%Other 3%
5.0 COUNTRY PROFILES
Australia
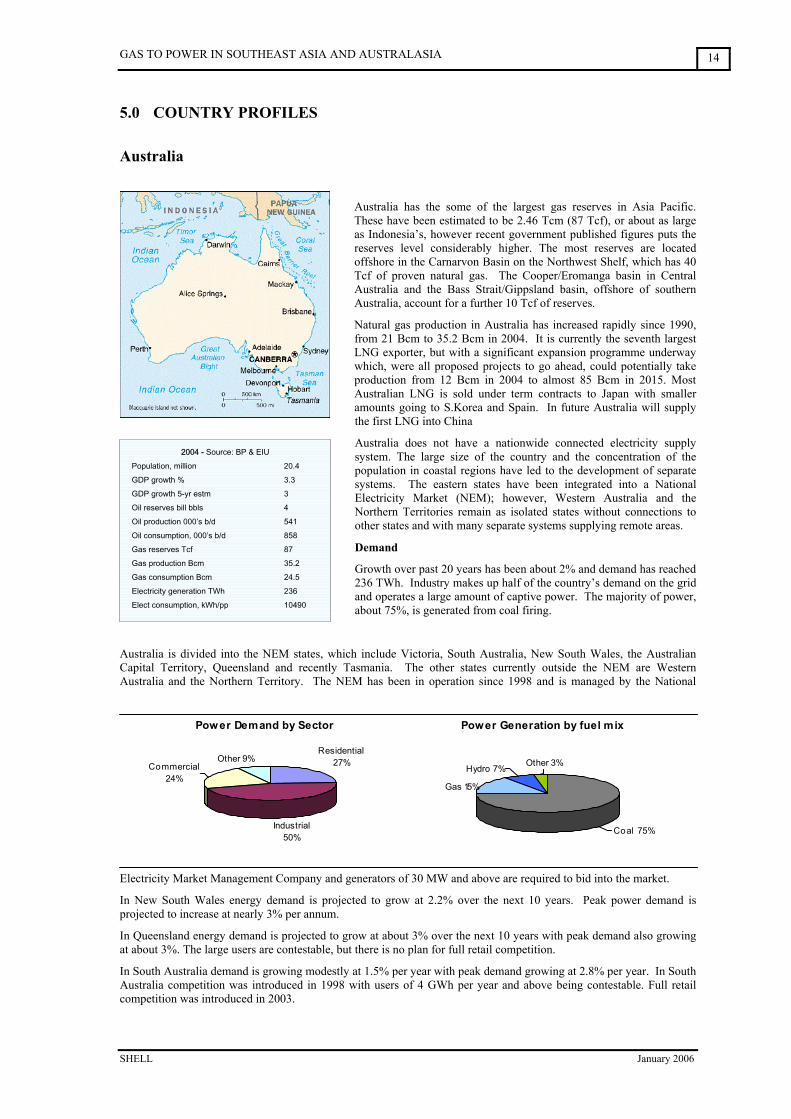
Australia has the some of the largest gas reserves in Asia Pacific. These have been estimated to be 2.46 Tcm (87 Tcf), or about as large as Indonesia’s, however recent government published figures puts the reserves level considerably higher. The most reserves are located offshore in the Carnarvon Basin on the Northwest Shelf, which has 40 Tcf of proven natural gas. The Cooper/Eromanga basin in Central Australia and the Bass Strait/Gippsland basin, offshore of southern Australia, account for a further 10 Tcf of reserves.
Natural gas production in Australia has increased rapidly since 1990, from 21 Bcm to 35.2 Bcm in 2004. It is currently the seventh largest LNG exporter, but with a significant expansion programme underway which, were all proposed projects to go ahead, could potentially take production from 12 Bcm in 2004 to almost 85 Bcm in 2015. Most Australian LNG is sold under term contracts to Japan with smaller amounts going to S.Korea and Spain. In future Australia will supply the first LNG into China
Australia does not have a nationwide connected electricity supply system. The large size of the country and the concentration of the population in coastal regions have led to the development of separate systems. The eastern states have been integrated into a National Electricity Market (NEM); however, Western Australia and the Northern Territories remain as isolated states without connections to other states and with many separate systems supplying remote areas.
Demand
Growth over past 20 years has been about 2% and demand has reached 236 TWh. Industry makes up half of the country’s demand on the grid and operates a large amount of captive power. The majority of power, about 75%, is generated from coal firing.
Australia is divided into the NEM states, which include Victoria, South Australia, New South Wales, the Australian Capital Territory, Queensland and recently Tasmania. The other states currently outside the NEM are Western Australia and the Northern Territory. The NEM has been in operation since 1998 and is managed by the National
Electricity Market Management Company and generators of 30 MW and above are required to bid into the market.
In New South Wales energy demand is projected to grow at 2.2% over the next 10 years. Peak power demand is projected to increase at nearly 3% per annum.
In Queensland energy demand is projected to grow at about 3% over the next 10 years with peak demand also growing at about 3%. The large users are contestable, but there is no plan for full retail competition.
In South Australia demand is growing modestly at 1.5% per year with peak demand growing at 2.8% per year. In South Australia competition was introduced in 1998 with users of 4 GWh per year and above being contestable. Full retail competition was introduced in 2003.
2004 - Source: BP & EIU
Population, million 20.4
GDP growth % 3.3
GDP growth 5-yr estm 3
Oil reserves bill bbls 4
Oil production 000’s b/d 541
Oil consumption, 000’s b/d 858
Gas reserves Tcf 87
Gas production Bcm 35.2
Gas consumption Bcm 24.5
Electricity generation TWh 236
Elect consumption, kWh/pp 10490
GAS TO POWER IN SOUTHEAST ASIA AND AUSTRALASIA
SHELL January 2006
15
In Victoria energy demand is projected to grow at 2% per year and peak demand at 3% per year. Victoria is privatized and has five distribution and supply companies, a transmission company, and seven generation companies.
Tasmania has recently joined the NEM and a submarine transmission link to Victoria is being connected. Power demand is rising at less than 2% and 10.2 TWh was consumed in 2004. Growth is projected at 1.6% per year over the next 10 years with peak demand growth at same level.
Western Australia is isolated and separate from the rest of the country’s electricity systems. Only part of the state is served by a grid system, the South West Interconnected System (SWIS), while there is also a small grid in the northwest and many smaller localized grids. Demand has been growing at about 3% and was 13.7 TWh in 2004. Demand is forecast to grow at 3.3% per year for the next 10 years.
In the Northern Territory, the Power and Water Corporation is the state owned utility. Wholesale competition for consumers over 750 MWh a year began in 2002; however plans for further market deregulation have been delayed due to lack of competition.
Generation
Within the NEM, in New South Wales power is generated mostly by coal and hydropower. The coal-fired generation is owned by the three state-owned power companies – Macquarie Generation, Delta Electricity and Pacific Power. Hydro capacity at about 3.6 GW is operated by Snowy Hydro, which is owned by a combination of NSW and Victoria state government and the federal government.
Queensland’s power generation is mostly state owned and controlled, though there are a number of large IPPs. Generation companies include CS Energy, Stanwell and Tarong. In South Australia, in addition to coal and gas fired generation, there are a number of wind power plants. The power sector was largely privatized in the late 1990s. In Victoria, power generation was privatized in the late 1990s. The large generators fire brown coal.
In Tasmania, the generator Hydro Tasmania has 2.6 GW of generation capacity which is mostly hydroelectric with two wind plants, two oil-fired facilities and a gas-fired plant.
Outside of the NEM, in Western Australia, the state-owned Western Power Corporation (WPC) owns about 3.5 GW of capacity within 4 large plants and more than 20 smaller plants. These fire a mix of coal, gas and some wind power. Western Australia has substantial resources and a comparatively small demand. WPC is restricted to adding only ‘renewable’ additional capacity. There are many IPPs operating in Western Australia developed to serve local demand. Additionally there is about 2 GW of captive capacity, mostly in the large-scale industrial areas, such as mining.
In the Northern Territory, the Power and Water Corporation is the state-owned integrated utility and is responsible for power generation.
Structure
With Australia’s federal state system and limited connectivity, the country now has a mix of state controlled and privatized systems.
Within the NEM, in NSW the power sector is state owned, apart from IPPs and captive power and, while there is competition between the state-owned companies, plans for privatization have not been pursued. In Queensland the power sector is mostly state owned with the exception of IPPs. In Victoria the sector is fully privatized. In Tasmania, the sector remains state controlled, though since 1998, generation, transmission and distribution have been in separate entities.
Western Australia’s state owned WPC has been partly privatized. It is being unbundled into generation, transmission and distribution, but full privatization remains an unlikely prospect. IPPs however are numerous and thriving.
In Northern Territory, the Power and Water Corporation is state owned and remains integrated.
Outlook
Natural gas consumption reached 24.5 Bcm in 2004 and forms about 17% of the energy mix and consumption is growing steadily. The development of domestic pipelines is stimulating demand and gas consumption is projected to grow twice as fast as the consumption of other energy sources in the next two decades. Gas is expected to account for 24% of total energy consumption by 2020. Gas-fired power currently makes up about 15% of total generation and is expected to grow to about 18% of the generation mix within the next 10 years.
The country has substantial reserves of gas, though not in the high demand areas. While a pipeline network is in place it was originally designed to handle onshore gas and it does not provide connections with most gas fields offshore. Construction of further pipeline infrastructure from West to East would promote the growth of gas-fired power.
Australia is scheduled to start imports of gas from the Kutubu and Hides fields in PNG in 2009. It is planned that the pipeline will come onshore in Queensland, with landfall at Cape York. The line will pass Cairns and Townsville before connecting to the existing system serving NSW and South Australia. A total of 3,000 km of pipeline is planned from the PNG-Australia border that will transport up 4 Bcm, and possibly rising eventually to 6 Bcm, a year of gas.
GAS TO POWER IN SOUTHEAST ASIA AND AUSTRALASIA
SHELL January 2006
16
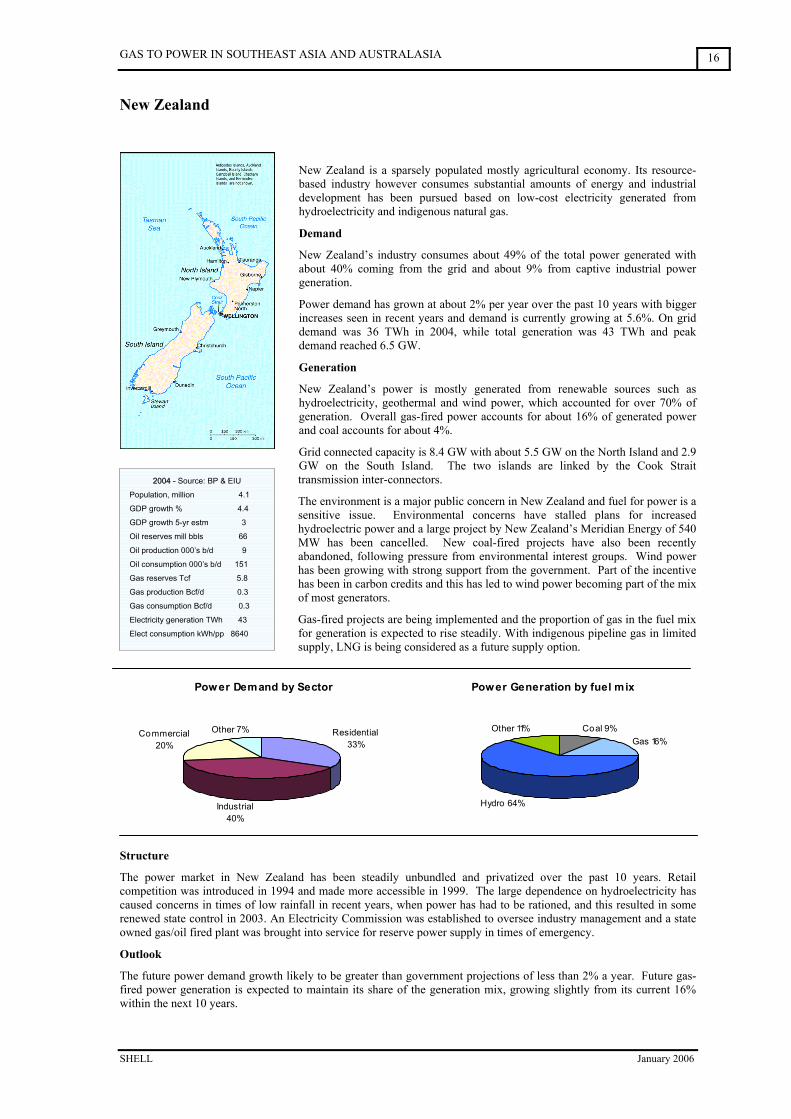
Power Demand by Sector
Residential 33%
Industrial 40%
Commercial 20%
Other 7%
Power Generation by fuel mix
Coal 9%Gas 16%
Hydro 64%
Other 11%
New Zealand
New Zealand is a sparsely populated mostly agricultural economy. Its resource-based industry however consumes substantial amounts of energy and industrial development has been pursued based on low-cost electricity generated from hydroelectricity and indigenous natural gas.
Demand
New Zealand’s industry consumes about 49% of the total power generated with about 40% coming from the grid and about 9% from captive industrial power generation.
Power demand has grown at about 2% per year over the past 10 years with bigger increases seen in recent years and demand is currently growing at 5.6%. On grid demand was 36 TWh in 2004, while total generation was 43 TWh and peak demand reached 6.5 GW.
Generation
New Zealand’s power is mostly generated from renewable sources such as hydroelectricity, geothermal and wind power, which accounted for over 70% of generation. Overall gas-fired power accounts for about 16% of generated power and coal accounts for about 4%.
Grid connected capacity is 8.4 GW with about 5.5 GW on the North Island and 2.9 GW on the South Island. The two islands are linked by the Cook Strait transmission inter-connectors.
The environment is a major public concern in New Zealand and fuel for power is a sensitive issue. Environmental concerns have stalled plans for increased hydroelectric power and a large project by New Zealand’s Meridian Energy of 540 MW has been cancelled. New coal-fired projects have also been recently abandoned, following pressure from environmental interest groups. Wind power has been growing with strong support from the government. Part of the incentive has been in carbon credits and this has led to wind power becoming part of the mix of most generators.
Gas-fired projects are being implemented and the proportion of gas in the fuel mix for generation is expected to rise steadily. With indigenous pipeline gas in limited supply, LNG is being considered as a future supply option.
Structure
The power market in New Zealand has been steadily unbundled and privatized over the past 10 years. Retail competition was introduced in 1994 and made more accessible in 1999. The large dependence on hydroelectricity has caused concerns in times of low rainfall in recent years, when power has had to be rationed, and this resulted in some renewed state control in 2003. An Electricity Commission was established to oversee industry management and a state owned gas/oil fired plant was brought into service for reserve power supply in times of emergency.
Outlook
The future power demand growth likely to be greater than government projections of less than 2% a year. Future gas-fired power generation is expected to maintain its share of the generation mix, growing slightly from its current 16% within the next 10 years.
2004 - Source: BP & EIU
Population, million 4.1
GDP growth % 4.4
GDP growth 5-yr estm 3
Oil reserves mill bbls 66
Oil production 000’s b/d 9
Oil consumption 000’s b/d 151
Gas reserves Tcf 5.8
Gas production Bcf/d 0.3
Gas consumption Bcf/d 0.3
Electricity generation TWh 43
Elect consumption kWh/pp 8640
GAS TO POWER IN SOUTHEAST ASIA AND AUSTRALASIA
SHELL January 2006
17
2004 - Source: BP & EIU
Population, million 0.35
GDP growth % 1.7
GDP growth 5-yr estm 1.5
Oil reserves mill bbls 1,100
Oil production 000’s b/d 211
Oil consumption 000’s b/d 6
Gas reserves Tcf 12.1
Gas production Bcm 12.1
Gas consumption Bcf/d 0.2
Electricity generation TWh 2.7
Elect consumption kWh/pp 6,235
Brunei
Brunei is a small country strategically located by the sea lanes connecting the Indian and Pacific Oceans. It is the fourth-largest producer of LNG in Asia and currently exports about 7 million tonnes per annum, mainly to Japan and Korea.
Oil & gas revenues account for one-third of GDP and about 80% of exports and government revenues. Its per capita GDP is one of the highest among non-OECD countries. It has a relatively small manufacturing sector and the state provides for most services.
Brunei has proved gas reserves 0.34 Tcm (12 Tcf) and reserves to production ratio of 28.3. Most of Brunei’s gas is produced by Brunei Shell Petroleum (BSP) and the balance, about 10% by Total S.A. Main fields – South West Ampa, which represents half of Brunei’s gas reserves and production, and Fairley. Gas production was 12.1 Bcm in 2004, a slight decrease from 2003.
Demand
Domestic gas consumption was about 1.7 Bcm in 2004, most of which is consumed for domestic power generation.
Brunei has a small power market and generation capacity is about 0.7 GW. Residential demand accounts for about 38% of electricity usage, while the government accounts for 28%, the commercial sector 19% and the oil & gas industry 15%.
Generation
The power facilities are natural gas-fired using simple cycle turbines, apart from the Lumut cogeneration plant and the facility at Belingus.
A first combined cycle power project is underway at Bukit Pangal, Tutong and this will generate 110MW and is due on stream mid-2007. This is the first phase of an expected four-phase power development.
Structure
The power industry is owned and operated by state company, Berakas Power Company, BPL.
Outlook
Brunei became Asia’s first LNG exporter in 1972 and has recently overhauled its liquefaction cryogenic heat exchangers to extend the life of the existing facilities for what is hoped to be a further 30 years. Brunei has plans to bring on stream a sixth LNG train in future.
The use of natural gas resources to develop a domestic petrochemicals industry is under review and the aluminium producer Alcoa has undertaken a feasibility study for a $1.5 billion gas-fired aluminium smelter in Seria. This would significantly increase Brunei’s domestic power consumption.
All power generation is gas-fired and is expected remain so in future although the amount of generation is small. Gas-fired power generation is expected to grow by about 25% over the next 10 years.
GAS TO POWER IN SOUTHEAST ASIA AND AUSTRALASIA
SHELL January 2006
18
2004 - Source: EIA & EIU
Population, million 13.6
GDP growth % 7.7
GDP growth 5-yr estm 6.5
Oil reserves mill bbls 0
Oil production 000’s b/d 0
Oil consumption 000’s b/d 8
Gas reserves Tcf -
Gas production Bcm 0
Gas consumption Bcf/d 0
Electricity generation TWh 1.0
Elect consumption kWh/pp 60
Cambodia
Cambodia has no gas industry and a currently very small electricity sector with limited generation capacity. All generation is reliant on imported diesel. However the country is targeting the sector to contribute to economic growth and social development. International credit agencies are providing support and encouraging reforms to encourage private sector involvement and to develop an efficient and competitive industry.
Cambodia has 24 small isolated power systems, centred largely on provincial cities and towns. The country’s infrastructure is being reconstructed, having been damaged by past conflicts. Annual consumption of electricity per capita is only about 60 kWh. Cambodia has plans for a nationwide power system and has hydroelectric potential.
Demand
Phnom Penh, the capital, accounts for about 70% of the country’s electricity consumption. Available capacity in Phnom Penh is about 130 MW and peak demand is about 80 MW. Only about 10% of the mostly rural population has access to electricity. Annual consumption is less than 1 TWh and electricity prices are some of the highest in the region.
Generation
Electricity generation capacity totals less than 200 MW and the main grid is centred in Phnom Penh. Total installed capacity in provincial towns amounts to about 50 MW with power generation units sized from 300 kW to 5 MW. Peak demand is expected to increase to 175 MW in 2010. Private generators currently import about 7 MW from Thailand and Electricite du Cambodge (EDC) imports about 4 MW from Vietnam.
Structure
The Ministry of Industry, Mines & Energy (MIME) is the government agency responsible for the co-ordination of electricity sector policy, planning and development. The state generator, serving Phnom Penh and six provincial cities is Electricite du Cambodge (EDC). The rest of the country is supplied by MIME or IPP’s contracted to MIME.
Outlook
The Government introduced the Cambodia Power Sector Strategy in 1999 to create a nationwide electric supply system by 2016. The key components are the creation of a Southern grid based on Phnom Penh with two inter-connectors to Vietnam and a Western grid based around Siem Reap with an inter-connector to Thailand. Cities not connected to either of the main grids would be supplied by local IPP’s with diesel giving way to hydro electricity. There are already a number of privately owned very small micro-hydropower plants with installed capacities ranging up to 50 kW.
Cambodia has the potential to produce hydroelectric power. Cross border supply to Thailand is planned for about 300 MW by 2016 and there are plans to build about another 700 MW of hydroelectric capacity at Lower Sesan (207 MW), Lower Srepok (222 MW), St Chay Areng (260 MW) and Kirirom III (13 MW). However these plans may have evolved differently by the time they are implemented.
Possible reserves of 2.7 Tcf of natural gas have been identified offshore, but these reserves have not been proved up and developed. Coal reserves of about 7 million tonnes have been identified, but these have not been developed. Cambodia also has plans to develop renewable biomass energy.
Cambodia will need to see significant further development in the future before prospects for gas to power become a possibility.
GAS TO POWER IN SOUTHEAST ASIA AND AUSTRALASIA
SHELL January 2006
19
2004 - Source: BP & EIU
Population, million 242
GDP growth % 5.1
GDP growth 5-yr estm 4.8
Oil reserves bill bbls 4.7
Oil production mill b/d 1.1
Oil consumption mill b/d 1.2
Gas reserves Tcf 90
Gas production Bcf/d 7.1
Gas consumption Bcf/d 3.2
Elect generation TWh 120
Elect Consumption kWh/pp 370
Power Demand by Sector
Residential 40%
Industry 42%
Commercial 13.50%
Other 4.50%
Power Generation by fuel mix
Oil, 8% Coal, 62%
Hydro, 9%Other, 8%
Gas, 12%
Indonesia
Indonesia is the largest country in South East Asia, is highly populated with mostly mountainous terrain, and has over 13,000 islands stretching over 5000 km from North Sumatra to Irian Jaya. It has the largest proven gas reserves in Asia with 2.5 Tcm, about the same as Australia. Gas production is flat at around 73 Bcm and approximately 50% is exported as LNG, while domestic demand is rapidly increasing. LNG exports had to be reduced in 2004/5. It sold 25.5 million tonnes in 2004, but is contracted to increase supplies and export over 29 million tonnes in 2009. Indonesia also exports gas by pipeline from the West Natuna field to Malaysia and Singapore and from Sumatra to Singapore.
Indonesia faces challenges supplying electricity across its widespread geography where gas resources are remote from population centres. These difficulties were exacerbated by the political and economic crises of the late 1990’s, which saw foreign and private investment retreat from the sector.
Demand
Indonesia saw strong demand growth for electricity up until the Asian financial crisis of 1997/8, when consumption contracted and investment stalled. Economic growth and power demand have now rebounded, driven by exports of goods and commodities helped by the depreciated currency valuation.
Electricity sales totalled about 120 TWh in 2004, with about 100 TWh, being consumed in the Java-Bali region, about 10 TWh in Sumatra and about 6 TWh in Sulawesi and Kalimantan. Demand growth is expected to exceed 7% a year in line with economic growth and an increase in electrification, which remains low at 50-60% in the larger population areas of Java, Bali, Sumatra, Kalimantan and Sulawesi, and even lower in the outlying island locations. PLN expects to increase their levels only slowly.
Residential sales account for 40% of all demand while industry accounts for about 42%, however the industry number does not include captive power generation.
______________________________________________________________________________________
Generation
The state-owned PT Perusahaan Listrik Negara (PLN) owns and operates about 5000 generation units on 1100 grids or systems and its combined grid connected capacity, including IPPs under its control, amounts to about 24 GW. Java-Bali has about 75% of the grid-connected generation capacity, of this amount about 4.4 GW is gas-fired. Other grids include 3 GW on Sumatra and about 1 GW on each of Sulawesi and Kalimantan. Additionally there is some 9 GW of off-grid ‘captive’ generation capacity, mostly supplying energy intensive industries such as mining or pulped paper.
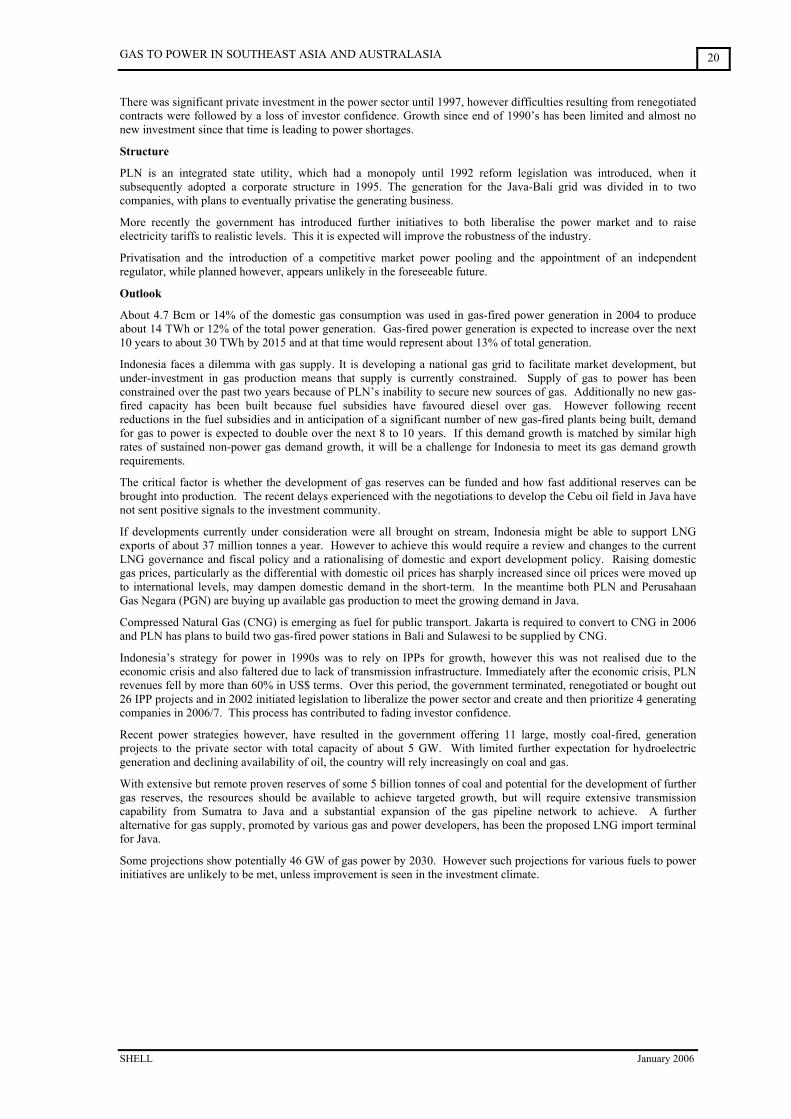
GAS TO POWER IN SOUTHEAST ASIA AND AUSTRALASIA
SHELL January 2006
20
There was significant private investment in the power sector until 1997, however difficulties resulting from renegotiated contracts were followed by a loss of investor confidence. Growth since end of 1990’s has been limited and almost no new investment since that time is leading to power shortages.
Structure
PLN is an integrated state utility, which had a monopoly until 1992 reform legislation was introduced, when it subsequently adopted a corporate structure in 1995. The generation for the Java-Bali grid was divided in to two companies, with plans to eventually privatise the generating business.
More recently the government has introduced further initiatives to both liberalise the power market and to raise electricity tariffs to realistic levels. This it is expected will improve the robustness of the industry.
Privatisation and the introduction of a competitive market power pooling and the appointment of an independent regulator, while planned however, appears unlikely in the foreseeable future.
Outlook
About 4.7 Bcm or 14% of the domestic gas consumption was used in gas-fired power generation in 2004 to produce about 14 TWh or 12% of the total power generation. Gas-fired power generation is expected to increase over the next 10 years to about 30 TWh by 2015 and at that time would represent about 13% of total generation.
Indonesia faces a dilemma with gas supply. It is developing a national gas grid to facilitate market development, but under-investment in gas production means that supply is currently constrained. Supply of gas to power has been constrained over the past two years because of PLN’s inability to secure new sources of gas. Additionally no new gas-fired capacity has been built because fuel subsidies have favoured diesel over gas. However following recent reductions in the fuel subsidies and in anticipation of a significant number of new gas-fired plants being built, demand for gas to power is expected to double over the next 8 to 10 years. If this demand growth is matched by similar high rates of sustained non-power gas demand growth, it will be a challenge for Indonesia to meet its gas demand growth requirements.
The critical factor is whether the development of gas reserves can be funded and how fast additional reserves can be brought into production. The recent delays experienced with the negotiations to develop the Cebu oil field in Java have not sent positive signals to the investment community.
If developments currently under consideration were all brought on stream, Indonesia might be able to support LNG exports of about 37 million tonnes a year. However to achieve this would require a review and changes to the current LNG governance and fiscal policy and a rationalising of domestic and export development policy. Raising domestic gas prices, particularly as the differential with domestic oil prices has sharply increased since oil prices were moved up to international levels, may dampen domestic demand in the short-term. In the meantime both PLN and Perusahaan Gas Negara (PGN) are buying up available gas production to meet the growing demand in Java.
Compressed Natural Gas (CNG) is emerging as fuel for public transport. Jakarta is required to convert to CNG in 2006 and PLN has plans to build two gas-fired power stations in Bali and Sulawesi to be supplied by CNG.
Indonesia’s strategy for power in 1990s was to rely on IPPs for growth, however this was not realised due to the economic crisis and also faltered due to lack of transmission infrastructure. Immediately after the economic crisis, PLN revenues fell by more than 60% in US$ terms. Over this period, the government terminated, renegotiated or bought out 26 IPP projects and in 2002 initiated legislation to liberalize the power sector and create and then prioritize 4 generating companies in 2006/7. This process has contributed to fading investor confidence.
Recent power strategies however, have resulted in the government offering 11 large, mostly coal-fired, generation projects to the private sector with total capacity of about 5 GW. With limited further expectation for hydroelectric generation and declining availability of oil, the country will rely increasingly on coal and gas.
With extensive but remote proven reserves of some 5 billion tonnes of coal and potential for the development of further gas reserves, the resources should be available to achieve targeted growth, but will require extensive transmission capability from Sumatra to Java and a substantial expansion of the gas pipeline network to achieve. A further alternative for gas supply, promoted by various gas and power developers, has been the proposed LNG import terminal for Java.
Some projections show potentially 46 GW of gas power by 2030. However such projections for various fuels to power initiatives are unlikely to be met, unless improvement is seen in the investment climate.
GAS TO POWER IN SOUTHEAST ASIA AND AUSTRALASIA
SHELL January 2006
21
2004 - Source: EIA & EIU
Population, million 6.2
GDP growth % 6
GDP growth 5-yr estm 5
Oil reserves mill bbls 0
Oil production 000’s b/d 0
Oil consumption 000’s b/d 3
Gas reserves Tcf 0
Gas production Bcm 0
Gas consumption Bcf/d 0
Electricity generation TWh 4
Elect consumption kWh/pp 130
Laos
Laos is a land locked country, with no oil or gas production. It has a limited domestic power market, unusually however it has a substantial export market based on hydroelectric generation and the export of hydroelectric generated power to neighbouring Thailand. The country also has extensive coal resources. It intends to exploit its substantial power generation potential, with further electricity exports planned to Thailand, Vietnam and possibly later to China.
Demand
Only one quarter of the mostly rural population has access to electricity from the grid. Electricity consumption per head is only 130 kWh per person each year. More than half of the grid’s capacity is dedicated for exports.
Generation
Laos has currently about 600 MW of hydroelectric generation capacity and a small amount of diesel-fired generation. A number of generation projects are under development predicated on exports to Thailand and Vietnam. These follow a bilateral power sale agreement agreed in the mid 1990’s between the governments of Laos and Thailand for the development and sale of up to 3000 MW of power. Two projects currently exporting to Thailand, and co-developed, are Thuen Hinboun hydroelectric on the Nam Theun river at 210 MW and Honay Ho at the Mekong river at 150 MW.
Outlook
Of the generation projects under development for electricity export to Thailand, Nam Theun–2, a hydroelectric IPP on the Nam Theun River will have a capacity of 1070 MW. This is a joint venture with EDF, EGAT, the government of Laos and an Italian developer. The project is currently being financed and is backed by World Bank and multi-lateral agencies. Almost all power generated is intended for export.
A further hydroelectric project being developed for Thailand exports is Nam Ngum-2 at 615 MW. A project co-developed for Vietnam is the Xekaman III hydroelectric, the first in a series, at 300 MW.
A large project that is not hydroelectric is Hongsa, a 740 MW lignite coal fired being developed by the Thai-Lao Power Company.
Investment in Laos power sector is financed with support from the various development organisations, export credit agencies, the Asian Development Bank and the World Bank
Laos has no current gas-fired power and little foreseeable prospect of future gas-fired power.
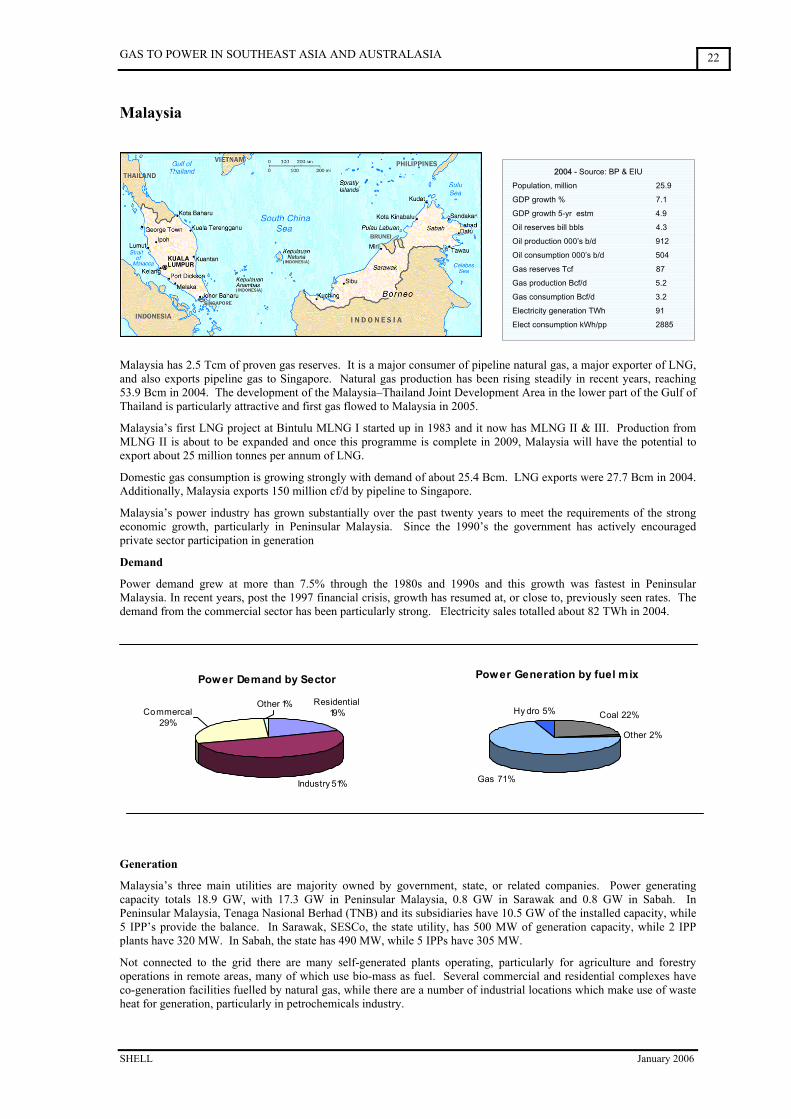
GAS TO POWER IN SOUTHEAST ASIA AND AUSTRALASIA
SHELL January 2006
22
2004 - Source: BP & EIU
Population, million 25.9
GDP growth % 7.1
GDP growth 5-yr estm 4.9
Oil reserves bill bbls 4.3
Oil production 000’s b/d 912
Oil consumption 000’s b/d 504
Gas reserves Tcf 87
Gas production Bcf/d 5.2
Gas consumption Bcf/d 3.2
Electricity generation TWh 91
Elect consumption kWh/pp 2885
Power Generation by fuel mix
Coal 22%
Other 2%
Gas 71%
Hy dro 5%
Power Demand by Sector
Residential 19%
Industry 51%
Commercal 29%
Other 1%
Malaysia
Malaysia has 2.5 Tcm of proven gas reserves. It is a major consumer of pipeline natural gas, a major exporter of LNG, and also exports pipeline gas to Singapore. Natural gas production has been rising steadily in recent years, reaching 53.9 Bcm in 2004. The development of the Malaysia–Thailand Joint Development Area in the lower part of the Gulf of Thailand is particularly attractive and first gas flowed to Malaysia in 2005.
Malaysia’s first LNG project at Bintulu MLNG I started up in 1983 and it now has MLNG II & III. Production from MLNG II is about to be expanded and once this programme is complete in 2009, Malaysia will have the potential to export about 25 million tonnes per annum of LNG.
Domestic gas consumption is growing strongly with demand of about 25.4 Bcm. LNG exports were 27.7 Bcm in 2004. Additionally, Malaysia exports 150 million cf/d by pipeline to Singapore.
Malaysia’s power industry has grown substantially over the past twenty years to meet the requirements of the strong economic growth, particularly in Peninsular Malaysia. Since the 1990’s the government has actively encouraged private sector participation in generation
Demand
Power demand grew at more than 7.5% through the 1980s and 1990s and this growth was fastest in Peninsular Malaysia. In recent years, post the 1997 financial crisis, growth has resumed at, or close to, previously seen rates. The demand from the commercial sector has been particularly strong. Electricity sales totalled about 82 TWh in 2004.
Generation
Malaysia’s three main utilities are majority owned by government, state, or related companies. Power generating capacity totals 18.9 GW, with 17.3 GW in Peninsular Malaysia, 0.8 GW in Sarawak and 0.8 GW in Sabah. In Peninsular Malaysia, Tenaga Nasional Berhad (TNB) and its subsidiaries have 10.5 GW of the installed capacity, while 5 IPP’s provide the balance. In Sarawak, SESCo, the state utility, has 500 MW of generation capacity, while 2 IPP plants have 320 MW. In Sabah, the state has 490 MW, while 5 IPPs have 305 MW.
Not connected to the grid there are many self-generated plants operating, particularly for agriculture and forestry operations in remote areas, many of which use bio-mass as fuel. Several commercial and residential complexes have co-generation facilities fuelled by natural gas, while there are a number of industrial locations which make use of waste heat for generation, particularly in petrochemicals industry.
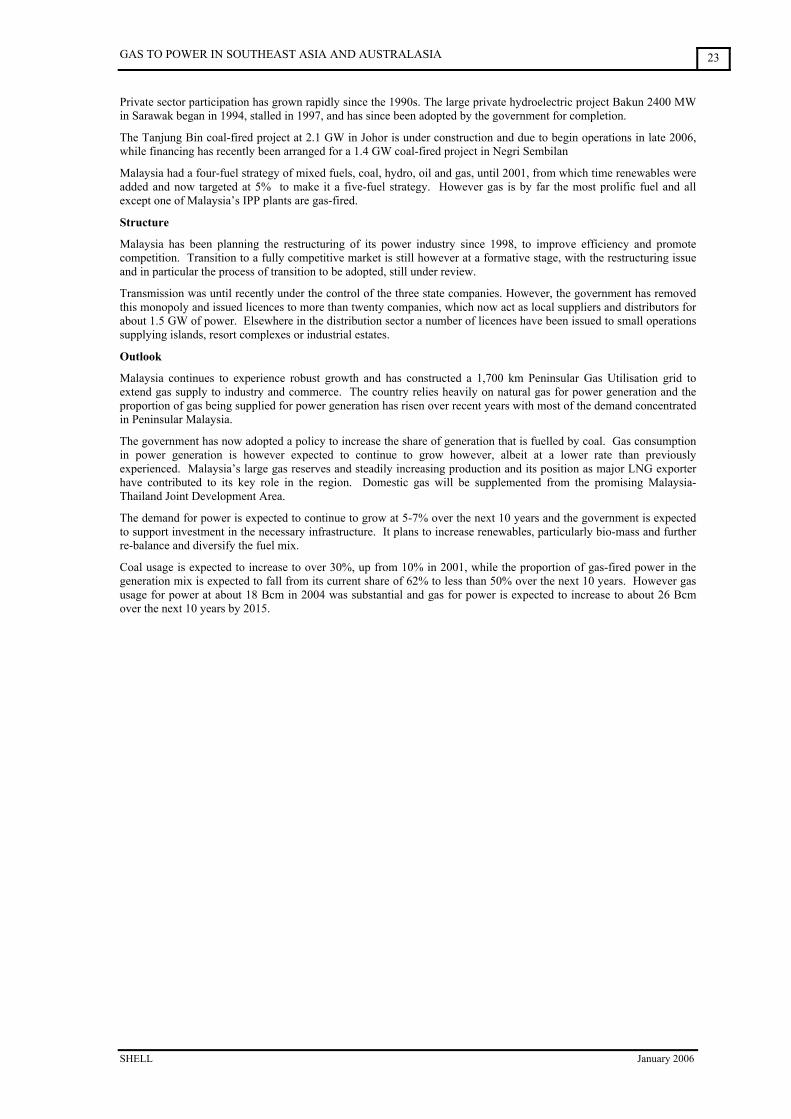
GAS TO POWER IN SOUTHEAST ASIA AND AUSTRALASIA
SHELL January 2006
23
Private sector participation has grown rapidly since the 1990s. The large private hydroelectric project Bakun 2400 MW in Sarawak began in 1994, stalled in 1997, and has since been adopted by the government for completion.
The Tanjung Bin coal-fired project at 2.1 GW in Johor is under construction and due to begin operations in late 2006, while financing has recently been arranged for a 1.4 GW coal-fired project in Negri Sembilan
Malaysia had a four-fuel strategy of mixed fuels, coal, hydro, oil and gas, until 2001, from which time renewables were added and now targeted at 5% to make it a five-fuel strategy. However gas is by far the most prolific fuel and all except one of Malaysia’s IPP plants are gas-fired.
Structure
Malaysia has been planning the restructuring of its power industry since 1998, to improve efficiency and promote competition. Transition to a fully competitive market is still however at a formative stage, with the restructuring issue and in particular the process of transition to be adopted, still under review.
Transmission was until recently under the control of the three state companies. However, the government has removed this monopoly and issued licences to more than twenty companies, which now act as local suppliers and distributors for about 1.5 GW of power. Elsewhere in the distribution sector a number of licences have been issued to small operations supplying islands, resort complexes or industrial estates.
Outlook
Malaysia continues to experience robust growth and has constructed a 1,700 km Peninsular Gas Utilisation grid to extend gas supply to industry and commerce. The country relies heavily on natural gas for power generation and the proportion of gas being supplied for power generation has risen over recent years with most of the demand concentrated in Peninsular Malaysia.
The government has now adopted a policy to increase the share of generation that is fuelled by coal. Gas consumption in power generation is however expected to continue to grow however, albeit at a lower rate than previously experienced. Malaysia’s large gas reserves and steadily increasing production and its position as major LNG exporter have contributed to its key role in the region. Domestic gas will be supplemented from the promising Malaysia-Thailand Joint Development Area.
The demand for power is expected to continue to grow at 5-7% over the next 10 years and the government is expected to support investment in the necessary infrastructure. It plans to increase renewables, particularly bio-mass and further re-balance and diversify the fuel mix.
Coal usage is expected to increase to over 30%, up from 10% in 2001, while the proportion of gas-fired power in the generation mix is expected to fall from its current share of 62% to less than 50% over the next 10 years. However gas usage for power at about 18 Bcm in 2004 was substantial and gas for power is expected to increase to about 26 Bcm over the next 10 years by 2015.
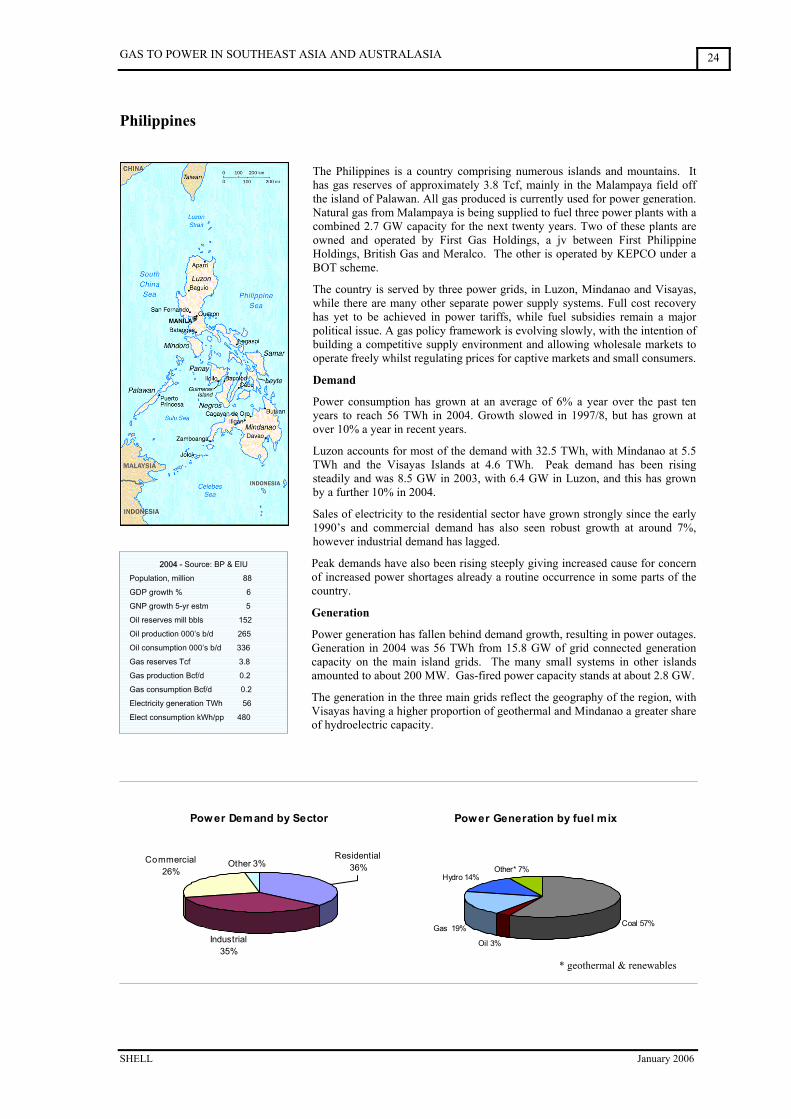
GAS TO POWER IN SOUTHEAST ASIA AND AUSTRALASIA
SHELL January 2006
24
Power Generation by fuel mix
Coal 57%
Oil 3%
Gas 19%
Hydro 14%Other* 7%
Power Demand by Sector
Industrial 35%
Other 3%Commercial 26%
Residential 36%
Philippines
The Philippines is a country comprising numerous islands and mountains. It has gas reserves of approximately 3.8 Tcf, mainly in the Malampaya field off the island of Palawan. All gas produced is currently used for power generation. Natural gas from Malampaya is being supplied to fuel three power plants with a combined 2.7 GW capacity for the next twenty years. Two of these plants are owned and operated by First Gas Holdings, a jv between First Philippine Holdings, British Gas and Meralco. The other is operated by KEPCO under a BOT scheme.
The country is served by three power grids, in Luzon, Mindanao and Visayas, while there are many other separate power supply systems. Full cost recovery has yet to be achieved in power tariffs, while fuel subsidies remain a major political issue. A gas policy framework is evolving slowly, with the intention of building a competitive supply environment and allowing wholesale markets to operate freely whilst regulating prices for captive markets and small consumers.
Demand
Power consumption has grown at an average of 6% a year over the past ten years to reach 56 TWh in 2004. Growth slowed in 1997/8, but has grown at over 10% a year in recent years.
Luzon accounts for most of the demand with 32.5 TWh, with Mindanao at 5.5 TWh and the Visayas Islands at 4.6 TWh. Peak demand has been rising steadily and was 8.5 GW in 2003, with 6.4 GW in Luzon, and this has grown by a further 10% in 2004.
Sales of electricity to the residential sector have grown strongly since the early 1990’s and commercial demand has also seen robust growth at around 7%, however industrial demand has lagged.
Peak demands have also been rising steeply giving increased cause for concern of increased power shortages already a routine occurrence in some parts of the country.
Generation
Power generation has fallen behind demand growth, resulting in power outages. Generation in 2004 was 56 TWh from 15.8 GW of grid connected generation capacity on the main island grids. The many small systems in other islands amounted to about 200 MW. Gas-fired power capacity stands at about 2.8 GW.
The generation in the three main grids reflect the geography of the region, with Visayas having a higher proportion of geothermal and Mindanao a greater share of hydroelectric capacity.
2004 - Source: BP & EIU
Population, million 88
GDP growth % 6
GNP growth 5-yr estm 5
Oil reserves mill bbls 152
Oil production 000’s b/d 265
Oil consumption 000’s b/d 336
Gas reserves Tcf 3.8
Gas production Bcf/d 0.2
Gas consumption Bcf/d 0.2
Electricity generation TWh 56
Elect consumption kWh/pp 480
* geothermal & renewables
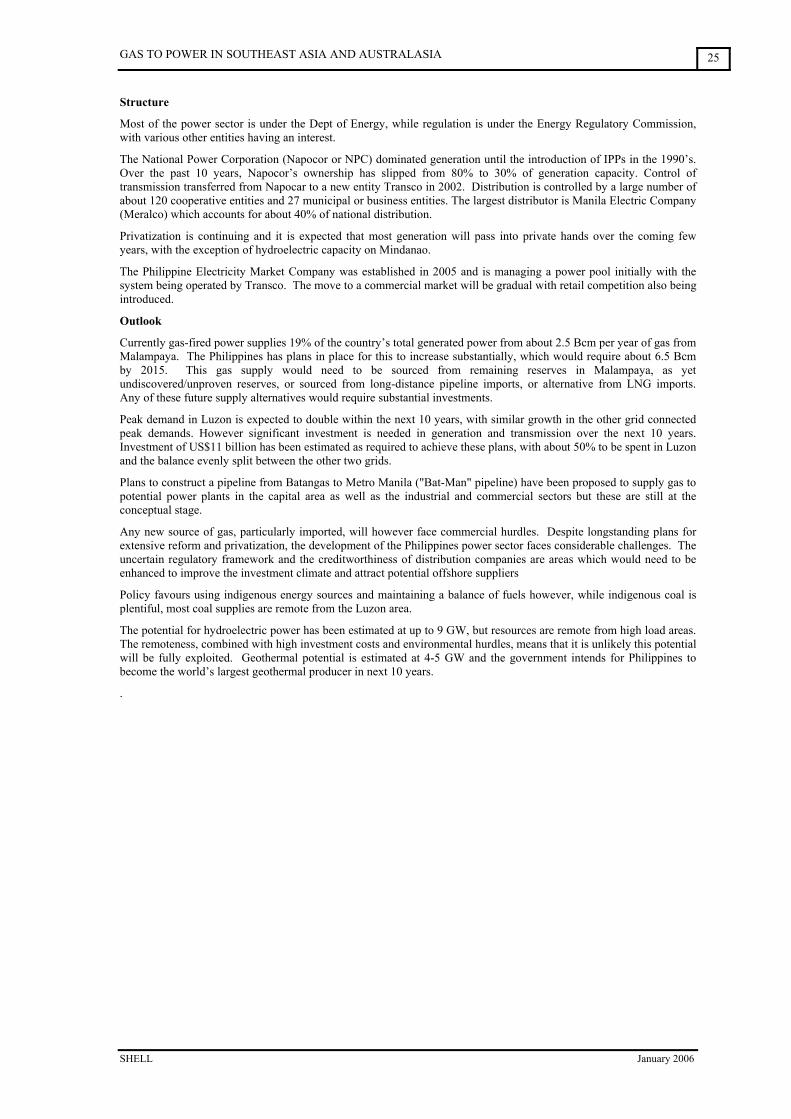
GAS TO POWER IN SOUTHEAST ASIA AND AUSTRALASIA
SHELL January 2006
25
Structure
Most of the power sector is under the Dept of Energy, while regulation is under the Energy Regulatory Commission, with various other entities having an interest.
The National Power Corporation (Napocor or NPC) dominated generation until the introduction of IPPs in the 1990’s. Over the past 10 years, Napocor’s ownership has slipped from 80% to 30% of generation capacity. Control of transmission transferred from Napocar to a new entity Transco in 2002. Distribution is controlled by a large number of about 120 cooperative entities and 27 municipal or business entities. The largest distributor is Manila Electric Company (Meralco) which accounts for about 40% of national distribution.
Privatization is continuing and it is expected that most generation will pass into private hands over the coming few years, with the exception of hydroelectric capacity on Mindanao.
The Philippine Electricity Market Company was established in 2005 and is managing a power pool initially with the system being operated by Transco. The move to a commercial market will be gradual with retail competition also being introduced.
Outlook
Currently gas-fired power supplies 19% of the country’s total generated power from about 2.5 Bcm per year of gas from Malampaya. The Philippines has plans in place for this to increase substantially, which would require about 6.5 Bcm by 2015. This gas supply would need to be sourced from remaining reserves in Malampaya, as yet undiscovered/unproven reserves, or sourced from long-distance pipeline imports, or alternative from LNG imports. Any of these future supply alternatives would require substantial investments.
Peak demand in Luzon is expected to double within the next 10 years, with similar growth in the other grid connected peak demands. However significant investment is needed in generation and transmission over the next 10 years. Investment of US$11 billion has been estimated as required to achieve these plans, with about 50% to be spent in Luzon and the balance evenly split between the other two grids.
Plans to construct a pipeline from Batangas to Metro Manila ("Bat-Man" pipeline) have been proposed to supply gas to potential power plants in the capital area as well as the industrial and commercial sectors but these are still at the conceptual stage.
Any new source of gas, particularly imported, will however face commercial hurdles. Despite longstanding plans for extensive reform and privatization, the development of the Philippines power sector faces considerable challenges. The uncertain regulatory framework and the creditworthiness of distribution companies are areas which would need to be enhanced to improve the investment climate and attract potential offshore suppliers
Policy favours using indigenous energy sources and maintaining a balance of fuels however, while indigenous coal is plentiful, most coal supplies are remote from the Luzon area.
The potential for hydroelectric power has been estimated at up to 9 GW, but resources are remote from high load areas. The remoteness, combined with high investment costs and environmental hurdles, means that it is unlikely this potential will be fully exploited. Geothermal potential is estimated at 4-5 GW and the government intends for Philippines to become the world’s largest geothermal producer in next 10 years.
.
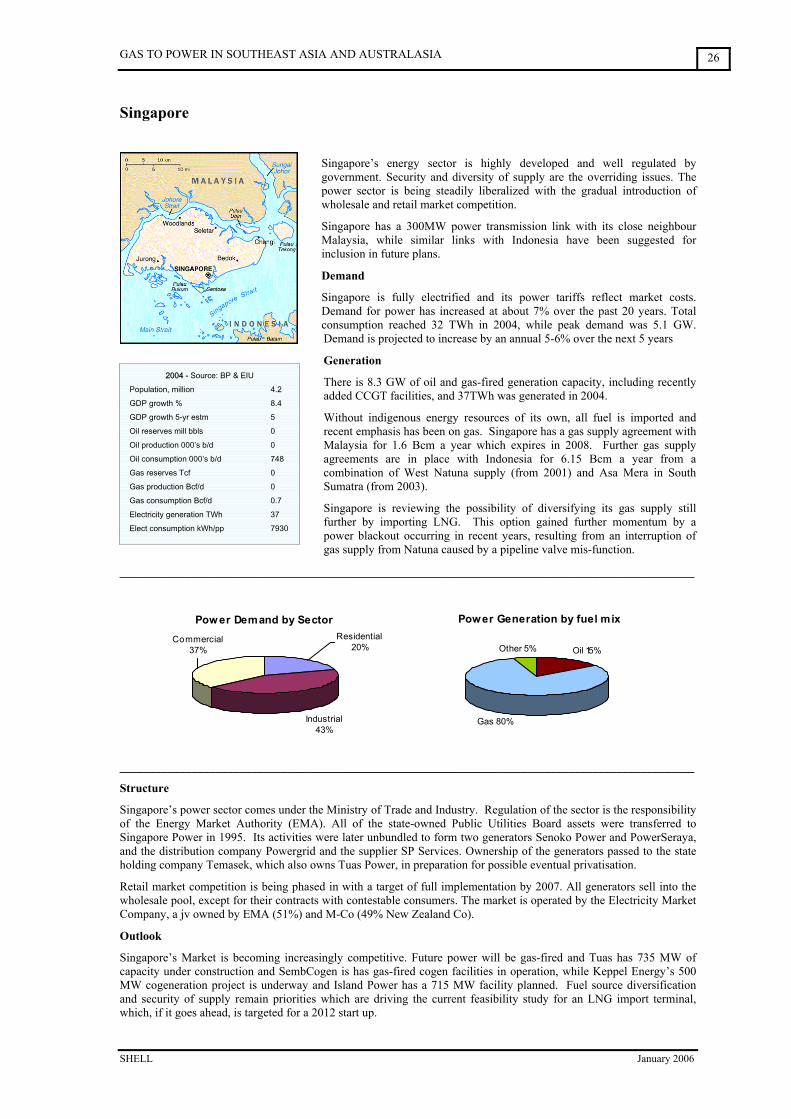
GAS TO POWER IN SOUTHEAST ASIA AND AUSTRALASIA
SHELL January 2006
26
Power Generation by fuel mix
Oil 15%
Gas 80%
Other 5%
Power Demand by Sector
Industrial 43%
Commercial 37%
Residential 20%
Singapore
Singapore’s energy sector is highly developed and well regulated by government. Security and diversity of supply are the overriding issues. The power sector is being steadily liberalized with the gradual introduction of wholesale and retail market competition.
Singapore has a 300MW power transmission link with its close neighbour Malaysia, while similar links with Indonesia have been suggested for inclusion in future plans.
Demand
Singapore is fully electrified and its power tariffs reflect market costs. Demand for power has increased at about 7% over the past 20 years. Total consumption reached 32 TWh in 2004, while peak demand was 5.1 GW. Demand is projected to increase by an annual 5-6% over the next 5 years
Generation
There is 8.3 GW of oil and gas-fired generation capacity, including recently added CCGT facilities, and 37TWh was generated in 2004.
Without indigenous energy resources of its own, all fuel is imported and recent emphasis has been on gas. Singapore has a gas supply agreement with Malaysia for 1.6 Bcm a year which expires in 2008. Further gas supply agreements are in place with Indonesia for 6.15 Bcm a year from a combination of West Natuna supply (from 2001) and Asa Mera in South Sumatra (from 2003).
Singapore is reviewing the possibility of diversifying its gas supply still further by importing LNG. This option gained further momentum by a power blackout occurring in recent years, resulting from an interruption of gas supply from Natuna caused by a pipeline valve mis-function.
________________________________________________________________________________________________
________________________________________________________________________________________________
Structure
Singapore’s power sector comes under the Ministry of Trade and Industry. Regulation of the sector is the responsibility of the Energy Market Authority (EMA). All of the state-owned Public Utilities Board assets were transferred to Singapore Power in 1995. Its activities were later unbundled to form two generators Senoko Power and PowerSeraya, and the distribution company Powergrid and the supplier SP Services. Ownership of the generators passed to the state holding company Temasek, which also owns Tuas Power, in preparation for possible eventual privatisation.
Retail market competition is being phased in with a target of full implementation by 2007. All generators sell into the wholesale pool, except for their contracts with contestable consumers. The market is operated by the Electricity Market Company, a jv owned by EMA (51%) and M-Co (49% New Zealand Co).
Outlook
Singapore’s Market is becoming increasingly competitive. Future power will be gas-fired and Tuas has 735 MW of capacity under construction and SembCogen is has gas-fired cogen facilities in operation, while Keppel Energy’s 500 MW cogeneration project is underway and Island Power has a 715 MW facility planned. Fuel source diversification and security of supply remain priorities which are driving the current feasibility study for an LNG import terminal, which, if it goes ahead, is targeted for a 2012 start up.
2004 - Source: BP & EIU
Population, million 4.2
GDP growth % 8.4
GDP growth 5-yr estm 5
Oil reserves mill bbls 0
Oil production 000’s b/d 0
Oil consumption 000’s b/d 748
Gas reserves Tcf 0
Gas production Bcf/d 0
Gas consumption Bcf/d 0.7
Electricity generation TWh 37
Elect consumption kWh/pp 7930
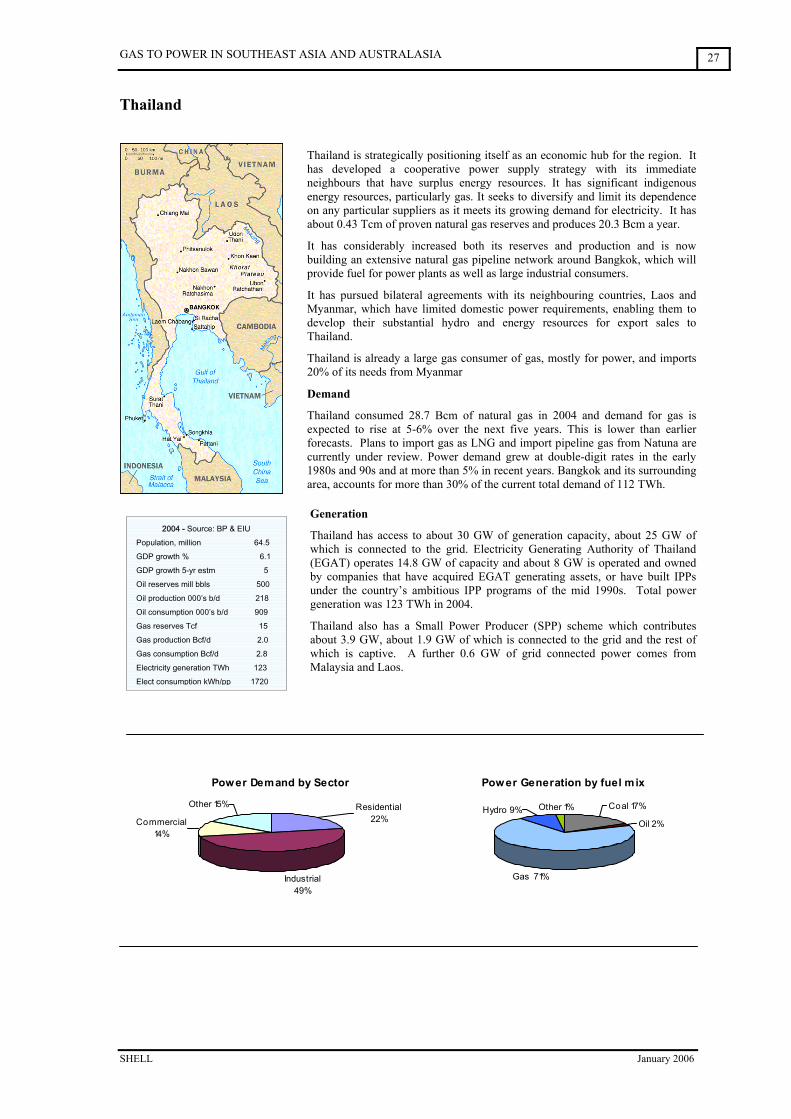
GAS TO POWER IN SOUTHEAST ASIA AND AUSTRALASIA
SHELL January 2006
27
Power Demand by Sector
Industrial 49%
Commercial 14%
Other 15% Residential 22%
Power Generation by fuel mix
Coal 17%
Oil 2%
Gas 71%
Other 1%Hydro 9%
Thailand
Thailand is strategically positioning itself as an economic hub for the region. It has developed a cooperative power supply strategy with its immediate neighbours that have surplus energy resources. It has significant indigenous energy resources, particularly gas. It seeks to diversify and limit its dependence on any particular suppliers as it meets its growing demand for electricity. It has about 0.43 Tcm of proven natural gas reserves and produces 20.3 Bcm a year.
It has considerably increased both its reserves and production and is now building an extensive natural gas pipeline network around Bangkok, which will provide fuel for power plants as well as large industrial consumers.
It has pursued bilateral agreements with its neighbouring countries, Laos and Myanmar, which have limited domestic power requirements, enabling them to develop their substantial hydro and energy resources for export sales to Thailand.
Thailand is already a large gas consumer of gas, mostly for power, and imports 20% of its needs from Myanmar
Demand
Thailand consumed 28.7 Bcm of natural gas in 2004 and demand for gas is expected to rise at 5-6% over the next five years. This is lower than earlier forecasts. Plans to import gas as LNG and import pipeline gas from Natuna are currently under review. Power demand grew at double-digit rates in the early 1980s and 90s and at more than 5% in recent years. Bangkok and its surrounding area, accounts for more than 30% of the current total demand of 112 TWh.
Generation
Thailand has access to about 30 GW of generation capacity, about 25 GW of which is connected to the grid. Electricity Generating Authority of Thailand (EGAT) operates 14.8 GW of capacity and about 8 GW is operated and owned by companies that have acquired EGAT generating assets, or have built IPPs under the country’s ambitious IPP programs of the mid 1990s. Total power generation was 123 TWh in 2004.
Thailand also has a Small Power Producer (SPP) scheme which contributes about 3.9 GW, about 1.9 GW of which is connected to the grid and the rest of which is captive. A further 0.6 GW of grid connected power comes from Malaysia and Laos.
2004 - Source: BP & EIU
Population, million 64.5
GDP growth % 6.1
GDP growth 5-yr estm 5
Oil reserves mill bbls 500
Oil production 000’s b/d 218
Oil consumption 000’s b/d 909
Gas reserves Tcf 15
Gas production Bcf/d 2.0
Gas consumption Bcf/d 2.8
Electricity generation TWh 123
Elect consumption kWh/pp 1720
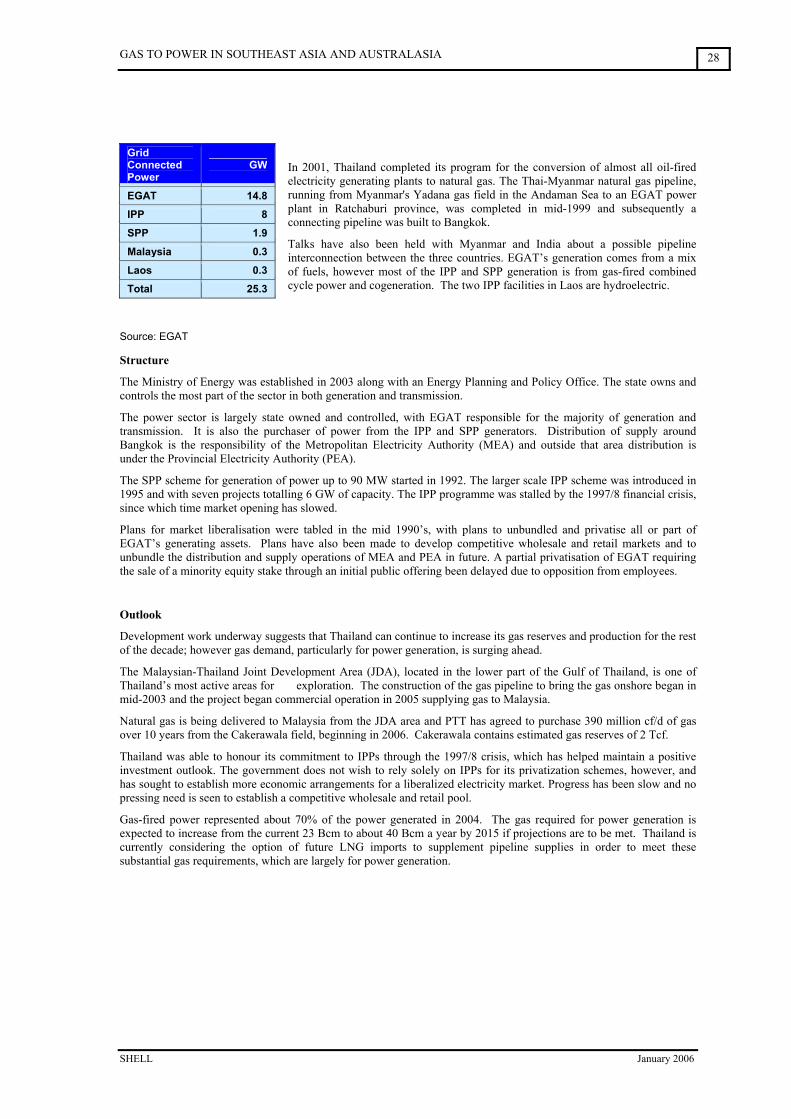
GAS TO POWER IN SOUTHEAST ASIA AND AUSTRALASIA
SHELL January 2006
28
In 2001, Thailand completed its program for the conversion of almost all oil-fired electricity generating plants to natural gas. The Thai-Myanmar natural gas pipeline, running from Myanmar's Yadana gas field in the Andaman Sea to an EGAT power plant in Ratchaburi province, was completed in mid-1999 and subsequently a connecting pipeline was built to Bangkok.
Talks have also been held with Myanmar and India about a possible pipeline interconnection between the three countries. EGAT’s generation comes from a mix of fuels, however most of the IPP and SPP generation is from gas-fired combined cycle power and cogeneration. The two IPP facilities in Laos are hydroelectric.
Source: EGAT
Structure
The Ministry of Energy was established in 2003 along with an Energy Planning and Policy Office. The state owns and controls the most part of the sector in both generation and transmission.
The power sector is largely state owned and controlled, with EGAT responsible for the majority of generation and transmission. It is also the purchaser of power from the IPP and SPP generators. Distribution of supply around Bangkok is the responsibility of the Metropolitan Electricity Authority (MEA) and outside that area distribution is under the Provincial Electricity Authority (PEA).
The SPP scheme for generation of power up to 90 MW started in 1992. The larger scale IPP scheme was introduced in 1995 and with seven projects totalling 6 GW of capacity. The IPP programme was stalled by the 1997/8 financial crisis, since which time market opening has slowed.
Plans for market liberalisation were tabled in the mid 1990’s, with plans to unbundled and privatise all or part of EGAT’s generating assets. Plans have also been made to develop competitive wholesale and retail markets and to unbundle the distribution and supply operations of MEA and PEA in future. A partial privatisation of EGAT requiring the sale of a minority equity stake through an initial public offering been delayed due to opposition from employees.
Outlook
Development work underway suggests that Thailand can continue to increase its gas reserves and production for the rest of the decade; however gas demand, particularly for power generation, is surging ahead.
The Malaysian-Thailand Joint Development Area (JDA), located in the lower part of the Gulf of Thailand, is one of Thailand’s most active areas for gas exploration. The construction of the gas pipeline to bring the gas onshore began in mid-2003 and the project began commercial operation in 2005 supplying gas to Malaysia.
Natural gas is being delivered to Malaysia from the JDA area and PTT has agreed to purchase 390 million cf/d of gas over 10 years from the Cakerawala field, beginning in 2006. Cakerawala contains estimated gas reserves of 2 Tcf.
Thailand was able to honour its commitment to IPPs through the 1997/8 crisis, which has helped maintain a positive investment outlook. The government does not wish to rely solely on IPPs for its privatization schemes, however, and has sought to establish more economic arrangements for a liberalized electricity market. Progress has been slow and no pressing need is seen to establish a competitive wholesale and retail pool.
Gas-fired power represented about 70% of the power generated in 2004. The gas required for power generation is expected to increase from the current 23 Bcm to about 40 Bcm a year by 2015 if projections are to be met. Thailand is currently considering the option of future LNG imports to supplement pipeline supplies in order to meet these substantial gas requirements, which are largely for power generation.
Grid Connected Power
GW
EGAT 14.8
IPP 8
SPP 1.9
Malaysia 0.3
Laos 0.3
Total 25.3
GAS TO POWER IN SOUTHEAST ASIA AND AUSTRALASIA
SHELL January 2006
29
Power Demand by Sector
Industrial 25%
Commercial 15%
Other 2% Residential 48%
Power Generation by fuel mix
Coal 13%
Oil 11%
Gas 38%
Hydro 37%
Other 1%
Vietnam
Reconstruction of the country and the economy took off in the late 1980s following economic reforms. Vietnam has proven gas reserves of 0.24 Tcm and this is expected to increase. Natural gas production and consumption are rising, with further increases expected as additional fields come on-stream. Natural gas is currently produced entirely for domestic consumption in the power sector.
The Cuu Long basin, a source of associated gas, is the largest gas production area. Two fields have been developed specifically for their natural gas potential and these are Tien Hai and Lan Tay/Lan Do of Nam Con Son, which began producing in 2002.
Demand
In the 1990s power consumption doubled and has seen double-digit growth over recent years. Peak demand requirements have also surged to over 7 GW. Much of the rural population does not have access to grid connection and, where it has, system reliability is poor due to legacy locally installed infrastructure.
Generation
Power generation has increased rapidly, at 12.5% through the 1990s and closer to 15% in recent years. A total of 42 TWh was generated in 2004 mostly by state-controlled Electricity of Vietnam (EVN) from a total of 8.8 GW of capacity.
Structure
EVN was established in 1995 as a state business to control and operate power generation, transmission and distribution.
IPPs have been underway since the mid 1990’s, but progress has been slower than planned. The limited legal and regulatory framework has discouraged industrial investment and finance, as has low tariff rates of 5–6 cents per KWh. Most recent private projects have been locally sponsored. IPPs that have proceeded have been to monetize gas projects, Phu My 2.2 at 715 MW and Phu My 3. Captive plants are common in industrial zones.
The government had stated its intention to introduce market reforms to the power sector, introducing a new Electricity Law to liberalize and diversify the industry.
Outlook
A Phu My to Neon Trash pipeline is planned to transport associated gas from the Bach Ho and Rung fields for power generation, but has been delayed over concerns about cost. The first power complex in Neon Trash will be complete in 2009, with two other complexes to be finished in 2012 and 2014.
Gas is currently piped to four generating plants at the Phu My industrial complex, where electricity is provided primarily to areas surrounding Ho Chi Minh. The Su Too Den and Rang Dong oil fields, both of which have considerable reserves of associated natural gas, are located close to the 62-mile pipeline from the Bach Ho field. An estimated 60 million cf/d of gas is earmarked for power plants in southern Vietnam. In 2004, PetroVietnam and Thailand’s PTT agreed to conduct a feasibility study to build a natural gas pipeline network in southern Vietnam.
Power demand is surging ahead in Vietnam and much will be met by gas-fired generation. Currently about 4 Bcm a year of gas is used for power and this is expected to increase to about 12 Bcm by 2015.
2004 - Source: BP & EIU
Population, million 83.8
GDP growth % 7.7
GDP growth 5-yr estm 7
Oil reserves bill bbls 3.0
Oil production 000’s b/d 427
Oil consumption 000’s b/d 210
Gas reserves Tcf 8.3
Gas production Bcf/d 0.4
Gas consumption Bcf/d 0.4
Electricity generation TWh 42
Elect consumption kWh/pp 450
GAS TO POWER IN SOUTHEAST ASIA AND AUSTRALASIA
SHELL January 2006
30
6.0 CONCLUSIONS
The region encompassing South East Asia and Australasia will use natural gas to meet much of its fast growing energy needs over the next 10 years. Natural gas provides both a readily available and a clean energy source to meet the region’s needs for efficient power generation and the majority of the growth in gas demand and increased gas usage will be for power. Gas consumption for power generation in the region is expected to increase from its recent levels of about 74 Bcm to about 130 Bcm a year over the next ten years. However with escalating energy prices, a key factor influencing the pace of growth will be the affordability of gas for the rapidly developing markets in the region.
The further development of regional gas-fired power and gas supply is an essential element in maintaining the economic growth of South East Asia, while clean and efficient gas-fired power will benefit the environment.
To meet these needs Australia’s role as a major gas producing country is increasingly significant, as more reserves are proved up and developed.
The region’s rapid development of gas for power generation is due to strong fundamentals of continuing economic growth and available gas supplies. These drivers are expected to remain important for the foreseeable future.
South East Asia is not without its challenges however and the largest of these are the development of further gas reserves and the need for investment in gas pipeline and power generation infrastructure. Cooperation between neighbouring countries in the joint development of gas resources is providing increasing gas supplies for the countries of Thailand and Malaysia. While several of the region’s nations are positioned well financially, some of the large developing economies, notably Indonesia and the Philippines, are facing challenges attracting private investment and will need to build further confidence in their regulatory and financial environment.
Currently most countries consume either indigenously produced gas supplied by pipeline, or imported gas pipelined from neighbouring countries, for their domestic power generation needs, while several countries are also LNG exporters. This picture will evolve over the coming years, as more countries in South East Asia consider further development of both local and imported gas either pipeline or LNG to provide gas meet their future power generation needs.
A critical issue in this equation will be price and affordability, however some countries will also be driven by a desire to increase their security of supply and diversify supply sources.
The development of efficient gas transport and electric power transmission systems can yield significant benefits. In South East Asia development of an enhanced electricity grid system has been planned. If implemented, this could reduce the costs of delivering power by reducing overall needs for new generating capacity by taking advantage of generating options with relatively low costs.
Reform of the region’s electricity markets, with unbundling of utilities, privatisation and liberalisation, is progressing at different rates and to differing degrees in the various national markets. Market reforms can bring significant benefits and can result in energy prices to most classes of consumers falling, while competitiveness of the industry improves.
The development of the gas pipeline systems in the region will promote growth, while development of the region’s gas markets could be expected to boost trade and raise gas consumption. As the level of cooperation between nations in South East Asia and Australasia continues to build, and the developing economies grow still further, the region is expected to prosper and the demand for electricity, and in particular gas for power, will grow.
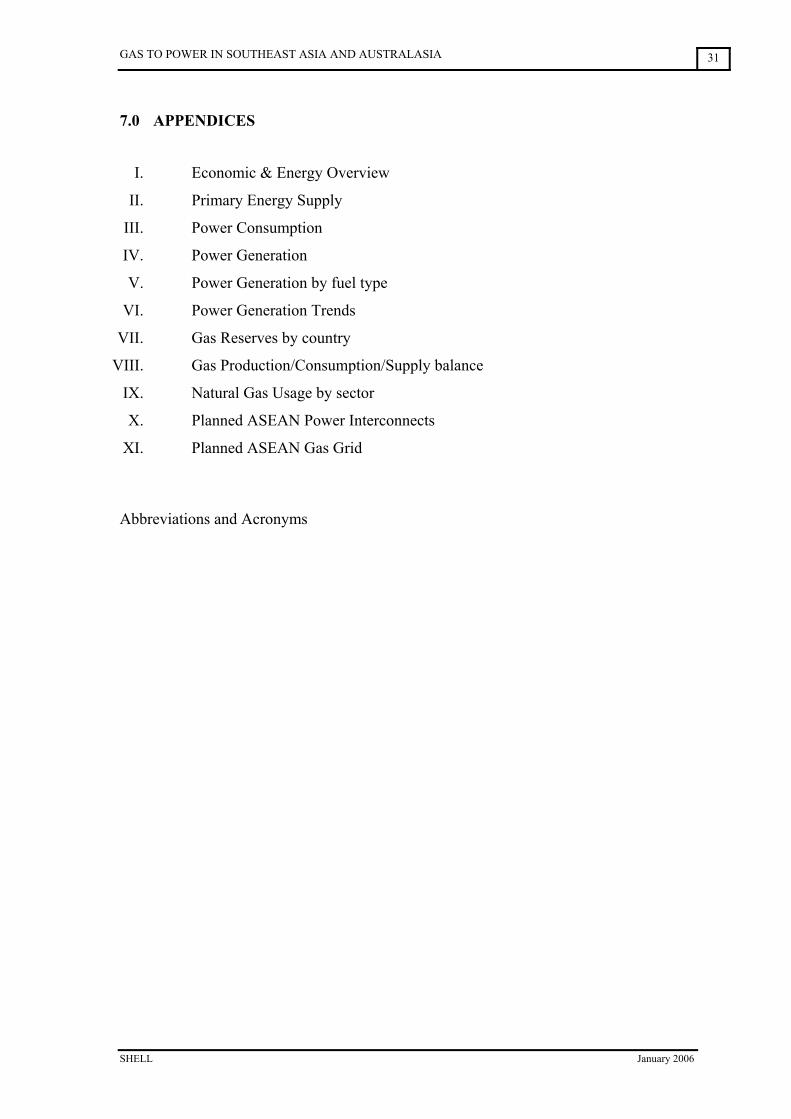
GAS TO POWER IN SOUTHEAST ASIA AND AUSTRALASIA
SHELL January 2006
31
7.0 APPENDICES
I. Economic & Energy Overview
II. Primary Energy Supply
III. Power Consumption
IV. Power Generation
V. Power Generation by fuel type
VI. Power Generation Trends
VII. Gas Reserves by country
VIII. Gas Production/Consumption/Supply balance
IX. Natural Gas Usage by sector
X. Planned ASEAN Power Interconnects
XI. Planned ASEAN Gas Grid
Abbreviations and Acronyms

GAS TO POWER IN SOUTHEAST ASIA AND AUSTRALASIA
SHELL January 2006
32

GAS TO POWER IN SOUTHEAST ASIA AND AUSTRALASIA APPENDIX I
SHELL January 2006
ECONOMIC & ENERGY OVERVIEW
ECONOMIC OVERVIEW 2004 data unless otherwise shown
Australia Brunei Cambodia Indonesia Laos Malaysia N. Zealand Philippines Singapore Thailand Vietnam
Population, million 20.4 0.35 13.6 242 6.2 25.9 4.1 87.9 4.2 64.5 83.8
GDP US$ billion 669.6 8.9 4.9 268.8 11.28 129.5 106.4 96 106.8 163.5 51.2
GDP per head US$ 30,800 25,280 360 1,110 1,900 5,000 25,950 1,090 25,430 2,550 610
GDP growth 2004 % 3.3 1.7 7.7 5.1 6 7.1 4.4 6 8.4 6.1 7.7
GDP growth 2005 estm % 2.4 1.5 6.5 4.8 5 4.9 2.6 5 4 4 8
GDP growth 5-yr estm % 3 2 6 5 5 5 3 5 5 4.5 7
Energy consumption Mill toe 119 3.1 - 109.7 - 60.3 18.3 25 45.1 81.5 23
Proved oil reserves Mill bbls 4,000 1,100 0 4,700 0 4,300 66 152 0 500 3,000
Oil production 000's bbls/d 541 211 0 1126 0 912 9 26 0 218 427
Oil consumption 000's bbls/d 858 6 8 1150 3 504 151 336 748 909 210
Gas reserves Tcm 2.46 0.34 0 2.56 0 2.46 0.16 0.11 0 0.43 0.24
Gas reserves Tcf 87 12 0 90 0 87 5.8 3.8 0 15 8.3
Gas production Bcm 35.2 12.1 0 73.3 0 53.9 3.6 2.5 0 20.3 4.2
Gas production Bcf/day 3.4 1.2 0 7.1 0 5.2 0.3 0.2 0 2 0.4
Gas consumption Bcm 24.5 1.7 0 33.7 0 33.2 3.6 2.5 7.8 28.7 4.2
Gas consumption Bcf/day 2.4 0.2 0 3.2 0 3.2 0.3 0.2 0.7 2.8 0.4
Electricity generated TWh 236 2.7 1 120 4 91 43 56 37 123 42
Electricity consumption kWh/head 10,490 6,235 60 370 130 2,855 8,640 480 7930 1720 450
Sources: EIU, CIA, EIA, BP Statistical Review of World Energy
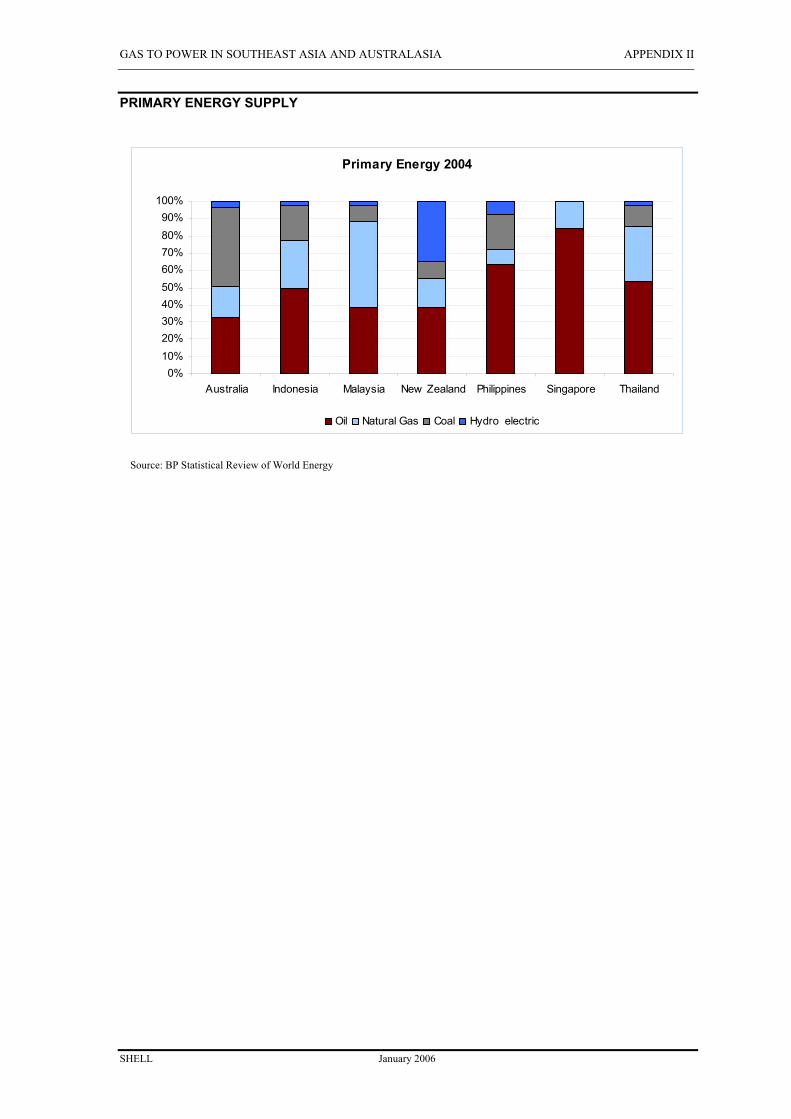
GAS TO POWER IN SOUTHEAST ASIA AND AUSTRALASIA APPENDIX II
SHELL January 2006
PRIMARY ENERGY SUPPLY
Source: BP Statistical Review of World Energy
Primary Energy 2004
0%10%20%30%40%50%60%70%80%90%
100%
Australia Indonesia Malaysia New Zealand Philippines Singapore Thailand
Oil Natural Gas Coal Hydro electric
GAS TO POWER IN SOUTHEAST ASIA AND AUSTRALASIA APPENDIX III
SHELL January 2006
Electricity demand growth 1980-2004
0.00
50.00
100.00
150.00
200.00
250.00
Austra
liaBrun
ei
Cambo
dia
Indon
esia
Laos
Malays
ia
New Zea
land
Philipp
ines
Singap
ore
Thaila
nd
Vietna
m
TWh
1980 2004
POWER CONSUMPTION
Sources: EIA & BP Statistical Review of World Energy
Sources: EIA & BP Statistical Review of World Energy
Electricity Consumption: S.E Asia & Australasia
0.00
100.00
200.00
300.00
400.00
500.00
600.00
700.00
800.00
1980 1985 1990 1995 2000 2001 2002 2003 2004
TWh
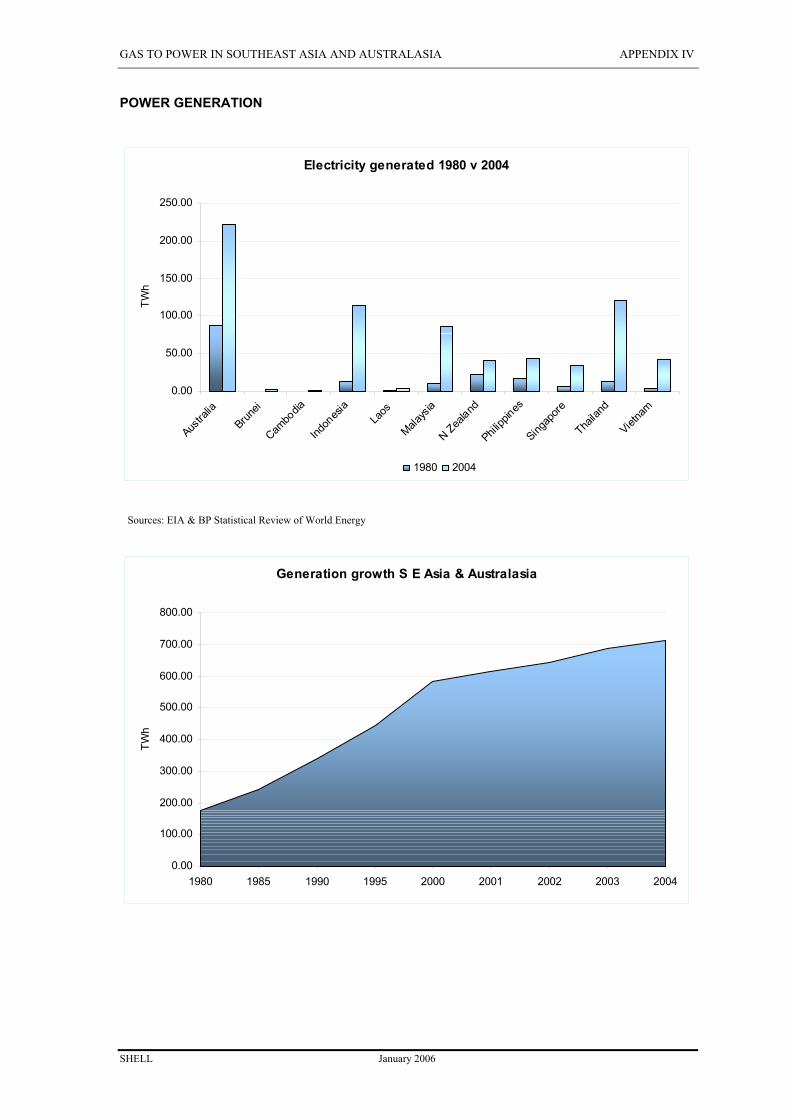
GAS TO POWER IN SOUTHEAST ASIA AND AUSTRALASIA APPENDIX IV
SHELL January 2006
POWER GENERATION
Sources: EIA & BP Statistical Review of World Energy
Electricity generated 1980 v 2004
0.00
50.00
100.00
150.00
200.00
250.00
Austra
liaBrun
ei
Cambo
dia
Indon
esia
Laos
Malays
ia
N Zealand
Philipp
ines
Singap
ore
Thaila
nd
Vietna
m
TWh
1980 2004
Generation growth S E Asia & Australasia
0.00
100.00
200.00
300.00
400.00
500.00
600.00
700.00
800.00
1980 1985 1990 1995 2000 2001 2002 2003 2004
TWh
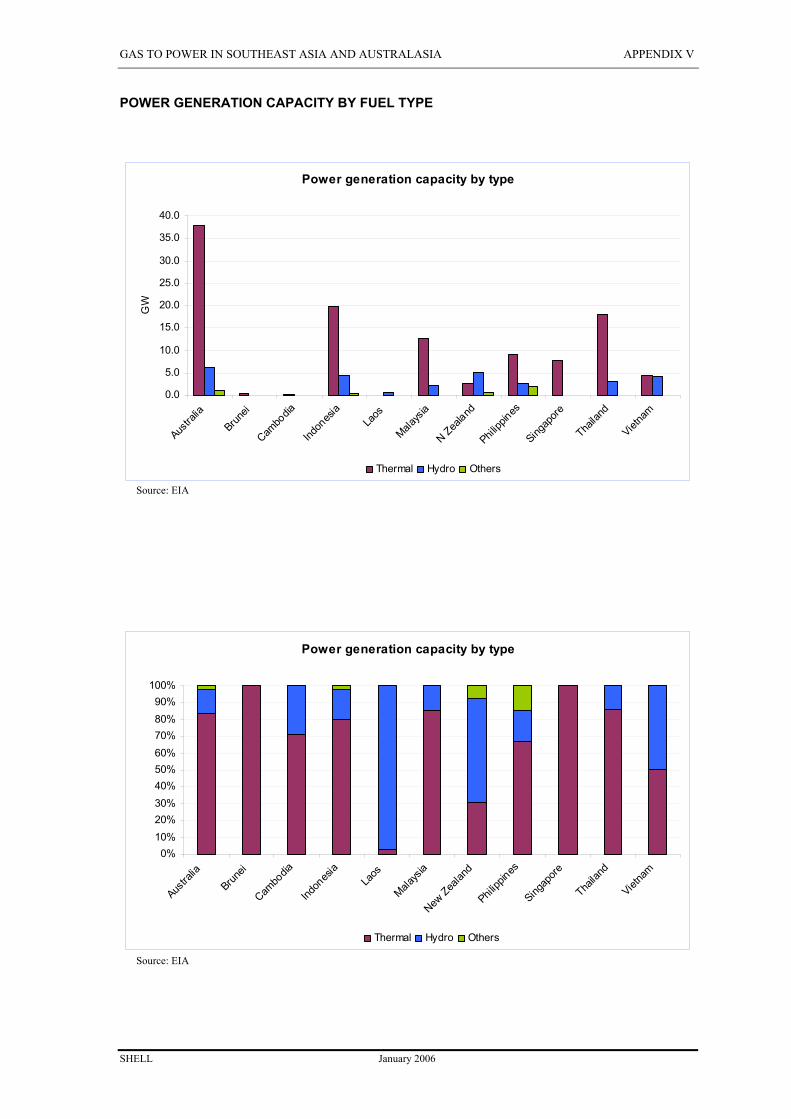
GAS TO POWER IN SOUTHEAST ASIA AND AUSTRALASIA APPENDIX V
SHELL January 2006
POWER GENERATION CAPACITY BY FUEL TYPE
Source: EIA
Power generation capacity by type
0.0
5.0
10.0
15.0
20.0
25.0
30.0
35.0
40.0
Austra
liaBrun
ei
Cambo
dia
Indon
esia
Laos
Malays
ia
N Zealand
Philipp
ines
Singap
ore
Thaila
nd
Vietna
m
GW
Thermal Hydro Others
Source: EIA
Power generation capacity by type
0%10%20%30%40%50%60%70%80%90%
100%
Austra
liaBrun
ei
Cambo
dia
Indon
esia
Laos
Malays
ia
New Zea
land
Philipp
ines
Singap
ore
Thaila
nd
Vietna
m
Thermal Hydro Others
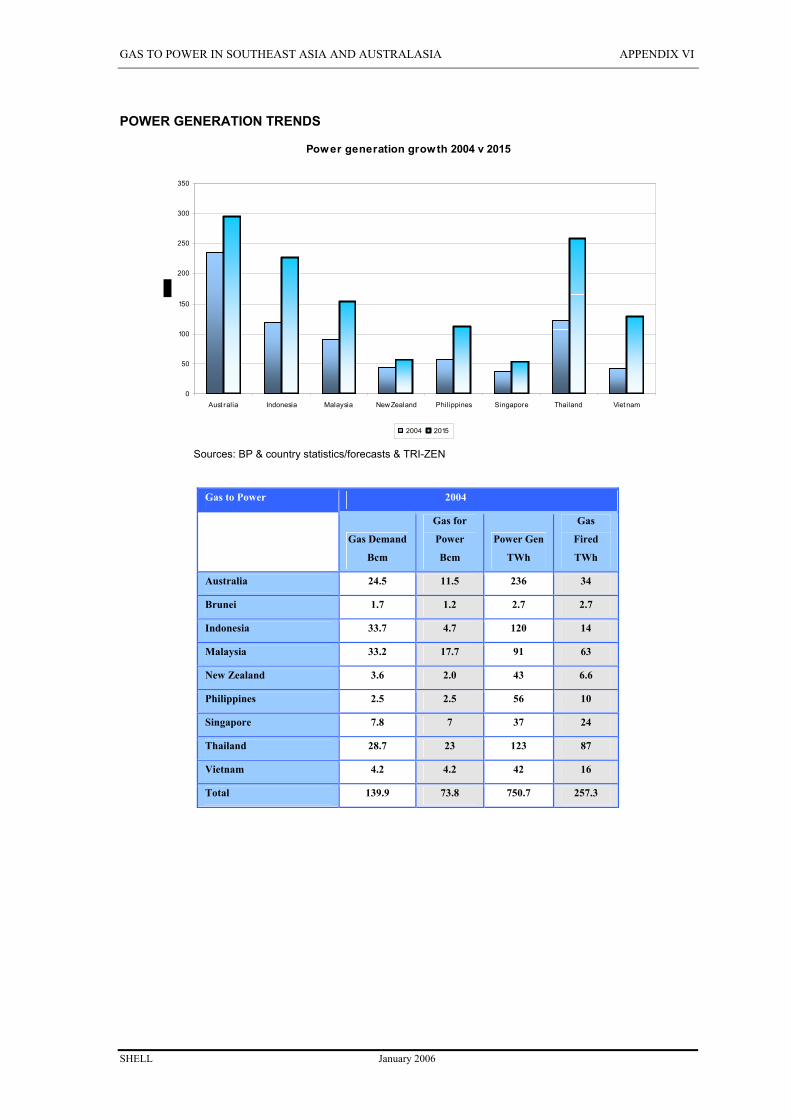
GAS TO POWER IN SOUTHEAST ASIA AND AUSTRALASIA APPENDIX VI
SHELL January 2006
POWER GENERATION TRENDS
Power generation growth 2004 v 2015
0
50
100
150
200
250
300
350
Aust ralia Indonesia Malaysia New Zealand Philippines Singapore Thailand Viet nam
2004 2015
Sources: BP & country statistics/forecasts & TRI-ZEN
Gas to Power 2004
Gas Demand
Bcm
Gas for
Power
Bcm
Power Gen
TWh
Gas
Fired
TWh
Australia 24.5 11.5 236 34
Brunei 1.7 1.2 2.7 2.7
Indonesia 33.7 4.7 120 14
Malaysia 33.2 17.7 91 63
New Zealand 3.6 2.0 43 6.6
Philippines 2.5 2.5 56 10
Singapore 7.8 7 37 24
Thailand 28.7 23 123 87
Vietnam 4.2 4.2 42 16
Total 139.9 73.8 750.7 257.3
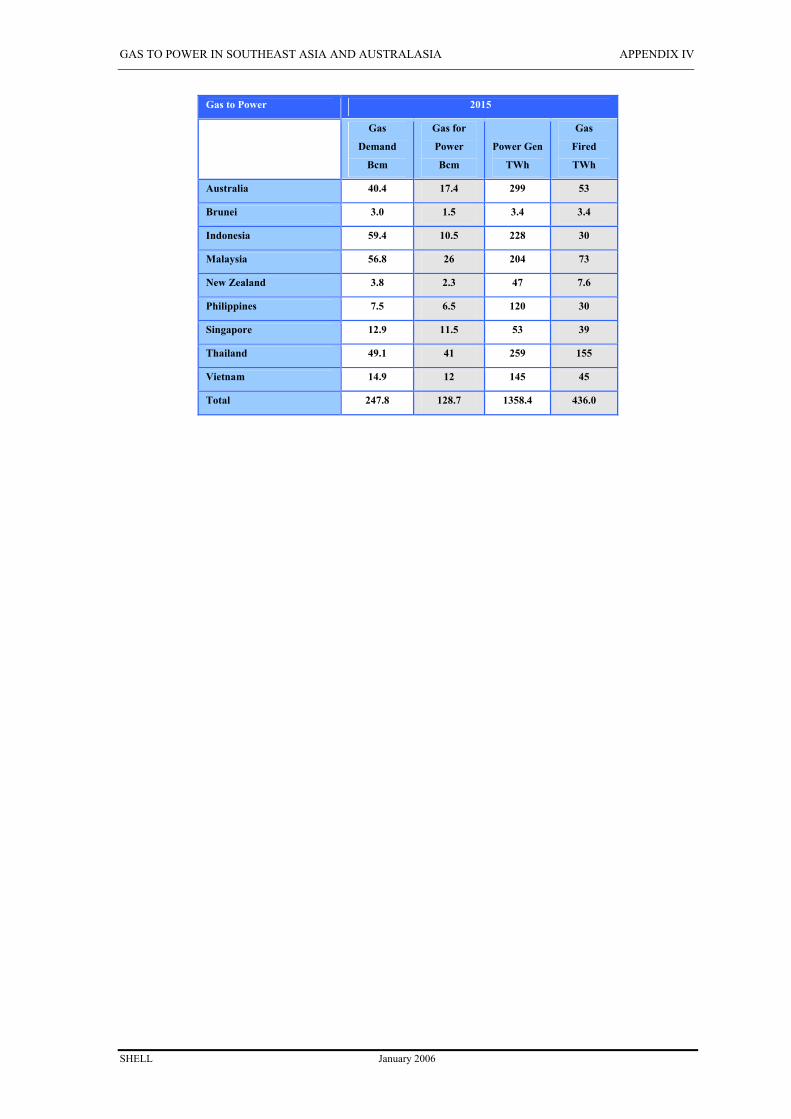
GAS TO POWER IN SOUTHEAST ASIA AND AUSTRALASIA APPENDIX IV
SHELL January 2006
Gas to Power 2015
Gas
Demand
Bcm
Gas for
Power
Bcm
Power Gen
TWh
Gas
Fired
TWh
Australia 40.4 17.4 299 53
Brunei 3.0 1.5 3.4 3.4
Indonesia 59.4 10.5 228 30
Malaysia 56.8 26 204 73
New Zealand 3.8 2.3 47 7.6
Philippines 7.5 6.5 120 30
Singapore 12.9 11.5 53 39
Thailand 49.1 41 259 155
Vietnam 14.9 12 145 45
Total 247.8 128.7 1358.4 436.0
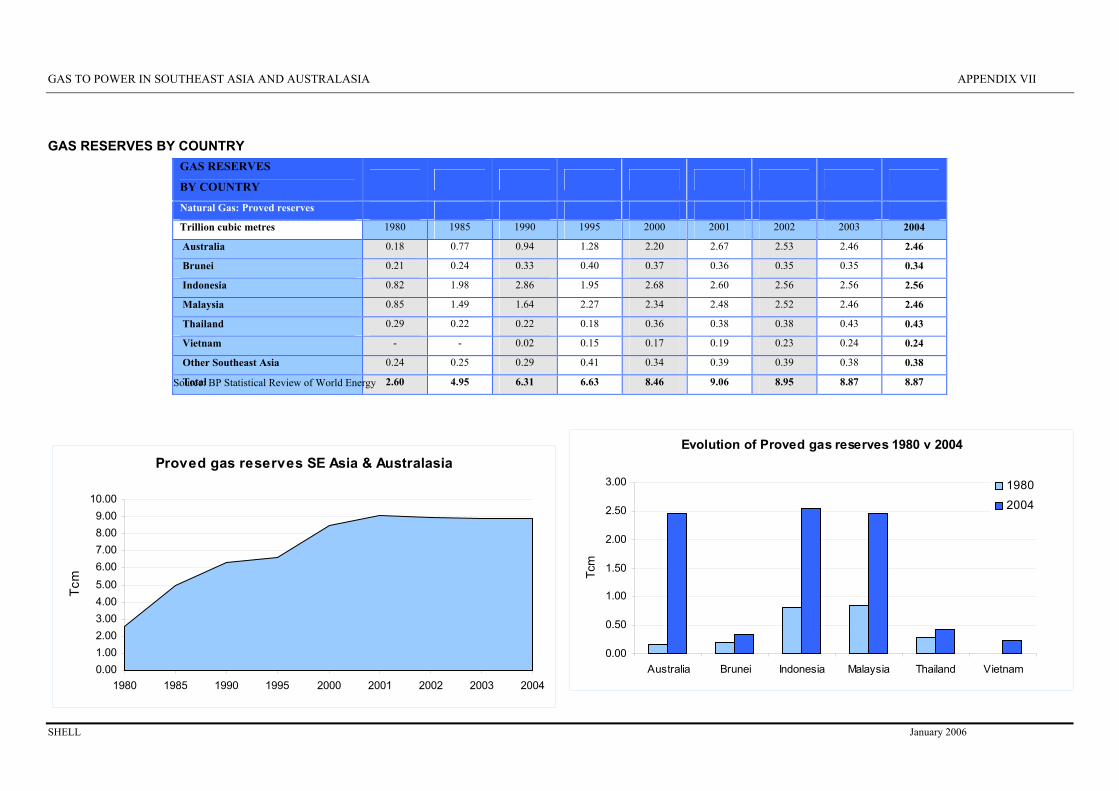
GAS TO POWER IN SOUTHEAST ASIA AND AUSTRALASIA APPENDIX VII
SHELL January 2006
Evolution of Proved gas reserves 1980 v 2004
0.00
0.50
1.00
1.50
2.00
2.50
3.00
Australia Brunei Indonesia Malaysia Thailand Vietnam
Tcm
1980
2004
Proved gas reserves SE Asia & Australasia
0.001.002.003.004.005.006.007.008.009.00
10.00
1980 1985 1990 1995 2000 2001 2002 2003 2004
Tcm
GAS RESERVES BY COUNTRY
GAS RESERVES
BY COUNTRY
Natural Gas: Proved reserves
Trillion cubic metres 1980 1985 1990 1995 2000 2001 2002 2003 2004
Australia 0.18 0.77 0.94 1.28 2.20 2.67 2.53 2.46 2.46
Brunei 0.21 0.24 0.33 0.40 0.37 0.36 0.35 0.35 0.34
Indonesia 0.82 1.98 2.86 1.95 2.68 2.60 2.56 2.56 2.56
Malaysia 0.85 1.49 1.64 2.27 2.34 2.48 2.52 2.46 2.46
Thailand 0.29 0.22 0.22 0.18 0.36 0.38 0.38 0.43 0.43
Vietnam - - 0.02 0.15 0.17 0.19 0.23 0.24 0.24
Other Southeast Asia 0.24 0.25 0.29 0.41 0.34 0.39 0.39 0.38 0.38
Total 2.60 4.95 6.31 6.63 8.46 9.06 8.95 8.87 8.87 Source: BP Statistical Review of World Energy
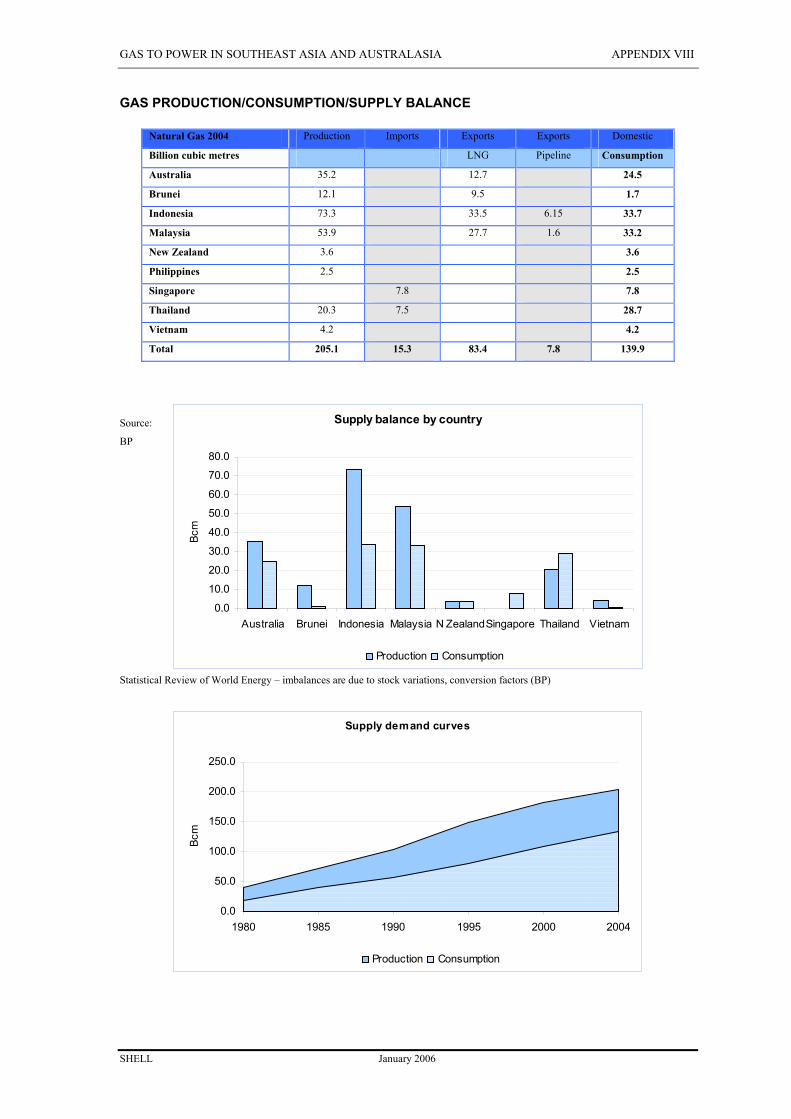
GAS TO POWER IN SOUTHEAST ASIA AND AUSTRALASIA APPENDIX VIII
SHELL January 2006
Supply demand curves
0.0
50.0
100.0
150.0
200.0
250.0
1980 1985 1990 1995 2000 2004
Bcm
Production Consumption
Supply balance by country
0.0
10.0
20.0
30.0
40.0
50.0
60.0
70.0
80.0
Australia Brunei Indonesia Malaysia N ZealandSingapore Thailand Vietnam
Bcm
Production Consumption
GAS PRODUCTION/CONSUMPTION/SUPPLY BALANCE
Natural Gas 2004 Production Imports Exports Exports Domestic
Billion cubic metres LNG Pipeline Consumption
Australia 35.2 12.7 24.5
Brunei 12.1 9.5 1.7
Indonesia 73.3 33.5 6.15 33.7
Malaysia 53.9 27.7 1.6 33.2
New Zealand 3.6 3.6
Philippines 2.5 2.5
Singapore 7.8 7.8
Thailand 20.3 7.5 28.7
Vietnam 4.2 4.2
Total 205.1 15.3 83.4 7.8 139.9
Source:
BP
Statistical Review of World Energy – imbalances are due to stock variations, conversion factors (BP)

GAS TO POWER IN SOUTHEAST ASIA AND AUSTRALASIA APPENDIX IX
SHELL January 2006
NATURAL GAS USAGE - PERCENTAGE BY SECTOR
Natural Gas 2004 Power City Gas Industry Transport Others LNG Pipeline
Percentage Split Exports Exports
Australia 19.5 11.8 39.3 0.1 29.3
Brunei 10 90
Indonesia 6.6 9.8 20.6 57.4 5.5
Malaysia 25.7 7.1 14.2 50 3
New Zealand 60 7 29 4
Philippines 100
Singapore 90 10
Thailand 80 8 12
Vietnam 100
Country/Government agency statistics
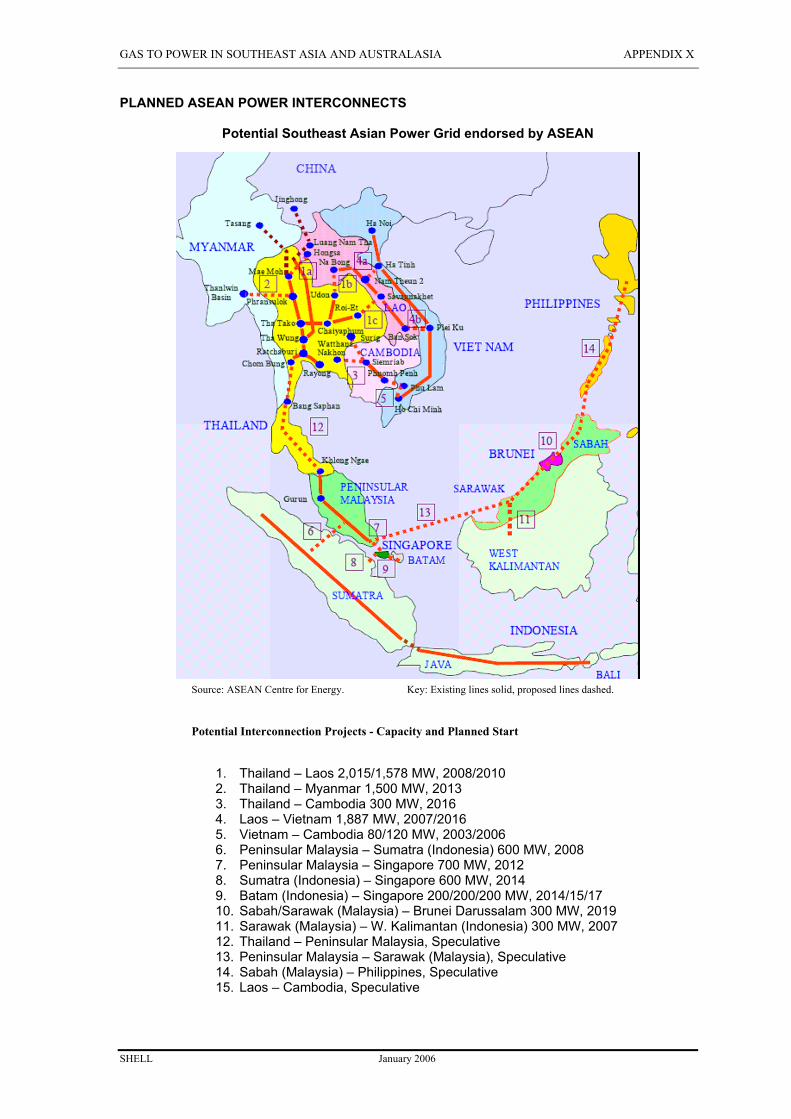
GAS TO POWER IN SOUTHEAST ASIA AND AUSTRALASIA APPENDIX X
SHELL January 2006
PLANNED ASEAN POWER INTERCONNECTS
Potential Southeast Asian Power Grid endorsed by ASEAN
Source: ASEAN Centre for Energy. Key: Existing lines solid, proposed lines dashed.
Potential Interconnection Projects - Capacity and Planned Start
1. Thailand – Laos 2,015/1,578 MW, 2008/2010 2. Thailand – Myanmar 1,500 MW, 2013 3. Thailand – Cambodia 300 MW, 2016 4. Laos – Vietnam 1,887 MW, 2007/2016 5. Vietnam – Cambodia 80/120 MW, 2003/2006 6. Peninsular Malaysia – Sumatra (Indonesia) 600 MW, 2008 7. Peninsular Malaysia – Singapore 700 MW, 2012 8. Sumatra (Indonesia) – Singapore 600 MW, 2014 9. Batam (Indonesia) – Singapore 200/200/200 MW, 2014/15/17 10. Sabah/Sarawak (Malaysia) – Brunei Darussalam 300 MW, 2019 11. Sarawak (Malaysia) – W. Kalimantan (Indonesia) 300 MW, 2007 12. Thailand – Peninsular Malaysia, Speculative 13. Peninsular Malaysia – Sarawak (Malaysia), Speculative 14. Sabah (Malaysia) – Philippines, Speculative 15. Laos – Cambodia, Speculative

GAS TO POWER IN SOUTHEAST ASIA AND AUSTRALASIA APPENDIX XI
SHELL January 2006
PLANNED ASEAN GAS GRID
Southeast Asia Existing and Planned Gas Pipeline Infrastructure
Source: TRI-ZEN
Under construction
Indonesia
• South Sumatra-West Java pipeline phase one due to be completed
mid 2006, phase two 2008
• Greater Jakarta distribution network scheduled to be completed in 2006
• West Java distribution network scheduled to be completed in 2008
Thailand
• Third pipeline from Rayong to the Arthit field in the Gulf of Thailand, due
to be commissioned mid 2006
• Trans Thai – Malaysia gas pipeline from the Joint Development Area (JDA)
to Songkhla in Southern Thailand and then to Northern Malaysia (Kedah)
OperatingUnder constructionPlanned
GAS TO POWER IN SOUTHEAST ASIA AND AUSTRALASIA APPENDIX IV
SHELL January 2006
Planned
Indonesia
• Duri-Dumai-Medan pipeline, due to be constructed between 2006 and 2009
• East Kalimantan - Central Java pipeline, planning is currently at the feasibility stage with
completion scheduled for 2010
• East Java -West Java Pipeline plus an East & Central Java distribution system, due for
completion 2010.
• Sengkang- Makassar pipeline, due for completion in 2011
Malaysia
• Pipeline from the Joint Development Area to the Arthit field in Thailand to link
into the Thai collection system 2009
Thailand
• Pipeline from Gulf of Thailand to Vietnam possibly fed from the JDA
GAS TO POWER IN SOUTHEAST ASIA AND AUSTRALASIA
SHELL January 2006
LIST OF ABBREVIATIONS & ACRONYMS
APEC Asia-Pacific Economic Co-operation
APERC Asia Pacific Energy Research Centre
ASEAN Association of Southeast Asian Nations
Bbl/d Barrels per day
B/d Barrels per day
Bcf Billion cubic feet
Bcf/d Billion cubic feet per day
Bcm Billion cubic metres
BPL Berakas Power Company (Brunei Darussalam)
BSP Brunei Shell Petroleum
Btu British thermal unit
CIA Central Intelligence Agency (US)
CCGT Combined Cycle Gas Turbine
CNG Compressed Natural gas
CO2 Carbon dioxide
DES Department of Electrical Services (Brunei Darussalam)
DG Distributed Generation
EDC Electricite du Cambodge (Cambodia)
EDF Electricite du France
EDL Electricite du Laos
EGAT Electricity Generating Authority of Thailand
EIA Energy Information Administration (USA)
EIU Economist Intelligence Unit
EMA Energy Market Authority (Singapore)
ESA Energy Supply Act of 1990 (Malaysia)
EVN Electricity of Viet Nam
GDP Gross Domestic Product
GW Gigawatt (one thousand million Watts)
GWh Gigawatt hour (one million kilowatt hours)
IEA International Energy Agency
IPPs Independent Power Producers
JV Joint Venture
JDA Joint Development Area
km kilometers
kt kilotonne (one thousand tonnes)
kV kilovolt (one thousand volts)
kW Kilowatt (=1,000 watts)
kWh Kilowatt hour (=1,000 watt-hours or 3,412 Btu)
kWh/pp Kilowatt hour per person (consumption per year)
ktoe Kilo tonnes of oil equivalent
GAS TO POWER IN SOUTHEAST ASIA AND AUSTRALASIA
SHELL January 2006
LNG Liquefied Natural Gas
LOI Letter of Intent
LPG Liquefied Petroleum Gas
MBtu Million British thermal units
MEA Metropolitan Electricity Authority (Thailand)
Meralco Manila Electric Company (Philippines)
MIME Ministry of Industry, Mines & Energy (Cambodia)
MOU Memorandum of understanding
MRET Minimum Renewable Energy Target
Mill toe Million tonnes of oil equivalent
MW Megawatts (=1,000 kilowatts)
MWh Megawatt hour (one thousand kilowatt hours)
NEM National Electricity Market (Australia)
NOx Nitrogen oxides
NPC National Power Corporation (Philippines)
NSW New South Wales (Australia)
OECD Organisation for Economic Corporation and Development
PEA Provincial Electricity Authority (Thailand)
PGN Perusahaan Gas Negara (Indonesia)
PLN Perusahaan Listrik Negara (Indonesia)
PNG Papua New Guinea
PNOC Philippines National Oil Company
PPA Power purchase agreement
PTT Petroleum Company of Thailand
SESco Sarawak Electricity Company (Malaysia)
SOx Sulphur oxides (including sulphur dioxide)
SSP Small Power Producer (Thailand)
SWIS South West Interconnect System (Australia)
Tcf Trillion cubic feet
Tcm Trillion cubic metres
TNB Tenaga Nasional Berhad (Malaysia)
TWh Terawatt hour (one billion kilowatt hours)
WPC Western Power Corporation (Australia)

2006
International Gas UnionUnion Internationale de l’Industrie du Gaz
For more information, please contact:
International Gas Union Office of the Secretary GeneralP.O. Box 550 c/o DONG Energy A/S Agern Alle 24-26 DK-2970 HoersholmDenmark
Website: www.igu.org
Gas to Power - North America