Gas Condensate Relative Permeability for Well …curtis/courses/PVT-Flow/2013-TPG4145/e...GAS...
33
Transport in Porous Media 52: 279–311, 2003. © 2003 Kluwer Academic Publishers. Printed in the Netherlands. 279 Gas Condensate Relative Permeability for Well Calculations CURTIS H. WHITSON 1,2 , ØIVIND FEVANG 2 and AUD SÆVAREID 3 1 Norwegian University of Science and Technology, NTNU, Norway 2 Pera a/s 3 Statoil a/s (Received: 5 October 2001; in final form: 28 October 2002) Abstract. This paper addresses several issues related to the modeling and experimental design of relative permeabilities used for simulating gas condensate well deliverability. Based on the properties of compositional flow equations, we make use of the fact that relative permeability ratio k rg /k ro is a purely thermodynamic variable, replacing saturation, when flow is steady-state. The key relation defining steady-state flow in gas condensate wells is relative permeability k rg as a function of k rg /k ro . Consequently, determination of saturation and k r as a function of saturation is not important for this specific calculation. Once the k rg = f (k rg /k ro ) relationship is experimentally established and correlated with capillary number (N c ), accurate modeling of condensate blockage is possible. A generalized model is developed for relative permeability as the function of k rg /k ro and capillary number. This model enables us to link the ‘immiscible’ or ‘rock’ curves with ‘miscible’ or ‘straight- line’ curves by a transition function dependent on the capillary number. This model is also extended to the case of high-rate, inertial gas flow within the steady-state condensate blockage region and locally at the wellbore. We have paid particular attention to the effect of hysteresis on the relation k rg = f (k rg /k ro ), based on our observation that many repeated cycles of partial/complete imbibition and drainage occur in the near-well region during the life of a gas condensate well. Finally, the composite effect of condensate blockage is handled using a ‘Muskat’ pseudopressure model, where relative permeabilities are corrected for the positive effect of capillary number dependence and the negative effect of inertial high velocity flow. Special steady-state experimental procedures have been developed to measure k rg as a function of k rg /k ro and N c . Saturations, though they can be measured, are not necessary. An approach for fitting steady-state gas condensate relative permeability data has been developed and used for modeling relative permeability curves. Key words: gas condensate, condensate blockage, steady-state flow, well performance, relative permeability. Nomenclature A cross-sectional area to flow; constant in Chierici k ro correlation. B constant in Chierici k rg correlation. B gd dry-gas FVF. c g1 , c g2 , c g3 constants in Arco k rg correlation. c o1 , c o2 , c o3 constants in Arco k ro correlation. f I immiscibility factor. k absolute water permeability (md). k r relative permeability, relative to absolute permeability. k rg relative permeability to gas. k rgI ‘immiscible’ (N c = 0) relative permeability to gas. k rgM ‘miscible’ (N c =∞) relative permeability to gas.
Transcript of Gas Condensate Relative Permeability for Well …curtis/courses/PVT-Flow/2013-TPG4145/e...GAS...

Transport in Porous Media 52: 279–311, 2003.© 2003 Kluwer Academic Publishers. Printed in the Netherlands.
279
Gas Condensate Relative Permeability for WellCalculations
CURTIS H. WHITSON1,2, ØIVIND FEVANG2 and AUD SÆVAREID3
1Norwegian University of Science and Technology, NTNU, Norway2Pera a/s3Statoil a/s
(Received: 5 October 2001; in final form: 28 October 2002)
Abstract. This paper addresses several issues related to the modeling and experimental design ofrelative permeabilities used for simulating gas condensate well deliverability. Based on the propertiesof compositional flow equations, we make use of the fact that relative permeability ratio krg/kro isa purely thermodynamic variable, replacing saturation, when flow is steady-state. The key relationdefining steady-state flow in gas condensate wells is relative permeability krg as a function of krg/kro.Consequently, determination of saturation and kr as a function of saturation is not important forthis specific calculation. Once the krg = f (krg/kro) relationship is experimentally established andcorrelated with capillary number (Nc), accurate modeling of condensate blockage is possible. Ageneralized model is developed for relative permeability as the function of krg/kro and capillarynumber. This model enables us to link the ‘immiscible’ or ‘rock’ curves with ‘miscible’ or ‘straight-line’ curves by a transition function dependent on the capillary number. This model is also extendedto the case of high-rate, inertial gas flow within the steady-state condensate blockage region andlocally at the wellbore. We have paid particular attention to the effect of hysteresis on the relationkrg = f (krg/kro), based on our observation that many repeated cycles of partial/complete imbibitionand drainage occur in the near-well region during the life of a gas condensate well. Finally, thecomposite effect of condensate blockage is handled using a ‘Muskat’ pseudopressure model, whererelative permeabilities are corrected for the positive effect of capillary number dependence and thenegative effect of inertial high velocity flow. Special steady-state experimental procedures have beendeveloped to measure krg as a function of krg/kro and Nc. Saturations, though they can be measured,are not necessary. An approach for fitting steady-state gas condensate relative permeability data hasbeen developed and used for modeling relative permeability curves.
Key words: gas condensate, condensate blockage, steady-state flow, well performance, relativepermeability.
Nomenclature
A cross-sectional area to flow; constant in Chierici kro correlation.B constant in Chierici krg correlation.Bgd dry-gas FVF.cg1, cg2, cg3 constants in Arco krg correlation.co1, co2, co3 constants in Arco kro correlation.fI immiscibility factor.k absolute water permeability (md).kr relative permeability, relative to absolute permeability.krg relative permeability to gas.krgI ‘immiscible’ (Nc = 0) relative permeability to gas.krgM ‘miscible’ (Nc = ∞) relative permeability to gas.
280 CURTIS H. WHITSON ET AL.
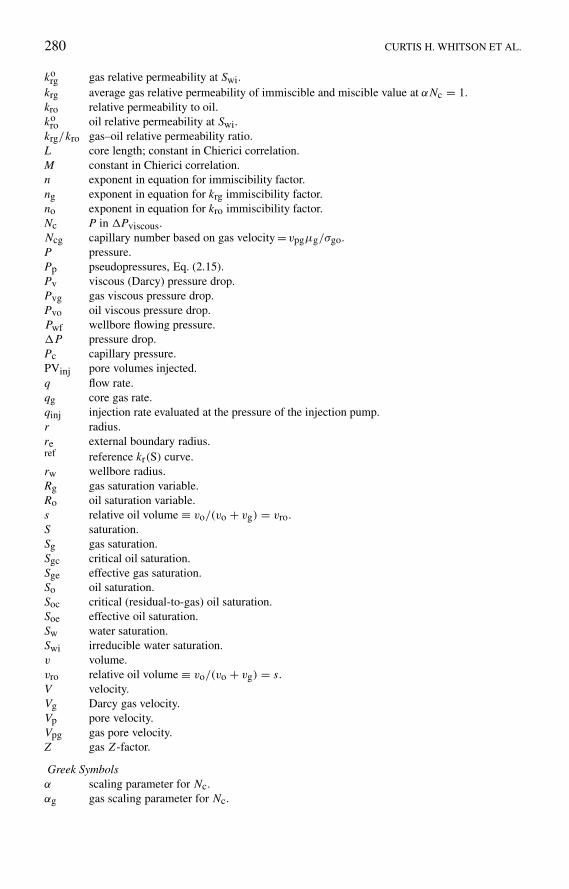
korg gas relative permeability at Swi.
krg average gas relative permeability of immiscible and miscible value at αNc = 1.kro relative permeability to oil.ko
ro oil relative permeability at Swi.krg/kro gas–oil relative permeability ratio.L core length; constant in Chierici correlation.M constant in Chierici correlation.n exponent in equation for immiscibility factor.ng exponent in equation for krg immiscibility factor.no exponent in equation for kro immiscibility factor.Nc P in Pviscous.Ncg capillary number based on gas velocity = vpgµg/σgo.P pressure.Pp pseudopressures, Eq. (2.15).Pv viscous (Darcy) pressure drop.Pvg gas viscous pressure drop.Pvo oil viscous pressure drop.Pwf wellbore flowing pressure.P pressure drop.Pc capillary pressure.PVinj pore volumes injected.q flow rate.qg core gas rate.qinj injection rate evaluated at the pressure of the injection pump.r radius.re external boundary radius.ref reference kr(S) curve.rw wellbore radius.Rg gas saturation variable.Ro oil saturation variable.s relative oil volume ≡ vo/(vo + vg) = vro.S saturation.Sg gas saturation.Sgc critical oil saturation.Sge effective gas saturation.So oil saturation.Soc critical (residual-to-gas) oil saturation.Soe effective oil saturation.Sw water saturation.Swi irreducible water saturation.v volume.vro relative oil volume ≡ vo/(vo + vg) = s.V velocity.Vg Darcy gas velocity.Vp pore velocity.Vpg gas pore velocity.Z gas Z-factor.
Greek Symbolsα scaling parameter for Nc.αg gas scaling parameter for Nc.
GAS CONDENSATE RELATIVE PERMEABILITY FOR WELL CALCULATIONS 281
αo oil scaling parameter for Nc.β inertial HVF coefficient.βeff effective inertial HVF coefficient including effect of krg.ξ total mass concentration.η chemical potential.λ mobility.λg gas mobility.λg oil mobility.ρ mass density.ρg gas density.µ viscosity.µg gas viscosity.µo oil viscosity.σgo interfacial tension (IFT).φ porosity.
1. Introduction
The typical chemical composition of a gas-condensate mixture is dominated byvolatile components such as methane, and a rather ‘small’ amount of heavy hy-drocarbon components (<15 mol-%), though these heavier components make up aconsiderably larger percentage of the liquid phase (‘retrograde condensate’) formedduring pressure decrease below an upper dewpoint. For practically any retrogradecondensate reservoir, the condensate saturation is, throughout most of the reservoir,so low that its mobility is much less than gas mobility and for practical purposescan be considered immobile. Nevertheless, this gas-dominated flow behavior is notat all correct in the vicinity of gas-condensate wells where condensate saturationsoften reach high values (>50%), and oil permeability may exceed gas permeability(krg/kro < 1).
Condensate blockage near the wellbore may reduce gas well deliverability ap-preciably, though the severity depends on a number of reservoir and well paramet-ers. Condensate blockage is important if the pressure drop from the reservoir tothe wellbore is a significant percentage of the total pressure drop from reservoirto delivery point (e.g. a surface separator) at the time (and after) a well goeson decline. Reservoirs with low-to-moderate permeability (<10–50 md) are often‘problem’ wells where condensate blockage must be handled properly. Wells withhigh kh products (>5–10,000 md-ft) are typically not affected by reservoir pressuredrop because the well’s deliverability is constrained almost entirely by the tubing.In this case, condensate blockage is a non-issue.
As previously discussed by Fevang and Whitson (1996), gas-condensate flowand saturation distribution in gas condensate reservoirs can be classified into threecategories: (1) a near-well region where the gas/oil flow is steady-state, the con-densate saturation is high and results in a severe hysteresis behavior throughout thelife of a well – experiencing hundreds of cycles of complete or partial imbibitionand drainage; (2) in the bulk of the reservoir far-removed from the wells, a secondregion exhibits only gas flow at a somewhat reduced permeability, while the con-

282 CURTIS H. WHITSON ET AL.
densate saturation remains very low but increases in time, where this process canbe treated as imbibition throughout the life of the reservoir; and (3) beyond region(2) where pressures are above the initial dewpoint and no condensate saturation isfound. In this paper we do not consider the complex relative permeability behav-ior where, through water encroachment, the gas and/or retrograde condensate aretrapped by aquifer water in quantities from 15–40 saturation percent, and where allthree phase permeabilities can be significantly reduced.
In terms of reservoir well performance, the near-well behavior, determinedby the near-well relative permeability functions, is the dominant factor. The far-removed region II of condensate accumulation has somewhat reduced gas relativepermeability, but this effect is generally second-order regarding well performance.Trapped saturations and reduced water relative permeability in water encroachmentdomain can be important for reservoir performance, but has no direct effect on wellperformance prior to water breakthrough.
The purpose of this paper is to present an approximate approach to model gascondensate wells, which is based on the hypothesis of a dominant role of thenear-well region and a steady-state flow within this region. The analysis of steady-state flow equations leads to a simple hydrodynamic formula similar to the Dupuitequation, relating flow rate with a ‘Muskat’ pseudopressure intergral. The pseudo-pressure integral contains thermodynamic functions and relative permeabilities.
To calculate thermodynamic functions we have obtained a closed thermody-namic system of equations (phase splitting the overall flowing composition), whichare entirely independent of the hydrodynamic sub-system. Moreover, we havestrictly shown that this thermodynamic system is monovariant, such that all thethermodynamic variables depend on pressure only.
The second parameter determining the pseudopressure integral is the relativepermeability. To calculate kr we have developed generalized models which arefounded on the fundamental laws of flow behavior near gas condensate wells. Thisflow behavior is characterized by a condensate ‘blockage’ near the wellbore wheregas relative permeability is reduced by the buildup of a significant mobile conden-sate saturation. Condensate blockage may reduce well deliverability appreciably,though the severity depends on a number of reservoir and well parameters.
The dependence of relative permeability on capillary number may also be im-portant, particularly for rich condensates with high delivery pressures (i.e. highbottomhole flowing pressures when the well is on decline). Capillary number de-scribes the relative balance of viscous and capillary forces (Nc = pviscous/Pc, orNc = vpgµg/σgo). For small Nc, capillary forces dominate and traditional (‘im-miscible’) relative permeability behavior is found. For large Nc, viscous forcesdominate and relative permeabilities tend to approach straight lines or ‘miscible-like’ behavior. In our modeling approach, we correlate relative permeability us-ing a generalized equation that consists of a traditional ‘immiscible’ (Corey-type(Brooks and Corey, 1966; Standing, 1975)) relation and a simple one-parametercorrelation for capillary number dependence.

GAS CONDENSATE RELATIVE PERMEABILITY FOR WELL CALCULATIONS 283
The relative permeability model we develop also considers scaling for the vari-ation of endpoint saturations. Our heuristic approach is based on maintaining thefundamental relationship krg = f (krg/kro), independent of endpoint saturation.
The last part of this paper is devoted to the experimental determination of rela-tive permeabilities for gas-condensate systems. According to theoretical analysis, itis readily shown that the relative permeability ratio krg/kro is a universal function ofpressure if gas-condensate flow is steady-state. Hence, the ratio krg/kro is a thermo-dynamic variable and can then be obtained directly from PVT experiment (or PVTsimulation). Moreover, because the measured data can be presented in the formkrg = f (krg/kro) instead of krg(S) and kro(S), we do not require the measurementof saturation. The immiscible correlations are transformed from their traditionalformat of kr(S) to krg(krg/kro) in the fitting process. Once the correlation is fit tomeasured data, it is readily converted back to the form kr(S) needed in traditionalreservoir modeling.
In 1942, Evinger and Muskat (1942) and Saevareid et al. (1999) already madethe same observation that saturation measurements are not important for saturatedoil well performance – where kro = f (krg/kro) is independent of So. This observa-tion in gas condensate systems is particularly important because it provides a moreaccurate and consistent interpretation of data from various sources (laboratories,model studies, etc.). A plot krg = f (krg/kro) – for gas condensate reservoirs –highlights the relevant krg/kro range for the particular reservoir and provides a keytool for quantifying condensate blockage.
Thus, we concentrate on the steady-state flowing conditions found in the near-well region – typically up to 100 m away from the wellbore. Specifically, we tryto use laboratory pressures (Saevareid et al., 1999) and flow velocities similar tothose experienced by wells in a given field. Relative permeability measurementsare limited to the key data required to model flow behavior at these conditions –namely the relationship krg = f (krg/kro).
The results of our experimental and modeling work on relative permeabilityhas been implemented in full-field reservoir simulation models using the conceptof a generalized pseudopressure function. Well productivity calculations basedon pseudopressure include the effects of condensate blockage, capillary numberdependence of relative permeability, high-velocity (‘non-Darcy’) effects, and wellgeometry.
2. Theory of Steady-State Compositional Flow
2.1. GENERAL EQUATIONS OF COMPOSITIONAL FLOW
Let us examine the system of equations describing the flow of a two-phase mul-ticomponent mixture in porous medium:
φ∂(ζ (k)ρ)
∂t+ div
(Vgφ(1 − s)ρgc
(k)g + Voφsρoc(k)
o
) = 0, (k = 1, . . . , N)
(2.1)

284 CURTIS H. WHITSON ET AL.
Ugφ(1 − s) = −kkrg(s)
µggradPg, Uoφs = −kkro(s)
µogradPo (2.2)
ζ (k) = ρgc(k)g (1 − s) + ρoc
(k)o s
ρg(1 − s) + ρos, (k = 1, . . . , N);
ρ = ρg(1 − s) + ρos (2.3)
η(k)g
(Pg, c(1)
g , . . . , c(N)g
) = η(k)o (Po, c(1)
o , . . . , c(N)o ),
(k = 1, . . . , N); Pg = Po + Pc(s) (2.4)
ρg = ρg(Pg, c(1)
g , . . . , c(N)g
), ρo = ρo(Po, c(1)
o , . . . , c(N)o ) (2.5)
N∑k=1
c(k)g = 1,
N∑k=1
c(k)o = 1 (2.6)
where φ is the porosity; k is the permeability; krg(s) and kro(s) are the relative gasand condensate (oil) permeabilities; Pc(s) is the capillary pressure; ζ (k) is the totalmass concentration of kth component in the system; c(k)
g is the mass concentrationof kth component in gas; c(k)
o is the mass concentration of kth component in oil; ρ
is the total density; ρg and ρo are the gas and the oil densities; µg and µo are the gasand oil viscosities; Vg and Vo are the true gas and oil flow velocities; Pg and Po arethe gas and oil pressures; η(k)
g and η(k)o are the chemical potentials of kth component
in gas and oil. s is not the traditional pore-volume saturation, but it representsthe fraction of flowing mixture volume which is oil, s ≡ vro = vo/(vo + vg) =qo/(qo + qg), where vo and vg are volumes of the following mixture.
Equation (2.1) is the mass conservation law written for each component; eachEquation (2.2) is the Darcy law written for each fluid phase; Equation (2.3) arethe definitions of the total concentration and total density; Equation (2.4) are theequilibrium conditions; Equation (2.5) are the equations of phase state.
Let the medium properties: φ, k, krg(s), kro(s) and Pc(s) be known. Let thefluid viscosities be known too. Then system (2.1) – (2.6) consisting of (3N + 8)equations contains (3N + 8) variables: ζ (k), c(k)
g , c(k)o , ρ, ρg, ρo, Ug, Uo, Pg, Po, s.
2.2. EQUATIONS OF STEADY-STATE COMPOSITIONAL FLOW
Let the flow be steady-state. Then the time-derivatives in (2.1) are zero. Hence, weobtain the following sub-system instead of (2.1):
ζ (k) = ζ (k)0 = const, (k = 1, . . . , N − 1) (2.7a)
div(Vgφ(1 − s)ρgc
(k)g + Voφsρoc
(k)o
) = 0, (k = 1, . . . , N) (2.7b)
where ζ (k)0 is ‘initial’ total concentration, that is, some values given by the initialconditions. System (2.7a) contains only (N − 1) equations, as only (N − 1) initial

GAS CONDENSATE RELATIVE PERMEABILITY FOR WELL CALCULATIONS 285
values ζ (k)0 are independent (#kζ (k)0 = 1). A supplementary equation followingfrom (2.1), ρ = ρ0 = const, is not also independent, as it is the sum of (2.7a) from1 to N.
Note that relationships (2.7a) mean that the total mixture composition remainsconstant during steady-state flow.
System (2.7), (2.2) – (2.6) contains now (4N + 7) equations with (3N + 8)
variables. Such a system is overdetermined.To the steady-state system be physically and mathematically correct, the fol-
lowing relation must be satisfied:
Vg = Vo ≡ V (2.8)
which means that the true flow velocity is the same for both phases.Then (2.7b) takes the form for any index k:
0 = div(V φ[ρgc(k)g (1 − s) + ρoc
(k)o s])
= div(V φζ (k)ρ) = ζ (k)0ρ0div(V φ)
or
div(V φ) = 0 (2.9)
Finally, the steady-state flow model of compositional flow represents a systemwhich is split into a hydrodynamic and a thermodynamic sub-system.
The hydrodynamic sub-system:
div(V φ) = 0, V = − kkrg(s)
φ(1 − s)µggradP, Vo = V (2.10)
The thermodynamic sub-system:
ζ (k) = ζ (k)0 = const, (k = 1, . . . , N − 1) (2.11a)
ζ (k) = ρgc(k)g (1 − s) + ρoc
(k)o s
ρg(1 − s) + ρos, (k = 1, . . . , N) (2.11b)
η(k)g
(P, c(1)
g , . . . , c(N)g
) = η(k)o
(Po, c(1)
o , . . . , c(N)o
),
(k = 1, . . . , N); P = Po + Pc(s) (2.11c)
ρg = ρg(P, c(1)
g , . . . , c(N)g
), ρo = ρo
(Po, c(1)
o , . . . , c(N)o
)(2.11d)
N∑k=1
c(k)g = 1,
N∑k=1
c(k)o = 1 (2.11e)

286 CURTIS H. WHITSON ET AL.
This system contains in total (3N + 7) equations with (3N + 7) variables: ζ (k),c(k)
g , c(k)o , ρg, ρo, V ≡ Vg, Vo, P ≡ Pg, Po, s. The system is correct.
2.3. UNIVERSAL RELATION BETWEEN RELATIVE PERMEABILITY
RATIO AND SATURATION
Four important corollaries follow from the steady-state model:
krgµo
kroµg= (1 − s)
s, if Pg = Po (2.12a)
krgµo
kroµg= (1 − s)
s
dPo
dP, if Pg = Po and the flow is 1D (2.12b)
and
krg
µg+ kro
µo= krg
(1 − s)µg, in both cases (2.12c)
These relations are easy to prove. Let us examine ratio of two Darcy’s velocitiesgiven by (2.2):
krgµogradPg
kroµggradPo= Ug(1 − s)
Uos
On the left-hand side, the gradients may be eliminated if the phase pressuresare the same. If not, the ratio of gradients in 1D case equals dPg/dP o. On theright-hand side the true velocities are eliminated due to (2.8). As a result we ob-tain (2.12a) or (2.12b). Relation (2.12c) follows from (2.12a) or (2.12b). Relation(2.12a) or (2.12b) means that the saturation can be replaced by the relative per-meability ratio. This fact is of considerable importance, as the measurement ofthe relative permeability ratio is a simpler and more accurate quantity than that ofsaturation.
2.4. MONOVARIANCE OF THE THERMODYNAMIC SUB-SYSTEM
Another significant property of steady-state compositional flow follows from ther-modynamic sub-system (2.11).
It is seen that this sub-system contains (3N + 4) equations and (3N + 5)
thermodynamic variables: ζ (k), c(k)g , c(k)
o , ρg, ρo, P, Po, s. This means that a single(arbitrary) variable is independent. In other words the system variance is equal to 1.
Let us designate P ≡ Pg as the independent thermodynamic variable. Thenthe monovariance means that during a steady-state flow all other thermodynamicvariables are functions of P:
ζ (k) = ζ (k)(P ), c(k)i = c
(k)i (P ), ρi = ρi(P ),
Po = Po(P ), s = s(P ); i = g, o; k = 1, . . . , N (2.13)

GAS CONDENSATE RELATIVE PERMEABILITY FOR WELL CALCULATIONS 287
2.5. STEADY-STATE MODEL FOR RADIAL FLOW
Let us examine now the steady-state radial flow towards a well between two radiirw and re in a cylindrical domain of thickness h. Let the total flow rate of bothphases q = 2πrh[Vgφ(1 − s) + Voφs] is known at radius rw. For q it is easy toobtain the following link with P using (2.8) and (2.10):
q = 2πrhVφ[(1 − s) + s] = 2πrhVφ = 2πhkkrg
(1 − s)µgr
dP
dr
Then the radial flow problem can be written using (2.10) and (2.13) as:
∂
∂r
(rkrg(s(P ))
[1 − s(P )]µg
∂P
∂r
)= 0, rw < r < re
P |r=re = Pe,krg
(1 − s)µgr
∂P
∂r
∣∣∣∣r=rw
= q
2πkh
The first integration yields:
krg
(1 − s)µgr
∂P
∂r= q
2πkh= const, ∀r
The final solution is then:
∫ Pe
P
krg(P̄ )
[1 − s(P̄ )]µgdP̄ = q
2πkhln
(re
r
)
or
q = 2πkh
ln(
rer
)∫ Pe
P
krg(P̄ )
(1 − s(P̄ ))µgdP̄ (2.14)
If P = Po, the last relationship can be written in the equivalent form, using(12c):
q = 2πkh
ln(
rer
)∫ Pe
P
[krg(P̄ )
µg+ kro(P̄ )
µo
]dP̄ (2.15)
The integral operator in (2.15) is called the ‘pseudopressure integral’.Thus, hydrodynamic equation (2.15) or (2.14) completed by a separate ther-
modynamic sub-system (2.11) represents a simple exact model of compositionalflow towards a well. The advantages of this models are obvious:(i) no necessity to

288 CURTIS H. WHITSON ET AL.
perform fine-grid hydrodynamic simulations; (ii) the thermodynamic calculationblock is entirely separated from the hydrodynamic model.
2.6. OBSERVATIONS
We see that a steady-state compositional flow through porous medium is character-ized by the following properties:
1. the total flowing composition of mixture is constant in space;2. the real flow velocities of both phases are identical; no relative velocity exists;3. the thermodynamic sub-system (2.11) is entirely independent on hydrodynam-
ics;4. the thermodynamic behavior of a multicomponent two-phase system during
steady-state flow in porous medium is monovariant, which means that all thethermodynamic variables, depend on pressure only;
5. the relative permeability ratio is a universal function of pressure defined as(2.12a) whatever the porous medium; hence, taking in account the previousproperty, the relative permeability ratio can be also examined as a pure ther-modynamic variable;
6. the hydrodynamic sub-system for a 1D radial flow has analytical solution (2.15)or (2.14), which is similar to the Dupuit formula with replacing the pressureby pseudopressure integrals.
3. Factors Affecting Gas-Condensate Relative Permeability
To calculate gas-condensate well performance using basic relation (2.15), it isnecessary to compute the pseudopressure integrals. In turn, they include thermo-dynamic variables and relative permeabilities. The calculation of thermodynamicvariables as functions of pressure is based on system (2.11) and does not presentany problems. Indeed, system (2.11) describes a classical PVT experiment per-formed for a mixture at a constant total composition.
The more complex problem is to calculate relative permeabilities for gas-condensate systems, that remains still a rather open problem.
According to the recent results of various researchers, the gas-condensate rela-tive permeabilities depend on various parameters, not only on the saturation.Among the basic parameters influencing the relative permeability behavior it isnecessary to note:
— the hysteresis phenomena in the vicinity of wells;— the capillary number;— the high-rate flow of gas and inertia effects;— the medium heterogeneity and scale effects.
In the present paper we suggest a generalized model, which takes into accountall of these effects.

GAS CONDENSATE RELATIVE PERMEABILITY FOR WELL CALCULATIONS 289
Figure 1. Saturation hysteresis prior-to and following the annual 12-hour shutins in a gascondensate well – at a radius of 2.2 m from the wellbore. Shows complete and partial cyclesof drainage and imbibition.
Figure 2. Same as Figure 1 but at a radius 2.2 m from the wellbore.
3.1. SATURATION HYSTERESIS IN THE VICINITY OF A WELL
We have found that the changing saturation history in the near-well region of agas-condensate well is complex, as illustrated in Figures 1–4. The results weregenerated with a fine-grid radial EOS-based compositional model.
Repeated cycles of imbibition and drainage follow rate variations and shutinperiods. Figures 1 and 2 show the saturation history of a well at radii of 2.2 and3.5 m, where annual 12-hour shutins are imposed over a five-year period duringdepletion. Cycles of imbibition and drainage are repeated in association with each

290 CURTIS H. WHITSON ET AL.
Figure 3. Saturation profiles following a 12-hour shutin for a gas condensate well – for a gascondensate well during the first five years of depletion. Shows the development of a solid oil‘bank’ in the near-well region, as well as complex near-critical and two-phase regions beyondthe oil bank.
Figure 4. Producing GOR variation prior and following the annual 12-hour shutins – for agas condensate well during the first five years of depletion. Post-shutin GOR behavior showsoverly-rich produced wellstream due the ‘emptying’ of the oil bank that develops near the wellduring the shutin period.

GAS CONDENSATE RELATIVE PERMEABILITY FOR WELL CALCULATIONS 291
shutin. Similar cycles of hysteresis (not shown) also follow changes in productionrate, and particularly abrupt reductions in rate.
Figure 3 illustrates the complexity of saturation distribution around a well atthe end of shutin periods. For the initial-test shutin, the oil saturation buildups upfrom a pre-shutin value of 20–40% to So values at the end of the shutin of (a) 100%at r < 2 ft, (b) a critical fluid at 2 ft (0 or 100%), (c) 0–20% in the small intervalr = 8–10 ft, and (d) 0% beyond 10 ft.
For subsequent shutins at 1, 2, and 5 years into depletion, the near-well re-gion oil saturation increases from pre-shutin flowing saturations of about 55%,to end-shutin saturations of 100% near the well (3–20 ft), then monotonically de-creases at increasing radii until the ‘average reservoir saturation’ (due to retrogradecondensation) is approached far into the reservoir.
Production following the shutin will cause a significant drainage of the built-upnear-well saturations as shown in Figures 1 and 2. This drainage behavior followingshutins will be experienced with varying degree throughout the entire ‘condensateblockage’ zone. This drainage process will continue indefinitely (at any given pointin the blockage zone) until a new BHFP incease is imposed by rate reduction orshutin.
The near-well saturation hysteresis varies from reservoir to reservoir, but similarcycles of large saturation change are common to all gas condensates during the lifeof a well. We consider this behavior to constitute severe hysteresis, but hysteresisthat can not readily be modeled. The hysteresis is neither strictly ‘imbibition’ orstrictly ‘drainage’ – but a complex series of drainage–imbibition cycles. The mostimportant issue is whether the effect of such hysteresis has a large or small impacton krg.
3.2. REASONS OF SATURATION HYSTERESIS
Considerable misunderstanding can be found in the literature regarding relativepermeabilities in gas condensate wells, and particularly with respect to whether theprocess is ‘imbibition’ or ‘drainage’. Let us remember that, according to definition,imbibition is a process of condensate saturation growth. In the theory of water–oilflow, the imbibition and drainage relative permeability curves are different andform a hysteretic loop.
It has been argued by Raghavan and Jones (1996) for gas-condensate flow thatimbibition is the dominating process regarding the development of liquid phaseduring depletion of a gas-condensate reservoir. They claim that only a small volumeof the reservoir near the well is affected by the drainage process, and the time overwhich this occurs is relatively short.
In reality, only in the far-removed region of the reservoir where condensate iscontinuously accumulating and oil saturation is continuously increasing, imbibi-tion dominates. As discussed earlier, however, the relative permeability behaviorin this ‘accumulation’ region has only a second-order or negligible effect on wellperformance.

292 CURTIS H. WHITSON ET AL.
We have conducted detailed well simulations using a compositional model andmultiple C7+ fractions, with flowing BHP as low as 250 psia, without ever havingobserved that oil saturation near the wellbore ‘vaporizes’ to a zero (or low) satur-ation where oil has zero mobility. In fact, steady-state flow theory proves that aslong as the BHFP is greater than the lower dewpoint of the produced wellstream,then the threshold oil saturation Sro > 0 and krg/kro < ∞, according to (2.12a),which guarantees two-phase gas/oil flow with both gas and oil saturations greaterthan zero.
The drainage actually experienced in the near-well region of a gas condensatewell is mainly due to the rate changes and shutin periods that cause complete andpartial cycles of imbibition and drainage. Even for the over-simplified case of awell producing at a constant BHFP at all times, the oil saturation at the wellborewill increase initially (‘imbibition’), reach a maximum, and then decrease (‘drain-age’) during the remaining life of the well; the decrease in saturation is not due torevaporization, but because the flowing mixture (produced wellstream) is gettingleaner.
As for the duration of drainage period in the vicinity of wells, it is not at allshort. First of all, for the simple case of a well producing against a constant BHFP,the initial oil saturation increase – ‘imbibition’ – is always followed by an extendedperiod of oil saturation decrease – ‘drainage’. The drainage process is caused bythe flowing mixture in the near-well region becoming leaner. The leaner mixturesmust have increasing krg/kro values. For higher krg/kro values (at a given pressure),krg must be increasing. This implies a decreasing oil saturation, which is a drainageprocess. For this simplified case, it is the drainage process that describes the entire‘blockage’ region throughout most of the life of the reservoir.
In reality, the rate changes and shutin periods associated with normal (erratic)production behavior of actual gas condensate wells will lead to a much morecomplex saturation history than described above.
In conclusion, in the near-well region where condensate blockage occurs, prac-tically unlimited cycles of drainage and imbibition hysteresis occur during shutins,rate changes, and by the continuous depletion process. What one ‘calls’ the processof saturation change in a gas-condensate well is of no importance. The only issueis whether the cycles of saturation change have a quantitative impact on the relativepermeability behavior [of krg = f (krg/kro)], and if so, how they should be modeled.
4. Relative Permeability Model for Gas-Condensate Systems
The key behavior of relative permeabilities for describing near-well flow of gascondensates and condensate ‘blockage’ as presented herein, include:
— relative permeability in the near-well region is the function of ratio krg/kro,instead of S;
— we consider relative permeability as a function of capillary number and sug-gest the form of this function;

GAS CONDENSATE RELATIVE PERMEABILITY FOR WELL CALCULATIONS 293
— for a high-velocity flow we suggest the so-called ‘effective relative permeab-ility’ dependent now on flow velocity;
— for a heterogeneous reservoir at the macroscale we suggest a procedure ofscaling for relative gas-condensate permeabilities.
4.1. RELATIVE PERMEABILITY DEPENDENT ON CAPILLARY NUMBER
If the capillary forces tend to zero, the mixture behaves as miscible. In this casethe relative permeabilities will be converted to diagonals. In contrast, at very highcapillary forces, the relative permeability tends to an invariable function typicalfor absolutely immiscible systems. All the intermediate curves will be obviouslysituated between these two limit functions.
We thus propose a generalized relative permeability model, where the ‘immis-cible’ or ‘rock’ curves are linked with ‘miscible’ or ‘straight-line’ curves through atransition function dependent on capillary number, fI(Nc). The transition functionis a smooth and continuous relation without a ‘threshold’ Nc value.
For low capillary numbers, the immisicible curves apply and fI = 1. Forsufficiently high capillary numbers the miscible curves apply and fI = 0. A con-stant krg/kro value (used instead of saturation) defines the immiscible and misciblerelative permeability values used in the generalized correlation.
The immiscible relative permeability models contain a number of (2–10)adjustable parameters, while the transition function fI has only two adjustableparameters. Non-linear regression locates the minimum (weighted sum-of-squares)deviation between measured and model krg data for a given set of measurementswith varying krg/kro and Nc values.
Capillary number is defined as the ratio of viscous forces to capillary retainingforces
Nc = Pv
Pc(4.1)
or, which is the same:
Nc = Ncg ≡ Vpg · µg
σgo, Vpg = Vg
φ · (1 − Swi)(4.2)
where Vpg is a ‘pore’ gas velocity and Vg is Darcy’s gas velocity.Relative permeability of gas including capillary number dependence is given by
Whitson and Fevang (1997)
krg = fI · krgI + (1 − fI) · krgM (4.3)
where krgI is the immiscible (Nc = 0, fI = 1) gas relative permeability, and krgM isthe miscible (Nc = ∞, fI = 0) straight line gas relative permeability, calculated as
krgM = korg · 1
1 + (krg/kro)−1(4.4)

294 CURTIS H. WHITSON ET AL.
Our application of Equation (4.3) is different from others (Coats, 1980; Blom,1999; Blom and Hagoort, 2003b) because we evaluate krgI and krgM at the samevalue of krg/kro – not at the same saturation. The limit to our approach is that itonly can be used for the steady-state region where both gas and oil are flowing.The advantage is that only one set of parameters are required for correlating fI
data, not four potentially separate sets for krg, kro, Sgc, and Soc.The transition function fI can be defined in the following way:
fI = 1
(α · Nc)n + 1(4.5)
where α is a constant dependent only on rock properties. Based on regressionof Heriot-Watt (Henderson et al., 1995a, b) and Delft (Blom, 1999; Blom andHagoort, 2003a) krg = f (krg/kro) data, we found a good estimate for α given by
α = 2 · 104
√kφ
, n = 0.7 (4.6)
where K is absolute permeability and φ is porosity.If saturation is used to link krgI to krgM and kroI to kroM, then separate parameters
(ng, αg) and (no, αo) are apparently needed for each phase. Experimental evidenceby Blom (1999) suggest that ng < no, ng ≈ 1 and no ≈ 1–3 using saturation tolink krI and krM; also, αg/αo = 1–100.
Furthermore, with saturation as the ‘linking’ variable, critical saturations Soc
and Sgc must also be correlated from immiscible to miscible values using additionalsets of parameters (nSgc , αSgc) and (nSoc , αSoc).
Clearly, the price for a more general treatment of capillary number dependenceis additional complexity. Our experience is that the complexity is neither necessaryor justified to match steady state gas–oil relative permeabilities needed in well cal-culations modeled with the pseudopressure approach. For cell-to-cell calculationsin a model (e.g. a fine-grid radial model), the relative permeability model must beexpressed in terms of saturation and our approach is no longer useful.
4.2. IMMISCIBLE RELATIVE PERMEABILITY MODELS
We have found three relative permeability correlations useful for describing low-capillary number ‘immiscible’ behavior of steady-state data measured for gas con-densate cores.
The Corey model (Brooks and Corey, 1966; Standing, 1975):
krg = korg
[(1 − Soe)(1 − Swi) + Sm − 1
Sm − Swi
]2 [1 − S
(λ+2
λ
)oe
],
kro = koro
[Soe · (1 − Swi) − Soc
1 − Swi − Soc
]· S
(λ+2
λ
)oe (4.7)
where Soe ≡ So1−Swi
.

GAS CONDENSATE RELATIVE PERMEABILITY FOR WELL CALCULATIONS 295
The Chierici model (Chierici, 1984):
krg = korg · exp(−B · R−M
g ), kro = koro · exp(−A · RL
o ) (4.8)
where
Rg = Sg − Sgc
1 − Swi − Sg(Sg > Sgc), Ro = Sg
1 − Swi − Soc − Sg
The Arco model (Jerauld, 1997):
krg = korg(1 + cg2) · S
cg1ge · (
1 + cg2 · Scg3ge
)−1,
kro = koro(1 + co2) · Sco1
oe · (1 + co2 · Sco3
oe
)−1
cg3 = cg1 ·(
1 + 1
cg2
), Sge ≡ Sg − Sgc
1 − Swi − Sgc,
co3 = co1 ·(
1 + 1
co2
), Soe ≡ 1 − Sg − Swi − Soc
1 − Swi − Soc(4.9)
Using relation (12a) between saturation and relative permeability ratio, it is easyreconstruct all these functions in the form of krg = f (krg/kro), kro = f (krg/kro).
We generally use one of these three correlations to fit data in the form krg =f (krg/kro) – that is, without the need for measured saturations. It is important torealize that the three correlations can usually describe similar krg = f (krg/kro)
behavior but with somewhat different kr(S) behavior. This is illustrated in Figures5–7.
Figure 5 shows the more-or-less same krg = f (krg/kro) behavior for the entirerange of krg/kro of interest to gas condensate wells (0.1–100). Figure 6 shows thekr(S) curves on a semi-log plot, enclosing with a box the area of interest wherekrg/kro ranges from 0.1 to 100.
Figure 7 shows the kr(S) curves on a cartesian plot, enclosing with a box thearea of interest (to some rich gas condensates) where krg(S) may have a second-order effect on pressure loss calculations in the ‘accumulation’ region away fromthe well (Region 2 in the Fevang–Whitson paper (Fevang and Whitson, 1996)). Ifsaturation measurements are made, they should be made in this region. These So
data, if available, can be used together with the krg = f (krg/kro) data in fitting therelative permeability correlation.
4.3. RELATIVE PERMEABILITY SCALING IN HETEROGENEOUS STRATA
The different rock types in a full-field simulation model must be assigned consis-tent relative permeability data. The best modeling approach is to develop a relativepermeability correlation that is general for all rock types, or to develop separatecorrelations for each rock type that exhibits considerably different relative per-meability behavior [krg = f (krg/kro) behavior]. However, this approach requires a

296 CURTIS H. WHITSON ET AL.
Figure 5. Fundamental krg = f (krg/kro) relationship using three different immiscible correl-ations, showing essentially identical behavior in the entire range of krg/kro of interest (fromvery rich to very lean gas condensate systems).
Figure 6. Saturation dependent relative permeability curves for three correlations, showing inparticular the region that affect flow behavior in the near-well region (boxed area). The threecorrelations have the ‘same’ krg = f (krg/kro) relationship in the boxed region.

GAS CONDENSATE RELATIVE PERMEABILITY FOR WELL CALCULATIONS 297
Figure 7. Saturation dependent relative permeability relations for three correlations, showingin particular the region that affect flow behavior in the ‘distant’ accumulation region away fromthe well (boxed area). The three correlations have the ‘same’ krg = f (krg/kro) relationship.
large number of measured data (for each rock type) – data which are usually notavailable.
When only limited relative permeability data are available, end-point scalingcan be used to generate relative permeability for different rock types. Our proce-dure for endpoint scaling of relative permeability uses the same scaling for bothgas (krg) and oil relative permeability (to gas, krog) curves. For a reference set ofrelative permeability curves,
krefrg = f (Sref
g , Srefwi , Sref
gc , Srefoc ), kref
ro = f (Srefg , Sref
wi , Srefgc , Sref
oc )
Sg = Sgc
Srefg
Srefgc
, Sg � Sgc
Sg = Sgc + (1 − Swi − Soc − Sgc)
(1 − Srefwi − Sref
oc − Srefgc )
(Srefg − Sref
gc ),
Sgc < Sg � 1 − Swi − Soc
Sg = 1 + Swi + Soc + Soc
Srefoc
(Srefg − 1 − Sref
wi − Srefoc ),
1 − Swi − Soc < Sg � 1 − Swi
Sg = 1 − Swi + Swi
Srefwi
(Srefg − 1 + Sref
wi ), 1 − Swi < Sg � 1

298 CURTIS H. WHITSON ET AL.
The relative permeabilities are scaled with the ratio:
krg(Sg) = krefrg (Sref
g ) · krg(Swi)/krg(Srefwi ),
kro(Sg) = krefro (Sref
g ) · kro(Swi)/kro(Srefwi )
This endpoint scaling procedure ensures a reasonable krg(krg/kro) relationshipfor a wide range of endpoints. We have even found that the procedure is a good ap-proximation for reservoirs when sufficient data is available to develop independentcorrelations for each rock type.
4.4. RELATIVE PERMEABILITY MODEL FOR HIGH-VELOCITY
INERTIAL FLOW
To quantify the effect of inertial HVF pressure loss, an ‘effective’ gas relativepermeability krgHVF is defined. The HVF is usually described by the so-calledForchheimer equation:
−∂P
∂x= µ
kV + βρV 2
Let us rewrite this equation in the form of Darcy’s law:
−∂P
∂x= µ
kHVFV
where kHVF is the effective absolute permeability, which depend now on flow velo-city V.
In the same way the effective relative gas permeability, krgHVF, may be definedas that function make equivalent the formal two-phase Darcy equation to the two-phase Forchheimer equation. Starting with a single-phase relation for the inertialHVF coefficient β,
β = akbφc
it should be noted that various references give a wide range in constants: a ∼ 109–1010, b ∼ 0.5–1.5, and c ∼ 0–5.5. A number of authors have also treated thecorrection of β for relative permeability effect (see Blom and Hagoort (2003b) fora review), where we use the relation
βeff = β · k−b′rg (4.10)
with b′ = b. The choice of correlation for β can have a profound affect on themagnitude of inertial HVF and the effect of relative permeability on βeff. In theexamples presented below, we use a = 9 109, b = b′ = 1, and c = 0.75.
Our suggestion is to use an effective gas relative permeability corrected for highvelocity effect krgHVF, defined as
krgHVF
krg=
[1 + k · krg
µg· βeff · ρg · Vg
]−1
(4.11)

GAS CONDENSATE RELATIVE PERMEABILITY FOR WELL CALCULATIONS 299
Effective oil relative permeability including the effect of HVF is calculated bydividing krgHVF by krg/kro.
4.5. VELOCITY DEPENDENCE IN PSEUDOPRESSURE
Relationships (4.2) for capillary number and (4.11) for the effective HVF relativepermeability include the flow velocity V. It is necessary to find a relation that givesvelocity as a function of pressure so that capillary number and inertial HVF effectscan be included in the pseudopressure function (2.15) through relative permeabil-ity. Our approach is outlined here for radial flow, with similar equations used forlinear flow in vertically-fractured wells.
A trivial relation exists between the flow rate and the velocity: V = qB/2πhr.Inverting this equation with respect to the radius, we obtain:
r = qB
2πhV(4.12)
Let us insert now this relation into (2.15), eliminating thus variable r:
q = 2πh
µBln
(r
rw
) (Pp − Ppwf)
where 1(P ) is the pseudopressure integral.Then we obtain for the velocity as the function of pressure:
V (p) = qB
2πhrwexp
[−2πkH
qµB(Pp − Ppwf)
](4.13)
Knowing velocity V as a function of pressure, capillary number is also givenin terms of pressure, and the pseudopressure function can be evaluated includingcapillary number dependence of relative permeabilities. Knowing krg, the correc-tion to include inertial HVF can be calculated using Equation (4.11), where krgHVF
should then be used in the final pseudopressure calculation.The equations above can readily be extended to linear flow for vertically-
fractured wells.An example is presented using the pseudopressure method for calculating reser-
voir well performance of a rich gas condensate with two well configurations (radialand vertically-fractured). Figures 8–13 present results of the calculations.
Figures 8 and 9 show the rate–time performance for three assumptions: (a) noNc dependence on krg = f (krg/kro), (b) Nc dependence included using our pro-posed correlation, Equation (4.3), and (c) both Nc dependence and inertial HVFeffects included. For this example, the capillary number dependence has a signi-ficant impact on rate–time predictions, while the inertial HVF effect has only asecond-order effect.

300 CURTIS H. WHITSON ET AL.
Figure 8. Rate–time behavior for a a rich gas condensate radial well showing the ef-fect of including capillary number improvement of krg, and inertial high velocity flow(‘turbulence’).
Figure 9. Rate–time behavior for a a rich gas condensate vertically-fractured well showingthe effect of including capillary number improvement of krg, and inertial high velocity flow(‘turbulence’).

GAS CONDENSATE RELATIVE PERMEABILITY FOR WELL CALCULATIONS 301
Figure 10. Example gas ‘pore’ velocities variation with pressure for radial and verti-cally-fractured (linear) flow geometries in a rich gas condensate well using proposedsteady-state pseudopressure model.
Figure 11. Example capillary number variation with pressure for radial flow geometry in arich gas condensate well using proposed steady-state pseudopressure model; also shows effectof inertial HVF (‘turbulence’) on capillary number.
302 CURTIS H. WHITSON ET AL.
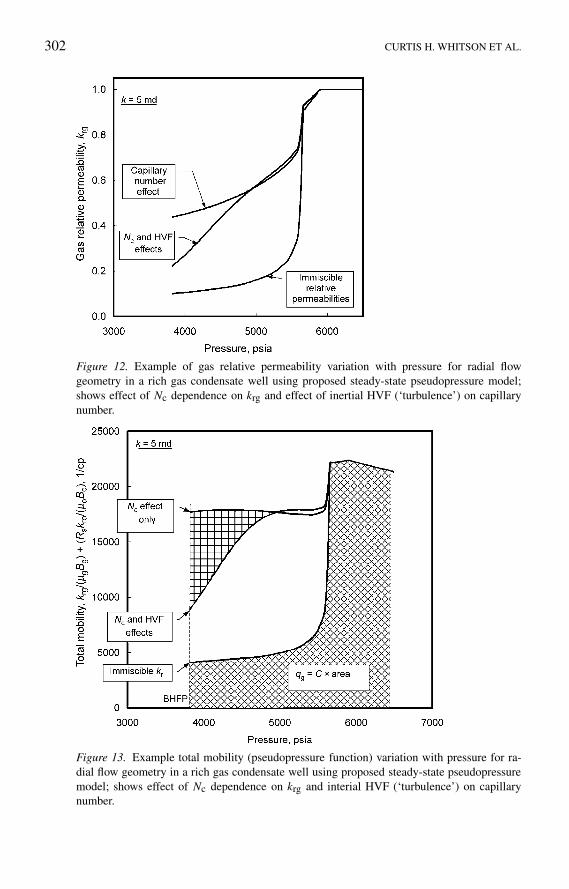
Figure 12. Example of gas relative permeability variation with pressure for radial flowgeometry in a rich gas condensate well using proposed steady-state pseudopressure model;shows effect of Nc dependence on krg and effect of inertial HVF (‘turbulence’) on capillarynumber.
Figure 13. Example total mobility (pseudopressure function) variation with pressure for ra-dial flow geometry in a rich gas condensate well using proposed steady-state pseudopressuremodel; shows effect of Nc dependence on krg and interial HVF (‘turbulence’) on capillarynumber.

GAS CONDENSATE RELATIVE PERMEABILITY FOR WELL CALCULATIONS 303
Looking at the radial well calculations in more detail, Figures 10–13 showthe pressure dependence of gas pore velocity, capillary number, gas relativepermeability, and total mobility. These figures show quantitatively howthe capillary number and inertial HVF affect relative permeability and total mo-bility. It seems clear that the capillary number dependence can be an importantfactor in predicting reservoir well preformance (i.e. condensate blockage) and,consequently, should be measured in the laboratory and correlated for modelcalculations.
Though the effect of inertial HVF was not particularly important in this examplewe have found a number of field case histories where inertial HVF in a verticalfracture (or in perforations; Stewart, 1997) has had a major impact on the welldeliverability. Considerable uncertainty in prediction of β and its dependence onrelative permeability exists with today’s correlations – more than one order ofmagnitude. Consequently we recommend that additional measurements be madeto improve our quantitative prediction of inertial HVF in gas condensate systems.
5. Experimental Measurement of Gas-Condensate Relative Permeabilities
Our recommendation for measuring relative permeability data used in well model-ing of gas condensate reservoirs is outlined below.
5.1. DEFINING THE RANGE OF RELEVANT krg/kro DATA
Using Equation (2.12a), it is easy to evaluate the general range of krg/kro variationin a gas-condensate reservoir. When applied to the near-well region, saturation s =vro in (2.12a) is then the ratio of oil volume to total gas + oil volume of the mixtureflowing into a well (produced wellstream), evaluated at pressures existing in thenear-wellbore region. For example, a ‘rich’ gas condensate at relatively moderateflowing near-wellbore pressures (100–200 bar) s = vro may be about 0.2. Theµg/µo ratio is typically about 0.025/0.1 or about 0.25. This leads to a krg/kro =(1/0.2–1)(0.25) = 1 [the crossing point of the relative permeability curves]. Asthe reservoir depletes, the flowing wellstream becomes leaner and s = vro willdecrease to a lower value – for example, S = 0.025. Interestingly, near-wellboreviscosities are more-or-less constant during depletion and the resulting late-lifekrg/kro = (1/0.025–1)(0.25) = 10.
This simple example illustrates the observation that the range of krg/kro ex-perienced by a gas condensate well during its entire life of depletion will varyby only about one order of magnitude. The krg variation is even smaller – per-haps from 0.05 to 0.2 in this ‘rich’ condensate example. Consequently, our ap-proach to measuring relative permeabilities is to (1) determine the expected rangeof krg/kro spanned for a given reservoir from PVT properties of the gas condensatefluid system, then (2) concentrate on obtaining accurate krg data in this range of
304 CURTIS H. WHITSON ET AL.
krg/kro. The measurements are preferably made at realistic flowing pressures andvelocities.
We recommend that, as a minimum, five immiscible krg data be measured for aspecific range of krg/kro values. These krg/kro values are those which dominate flowin the condensate blockage region near the well, and they are defined only by PVTproperties of the fluid system (Equation (2.12a)).
First, a constant-volume depletion (CVD) experiment is simulated. For eachCVD gas removed, a constant-composition experiment (CCE) is simulated, report-ing s = vro = Vo/Vt and the viscosity ratio µg/µo for pressures from the gasdewpoint (CVD pressure) down to a ‘minimum’ pressure. These PVT quantitiesare used in Equation (2.12a) to calculate krg/kro(p).
The CVD pressures should cover the range from initial dewpoint to the expectedabandonment reservoir pressure. The minimum CCE pressure should be selectedto represent the lowest BHFP expected (when the well is on decline).
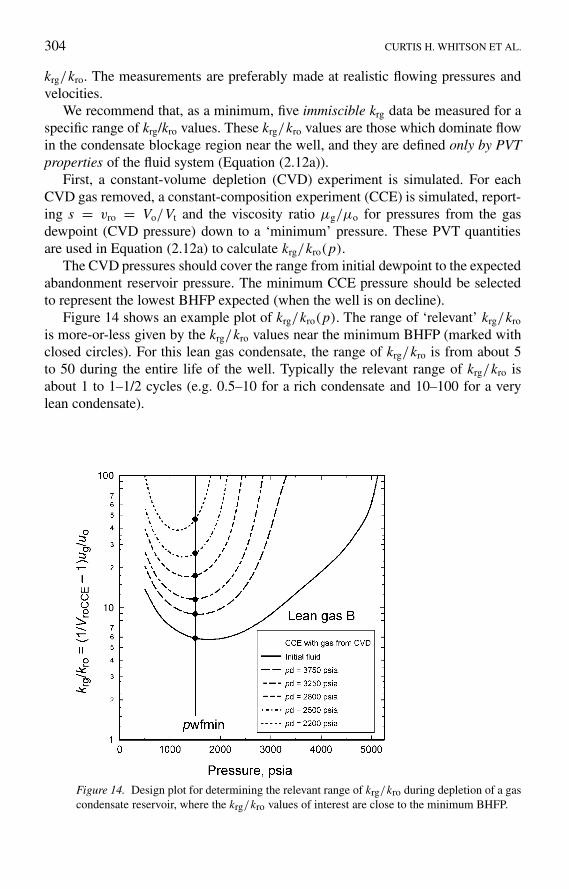
Figure 14 shows an example plot of krg/kro(p). The range of ‘relevant’ krg/kro
is more-or-less given by the krg/kro values near the minimum BHFP (marked withclosed circles). For this lean gas condensate, the range of krg/kro is from about 5to 50 during the entire life of the well. Typically the relevant range of krg/kro isabout 1 to 1–1/2 cycles (e.g. 0.5–10 for a rich condensate and 10–100 for a verylean condensate).
Figure 14. Design plot for determining the relevant range of krg/kro during depletion of a gascondensate reservoir, where the krg/kro values of interest are close to the minimum BHFP.

GAS CONDENSATE RELATIVE PERMEABILITY FOR WELL CALCULATIONS 305
5.2. IMMISCIBLE STEADY-STATE MEASUREMENTS
Each immiscible krg data should be measured by flowing a pre-selected reservoirgas (with known krg/kro) under steady-state conditions at a core pressure close tothe minimum BHFP. When steady-state is achieved the pressure drop is measured,and krg is calculated from the gas flow rate, pressure drop, and gas viscosity; kro iscalculated from kro = krg/(krg/kro).
Steady-state flow can be achieved either by flowing the reservoir (CVD) gasthrough a back-pressure regulator upstream to the core, thereby lowering the pres-sure to a value close to the minimum BHFP; else it can be measured by equi-librating the reservoir gas at core pressure and injecting the equilibrium gas andoil at rates that ensure the correct krg/kro value given by Equation (2.12a) [notingqo/(qg + qo) = Vro(pcore)].
The five immiscible data should be selected using five flowing mixtures (e.g.CVD gases) that provide more-or-less evenly-spaced krg/kro values in the range ofinterest.
5.3. HIGH CAPILLARY NUMBER MEASUREMENTS
Based on the maximum expected (plateau) rates for a given field using the initialreservoir fluid, the flow velocities can be estimated at the minimum BHFP. At theseconditions, a capillary number can be calculated. This capillary number can beused in our correlation for fI, Equations (4.5) giving the expected improvement inkrg from Equation (4.3).
As an example, consider a field with qgmax = 2·106 Sm3/d, h = 100 m, r = 1 m,φ = 0.2, Sw = 0.25, Bgd(100 bar) = 0.0125, µg = 0.02 mPa s, Vpg = 0.03 m/s[Vpg = qgmaxBgd(pwf)/(2πrhφ(1 − Sw))]. With a gas-oil IFT of σgo = 3 mN/m at100 bar, Nc = Vpgµg/σgo = 2 · 10−4. For a permeability of k = 50 md, Eq. (22).Equation (4.5) α = 2 · 104/[(50)(0.2)]0.5 = 7320. The immiscibility factor fIat these conditions is fI = 1/(1 + [(7320)(2 · 10−4)]0.7) = 0.434, which is asignificant improvement in krg = 0.434(0.1)+ (1−0.434)(0.5) = 0.33 (comparedwith krgI = 0.1).
Steady-state measurements (at minimum BHFP) can be made at high flow velo-cities in the laboratory to achieve higher capillary numbers. However, this has twodisadvantages: (1) maximum laboratory pump rates do not usually allow reachingNc values close to field values, and (2) even if field velocities could be reached,the effect of ‘inertial’ HVF pressure drop may become significant and confuse theinterpretation of krg measurements.
Alternatively, we suggest measuring steady-state flow at higher corepressures with lower gas–oil IFTs. Higher flow velocities can still be used to reachhigh (near-field) capillary numbers, but it should first be established (e.g. withsingle-phase gas flow tests) that inertial HVF effects do not occur at thesevelocities.

306 CURTIS H. WHITSON ET AL.
Value krg should be measured at several velocities for each flowing mixture,and measurements can be repeated at a number of core flowing pressures(i.e. IFT values). To accurately correlate the capillary number, a few IFT mea-surements may be necessary to tune the IFT correlation (parachors); this is par-ticularly true if σog < 0.1 mN/m, where the parachor correlation can be ratherinaccurate.
5.4. SELECTING A SYNTETIC GAS MIXTURE
We have found that the same krg = f (krg/kro) relation exists for actual reservoirgas condensate and synthetic gas condensate selected to mimic the key PVT be-havior of the actual reservoir fluid system. The selection of a synthetic gas canbe chosen using pure hydrocarbon compounds (e.g. C1-C8-C16), where the molarquantities of the synthetic mixture are determined (automatically by regression) tomatch the approximate dewpoint, Vro, and Z-factor behavior of the reservoir gas.It is also helpful if the gas–oil viscosity ratio is reasonably close to the reservoirfluid system (at pressures below the dewpoint). Figure 15 shows two examplesof synthetic gas Vro behavior compared with reservoir fluid CCE liquid dropoutcurves.
There is some evidence (e.g. the data of Ham and Eilerts (1967)) that the steady-state krg = f (krg/kro) behavior is independent of the fluid system (see Figure 16).
Figure 15. Example comparisons of oil relative volume behavior between two reservoir fluidsand their synthetic gas ‘best-fit’ mixtures.

GAS CONDENSATE RELATIVE PERMEABILITY FOR WELL CALCULATIONS 307
Figure 16. Immiscible (low-Nc) relative permeability measurements for two Berea and oneNorth Sea sandstone compared with results for a Berea sample reported by Ham and Eilerts(1967).
Figure 17. Fit of measured krg data with the proposed relative permeability model for a widerange of capillary numbers and a more-or-less constant krg/kro = 2.

308 CURTIS H. WHITSON ET AL.
Additional research is necessary to verify this supposition, but clearly it wouldmake the measurement of immiscible krgI data much simpler. Still, to measure thecapillary number dependence of the krg = f (krg/kro) relation, synthetic systemswith low IFTs must be used.
5.5. FITTING RELATIVE PERMEABILITY DATA
Our procedure for fitting measured relative permeability data correlates krg =f (krg/kro, Nc) using an immiscible equation for krgI (Arco, Corey, or Chirieci),and the proposed correlation for capillary number dependence. Exponents andend-point saturations can be modified in the immiscible correlations, while the Nc
correlation has only two adjustable parameters, α and n.Figure 17 show an example fit of measured data for a Berea core and a medium-
rich fluid system flowing with a krg/kro = 2–3 for a wide range of capillarynumbers (velocities and core pressures). The closed circles are measurements usingthe reservoir gas condensate system, and the open circles are measurements usingthe ‘best-fit’ synthetic gas mixture. Gas–oil IFTs for the synthetic gas were in therange 0.8–1.6 mN/m, while for the reservoir gas the estimated IFT was 6.3 mN/m.The proposed correlation is shown as the solid line.
Figures 18 and 19 show the results of our proposed relative permeability modelused to fit data measured by Marathon (Chen et al., 1999) for a near-critical NorthSea gas condensate. The open circles are low-pressure laboratory unsteady-state
Figure 18. Fit of all available krg data using the proposed relative permeability model.

GAS CONDENSATE RELATIVE PERMEABILITY FOR WELL CALCULATIONS 309
Figure 19. Quality of fit to measured relative permeability data from a North Sea richgas condensate field using proposed model including capillary number dependence ofkrg = f (krg/kro).
measurements from seven different cores. The solid symbols are measured datausing a stack of reservoir cores, flowing initial resevoir gas through the core-stackusing a steady-state procedure at varying core pressures. The reservoir-conditiondata had varying gas–oil IFTs (0.026–0.54 mN/m) and capillary numbers (2.2 ×10⁻⁴ − 7.8 × 10⁻⁶). The overall fit is shown in Figure 19, indicating that all dataare correlated within about 15%.
If saturation data are available, they also can be used in the model parameter fit.However, the only situation we have found where saturation dependence of krg isimportant is when the oil saturation in Region 2 (accumulation region outside thecondensate blockage zone) reaches values of 15–30%. This is only experienced bymedium to rich gas condensates, and even then the effect is second order to theprimary krg reduction in the near-well region.
Conclusions
1. The oil saturation history experienced in the near-well region of a gas con-densate well consists of an unlimited number of cycles of complete or partialdrainage and imbibition.
2. Based on our steady-state measurements (Saevareid et al., 1999) of several gascondensate systems we have found that the effect of saturation hysteresis issmall on the fundamental relative permeability relation krg = f (krg/kro).
3. A design procedure is proposed for defining the laboratory conditions andflowing mixtures that will ensure measurement of relative permeability beha-

310 CURTIS H. WHITSON ET AL.
vior at relevant flow conditions for the near-well region dictating condensateblockage.
4. The effect of capillary number on gas/oil relative permeability can result ina significant improvement in gas relative permeability and thereby reduce thenegative impact of condensate blockage.
5. An empirical but consistent model is proposed for scaling gas/oil relativepermeabilities for different rock types and regions with varying end-point sat-urations. The scaling is applied consistently to the gas and oil relative per-meabilities to ensure that the reference (measured) krg = f (krg/kro) relation ishonored.
6. An approach is given for incorporating (a) the improvement in krg at highcapillary numbers, and (b) the detrimental effect of inertial high velocity flow(‘turbulence’) as part of the two-phase condensate pseudopressure model. Thekey to this approach is estimating velocity as a function of pressure in thereservoir using an appropriate form of Dacy’s law for the well-flow geometry.
Acknowledgements
We thank the participants of the ‘Gas Condensate Well Performance’ project – BP,Chevron, INA, Mobil, Norsk Hydro, Norwegian Research Council (NFR), Norwe-gian Petroleum Directorate (NPD), Occidental International, and Saga Petroleum –for financial and technical support during the two years this work was conduc-ted (1996–1998). We also thank Kameshwar Singh for his assistance. Finally, weacknowledge the theoretical development in section 2 to Prof Mikhail Panfilov.
References
Al-Hussainy, R., Ramey, Jr., H. J. and Crawford, P. B.: 1966, The flow of real gases through porousmedia, JPT, 624; Trans. AIME, 237.
Blom, S. M. P.: 1999, Relative permeability to near-miscible fluids, PhD Thesis, Delft University.Blom, S. M. P. and Hagoort, J.: 2003a, Relative permeability at near-critical conditions, Paper SPE
38935.Blom, S. M. P. and Hagoort, J.: 2003b, The combined effect of near-critical relative permeability and
non-darcy flow on well impairment by condensate drop-out, Paper SPE 39976.Brooks, R. H. and Corey, A. T.: 1966, Properties of porous media affecting fluid flow, J. Irrigation
Drainage Division, Proc. of ASCE, 92(No. IR2), 61–88.Chen, H. L., Wilson, S. D. and Monger-McClure, T. G.: 1999, Determination of relative permeability
and recovery for North Sea gas-condensate reservoirs, SPERE, 393–402.Chierici, G. L.: 1984, Novel relation for drainage and imbibition relative permeabilities, SPEJ,
275–276.Coats, K. H.: 1980, An equation of state compositional model, SPEJ, 363–376.Evinger, H. H. and Muskat, M.: 1942, Calculation of theoretical productivity factor, Trans. AIME
146, 126–139.Fevang, Ø. and Whitson, C. H.: 1996, Modeling gas-condensate well deliverability, SPERE.Ham, J. D. and Eilerts, C. K.: 1967, Effect of saturation on mobility of low liquid–vapor ratio fluids,
SPEJ, 11–19.

GAS CONDENSATE RELATIVE PERMEABILITY FOR WELL CALCULATIONS 311
Henderson, G. D., Danesh, A., Teherani, D. H., Al-Shaidi, S. and Peden, J. M.: 1995a, Measurementand correlation of gas condensate relative permeability by the steady-state method, SPEJ 1(2),191–201.
Henderson, G. D., Danesh, A., Tehrani, D. and Peden, J. M.: 1995b, The effect of velocity andinterfacial tension on the relative permeability of gas condensate fluids in the wellbore region,8th European IOR Symposium, May 15–17, 1995, Vienna.
Janicek, J. D. and Katz, D. L.: 1955, Applications of unsteady state gas flow calculations, in reprintfrom the U. Michigan Research Conference, June 1955.
Jerauld, G. R.: 1997, General three-phase relative permeability model for Prudoe Bay, SPERE,255–263.
Jones, J. R. and Raghavan, R.: 1985, Interpretation of flowing well response in gas condensate wells,Paper SPE 14204 presented at the 1985 SPE Annual Technical Conference and Exhibition, LasVegas, September 22–25.
Jones, J. R., Vo, D. T. and Raghavan, R.: 1986, Interpretation of pressure buildup responses in gascondensate wells, Paper SPE 15535 presented at the 1986 SPE Annual Technical Conference andExhibition, New Orleans, October 5–8.
Muskat, M.: 1949, Physical Principles of Oil Production, McGraw-Hill, London.Raghavan, R. and Jones, J.: 1996, Depletion performance of gas-condensate reservoirs, JPT,
725–731.Saevareid, A., Whitson, C. H. and Fevang, Ø.: 1999, An engineering approach to measuring and
modeling gas condensate relative permeabilities, Paper presented at the 1999 SCA Conferenceheld in Goldon, CO, August 2–4, 1999.
Standing, M. B.: 1975, Notes on relative permeability relationships, Proc., University of Trondheim,NTH, Norway.
Stewart, G.: 1997, Personal communication, in: IBC Conference on Optimisation of Gas CondensateFields.
Whitson, C. H. and Fevang, Ø.: 1997, Generalized pseudopressure well treatment in reservoirsimulation, In: Proc. IBC Conference on Optimisation of Gas Condensate Fields.