Gas and WAG Injection in the Varg field A Successful IOR Story Gas and WAG Injection in... · Gas...
36
11/3/2016 Gas and WAG Injection in the Varg field – A Successful IOR Story
Transcript of Gas and WAG Injection in the Varg field A Successful IOR Story Gas and WAG Injection in... · Gas...

11/3/2016
Gas and WAG Injection in the Varg
field – A Successful IOR Story
11/3/2016
‘Increased Oil Recovery from a Mature Oil Field by
Gas Injection’
B. Matre* (Repsol Norge as), J. Rasmussen (Repsol Norge as), K.
Hettervik (Orec) & D. Hongbua (University of Stavanger)
-18th EAGE European Synposium on Improved Oil Recvery. Dresden
Germany 14-16th of April 2015
-20th SPE Improved Oil Recovery Conference Tulsa Ok, USA 11-13th of
April 2016
Recycled Material
Based on presentations from 2015 and 2016:

11/3/2016
Outline
1. The Varg Field – A brief introduction
2. A-10 A- A-07 C Well pair •Water injection
•Gas injection
•IOR and possible mechanisms
•Gas re-production
3. A-01 B •Huff’n Puff
4. Conclusion

11/3/2016
Varg Field
Located 200 km West of Stavanger
First Oil 1998
16 slot WHP- Dry Trees
• Not normally manned platform
FPSO WI/GI/2 Separators/2 Flow lines
FPSO owned and operated by TK
Jurassic Sandstone, ‘Darcy sand’, but
also moderate reservoir quality
Light Oil, 35oAPI, undersaturated
Pb=180-220 bar
Stoiip > 300 mmstb; produced oil 102.9
mmstb. RF varies by segment; +60%-
25%
Multiple OWC 2845-3018 m TVD SS,
Multiple compartments, Faulted.
Significant events 2014
• Gas Export
• New Seismic
Talisman (Now Repsol) Operator from
2005
• Partners Petoro as and Det norske AS
(Aker BP)
CoP 2nd of June 2016

11/3/2016
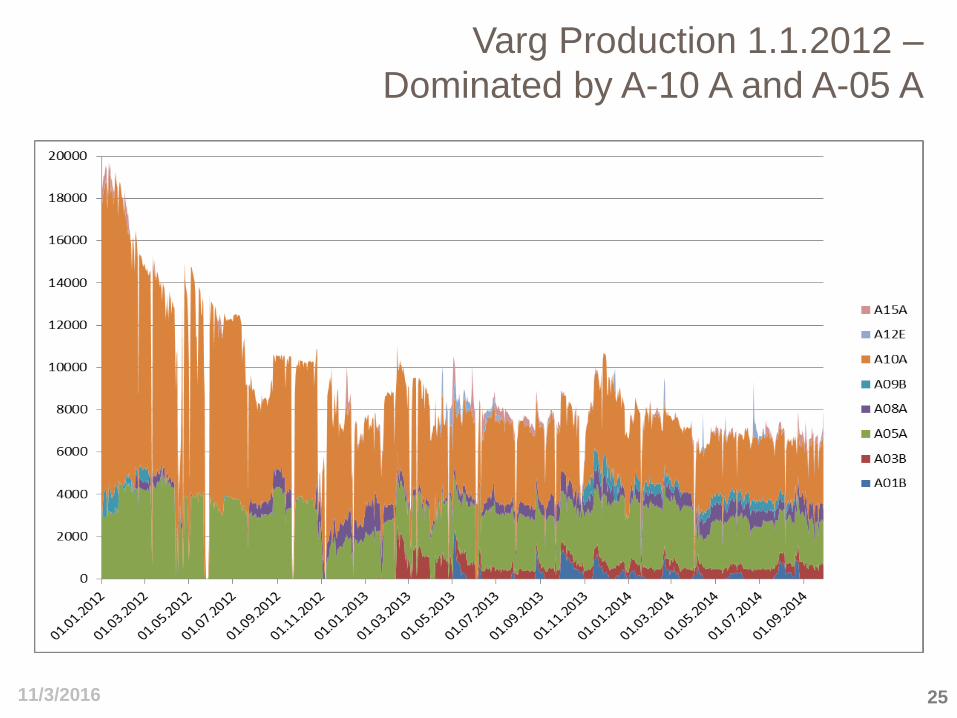
Varg Production
• Production levels re-established as new segments are put on production
• Importance of Wag in late life
A-10 A
A-10 A WAG
Mainly South Seg
NW and W Seg
11/3/2016
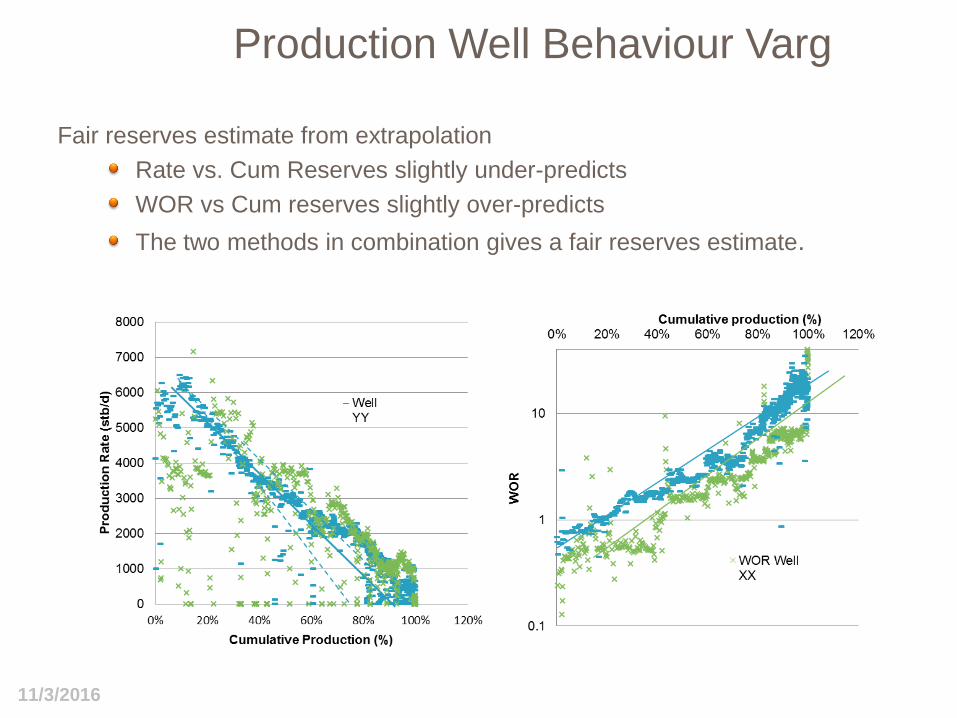
Production Well Behaviour Varg
Fair reserves estimate from extrapolation
Rate vs. Cum Reserves slightly under-predicts
WOR vs Cum reserves slightly over-predicts
The two methods in combination gives a fair reserves estimate.

11/3/2016
A-10 A- A-07 C Well pair
Excellent reservoir properties and connectivity
between wells
Segment is not influenced by other active wells Large faults to the West, Different OWC in the North,
Reservoir pinches out to the East
3D view

11/3/2016
Implementation of WAG
Gas available from secondary gas cap and solution gas; gas production from A-08 A
Gas compressor available
Total Investment; About 1 MNOK to connect A-7 C to gas line
For every gas/water cycle need one to two shifts to alter A07 C to water/gas injection

11/3/2016
A-10 A Production Plot

11/3/2016
IOR Oil from A-10A
• Exponential decline may overestimate IOR oil
• WOR-method- Difficult to find baseline as wct is only 25%
• At least 2 mmbl IOR oil
• (Plot also shows importance of the injector.)

11/3/2016
WAG Saturation Development
1.12.2012
1.06.2012
Sgas
Swat
Soil
Simulation model:
Grid sizes: x15-25m, y ~25m, z 1-2m
Active grid cells ~120 000
Permeability 50-1000 mD
STOOIP in WAG area ~ 30 mill. bbl
• Oil recovered by gas/water, gas recovered
by water.
• Improved sweep is main recovery
mechanism for IOR

11/3/2016
Simulation Results from A-10 A - A-07C
Simulation of A-07C w/wo gas injection
IOR oil 2.6 mmbbl

11/3/2016
Gas Use and Production
11.9 bcf of gas injected
13.7 bcf of gas produced since start of
gas injection
But some of that gas would have been
produced during normal water injection
operation
Considering only ‘excess gas’ (gas at
GOR above solution GOR); 9.6 bcf is re-
produced (81%)
Adding the solution gas from the IOR oil
(2.6), 11.1 bcf (94%) is reproduced. =>
Net lost gas volume to IOR is low.
11/3/2016
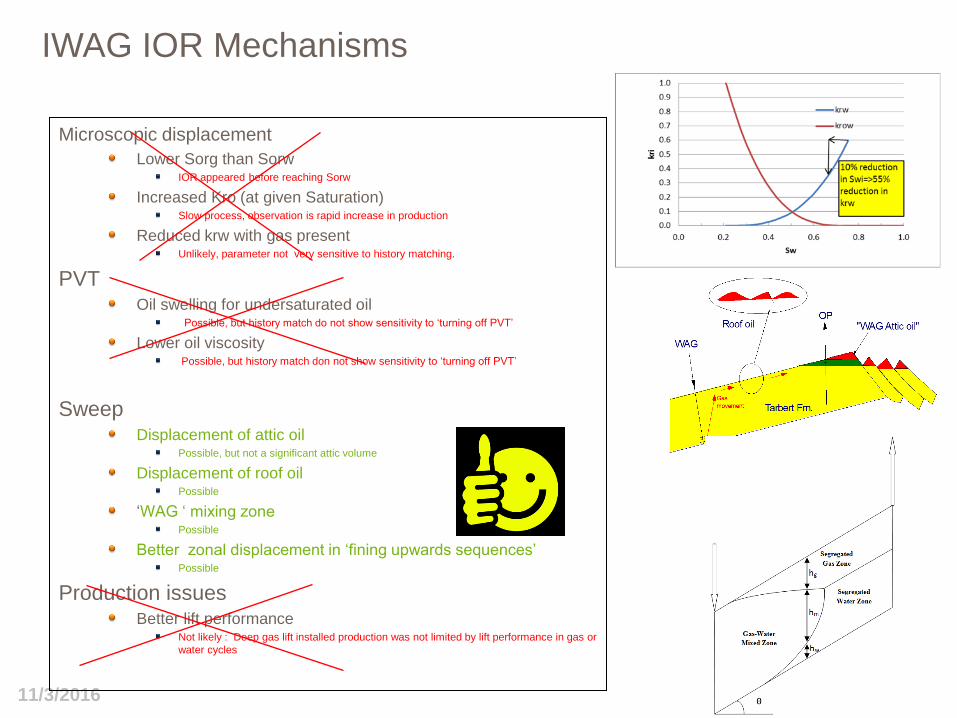
IWAG IOR Mechanisms
Microscopic displacement
Lower Sorg than Sorw IOR appeared before reaching Sorw
Increased Kro (at given Saturation) Slow process, observation is rapid increase in production
Reduced krw with gas present Unlikely, parameter not very sensitive to history matching.
PVT Oil swelling for undersaturated oil
Possible, but history match do not show sensitivity to ‘turning off PVT’
Lower oil viscosity Possible, but history match don not show sensitivity to ‘turning off PVT’
Sweep Displacement of attic oil
Possible, but not a significant attic volume
Displacement of roof oil Possible
‘WAG ‘ mixing zone Possible
Better zonal displacement in ‘fining upwards sequences’ Possible
Production issues Better lift performance
Not likely : Deep gas lift installed production was not limited by lift performance in gas or
water cycles

11/3/2016
Gas Injection in A-01B
• Have drilled ~24 m MD of oil filled sand (~12
m TVD)
• Found water in the lower poorer quality part
of the well
• High porosity, indicating high permeability
(~500 md)
• Failed to cement well, i.e.no zonal isolation ,
acts like open hole
• Well came in with up to ~5000 boe/d, but
rapidly declined down to ~1500 boe /d and
then died due to lack of pressure support
combined with a WCT around 60%.
• Failed to establish pressure communication
to A-13 or any other injectors.
• What to do ?
15/12-A-1 B
Dra
up
ne
11
4R
Z1
7R
Z2
25
RZ
39
7
Tops
TO
PS
_R
ES
.TO
PS
GR/CAL
BEST.GR_1
GAPI0 150
best.ucav
IN0 10
Resistivity
BEST.HRD_1
OHMM0.2 2000
BEST.HRM_1
OHMM0.2 2000
Density/Neutron
BEST.ROBB_1
G/C31.95 2.95
BEST.DRHB_1
G/C3-0.25 0.25
BEST.TNPH_1
G/C30.45 -0.15
Volumetrics
BEST.VSH_1
V/V0 1
BEST.PHIE_1
V/V1 0
BEST.VOL_UWAT_1
V/V1 0
3850
3860
3870
3880
3890
3900
3910
3920
3930
3940
3950
3960
3970
Depth
DEPTHMETRES
2779
2780
2781
2782
2783
2784
2785
2786
2787
2788
2789
2790
2791
2792
2793
2794
2795
2796
2797
2798
2799
2800
2801
2802
2803
2804
2805
2806
2807
2808
2809
2810
2811
2812
2813
2814
2815
2816
2817
2818
2819
2820
2821
2822
2823
2824
2825
2826
2827
2828
2829
2830
2831
2832
2833
2834
2835
2836
2837
Depth
TVDSSMETRES
Porosity
BEST.PHIT_1
V/V0.5 0
BEST.PHIE_1
V/V0.5 0
Permeability
BEST.KLOG_1
MD0.2 2000
FM_PRESS.MOBILITY_1
MD/CP0.2 2000
Saturation
BEST.FTEMP_1
DEGC100 150
perf.perf
B/E0 20
BEST.SWE_1
V/V1 0
BE
ST
.PA
Y_
1
BE
ST
.SA
ND
_1
11/3/2016
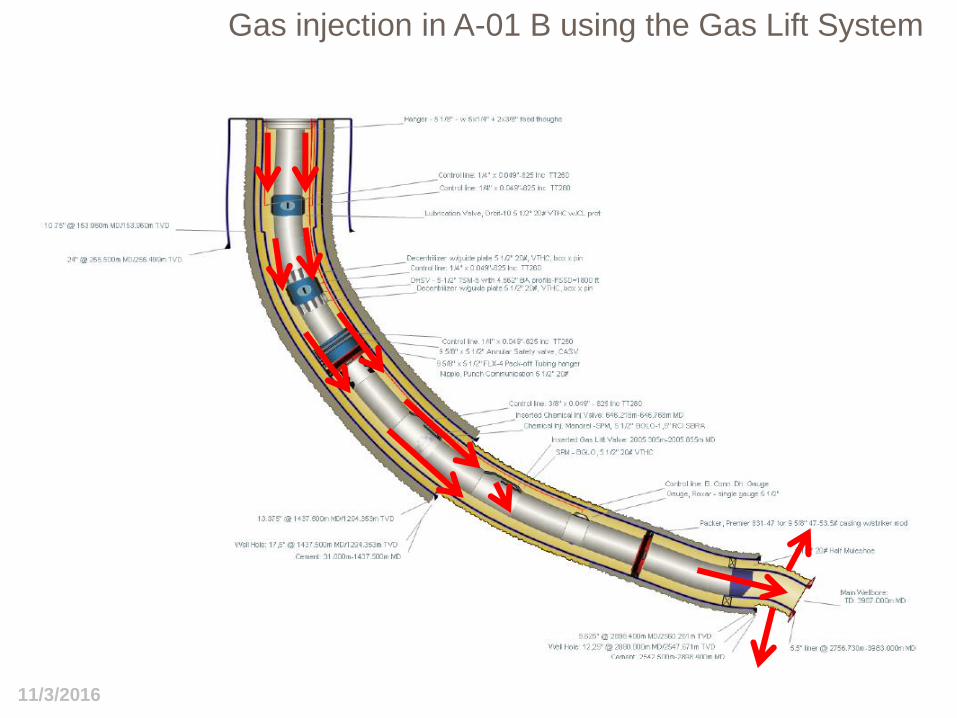
Gas injection in A-01 B using the Gas Lift System

11/3/2016
Motivation for Gas Injection ?
Reduce krw selectively. • Gas will be dissolved faster back into
oil
Displace attic oil • Seismic indicates sand up-dip of A-01B
Deeper Gas Lift • GLV at 1770 m TVD, Perf at 2800 m
TVD

11/3/2016
Production Results after ‘Huff’n Puff’
1. Inject Gas ‘slugs’ of 1 MSm3 of gas, typically 1-2 weeks
2. Rest – to allow for segregation and displacing attic oil
3. Produce , initially gas, then oil

11/3/2016
Conclusions
Gas injection has significantly increased late life production and reserves for the Varg Field. 3
different methods have been used to estimate incremental oil from WAG, all showing
significant benefit.
The Varg Gas injection is an example showing that IOR can be very attractive economically
with short payback time, low additional investments and most of the injected gas re-produced.
The most important recovery mechanism for IOR by WAG in A-07 C – A-10 is improved
vertical sweep.
Operational flexibility is key for successful WAG. GOR and WOR have been managed by
adjusting WAG Cycle length to production responses.
Huff ‘n Puff with hydrocarbon gas has been implemented in well A-01 B and has to date
produced about 0.13 mmstb of incremental oil. Huff’n Puff has proven to be an innovative
method for getting some gas injection benefits without a gas injector.
Gas IOR can be economical even when competing with gas export.

11/3/2016
Acknowledgements
• We would like to thank the Varg Partners for permission to publish the paper.
Slide 21

11/3/2016
Thank you
© Compañía. Dirección que ha elaborado el documento. Fecha completa.

11/3/2016
Questions?

11/3/2016
Don’t Forget the Prize!!
11/3/2016
Varg Production 1.1.2012 –
Dominated by A-10 A and A-05 A
25

11/3/2016
A-10 A Scale issues
‘THE CHALLENGE OF SCALE CONTROL IN A LATE
LIFE HIGH SALINITY, HIGH TEMPERATURE FIELD’
Myles Jordan (Nalco Energy Services Ltd), Eyvind Sorhaug (Talisman
Energy Norge AS) and David Marlow (Nalco Energy Service AS).
Presented at 22nd International Oilfield Chemistry Symposium 18th-21st
of March2012

11/3/2016
Varg Map
11/3/2016
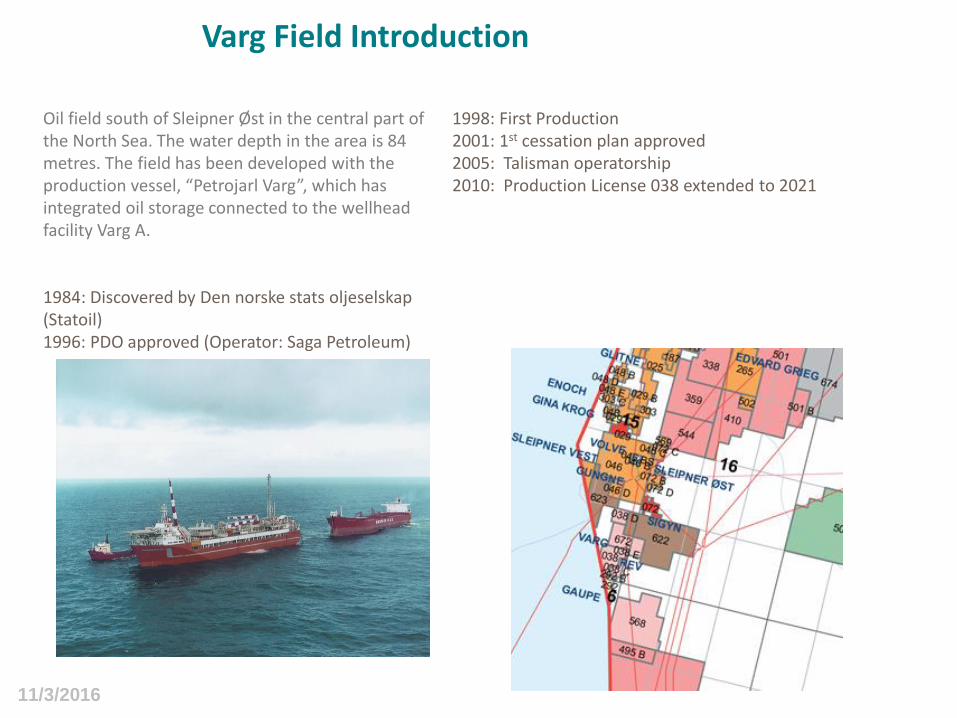
Oil field south of Sleipner Øst in the central part of the North Sea. The water depth in the area is 84 metres. The field has been developed with the production vessel, “Petrojarl Varg”, which has integrated oil storage connected to the wellhead facility Varg A. 1984: Discovered by Den norske stats oljeselskap (Statoil) 1996: PDO approved (Operator: Saga Petroleum)
1998: First Production 2001: 1st cessation plan approved 2005: Talisman operatorship 2010: Production License 038 extended to 2021
Varg Field Introduction

11/3/2016
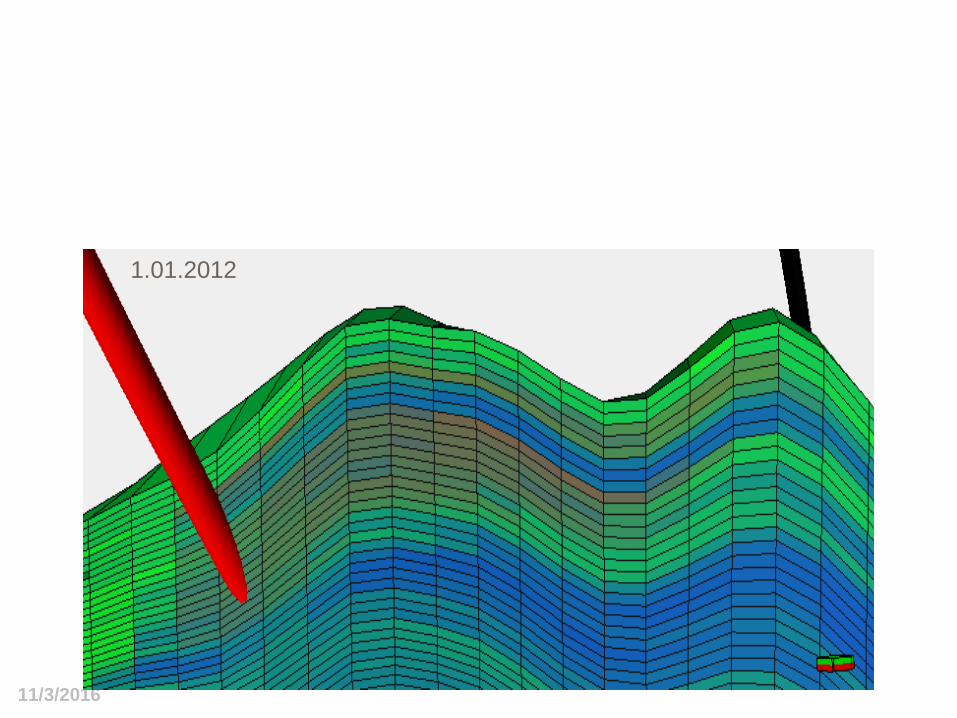
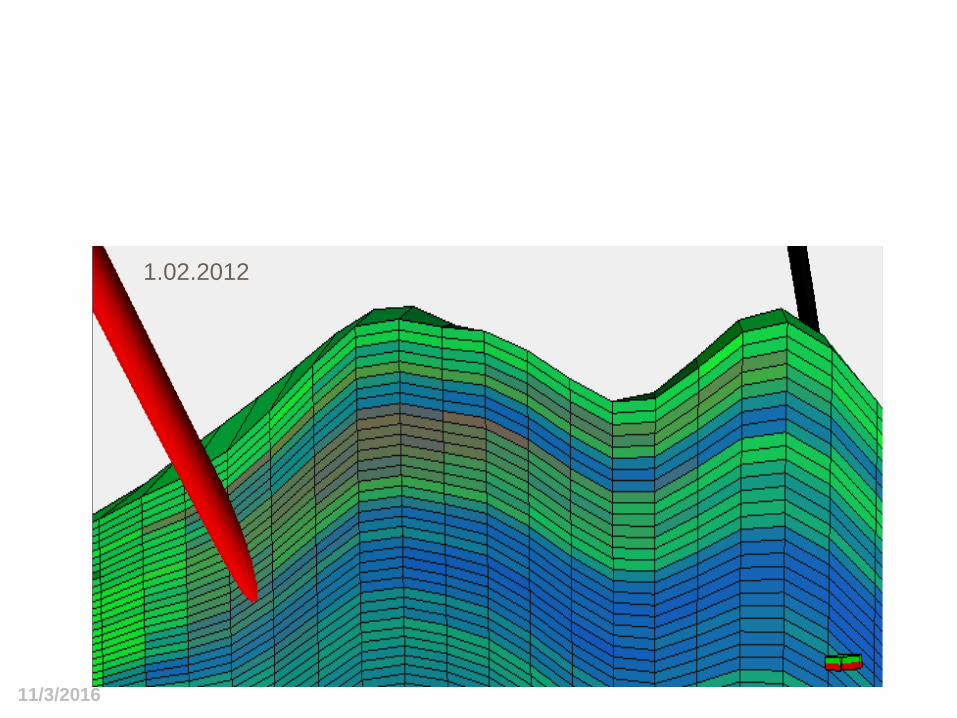
A-10 A Production

11/3/2016
1.09.2011

11/3/2016
1.12.2011
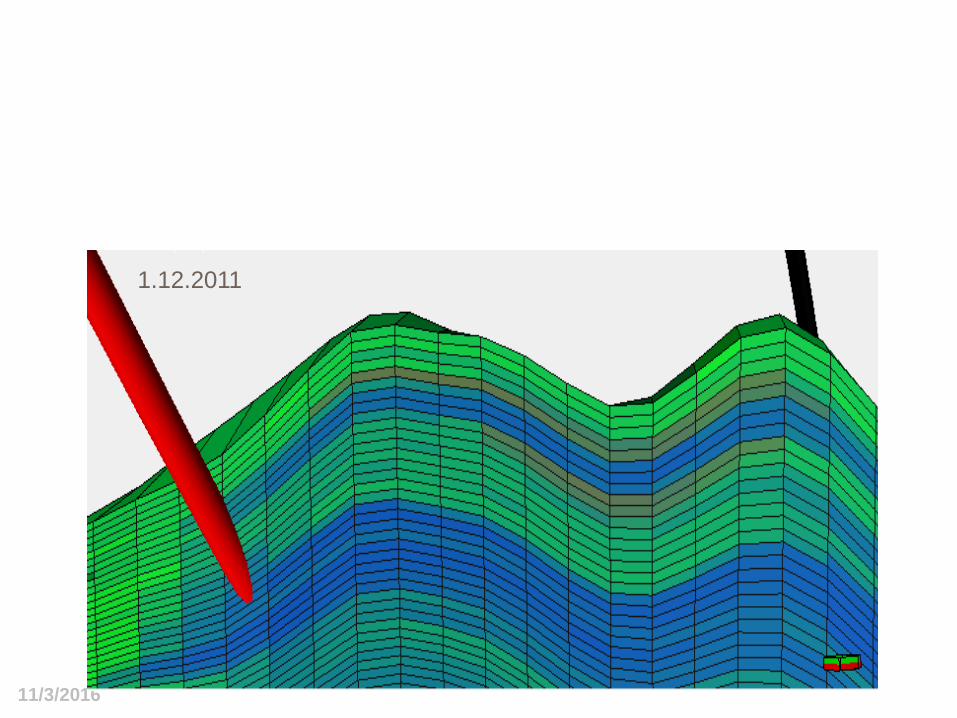
11/3/2016
1.12.2011
11/3/2016
1.01.2012
11/3/2016
1.02.2012

11/3/2016
1.03.2012
11/3/2016
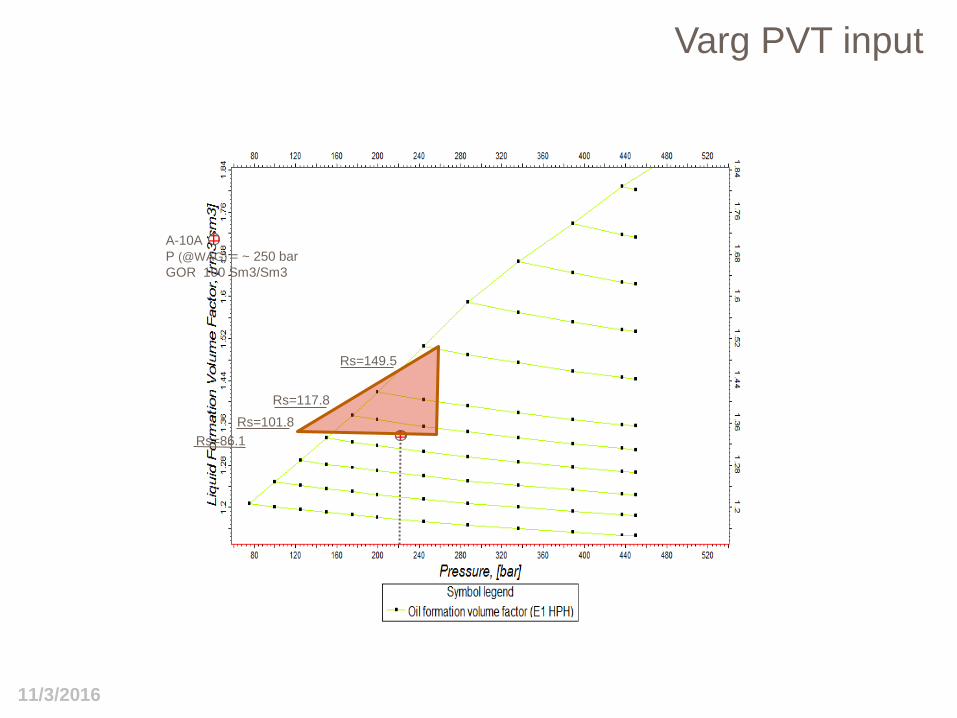
Varg PVT input
Rs=101.8
Rs=117.8
Rs=149.5
Rs=86.1
A-10A
P (@WAG) = ~ 250 bar
GOR 100 Sm3/Sm3
11/3/2016
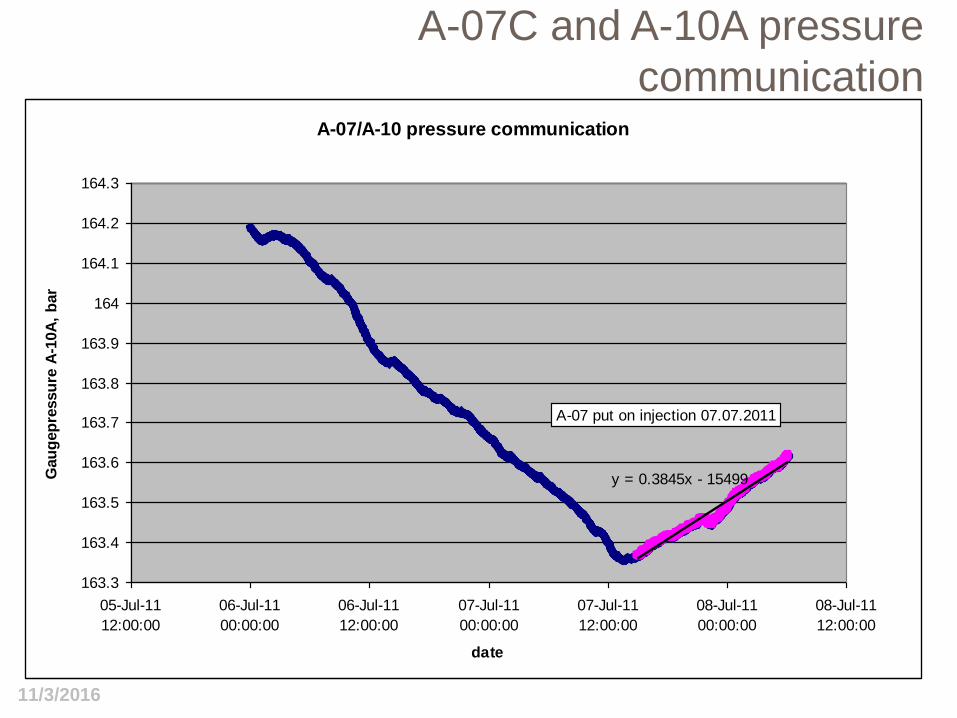
A-07C and A-10A pressure
communication
Inn med trykk-kommunikajsonssplott, se A-10A welltest A-07/A-10 pressure communication
y = 0.3845x - 15499
163.3
163.4
163.5
163.6
163.7
163.8
163.9
164
164.1
164.2
164.3
05-Jul-11
12:00:00
06-Jul-11
00:00:00
06-Jul-11
12:00:00
07-Jul-11
00:00:00
07-Jul-11
12:00:00
08-Jul-11
00:00:00
08-Jul-11
12:00:00
date
Gau
gep
ressu
re A
-10A
, b
ar
A-07 put on injection 07.07.2011