Garfield County, Utah Resource Assessment€¦ · Garfield County, Utah Resource Assessment August...
19
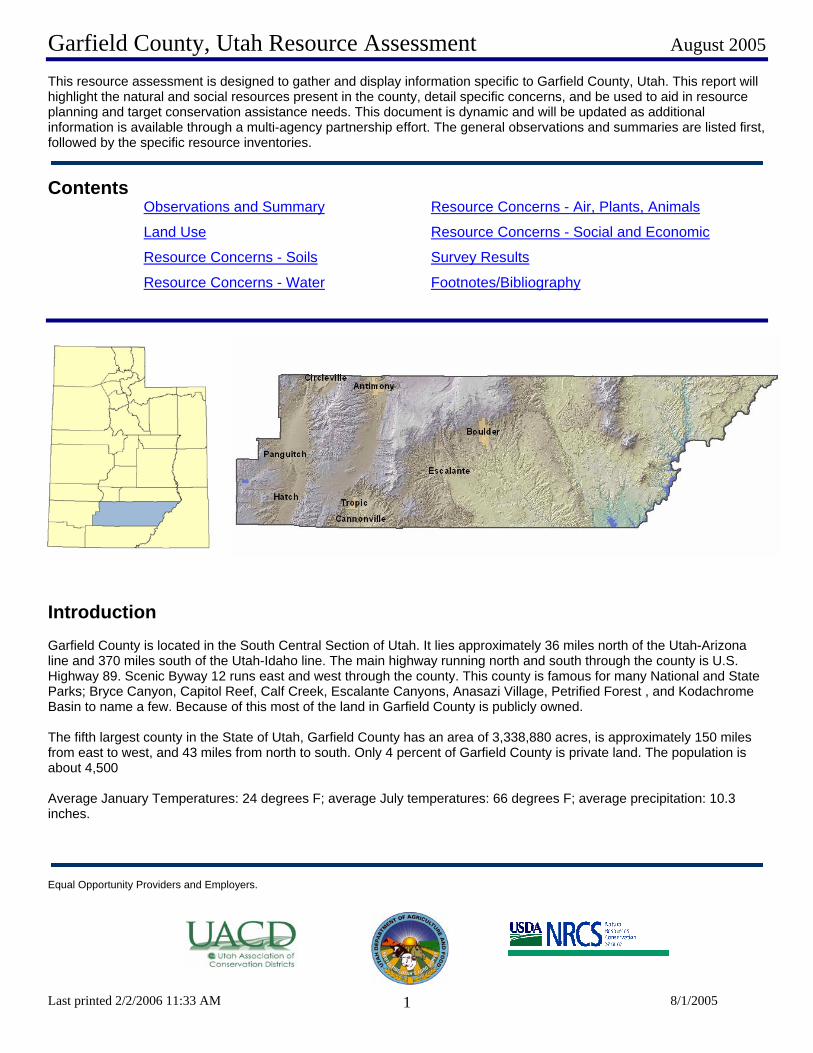
Garfield County, Utah Resource Assessment August 2005 Last printed 2/2/2006 11:33 AM 8/1/2005 1 This resource assessment is designed to gather and display information specific to Garfield County, Utah. This report will highlight the natural and social resources present in the county, detail specific concerns, and be used to aid in resource planning and target conservation assistance needs. This document is dynamic and will be updated as additional information is available through a multi-agency partnership effort. The general observations and summaries are listed first, followed by the specific resource inventories. Contents Observations and Summary Resource Concerns - Air, Plants, Animals Land Use Resource Concerns - Social and Economic Resource Concerns - Soils Survey Results Resource Concerns - Water Footnotes/Bibliography Introduction Garfield County is located in the South Central Section of Utah. It lies approximately 36 miles north of the Utah-Arizona line and 370 miles south of the Utah-Idaho line. The main highway running north and south through the county is U.S. Highway 89. Scenic Byway 12 runs east and west through the county. This county is famous for many National and State Parks; Bryce Canyon, Capitol Reef, Calf Creek, Escalante Canyons, Anasazi Village, Petrified Forest , and Kodachrome Basin to name a few. Because of this most of the land in Garfield County is publicly owned. The fifth largest county in the State of Utah, Garfield County has an area of 3,338,880 acres, is approximately 150 miles from east to west, and 43 miles from north to south. Only 4 percent of Garfield County is private land. The population is about 4,500 Average January Temperatures: 24 degrees F; average July temperatures: 66 degrees F; average precipitation: 10.3 inches. Equal Opportunity Providers and Employers.
Transcript of Garfield County, Utah Resource Assessment€¦ · Garfield County, Utah Resource Assessment August...
Garfield County, Utah Resource Assessment August 2005 This resource assessment is designed to gather and display information specific to Garfield County, Utah. This report will highlight the natural and social resources present in the county, detail specific concerns, and be used to aid in resource planning and target conservation assistance needs. This document is dynamic and will be updated as additional information is available through a multi-agency partnership effort. The general observations and summaries are listed first, followed by the specific resource inventories.
Contents Observations and Summary Resource Concerns - Air, Plants, Animals
Land Use Resource Concerns - Social and Economic
Resource Concerns - Soils Survey Results
Resource Concerns - Water Footnotes/Bibliography
Last printed 2/2/2006 11:33 AM
Introduction Garfield County is located in thline and 370 miles south of theHighway 89. Scenic Byway 12Parks; Bryce Canyon, Capitol Basin to name a few. Because The fifth largest county in the from east to west, and 43 mileabout 4,500 Average January Temperatureinches.
Equal Opportunity Providers and Emp
8/1/2005 1
e South Central Section of Utah. It lies approximately 36 miles north of the Utah-Arizona Utah-Idaho line. The main highway running north and south through the county is U.S. runs east and west through the county. This county is famous for many National and State Reef, Calf Creek, Escalante Canyons, Anasazi Village, Petrified Forest , and Kodachrome of this most of the land in Garfield County is publicly owned.
State of Utah, Garfield County has an area of 3,338,880 acres, is approximately 150 miles s from north to south. Only 4 percent of Garfield County is private land. The population is
s: 24 degrees F; average July temperatures: 66 degrees F; average precipitation: 10.3
loyers.

Garfield County, Utah Resource Assessment August 2005
Last printed 2/2/2006 11:33 AM 8/1/2005 2
Back to Contents General Land Use Observations
Overgrazing in the past has led to many of our current issues with plant community composition and health of rangelands.
It is a challenge getting most of the landowners to make wildlife a priority, especially when they are part-time and have many financial restraints.
Noxious weeds and invasive plants are an ever increasing problem Resource Assessment Summary
CategoriesConcern
high, medium, or low
Description and Specific Location (quantify where possible)
Soil High
Accelerated erosion due to wind is a rapidly increasing problem, especially in the valleys where the wind tends to be strong. Water erosion is less of a problem but it still occurs. Along the sevier river where there has been extreme flood events this year water erosion has increased quite a bit.
Water Quantity mediumSome agriculture areas are still using inefficient irrigation methods affecting water quantity. Water is quite often in short supply over the alst few years. Water quantity is a concern for most landowners.
Water Quality Ground Water low
Development in some areas, particularly summer home development near Panguitch Lake and Assay Creek, is a concern in contamination ofthe groundwater
Water Quality Surface Water high
Riparian habitat and vegetation along the Sevier River and the East Fork as well as the Escalante River is lacking. There are eroding banks and lack of woody riparian vegetation. There is also concern from the sedimentation from run-off into the rivers
Air Quality low Air quality concerns are related to the issues described in the accelerated erosion due to wind above.
Plant Suitability medium
Noxious weeds are a serious threat to agriculture lands and wildland areas. There are precenses of noxious weeds throughout the county especially in agriculture areas and tavel routes. The shrub rangelands are continually being invaded by Pinyon/Juniper trees which are undesirable species for these areas and unproductive.
Plant Condition mediumThe short growing season in the Panguitch, Hatch area limits the growth of commercial plants. Over grazing in the past and the mortality rate of existing plants is a problem on the rangelands.
Fish and Wildlife highHabitat is not always suitable for a diversity of wildlife species and it needs improvement. In agriculture areas management of wildlife is an issue.
Domestic Animals low
Social and Economic low
Development in agriculture ares is an ever increasing problem especially in the Panguitch, Boulder, and Escalante areas. Agriculture and ranching needs to be maintained as a sustainable economic and cultural lifestyle.

Garfield County, Utah Resource Assessment August 2005
L
Back to ContentsLand Cover
ast printed 2/2/2006 11:33 AM 8/1/2005 3
Acres %Forest 1,036,581 32%Grain Crops 1,400 0%Grass/Pasture/Haylands 20,300 1%Shrub/Rangelands 2,139,677 66%Water/Wetlands(approximate) 32,150 1%Developed 27,000 1%Garfield County Totals *b 3,257,108 100%
*a : Estimate from Farm Service Agency records and include CRP/CREP. *b : Totals may not add due to
rounding and small unknown acreages.
Land Cover/Land Use
Garfield County, Utah Resource Assessment August 2005
Last printed 2/2/2006 11:33 AM 8/1/2005 4
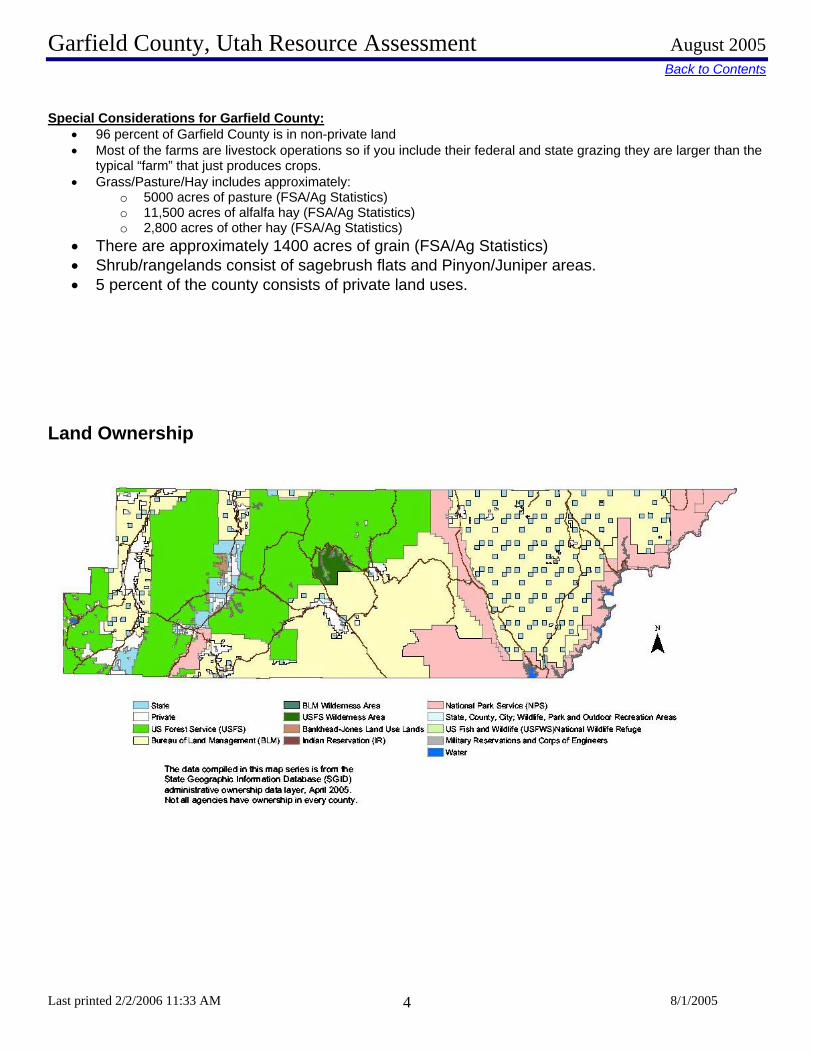
Back to Contents Special Considerations for Garfield County:
• 96 percent of Garfield County is in non-private land • Most of the farms are livestock operations so if you include their federal and state grazing they are larger than the
typical “farm” that just produces crops. • Grass/Pasture/Hay includes approximately:
o 5000 acres of pasture (FSA/Ag Statistics) o 11,500 acres of alfalfa hay (FSA/Ag Statistics) o 2,800 acres of other hay (FSA/Ag Statistics)
• There are approximately 1400 acres of grain (FSA/Ag Statistics) • Shrub/rangelands consist of sagebrush flats and Pinyon/Juniper areas. • 5 percent of the county consists of private land uses.
Land Ownership
Garfield County, Utah Resource Assessment August 2005
La
Back to Contents
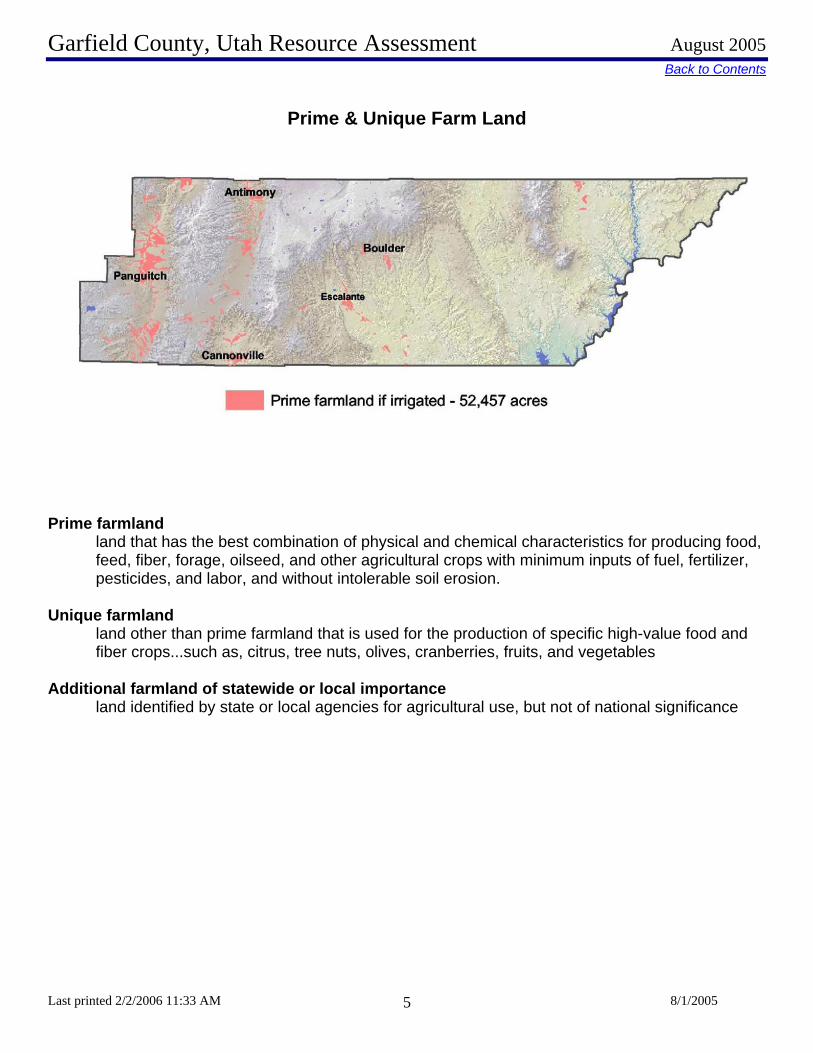
Prime & Unique Farm Land
Pr
Un
Ad
st printed 2/2/2006 11:33 AM 8/1/2005 5
ime farmland land that has the best combination of physical and chemical characteristics for producing food, feed, fiber, forage, oilseed, and other agricultural crops with minimum inputs of fuel, fertilizer, pesticides, and labor, and without intolerable soil erosion.
ique farmland land other than prime farmland that is used for the production of specific high-value food and fiber crops...such as, citrus, tree nuts, olives, cranberries, fruits, and vegetables
ditional farmland of statewide or local importance land identified by state or local agencies for agricultural use, but not of national significance

Garfield County, Utah Resource Assessment August 2005
Last printed 2/2/2006 11:33 AM 8/1/2005 6
Back to Contents Resource Concerns – SOILS
Categories Specific Resource Concern / Issue
Cro
pH
ayPa
stur
eG
raze
d R
ange
Gra
zed
Fore
stPa
stur
e N
ativ
e/N
atur
aliz
ed
Wild
life
Wat
ersh
ed P
rote
ctio
nFo
rest
Hea
dqua
rter
sU
rban
Rec
reat
ion
Wat
erM
ined
Nat
ural
Are
a
Sheet and Rill x x x x x x xWind x x x x x xStreambankShoreline x x x x x x x xIrrigation-induced x x xMass Movement xRoad, roadsides and Construction Sites x x xOrganic Matter Depletion x xRangeland Site Stability x x x x xCompaction x x x x xContaminants: Animal Waste and Other OrganicsN xContaminants: Animal Waste and Other OrganicsP x x xContaminants: Animal Waste and Other OrganicsKContaminants : Commercial FertilizerNContaminants : Commercial FertilizerP x x xContaminants : Commercial FertilizerKContaminantsResidual Pesticides x xDamage from Sediment Deposition x x x x
Soil Erosion
Soil Condition

Garfield County, Utah Resource Assessment August 2005
L
Back to Contents Land Capability Class on Cropland and Pastureland
ast printed 2/2/2006 11:33 AM 8/1/2005 7
Acres Percentage I - slight limitations 0 0% II - moderate limitations 12,337 13% III - severe limitations 71,051 74% IV - very severe limitations 4,965 5% V - no erosion hazard, but other limitations 0 0% VI - severe limitations, unsuited for cultivation, limited to pasture, range, forest 7,093 7% VII - very severe limitations, unsuited for cultivation, limited to grazing, forest, wildlife 0 0%
Land Capability Class (Irrigated Cropland &
Pastureland Only)
VIII - misc areas have limitations, limited to recreation, wildlife, and water supply 0 0%

Garfield County, Utah Resource Assessment August 2005
Last printed 2/2/2006 11:33 AM 8/1/2005 8
Back to Contents Soil Erosion
Garfield County Soil Erosion
1.410
0.593
0.399
0.035 0.035 0.021
0.856
0.067
0.0000.2000.4000.6000.8001.0001.2001.4001.600
1982 1987 1992 1997
Years
tons
/acr
e
Soil Loss by WindSoil Loss by Water
Sheet and rill erosion by water on the subbasin croplands and pasturelands have been reduced by more than 50 thousand tons of soil per year from 1982 to 1997.
NRI estimates indicate 1,400 acres of the subbasin agricultural land s still had water erosion rates above
a sustainable level in 1997.
Controlling erosion not only sustains the long-term productivity of the land, but also affects the amount of soil, pesticides, fertilizer, and other substances that move into the nation’s waters.
Through NRCS programs many farmers and ranchers have applied conservation practices to reduce the
effects of erosion by water. As a result, erosion rates on croplands and pasturelands fell 60 percent from .035 to .021 tons/acre/year from 1982 to 1997.

Garfield County, Utah Resource Assessment August 2005
Last printed 2/2/2006 11:33 AM 8/1/2005 9
Back to ContentsResource Concerns – WATER
Categories Specific Resource Concern / Issue
Cro
pH
ayPa
stur
eG
raze
d R
ange
Gra
zed
Fore
stPa
stur
e N
ativ
e/N
atur
aliz
ed
Wild
life
Wat
ersh
ed P
rote
ctio
nFo
rest
Hea
dqua
rter
sU
rban
Rec
reat
ion
Wat
erM
ined
Nat
ural
Are
a
Water Quantity – Rangeland Hydrologic Cycle x x x x x x xExcessive SeepageExcessive Runoff, Flooding, or Ponding xExcessive Subsurface WaterDrifted SnowInadequate OutletsInefficient Water Use on Irrigated Land x x xInefficient Water Use on Non-irrigated LandReduced Capacity of Conveyances by Sediment Deposition
x x xReduced Storage of Water Bodies by Sediment Accumulation
Aquifer OverdraftInsufficient Flows in Watercourses x x x x x x x x x x xHarmful Levels of Pesticides in GroundwaterExcessive Nutrients and Organics in GroundwaterExcessive Salinity in GroundwaterHarmful Levels of Heavy Metals in GroundwaterHarmful Levels of Pathogens in GroundwaterHarmful Levels of Petroleum in GroundwaterHarmful Levels of Pesticides in Surface WaterExcessive Nutrients and Organics in Surface Water x x xExcessive Suspended Sediment and Turbidity in Surface Water
Excessive Salinity in Surface WaterWater Quality – Colorado River Excessive SalinityHarmful Levels of Heavy Metals in Surface WaterHarmful Temperatures of Surface Water Harmful Levels of Pathogens in Surface WaterHarmful Levels of Petroleum in Surface Water
Water Quantity
Water Quality, Groundwater
Water Quality, Surface
Garfield County, Utah Resource Assessment August 2005
L
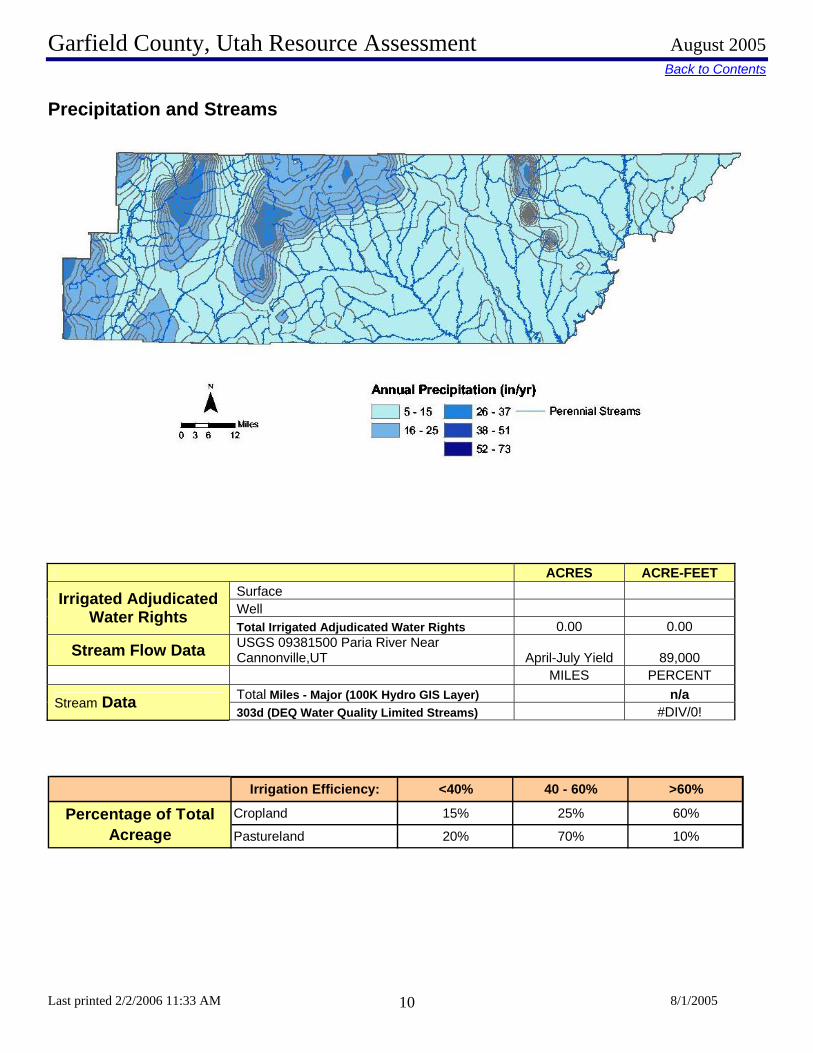
Back to Contents Precipitation and Streams
ast printed 2/2/2006 11:33 AM 8/1/2005 10
ACRES ACRE-FEET Surface Well
Irrigated Adjudicated Water Rights
Total Irrigated Adjudicated Water Rights 0.00 0.00
Stream Flow Data USGS 09381500 Paria River Near Cannonville,UT April-July Yield 89,000
MILES PERCENT Total Miles - Major (100K Hydro GIS Layer) n/a Stream Data 303d (DEQ Water Quality Limited Streams) #DIV/0!
Irrigation Efficiency: <40% 40 - 60% >60%
Cropland 15% 25% 60%
Pastureland 20% 70% 10%Percentage of Total
Acreage

Garfield County, Utah Resource Assessment August 2005
Last printed 2/2/2006 11:33 AM 8/1/2005 11
Back to Contents Watersheds & Total Maximum Daily Load (TMDL)
Name Status Name StatusUpper Sevier River Community Watershed Project
Pending Completion Upper sevier Watershed Management Plan Complete
Escalante River Watershed Water Quality Management Plan
Draft
Paria River Watershed Water Quality management Plan
Draft
Name Status Number Status
Watershed Projects, Plans, Studies and AssessmentsNRCS Watershed Projects NRCS Watershed Plans, Studies & Assessments
DEQ TMDL's NRCS Comprehensive Nutrient Management Plans
AFO/CAFO Animal Feeding Operations (AFO)Animal Type Dairy Feed Lot
(Cattle) Horses Sheep Mixed Other
No. of Farms 0 48 3 1 4No. of Animals
0
Potential Confined Animal Feeding Operations (PCAFO)Animal Type Dairy Feed Lot
(Cattle) Horses Sheep Mixed Other
No. of Farms 0 4 1 0 2No. of Animals
0
Confined Animal Feeding Operations - Utah CAFO PermitAnimal Type Dairy Feed Lot
(Cattle) Horses Sheep Other
No. of Permitted Farms 0 0 0 0No. of Permitted Animals
0

Garfield County, Utah Resource Assessment August 2005
Last printed 2/2/2006 11:33 AM 8/1/2005 12
Back to Contents Resource Concerns – AIR, PLANTS, ANIMALS
Categories Specific Resource Concern / Issue
Cro
pH
ayPa
stur
eG
raze
d R
ange
Gra
zed
Fore
stPa
stur
e N
ativ
e/N
atur
aliz
ed
Wild
life
Wat
ersh
ed P
rote
ctio
nFo
rest
Hea
dqua
rter
sU
rban
Rec
reat
ion
Wat
erM
ined
Nat
ural
Are
a
Particulate matter less than 10 micrometers in diameter (PM 10) Particulate matter less than 2.5 micrometers in diameter (PM 2.5)Excessive Ozone Excessive Greenhouse Gas: CO2 (carbon dioxide) Excessive Greenhouse Gas: N2O (nitrous oxide)Excessive Greenhouse Gas: CH4 (methane)Ammonia (NH3)Chemical Drift x xObjectionable Odors xReduced Visibility x x xUndesirable Air MovementAdverse Air Temperature
Plant Suitability
Plants not adapted or suited
Plant Condition – Productivity, Health and Vigor
Threatened or Endangered Plant Species: Plant Species Listed or Proposed for Listing under the Endangered Species Act x x x xThreatened or Endangered Plant Species: Declining Species, Species of Concern x x x xNoxious and Invasive Plants x x x x x x x x x x x x x x xForage Quality and Palatability x x xPlant Condition – Wildfire Hazard x x xInadequate Food x x x x xInadequate Cover/Shelter x x xInadequate Water x x xInadequate SpaceHabitat Fragmentation x x x Imbalance Among and Within Populations
Threatened and Endangered Species: Species Listed or Proposed for Listing under the Endangered Species Act x x x x x x x x x x x x x x xInadequate Quantities and Quality of Feed and Forage x x x xInadequate ShelterInadequate Stock Water x x xStress and Mortality x x
Air Quality
Plant Condition
Fish and Wildlife
Domestic Animals

Garfield County, Utah Resource Assessment August 2005
Last printed 2/2/2006 11:33 AM 8/1/2005 13
Back to Contents Noxious Weeds
Utah Noxious Weed List
The following weeds are officially designated and published as noxious for the State of Utah, as per the authority vested in the Commissioner of Agriculture under Section 4-17-3, Utah Noxious Weed Act:
• Bermudagrass** (cynodon dactylon) • Canada thistle (cirsium arvense) • Diffuse knapweed (centaurea diffusa) • Dyers woad (isatis tinctoria L) • Field bindweed (Wild Morning Glory) (convolvulus arvensis) • Hoary cress (cardaria drabe) • Johnsongrass (sorghum halepense) • Leafy spurge (euphorbia esula) • Medusahead (taeniatherum caput-medusae) • Musk thistle (carduus mutans) • Perennial pepperweed (lepidium latifolium) • Perennial sorghum (sorghum halepense L & sorghum almum) • Purple loosestrife (lythrum salicaria L.) • Quackgrass (agropyron repens) • Russian knapweed (centaurea repens) • Scotch thistle (onopordum acanthium) • Spotted knapweed (centaurea maculosa) • Squarrose knapweed (centaurea squarrosa) • Yellow starthistle (centaurea solstitialis)
There are no additional noxious weeds declared by Garfield County (2003).
Garfield County, Utah Resource Assessment August 2005
Last printed 2/2/2006 11:33 AM 8/1/2005 14
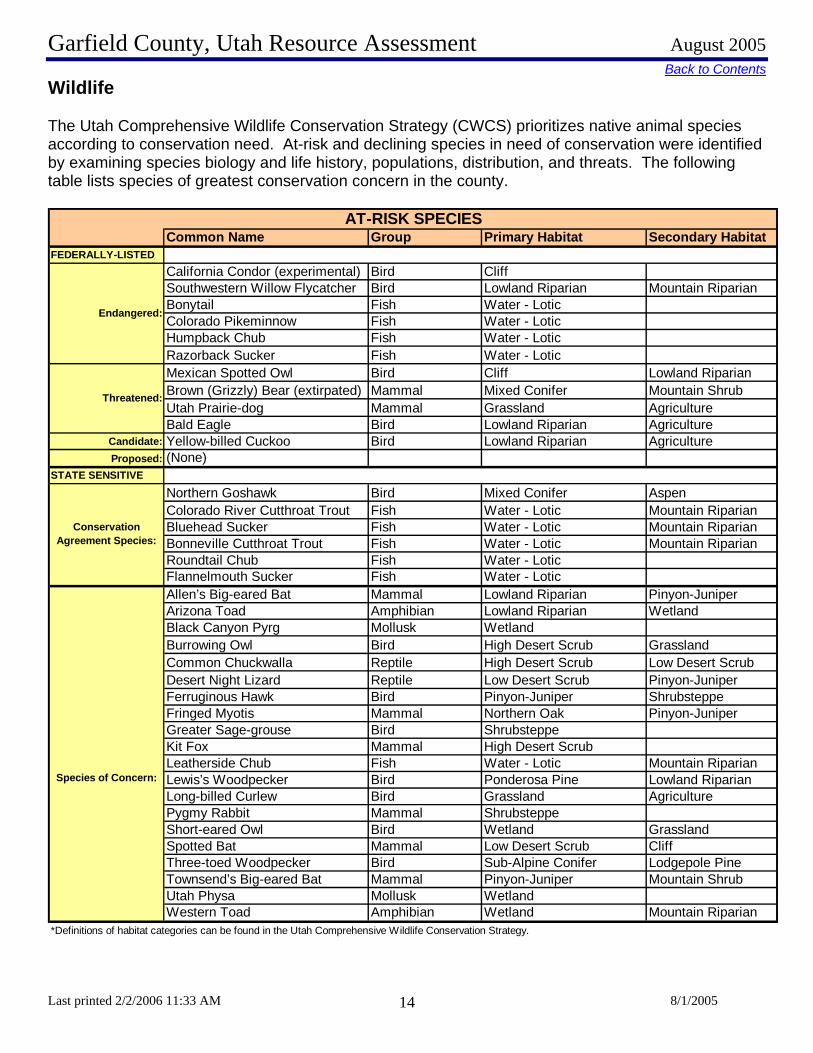
Back to ContentsWildlife The Utah Comprehensive Wildlife Conservation Strategy (CWCS) prioritizes native animal species according to conservation need. At-risk and declining species in need of conservation were identified by examining species biology and life history, populations, distribution, and threats. The following table lists species of greatest conservation concern in the county.
Common Name Group Primary Habitat Secondary HabitatFEDERALLY-LISTED
California Condor (experimental) Bird CliffSouthwestern Willow Flycatcher Bird Lowland Riparian Mountain RiparianBonytail Fish Water - LoticColorado Pikeminnow Fish Water - LoticHumpback Chub Fish Water - LoticRazorback Sucker Fish Water - LoticMexican Spotted Owl Bird Cliff Lowland RiparianBrown (Grizzly) Bear (extirpated) Mammal Mixed Conifer Mountain ShrubUtah Prairie-dog Mammal Grassland AgricultureBald Eagle Bird Lowland Riparian Agriculture
Candidate: Yellow-billed Cuckoo Bird Lowland Riparian AgricultureProposed: (None)
STATE SENSITIVE
Northern Goshawk Bird Mixed Conifer AspenColorado River Cutthroat Trout Fish Water - Lotic Mountain RiparianBluehead Sucker Fish Water - Lotic Mountain RiparianBonneville Cutthroat Trout Fish Water - Lotic Mountain RiparianRoundtail Chub Fish Water - LoticFlannelmouth Sucker Fish Water - LoticAllen’s Big-eared Bat Mammal Lowland Riparian Pinyon-JuniperArizona Toad Amphibian Lowland Riparian WetlandBlack Canyon Pyrg Mollusk WetlandBurrowing Owl Bird High Desert Scrub GrasslandCommon Chuckwalla Reptile High Desert Scrub Low Desert ScrubDesert Night Lizard Reptile Low Desert Scrub Pinyon-JuniperFerruginous Hawk Bird Pinyon-Juniper ShrubsteppeFringed Myotis Mammal Northern Oak Pinyon-JuniperGreater Sage-grouse Bird ShrubsteppeKit Fox Mammal High Desert ScrubLeatherside Chub Fish Water - Lotic Mountain RiparianLewis’s Woodpecker Bird Ponderosa Pine Lowland RiparianLong-billed Curlew Bird Grassland AgriculturePygmy Rabbit Mammal ShrubsteppeShort-eared Owl Bird Wetland GrasslandSpotted Bat Mammal Low Desert Scrub CliffThree-toed Woodpecker Bird Sub-Alpine Conifer Lodgepole PineTownsend’s Big-eared Bat Mammal Pinyon-Juniper Mountain ShrubUtah Physa Mollusk WetlandWestern Toad Amphibian Wetland Mountain Riparian
*Definitions of habitat categories can be found in the Utah Comprehensive Wildlife Conservation Strategy.
Threatened:
Conservation Agreement Species:
Species of Concern:
AT-RISK SPECIES
Endangered:

Garfield County, Utah Resource Assessment August 2005
Last printed 2/2/2006 11:33 AM 8/1/2005 15
Back to Contents The Utah CWCS also prioritizes habitat categories based on several criteria important to the species of greatest conservation need. The top ten hey habitats state-wide are (in order of priority): 1) Lowland Riparian (riparian areas <5,500 ft elevation; principal vegetation: Fremont cottonwood and willow)
2) Wetland (marsh <5,500 ft elevation; principal vegetation: cattail, bulrush, and sedge) 3) Mountain Riparian (riparian areas >5,500 ft elevation; principal vegetation: narrowleaf cottonwood, willow, alder, birch and dogwood) 4) Shrubsteppe (shrubland at 2,500 - 11,500 ft elevation; principal vegetation: sagebrush and perennial grasses)
5) Mountain Shrub (deciduous shrubland at 3,300 - 9,800 ft elevation; principal vegetation: mountain mahogany, cliff rose, bitterbrush, serviceberry, etc.) 6) Water - Lotic (open water; streams and rivers) 7) Wet Meadow (water saturated meadows at 3,300 - 9,800 ft elevation; principal vegetation: sedges, rushes, grasses and forbs)
8) Grassland (perennial and annual grasslands or herbaceous dry meadows at 2,200 - 9,000 ft elevation)
9) Water - Lentic (open water; lakes and reservoirs)
10) Aspen (deciduous aspen forest at 5,600 - 10,500 ft elevation)
Resource Concerns – SOCIAL AND ECONOMIC
Categories Specific Resource Concern / Issue
Cro
pH
ayPa
stur
eG
raze
d R
ange
Gra
zed
Fore
stPa
stur
e N
ativ
e/N
atur
aliz
ed
Wild
life
Wat
ersh
ed P
rote
ctio
nFo
rest
Hea
dqua
rter
sU
rban
Rec
reat
ion
Wat
erM
ined
Nat
ural
Are
a
Non-Traditional Landowners and Tenants x xUrban Encroachment on Agricultural Land x x x x x x x xMarketing of Resource ProductsInnovation NeedsNon-Traditional Land Uses x x xPopulation Demographics, Changes and Trends x x xSpecial Considerations for Land Mangement (High State and Federal Percentage) x x x x x xActive Resource Groups (CRMs, etc)Full Time vs Part Time Agricultural Communities x x x x x xSize of Operating UnitsLand Removed from Production through EasmentsLand Removed from Production through USDA Programs
Other
Social and Economic

Garfield County, Utah Resource Assessment August 2005
Last printed 2/2/2006 11:33 AM 8/1/2005 16
Back to Contents Census and Social Data
Garfield County Population Growth 1900 - 2003
0
1,000
2,000
3,000
4,000
5,000
6,000
1900 1910 1920 1930 1940 1950 1960 1970 1980 1990 2000 2003est.
0
10
20
30
40
50
60
70
1-9 10-49 50-179 180-499 500-999 1000+
Size of Farms in 2002 (Acres)
Number of Farms: 601 Number of Operators:
Full-Time Operators: 32 Part-Time Operators:569

Garfield County, Utah Resource Assessment August 2005
Last printed 2/2/2006 11:33 AM 8/1/2005 17
Back to Contents
Public Survey/Questionnaire Results:
Garfield County Resource Assessment Survey project
August 25, 2005 Canyonlands and Upper Sevier Soil Conservation Districts
The Canyonlands and Upper Sevier Conservation Districts received 31 resource assessment surveys from citizens/stakeholders in Garfield County From;
1) Upper Sevier SCD Survey Mail-out 2) Canyonlands Resource Assessment Public Meeting 3) Color Country RC&D Meetings 4) Panguitch Quilt Walk Festival 5) Upper Sevier Watershed Steering Committee Meeting 6) Garfield County Mail-out
Top Five Concerns that should be addressed immediately: 1. Presence of invasive plants including noxious weeds 68% 2. Soil loss or erosion on land or along stream channels 65% 3. Adequate water supply for desired uses 61% 4. Storm run-off or flooding 52% 5. Adequate food, water and cover for livestock 39% Top Five Concerns that should be addressed in the future: 1. Wildfire hazard 52% 2. Soil condition due to compaction or other changes 45% 2. Available clean water is clean enough for desired uses 45% 2. Adequate energy sources available 45% 3. Adequate food, water and cover available for wildlife 42% 4. Plant health, production and adequate quantities 39% 5. Soil loss or erosion on land or along stream channels 35% 5. Recreation Opportunities 35% Garfield County Survey Demographics: Gender-28 responses Age - 29 responses Race/Ethnicity – 26 responses Male- 70% 18-24 – 0% European/Caucasian – 96% Female-21% 25-38 – 10% Other – 4% 39-50 – 24% 51-65 – 38% 66+ - 28% Ag Producers – 48% Non-Ag Producers – 52%

Garfield County, Utah Resource Assessment August 2005
Last printed 2/2/2006 11:33 AM 8/1/2005 18
Back to Contents Footnotes / Bibliography 1. General information about Garfield County obtained from a Garfield County website and the NRCS office. 2. Location and land ownership maps made using GIS shapefiles from the Automated Geographical Reference Center (AGRC), a Utah State Division of Information Technology. Website: http://agrc.utah.gov/ 3. Land Use/Land Cover layer developed by the Utah Department of Water Resources. A polygon coverage containing water-related land-use for all 2003 agricultural areas of the state of Utah. Compiled from initial USGS 7.5 minute Digital Raster Graphic waterbodies, individual farming fields and associated areas are digitized from Digital Orthophotos, then surveyed for their land use, crop type, irrigation method, and associated attributes. 4. Prime and Unique farmlands derived from SURGO Soils Survey UT607 and Soil Data Viewer. Definitions of Prime and Unique farmlands from U.S. Geological Survey, http://water.usgs.gov/eap/env_guide/farmland.html#HDR5 5. Land Capability Classes derived from SURGO Soils Survey UT607 and Soil Data Viewer. 6. Tons of Soil Loss by Water Erosion data gathered from National Resource Inventory (NRI) data. Estimates from the 1997 NRI Database (revised December 2000) replace all previous reports and estimates. Comparisons made using data published for the 1982, 1987, or 1992 NRI may produce erroneous results. This is due to changes in statistical estimation protocols, and because all data collected prior to 1997 were simultaneously reviewed (edited) as 1997 NRI data were collected. In addition, this December 2000 revision of the 1997 NRI data updates information released in December 1999 and corrects a computer error discovered in March 2000. For more information: http://www.nrcs.usda.gov/technical/NRI/ 7. Precipitation data was developed by the Oregon Climate Service at Oregon State University using average monthly or annual precipitation from 1960 to 1990. Publication date: 1998. Data was downloaded from the Resource Data Gateway, http://dgateway-wb01.lighthouse.itc.nrcs.usda.gov/lighthouse 8. Irrigated Adjudicated Water Rights obtained from the Utah Division of Water Rights. 9. Stream Flow data from USGS website http://www.usgs.gov 10. Watershed information from Upper Sevier Watershed Management Plan, Escalante River Watershed Water Quality Management Plan, and Paria River Watershed Water Quality Management Plan 11. The 2003 noxious weed list was obtained from the State Of Utah Department of Food and Agriculture. For more information contact Steve Burningham, 801-538-7181 or visit their website at http://ag.utah.gov/plantind/noxious_weeds.html
Garfield County, Utah Resource Assessment August 2005
Last printed 2/2/2006 11:33 AM 8/1/2005 19
12. Wildlife information derived from the Utah Division of Wildlife Resources' Comprehensive Wildlife Conservation Strategy (CWCS) ( http://wildlife.utah.gov/cwcs/ ) and from the Utah Conservation Data Center ( http://dwrcdc.nr.utah.gov/ucdc/ ). 13. County population data from the U.S. Census Bureau, Utah Quick Facts, http://quickfacts.census.gov/qfd/states/49000.html 14. Farm information obtained from the National Agricultural Statistics Service, 2002 Census of Agriculture. http://www.nass.usda.gov/census/census02/volume1/index2.htm


![6 30 10 RisK Assessment for Garfield County Based on 2008 Air Monitoring[1]](https://static.fdocuments.us/doc/165x107/577d21821a28ab4e1e9563a2/6-30-10-risk-assessment-for-garfield-county-based-on-2008-air-monitoring1.jpg)