Garbage and Blue Box Composition Data - London, …...Appendix B: Garbage and Blue Box Composition...
24
Appendix B: Garbage and Blue Box Composition Data B-1 Appendix B Garbage and Blue Box Composition Data Existing Composition – Garbage (including compostables) and Blue Box Recyclables Composition audits of garbage and Blue Box recyclables were conducted in London in 2012/2013 (with funding, coordination and sampling methodology provided by Stewardship Ontario). The audit consisted of four separate sets of audits conducted at specified intervals throughout the year (i.e. spring, summer, fall, winter) to address any issues of seasonality. Each audit included two samples taken over two consecutive collections to address issues of sporadic set out. The audit sample consisted of 100 curbside homes to achieve statistical significance. The same homes were used for each of the four sets of audits. The audit data was combined with other City data (quantities of garbage and Blue Box recyclables collected from single family homes and multi-residential, multi-residential waste and blue box audits from 2007, etc.) to create the following tables: Table B1 – Summary of 2012 Garbage Composition Table B2 – Estimated 2012 Curbside Garbage and Recycling Composition Table B3 – Estimated 2012 Multi-Residential Garbage and Recycling Composition Table B4 – Estimated 2012 Garbage and Recycling Composition Future Composition - Waste (Garbage and Blue Box Materials Combined) Estimates of waste quantities (garbage and blue box materials combined) were calculated for 2012, 2016 and 2025 and are shown in tables: Table B5 – Estimated 2012 Curbside and Multi-Residential Waste Composition Table B6 – Estimated 2016 Curbside and Multi-Residential Waste Composition Table B7 – Estimated 2025 Curbside and Multi-Residential Waste Composition These estimates were made taking the 2012 waste composition and adjusting it based on: estimates of future curbside (single family dwellings) and multi-residential units from Employment, Population, Housing and Non-Residential Construction Projects, City of London, Ontario, 2011 Update (AltusGroup, 2012) expected changes to the generation rate of specific materials using information on projected changes to the generation rates from Volume 1: Executive Summary A Study of the Optimization of the Blue Box Material Processing System in Ontario Final Report (Waste Diversion Organization, 2012) (Table B8)
Transcript of Garbage and Blue Box Composition Data - London, …...Appendix B: Garbage and Blue Box Composition...

Appendix B: Garbage and Blue Box Composition Data B-1
Appendix B Garbage and Blue Box Composition Data
Existing Composition – Garbage (including compostables) and Blue Box
Recyclables
Composition audits of garbage and Blue Box recyclables were conducted in
London in 2012/2013 (with funding, coordination and sampling methodology
provided by Stewardship Ontario). The audit consisted of four separate sets of
audits conducted at specified intervals throughout the year (i.e. spring, summer,
fall, winter) to address any issues of seasonality. Each audit included two
samples taken over two consecutive collections to address issues of sporadic set
out. The audit sample consisted of 100 curbside homes to achieve statistical
significance. The same homes were used for each of the four sets of audits.
The audit data was combined with other City data (quantities of garbage and
Blue Box recyclables collected from single family homes and multi-residential,
multi-residential waste and blue box audits from 2007, etc.) to create the
following tables:
Table B1 – Summary of 2012 Garbage Composition
Table B2 – Estimated 2012 Curbside Garbage and Recycling Composition
Table B3 – Estimated 2012 Multi-Residential Garbage and Recycling Composition
Table B4 – Estimated 2012 Garbage and Recycling Composition
Future Composition - Waste (Garbage and Blue Box Materials Combined)
Estimates of waste quantities (garbage and blue box materials combined) were
calculated for 2012, 2016 and 2025 and are shown in tables:
Table B5 – Estimated 2012 Curbside and Multi-Residential Waste Composition
Table B6 – Estimated 2016 Curbside and Multi-Residential Waste Composition
Table B7 – Estimated 2025 Curbside and Multi-Residential Waste Composition
These estimates were made taking the 2012 waste composition and adjusting it
based on:
estimates of future curbside (single family dwellings) and multi-residential units
from Employment, Population, Housing and Non-Residential Construction
Projects, City of London, Ontario, 2011 Update (AltusGroup, 2012)
expected changes to the generation rate of specific materials using
information on projected changes to the generation rates from Volume 1:
Executive Summary A Study of the Optimization of the Blue Box Material
Processing System in Ontario Final Report (Waste Diversion Organization, 2012)
(Table B8)

Appendix B: Garbage and Blue Box Composition Data B-2
The changes to material generation rates in Table B7 are due to industry
introducing new packaging or modifying existing packaging, changing
consumer habits and new products being introduced. Examples of recent
changes include:
More fruits and vegetables in “clamshell” packaging
An increase in light weight and multi material packaging
Plastic containers replacing glass, aluminum and steel
An increase in plastic stand-up pouches for food products
Consumers reading more newspapers and magazines online which reduces
the amount of paper for recycling
An increase in cardboard as more people shop online
Future Composition – Garbage and Blue Box Materials
Projections of the amount of material that would be diverted by the Blue Box
program in the future were estimated for three scenarios:
Table B9 – Estimated 2016 Garbage and Blue Box Composition – Base Case
Table B10 – Estimated 2025 Garbage and Blue Box Composition – Base Case
Table B11 – Estimated 2025 Garbage and Blue Box Composition – High Increase in
Capture Rate
The composition in Table B9 is based on the implementation of the
recommendations in this report. The composition in Table B10 assumes the
increased capture rates continues in line with trends from previous years, but there
are no substantially new or different initiatives to increase recovery. It is assumed
that markets for some materials will strengthen based on current efforts. The
composition in Table B11 assumes recovery rates are substantial and will require
aggressive promotion, education and incentive programs (e.g., rewards programs
for recycling).
The capture rates used to generate Tables B9 to B11 are presented in Table B12.

Appendix B: Garbage and Blue Box Composition Data B-3
Table B1: Summary of 2012 Garbage Composition
Material Category
2012 Curbside
(Single Family
Dwellings)
Multi-Residential Total
Total
tonne/yr
% Blue
Box
Capturea
Total
tonne/yr
% Blue
Box
Capturea
Total
tonne/yr
% Blue
Box
Capture
Blue Box Recyclables
Paper 3,853 83% 3,510 42% 7,363 74%
Plastic 997 67% 657 30% 1,654 58%
Metal 652 66% 460 26% 1,112 57%
Glass 509 81% 436 35% 945 71%
Total Blue Box Recyclables 6,011 80% 5,063 39% 11,074 71%
Other Potential Blue Box Materials
Beverage Cups/Ice Cream
Containers 352
121
473
Expanded Polystyrene 256
83
339
Plastic Bags/Film 2,388
773
3,161
Total Other Potential Blue Box 2,996
977
3,973
Other
Municial Hazardous & Special
Waste 254
46
300
Food Waste 22,065
6,919
28,983
Yard Waste 1,193
312
1,504
Textiles 1,842
818
2,660
Construction & Demolition 1,899
843
2,742
Carpeting 958
426
1,384
Electronics 648
288
935
Other Non-recyclable Materials 19,784
7,209
26,993
Total Other 48,643
16,860
65,503
Grand Total 57,650
22,900
80,550
Notes
(a) Percentage of material that is not in the garbage (placed in Blue Box).

Appendix B: Garbage and Blue Box Composition Data B-4
Table B2: Estimated 2012 Curbside Garbage and Recycling Composition
Material Category
Materials
Accepted
in
London's
Blue Box
Program
Estimated Curbside Composition (Excludes Bulky Items)
City Per Household Blue Box
Material
Recycled
Material in
Garbage Total
Capture
Rate of Blue
Box
Materials
Blue Box
Material
Recycled
Material in
Garbage Total
tonne/yr tonne/yr tonne/yr kg/hhld/yr kg/hhld/yr kg/hhld/yr
1. PAPER
Newsprint X 7,228 359 7,587 95% 62 3 65
Magazines and Catalogues X 2,492 172 2,664 94% 21 1 23
Directories / Telephone Books X 138 30 167 82% 1 0.3 1.4
Mixed Fine Paper X 1,187 1,189 2,376 50% 10 10 20
Books X 438 145 583 75% 4 1 5
Other Printed Materials - Non-
Recycable 133 324 457 29% 1 3 4
Total Paper
11,614 2,220 13,834 84% 99 19 118
Targeted BB Paper
11,481 1,895 13,377 86% 98 16 114
2. PAPER PACKAGING
Gable Top Containers X 248 83 331 75% 2 0.7 3
Aseptic Containers X 83 67 150 55% 0.7 0.6 1.3
Spiral Wound Containers X 53 68 121 44% 0.5 0.6 1.0
Corrugated Cardboard X 3,821 616 4,437 86% 33 5 38
Boxboard / Cores (Tubes) X 2,655 1,125 3,780 70% 23 10 32
Polycoat Cups/Ice Cream
Containers 52 299 351 15% 0.4 3 3
Other Bleached Long
Polycoat Fibre 3 53 57 6% 0.0 0.5 0.5
Other Paper Laminate
Categories - Non-Recyclable 25 318 343 7% 0.2 3 3
Tissue/Toweling - Non-
Recyclable 13 3,205 3,218 0% 0.1 27 27
Total Paper Packaging
6,954 5,833 12,787 54% 59 50 109
Targeted BB Paper
Packaging 6,860 1,958 8,818 78% 58 17 75
3. PLASTICS
#1 PET X 1,269 397 1,666 76% 11 3 14
#2 HDPE X 460 159 620 74% 4 1 5
#3 - #7 Mixed Plastics X 306 408 714 43% 3 3 6
#6 PS - Expanded Polystyrene
19 256 275 7% 0.2 2 2
Large HDPE & PP Pails & Lids X 11 33 44 25% 0.1 0.3 0.4
LDPE/HDPE Film
141 2,388 2,529 6% 1 20 22
Plastic Laminates - Mostly
Non-Recyclable 31 946 977 3% 0.3 8 8
Other Rigid Plastic Packaging
- Mostly Non-Recyclable 171 575 746 23% 1 5 6
Other Plastics - Non-
Packaging/Durable - Non-
Recyclable
149 942 1,091 14% 1 8 9
Total Plastics
2,558 6,104 8,662 30% 22 52 74
Targeted BB Plastics
2,046 997 3,043 67% 17 8 26

Appendix B: Garbage and Blue Box Composition Data B-5
Table B2: Estimated 2012 Curbside Garbage and Recycling Composition (continued)
Material Category
Materials
Accepted
in
London's
Blue Box
Program
Estimated Curbside Composition (Excludes Bulky Items)
City Per Household Blue Box
Material
Recycled
Material in
Garbage Total
Capture
Rate of Blue
Box
Materials
Blue Box
Material
Recycled
Material in
Garbage Total
tonne/yr tonne/yr tonne/yr kg/hhld/yr kg/hhld/yr kg/hhld/yr
4. METALS
Aluminum- Food/Beverage
Containers X 430 112 542 79% 4 1 5
Aluminum - Foil and Trays X 26 165 191 14% 0.2 1.4 1.6
Steel - Food and Beverage
Containers X 760 222 981 77% 6 2 8
Steel/Aluminum - Aerosol
Containers (Non-MHSW) X 26 109 134 19% 0.2 0.9 1.1
Other Aluminum - Non-Blue
Box 0.0 11 11 0% 0.0 0.1 0.1
Other Steel - Non-Blue Box
37 457 493 7% 0.3 4 4
Total Metals
1,278 1,075 2,353 54% 11 9 20
Targeted BB Metals
1,242 608 1,849 67% 11 5 16
5. GLASS
Clear Glass X 1,591 469 2,060 77% 14 4 18
Coloured Glass X 518 40 557 93% 4 0.3 5
Other Glass - Non-Blue Box
128 335 463 28% 1 3 4
Total Glass
2,236 844 3,080 73% 19 7 26
Targeted BB Glass
2,109 509 2,618 81% 18 4 22
6. MUNICIPAL HAZARDOUS
AND SPECIAL WASTE
Paint & Stain Containers X 10 44 55 19% 0.1 0.4 0.5
Lubricating Oil Containers
5 7 11 40% 0.0 0.1 0.1
Batteries
2 106 108 2% 0.0 0.9 0.9
Other MHSW
30 101 131 23% 0.3 0.9 1.1
Total MHSW
47 258 305 15% 0.4 2 3
Targeted BB MHSW
10 44 55 19% 0.1 0.4 0.5
7. OTHER MATERIALS
Food Waste
0.0 22,065 22,065 0% 0.0 188 188
Yard Waste
0.0 1,193 1,193 0% 0.0 10 10
Diapers & Sanitary Products
0.0 3,492 3,492 0% 0.0 30 30
Textiles
0.0 1,842 1,842 0% 0.0 16 16
C&D
0.0 1,899 1,899 0% 0.0 16 16
Carpeting
0.0 958 958 0% 0.0 8 8
Electronics
0.0 648 648 0% 0.0 6 6
Other HSW
0.0 40 40 0% 0.0 0.3 0.3
Other Non-Recyclable
Materials 313 9,180 9,493 3% 3 78 81
Total Other Materials
313 41,316 41,629 1% 2.7 352 355
Total Targeted BB
23,749 6,011 29,760 80% 202 51 254
Grand Total
25,000 57,650 82,650 30% 213 491 705

Appendix B: Garbage and Blue Box Composition Data B-6
Table B3: Estimated 2012 Multi-Residential Garbage and Recycling Composition
Material Category
Materials
Accepted
in
London's
Program
Estimated Multi Residential Composition (excludes bulky items)
City Per Household
Blue Box
Material
Recycled
Material
in
Garbage
Material
in
Garbage Total
Capture
Rate of
Blue Box
Materials
Blue Box
Material
Recycled
Material in
Garbage Total
recycling
units
non-
recycling
units
recycling
units
recycling
units
tonne/yr tonne/yr tonne/yr tonne/yr
kg/hhld/yr kg/hhld/yr kg/hhld/yr
1. PAPER
Newsprint X 1,189 807 134 2,130 56% 25 17 42
Magazines and Catalogues X 410 291 47 748 55% 9 6 15
Directories / Telephone Books X 23 22 3 47 48% 0.5 0.5 1
Mixed Fine Paper X 195 437 43 675 29% 4 9 13
Books X 72 82 10 165 44% 1.5 1.7 3.2
Other Printed Materials - Non-
Recycable 22 100 8 131 17% 0.5 2 3
Total Paper
1,910 1,739 246 3,895 49% 40 37 77
Targeted BB Paper
1,888 1,639 238 3,765 50% 40 35 74
2. PAPER PACKAGING
Gable Top Containers X 39 89 9 137 29% 0.8 2 3
Aseptic Containers X 8 28 2 39 21% 0.2 0.6 0.8
Spiral Wound Containers X 6 29 2 38 17% 0.1 0.6 0.7
Corrugated Cardboard X 300 557 58 915 33% 6 12 18
Boxboard / Cores (Tubes) X 313 785 74 1,172 27% 7 17 23
Polycoat Cups/Ice Cream
Containers 6 97 7 110 6% 0.1 2 2
Other Bleached Long
Polycoat Fibre 0.4 16 1 18 2% 0.0 0.3 0.4
Other Paper Laminate
Categories - Non-Recyclable 3 98 7 108 3% 0.1 2 2
Tissue/Toweling - Non-
Recyclable 2 944 64 1,009 0% 0.0 20 20
Total Paper Packaging
678 2,642 224 3,543 19% 14 56 70
Targeted BB Paper Packaging
667 1,488 145 2,300 29% 14 31 45
3. PLASTICS
#1 PET X 177 306 32 515 34% 4 6 10
#2 HDPE X 64 115 12 192 33% 1 2 4
#3 - #7 Mixed Plastics X 43 165 14 222 19% 1 3 4
#6 PS - Expanded Polystyrene
3 78 5 86 3% 0.1 2 2
Large HDPE & PP Pails & Lids X 2 11 1 14 11% 0.0 0.2 0.3
LDPE/HDPE Film
20 723 50 792 2% 0.4 15 16
Plastic Laminates - Mostly Non-
Recyclable 4 283 19 306 1% 0.1 6 6
Other Rigid Plastic Packaging
- Mostly Non-Recyclable 24 195 15 233 10% 0.5 4 5
Other Plastics - Non-
Packaging/Durable - Non-
Recyclable
21 299 22 341 6% 0.4 6 7
Total Plastics
356 2,174 170 2,701 13% 7 46 53
Targeted BB Plastics
285 598 59 942 30% 6 13 19

Appendix B: Garbage and Blue Box Composition Data B-7
Table B3: Estimated 2012 Multi-Residential Garbage and Recycling Composition (continued)
Material Category
Materials
Accepted
in
London's
Program
Estimated Multi Residential Composition (excludes bulky items)
City Per Household
Blue Box
Material
Recycled
Material
in
Garbage
Material
in
Garbage Total
Capture
Rate of
Blue Box
Materials
Blue Box
Material
Recycled
Material in
Garbage Total
recycling
units
non-
recycling
units
recycling
units
recycling
units
tonne/yr tonne/yr tonne/yr tonne/yr
kg/hhld/yr kg/hhld/yr kg/hhld/yr
4. METALS
Aluminum- Food/Beverage
Containers X 56 114 11 182 31% 1 2 4
Aluminum - Foil and Trays X 3 57 4 65 5% 0.1 1.2 1.3
Steel - Food and Beverage
Containers X 100 209 21 329 30% 2 4 6
Steel/Aluminum - Aerosol
Containers (Non-MHSW) X 3 39 3 46 7% 0.1 0.8 0.9
Other Aluminum - Non-Blue
Box 0.0 3.3 0.2 3.6 0% 0.0 0.1 0.1
Other Steel - Non-Blue Box
4 117 8 129 3% 0.1 2 3
Total Metals
167 539 48 754 22% 4 11 15
Targeted BB Metals
163 419 39 621 26% 3 9 12
5. GLASS
Clear Glass X 188 338 35 561 34% 4 7 11
Coloured Glass X 43 57 7 106 40% 1 1 2
Other Glass - Non-Blue Box
29 197 15 241 12% 0.6 4 5
Total Glass
260 591 57 908 29% 5 12 18
Targeted BB Glass
231 394 42 668 35% 5 8 13
6. MUNICIPAL HAZARDOUS
AND SPECIAL WASTE
Paint & Stain Containers X 0.2 1 0.1 1 17% 0.0 0.0 0.0
Lubricating Oil Containers
0.5 0.8 0.1 1 37% 0.0 0.0 0.0
Batteries
0.2 13 1 14 1% 0.0 0.3 0.3
Other MHSW
4 12 1 17 21% 0.1 0.3 0.3
Total MHSW
5 27 2 34 13% 0.1 1 0.7
Targeted BB MHSW
0.2 1 0.1 1 17% 0.0 0.0 0.0
7. OTHER MATERIALS
Food Waste
0.0 6,482 437 6,919 0% 0.0 136 136
Yard Waste
0.0 292 20 312 0% 0.0 6 6
Diapers & Sanitary Products
0.0 684 46 730 0% 0.0 14 14
Textiles
0.0 767 52 818 0% 0.0 16 16
C&D
0.0 790 53 843 0% 0.0 17 17
Carpeting
0.0 399 27 426 0% 0.0 8 8
Electronics
0.0 270 18 288 0% 0.0 6 6
Other HSW
0.0 17 1 18 0% 0.0 0.3 0.3
Other Non-Recyclable
Materials 125 3,820 266 4,211 3% 3 80 83
Total Other Materials
125 13,520 919 14,565 1% 0.0 198 198
Total Targeted BB
3,234 4,539 524 8,297 39% 68 96 164
Grand Total
3,500 21,234 1,666 26,400 13% 71 361 432

Appendix B: Garbage and Blue Box Composition Data B-8
Table B4: Estimated 2012 Garbage and Recycling Composition
Material Category
Materials
Accepted
in
London's
Program
Estimated Overall Composition (Excludes Bulky Items)
City Per Household Blue Box
Material
Recycled
Material in
Garbage Total
Capture
Rate of Blue
Box
Materials
Blue Box
Material
Recycled
Material in
Garbage Total
tonne/yr tonne/yr tonne/yr kg/hhld/yr kg/hhld/yr kg/hhld/yr
1. PAPER
Newsprint X 8,416 1,301 9,717 87% 50 8 58
Magazines and Catalogues X 2,902 510 3,412 85% 17 3 20
Directories / Telephone
Books X 160 54 214 75% 1 0.3 1.3
Mixed Fine Paper X 1,382 1,669 3,051 45% 8 10 18
Books X 510 238 748 68% 3 1 4
Other Printed Materials -
Non-Recycable 155 433 588 26% 0.9 3 3
Total Paper
13,525 4,205 17,729 76% 81 25 106
Targeted BB Paper
13,370 3,772 17,141 78% 80 22 102
2. PAPER PACKAGING
Gable Top Containers X 287 180 467 61% 2 1 3
Aseptic Containers X 90 97 187 48% 0.5 0.6 1.1
Spiral Wound Containers X 59 99 159 37% 0.4 0.6 0.9
Corrugated Cardboard X 4,122 1,231 5,352 77% 25 7 32
Boxboard / Cores (Tubes) X 2,968 1,983 4,952 60% 18 12 29
Polycoat Cups/Ice Cream
Containers 58 402 461 13% 0.3 2.4 3
Other Bleached Long
Polycoat Fibre 4 71 74 5% 0.0 0.4 0.4
Other Paper Laminate
Categories - Non-Recyclable 28 423 451 6% 0.2 3 3
Tissue/Toweling - Non-
Recyclable 14 4,212 4,226 0% 0.1 25 25
Total Paper Packaging
7,631 8,698 16,330 47% 45 52 97
Targeted BB Paper
Packaging 7,526 3,591 11,117 68% 45 21 66
3. PLASTICS
#1 PET X 1,446 735 2,181 66% 9 4 13
#2 HDPE X 524 287 811 65% 3 2 5
#3 - #7 Mixed Plastics X 348 588 936 37% 2 3 6
#6 PS - Expanded
Polystyrene 22 339 361 6% 0.1 2 2
Large HDPE & PP Pails & Lids X 12 45 57 22% 0.1 0.3 0
LDPE/HDPE Film
161 3,161 3,321 5% 1 19 20
Plastic Laminates - Mostly
Non-Recyclable 35 1,248 1,283 3% 0.2 7 8
Other Rigid Plastic
Packaging - Mostly Non-
Recyclable
195 784 980 20% 1 5 6
Other Plastics - Non-
Packaging/Durable - Non-
Recyclable
169 1,262 1,432 12% 1 8 9
Total Plastics
2,914 8,449 11,363 26% 17 50 68
Targeted BB Plastics
2,331 1,654 3,985 58% 14 10 24

Appendix B: Garbage and Blue Box Composition Data B-9
Table B4: Estimated 2012 Garbage and Recycling Composition (continued)
Material Category
Materials
Accepted
in
London's
Program
Estimated Overall Composition (Excludes Bulky Items)
City Per Household Blue Box
Material
Recycled
Material in
Garbage Total
Capture
Rate of Blue
Box
Materials
Blue Box
Material
Recycled
Material in
Garbage Total
tonne/yr tonne/yr tonne/yr kg/hhld/yr kg/hhld/yr kg/hhld/yr
4. METALS
Aluminum- Food/Beverage
Containers X 486 238 724 67% 3 1 4
Aluminum - Foil and Trays X 30 226 256 12% 0.2 1.3 1.5
Steel - Food and Beverage
Containers X 859 451 1,311 66% 5 3 8
Steel/Aluminum - Aerosol
Containers (Non-MHSW) X 29 151 180 16% 0.2 0.9 1
Other Aluminum - Non-Blue
Box 0.0 14 14 0% 0.0 0.1 0.1
Other Steel - Non-Blue Box
40 582 622 6% 0.2 3 4
Total Metals
1,445 1,662 3,107 47% 9 10 18
Targeted BB Metals
1,404 1,066 2,470 57% 8 6 15
5. GLASS
Clear Glass X 1,779 842 2,621 68% 11 5 16
Coloured Glass X 561 103 664 84% 3 1 4
Other Glass - Non-Blue Box
156 547 703 22% 0.9 3 4
Total Glass
2,496 1,492 3,988 63% 15 9 24
Targeted BB Glass
2,340 945 3,285 71% 14 6 20
6. MUNICIPAL HAZARDOUS
AND SPECIAL WASTE
Paint & Stain Containers X 11 46 56 19% 0.1 0.3 0.3
Lubricating Oil Containers
5 8 13 40% 0.0 0.0 0.1
Batteries
2 120 122 2% 0.0 0.7 0.3
Other MHSW
33 114 148 23% 0.2 1 1
Total MHSW
51 288 339 15% 0.3 2 2
Targeted BB MHSW
11 46 56 19% 0.1 0.3 0.3
7. OTHER MATERIALS
Food Waste
0.0 28,983 28,983 0% 0.0 173 173
Yard Waste
0.0 1,504 1,504 0% 0.0 9 9
Diapers & Sanitary Products
0.0 4,222 4,222 0% 0.0 25 25
Textiles
0.0 2,660 2,660 0% 0.0 16 16
C&D
0.0 2,742 2,742 0% 0.0 16 16
Carpeting
0.0 1,384 1,384 0% 0.0 8 8
Electronics
0.0 935 935 0% 0.0 6 6
Other HSW
0.0 58 58 0% 0.0 0.3 0.3
Other Non-Recyclable
Materials 439 13,266 13,705 3% 3 79 82
Total Other Materials
439 55,756 56,195 1% 0.0 247 247
Total Targeted BB
26,982 11,074 38,056 71% 161 66 227
Grand Total
28,500 80,550 109,050 26% 167 395 561
Appendix B: Garbage and Blue Box Composition Data B-10
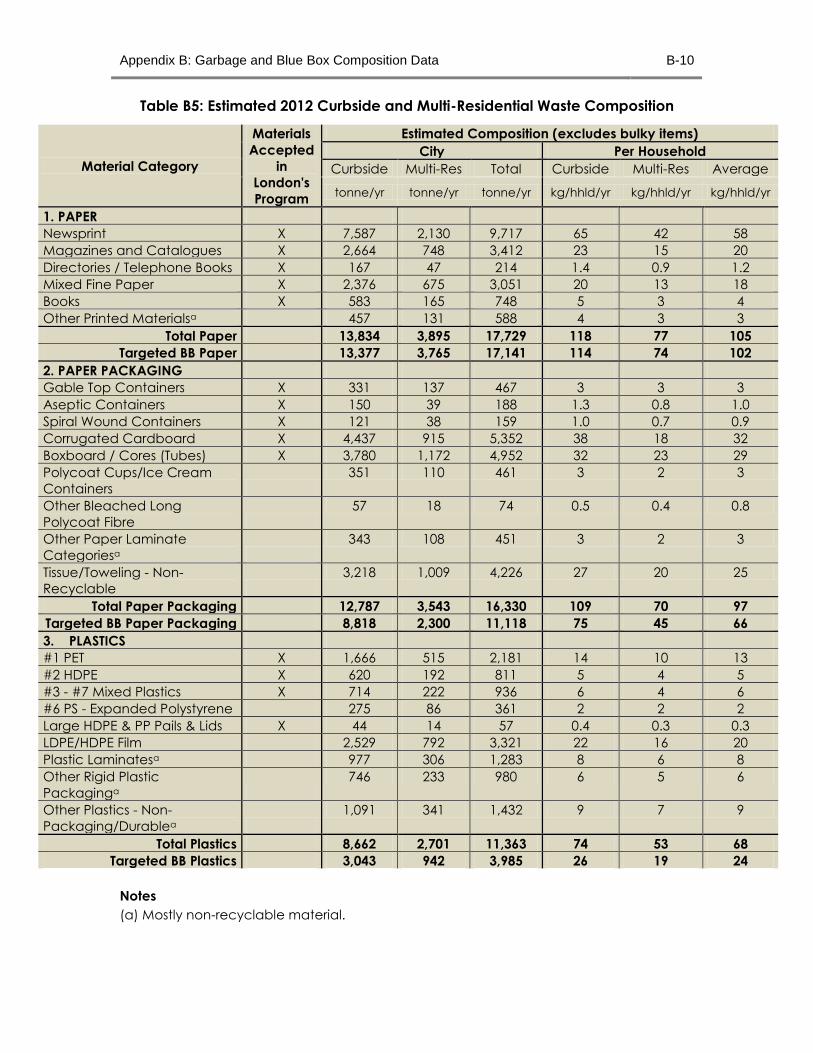
Table B5: Estimated 2012 Curbside and Multi-Residential Waste Composition
Material Category
Materials
Accepted
in
London's
Program
Estimated Composition (excludes bulky items)
City Per Household
Curbside Multi-Res Total Curbside Multi-Res Average
tonne/yr tonne/yr tonne/yr kg/hhld/yr kg/hhld/yr kg/hhld/yr
1. PAPER
Newsprint X 7,587 2,130 9,717 65 42 58
Magazines and Catalogues X 2,664 748 3,412 23 15 20
Directories / Telephone Books X 167 47 214 1.4 0.9 1.2
Mixed Fine Paper X 2,376 675 3,051 20 13 18
Books X 583 165 748 5 3 4
Other Printed Materialsa 457 131 588 4 3 3
Total Paper 13,834 3,895 17,729 118 77 105
Targeted BB Paper 13,377 3,765 17,141 114 74 102
2. PAPER PACKAGING
Gable Top Containers X 331 137 467 3 3 3
Aseptic Containers X 150 39 188 1.3 0.8 1.0
Spiral Wound Containers X 121 38 159 1.0 0.7 0.9
Corrugated Cardboard X 4,437 915 5,352 38 18 32
Boxboard / Cores (Tubes) X 3,780 1,172 4,952 32 23 29
Polycoat Cups/Ice Cream
Containers
351 110 461 3 2 3
Other Bleached Long
Polycoat Fibre
57 18 74 0.5 0.4 0.8
Other Paper Laminate
Categoriesa
343 108 451 3 2 3
Tissue/Toweling - Non-
Recyclable
3,218 1,009 4,226 27 20 25
Total Paper Packaging 12,787 3,543 16,330 109 70 97
Targeted BB Paper Packaging 8,818 2,300 11,118 75 45 66
3. PLASTICS
#1 PET X 1,666 515 2,181 14 10 13
#2 HDPE X 620 192 811 5 4 5
#3 - #7 Mixed Plastics X 714 222 936 6 4 6
#6 PS - Expanded Polystyrene 275 86 361 2 2 2
Large HDPE & PP Pails & Lids X 44 14 57 0.4 0.3 0.3
LDPE/HDPE Film 2,529 792 3,321 22 16 20
Plastic Laminatesa 977 306 1,283 8 6 8
Other Rigid Plastic
Packaginga
746 233 980 6 5 6
Other Plastics - Non-
Packaging/Durablea
1,091 341 1,432 9 7 9
Total Plastics 8,662 2,701 11,363 74 53 68
Targeted BB Plastics 3,043 942 3,985 26 19 24
Notes
(a) Mostly non-recyclable material.

Appendix B: Garbage and Blue Box Composition Data B-11
Table B5: Estimated 2012 Curbside and Multi-Residential Waste Composition (continued)
Material Category
Materials
Accepted
in
London's
Program
Estimated Composition (excludes bulky items)
City Per Household
Curbside Multi-Res Total Curbside Multi-Res Average
tonne/yr tonne/yr tonne/yr kg/hhld/yr kg/hhld/yr kg/hhld/yr
4. METALS
Aluminum- Food/Beverage
Containers X
542 182 724 5 4 4
Aluminum - Foil and Trays X 191 65 256 2 1 2
Steel - Food and Beverage
Containers X 981 329 1,311 8 6 8
Steel/Aluminum - Aerosol
Containers X
134 46 180 1 1 1
Other Aluminum - Non-Blue
Box
10.5 3.6 14 0.1 0.1 0.1
Other Steel - Non-Blue Box 493 129 622 4 3 4
Total Metals 2,353 754 3,107 20 15 18
Targeted BB Metals 1,849 621 2,470 16 12 15
5. GLASS
Clear Glass X 2,060 561 2,621 18 11 16
Coloured Glass X 557 106 664 5 2 4
Other Glass - Non-Blue Box 463 241 703 4 5 4
Total Glass 3,080 908 3,988 26 18 24
Targeted BB Glass 2,618 668 3,285 22 13 20
6. MUNICIPAL HAZARDOUS
AND SPECIAL WASTE
Paint & Stain Containers X 55 1 56 0.5 0.03 0.2
Lubricating Oil Containers 11 1 13 0.1 0.0 0.1
Batteries 108 14 122 1 0.3 1
Other MHSW 131 17 148 1 0 1
Total MHSW 305 34 339 3 1 2
Targeted BB MHSW 55 1 56 0.5 0.0 0.2
7. OTHER MATERIALS
Food Waste 22,065 6,919 28,983 188 136 173
Yard Waste 1,193 312 1,504 10 6 9
Diapers & Sanitary Products 3,492 730 4,222 30 14 25
Textiles 1,842 818 2,660 16 16 16
C&D 1,899 843 2,742 16 17 16
Carpeting 958 426 1,384 8 8 8
Electronics 648 288 935 6 6 6
Other HSW 40 18 58 0.3 0.3 0.3
Other Non-Recyclable
Materials 9,493 4,211 13,704 81 83 82
Total Other Materials 31,449 10,048 56,194 268 198 247
Total Targeted BB 29,760 8,297 38,056 254 164 226
Grand Total 72,470 21,883 109,050 618 432 562

Appendix B: Garbage and Blue Box Composition Data B-12
Table B6: Estimated 2016 Curbside and Multi-Residential Waste Composition
Material Category
Materials
Accepted
in
London's
Program
Estimated Curbside Composition (excludes bulky items)
City Per Household
Curbside Multi-Res Total Curbside Multi-Res Average
tonne/yr tonne/yr tonne/yr kg/hhld/yr kg/hhld/yr kg/hhld/yr
1. PAPER
Newsprint X 6,959 2,152 9,111 57 37 51
Magazines and Catalogues X 2,572 796 3,368 21 14 19
Directories / Telephone Books X 135 42 176 1 1 1
Mixed Fine Paper X 2,562 801 3,363 21 14 19
Books X 610 190 799 5 3 4
Other Printed Materials - Non-
Recycable 478 150 629 4 3 3
Total Paper
13,316 4,130 17,446 109 71 97
Targeted BB Paper
12,837 3,980 16,817 105 68 94
2. PAPER PACKAGING
Gable Top Containers X 389 177 565 3 3 3
Aseptic Containers X 176 50 226 1 1 1
Spiral Wound Containers X 136 47 183 1 1 1
Corrugated Cardboard X 5,141 1,167 6,309 42 20 35
Boxboard / Cores (Tubes) X 3,954 1,350 5,304 32 23 29
Polycoat Cups/Ice Cream
Containers 395 136 532 3 2 3
Other Bleached Long
Polycoat Fibre 64 22 86 0.5 0.4 0.5
Other Paper Laminate
Categories - Non-Recyclable 387 133 520 3 2 3
Tissue/Toweling - Non-
Recyclable 3,366 1,162 4,528 27 20 25
Total Paper Packaging
14,007 4,244 18,251 114 73 102
Targeted BB Paper Packaging
9,796 2,790 12,586 80 48 70
3. PLASTICS
#1 PET X 1,904 648 2,551 16 11 14
#2 HDPE X 628 214 842 5 4 5
#3 - #7 Mixed Plastics X 804 275 1,079 7 5 6
#6 PS - Expanded Polystyrene
244 84 328 2 1 2
Large HDPE & PP Pails & Lids X 46 16 61 0.4 0.3 0.3
LDPE/HDPE Film
2,564 884 3,449 21 15 19
Plastic Laminates - Mostly
Non-Recyclable 1,117 385 1,502 9 7 8
Other Rigid Plastic Packaging
- Mostly Non-Recyclable 925 318 1,243 8 5 7
Other Plastics - Non-
Packaging/Durable - Non-
Recyclable
1,141 393 1,534 9 7 9
Total Plastics
9,371 3,217 12,589 76 55 70
Targeted BB Plastics
3,381 1,153 4,534 28 20 25

Appendix B: Garbage and Blue Box Composition Data B-13
Table B6: Estimated 2016 Curbside and Multi-Residential Waste Composition (continued)
Material Category
Materials
Accepted
in
London's
Program
Estimated Curbside Composition (excludes bulky items)
City Per Household
Curbside Multi-Res Total Curbside Multi-Res Average
tonne/yr tonne/yr tonne/yr kg/hhld/yr kg/hhld/yr kg/hhld/yr
4. METALS
Aluminum- Food/Beverage
Containers X 550 203 752 4 3 4
Aluminum - Foil and Trays X 194 72 266 2 1 1
Steel - Food and Beverage
Containers X 963 356 1,319 8 6 7
Steel/Aluminum - Aerosol
Containers (Non-MHSW) X 141 52 193 1 1 1
Other Aluminum - Non-Blue
Box 11.0 4.1 15 0.1 0.1 0.1
Other Steel - Non-Blue Box
516 148 664 4 3 4
Total Metals
2,375 836 3,211 19 14 18
Targeted BB Metals
1,848 684 2,531 15 12 14
5. GLASS
Clear Glass X 1,956 587 2,543 16 10 14
Coloured Glass X 529 111 641 4 2 4
Other Glass - Non-Blue Box
484 277 761 4 5 4
Total Glass
2,969 975 3,944 24 17 22
Targeted BB Glass
2,485 698 3,183 20 12 18
6. MUNICIPAL HAZARDOUS
AND SPECIAL WASTE
Paint & Stain Containers X 57 2 59 0.5 0.03 0.3
Lubricating Oil Containers
12 2 14 0.1 0.0 0.1
Batteries
113 16 129 1 0.3 1
Other MHSW
137 20 156 1 0 1
Total MHSW
319 39 358 3 1 2
Targeted BB MHSW
57 2 59 0.5 0.0 0.3
7. OTHER MATERIALS
Food Waste
23,080.5 7,969 31,050 188 136 173
Yard Waste
1,248 359 1,607 10 6 9
Diapers & Sanitary Products
3,653 841 4,493 30 14 25
Textiles
1,927 943 2,870 16 16 16
C&D
1,986 972 2,958 16 17 16
Carpeting
1,003 490 1,493 8 8 8
Electronics
678 331 1,009 6 6 6
Other HSW
42 20 62 0.3 0.3 0.3
Other Non-Recyclable
Materials 9,930 4,851 14,781 81 83 82
Total Other Materials
32,896.6 11,574 44,470 268 198 247
Total Targeted BB
30,405 9,306 39,711 248 159 221
Grand Total
75,254 25,015 100,270 613 428 558

Appendix B: Garbage and Blue Box Composition Data B-14
Table B7: Estimated 2025 Curbside and Multi-Residential Waste Composition
Material Category
Materials
Accepted
in
London's
Program
Estimated Curbside Composition (excludes bulky items)
City Per Household
Curbside Multi-Res Total Curbside Multi-Res Average
tonne/yr tonne/yr tonne/yr kg/hhld/yr kg/hhld/yr kg/hhld/yr
1. PAPER
Newsprint X 5,293 1,626 6,919 39 25 35
Magazines and Catalogues X 2,323 714 3,037 17 11 15
Directories / Telephone
Books X 49 15 64 0.4 0.2 0.3
Mixed Fine Paper X 3,039 944 3,983 22 15 20
Books X 678 209 887 5 3 4
Other Printed Materials -
Non-Recycable 532 166 698 4 3 3
Total Paper
11,914 3,674 15,588 87 57 78
Targeted BB Paper
11,382 3,508 14,890 83 54 75
2. PAPER PACKAGING
Gable Top Containers X 538 243 782 4 4 4
Aseptic Containers X 244 69 312 2 1 2
Spiral Wound Containers X 176 60 236 1 1 1
Corrugated Cardboard X 6,966 1,571 8,537 51 24 43
Boxboard / Cores (Tubes) X 4,395 1,491 5,886 32 23 29
Polycoat Cups/Ice Cream
Containers 510 175 685 4 3 3
Other Bleached Long
Polycoat Fibre 82 28 111 1 0.4 1
Other Paper Laminate
Categories - Non-Recyclable 499 171 670 4 3 3
Tissue/Toweling - Non-
Recyclable 3,741 1,283 5,025 27 20 25
Total Paper Packaging
17,152 5,091 22,243 126 79 112
Targeted BB Paper
Packaging 12,319 3,434 15,753 90 53 79
3. PLASTICS
#1 PET X 2,519 852 3,370 18 13 17
#2 HDPE X 648 219 868 5 3 4
#3 - #7 Mixed Plastics X 1,036 353 1,389 8 5 7
#6 PS - Expanded
Polystyrene 160 55 215 1 1 1
Large HDPE & PP Pails & Lids X 51 17 68 0.4 0.3 0.3
LDPE/HDPE Film
2,647 907 3,554 19 14 18
Plastic Laminates - Mostly
Non-Recyclable 1,477 506 1,984 11 8 10
Other Rigid Plastic
Packaging - Mostly Non-
Recyclable
1,389 474 1,863 10 7 9
Other Plastics - Non-
Packaging/Durable - Non-
Recyclable
1,268 434 1,702 9 7 9
Total Plastics
11,195 3,817 15,012 82 59 75
Targeted BB Plastics
4,254 1,441 5,695 31 22 29

Appendix B: Garbage and Blue Box Composition Data B-15
Table B7: Estimated 2025 Curbside and Multi-Residential Waste Composition (continued)
Material Category
Materials
Accepted
in
London's
Program
Estimated Curbside Composition (excludes bulky items)
City Per Household
Curbside Multi-Res Total Curbside Multi-Res Average
tonne/yr tonne/yr tonne/yr kg/hhld/yr kg/hhld/yr kg/hhld/yr
4. METALS
Aluminum - Food/Beverage
Containers X 567 208 775 4 3 4
Aluminum - Foil and Trays X 200 74 274 1 1 1
Steel - Food and Beverage
Containers X 913 335 1,248 7 5 6
Steel/Aluminum - Aerosol
Containers (Non-MHSW) X 156 58 214 1 1 1
Other Aluminum - Non-Blue
Box 12.2 4.5 17 0.1 0.1 0.1
Other Steel - Non-Blue Box
574 164 738 4 3 4
Total Metals
2,423 844 3,266 18 13 16
Targeted BB Metals
1,837 675 2,512 13 10 13
5. GLASS
Clear Glass X 1,677 500 2,177 12 8 11
Coloured Glass X 454 95 549 3 1 3
Other Glass - Non-Blue Box
538 306 844 4 5 4
Total Glass
2,669 901 3,569 20 14 18
Targeted BB Glass
2,131 595 2,725 16 9 14
6. MUNICIPAL HAZARDOUS
AND SPECIAL WASTE
Paint & Stain Containers X 64 2 65 0 0.0 0.3
Lubricating Oil Containers
13 2 15 0.1 0.0 0.1
Batteries
126 18 144 1 0.3 1
Other MHSW
152 22 174 1 0 1
Total MHSW
355 43 398 3 1 2
Targeted BB MHSW
64 2 65 0 0.0 0.3
7. OTHER MATERIALS
Food Waste
25,658 8,802 34,459 188 136 173
Yard Waste
1,387 397 1,783 10 6 9
Diapers & Sanitary Products
4,060 929 4,989 30 14 25
Textiles
2,142 1,041 3,183 16 16 16
C&D
2,208 1,073 3,281 16 17 16
Carpeting
1,115 542 1,656 8 8 8
Electronics
753 366 1,119 6 6 6
Other HSW
46 23 69 0.3 0.3 0.3
Other Non-Recyclable
Materials 11,038 5,358 16,396 81 83 82
Total Other Materials
36,570 12,783 49,352 268 198 247
Total Targeted BB
31,986 9,655 41,640 234 150 209
Grand Total
82,276 27,153 109,429 603 421 548

Appendix B: Garbage and Blue Box Composition Data B-16
Table B8: Assumed Change 2016 to Per Household Generation
Material Assumed Change
2016 to Per Household
Generationa
Assumed Change
2025 to Per Household
Generationb
Newspaper -12% -40%
Telephone Books -23% -75%
Old Magazines -8% -25%
Other Printed Paper 3% 10%
OCC 11% 35%
Gable Top 12% 40%
Paper Laminates 8% 25%
Aseptic 12% 40%
OBB 0% 0%
PET 9% 30%
HDPE -3% -10%
PS -15% -50%
Film -3% -10%
Plastic Laminates 9% 30%
Other Plastics 18% 60%
Aluminum Food & Beverage Cans -3% -10%
Foil and Other Aluminum -3% -10%
Steel Cans -6% -20%
Aerosol 0% 0%
Paint Cans -9% -30%
Food & Beverage Glass Clear -9% -30%
Food & Beverage Glass Coloured -9% -30%
Notes
(a) Assumed to be 30% of the estimated change for the year 2025.
(b) From Executive Summary a Study of the Optimization of the Blue Box Material
Processing System in Ontario Final Report (Waste Diversion Organization, 2012)

Appendix B: Garbage and Blue Box Composition Data B-17
Table B9: Estimated 2016 Garbage and Blue Box Composition – Base Case
Material Category
Materials
Accepted in
London's
Program
Estimated 2016 Garbage
and Blue Box Composition
Blue Box Garbage Total Capture
tonne/yr tonne/yr tonne/yr Rate
1. PAPER
Newsprint X 8,502 1,215 9,717 88%
Magazines and Catalogues X 2,986 427 3,412 88%
Directories / Telephone Books X 188 27 214 88%
Mixed Fine Paper X 1,373 1,678 3,051 45%
Books X 570 178 748 76%
Other Printed Materials - Non-Recyclable 0.0 588 588 0%
Total Paper 13,618 4,111 17,729 77%
Targeted BB Paper 13,618 3,523 17,141 79%
2. PAPER PACKAGING
Gable Top Containers X 304 164 467 65%
Aseptic Containers X 101 87 188 54%
Spiral Wound Containers X 69 89 159 44%
Corrugated Cardboard X 4,282 1,070 5,352 80%
Boxboard / Cores (Tubes) X 3,219 1,733 4,952 65%
Polycoat Cups/Ice Cream Containers X 202 259 461 44%
Other Bleached Long Polycoat Fibre X 0.0 74 74 0%
Other Paper Laminate Categories - Non-
Recyclable
0.0 451 451 0%
Tissue/Toweling - Non-Recyclable 0.0 4,226 4,226 0%
Total Paper Packaging 8,176 8,154 16,330 50%
Targeted BB Paper Packaging 7,975 3,143 11,118 72%
3. PLASTICS
#1 PET X 1,527 654 2,181 70%
#2 HDPE X 568 243 811 70%
#3 - #7 Mixed Plastics X 374 562 936 40%
#6 PS - Expanded Polystyrene X 0.0 361 361 0%
Large HDPE & PP Pails & Lids X 20 37 57 35%
LDPE/HDPE Film 141 3,180 3,321 4%
Plastic Laminates - Mostly Non-Recyclable 0.0 1,283 1,283 0%
Other Rigid Plastic Packaging - Mostly Non-
Recyclable 0.0 980 980 0%
Other Plastics - Non-Packaging/Durable -
Non-Recyclable
0.0 1,432 1,432 0%
Total Plastics 2,630 8,733 11,363 23%
Targeted BB Plastics 2,489 1,496 3,985 62%

Appendix B: Garbage and Blue Box Composition Data B-18
Table B9: Estimated 2016 Garbage and Blue Box Composition – Base Case (continued)
Material Category
Materials
Accepted in
London's
Program
Estimated 2016 Garbage
and Blue Box Composition
Blue Box Garbage Total Capture
tonne/yr tonne/yr tonne/yr Rate
4. METALS
Aluminum- Food/Beverage Containers X 507 217 724 70%
Aluminum - Foil and Trays X 27 229 256 11%
Steel - Food and Beverage Containers X 917 393 1,311 70%
Steel/Aluminum - Aerosol Containers (Non-
MHSW) X 63 117 180 35%
Other Aluminum - Non-Blue Box 0.0 14 14 0%
Other Steel - Non-Blue Box 218 404 622 35%
Total Metals 1,732 1,375 3,107 56%
Targeted BB Metals 1,514 957 2,470 61%
5. GLASS
Clear Glass X 1,835 786 2,621 70%
Coloured Glass X 523 141 664 79%
Other Glass - Non-Blue Box
0.0 703 703 0%
Total Glass
2,358 1,631 3,988 59%
Targeted BB Glass
2,358 927 3,285 72%
6. MUNICIPAL HAZARDOUS AND SPECIAL
WASTE
Paint & Stain Containers X 15 41 56 28%
Lubricating Oil Containers X 6 7 13 48%
Batteries
0.0 122 122 0%
Other MHSW
0.0 148 148 0%
Total MHSW
22 317 339 6%
Targeted BB MHSW
15 41 56 28%
7. OTHER MATERIALS
Food Waste
0.0 28,983 28,983 0%
Yard Waste
0.0 1,504 1,504 0%
Diapers & Sanitary Products
0.0 4,222 4,222 0%
Textiles
0.0 2,660 2,660 0%
C&D
0.0 2,742 2,742 0%
Carpeting
0.0 1,384 1,384 0%
Electronics
0.0 935 935 0%
Other HSW
0.0 58 58 0%
Other Non-Recyclable Materials
0.0 13,704 13,704 0%
Total Other Materials
0.0 41,497 41,497 0%
Total Targeted BB
27,969 10,088 38,056 73%
Grand Total
28,535 65,818 94,353 30%

Appendix B: Garbage and Blue Box Composition Data B-19
Table B10: Estimated 2025 Garbage and Blue Box Composition – Base Case
Material Category
Materials
Accepted in
London's
Program
Estimated 2025 - Natural Cap. Garbage and
Blue Box Composition
Blue Box Garbage Total Capture
tonne/yr tonne/yr tonne/yr Rate
1. PAPER
Newsprint X 6,227 692 6,919 90%
Magazines and Catalogues X 2,733 304 3,037 90%
Directories / Telephone Books X 57 6 64 90%
Mixed Fine Paper X 1,992 1,992 3,983 50%
Books X 710 177 887 80%
Other Printed Materials - Non-Recyclable
0.0 698 698 0%
Total Paper
11,719 3,869 15,588 75%
Targeted BB Paper
11,719 3,171 14,890 79%
2. PAPER PACKAGING
Gable Top Containers X 547 235 782 70%
Aseptic Containers X 187 125 312 60%
Spiral Wound Containers X 118 118 236 50%
Corrugated Cardboard X 7,256 1,281 8,537 85%
Boxboard / Cores (Tubes) X 3,826 2,060 5,886 65%
Polycoat Cups/Ice Cream Containers X 342 342 685 50%
Other Bleached Long Polycoat Fibre X 0.0 111 111 0%
Other Paper Laminate Categories - Non-
Recyclable 0.0 670 670 0%
Tissue/Toweling - Non-Recyclable
0.0 5,025 5,025 0%
Total Paper Packaging
12,277 9,966 22,243 55%
Targeted BB Paper Packaging
11,935 3,818 15,753 76%
3. PLASTICS
#1 PET X 2,359 1,011 3,370 70%
#2 HDPE X 607 260 868 70%
#3 - #7 Mixed Plastics X 625 764 1,389 45%
#6 PS - Expanded Polystyrene X 0 215 215 0%
Large HDPE & PP Pails & Lids X 27 41 68 40%
LDPE/HDPE Film
178 3,376 3,554 5%
Plastic Laminates - Mostly Non-Recyclable
0.0 1,984 1,984 0%
Other Rigid Plastic Packaging - Mostly Non-
Recyclable 0.0 1,863 1,863 0%
Other Plastics - Non-Packaging/Durable -
Non-Recyclable 0.0 1,702 1,702 0%
Total Plastics
3,796 11,216 15,012 25%
Targeted BB Plastics
3,619 2,076 5,695 64%

Appendix B: Garbage and Blue Box Composition Data B-20
Table B10: Estimated 2025 Garbage and Blue Box Composition – Base Case (continued)
Material Category
Materials
Accepted in
London's
Program
Estimated 2025 - Natural Cap. Garbage and
Blue Box Composition
Blue Box Garbage Total Capture
tonne/yr tonne/yr tonne/yr Rate
4. METALS
Aluminum- Food/Beverage Containers X 543 233 775 70%
Aluminum - Foil and Trays X 41 233 274 15%
Steel - Food and Beverage Containers X 874 374 1,248 70%
Steel/Aluminum - Aerosol Containers (Non-
MHSW) X 86 129 214 40%
Other Aluminum - Non-Blue Box
0.0 17 17 0%
Other Steel - Non-Blue Box
295 443 738 40%
Total Metals
1,838 1,428 3,266 56%
Targeted BB Metals
1,543 969 2,512 61%
5. GLASS
Clear Glass X 1,741 435 2,177 80%
Coloured Glass X 439 110 549 80%
Other Glass - Non-Blue Box
0.0 844 844 0%
Total Glass
2,180 1,389 3,569 61%
Targeted BB Glass
2,180 545 2,725 80%
6. MUNICIPAL HAZARDOUS AND SPECIAL
WASTE
Paint & Stain Containers X 20 46 65 30%
Lubricating Oil Containers X 8 8 15 50%
Batteries
0.0 144 144 0%
Other MHSW
0.0 174 174 0%
Total MHSW
27 371 398 7%
Targeted BB MHSW
20 46 65 30%
7. OTHER MATERIALS
Food Waste
0.0 34,459 34,459 0%
Yard Waste
0.0 1,783 1,783 0%
Diapers & Sanitary Products
0.0 4,989 4,989 0%
Textiles
0.0 3,183 3,183 0%
C&D
0.0 3,281 3,281 0%
Carpeting
0.0 1,656 1,656 0%
Electronics
0.0 1,119 1,119 0%
Other HSW
0.0 69 69 0%
Other Non-Recyclable Materials
0.0 16,396 16,396 0%
Total Other Materials
0.0 49,352 49,352 0%
Total Targeted BB
31,016 10,625 41,640 74%
Grand Total
31,838 77,591 109,429

Appendix B: Garbage and Blue Box Composition Data B-21
Table B11: Estimated 2025 Garbage and Blue Box Composition – High Increase in
Capture Rate
Material Category
Materials
Accepted in
London's
Program
Estimated 2025 - High Cap. Garbage and Blue
Box Composition
Blue Box Garbage Total Capture
tonne/yr tonne/yr tonne/yr Rate
1. PAPER
Newsprint X 6,227 692 6,919 90%
Magazines and Catalogues X 2,733 304 3,037 90%
Directories / Telephone Books X 57 6 64 90%
Mixed Fine Paper X 2,390 1,593 3,983 60%
Books X 799 89 887 90%
Other Printed Materials - Non-Recyclable
0.0 698 698 0%
Total Paper
12,206 3,382 15,588 78%
Targeted BB Paper
12,206 2,684 14,890 82%
2. PAPER PACKAGING
Gable Top Containers X 586 195 782 75%
Aseptic Containers X 234 78 312 75%
Spiral Wound Containers X 165 71 236 70%
Corrugated Cardboard X 7,683 854 8,537 90%
Boxboard / Cores (Tubes) X 4,120 1,766 5,886 70%
Polycoat Cups/Ice Cream Containers X 411 274 685 60%
Other Bleached Long Polycoat Fibre X 55 55 111 50%
Other Paper Laminate Categories - Non-
Recyclable 0.0 670 670 0%
Tissue/Toweling - Non-Recyclable
0.0 5,025 5,025 0%
Total Paper Packaging
13,255 8,988 22,243 60%
Targeted BB Paper Packaging
12,789 2,964 15,753 81%
3. PLASTICS
#1 PET X 2,528 843 3,370 75%
#2 HDPE X 651 217 868 75%
#3 - #7 Mixed Plastics X 694 694 1,389 50%
#6 PS - Expanded Polystyrene X 0.0 215 215 0%
Large HDPE & PP Pails & Lids X 34 34 68 50%
LDPE/HDPE Film
178 3,376 3,554 5%
Plastic Laminates - Mostly Non-Recyclable
0.0 1,984 1,984 0%
Other Rigid Plastic Packaging - Mostly Non-
Recyclable 0.0 1,863 1,863 0%
Other Plastics - Non-Packaging/Durable -
Non-Recyclable 0.0 1,702 1,702 0%
Total Plastics
4,084 10,928 15,012 27%
Targeted BB Plastics
3,907 1,788 5,695 69%

Appendix B: Garbage and Blue Box Composition Data B-22
Table B11: Estimated 2025 Garbage and Blue Box Composition – High Increase in
Capture Rate (continued)
Material Category
Materials
Accepted in
London's
Program
Estimated 2025 - High Cap. Garbage and Blue
Box Composition
Blue Box Garbage Total Capture
tonne/yr tonne/yr tonne/yr Rate
4. METALS
Aluminum- Food/Beverage Containers X 582 194 775 75%
Aluminum - Foil and Trays X 82 192 274 30%
Steel - Food and Beverage Containers X 936 312 1,248 75%
Steel/Aluminum - Aerosol Containers (Non-
MHSW) X 107 107 214 50%
Other Aluminum - Non-Blue Box
0.0 17 17 0%
Other Steel - Non-Blue Box
369 369 738 50%
Total Metals
2,076 1,191 3,266 64%
Targeted BB Metals
1,707 805 2,512 68%
5. GLASS
Clear Glass X 1,850 326 2,177 85%
Coloured Glass X 466 82 549 85%
Other Glass - Non-Blue Box
0.0 844 844 0%
Total Glass
2,316 1,253 3,569 65%
Targeted BB Glass
2,316 409 2,725 85%
6. MUNICIPAL HAZARDOUS AND SPECIAL
WASTE
Paint & Stain Containers X 33 33 65 50%
Lubricating Oil Containers X 8 8 15 50%
Batteries
0.0 144 144 0%
Other MHSW
0.0 174 174 0%
Total MHSW
40 358 398 10%
Targeted BB MHSW
33 33 65 50%
7. OTHER MATERIALS
Food Waste
0.0 34,459 34,459 0%
Yard Waste
0.0 1,783 1,783 0%
Diapers & Sanitary Products
0.0 4,989 4,989 0%
Textiles
0.0 3,183 3,183 0%
C&D
0.0 3,281 3,281 0%
Carpeting
0.0 1,656 1,656 0%
Electronics
0.0 1,119 1,119 0%
Other HSW
0.0 69 69 0%
Other Non-Recyclable Materials
0.0 16,396 16,396 0%
Total Other Materials
0.0 49,352 49,352 0%
Total Targeted BB
32,958 8,682 41,640 79%
Grand Total
33,978 75,451 109,429 31%

Appendix B: Garbage and Blue Box Composition Data B-23
Table B12: Capture Rates
Materials
Estimated 2012 Capture
Rates for London
Estimated Capture Rates
for Ontario from A study of
the Optiza of Blue Box
Material Processing System
in Ontarion (June, 2012)
Projected Short Term Change
London's Capture Rate (2016)
Projected Long
Term Change to
Overall London's
Capture Rate
Curbside Multi-
Residential Overall 2010
Natural
Growth
2025
High
Growth
2025
Curbside Multi-
Residential
Overall
Natural
Growth
2025
HIgh
Growth
2025
1. PAPER
Newsprint 95% 56% 87% 97% 98% 98% 95% 65% 88% 90% 90%
Magazines and Catalogues 94% 55% 85% 97% 98% 98% 95% 65% 88% 90% 90%
Directories / Telephone
books 82% 48% 75% 97% 98% 98% 95% 65% 88% 90% 90%
Mixed Fine Paper 50% 29% 45% 56% 60% 75% 50% 30% 45% 50% 60%
Books 75% 44% 68% - - - 85% 50% 76% 80% 90%
Other Printed Materials -Non
recycable 29% 17% 26% - - -
Total Paper 84% 49% 76%
Targeted BB Paper 86% 50% 78%
2. PAPER PACKAGING
Gable Top Containers 75% 29% 61% 34% 50% 75% 76% 32% 65% 70% 75%
Aseptic Containers 55% 21% 48% 12% 30% 75% 60% 35% 54% 60% 75%
Spiral wound containers 44% 17% 37% 1% 5% 30% 50% 25% 44% 50% 70%
Corrugated Cardboard 86% 33% 77% 87% 88% 95% 90% 50% 80% 85% 90%
Boxboard / cores (tubes) 70% 27% 60% 55% 60% 80% 75% 35% 65% 65% 70%
Polycoat cups/Ice Cream
Containers 15% 6% 13% 1% 5% 30% 50% 25% 44% 50% 60%
Other bleached long
polycoat fibre 6% 2% 5% 1% 5% 30% 0% 0% 0% 0% 50%
Other paper laminate
categories - Non recyclable 7% 3% 6% - - -
Tissue/Toweling - Non
recyclable 0% 0% 0% - - -
Total Paper Packaging 54% 19% 47%
Targeted BB Paper
Packaging 78% 29% 68%
3. PLASTICS
#1 PET 76% 34% 66% 61% 65% 75% 80% 40% 70% 70% 75%
#2 HDPE 74% 33% 65% 57% 60% 75% 80% 40% 70% 70% 75%
#3 - #7 Mixed Plastics 43% 19% 37% 19% 40% 60% 45% 25% 40% 45% 50%
#6 PS - Expanded
polystyrene 7% 3% 6% 4% 10% 50% 0% 0% 0% 0% 0%
Large HDPE & PP Pails & Lids 25% 11% 22% - - - 40% 20% 35% 40% 50%
LDPE/HDPE Film 6% 2% 5% 6% 15% 40% 5% 2% 4% 5% 5%
Plastic Laminates - mostly
non recyclables 3% 1% 3% 1% 1% 10% 0% 0% 0%
Other Rigid Plastic Packaging
- mostly non recyclable 23% 10% 20% - - -
0%
Other Plastics - non-
packaging/durable - Non
recyclable
14% 6% 12% - - -
Total Plastics 30% 13% 26%
Targeted BB Plastics 67% 30% 58%

Appendix B: Garbage and Blue Box Composition Data B-24
Table B12: Capture Rates (continued)
Materials
Estimated 2012 Capture
Rates for London
Estimated Capture Rates
for Ontario from A study of
the Optiza of Blue Box
Material Processing System
in Ontarion (June, 2012)
Projected Short Term Change
London's Capture Rate (2016)
Projected Long
Term Change to
Overall London's
Capture Rate
Curbside Multi-
Residential Overall 2010
Natural
Growth
2025
High
Growth
2025
Curbside Multi-
Residential
Overall
Natural
Growth
2025
HIgh
Growth
2025
4. METALS
Aluminum- food/Beverage
Containers 79% 31% 67% 50% 55% 75% 80% 40% 70% 70% 75%
Aluminum - foil and trays 14% 5% 12% 9% 20% 50% 12% 6% 11% 15% 30%
Steel - food and beverage
containers 77% 30% 66% 61% 65% 75% 80% 40% 70% 70% 75%
Steel/aluminum - aerosol
containers (non-MHSW) 19% 7% 16% 28% 30% 50% 40% 20% 35% 40% 50%
Other Aluminum - non-Blue
Box 0% 0% 0% - - -
Other steel - Non-Blue Box 7% 3% 6% - - - 40% 20% 35% 40% 50%
Total Metals 54% 22% 47%
Targeted BB Metals 67% 26% 57%
5. GLASS
Clear Glass 77% 34% 68% 89% 90% 95% 80% 40% 70% 80% 85%
Coloured Glass 93% 40% 84% 71% 72% 80% 90% 45% 79% 80% 85%
Other Glass - non-Blue Box 28% 12% 22% - - -
Total Glass 73% 29% 63%
Targeted BB Glass 81% 35% 71%
6. MUNICIPAL HAZARDOUS
AND SPECIAL WASTE
Paint & Stain containers 19% 17% 19% - - - 30% 20% 28% 30% 50%
Lubricating Oil Containers 40% 37% 40% - - - 50% 40% 48% 50% 50%
Batteries 2% 1% 2% - - -
Other MHSW 23% 21% 23% - - -
Total MHSW 15% 13% 15%
Targeted BB MHSW 19% 17% 19%
7. OTHER MATERIALS
Food Waste 0% 0% 0% - - -
Yard Waste 0% 0% 0% - - -
Diapers & Sanitary Products 0% 0% 0% - - -
Textiles 0% 0% 0% - - -
C&D 0% 0% 0% - - -
Carpeting 0% 0% 0% - - -
Electronics 0% 0% 0% - - -
Other HSW 0% 0% 0% - - -
Other non-recyclable
materials 3% 3% 3% - - -
Total Other Materials 1% 1% 1%
Total Targeted BB 80% 39% 71%
Grand Total 30% 13% 26%