GAO-09-656 Superfund: Litigation Has Decreased and EPA Needs ...
130
GAO United States Government Accountability Office Report to Congressional Requesters SUPERFUND Litigation Has Decreased and EPA Needs Better Information on Site Cleanup and Cost Issues to Estimate Future Program Funding Requirements July 2009 GAO-09-656
Transcript of GAO-09-656 Superfund: Litigation Has Decreased and EPA Needs ...
GAO United States Government Accountability Office
Report to Congressional Requesters
SUPERFUND
Litigation Has Decreased and EPA Needs Better Information on Site Cleanup and Cost Issues to Estimate Future Program Funding Requirements
July 2009
GAO-09-656
What GAO Found
United States Government Accountability Office
Why GAO Did This Study
HighlightsAccountability Integrity Reliability
July 2009 SUPERFUND
Litigation Has Decreased and EPA Needs Better Information on Site Cleanup and Cost Issues to Estimate Future Program Funding Requirements Highlights of GAO-09-656, a report to
congressional requesters
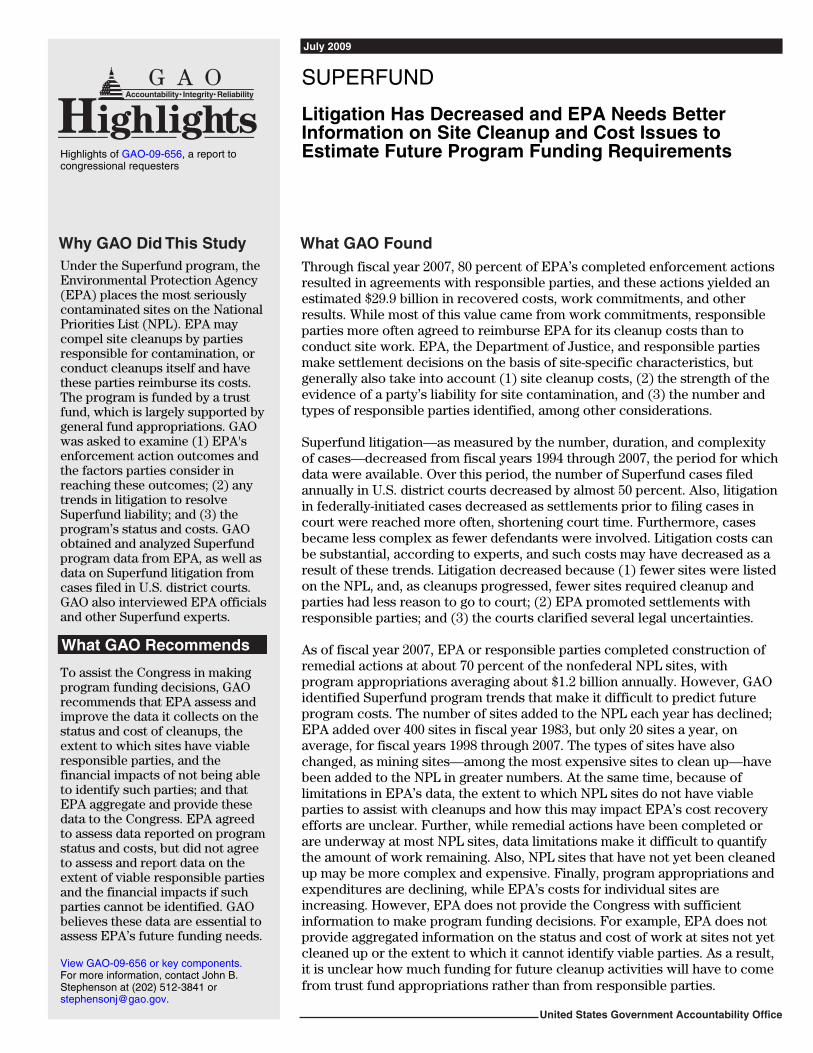
Under the Superfund program, the Environmental Protection Agency (EPA) places the most seriously contaminated sites on the National Priorities List (NPL). EPA may compel site cleanups by parties responsible for contamination, or conduct cleanups itself and have these parties reimburse its costs. The program is funded by a trust fund, which is largely supported by general fund appropriations. GAO was asked to examine (1) EPA's enforcement action outcomes and the factors parties consider in reaching these outcomes; (2) any trends in litigation to resolve Superfund liability; and (3) the program’s status and costs. GAO obtained and analyzed Superfund program data from EPA, as well as data on Superfund litigation from cases filed in U.S. district courts. GAO also interviewed EPA officials and other Superfund experts.
What GAO Recommends
To assist the Congress in making program funding decisions, GAO recommends that EPA assess and improve the data it collects on the status and cost of cleanups, the extent to which sites have viable responsible parties, and the financial impacts of not being able to identify such parties; and that EPA aggregate and provide these data to the Congress. EPA agreed to assess data reported on program status and costs, but did not agree to assess and report data on the extent of viable responsible parties and the financial impacts if such parties cannot be identified. GAO believes these data are essential to assess EPA’s future funding needs.
Through fiscal year 2007, 80 percent of EPA’s completed enforcement actions resulted in agreements with responsible parties, and these actions yielded an estimated $29.9 billion in recovered costs, work commitments, and other results. While most of this value came from work commitments, responsible parties more often agreed to reimburse EPA for its cleanup costs than to conduct site work. EPA, the Department of Justice, and responsible parties make settlement decisions on the basis of site-specific characteristics, but generally also take into account (1) site cleanup costs, (2) the strength of the evidence of a party’s liability for site contamination, and (3) the number and types of responsible parties identified, among other considerations. Superfund litigation—as measured by the number, duration, and complexity of cases—decreased from fiscal years 1994 through 2007, the period for which data were available. Over this period, the number of Superfund cases filed annually in U.S. district courts decreased by almost 50 percent. Also, litigation in federally-initiated cases decreased as settlements prior to filing cases in court were reached more often, shortening court time. Furthermore, cases became less complex as fewer defendants were involved. Litigation costs can be substantial, according to experts, and such costs may have decreased as a result of these trends. Litigation decreased because (1) fewer sites were listed on the NPL, and, as cleanups progressed, fewer sites required cleanup and parties had less reason to go to court; (2) EPA promoted settlements with responsible parties; and (3) the courts clarified several legal uncertainties. As of fiscal year 2007, EPA or responsible parties completed construction of remedial actions at about 70 percent of the nonfederal NPL sites, with program appropriations averaging about $1.2 billion annually. However, GAO identified Superfund program trends that make it difficult to predict future program costs. The number of sites added to the NPL each year has declined; EPA added over 400 sites in fiscal year 1983, but only 20 sites a year, on average, for fiscal years 1998 through 2007. The types of sites have also changed, as mining sites—among the most expensive sites to clean up—have been added to the NPL in greater numbers. At the same time, because of limitations in EPA’s data, the extent to which NPL sites do not have viable parties to assist with cleanups and how this may impact EPA’s cost recovery efforts are unclear. Further, while remedial actions have been completed or are underway at most NPL sites, data limitations make it difficult to quantify the amount of work remaining. Also, NPL sites that have not yet been cleaned up may be more complex and expensive. Finally, program appropriations and expenditures are declining, while EPA’s costs for individual sites are increasing. However, EPA does not provide the Congress with sufficient information to make program funding decisions. For example, EPA does not provide aggregated information on the status and cost of work at sites not yet cleaned up or the extent to which it cannot identify viable parties. As a result, it is unclear how much funding for future cleanup activities will have to come from trust fund appropriations rather than from responsible parties.
View GAO-09-656 or key components. For more information, contact John B. Stephenson at (202) 512-3841 or [email protected].
Page i GAO-09-656
Contents
Letter 1
Results in Brief 6 Background 10 EPA Resolves Most Enforcement Actions through Settlements with
Responsible Parties, and Site-Specific Conditions Influence the Negotiation Process 23
Superfund Litigation Decreased Due to a Number of Factors, According to Experts 37
Differences in the Types of Sites on the NPL and Other Factors Make It Difficult to Assess the Status of Superfund Site Cleanups and Program Costs 50
Conclusions 79 Recommendations for Executive Action 80 Agency Comments and Our Evaluation 81
Appendix I Objectives, Scope, and Methodology 87
Appendix II Detailed Information on the Number, Duration,
Complexity, and Outcomes of CERCLA Cases 102
Appendix III Comments from the Environmental Protection
Agency 119
Appendix IV GAO Contact and Staff Acknowledgments 122
Tables
Table 1: Purpose, Source, Time Frame, and Scope of Data Collected and Analyzed for This Report 4
Table 2: Trust Fund Revenue in the Periods Before and After the Superfund Taxes Expired 11
Table 3: EPA Enforcement Actions, by Type of Process Followed and Outcome Achieved 22
Table 4: Types of EPA Enforcement Actions Taken at NPL Sites, Fiscal Years 1979 through 2007 25
Superfund

Table 5: Outcome of EPA Enforcement Actions at NPL Sites, Fiscal Years 1979 through 2007 27
Table 6: Outcome of EPA Enforcement Actions at NPL Sites, Fiscal Years 1979 through 2007, by Type of Site Work Sought 29
Table 7: Estimated Value of Superfund Enforcement Activities at NPL Sites, Fiscal Years 1979 through 2007 31
Table 8: Number and Percentage of CERCLA Cases Filed by Type of Plaintiff, Fiscal Years 1994 through 2007 39
Table 9: Number of Nonfederal NPL Sites, Including Megasites, by Type, Fiscal Years 1983 through 2007 55
Table 10: Number and Percentage of Nonfederal Sites Added to the NPL by Type, Fiscal Years 1983 through 2007 57
Table 11: EPA Average Expenditures per Site at Nonfederal NPL Sites, through Fiscal Year 2007 58
Table 12: Information on Responsible Parties Identified at Nonfederal NPL Sites 59
Table 13: Least and Most Advanced Stages of Cleanup at Nonfederal NPL Sites with One Operable Unit, as of Fiscal Year 2007 66
Table 14: Least and Most Advanced Stages of Cleanup at Nonfederal NPL Sites with Multiple Operable Units, as of Fiscal Year 2007 67
Table 15: Construction Complete Nonfederal NPL Sites by Site Type and Megasite Designation, through Fiscal Year 2007 70
Table 16: Categorization Examples of CERCLA Case Party Types 93 Table 17: CERCLA Cases Filed by U.S. District Court, Fiscal Years
1994 through 2007 102 Table 18: CERCLA Cases Filed in U.S. District Courts, According to
the EPA Region Where the Courts Are Located, Fiscal Years 1994 through 2007 105
Table 19: CERCLA Cases Filed by Type of Plaintiff, Fiscal Years 1994 through 2007 106
Table 20: Duration of CERCLA Cases by Type of Plaintiff, Fiscal Years 1994 through 2007 106
Figures
Figure 1: Site Cleanup Process 13 Figure 2: EPA Enforcement Process 18 Figure 3: Outcomes of EPA Enforcement Actions and Processes
Followed at NPL Sites, Fiscal Years 1979 through 2007 24
Page ii GAO-09-656 Superfund

Figure 4: Percentage of EPA’s Enforcement Actions at NPL Sites That Resulted in the Performance of Site Work, the Reimbursement of Agency Costs, Both, or Neither, Fiscal Years 1979 through 2007 26
Figure 5: Trends in CERCLA Cases Filed by Type of Plaintiff, Fiscal Years 1994 through 2007 38
Figure 6: CERCLA Cases Filed by the Federal Government with Previously Negotiated Settlements, Fiscal Years 1994 through 2007 40
Figure 7: Average Number of Defendants per CERCLA Case, Fiscal Years 1994 through 2007 41
Figure 8: Percentage of CERCLA Cases in Which Defendants Pursued Additional Parties, Fiscal Years 1994 through 2007 42
Figure 9: Number of Nonfederal Sites Added to the NPL, Fiscal Years 1983 through 2007 51
Figure 10: Percentage of Nonfederal Sites Added to the NPL by Type, Fiscal Years 1983 through 2007 56
Figure 11: Number of Nonfederal NPL Sites That Were Not Construction Complete, through Fiscal Year 2007, by Year of Site Listing 68
Figure 12: EPA’s Superfund Program Appropriation, Fiscal Years 1981 through 2007 72
Figure 13: EPA Superfund Expenditures, Fiscal Years 1999 through 2007 74
Figure 14: Number of CERCLA Cases Filed by Duration and Type of Plaintiff, Fiscal Years 1994 through 2007 107
Figure 15: Average Number of Defendants per CERCLA Case by Duration, Fiscal Years 1994 through 2007 108
Figure 16: Average Number of Defendants per CERCLA Case by Type of Plaintiff, Fiscal Years 1994 through 2007 109
Figure 17: Percentage of CERCLA Cases in Which Defendants Pursued Additional Parties by Type of Plaintiff, Fiscal Years 1994 through 2007 110
Figure 18: Number of CERCLA Cases, by Outcome and Type of Plaintiff, Fiscal Years 1994 through 2007 111
Figure 19: Percentage of CERCLA Cases, by Type of Outcome and Plaintiff, Fiscal Years 1994 through 2007 112
Figure 20: Duration of CERCLA Cases by Outcome, Fiscal Years 1994 through 2007 113
Page iii GAO-09-656 Superfund
Figure 21: Percentage of Closed CERCLA Cases with Only Previously Negotiated Settlements or Minimal Litigation by Type of Plaintiff, Fiscal Years 1994 through 2007 114
Figure 22: Percentage of Closed CERCLA Cases with Only Dismissals by Type of Plaintiff, Fiscal Years 1994 through 2007 115
Figure 23: Percentage of Closed CERCLA Cases with Dismissals That Had Possible Settlements, Fiscal Years 1994 through 2007 116
Figure 24: Percentage of Closed CERCLA Cases with Only Nonconsensual Judgments by Type of Plaintiff, Fiscal Years 1994 through 2007 117
Figure 25: Percentage of Closed CERCLA Cases with Appeals by Type of Outcome, Fiscal Years 1994 through 2007 118
Page iv GAO-09-656 Superfund
Abbreviations
CERCLA Comprehensive Environmental Response, Compensation, and Liability Act CERCLIS Comprehensive Environmental Response, Compensation, and Liability Information System DOJ Department of Justice EPA Environmental Protection Agency IFMS Integrated Financial Management System NACEPT National Advisory Council for Environmental Policy and Technology NPL National Priorities List OCFO Office of the Chief Financial Officer OECA Office of Enforcement and Compliance Assurance OSWER Office of Solid Waste and Emergency Response PACER Public Access to Court Electronic Records RCRA Resource Conservation and Recovery Act
This is a work of the U.S. government and is not subject to copyright protection in the United States. The published product may be reproduced and distributed in its entirety without further permission from GAO. However, because this work may contain copyrighted images or other material, permission from the copyright holder may be necessary if you wish to reproduce this material separately.
Page v GAO-09-656 Superfund
Page 1 GAO-09-656
United States Government Accountability Office
Washington, DC 20548
July 15, 2009
Congressional Requesters
The Comprehensive Environmental Response, Compensation, and Liability Act (CERCLA) of 1980 established the Superfund program to protect human health and the environment from the effects of hazardous substances. Under the Superfund program—the federal government’s principal program to clean up hazardous waste sites—the Environmental Protection Agency (EPA) has the authority to compel parties responsible for contaminating these sites to clean them up, or to conduct cleanups itself and then seek reimbursement from the responsible parties. In the past, EPA’s approach for enforcing CERCLA was criticized as leading to lengthy negotiations and protracted litigation, resulting in high costs for the government, as well as the responsible parties.
EPA places some of the most seriously contaminated sites on the National Priorities List (NPL), and cleanups of these sites are typically expensive and lengthy. Cleanup actions are managed by EPA’s Office of Solid Waste and Emergency Response (OSWER) and progress through several steps: investigation and study; selection and design of the cleanup method; and implementation of the cleanup, known as the remedial action. Remedial actions—or remedies—are generally long-term cleanups that aim to permanently and significantly reduce contamination. EPA can also take removal actions at any time; these actions are generally short-term or emergency cleanups to mitigate immediate threats. When the remedial action phase is complete, all immediate threats have been addressed, and all long-term threats are under control, EPA generally considers the site to be “construction complete.” Most sites then enter into an operation and maintenance phase in which the responsible party or the state maintains the remedy while EPA conducts periodic reviews to ensure that the remedy continues to protect human health and the environment. As of the end of fiscal year 2007,1 there were 1,569 NPL
1For this report, we collected and analyzed data through fiscal year 2007 because that was the most current information at the time we initiated our work.
Superfund
sites.2 The Superfund program is funded by annual appropriations from a trust fund; historically, the trust fund was financed primarily by taxes on crude oil and certain chemicals, as well as an environmental tax on corporations. Since the authority for these taxes expired in 1995, however, the general fund has been the largest source of revenue for the trust fund.
EPA’s Office of Enforcement and Compliance Assurance (OECA) is responsible for Superfund enforcement, including identifying responsible parties and taking enforcement actions against these parties to compel them to clean up sites or reimburse EPA’s costs. During its enforcement actions, EPA attempts to reach an agreement—known as a settlement—with responsible parties about who will perform and/or pay for site cleanups. The Department of Justice (DOJ) assists EPA in its efforts to enforce CERCLA by negotiating and, when necessary, litigating on EPA’s behalf.3 To begin litigation, DOJ will file a complaint in U.S. district court against one or more responsible parties, initiating a case against them. CERCLA cases may require only minimal court involvement, as when EPA seeks a court’s approval for a previously negotiated settlement. Alternatively, cases may be lengthy and complex; however, EPA may still reach an agreement with the parties after some litigation. While many CERCLA cases are filed by the federal government, states, private parties, and others may also initiate litigation under the act for a variety of reasons, including compelling others to contribute toward site cleanup costs.
2This number includes 1,397 nonfederal NPL sites, as well as 172 federal facilities that EPA had listed on the NPL, as of fiscal year 2007. Of the 1,397 nonfederal NPL sites, 306 sites had been deleted from the NPL once they no longer posed a threat to human health or the environment. The number of deleted sites does not include one site that was deleted from the NPL but was subsequently restored. Of the 172 federal facility NPL sites, 15 sites had been deleted from the NPL. These are sites owned and operated by federal agencies, such as the Departments of Defense, Energy, and the Interior. Cleanups of these facilities are funded by the responsible agency (and not by EPA’s Superfund appropriation); and enforcement of CERCLA with respect to federal agencies is handled differently than the process for other parties. Throughout this report, we excluded federal facilities from our analyses, except where otherwise noted. In particular, in reporting enforcement outcomes, we include enforcement against responsible parties even if the action concerned a federal facility.
3Throughout this report, we refer to litigation as an EPA enforcement action; however, the agency cannot initiate litigation itself, but must make a referral to DOJ, which, by statute and executive order, has sole control of federal CERCLA litigation.
Page 2 GAO-09-656 Superfund
In this context, you asked us to (1) identify the outcomes of EPA’s enforcement actions, and the factors federal and private parties consider in reaching these outcomes; (2) examine the trends, if any, in litigation to resolve Superfund liability; and (3) determine the status and implementation costs of the Superfund program. You also asked that we examine the costs of EPA’s efforts to enforce and administer the Superfund program, and we provided you with detailed data on these activities in July 2008.4
To understand the Superfund enforcement process, we reviewed applicable statutes, regulations, and EPA guidance. We also interviewed officials responsible for implementing and enforcing the Superfund program, including officials in OSWER and OECA, and in DOJ’s Environment and Natural Resources Division. To provide information on the outcomes of EPA’s Superfund enforcement actions,5 as well as on the program’s status, we obtained and analyzed data from EPA’s Comprehensive Environmental Response, Compensation, and Liability Information System (CERCLIS). Also, to provide information on the cost of implementing the Superfund program, we analyzed program expenditure data from EPA’s Integrated Financial Management System (IFMS), and interviewed officials with EPA’s Office of the Chief Financial Officer. We converted all dollar figures in the data we collected from the CERCLIS and IFMS databases into constant 2007 dollars. To examine trends in litigation to resolve Superfund liability, we conducted a comprehensive analysis of cases filed under CERCLA in 88 out of the 94 U.S. district courts. We identified these cases by searching the Public Access to Court Electronic Records (PACER) system for cases filed for fiscal years 1994 through 2007, and as a result, developed a database of
4GAO, Superfund: Funding and Reported Costs of Enforcement and Administration
Activities, GAO-08-841R (Washington, D.C.: July 18, 2008).
5We limited our data collection and analysis to EPA’s completed enforcement actions; that is, actions that EPA took against responsible parties that had reached a final outcome, such as issuing a unilateral administrative order or agreeing to a settlement. Throughout this report, when we use the term “enforcement actions,” we are referring to completed enforcement actions.
Page 3 GAO-09-656 Superfund
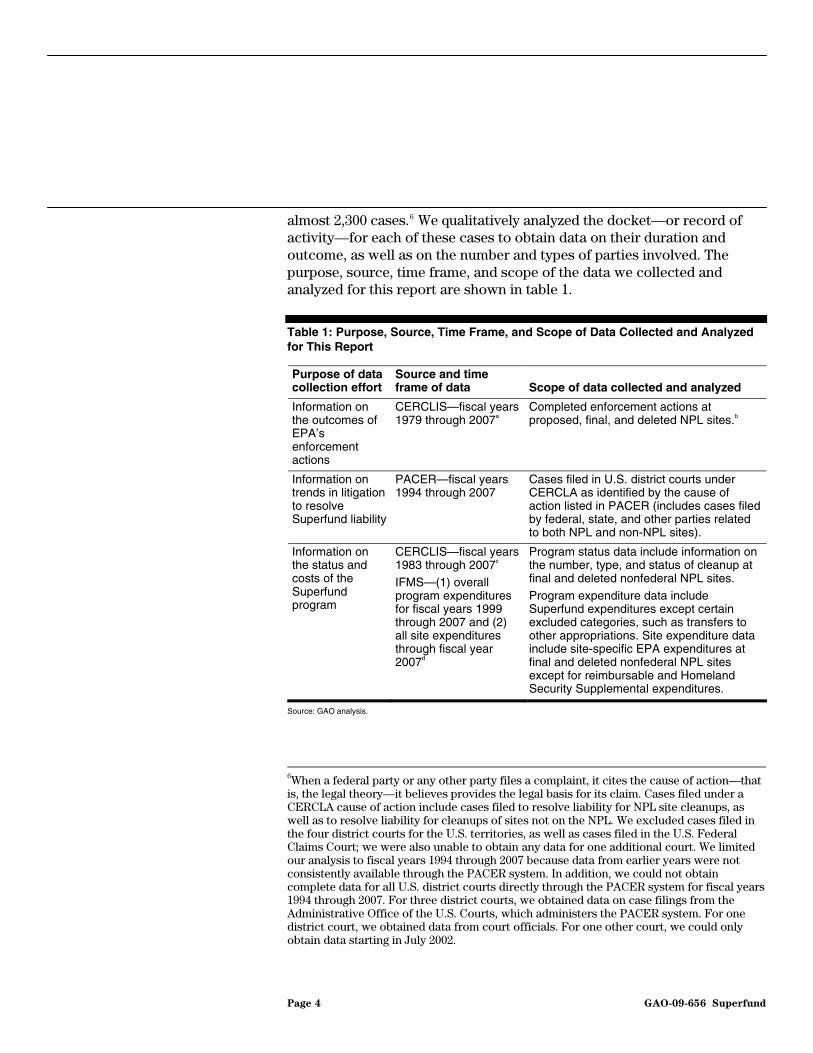
almost 2,300 cases.6 We qualitatively analyzed the docket—or record of activity—for each of these cases to obtain data on their duration and outcome, as well as on the number and types of parties involved. The purpose, source, time frame, and scope of the data we collected and analyzed for this report are shown in table 1.
Table 1: Purpose, Source, Time Frame, and Scope of Data Collected and Analyzed for This Report
Purpose of data collection effort
Source and time frame of data Scope of data collected and analyzed
Information on the outcomes of EPA’s enforcement actions
CERCLIS—fiscal years 1979 through 2007a
Completed enforcement actions at proposed, final, and deleted NPL sites.b
Information on trends in litigation to resolve Superfund liability
PACER—fiscal years 1994 through 2007
Cases filed in U.S. district courts under CERCLA as identified by the cause of action listed in PACER (includes cases filed by federal, state, and other parties related to both NPL and non-NPL sites).
Information on the status and costs of the Superfund program
CERCLIS—fiscal years 1983 through 2007c
IFMS—(1) overall program expenditures for fiscal years 1999 through 2007 and (2) all site expenditures through fiscal year 2007d
Program status data include information on the number, type, and status of cleanup at final and deleted nonfederal NPL sites.
Program expenditure data include Superfund expenditures except certain excluded categories, such as transfers to other appropriations. Site expenditure data include site-specific EPA expenditures at final and deleted nonfederal NPL sites except for reimbursable and Homeland Security Supplemental expenditures.
Source: GAO analysis.
6When a federal party or any other party files a complaint, it cites the cause of action—that is, the legal theory—it believes provides the legal basis for its claim. Cases filed under a CERCLA cause of action include cases filed to resolve liability for NPL site cleanups, as well as to resolve liability for cleanups of sites not on the NPL. We excluded cases filed in the four district courts for the U.S. territories, as well as cases filed in the U.S. Federal Claims Court; we were also unable to obtain any data for one additional court. We limited our analysis to fiscal years 1994 through 2007 because data from earlier years were not consistently available through the PACER system. In addition, we could not obtain complete data for all U.S. district courts directly through the PACER system for fiscal years 1994 through 2007. For three district courts, we obtained data on case filings from the Administrative Office of the U.S. Courts, which administers the PACER system. For one district court, we obtained data from court officials. For one other court, we could only obtain data starting in July 2002.
Page 4 GAO-09-656 Superfund
aData on Superfund enforcement outcomes start in fiscal year 1979 because the earliest Superfund enforcement action with a monetary value was achieved in that year. An EPA official told us that, although this outcome occurred before the Superfund program began, it was included as a Superfund enforcement outcome because it concerned a site that was later listed on the NPL. bThese data primarily represent EPA enforcement actions at nonfederal NPL sites; however, enforcement actions against responsible parties at a small number of federal facility NPL sites are also included in the data. Overall, we did not assess EPA’s efforts to enforce site cleanups at federal facilities. cSites were first listed on the NPL in fiscal year 1983. Therefore, while cleanup or enforcement actions were initiated at some sites prior to fiscal year 1983, throughout this report we refer to fiscal year 1983 as the initial time frame for data collected on the number, type, and status of cleanup of sites on the NPL. dEPA could only provide data on site-specific expenditures prior to fiscal year 1990 on an aggregated basis. Therefore, we could not determine when the earliest of these expenditures were made. See appendix I for more detail on our analysis of these data.
In addition, to obtain more detailed information on how the Superfund enforcement process is implemented at individual sites, as well as the factors that influence parties’ decisions, we reviewed EPA enforcement documentation from a nonprobability sample of 10 Superfund sites. We selected these sites on the basis of a variety of characteristics, such as geographic location, site type, number of responsible parties, and value of enforcement actions taken. Finally, to help identify contributing factors for the trends we found in our analysis of data on EPA’s enforcement actions, litigation to resolve Superfund liability, and the program’s status and costs, as well as to obtain information on the factors that influence parties’ decisions, we interviewed Superfund program experts, including EPA and DOJ officials, attorneys that represent responsible parties, and other subject matter experts. We selected these individuals on the basis of a number of factors, such as referral from other interviewees, the past efforts of these individuals (or the organizations they represent) related to the Superfund program or CERCLA enforcement, and representation of a variety of perspectives. We also obtained and reviewed information on recent legal decisions and ongoing cases that experts identified as significant to CERCLA liability issues.
We evaluated the reliability of the data used in our analyses and identified some potential limitations in the data used for this report. For example, we found certain limitations in the extent to which EPA data on the value of its enforcement actions represent the actual value of these actions. Also, EPA noted that the agency currently has ongoing data correction and updating efforts that could result in changes to the data we analyzed for this report. In addition, we found evidence that not all U.S. district court cases filed under CERCLA were categorized as such—with a CERCLA cause of action—in the PACER system. Despite these limitations, we determined that these data were sufficiently reliable for presenting
Page 5 GAO-09-656 Superfund
information on overall trends; we also corroborated the overall trends through discussions with experts. Where necessary, we note the potential limitations of these data in the report. Appendix I provides a more detailed description of our scope and methodology.
We conducted this performance audit from August 2007 to July 2009, in accordance with generally accepted government auditing standards. Those standards require that we plan and perform the audit to obtain sufficient, appropriate evidence to provide a reasonable basis for our findings and conclusions based on our audit objectives. We believe that the evidence obtained provides a reasonable basis for our findings and conclusions based on our audit objectives.
EPA’s enforcement actions have resulted in an estimated $29.9 billion in cost recoveries, commitments to conduct site work, and other outcomes, according to EPA data through fiscal year 2007. Almost 80 percent of EPA’s completed enforcement actions at NPL sites resulted in agreements with responsible parties to perform or pay for site cleanup work; experts told us that site-specific conditions and other key considerations influence EPA’s and others’ decisions about how to resolve liability issues. EPA, DOJ, and responsible parties are usually interested in reaching agreement, according to experts we spoke with, but they are more likely to agree that the responsible parties will reimburse EPA for its cleanup costs than that the responsible parties will conduct site work themselves. However, the estimated value of responsible parties’ commitments to conduct site work is significantly higher than the estimated value of the agency costs EPA has recovered through its enforcement actions. Experts told us that while EPA, DOJ, and responsible parties make decisions about settling on the basis of site-specific characteristics, parties generally take into account certain key considerations regardless of particular site conditions. First, parties consider the cost of site cleanup; they may be less likely to settle quickly if costs are expected to be high. Second, EPA and responsible parties evaluate the strength of the agency’s evidence establishing a party’s liability for site contamination; when the evidence of a responsible party’s liability for a site seems tenuous, the party may wait to settle until EPA discovers additional supporting evidence. Finally, the number and types of responsible parties identified is an important consideration in decisions to reach settlement. For example, DOJ officials said it can be more difficult to settle when some responsible parties are facing bankruptcy because other responsible parties do not want to pay for the insolvent parties’ share of cleanup costs.
Results in Brief
Page 6 GAO-09-656 Superfund
From fiscal years 1994 through 2007, Superfund litigation—as measured by the number, duration, and complexity of CERCLA cases—decreased for several reasons, according to experts, including a decline in the number of sites being cleaned up, changes in EPA’s enforcement process that have encouraged settlements, and court decisions that have clarified legal uncertainties. More specifically:
• Number, duration, and complexity decreased. The number of CERCLA cases filed annually in U.S. district courts decreased by almost 50 percent, primarily because of a substantial reduction in the number of cases filed by parties other than the federal or state governments, such as businesses or private individuals. At the same time, the duration of cases decreased as the federal government increasingly negotiated settlements on CERCLA liability with responsible parties prior to filing cases in court. The median length of time that cases with previously negotiated settlements were before the court was approximately 3 months, compared with nearly 16 months for cases without such settlements. Furthermore, the complexity of CERCLA cases decreased as the number of defendants involved in such cases and the percentage of cases in which defendants pursued additional parties declined. Although comprehensive data on CERCLA litigation costs are not available, DOJ officials and responsible party attorneys said that litigation costs can be substantial. As the amount of CERCLA litigation decreased, the costs associated with this litigation may have also decreased.
• Factors contributing to these trends. According to Superfund experts, these trends have occurred for several reasons. First, the drop in litigation may reflect that fewer NPL sites required cleanup, and so parties may have had less reason to go to court. Fewer sites required cleanup because, for example, fewer sites were listed on the NPL in recent years, and the number of active NPL sites—those sites that had yet to reach construction complete—decreased by about one-half between fiscal years 1994 and 2007. Second, EPA changed its enforcement process to further promote settlements with responsible parties, especially settlements negotiated prior to filing a case in court. Following these and other enforcement process changes in the mid-1990s, a greater proportion of EPA’s enforcement actions resulted in agreements with responsible parties, and EPA and responsible parties more frequently reached these agreements prior to filing litigation in court. Finally, because the courts have clarified several initial uncertainties in the law, parties have become more certain of the probable outcomes of litigation and are, therefore, less likely to sue. However, as some attorneys indicated, recent or upcoming court decisions may raise some issues—such as the circumstances under
Page 7 GAO-09-656 Superfund
which certain responsible parties can recover costs from others or when liability for site contamination can be apportioned among different parties—that could affect the likelihood of litigation in the future.
While some trends in the Superfund program’s status and implementation costs are unclear because of limitations in EPA’s data, we identified a number of trends that could affect future program costs. However, EPA does not provide the Congress with sufficient information to assess program funding needs. Specifically:
• The number of sites added to the NPL each year has declined significantly since the beginning of the program. However, the types of sites added to the NPL have also changed in recent years. For example, mining sites, which are among the most expensive types of sites to clean up, have been added to the NPL in increasing numbers. At the same time, trends in the extent to which NPL sites do not have viable responsible parties to assist with site cleanup are unclear, in part, because of limitations in EPA’s data; making it difficult for the agency to determine the potential impact of these trends on its cost recovery efforts.
• Remedial actions have been completed or are underway at most NPL sites; however, limitations in EPA’s data on the status of cleanups at individual sites make it difficult to aggregate these data to quantify the amount of work remaining across all NPL sites. For example, one of the methods EPA uses to track the progress of different parts of a site’s cleanup—called operable units—is with key milestones, such as whether the site study or the remedial action is underway. While EPA recommended that we use these data to provide information on the status of site cleanups, these milestones provide only limited information on the amount of work remaining at an operable unit because the scope and type of work at operable units varies. For example, at one site, one operable unit may involve cleaning up a portion of a river and, at the same site, another operable unit may be for activities not directly related to cleanup, such as providing drinking water to residents. Such considerable differences in operable units make it difficult to use EPA’s operable unit milestone data to determine the amount of work, overall, that needs to be completed at a site. In addition, because certain types of sites take longer to clean up, the sites that remain on the NPL and that are not construction complete may include more complex and expensive sites. Moreover, even at some sites that are designated as construction complete, EPA may incur additional costs to address remaining site contamination.
Page 8 GAO-09-656 Superfund
• Superfund financial data show mixed trends: program appropriations and expenditures are declining while the costs EPA incurs for individual sites are increasing. From fiscal year 1999 through 2007, both EPA’s annual Superfund appropriation and its total expenditures for remedial actions at Superfund sites decreased. However, during this period, the average total amount EPA had spent per site by the time individual sites reached the construction complete milestone increased by an average of 13 percent each year. Nevertheless, EPA does not provide the Congress with sufficient information to make funding decisions about the Superfund program. In particular, EPA does not provide information on the work remaining and cost of cleanups at sites that are not construction complete, including complex and costly sites, and the extent to which it cannot identify viable responsible parties to assist with site cleanup. As a result, it is unclear how much funding for future cleanup activities will have to come from Superfund trust fund appropriations rather than from responsible parties.
To assist the Congress in making decisions about funding the Superfund program, we are recommending that the Administrator, EPA, assess and improve the comprehensiveness and reliability of the data the agency collects on the status and cost of cleanups at individual sites (particularly complex and expensive sites); the extent to which there are viable responsible parties at sites; and the financial impacts if EPA cannot identify viable responsible parties to assist in paying for some or all of a site’s cleanup. We are also recommending that the Administrator, EPA, aggregate these data, as appropriate, to provide clear and complete information on these issues, and provide this information to the Congress.
In responding to a draft of this report, EPA noted that it agreed with the report’s findings with respect to trends in Superfund enforcement and litigation, and recognized that both site-specific and aggregate information are necessary to support congressional decision making. EPA indicated that it agreed with our recommendation to assess and improve the data it provides on the program’s status and costs; although EPA identified some potential limitations to doing this, based on the site-specific nature of Superfund cleanups. EPA disagreed with our recommendations to collect and provide aggregated data on the extent to which there are viable responsible parties at sites and the financial impacts if EPA cannot identify viable responsible parties to pay for some or all of a site’s cleanup costs. EPA stated that it believes these data would be of limited value because they are subject to change throughout the cleanup and enforcement process. However, we believe these data are essential to assess EPA’s future funding needs. EPA also provided other comments
Page 9 GAO-09-656 Superfund
suggesting clarification of certain aspects of the report, as well as technical comments, which we incorporated, as appropriate. See appendix III for EPA’s written comments. DOJ and the Administrative Office of the U.S. Courts did not provide written comments on the draft report.
CERCLA was passed in late 1980, in the wake of the discovery of toxic waste sites such as Love Canal, where housing was built upon a former landfill for toxic chemicals, and residents began developing cancer and other illnesses from the residual waste. Unlike some environmental statutes, CERCLA did not regulate activity in order to prevent contamination of the environment;7 rather, CERCLA created a mechanism for responding to contamination that already exists. CERCLA established a trust fund from which EPA receives annual appropriations for Superfund program activities. The Superfund trust fund has received revenue from four major sources: taxes on crude oil and certain chemicals, as well as an environmental tax assessed on corporations based upon their taxable income; appropriations from the general fund; fines, penalties, and recoveries from responsible parties; and interest accrued on the balance of the fund. In the program’s early years, dedicated taxes provided the majority of revenue to the Superfund trust fund. However, in 1995, the authority for these taxes expired and has not been reinstated.8 Since that time, appropriations from the general fund have constituted the largest source of revenue for the trust fund, as table 2 shows.
Background
7CERCLA may help to prevent pollution by establishing that parties may be held liable for site contamination, which provides parties with incentives to properly manage hazardous substances so as to avoid liability.
8The budget proposed by the administration for fiscal year 2010 includes a provision to reestablish a tax to support the Superfund program. Additionally, bills introduced in the 111th Congress would impose a royalty on mining on federal lands—which would allow the federal government, as landowner, to share in the value of the mine’s production—that would be used, in part, to support cleanup actions at abandoned mines; 33 NPL sites are identified as being mining sites.
Page 10 GAO-09-656 Superfund

Table 2: Trust Fund Revenue in the Periods Before and After the Superfund Taxes Expired
Constant 2007 dollars in millions
Revenue sourcea
Fiscal years 1981-1995 (percentage of total
revenues)
Fiscal years 1996-2007 (percentage of total
revenues)
Receipts from dedicated taxesb
$18,018 (68%) $936 (6%)
Appropriations from the general fundc
4,616 (17) 9,281 (59)
Interest 2,412 (9) 2,543 (16)
Fines, penalties, and recoveries
1,634 (6) 2,906 (19)
Total $26,680 (100%) $15,667 (100%)
Source: GAO analysis of data from the President’s Budget Appendices.
Note: Totals may not add due to rounding. aWe did not include revenue from offsetting collections, because these data were only available for selected years. bThe Superfund program continued to collect some taxes after the authority expired as a result of adjustments to prior years’ corporate tax returns based on audits conducted by the Internal Revenue Service. cIn fiscal year 1981, the trust fund received an appropriation from the Pollution Fund. We have included this money under the category of appropriations for ease of presentation.
Since CERCLA was enacted, the Congress and EPA have made some significant changes to the program, including the following:
• The Superfund Amendments and Reauthorization Act of 1986 gave EPA additional enforcement authorities and statutory direction concerning settlements, and required greater state and public participation in site cleanup activities. The act also increased the potentially available funds for the program by allowing additional taxes to be collected for the trust fund, and by increasing the authorized level of funding that the Congress could appropriate from the trust fund to the Superfund program.
• In the mid-1990s, EPA undertook 62 reforms—collectively known as the Superfund administrative reforms—to respond to criticism of the Superfund program. These 62 reforms were intended to cover a range of activities, such as (1) selecting more technologically advanced and cost-effective cleanup remedies, (2) providing technical assistance so that communities and tribes located near sites could better participate in cleanup decisions, and (3) reducing the costs associated with enforcing Superfund by, for example, expediting settlements with
Page 11 GAO-09-656 Superfund
certain types of responsible parties, such as those that contributed small amounts of hazardous substances.
• A 1999 amendment to CERCLA defined the term “recyclable material” and exempted certain parties who arranged for the recycling of these materials from Superfund liability, provided certain conditions are met. According to the amendment, one purpose of these exemptions was to remove impediments to recycling that were unintended consequences of the Superfund provisions.
• In 2002, the Small Business Liability Relief and Brownfields Revitalization Act, among other things, limited the liability of certain types of responsible parties and established the Brownfields program—a federal grant program to assist with the redevelopment of certain sites polluted (or potentially polluted) by hazardous contaminants.
EPA’s Process for Listing Superfund Sites on the NPL and Cleaning Them Up
Potentially hazardous sites are usually reported to EPA by a state environmental agency, but sometimes local or tribal governments, other federal agencies, individuals, or community groups also identify such sites. The EPA regional office,9 often in conjunction with a state environmental agency, evaluates the site to verify that hazardous substances are present and to determine whether the site could be addressed by other programs, such as state hazardous waste programs or other federal authorities. Regional officials may decide not to include a site for further assessment for a number of reasons, such as if the site could be addressed by other programs, or if the officials make a determination that no further cleanup action is necessary at the site. Also, as part of the evaluation process, EPA uses its Hazard Ranking System to numerically assess the potential of sites to pose a threat to human health or the environment—sites that score at least 28.5 under the Hazard Ranking System are eligible for NPL listing. EPA regions then submit sites to EPA headquarters for possible listing on the NPL on the basis of a variety of factors, including the severity of the contamination and the urgency of the threat it poses. In 2002, EPA established a committee of regional and headquarters personnel to review regional submissions as part of the selection process. This committee primarily considers risks to human health and the environment and the urgency of the need for response; it also considers program management factors, such as projected costs to the Superfund program and the timing
9EPA has 10 regional offices, each of which is responsible for executing agency programs within several states and, in some regions, territories.
Page 12 GAO-09-656 Superfund
of funding needs.10 As a matter of policy, EPA also seeks concurrence from the government of the state in which a site is located. Sites that EPA decides to list on the NPL are proposed for listing in the Federal Register for a 60-day public comment period. Final listing decisions are also published in the Federal Register.11
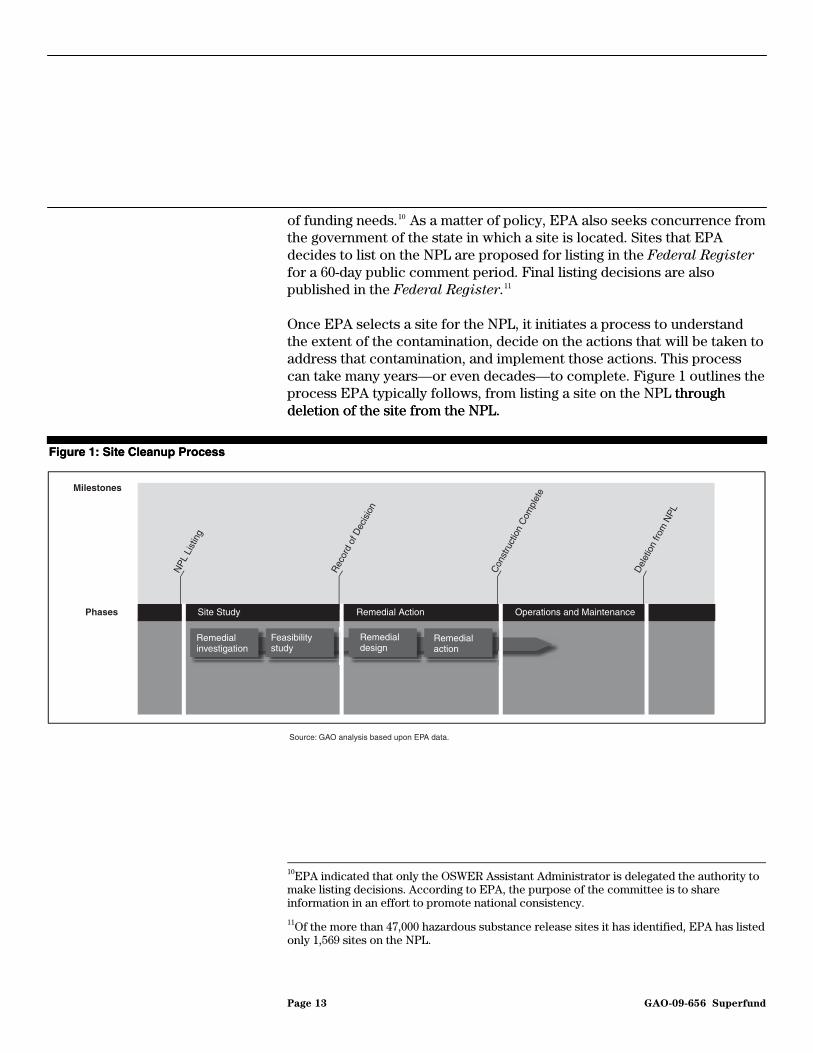
Once EPA selects a site for the NPL, it initiates a process to understand the extent of the contamination, decide on the actions that will be taken to address that contamination, and implement those actions. This process can take many years—or even decades—to complete. Figure 1 outlines the process EPA typically follows, from listing a site on the NPL through deletion of the site from the NPL.
through deletion of the site from the NPL.
Figure 1: Site Cleanup Process Figure 1: Site Cleanup Process
Milestones
Phases Site Study Remedial Action Operations and Maintenance
Remedialaction
Remedialinvestigation
Remedialdesign
Source: GAO analysis based upon EPA data.
NPL
Lis
ting
Rec
ord
of D
ecis
ion
Con
stru
ctio
n C
ompl
ete
Feasibilitystudy
Del
etio
n fro
m N
PL
10EPA indicated that only the OSWER Assistant Administrator is delegated the authority to make listing decisions. According to EPA, the purpose of the committee is to share information in an effort to promote national consistency.
11Of the more than 47,000 hazardous substance release sites it has identified, EPA has listed only 1,569 sites on the NPL.
Page 13 GAO-09-656 Superfund
After a site is listed, EPA or a responsible party will conduct a two-part study of the site: (1) remedial investigation, to characterize site conditions and assess the risks to human health and the environment, among other actions; and (2) feasibility study, to evaluate various options to address the problems identified through the remedial investigation. For example, EPA may determine that the soil at a site is polluted with a hazardous chemical during the remedial investigation and decide during the feasibility study that removing the soil for off-site treatment represents the best way to clean the site. These findings and decisions are documented in a record of decision.
Next, either EPA or a responsible party may initiate the remedial action that was documented in the record of decision. Like the site study, implementation of the remedial action is divided into two parts: (1) remedial design, a further evaluation of the best way to implement the chosen remedy; and (2) remedial action, the implementation of the remedy selected. When physical construction of all remedial actions is complete and other criteria are met, EPA deems the site to be “construction complete.” Most sites then enter into the operation and maintenance phase, when the responsible party or the state maintain the remedy, while EPA conducts periodic reviews to ensure that the remedy continues to protect human health and the environment. For example, at a site with soil contamination, the remedial action could consist of building a cap over the contaminated soil, while the operation and maintenance phase would consist of monitoring and maintaining the cap. Eventually, when EPA determines, with state concurrence, that no further remedial activities at the site are appropriate, EPA may delete the site from the NPL. Although most sites progress through the cleanup process in roughly the same way, EPA may take different approaches based on site-specific conditions.
While appropriated resources from the Superfund trust fund are available for remedial actions at sites that have been listed on the NPL, EPA can also use these resources to conduct removal actions to address site contamination at any site where there is an actual or threatened release of a hazardous substance. CERCLA defines removal actions to include necessary (1) actions in the event of a release or threatened release of hazardous substances into the environment; (2) actions to monitor, assess, and evaluate the release or threatened release of hazardous substances; (3) disposal of removed material; and (4) actions to otherwise prevent, minimize, or mitigate damage to public health, welfare, or to the environment. CERCLA limits EPA removal actions paid for with appropriations from the trust fund to actions lasting 12 months or less and costing $2 million or less, although these limits can be exceeded if EPA
Page 14 GAO-09-656 Superfund
determines that conditions for an exemption are met. Most removal actions have occurred at sites not on the NPL.
Liability Under CERCLA Under CERCLA, liability stems from the release (or threatened release) of hazardous substances into the environment from a facility. Many of these concepts are defined broadly. For example, under CERCLA, a “facility” includes, among other things, buildings, pipelines, lagoons, ditches, storage containers, motor vehicles, or any sites where a hazardous substance has come to be located. EPA also has to establish some other facts to successfully recover costs or require cleanup actions. To recover its costs, EPA’s expenditures must not be inconsistent with the National Contingency Plan.12 This plan, which was revised pursuant to CERCLA, establishes the procedures and standards for responding to releases of hazardous substances. To compel cleanup, EPA must show that an “imminent and substantial endangerment” may exist at the site that requires action on the part of the responsible parties.
Parties may also be held liable under CERCLA for damages related to the loss, injury or destruction of natural resources.13 The National Contingency Plan designates the secretaries of several departments—as the Department of the Interior or the Department of Agriculture—manage or hold federal lands as “natural resource trustees.” State and tribal officials are also designated as trustees. These trustees are authorized to sue, through the Attorney General, responsible parties for the costs of assessing the damages to natural resources, as well as the costs of restoration. EPA is not a natural resource trustee; rather, the agency’s role with respect to natural resource damages is generally to notify and coordinate with the trustees.
such who
CERCLA explicitly identifies four types of parties that can be held liable at a site, as well as some exemptions for parties meeting certain characteristics. The four types of parties are (1) owners or operators of a site; (2) former owners or operators of the site at the time hazardous wastes were disposed of; (3) those who arranged for disposal of hazardous substances (often called generators); and (4) transporters of hazardous
12See 59 FR 47416. The National Oil and Hazardous Substances Pollution Contingency Plan, referred to as the National Contingency Plan, is published in the Federal Register and can be found in the Code of Federal Regulations at 40 CFR Part 300.
13Natural resources include, among other things, land, wildlife, air, water, and groundwater.
Page 15 GAO-09-656 Superfund
waste to the site. Exempted parties include, among others: landowners who acquire contaminated property without knowing, after appropriate research, about the hazardous substances at the site; landowners who, after appropriate research, knowingly acquire contaminated property and take reasonable steps to prevent any further release of hazardous substances and cooperate fully with any response actions; generators and transporters who contribute extremely small amounts of waste to a site, known as de micromis parties; parties involved in recycling certain materials; and parties who have obtained certain federal permits to release hazardous substances. In addition, releases comprised solely of crude oil, petroleum, pesticides, and other specifically exempted substances are not subject to liability. However, in some cases, cleanups of these substances may be taken under other authorities, such as the Oil Pollution Act of 1990.14 Finally, CERCLA’s liability provisions are focused on releases of hazardous substances, although EPA also has the authority to respond to releases of pollutants and contaminants which may pose an imminent and substantial danger.
Courts have held responsible party liability under CERCLA to be strict, joint and several, and retroactive. Under strict liability, a party may be liable for cleanup even though its actions were not considered negligent. Because liability is joint and several, when the harm done is indivisible, one party can be held responsible for the full cost of the remedy even though other parties may have contributed to the release of hazardous substances at the site. Retroactive liability means that liability applies to actions that took place before CERCLA was enacted.
Parties held responsible by EPA or sued by other parties can challenge their CERCLA liability. Specifically, CERCLA provides responsible parties with three statutory defenses to Superfund liability when hazardous substances are released solely because of (1) an act of God;15 (2) an act of war;16 and (3) the actions of a third party (other than an agency or a party
14This act established provisions that expand the federal government’s ability to prevent and respond to oil spills, and provided resources for these activities.
15The act of God defense has rarely arisen in CERCLA cases. Courts have rejected the defense in association with heavy rainfalls, storms, a hurricane, and an unprecedented cold spell, among other situations.
16CERCLA’s act of war defense has been raised only rarely. One court has characterized the defense as “intended to cover releases occurring solely because of war (i.e. bomb dropped during a war on mining site and hazardous substances are released).”
Page 16 GAO-09-656 Superfund
in a contractual relationship with the responsible party), although the responsible party must have taken due care and reasonable steps to prevent a release. Responsible parties may also claim that too much time has passed for EPA to bring an enforcement action against them. CERCLA establishes specific statutes of limitations—that is, time limits—for filing actions against responsible parties.17 Liable parties may also seek to reduce their costs by arguing that they are not subject to joint and several liability when the site contamination is divisible among responsible parties, or that EPA’s costs were inconsistent with the regulations in the National Contingency Plan.
EPA’s Enforcement Process
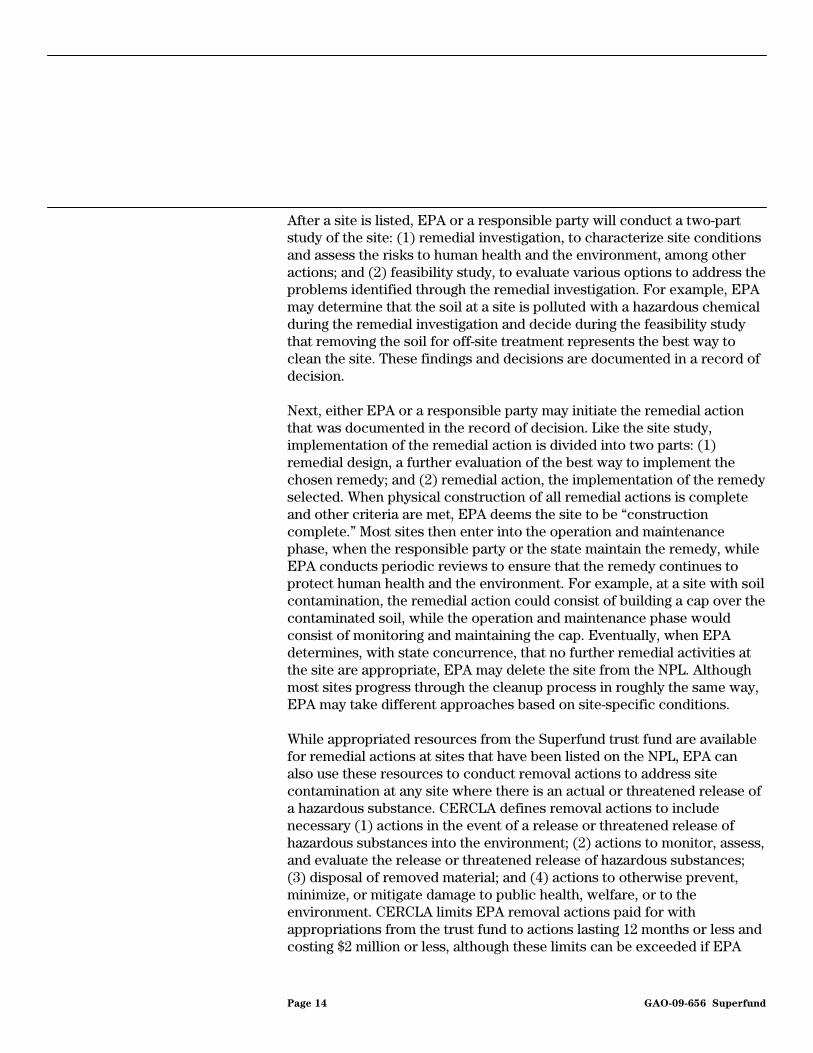
EPA enforcement begins with the identification of potentially responsible parties, usually early in the cleanup process; continues throughout site cleanup; and often does not conclude until after the site is declared construction complete, such as when the agency pursues parties to recover its costs for implementing the site cleanup. Although the process varies from site to site, the typical stages of enforcement for an NPL site are shown in figure 2.
17For costs associated with removal actions, cases generally must be brought within 3 years of the completion of the action. For costs associated with remedial actions, cases must be brought within 6 years from the start of construction of the action. EPA can avoid these rules by negotiating “tolling agreements” with responsible parties, which effectively freezes the statute of limitations for a certain period of time.
Page 17 GAO-09-656 Superfund
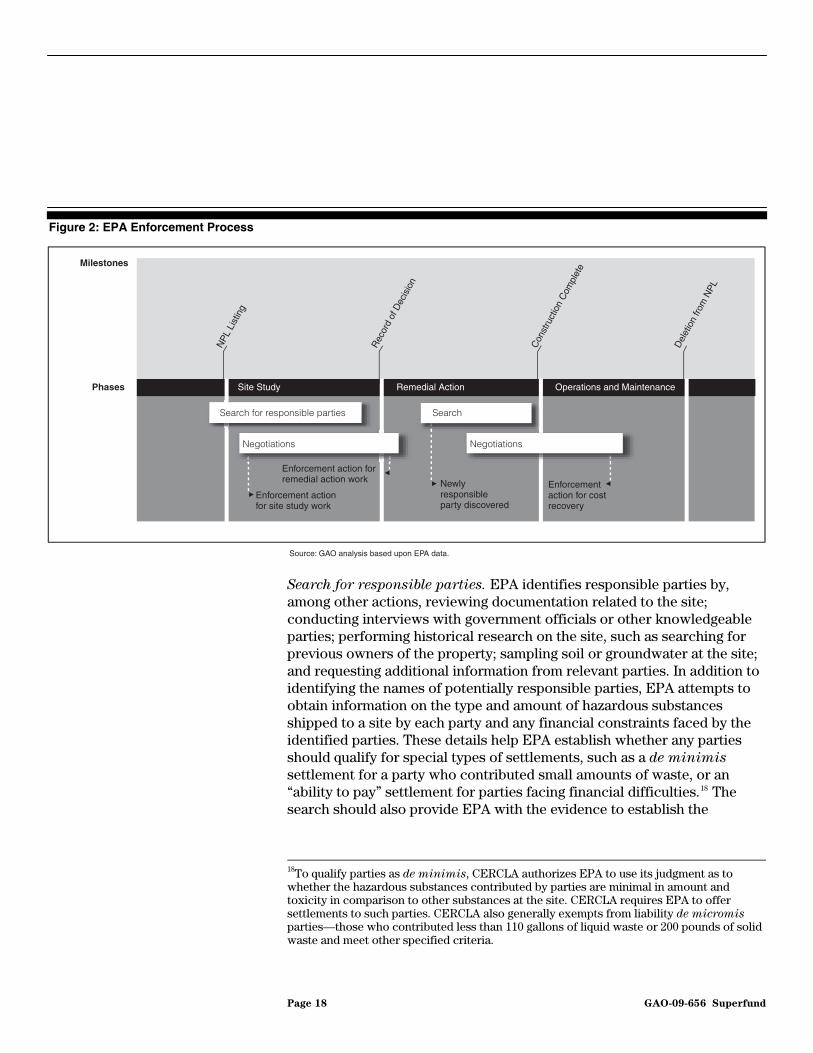
Figure 2: EPA Enforcement Process
Milestones
Phases Site Study Remedial Action Operations and Maintenance
Source: GAO analysis based upon EPA data.
NPL
Lis
ting
Rec
ord
of D
ecis
ion
Con
stru
ctio
n C
ompl
ete
Del
etio
n fro
m N
PL
Search for responsible parties
Negotiations Negotiations
Search
Enforcement actionfor site study work
Enforcement action forremedial action work Newly
responsibleparty discovered
Enforcementaction for costrecovery
Search for responsible parties. EPA identifies responsible parties by, among other actions, reviewing documentation related to the site; conducting interviews with government officials or other knowledgeable parties; performing historical research on the site, such as searching for previous owners of the property; sampling soil or groundwater at the site; and requesting additional information from relevant parties. In addition to identifying the names of potentially responsible parties, EPA attempts to obtain information on the type and amount of hazardous substances shipped to a site by each party and any financial constraints faced by the identified parties. These details help EPA establish whether any parties should qualify for special types of settlements, such as a de minimis settlement for a party who contributed small amounts of waste, or an “ability to pay” settlement for parties facing financial difficulties.18 The search should also provide EPA with the evidence to establish the
18To qualify parties as de minimis, CERCLA authorizes EPA to use its judgment as to whether the hazardous substances contributed by parties are minimal in amount and toxicity in comparison to other substances at the site. CERCLA requires EPA to offer settlements to such parties. CERCLA also generally exempts from liability de micromis
parties—those who contributed less than 110 gallons of liquid waste or 200 pounds of solid waste and meet other specified criteria.
Page 18 GAO-09-656 Superfund
potential liability of each party. Although the search typically begins no later than EPA’s efforts to list a site on the NPL, the discovery of new parties at a site can occur at any point during, and even after, the cleanup process is completed.
Negotiations. As with the search for responsible parties, negotiations typically take place early in the site cleanup process, but can resume at various points during the enforcement process. Formal negotiations begin when EPA sends a “special notice letter” to parties. This letter typically includes information about the site, the work necessary to study or clean up the site, other responsible parties, and also provides a draft settlement document to be used as a basis for negotiations. The special notice letter also initiates a “negotiation moratorium,” or a period of time during which EPA is prohibited from starting the site study or remedial action. EPA and the responsible parties may use this time to reach agreement about how the necessary site work will be conducted.
If negotiations are successful and parties settle with EPA to conduct site work or reimburse agency costs, CERCLA authorizes EPA to provide several benefits to the settling parties. EPA has the discretion to provide parties with a “covenant not to sue,” in which the federal government promises not to pursue additional enforcement actions against the parties for matters addressed by the settlement. In most cases, settlements also include “reopeners,” which allow EPA to take new enforcement actions if it discovers new evidence of liability or contamination after the initial settlement.19 CERCLA also provides “contribution protection” to parties that settle with EPA. That is, other parties cannot sue the settling parties for the costs affiliated with the matters addressed by the settlement.
In cases involving the performance of site work, where EPA and the responsible parties are unable to reach agreement, EPA may order the parties to conduct the cleanup action. If the parties do not comply with such orders, or for enforcement actions related to matters other than site work, EPA may refer the case to DOJ for litigation. DOJ officials then
19EPA includes several types of reopeners, referred to as a “reservation of rights,” in its settlements. For example, EPA may pursue additional work or cost recovery from the settling party when new information or previously unknown conditions indicate that the selected remedy is not protective of human health or the environment. Other situations where EPA could continue to pursue a party include violations of the settlement, additional liability outside the site, liability for natural resource damages (if not addressed by the settlement), criminal liability, and violations of federal or state law in the course of conducting the cleanup action.
Page 19 GAO-09-656 Superfund
renew efforts to negotiate with responsible parties. These efforts are known as “pre-filing negotiations” and are required prior to all civil litigation the federal government brings.20 Negotiations continue after DOJ files a CERCLA case, even during a trial.
Litigation Under CERCLA The federal government can litigate against responsible parties for many
reasons, including the following:
• Some parties may refuse to allow EPA access to a contaminated site or may not provide EPA with information to assist in identifying responsible parties or site hazards. CERCLA requires parties affiliated with a site (whether responsible for contamination or not) to provide EPA with access to the site and site information.
• EPA can litigate when parties refuse to comply with EPA administrative orders, such as orders directing responsible parties to conduct site work.
• EPA may use litigation to recover its costs, including those associated with site work and program administration, as well as the interest that has accrued on agency costs.
• Because certain agreements related to remedial actions, among others, must be confirmed by the court, EPA must initiate a case in court to file these agreements.
Parties other than the federal government—states, local governments, private citizens, businesses, and others—can also initiate CERCLA litigation. Many of these cases are known as “contribution claims,” where a responsible party sues other identified parties to recover some of the money it has spent to reimburse EPA for cleaning up a site. In addition to these contribution claims, responsible parties incurring cleanup costs may sue other responsible parties to recover some of those costs. Because these suing parties are responsible, in part, for the contamination, they cannot usually recover all of their costs, but may recover an amount
20While CERCLA authorizes some criminal penalties, such as those associated with various notification and recordkeeping requirements and the making of false statements, the actions we discuss in this report are largely civil actions.
Page 20 GAO-09-656 Superfund
determined by the courts to be equitable.21 In some instances, state governments, private parties, and others may also initiate litigation under CERCLA against federal agencies, and DOJ defends the federal agencies in such cases.
Litigation can take place over a considerable period of time, and during any phase of the process, the parties to the litigation can decide to reach a settlement. For example, during the discovery phase of litigation, when parties to a lawsuit request and obtain information from each other, such as the evidence that supports their claims or defenses, parties may decide that, given the evidence and the potential costs and risks of trial, it would be financially preferable to reach a settlement rather than to proceed to a trial. A case may be broken into several phases, including: (1) liability, or whether parties meet the legal standard of having contributed to the release of hazardous waste; (2) selection of a remedy, such as whether actions were consistent with the National Contingency Plan; and (3) allocation of costs among parties for contribution claims.
Documenting EPA Enforcement Actions
Completed EPA enforcement actions can be documented in one of four ways:
• Administrative orders on consent document the agreements EPA and responsible parties reached to pay for cleanup actions or conduct site work, such as site study and removal actions.22 These can contain penalties for noncompliance and may be enforced by a judge.
• Consent decrees also document agreements between EPA and responsible parties, but must be approved by the court. CERCLA
21Some courts have used a set of six factors to aid in allocating response costs among responsible parties in contribution claims. These factors, proposed in 1980 by then-Congressman Al Gore as an amendment to CERCLA, were not enacted but have, nonetheless, been used by some courts to determine equitable contribution. The “Gore factors” include such issues as the ability to distinguish between waste contributed by each party, the amount and toxicity of each party’s waste, and the degree of cooperation by each party with federal or state officials. Other courts have applied additional or other factors.
22EPA also documents some agreements as consent agreements and administrative cost recoveries. However, because these documents were used infrequently and have similar properties to administrative orders on consent, we have combined these three enforcement outcomes for ease of communication.
Page 21 GAO-09-656 Superfund
requires that agreements on conducting a remedial action take the form of a consent decree.23
• Unilateral administrative orders may require responsible parties to conduct site work, among other things. These documents describe the liability of the parties, the actions that must be taken, and the penalties for noncompliance. CERCLA authorizes fines for each day of noncompliance with a unilateral administrative order, as well as damages of up to three times any funds spent by EPA as a result of the parties’ noncompliance, in addition to the costs of cleanup.
• Judgments result from cases filed in court, when a judge or a jury determines the liability of a responsible party.
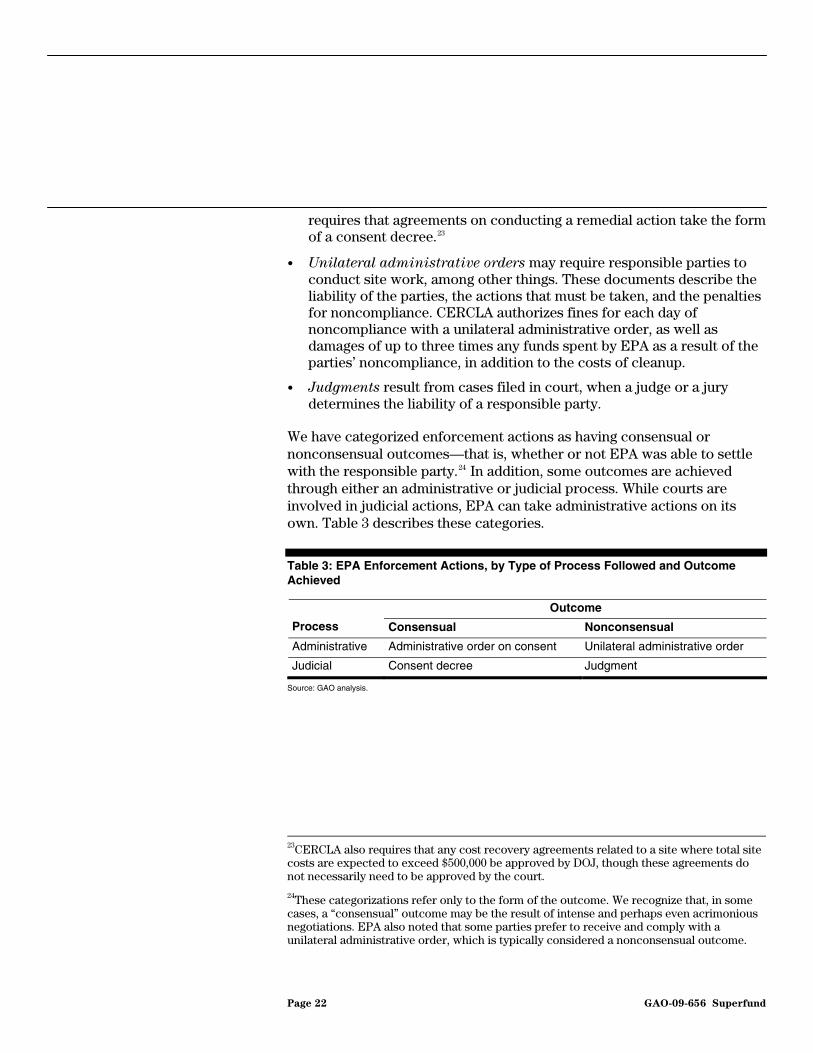
We have categorized enforcement actions as having consensual or nonconsensual outcomes—that is, whether or not EPA was able to settle with the responsible party.24 In addition, some outcomes are achieved through either an administrative or judicial process. While courts are involved in judicial actions, EPA can take administrative actions on its own. Table 3 describes these categories.
Table 3: EPA Enforcement Actions, by Type of Process Followed and Outcome Achieved
Outcome
Process Consensual Nonconsensual
Administrative Administrative order on consent Unilateral administrative order
Judicial Consent decree Judgment
Source: GAO analysis.
23CERCLA also requires that any cost recovery agreements related to a site where total site costs are expected to exceed $500,000 be approved by DOJ, though these agreements do not necessarily need to be approved by the court.
24These categorizations refer only to the form of the outcome. We recognize that, in some cases, a “consensual” outcome may be the result of intense and perhaps even acrimonious negotiations. EPA also noted that some parties prefer to receive and comply with a unilateral administrative order, which is typically considered a nonconsensual outcome.
Page 22 GAO-09-656 Superfund
Most of EPA’s enforcement actions are resolved through a settlement between the agency and responsible parties. In reaching these settlements, EPA’s and responsible parties’ decisions are influenced by site-specific characteristics and other key considerations, such as the expected cost of site cleanup, the strength of EPA’s evidence of responsible party liability, and the number and type of other responsible parties identified.
EPA Resolves Most Enforcement Actions through Settlements with Responsible Parties, and Site-Specific Conditions Influence the Negotiation Process
Most EPA Enforcement Actions Result in Agreements with Responsible Parties for Conducting Site Work or Reimbursing the Agency’s Costs
Over the life of the Superfund program, according to EPA data, the agency has completed at least one enforcement action at 1,160 sites, or 71 percent of all proposed, final, or deleted NPL sites.25 At many sites, EPA has taken multiple enforcement actions. While the median number of enforcement actions per site is 3, EPA has taken as many as 68 enforcement actions at one site. At one site we reviewed—an abandoned recycling facility—EPA files show that the agency used multiple enforcement tools. According to agency documentation, EPA issued a unilateral administrative order for a removal action to maintain a stormwater treatment plant; an administrative order on consent for site study work; two additional administrative orders on consent to recover past and anticipated future site costs from parties that contributed small amounts of waste to the site; a consent decree for the performance of the remedial action; and three
25As of the end of fiscal year 2007, there were 1,569 final and deleted NPL sites, as well as 66 sites that were proposed for listing on the NPL. According to EPA data, enforcement actions were taken at 38 sites proposed for the NPL, but not yet listed; enforcement actions were also taken at 11 federal facilities. In general, EPA actions to enforce CERCLA with respect to federal agencies follow a different process and we did not review these kinds of actions. In addition, 5 percent of these enforcement actions were taken before a site was listed on the NPL, including one action taken in fiscal year 2006 at a site that was not proposed for listing until fiscal year 2008. While EPA can take enforcement action at non-NPL sites, we did not include such enforcement actions in our analysis. We limited our data collection and analysis for this section of the report to completed enforcement actions at proposed, final, and deleted NPL sites. That is, enforcement actions analyzed for this report include actions that EPA took against responsible parties that had reached a final outcome, such as issuing a unilateral administrative order or agreeing to a settlement. However, an EPA official noted that some judgments may be under appeal or the parties may be negotiating in bankruptcy court. EPA officials said the agency has taken an enforcement action for at least 95 percent of those sites where it was able to identify responsible parties who could afford to pay for or conduct remedial actions.
Page 23 GAO-09-656 Superfund
additional enforcement actions for other aspects of site work or cost recovery. EPA had identified 528 parties responsible for contamination at this site.
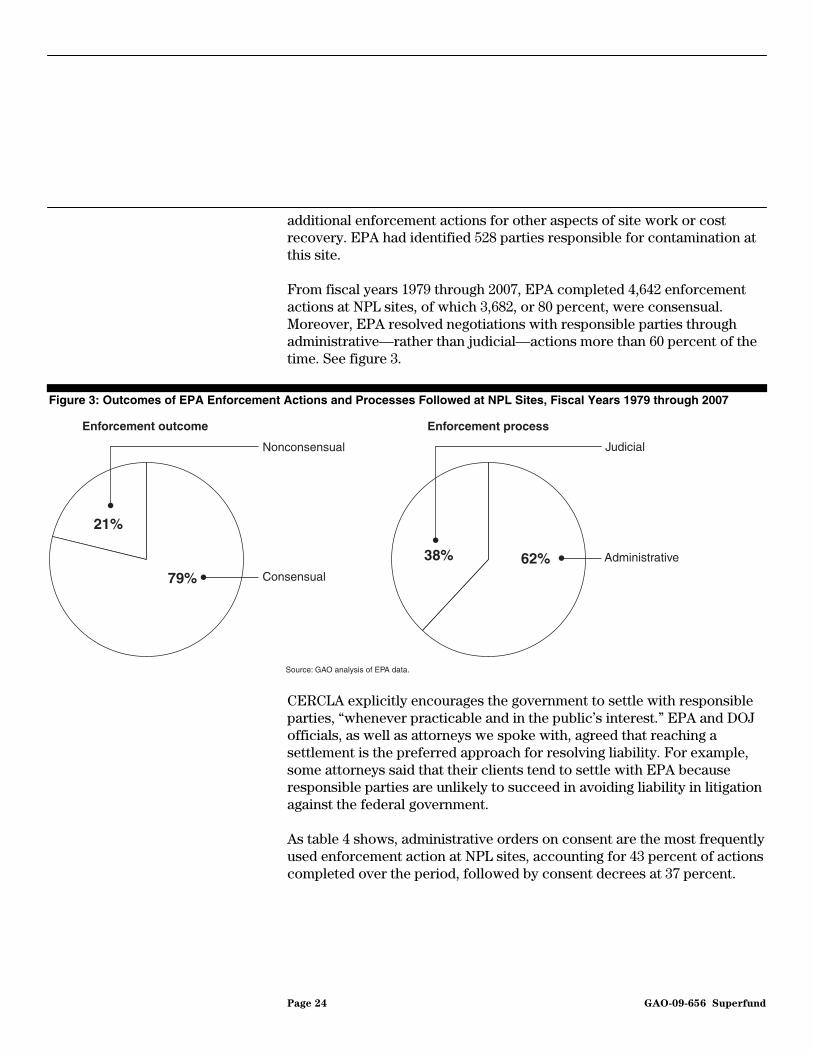
From fiscal years 1979 through 2007, EPA completed 4,642 enforcement actions at NPL sites, of which 3,682, or 80 percent, were consensual. Moreover, EPA resolved negotiations with responsible parties through administrative—rather than judicial—actions more than 60 percent of the time. See figure 3.
Figure 3: Outcomes of EPA Enforcement Actions and Processes Followed at NPL Sites, Fiscal Years 1979 through 2007
Source: GAO analysis of EPA data.
21%
79%62%38%
Enforcement outcome Enforcement process
Nonconsensual
Consensual
Administrative
Judicial
CERCLA explicitly encourages the government to settle with responsible parties, “whenever practicable and in the public’s interest.” EPA and DOJ officials, as well as attorneys we spoke with, agreed that reaching a settlement is the preferred approach for resolving liability. For example, some attorneys said that their clients tend to settle with EPA because responsible parties are unlikely to succeed in avoiding liability in litigation against the federal government.
As table 4 shows, administrative orders on consent are the most frequently used enforcement action at NPL sites, accounting for 43 percent of actions completed over the period, followed by consent decrees at 37 percent.
Page 24 GAO-09-656 Superfund

Table 4: Types of EPA Enforcement Actions Taken at NPL Sites, Fiscal Years 1979 through 2007
Number of times EPA has taken this action
Percentage of times EPA has taken this action
Administrative order on consent 1,982 43
Consent decree 1,700 37
Unilateral administrative order 901 19
Judgment 59 1
Total enforcement actions 4,642 100
Source: GAO analysis of EPA data.
Note: The categories included in table 4 represent the types of enforcement actions shown in EPA’s enforcement outcome data. EPA also documents some agreements as consent agreements and administrative cost recoveries. However, because these documents were used infrequently and have similar properties to administrative orders on consent, we have combined these three enforcement outcomes for ease of communication.
As the table shows, EPA and the responsible party were often able to reach agreement prior to a final judgment, with only one percent of enforcement actions resulting in a final judgment since 1979. However, EPA may have to go to court in many more instances, and the agency and responsible parties may litigate for extended periods of time before reaching a settlement. For example, according to EPA documentation, the agency and two responsible parties were engaged in litigation over liability for over 7 years at one site we reviewed. After the judge issued an interim ruling in EPA’s favor, the responsible parties decided to settle with EPA, and the settlement was documented as a consent decree.
As figure 4 shows, a majority of EPA’s enforcement actions at NPL sites resulted in commitments from responsible parties either to reimburse agency costs or to conduct site work, with only 22 percent related to both.
Enforcement Actions Often Result in the Performance of Site Work or Recovery of Agency Costs
Page 25 GAO-09-656 Superfund
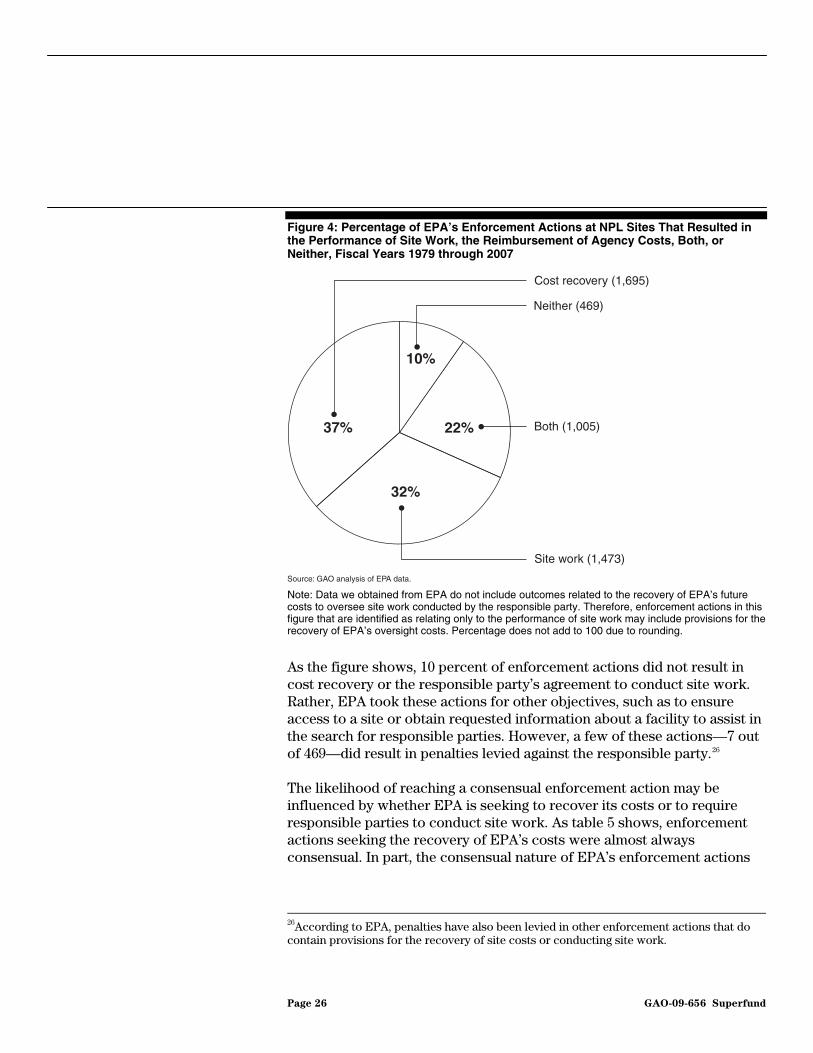
Figure 4: Percentage of EPA’s Enforcement Actions at NPL Sites That Resulted in the Performance of Site Work, the Reimbursement of Agency Costs, Both, or Neither, Fiscal Years 1979 through 2007
1695
147310%
37%
32%
22%
Cost recovery (1,695)
Neither (469)
Both (1,005)
Site work (1,473)
Source: GAO analysis of EPA data.
Note: Data we obtained from EPA do not include outcomes related to the recovery of EPA’s future costs to oversee site work conducted by the responsible party. Therefore, enforcement actions in this figure that are identified as relating only to the performance of site work may include provisions for the recovery of EPA’s oversight costs. Percentage does not add to 100 due to rounding.
As the figure shows, 10 percent of enforcement actions did not result in cost recovery or the responsible party’s agreement to conduct site work. Rather, EPA took these actions for other objectives, such as to ensure access to a site or obtain requested information about a facility to assist in the search for responsible parties. However, a few of these actions—7 out of 469—did result in penalties levied against the responsible party.26
The likelihood of reaching a consensual enforcement action may be influenced by whether EPA is seeking to recover its costs or to require responsible parties to conduct site work. As table 5 shows, enforcement actions seeking the recovery of EPA’s costs were almost always consensual. In part, the consensual nature of EPA’s enforcement actions
26According to EPA, penalties have also been levied in other enforcement actions that do contain provisions for the recovery of site costs or conducting site work.
Page 26 GAO-09-656 Superfund
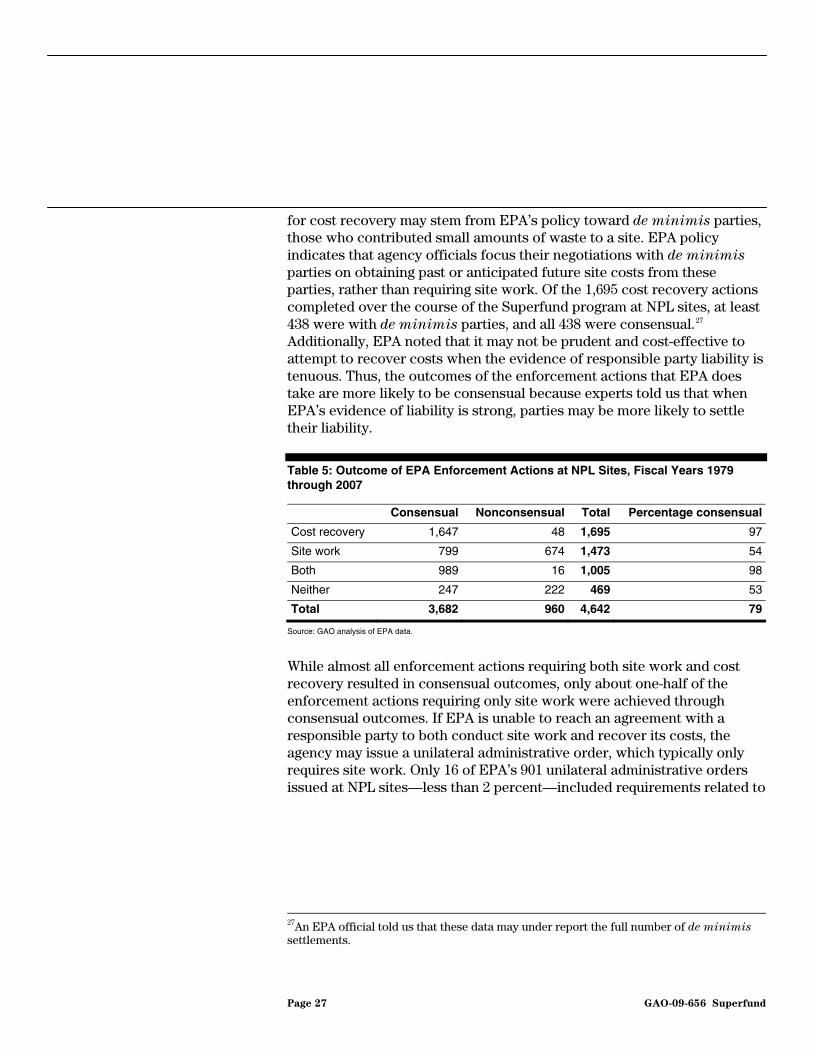
for cost recovery may stem from EPA’s policy toward de minimis parties, those who contributed small amounts of waste to a site. EPA policy indicates that agency officials focus their negotiations with de minimis parties on obtaining past or anticipated future site costs from these parties, rather than requiring site work. Of the 1,695 cost recovery actions completed over the course of the Superfund program at NPL sites, at least 438 were with de minimis parties, and all 438 were consensual.27 Additionally, EPA noted that it may not be prudent and cost-effective to attempt to recover costs when the evidence of responsible party liability is tenuous. Thus, the outcomes of the enforcement actions that EPA does take are more likely to be consensual because experts told us that when EPA’s evidence of liability is strong, parties may be more likely to settle their liability.
Table 5: Outcome of EPA Enforcement Actions at NPL Sites, Fiscal Years 1979 through 2007
Consensual Nonconsensual Total Percentage consensual
Cost recovery 1,647 48 1,695 97
Site work 799 674 1,473 54
Both 989 16 1,005 98
Neither 247 222 469 53
Total 3,682 960 4,642 79
Source: GAO analysis of EPA data.
While almost all enforcement actions requiring both site work and cost recovery resulted in consensual outcomes, only about one-half of the enforcement actions requiring only site work were achieved through consensual outcomes. If EPA is unable to reach an agreement with a responsible party to both conduct site work and recover its costs, the agency may issue a unilateral administrative order, which typically only requires site work. Only 16 of EPA’s 901 unilateral administrative orders issued at NPL sites—less than 2 percent—included requirements related to
27An EPA official told us that these data may under report the full number of de minimis
settlements.
Page 27 GAO-09-656 Superfund
recovering agency costs.28 EPA may then attempt to recover any costs through a separate enforcement action.
Finally, about one-half of the enforcement actions that required neither site work nor reimbursement of agency costs were consensual. These enforcement actions are more likely to be nonconsensual than some other types of actions because of the types of issues these actions address. For example, according to EPA policy and processes, the agency should try to obtain initial oral or written consent for site access or site information prior to taking enforcement actions. Consequently, EPA may take enforcement action only when the party refuses EPA’s request. Approximately 75 percent of the 218 enforcement actions taken at NPL sites that involved only site access or information requests were nonconsensual. When parties deny access or information, it may be less likely that EPA can resolve issues through consensual agreements. For example, according to EPA documentation for one site we reviewed, EPA had to sue two responsible parties for access to the site and information about the facility. The parties refused to settle with EPA prior to a trial. On appeal, the court eventually ruled that EPA should be granted access to the site. However, this decision came nearly 5 years after EPA had proposed the site for the NPL. Agency documentation indicated that, in the meantime, EPA’s ability to clean up the site and identify other responsible parties was delayed.
The type of site work to be performed and/or funded as a result of an enforcement action may also affect the likelihood of achieving a consensual outcome, as table 6 shows. Of the different enforcement outcomes related to site work, those related to site study were consensual more often than those related to other types of site work. EPA officials indicated that they did not want to force reluctant parties to conduct site studies because their work can influence the selection of an appropriate remedial action. Therefore, when EPA cannot reach agreement with responsible parties to conduct site study work, the agency may choose to
28EPA noted that some unilateral administrative orders related to site work may contain provisions to reimburse EPA for its future costs to oversee the responsible party. However, EPA does not track how often these provisions are included in its unilateral administrative orders, though agency officials indicated that many orders may include such provisions.
Page 28 GAO-09-656 Superfund
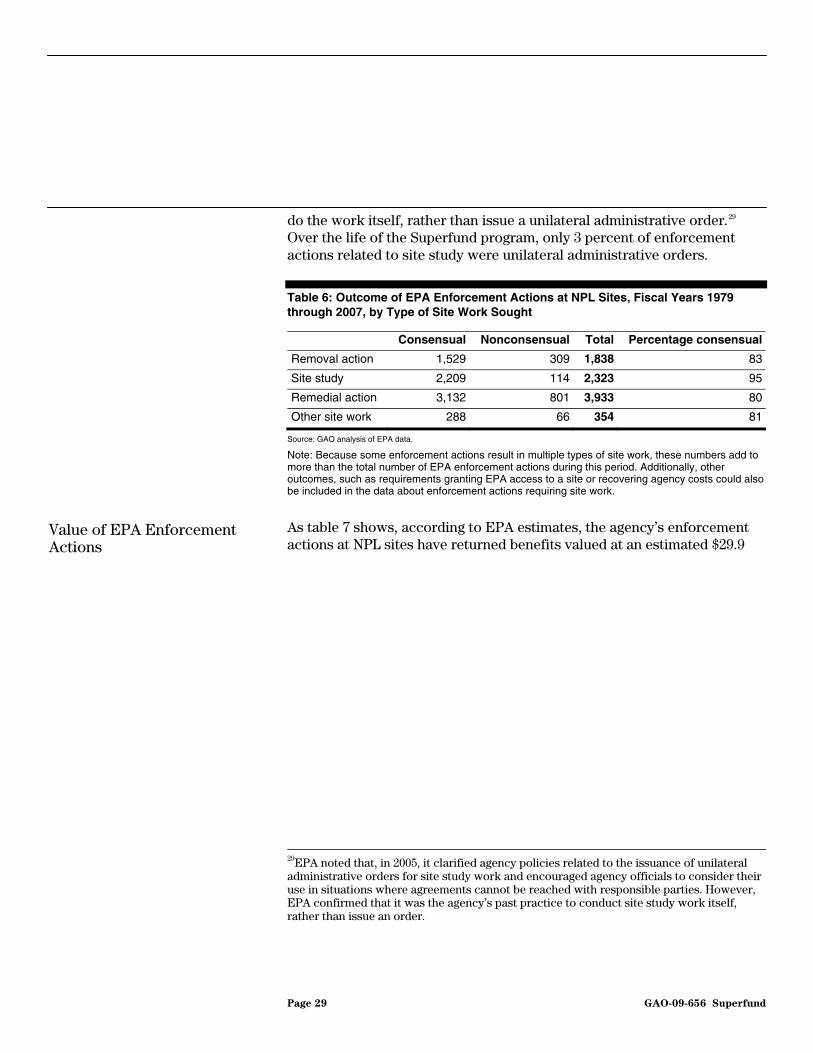
do the work itself, rather than issue a unilateral administrative order.29 Over the life of the Superfund program, only 3 percent of enforcement actions related to site study were unilateral administrative orders.
Table 6: Outcome of EPA Enforcement Actions at NPL Sites, Fiscal Years 1979 through 2007, by Type of Site Work Sought
Consensual Nonconsensual Total Percentage consensual
Removal action 1,529 309 1,838 83
Site study 2,209 114 2,323 95
Remedial action 3,132 801 3,933 80
Other site work 288 66 354 81
Source: GAO analysis of EPA data.
Note: Because some enforcement actions result in multiple types of site work, these numbers add to more than the total number of EPA enforcement actions during this period. Additionally, other outcomes, such as requirements granting EPA access to a site or recovering agency costs could also be included in the data about enforcement actions requiring site work.
As table 7 shows, according to EPA estimates, the agency’s enforcement actions at NPL sites have returned benefits valued at an estimated $29.9
Value of EPA Enforcement Actions
29EPA noted that, in 2005, it clarified agency policies related to the issuance of unilateral administrative orders for site study work and encouraged agency officials to consider their use in situations where agreements cannot be reached with responsible parties. However, EPA confirmed that it was the agency’s past practice to conduct site study work itself, rather than issue an order.
Page 29 GAO-09-656 Superfund
billion to the Superfund program.30 Although only 53 percent of enforcement actions required responsible parties to conduct site work, these enforcement actions resulted in commitments to conduct site work worth an estimated $22.5 billion, or 75 percent of the value of EPA’s enforcement actions. Furthermore, EPA’s recoveries of past costs, as well as penalties assessed, help to replenish the Superfund trust fund. Since the authority to collect dedicated taxes for the trust fund expired in 1995, fines, penalties, and recoveries have provided the second largest source of income for the trust fund—about 19 percent of trust fund revenues—after appropriations from the general fund.31 Moreover, according to EPA’s estimates, the agency has recovered approximately 36 percent of its site-specific costs over the life of the Superfund program.32 Responsible
30This total, which is based on EPA data, is an estimate of the value of EPA’s enforcement activities for a variety of reasons. First, the value of the responsible parties’ work commitments represents only the projected cost of the activities these parties agree to perform. According to EPA guidance, these estimates are expected to range from less than 30 percent to more than 50 percent of the actual project cost, and responsible parties are not required to provide EPA with information on the actual costs of implementing Superfund site response actions. Second, according to agency officials, the value of EPA’s past costs recovered, future costs obtained, and penalties assessed is based on enforcement documents, such as settlement agreements, and may not represent the amount a responsible party actually paid. Third, this total does not represent the value of EPA’s enforcement outcomes as amended over time. An EPA official stated that the agency only recently incorporated specific data on enforcement action amendments in its database. However, the official said that, historically, EPA headquarters worked with the regions to update data in CERCLIS when amendments to actions were significant. Fourth, the total is an estimate because the data do not include payments for future EPA oversight of work conducted by responsible parties or interest payments from responsible parties who arrange to pay EPA over time. Finally, EPA may assist states in taking enforcement actions for which the state is considered the lead enforcement authority, according to EPA’s data. The results of such actions are not included in the total we present in this report.
31Information on other sources of revenue for the trust fund was provided in table 2 of this report.
32There are some sites where EPA has spent a considerable amount of money that it may recover, but had not yet completed its enforcement as of the end of fiscal year 2007. At other sites, EPA data indicated the agency was able to recover significantly more from responsible parties than its data identified as having been spent at specific sites. Because these sites may represent data irregularities, we did not calculate a per-site average recovery, but, rather, identified a percentage recovered on the basis of total site expenditures and total past costs recovered.
Page 30 GAO-09-656 Superfund
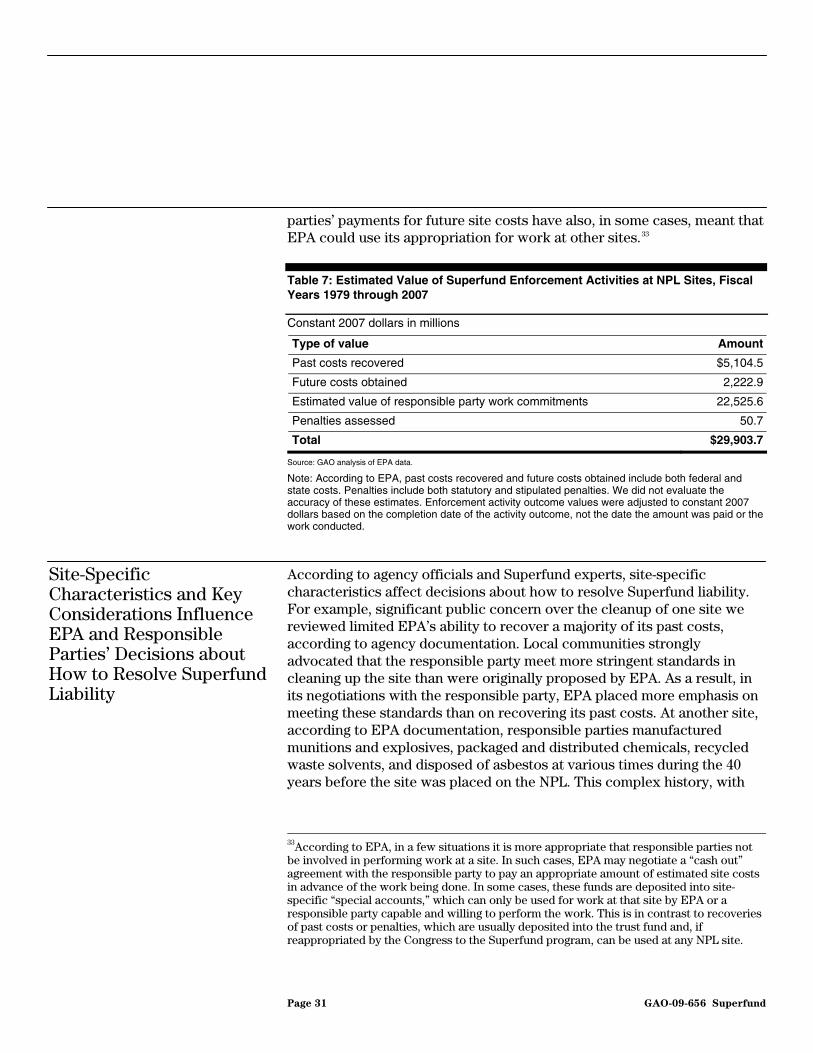
parties’ payments for future site costs have also, in some cases, meant that EPA could use its appropriation for work at other sites.33
Table 7: Estimated Value of Superfund Enforcement Activities at NPL Sites, Fiscal Years 1979 through 2007
Constant 2007 dollars in millions
Type of value Amount
Past costs recovered $5,104.5
Future costs obtained 2,222.9
Estimated value of responsible party work commitments 22,525.6
Penalties assessed 50.7
Total $29,903.7
Source: GAO analysis of EPA data.
Note: According to EPA, past costs recovered and future costs obtained include both federal and state costs. Penalties include both statutory and stipulated penalties. We did not evaluate the accuracy of these estimates. Enforcement activity outcome values were adjusted to constant 2007 dollars based on the completion date of the activity outcome, not the date the amount was paid or the work conducted.
Site-Specific Characteristics and Key Considerations Influence EPA and Responsible Parties’ Decisions about How to Resolve Superfund Liability
According to agency officials and Superfund experts, site-specific characteristics affect decisions about how to resolve Superfund liability. For example, significant public concern over the cleanup of one site we reviewed limited EPA’s ability to recover a majority of its past costs, according to agency documentation. Local communities strongly advocated that the responsible party meet more stringent standards in cleaning up the site than were originally proposed by EPA. As a result, in its negotiations with the responsible party, EPA placed more emphasis on meeting these standards than on recovering its past costs. At another site, according to EPA documentation, responsible parties manufactured munitions and explosives, packaged and distributed chemicals, recycled waste solvents, and disposed of asbestos at various times during the 40 years before the site was placed on the NPL. This complex history, with
33According to EPA, in a few situations it is more appropriate that responsible parties not be involved in performing work at a site. In such cases, EPA may negotiate a “cash out” agreement with the responsible party to pay an appropriate amount of estimated site costs in advance of the work being done. In some cases, these funds are deposited into site-specific “special accounts,” which can only be used for work at that site by EPA or a responsible party capable and willing to perform the work. This is in contrast to recoveries of past costs or penalties, which are usually deposited into the trust fund and, if reappropriated by the Congress to the Superfund program, can be used at any NPL site.
Page 31 GAO-09-656 Superfund
several different sources of contamination, made it difficult for EPA to negotiate with responsible parties, according to agency documents. Although some of these parties agreed to conduct the site cleanup, they did not agree to clean up the site’s asbestos contamination; other parties reimbursed only a portion of EPA’s past costs at the site, arguing that they were not responsible for this contaminant. Finally, at a third site, according to EPA documentation, some of the responsible parties challenged EPA’s decision to list the site on the NPL. This led to additional litigation by these parties, and a judge’s order compelling EPA to expedite its negotiations with other responsible parties.
While site-specific characteristics generally influence how Superfund liability is resolved, we identified some key considerations that the parties routinely take into account: (1) site cleanup costs, (2) the strength of EPA’s evidence, (3) the number and type of other responsible parties, and (4) other considerations that agency officials and Superfund experts cited less frequently as affecting negotiations.
In 7 of the 12 interviews we conducted with Superfund experts, the experts identified anticipated site costs as an important consideration during negotiations over Superfund liability. Some said high site costs could lead to more difficult negotiations because both EPA and the responsible parties have a lot at stake in the negotiations. EPA places a higher priority on cases in which it hopes to recover more than $200,000. However, at one site we reviewed, EPA was ultimately willing to forgo suing a party for approximately $13 million of its past costs, in part, because the responsible party was conducting a related cleanup action anticipated to cost several hundred million dollars.
Cost of Site Cleanup
Several experts also noted that uncertainty about the costs or scope of the cleanup could lead to more difficult negotiations. According to attorneys at one law firm, sites with long-term operation and maintenance requirements create “open-ended” liability for their clients. Additionally, these attorneys said that disagreements about the level of cleanup necessary—such as whether the site will be used as an industrial park or a residential neighborhood, which can affect the cleanup standards—create uncertainty. One state official we spoke with agreed that responsible parties are less likely to litigate over Superfund liability when they are certain about the costs of cleanup at a site. As a result, state officials said that many states have developed different approaches for identifying site cleanup requirements, such as creating a list of standard approaches for a variety of site contamination problems. In their view, these approaches
Page 32 GAO-09-656 Superfund
have helped reduce uncertainty about the scope of cleanup and the associated costs.
Finally, EPA policy directs agency officials to evaluate the value of a proposed settlement and determine how, if at all, the agency plans to recoup any unreimbursed costs that remain after settlement. Attorneys who represent responsible parties explained that, in deciding whether to settle with EPA, these parties also evaluate whether they will be able to recover some of their costs from parties not settling with the agency.
According to the attorneys we spoke with, the strength of EPA’s evidence is important to consider in negotiations over site liability. For example, two attorneys told us a responsible party may choose not to engage in early negotiations with EPA if the agency’s evidence is inconclusive; instead, the party may decide to wait for EPA to find additional evidence. One attorney said that he typically advises clients to resolve their liability with EPA as quickly as possible, but pointed out that it could be worthwhile for responsible parties with tenuous connections to Superfund sites to fight liability.
Strength of EPA’s Evidence Regarding Liability
Similarly, EPA officials consider the strength of the agency’s evidence when negotiating with responsible parties. In EPA’s key internal enforcement documentation, officials must provide information about the evidence the agency has tying each party to the site; the risks EPA could face in litigation; and whether the agency’s evidence could withstand the scrutiny of a trial. EPA’s documentation for some sites stated a preference for settling with responsible parties—rather than pursuing litigation against them in the hope of obtaining additional site work commitments or recovering costs—because the evidence against the parties was questionable or there were other risks to litigation. For example, at one site, EPA documentation explained that there was evidence of a particular contaminant; however, some parties identified as associated with this site produced a similar, but distinctively colored, contaminant that had not yet been found at the site. EPA believed this distinction could be a risk in litigation. At another site, EPA documentation noted that a contractor performing work at the site stopped and re-started the work several times. Because of CERCLA’s provisions limiting the time EPA has to file cases against responsible parties, responsible parties could try to use the first date at which site work stopped in order to raise questions about EPA’s claim for all site costs. In both of these instances, EPA was able to reach agreements with the responsible parties and avoid the risks of litigation. EPA documentation for other sites showed the agency’s confidence in the strength of its evidence. For example, at one site, EPA documents noted
Page 33 GAO-09-656 Superfund
that the hazardous substances sent to the site were well-documented in records maintained by site owners, which ensured that EPA had strong evidence against the responsible parties contributing these substances. According to agency documentation, this evidence limited litigation risks and likely strengthened EPA’s negotiating position. In the responsible parties’ settlement with EPA, the parties committed to conducting one remedial action and reimbursing EPA’s costs for another remedial action at the site, as well as other related costs.
DOJ officials and attorneys we spoke with both identified the number and type of responsible parties implicated at a site as important considerations in how they approach negotiations on Superfund site liability. For example, one attorney explained that the number of parties identified is important because, at sites with few responsible parties, each party will be responsible for a greater share of site cleanup costs and higher expected costs could make it more difficult to resolve liability. On the other hand, DOJ officials noted that it can be difficult for a large number of responsible parties to organize themselves to reach agreement with EPA. To assist in organization, EPA encourages responsible parties to form steering committees to expedite negotiations. In some instances, responsible parties will form multiple groups of similar parties, such as those who contributed large amounts of waste to a site and those who contributed only a small amount.
Number and Type of Other Responsible Parties
The involvement of certain types of responsible parties at a site can also make a difference in negotiations with EPA. For example, some experts noted that de minimis parties may have little experience with Superfund, and early settlements to remove such parties from the discussions can simplify future negotiations. In addition, DOJ officials said parties facing bankruptcy may complicate negotiations because it may be harder to negotiate with the remaining parties. For example, bankrupt owners of one site were largely responsible for site contamination, but could contribute only a minimal amount toward a cleanup action expected to cost tens of millions of dollars. According to agency documentation, some of the other responsible parties proposed a settlement in which they were only responsible for a small percentage of site costs, given the actions of the site owner and other identified parties. Agency documents showed EPA rejected this proposal, but identified the bankruptcy of the site owners as a significant inequity at the site.
Finally, having local governments as responsible parties may affect negotiations. According to one attorney, these governments can own landfills or contribute to the contamination of rivers. In light of local
Page 34 GAO-09-656 Superfund
governments’ unique responsibilities to provide sanitation services, and the challenges they face in funding a cleanup action, EPA policy establishes that, at certain types of sites, the regions may seek between 20 and 35 percent of estimated site costs from local governments; although, under joint and several liability, local governments who are responsible parties could be held liable for all site costs. One attorney criticized EPA’s approach for holding these parties liable because it may lead to confrontation with other responsible parties, who may believe that the local government also bears responsibility for site contamination.
Experts—as well as our review of site documentation—identified four other considerations that may less frequently affect EPA’s and the responsible parties’ approaches to negotiations over Superfund site liability. Specifically:
Other Considerations May Affect Liability Negotiations
• The potential for the settlement to set a precedent for future
negotiations. EPA explicitly considers precedent in its enforcement actions. With regard to a few of the sites we reviewed, EPA documentation noted that collecting all past site costs or all anticipated future costs for oversight of site cleanup set a positive precedent. Additionally, at one site, EPA documentation indicated that responsible parties’ agreements to implement a remedial action earlier than required were important for their impact on EPA’s future negotiations with other responsible parties. Responsible parties can also be concerned about the precedent of a settlement. For example, at one site we reviewed, EPA documentation indicated that both the responsible party identified at the site and the broader industry to which that party belonged were interested in seeing how liability was resolved, as an indication of how such cases were likely to be resolved across the country.
• Public perception of a responsible party. Experts said responsible parties may be concerned about their reputation in the local community. In particular, experts from one professional organization noted if a company plans to continue business in the area, it may not want to appear recalcitrant; therefore, it would be more likely to enter into an agreement to settle its liability. Also, these experts said litigation over site liability adds additional stigma that parties might be interested in avoiding. Finally, one attorney explained that some responsible parties want to appear as “good corporate citizens,” and may be more likely to settle with EPA.
• Enforcement under other federal laws. Federal laws other than CERCLA were important for understanding how site liability was resolved at many of the sites we reviewed. For example, according to
Page 35 GAO-09-656 Superfund

EPA documentation at one site, a responsible party filed for bankruptcy and EPA was one of the claimants for penalties stemming from a violation of a federal law other than CERCLA. This party had also negotiated a consent decree for groundwater monitoring with EPA under a different law. According to EPA documentation, agency officials believed that, in litigation, the responsible party would challenge EPA’s ability to pursue liability under CERCLA because of these situations, though the documentation indicated that the EPA officials disagreed with the party’s potential argument. As a result of these complicating factors, the agency took several additional enforcement actions and, ultimately, settled for a reduced amount of its past costs under CERCLA. At another site, EPA documentation noted that negotiations were complicated by pending legislation that would forgive a portion of the site costs for the site’s largest responsible party. Finally, at a third site, a party resolved its liability under CERCLA at the same time that it conducted work for related violations not under CERCLA.
• Likelihood that EPA will take on site work itself. Experts said responsible parties have less incentive to settle if they believe that they will not incur any costs by refusing. They will not incur costs if EPA does not issue a unilateral administrative order or does not proceed to conduct the site work itself. However, if EPA does issue an order and a responsible party refuses to comply with it, the responsible party may be subject to penalties of up to three times EPA’s costs to conduct site work. If the agency conducts the site work itself, experts said the costs may be higher than if the responsible parties had conducted the work. The parties in this instance would likely be responsible for reimbursing EPA’s costs. Some experts explained that as the level of the Superfund trust fund has fallen in recent years, EPA has lost some leverage in negotiations with responsible parties. Without a healthy trust fund from which the Congress may appropriate funds to EPA to conduct site work itself, experts said, parties may have less incentive to take on the needed site work. In recognition of this perceived leverage,34 EPA officials noted that the agency allocates a portion of its appropriation each year to be used in instances where responsible parties are recalcitrant in order to induce such parties to settle.
34EPA noted that the annual appropriation for the Superfund program determines the funds available, not the balance of the Superfund trust fund. However, we have found that the balance of the trust fund affects the funds available for future appropriations and, therefore, may provide an indicator to responsible parties of EPA’s ability to fund future cleanup actions.
Page 36 GAO-09-656 Superfund
Superfund litigation—as measured by the number, duration, and complexity of CERCLA cases—decreased from fiscal years 1994 through 2007, the period for which reliable data were available. These decreases in litigation may have led to a decrease in associated costs. According to experts, litigation decreased because fewer sites had cleanups underway, EPA changed its enforcement process to further encourage settlements, and court decisions clarified several initial legal uncertainties, making parties less inclined to litigate. However, some experts indicated that recent or upcoming court decisions may raise issues that could affect the likelihood of litigation in the future.
Superfund Litigation Decreased Due to a Number of Factors, According to Experts
The Number, Duration, and Complexity of Superfund Cases Decreased
According to our analysis of CERCLA cases, the number of cases filed decreased by 48 percent, from 214 cases filed in fiscal year 1994 to 111 cases filed in fiscal year 2007.35 While the number of cases filed by the federal and state governments remained relatively constant over the period, the number of cases filed by other types of plaintiffs, such as businesses or private individuals, decreased by 69 percent—from 142 to 44 cases.36 These cases accounted for the majority of cases we reviewed. Attorneys and EPA officials we spoke with confirmed this decreasing trend. Figure 5 shows trends in the number of cases filed during this
35Our analysis included civil cases filed in 88 of 94 U.S. district courts that were categorized as having a CERCLA cause of action from fiscal years 1994 through 2007. This analysis does not capture cases filed in state or local courts, or bankruptcy courts. In addition, our search methodology may have missed certain cases filed in federal courts involving CERCLA claims, but which were categorized with a different primary cause of action. See appendix I for a more detailed discussion of the potential limitations of our search methodology. Also, see appendix II for more information on the results of this analysis.
36Because cases can have more than one type of plaintiff, we categorized cases, as follows, to avoid over counting the total number of cases filed. Federal government cases are those in which at least one plaintiff represented the federal government. State government cases are those in which at least one plaintiff represented a state government, but no plaintiff represented the federal government. Cases categorized as having other plaintiffs are those in which neither the federal nor a state government was a plaintiff. As shown in table 8, the large majority of other plaintiffs are private parties, such as businesses or private individuals.
Page 37 GAO-09-656 Superfund
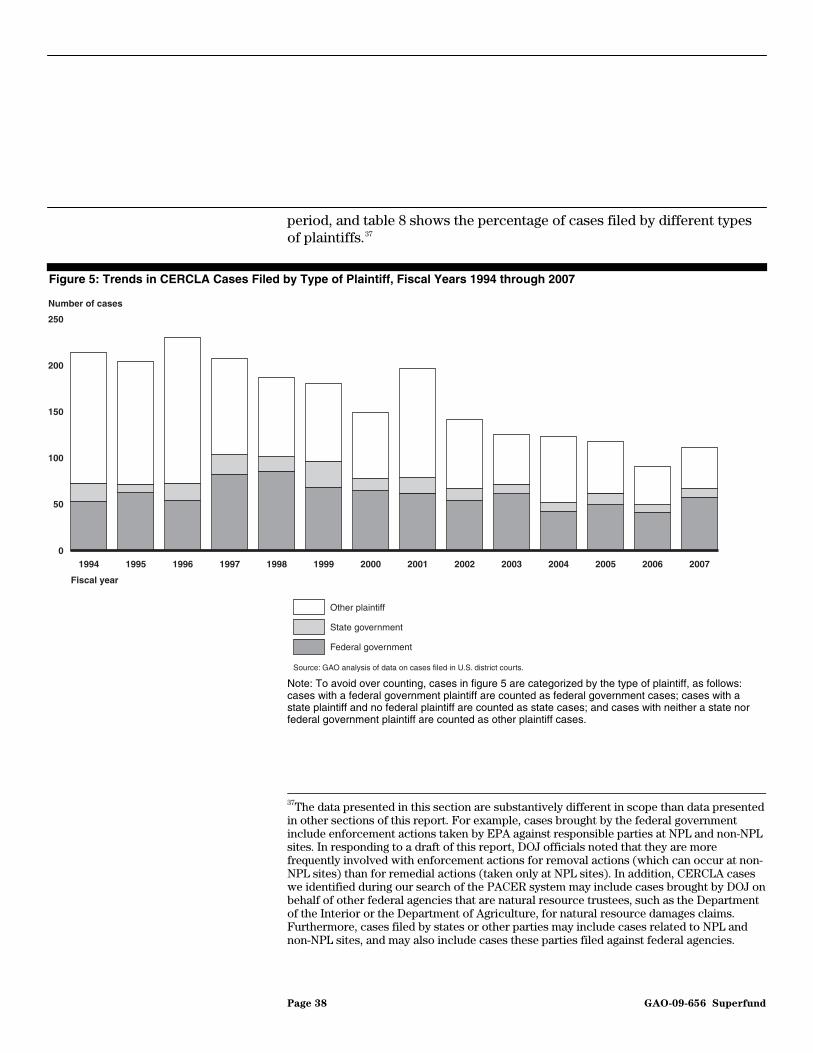
period, and table 8 shows the percentage of cases filed by different types of plaintiffs.37
Figure 5: Trends in CERCLA Cases Filed by Type of Plaintiff, Fiscal Years 1994 through 2007
Number of cases
Fiscal year
Other plaintiff
State government
Federal government
Source: GAO analysis of data on cases filed in U.S. district courts.
0
50
100
150
200
250
20072006200520042003200220012000199919981997199619951994
Note: To avoid over counting, cases in figure 5 are categorized by the type of plaintiff, as follows: cases with a federal government plaintiff are counted as federal government cases; cases with a state plaintiff and no federal plaintiff are counted as state cases; and cases with neither a state nor federal government plaintiff are counted as other plaintiff cases.
37The data presented in this section are substantively different in scope than data presented in other sections of this report. For example, cases brought by the federal government include enforcement actions taken by EPA against responsible parties at NPL and non-NPL sites. In responding to a draft of this report, DOJ officials noted that they are more frequently involved with enforcement actions for removal actions (which can occur at non-NPL sites) than for remedial actions (taken only at NPL sites). In addition, CERCLA cases we identified during our search of the PACER system may include cases brought by DOJ on behalf of other federal agencies that are natural resource trustees, such as the Department of the Interior or the Department of Agriculture, for natural resource damages claims. Furthermore, cases filed by states or other parties may include cases related to NPL and non-NPL sites, and may also include cases these parties filed against federal agencies.
Page 38 GAO-09-656 Superfund
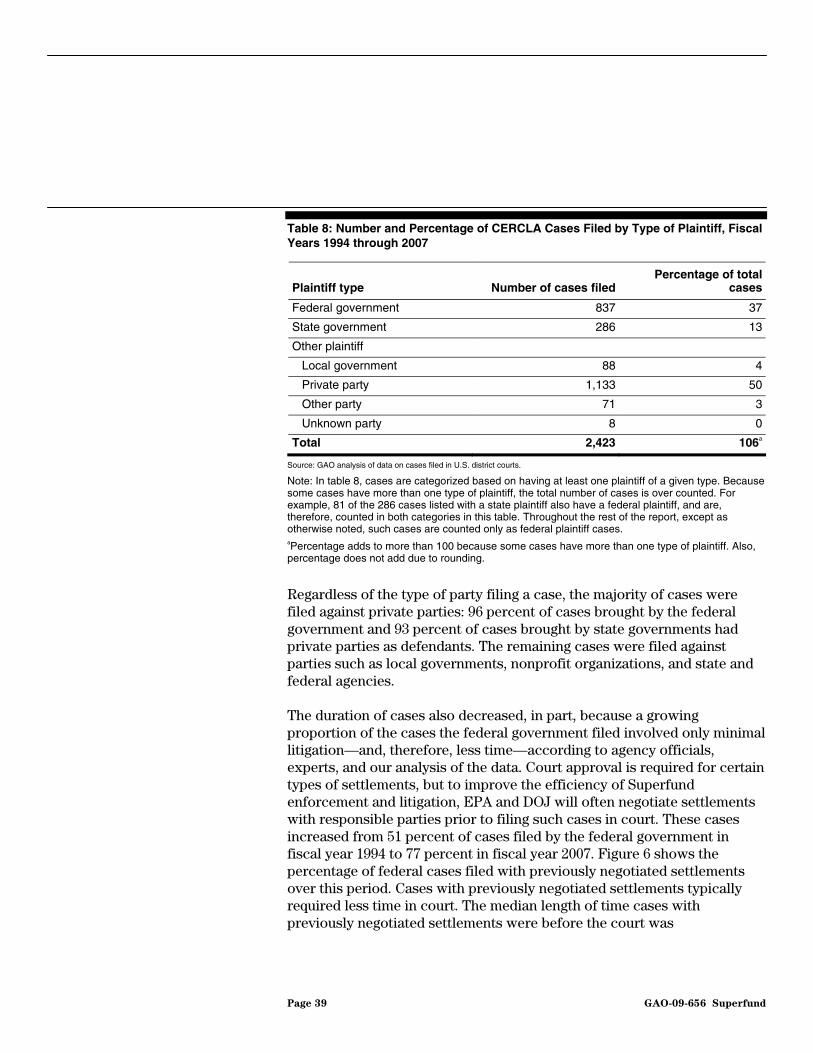
Table 8: Number and Percentage of CERCLA Cases Filed by Type of Plaintiff, Fiscal Years 1994 through 2007
Plaintiff type Number of cases filed Percentage of total
cases
Federal government 837 37
State government 286 13
Other plaintiff
Local government 88 4
Private party 1,133 50
Other party 71 3
Unknown party 8 0
Total 2,423 106a
Source: GAO analysis of data on cases filed in U.S. district courts.
Note: In table 8, cases are categorized based on having at least one plaintiff of a given type. Because some cases have more than one type of plaintiff, the total number of cases is over counted. For example, 81 of the 286 cases listed with a state plaintiff also have a federal plaintiff, and are, therefore, counted in both categories in this table. Throughout the rest of the report, except as otherwise noted, such cases are counted only as federal plaintiff cases. aPercentage adds to more than 100 because some cases have more than one type of plaintiff. Also, percentage does not add due to rounding.
Regardless of the type of party filing a case, the majority of cases were filed against private parties: 96 percent of cases brought by the federal government and 93 percent of cases brought by state governments had private parties as defendants. The remaining cases were filed against parties such as local governments, nonprofit organizations, and state and federal agencies.
The duration of cases also decreased, in part, because a growing proportion of the cases the federal government filed involved only minimal litigation—and, therefore, less time—according to agency officials, experts, and our analysis of the data. Court approval is required for certain types of settlements, but to improve the efficiency of Superfund enforcement and litigation, EPA and DOJ will often negotiate settlements with responsible parties prior to filing such cases in court. These cases increased from 51 percent of cases filed by the federal government in fiscal year 1994 to 77 percent in fiscal year 2007. Figure 6 shows the percentage of federal cases filed with previously negotiated settlements over this period. Cases with previously negotiated settlements typically required less time in court. The median length of time cases with previously negotiated settlements were before the court was
Page 39 GAO-09-656 Superfund
approximately 3 months, compared with nearly 16 months for cases in which settlements were not reached prior to filing.38
Figure 6: CERCLA Cases Filed by the Federal Government with Previously Negotiated Settlements, Fiscal Years 1994 through 2007
Percentage of federal plaintiff cases
Source: GAO analysis of data on cases filed in U.S. district courts.
Fiscal year
0
10
20
30
40
50
60
70
80
90
20072006200520042003200220012000199919981997199619951994
Finally, the complexity of CERCLA cases, represented by the number of defendants in cases and the number of cases in which defendants pursued additional parties, decreased from fiscal years 1994 through 2007. The average number of defendants per case decreased from approximately 23 defendants to 6, as shown in figure 7. In addition, the percentage of cases in which one or more defendants pursued additional parties to bring them
38We measured case duration from the date the docket indicated that the case was filed in court through the date the docket indicated the case was closed or terminated. For those cases that were not closed or terminated as of September 30, 2007, we measured duration from the date of filing through September 30, 2007. The data showed a similar trend in the duration of cases when only closed cases were considered. Our analysis of case duration does not account for any time spent negotiating out of court prior to filing the case. See appendix II for more information on the results of this analysis.
Page 40 GAO-09-656 Superfund
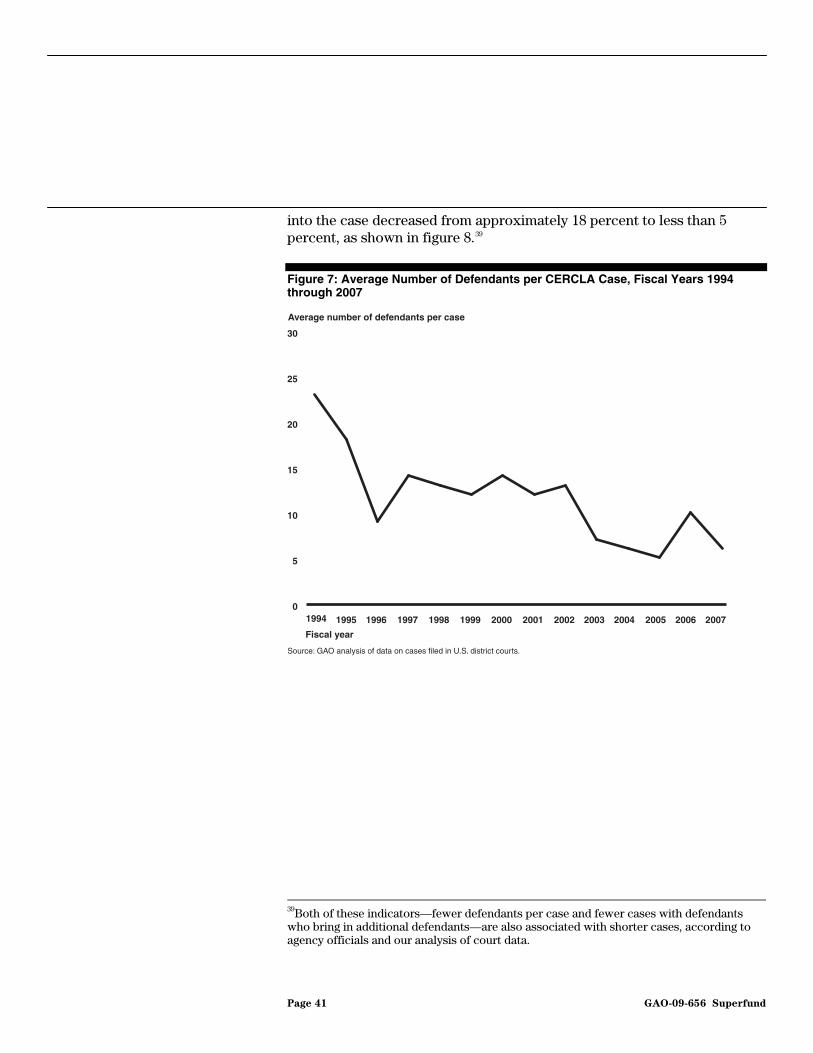
into the case decreased from approximately 18 percent to less than 5 percent, as shown in figure 8.39
Figure 7: Average Number of Defendants per CERCLA Case, Fiscal Years 1994 through 2007
Average number of defendants per case
Source: GAO analysis of data on cases filed in U.S. district courts.
Fiscal year
0
5
10
15
20
25
30
20072006200520042003200220012000199919981997199619951994
39Both of these indicators—fewer defendants per case and fewer cases with defendants who bring in additional defendants—are also associated with shorter cases, according to agency officials and our analysis of court data.
Page 41 GAO-09-656 Superfund
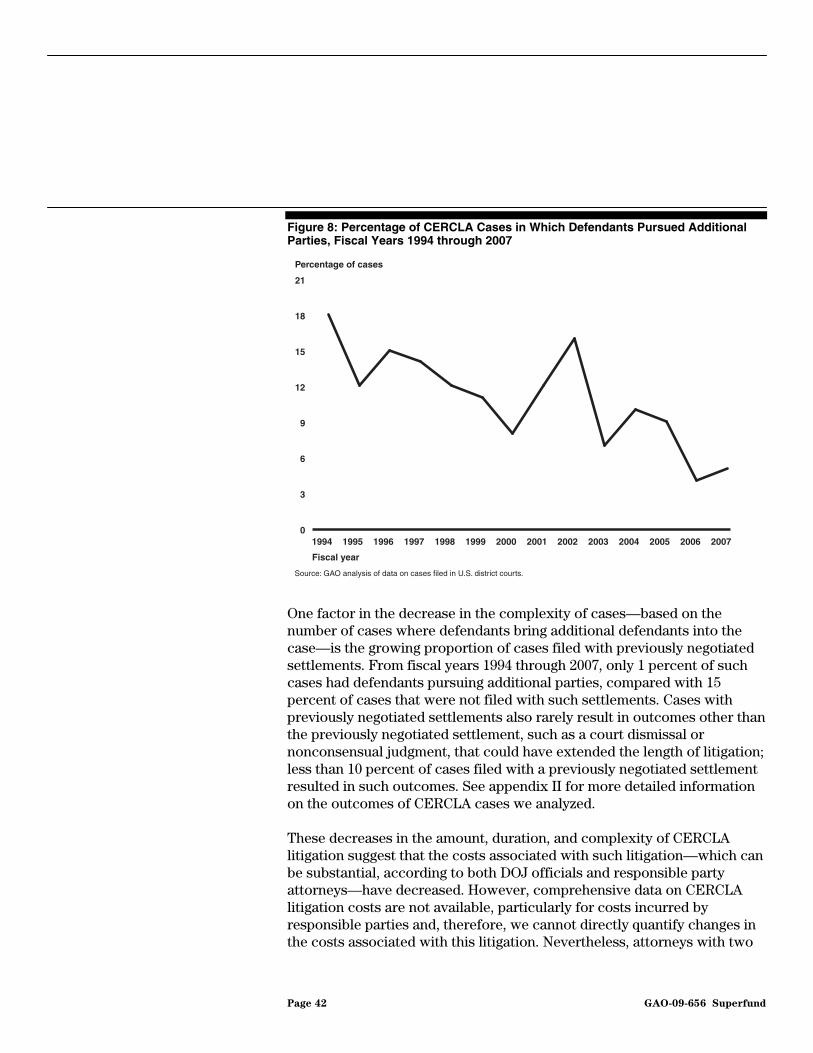
Figure 8: Percentage of CERCLA Cases in Which Defendants Pursued Additional Parties, Fiscal Years 1994 through 2007
Percentage of cases
Source: GAO analysis of data on cases filed in U.S. district courts.
Fiscal year
0
3
6
9
12
15
18
21
20072006200520042003200220012000199919981997199619951994
One factor in the decrease in the complexity of cases—based on the number of cases where defendants bring additional defendants into the case—is the growing proportion of cases filed with previously negotiated settlements. From fiscal years 1994 through 2007, only 1 percent of such cases had defendants pursuing additional parties, compared with 15 percent of cases that were not filed with such settlements. Cases with previously negotiated settlements also rarely result in outcomes other than the previously negotiated settlement, such as a court dismissal or nonconsensual judgment, that could have extended the length of litigation; less than 10 percent of cases filed with a previously negotiated settlement resulted in such outcomes. See appendix II for more detailed information on the outcomes of CERCLA cases we analyzed.
These decreases in the amount, duration, and complexity of CERCLA litigation suggest that the costs associated with such litigation—which can be substantial, according to both DOJ officials and responsible party attorneys—have decreased. However, comprehensive data on CERCLA litigation costs are not available, particularly for costs incurred by responsible parties and, therefore, we cannot directly quantify changes in the costs associated with this litigation. Nevertheless, attorneys with two
Page 42 GAO-09-656 Superfund
firms noted that because responsible parties are increasingly likely to settle out of court, a decline in the number of cases filed by these parties has contributed to the decrease in the number of new CERCLA cases. This decrease may have resulted in lower overall CERCLA litigation costs. Furthermore, the decreasing duration of cases as a result of previously negotiated settlements has probably contributed to a decrease in costs. The time spent in out-of-court negotiations, either among responsible parties or with EPA, is typically less costly than the time spent in court, according to attorneys we spoke with. For example, EPA and DOJ officials and private attorneys said that the costs of the discovery phase of litigation—when parties to a lawsuit may request and obtain information from each other, such as evidence that supports their claims or defenses—are particularly high. Finally, the decreasing complexity of CERCLA cases—in particular, the decreasing number of parties involved—has likely contributed to a decrease in total litigation costs. EPA’s expenditures for litigation, which decreased by 50 percent, from more than $50 million in fiscal year 1999 to $25 million in fiscal year 2007, provide further evidence of this trend.40
Superfund Litigation Has Decreased for Several Reasons
According to agency officials and attorneys we interviewed, the number, duration, and complexity of CERCLA cases decreased because of: (1) fewer site cleanups and fewer enforcement actions over time, (2) changes to EPA’s enforcement process that promoted settlement with responsible parties, and (3) court rulings that have clarified uncertainties about how the law should be interpreted and applied.
From fiscal years 1994 through 2007, litigation decreased, in part, because the government and private parties had fewer reasons to go to court, according to experts. For example, some attorneys noted that fewer sites were progressing through the Superfund cleanup process as the number of
Fewer Site Cleanups and Fewer Enforcement Actions Led to Less Litigation
40These expenditures include money spent establishing EPA’s Superfund claims when a responsible party files for bankruptcy, filing a judicial action charging criminal violation of CERCLA, preparing a case for referral to DOJ, and assisting the department in pursuing cases against responsible parties. Most DOJ activities funded by Superfund are coded as litigation expenditures in our analysis. The department provides information to EPA regarding the activities it carries out related to the Superfund program; however, because of differences in how EPA and the department code various activities, costs for some nonlitigation activities, such as the negotiation of settlements, may be included in this category.
Page 43 GAO-09-656 Superfund
new sites added to the NPL declined.41 Between fiscal years 1994 and 2007, 320 sites were listed on the NPL, compared with 1,244 sites for fiscal years 1983 through 1993. Furthermore, as cleanups continued at sites, the number of active NPL sites—those sites that had yet to reach construction complete—decreased by about one-half from fiscal years 1994 through 2007.
In addition, the number of Superfund enforcement actions EPA completed decreased by 44 percent between fiscal years 1994 and 2007. According to EPA officials, with fewer sites being cleaned up, there were fewer sites where EPA needed to take an enforcement action. The officials also cited a slow but steady decline in the agency’s enforcement budget as a factor that may have contributed to fewer enforcement actions. Furthermore, they noted that the agency was more likely to take certain types of actions, such as enforcement actions against parties that contributed small amounts of waste, earlier in the program. Additionally, over time, some types of parties have received exemptions to liability through amendments to CERCLA, which could reduce the number of enforcement actions taken. EPA officials specifically cited the exemptions included in the Superfund recycling equity amendments of 1999 as contributing to the decrease in CERCLA litigation.
Litigation also decreased because, through its Superfund administrative reforms and other changes to its enforcement process, EPA further promoted settlements with responsible parties, especially settlements negotiated prior to filing a case in court. Before EPA initiated its reforms in fiscal year 1993, 74 percent of its enforcement actions were resolved consensually. In comparison, after fiscal year 1997, when EPA’s implementation of many of these reforms peaked, 84 percent of enforcement actions were consensual. In particular, unilateral administrative orders, which were the most common nonconsensual action EPA took against parties, decreased from about 25 percent of EPA’s enforcement actions prior to fiscal year 1993 to approximately 14 percent after fiscal year 1997.
Changes to EPA’s Enforcement Process Have Led to Less Litigation
41While one attorney cited fewer NPL sites as a potential explanation for the decrease in litigation, we acknowledge that this provides only a partial justification for the decrease because parties may initiate CERCLA litigation concerning NPL or non-NPL sites. As a result of data limitations, we did not assess the extent to which the CERCLA cases we identified through our search of the PACER system related to NPL versus non-NPL sites.
Page 44 GAO-09-656 Superfund
Agency officials said that changes in EPA’s enforcement of the Superfund program, such as those made through its administrative reforms, encouraged parties to settle more often and earlier in the enforcement process. According to agency documentation, EPA instituted the following reforms, among others, to make the Superfund program work faster, more fairly, and more efficiently:
• Orphan share compensation. When a responsible party cannot be found or is insolvent, that share of the site cost is known as an orphan share. In some instances, EPA offers settling parties compensation for a portion of this share, which the parties would otherwise have to pay, so that they are more willing to settle.
• De minimis settlements. These settlements provide protection from additional liability for small waste contributors. EPA promoted the early use of these settlements so that such parties could quickly resolve their liability and avoid further involvement in site cleanup or litigation. Eliminating these parties facilitates settlements among the remaining parties at the site, according to EPA guidance and attorneys representing responsible parties.
• Ability to pay settlements. EPA promoted the early use of these settlements, which resolve the financial liability of responsible parties at a reduced amount for those who demonstrate that they cannot pay their full share of cleanup costs.
• Equitable issuance of unilateral administrative orders. Through this reform, EPA expected to increase the likelihood of settlement and reduce litigation by ensuring that unilateral orders were issued equitably. EPA attempted to ensure this by requiring regions to document that unilateral administrative orders had been issued to all appropriate parties after considering their liability and financial viability, as well as the extent to which they contributed to the contamination at the site.
• Responsible party search pilots. EPA tested several techniques to expedite and improve the process of searching for responsible parties.42
42In addition to changes to EPA’s enforcement process, the administrative reforms included changes to its approach to cleaning up sites, assessing risks at sites, involving the public, and redeveloping contaminated sites. For a detailed description of the reforms and their impact on the Superfund program, see GAO, Superfund: Extent to Which Most Reforms
Have Improved the Program Is Unknown, GAO/RCED-00-118 (Washington, D.C.: May 12, 2000). Although we found a difference in the frequency with which EPA was able to reach a settlement with responsible parties before and after the implementation of the agency’s administrative reforms, we did not assess the impact of any individual reform.
Page 45 GAO-09-656 Superfund
Several of EPA’s reforms, such as the promotion of de minimis settlements, encouraged the increased use of tools that the agency was already equipped with; while others, such as orphan share offers, were new tools for EPA to use to encourage settlements.
According to attorneys we spoke with, EPA’s Superfund enforcement is fairer because of the administrative reforms. As a result, several attorneys said that responsible parties were more likely to settle with EPA to conduct or fund site cleanup. However, two attorneys said that the amount of compensation EPA offers to cover orphan shares is too small to be effective in many cases. That is, the agency provides compensation to settling parties for only a percentage of the costs it has already spent cleaning up the site, or the total past and future oversight costs (whichever is less). Therefore, whatever portion of the orphan share is left to be cleaned up must be paid for by the settling parties. One attorney noted that, because the amount EPA spends cleaning up a site is likely to increase over time, its policy of only offering compensation for past costs can actually discourage early settlements since responsible parties may want to wait for the amount of the offer to increase as EPA spends more money on cleanup.
In addition, through reforms, such as the equitable issuance of unilateral administrative orders and the responsible party search pilot, as well as efforts to share information regarding site contamination among all responsible parties at a site, EPA encouraged identification of and enforcement against all responsible parties. Attorneys from two firms and DOJ officials said such changes in EPA’s enforcement process promoted less complex cases. According to attorneys we spoke with, EPA’s responsible party search process has become more thorough, and the process is fairer now than in the program’s earlier years, when EPA was more likely to pursue only a few large responsible parties. When EPA targets more of the potentially responsible parties at a site, the parties may be less resistant to settling because they are less likely to be held responsible for cleaning up waste contributed by parties not included in the settlement.
While changes to EPA’s enforcement process promoted more frequent settlements, DOJ officials we spoke with also attributed the increase in settlements negotiated prior to going to court to an executive order issued
Page 46 GAO-09-656 Superfund

in 1991.43 This order requires all federal agencies and their counsel to make reasonable efforts to achieve a settlement with parties before filcomplaint in civil court. DOJ officials said that they send letters to all parties in CERCLA cases offering them the opportunity to participate in negotiations prior to filing a case, and that parties who take advantage of this offer can have significantly lower costs associated with negotiation and litigation than those who do not. In addition, they noted that when a party waits to settle, the department has more time to build a case against it, which can result in less favorable outcomes for the party.
ing a
Court decisions that clarified initial issues concerning the application of CERCLA created more certainty among responsible parties about the extent of their liability and led to fewer lawsuits, according to experts.44 EPA and DOJ officials, as well as several attorneys, told us that parties are less likely to enter into protracted litigation when they are more certain of the probable outcomes, and that the courts have reduced uncertainty by deciding on some disputed aspects of Superfund liability. In particular, DOJ officials and attorneys representing responsible parties noted that the government’s ability to recover all of its cleanup costs at a site from one responsible party when the harm from contamination is indivisible—known as joint and several liability—was established by federal courts in the early years of the Superfund program.45 Consequently, parties can assess with some certainty whether they could be held liable for all cleanup costs at a site and, according to attorneys and agency officials, they often decide to settle because of the threat of joint and several liability. Similarly, courts have ruled that CERCLA liability is strict, that is, the government and private parties can hold responsible parties liable for the contamination they caused, regardless of whether their conduct was
Court Decisions Clarifying the Application of CERCLA Have Led to Less Litigation
43Executive Order 12778 (1991). Executive Order 12988 (1996) revoked the earlier executive order, but contains an identical provision encouraging settlement.
44In addition to cases shaping how the statute would be applied with respect to liability, courts upheld CERCLA against various constitutional challenges in a series of cases in the 1980s.
45Cases interpreting liability under CERCLA to be joint and several include United States v.
Chem-Dyne Corp. (S.D. Ohio 1983), State of Colo. v. ASARCO, Inc. (D. Colo. 1985), U.S. v.
Northeastern Pharmaceutical & Chemical Co., Inc. (8th Cir. 1986), State of N.Y. v. Shore
Realty Corp. (2d Cir. 1985), and U.S. v. Dickerson (D. Md. 1986). Recently, the Supreme Court upheld the principle of joint and several liability as the general rule; see Burlington
N. & Santa Fe Ry. Co. v. United States (U.S. 2009).
Page 47 GAO-09-656 Superfund
negligent.46 Finally, courts have consistently upheld the retroactive nature of CERCLA liability, which means that parties can be held liable for the cleanup of contamination from actions that occurred prior to the enactment of CERCLA.47 DOJ officials attributed the success of the Superfund program to the principles of joint and several, strict, and retroactive liability.
However, several of the experts we spoke with indicated that recent or upcoming court decisions may affect the certainty regarding some issues and, thus, could affect future litigation trends. In particular, some attorneys noted several unresolved issues concerning the circumstances under which one responsible party can sue another for contribution or cost recovery.48 They said that if parties believe their ability to sue other parties for contribution or cost recovery is in question, parties may be more reluctant to voluntarily clean up contamination or be less willing to settle with the government. A few attorneys also raised concerns about the scope of contribution protection under CERCLA, and the extent to which CERCLA settlements protect parties from liability under certain CERCLA provisions, as well as other laws.49 While EPA settlements establish
46Cases interpreting CERCLA liability as strict include U.S. v. Miami Drum Services, Inc.
(S.D. Fla. 1986), U.S. v. Conservation Chemical Co. (W.D. Mo. 1984), U.S. v. Price (D.N.J. 1983), and U.S. v. Northeastern Pharmaceutical and Chemical Co., Inc. (W.D. Mo. 1984).
47Courts have upheld CERCLA’s imposition of liability for actions that occurred prior to the statute, finding that the Congress intended CERCLA to apply retroactively. For example, see United States v. Dico, Inc. (8th Cir. 2001), and United States v. Olin Corp. (11th Cir. 1997). As to liability for natural resource damages, however, CERCLA provides that there is no liability when the release of hazardous substances and the resulting damages that occurred were “wholly before” CERCLA was enacted. See In re Acushnet River and New
Bedford Harbor: Proceedings re Alleged PCB Pollution (D. Mass. 1989).
48The Supreme Court decisions in Cooper Industries, Inc. v. Aviall Services Inc. (2004), and United States v. Atlantic Research Corp. (2007), addressed the question of whether responsible parties, in particular circumstances, can bring contribution or other claims under specific provisions of CERCLA. However, according to DOJ officials, these cases did not resolve all of the issues in this area and there is a significant amount of litigation. See, for example, W.R. Grace & Co. – Conn. v. Zotos International, Inc. (2d Cir. 2009); Kotrous
v. Goss-Jewett Co. (9th Cir. 2008); and ITT Industries, Inc. v. BorgWarner, Inc. (6th Cir. 2007).
49For example, the Supreme Court held in United States v. Atlantic Research Corp. that a particular CERCLA contribution protection provision operates to block claims, but in a comment to the decision, the Court suggested that the contribution protection provision does not affect other claims. This comment raised questions about whether parties that enter into settlement agreements would receive protection against other claims under CERCLA. Another issue that attorneys with one firm raised is whether CERCLA’s contribution protection operates to block state law claims.
Page 48 GAO-09-656 Superfund
contribution protection as a way to encourage parties to settle, parties may have less incentive to settle if they have doubts about the effectiveness of the protection. EPA officials stated that their key concern with decisions in cases involving these issues is whether these decisions maintain the benefits of settling with the government for responsible parties. In addition, following a recent Supreme Court decision regarding the conditions under which site contamination is divisible under CERCLA—and, therefore, the liability is capable of being apportioned among different parties, rather than each party being held jointly and severally liable—parties may reassess their willingness to litigate over divisibility issues, which could affect future trends in Superfund litigation.50 Furthermore, DOJ officials expressed concern about the potential implications of a challenge to EPA’s use of unilateral administrative orders.51
Finally, successor and parent company liability are also unsettled issues. According to a few experts, the circumstances under which successor companies—companies that legally acquire or merge with another company—can be held liable for contamination created by the companies they succeed is still being debated in the courts. The liability of parent companies, or companies that own and control another company, is similarly unresolved, according to DOJ officials and a few attorneys. The DOJ officials and one of the attorneys noted that the requirements for
50Although CERCLA provides joint and several liability, courts have long held that apportionment is proper when there is a reasonable basis for determining the contribution of each cause to the site contamination. In Burlington N. & Santa Fe Ry. Co. v. United
States (U.S. 2009), the Supreme Court upheld the district court’s apportionment in a factually unique case and based on “detailed findings” by the district court. The case is notable because, until now, there have been few cases where courts found the harm to be divisible so as to avoid the general rule of joint and several liability. According to DOJ officials, as this case was just decided, it is too early to determine whether it will have a significant impact on the enforcement of the Superfund program.
51In General Electric v. Johnson (D.D.C. 2005), the district court for the District of Columbia rejected a constitutional challenge to the unilateral administrative order provisions of CERCLA, holding that, on their face, they comport with due process requirements. In a subsequent ruling in the same case, General Electric v. Jackson (D.D.C. 2009), the court upheld EPA’s use of unilateral administrative orders against a challenge that the agency’s pattern and practice of using those orders violated responsible parties’ constitutional right to due process. The case is now on appeal to the U.S. Court of Appeals for the District of Columbia Circuit. Similar issues have been raised in another case, City of
Rialto v. U.S. Dep’t of Defense (C.D. Cal. Nov. 29, 2007 and Feb. 5, 2008); now on appeal to the U.S. Court of Appeals for the 9th Circuit.
Page 49 GAO-09-656 Superfund
establishing a parent company’s liability for the contamination caused by a company that it owns are challenging.
While the number of sites added to the NPL each year has declined significantly since the Superfund program’s early years, the types of sites added in recent years are more costly to clean up, and may not have viable responsible parties to perform or pay for the work. Furthermore, even though remedial actions at most sites are completed or underway, the amount of work remaining is unclear; and, given the nature of sites that are not yet construction complete, the remaining work may be more complex or costly. These changes have occurred even as Superfund appropriations and expenditures have declined. However, EPA does not provide the Congress with sufficient information to make decisions about future funding needs of the Superfund program.
Differences in the Types of Sites on the NPL and Other Factors Make It Difficult to Assess the Status of Superfund Site Cleanups and Program Costs
The Number and Types of Sites Added to the NPL Have Changed Over Time, but Trends in Sites without Viable Responsible Parties Are Unclear
We identified three factors that could affect EPA’s ability to fund and conduct site cleanups: (1) the number of sites on the NPL has declined over time; (2) the types of sites added to the NPL may require greater EPA expenditures for cleanup; and (3) fewer sites may have responsible parties who can contribute to cleanup, although EPA data do not clearly indicate the number of sites without viable responsible parties or the value of the orphan shares at sites.
As figure 9 shows, the number of nonfederal sites added to the NPL has declined over time.52 In 1983, the first year of the NPL, EPA added over 400 sites, but EPA added only an average of 20 new sites annually for fiscal years 1998 through 2007.53
The Number of Sites Added to the NPL Has Declined Due to Several Factors
52Unless otherwise noted, data analyzed for this section of the report only represents data on final and deleted nonfederal NPL sites.
53By the end of fiscal year 2007, EPA had proposed 61 nonfederal sites that it either decided not to list, or had not yet determined whether to list on the NPL.
Page 50 GAO-09-656 Superfund
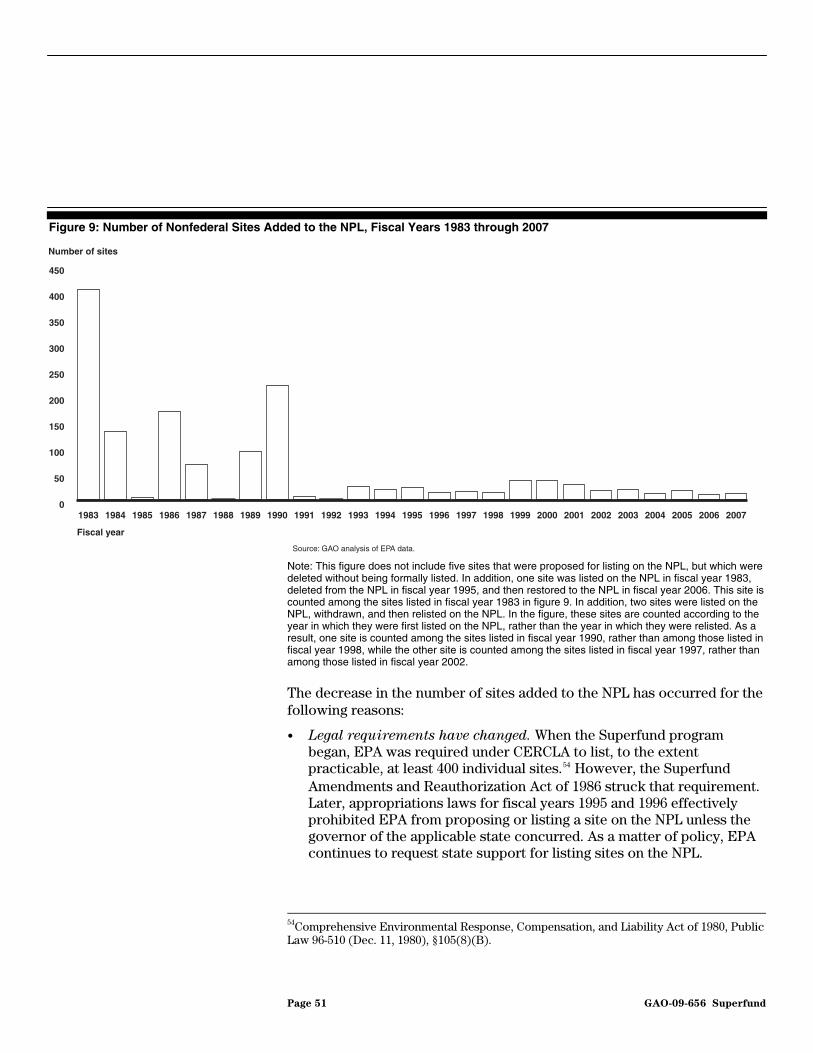
Figure 9: Number of Nonfederal Sites Added to the NPL, Fiscal Years 1983 through 2007
Number of sites
Fiscal year
Source: GAO analysis of EPA data.
0
50
100
150
200
250
300
350
400
450
2007200620052004200320022001200019991998199719961995199419931992199119901989198819871986198519841983
Note: This figure does not include five sites that were proposed for listing on the NPL, but which were deleted without being formally listed. In addition, one site was listed on the NPL in fiscal year 1983, deleted from the NPL in fiscal year 1995, and then restored to the NPL in fiscal year 2006. This site is counted among the sites listed in fiscal year 1983 in figure 9. In addition, two sites were listed on the NPL, withdrawn, and then relisted on the NPL. In the figure, these sites are counted according to the year in which they were first listed on the NPL, rather than the year in which they were relisted. As a result, one site is counted among the sites listed in fiscal year 1990, rather than among those listed in fiscal year 1998, while the other site is counted among the sites listed in fiscal year 1997, rather than among those listed in fiscal year 2002.
The decrease in the number of sites added to the NPL has occurred for the following reasons:
• Legal requirements have changed. When the Superfund program began, EPA was required under CERCLA to list, to the extent practicable, at least 400 individual sites.54 However, the Superfund Amendments and Reauthorization Act of 1986 struck that requirement. Later, appropriations laws for fiscal years 1995 and 1996 effectively prohibited EPA from proposing or listing a site on the NPL unless the governor of the applicable state concurred. As a matter of policy, EPA continues to request state support for listing sites on the NPL.
54Comprehensive Environmental Response, Compensation, and Liability Act of 1980, Public Law 96-510 (Dec. 11, 1980), §105(8)(B).
Page 51 GAO-09-656 Superfund

• Other cleanup programs have been used to clean up sites. According to EPA officials and Superfund experts representing responsible parties, state programs or other federal programs have been developed to clean up sites. In the early years of Superfund, few other means were available to address hazardous waste sites, particularly abandoned sites. In 2003, we reported that EPA regional and state officials considered the NPL a “last resort” for sites that cannot be addressed through other programs.55 Most states have established programs to help address hazardous waste sites, and EPA’s policy is to defer NPL listing for sites that can be effectively cleaned up under these programs. Federal programs that assist with cleaning up hazardous waste sites and that potentially reduce the need for sites to be listed on the NPL include the Superfund Alternative Approach,56 the Resource Conservation and Recovery Act (RCRA) Corrective Action program,57 and the Brownfields program,58 according to EPA officials.
• Removal actions may have helped clean up sites. According to a responsible party attorney and a representative of a public interest group, removal actions may address contamination issues at some sites without listing the sites on the NPL. As of the end of fiscal year 2007, the agency or responsible parties had started over 10,000 removal
55GAO, Superfund Program: Current Status and Future Fiscal Challenges, GAO-03-850 (Washington, D.C.: July 31, 2003).
56Under the Superfund Alternative Approach, EPA seeks to achieve responsible party CERCLA cleanup of sites that are eligible for, but are not listed on, the NPL. Superfund trust fund appropriations cannot be used for remedial actions at these sites and, therefore, a responsible party must be willing to perform the remedial action. According to a September 2007 EPA evaluation, 22 sites had cleanup agreements established using the Superfund Alternative Approach, and 40 other sites might be possible candidates for this approach.
57Under the RCRA Corrective Action program, EPA requires RCRA-regulated facilities to investigate and clean up releases of hazardous waste. Such cleanups are conducted under the authority of RCRA, rather than CERCLA. These RCRA corrective action authorities were enhanced in 1984.
58EPA’s Brownfields program assists in assessing and cleaning up abandoned, idled, or underused industrial and commercial facilities. According to an OSWER official, the Brownfields program is reserved for sites that are relatively less contaminated than Superfund sites, and that have a greater potential for rehabilitation. Brownfields sites may be cleaned up under CERCLA, RCRA, or state voluntary programs.
Page 52 GAO-09-656 Superfund

actions at sites, and 72 percent of these actions were at sites that had not been listed on the NPL, according to EPA data.59
• Waste handling practices may have helped prevent new sites from
being created. One Superfund legal expert and several responsible party attorneys suggested that the number of sites listed on the NPL may have declined because fewer new contaminated sites have been created. The attorneys attributed this decline in the number of new sites, at least partly, to improvements in waste handling practices.
• Funding constraints may have restrained EPA from listing sites. Experts representing public interest groups, an association of state agencies, and responsible parties stated that funding constraints may have affected EPA’s willingness to list a larger number of sites in recent years. In particular, state agency representatives indicated that, after EPA formed a headquarters group to review regional recommendations for new NPL site listings, the number of sites listed on the NPL each year decreased.60 The state agency representatives attributed this decrease to the group’s consideration of whether funds would be available to clean up a proposed site.61 EPA officials, however, told us that the cost of a site’s cleanup has not played a role in deciding whether to list a site on the NPL.
59Unlike other data presented in this section, the data on removals include both federal and nonfederal facilities because we did not obtain data on whether non-NPL sites are federal or nonfederal facilities. These data include all removal actions that were started, though not necessarily completed, prior to the end of fiscal year 2007.
60According to a 2004 report by the National Advisory Council for Environmental Policy and Technology, an advisory committee discussed, but did not reach a consensus recommendation on, the role that cost should play in decisions to list sites on the NPL. Some members of the committee believed that cost should not be used to limit or expand the number or types of sites listed on the NPL, as they believed the NPL should represent true national priorities—sites that meet the eligibility criteria and that require Superfund program resources to address. Other committee members believed that, over time, EPA is responsible for matching the size of the Superfund program to the level of funding provided. See National Advisory Council for Environmental Policy and Technology, Final
Report, (Washington, D.C., April 2004).
61Conversely, one expert we interviewed was critical of EPA’s approach to listing sites for not giving adequate consideration to funding. The expert stated that by listing sites on the NPL, EPA was committing to potentially spending hundreds of millions of dollars on cleanup work without identifying where the money for this work would come from.
Page 53 GAO-09-656 Superfund

The types of sites added to the NPL have changed. EPA places sites into the following six broad categories:
Types of Sites Now Added to the NPL May Require Greater EPA Cleanup Expenditures Than in the Past
• Manufacturing sites. Wood preservation and treatment, metal finishing and coating, electronic equipment, and other types of manufacturing facilities.
• Mining sites. Mining operations for metals or other substances.
• “Multiple” sites. Sites with operations that fall into more than one of EPA’s categories.
• “Other” sites. Sites that often have contaminated sediments or groundwater plumes with no identifiable source.
• Recycling sites. Battery, chemical, used oil recovery, or other types of recycling operations.
• Waste management sites. Landfills and other types of waste disposal facilities.
From fiscal years 1983 through 2007, more than 70 percent of the nonfederal sites added to the NPL were either manufacturing or waste management sites. In addition, about 11 percent of the sites added to the NPL were megasites—sites at which actual or expected total cleanup costs, including removal and remedial action costs, are expected to amount to $50 million or more.62 Mining and “multiple” sites represented the smallest categories of sites on the NPL, but were also the categories of sites with the highest percentage of megasites. Table 9 shows the number and percentage of sites, as well as the number and percentage of sites designated as megasites, in each of EPA’s six categories.
62These costs would include both EPA costs, as well as costs paid by responsible parties for site cleanup. EPA’s data classified sites as megasites, as well as potential megasites; however, we grouped both megasites and potential megasites together for purposes of this report.
Page 54 GAO-09-656 Superfund
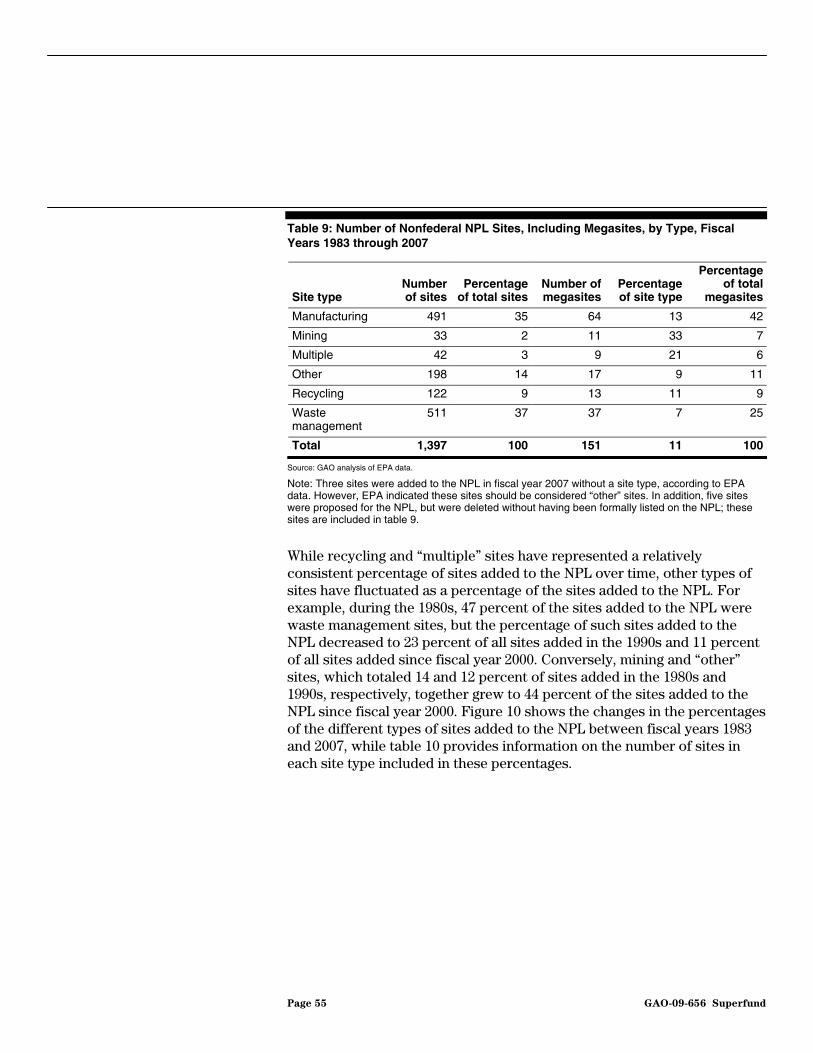
Table 9: Number of Nonfederal NPL Sites, Including Megasites, by Type, Fiscal Years 1983 through 2007
Site type Number of sites
Percentage of total sites
Number of megasites
Percentage of site type
Percentage of total
megasites
Manufacturing 491 35 64 13 42
Mining 33 2 11 33 7
Multiple 42 3 9 21 6
Other 198 14 17 9 11
Recycling 122 9 13 11 9
Waste management
511 37 37 7 25
Total 1,397 100 151 11 100
Source: GAO analysis of EPA data.
Note: Three sites were added to the NPL in fiscal year 2007 without a site type, according to EPA data. However, EPA indicated these sites should be considered “other” sites. In addition, five sites were proposed for the NPL, but were deleted without having been formally listed on the NPL; these sites are included in table 9.
While recycling and “multiple” sites have represented a relatively consistent percentage of sites added to the NPL over time, other types of sites have fluctuated as a percentage of the sites added to the NPL. For example, during the 1980s, 47 percent of the sites added to the NPL were waste management sites, but the percentage of such sites added to the NPL decreased to 23 percent of all sites added in the 1990s and 11 percent of all sites added since fiscal year 2000. Conversely, mining and “other” sites, which totaled 14 and 12 percent of sites added in the 1980s and 1990s, respectively, together grew to 44 percent of the sites added to the NPL since fiscal year 2000. Figure 10 shows the changes in the percentages of the different types of sites added to the NPL between fiscal years 1983 and 2007, while table 10 provides information on the number of sites in each site type included in these percentages.
Page 55 GAO-09-656 Superfund
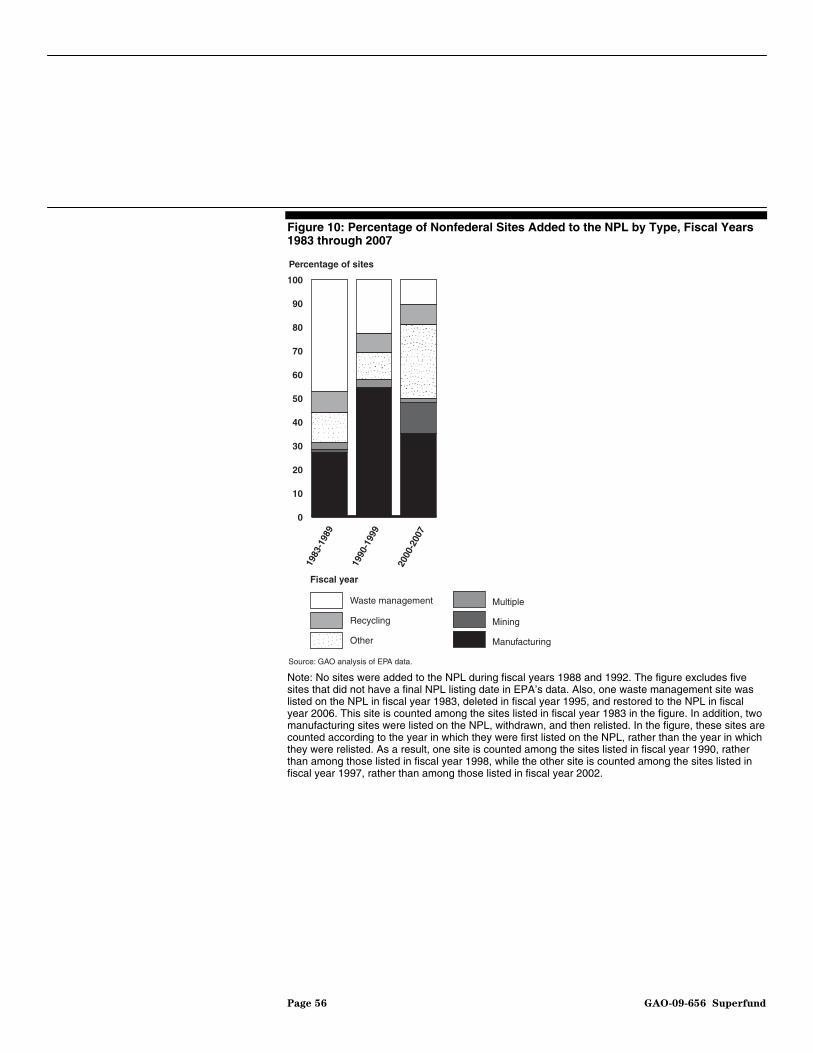
Figure 10: Percentage of Nonfederal Sites Added to the NPL by Type, Fiscal Years 1983 through 2007
Percentage of sites
Waste management
Recycling
Other
Multiple
Mining
Manufacturing
Fiscal year
Source: GAO analysis of EPA data.
0
10
20
30
40
50
60
70
80
90
100
2000
-200
7
1990
-199
9
1983
-198
9
Note: No sites were added to the NPL during fiscal years 1988 and 1992. The figure excludes five sites that did not have a final NPL listing date in EPA’s data. Also, one waste management site was listed on the NPL in fiscal year 1983, deleted in fiscal year 1995, and restored to the NPL in fiscal year 2006. This site is counted among the sites listed in fiscal year 1983 in the figure. In addition, two manufacturing sites were listed on the NPL, withdrawn, and then relisted. In the figure, these sites are counted according to the year in which they were first listed on the NPL, rather than the year in which they were relisted. As a result, one site is counted among the sites listed in fiscal year 1990, rather than among those listed in fiscal year 1998, while the other site is counted among the sites listed in fiscal year 1997, rather than among those listed in fiscal year 2002.
Page 56 GAO-09-656 Superfund
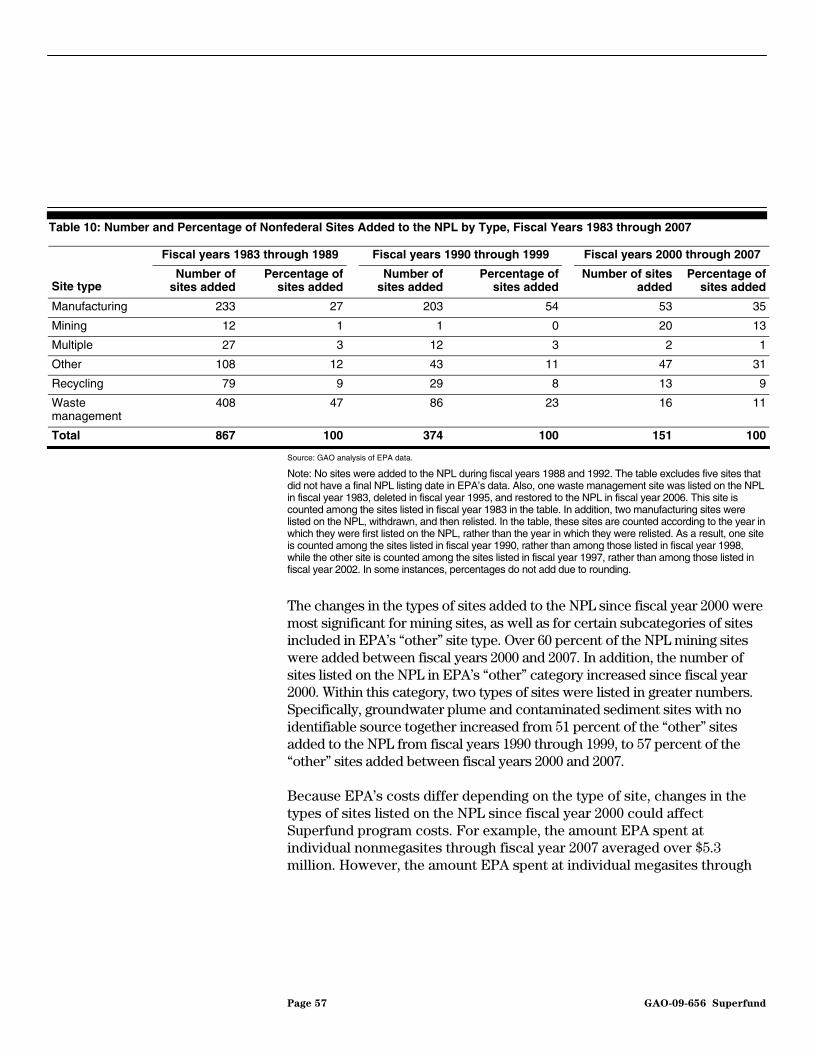
Table 10: Number and Percentage of Nonfederal Sites Added to the NPL by Type, Fiscal Years 1983 through 2007
Fiscal years 1983 through 1989 Fiscal years 1990 through 1999 Fiscal years 2000 through 2007
Site type Number of
sites added Percentage of
sites addedNumber of
sites addedPercentage of
sites added Number of sites
addedPercentage of
sites added
Manufacturing 233 27 203 54 53 35
Mining 12 1 1 0 20 13
Multiple 27 3 12 3 2 1
Other 108 12 43 11 47 31
Recycling 79 9 29 8 13 9
Waste management
408 47 86 23 16 11
Total 867 100 374 100 151 100
Source: GAO analysis of EPA data.
Note: No sites were added to the NPL during fiscal years 1988 and 1992. The table excludes five sites that did not have a final NPL listing date in EPA’s data. Also, one waste management site was listed on the NPL in fiscal year 1983, deleted in fiscal year 1995, and restored to the NPL in fiscal year 2006. This site is counted among the sites listed in fiscal year 1983 in the table. In addition, two manufacturing sites were listed on the NPL, withdrawn, and then relisted. In the table, these sites are counted according to the year in which they were first listed on the NPL, rather than the year in which they were relisted. As a result, one site is counted among the sites listed in fiscal year 1990, rather than among those listed in fiscal year 1998, while the other site is counted among the sites listed in fiscal year 1997, rather than among those listed in fiscal year 2002. In some instances, percentages do not add due to rounding.
The changes in the types of sites added to the NPL since fiscal year 2000 were most significant for mining sites, as well as for certain subcategories of sites included in EPA’s “other” site type. Over 60 percent of the NPL mining sites were added between fiscal years 2000 and 2007. In addition, the number of sites listed on the NPL in EPA’s “other” category increased since fiscal year 2000. Within this category, two types of sites were listed in greater numbers. Specifically, groundwater plume and contaminated sediment sites with no identifiable source together increased from 51 percent of the “other” sites added to the NPL from fiscal years 1990 through 1999, to 57 percent of the “other” sites added between fiscal years 2000 and 2007.
Because EPA’s costs differ depending on the type of site, changes in the types of sites listed on the NPL since fiscal year 2000 could affect Superfund program costs. For example, the amount EPA spent at individual nonmegasites through fiscal year 2007 averaged over $5.3 million. However, the amount EPA spent at individual megasites through
Page 57 GAO-09-656 Superfund
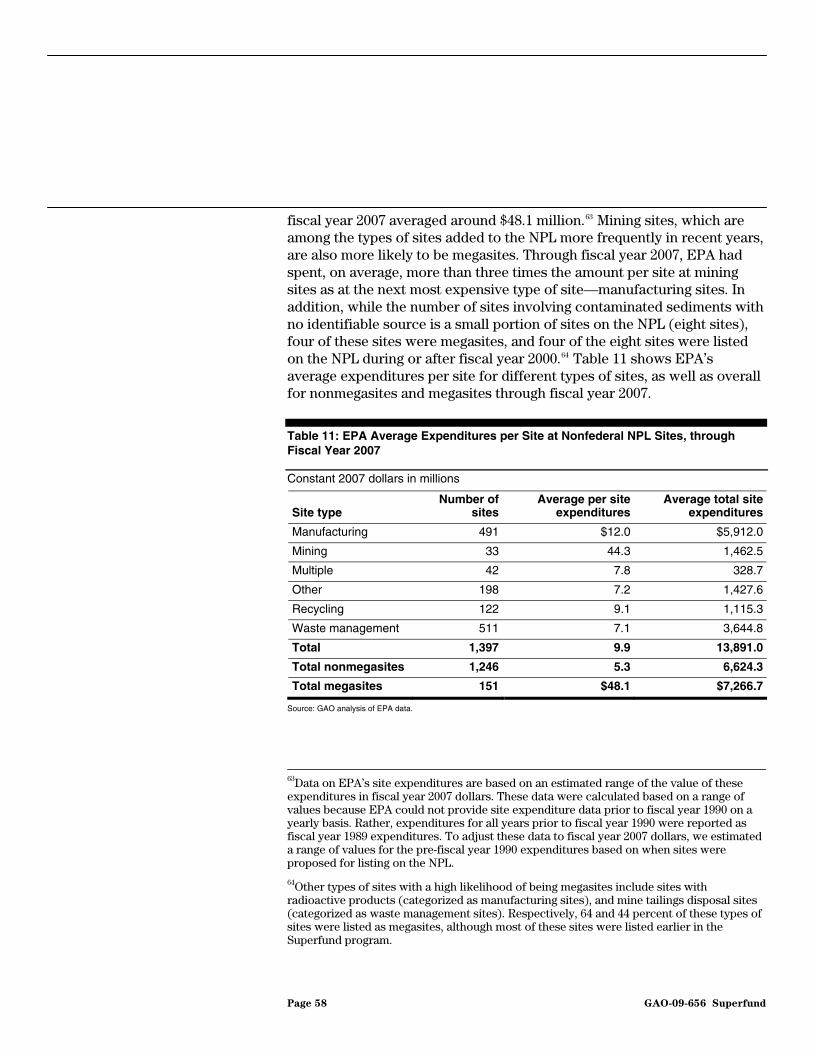
fiscal year 2007 averaged around $48.1 million.63 Mining sites, which are among the types of sites added to the NPL more frequently in recent years, are also more likely to be megasites. Through fiscal year 2007, EPA had spent, on average, more than three times the amount per site at mining sites as at the next most expensive type of site—manufacturing sites. In addition, while the number of sites involving contaminated sediments with no identifiable source is a small portion of sites on the NPL (eight sites), four of these sites were megasites, and four of the eight sites were listed on the NPL during or after fiscal year 2000.64 Table 11 shows EPA’s average expenditures per site for different types of sites, as well as ovefor nonmegasites and megasites through fiscal year 200
rall 7.
Table 11: EPA Average Expenditures per Site at Nonfederal NPL Sites, through Fiscal Year 2007
Constant 2007 dollars in millions
Site type Number of
sitesAverage per site
expenditures Average total site
expenditures
Manufacturing 491 $12.0 $5,912.0
Mining 33 44.3 1,462.5
Multiple 42 7.8 328.7
Other 198 7.2 1,427.6
Recycling 122 9.1 1,115.3
Waste management 511 7.1 3,644.8
Total 1,397 9.9 13,891.0
Total nonmegasites 1,246 5.3 6,624.3
Total megasites 151 $48.1 $7,266.7
Source: GAO analysis of EPA data.
63Data on EPA’s site expenditures are based on an estimated range of the value of these expenditures in fiscal year 2007 dollars. These data were calculated based on a range of values because EPA could not provide site expenditure data prior to fiscal year 1990 on a yearly basis. Rather, expenditures for all years prior to fiscal year 1990 were reported as fiscal year 1989 expenditures. To adjust these data to fiscal year 2007 dollars, we estimated a range of values for the pre-fiscal year 1990 expenditures based on when sites were proposed for listing on the NPL.
64Other types of sites with a high likelihood of being megasites include sites with radioactive products (categorized as manufacturing sites), and mine tailings disposal sites (categorized as waste management sites). Respectively, 64 and 44 percent of these types of sites were listed as megasites, although most of these sites were listed earlier in the Superfund program.
Page 58 GAO-09-656 Superfund
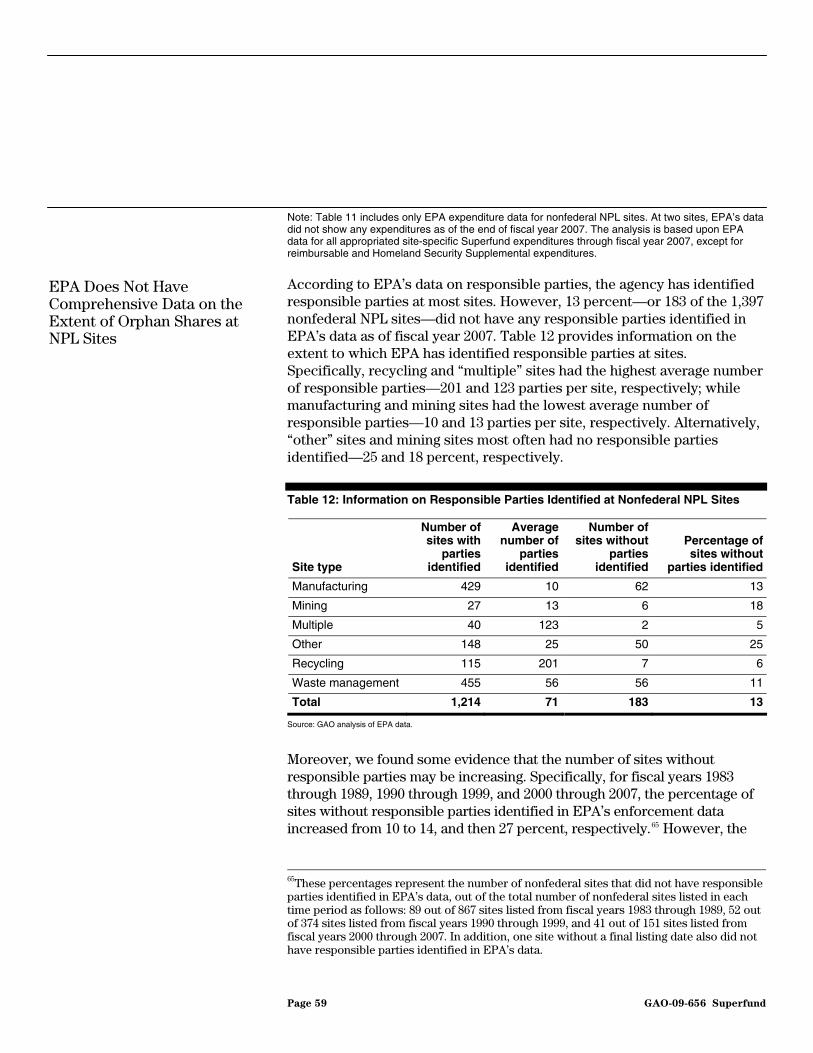
Note: Table 11 includes only EPA expenditure data for nonfederal NPL sites. At two sites, EPA’s data did not show any expenditures as of the end of fiscal year 2007. The analysis is based upon EPA data for all appropriated site-specific Superfund expenditures through fiscal year 2007, except for reimbursable and Homeland Security Supplemental expenditures.
According to EPA’s data on responsible parties, the agency has identified responsible parties at most sites. However, 13 percent—or 183 of the 1,397 nonfederal NPL sites—did not have any responsible parties identified in EPA’s data as of fiscal year 2007. Table 12 provides information on the extent to which EPA has identified responsible parties at sites. Specifically, recycling and “multiple” sites had the highest average number of responsible parties—201 and 123 parties per site, respectively; while manufacturing and mining sites had the lowest average number of responsible parties—10 and 13 parties per site, respectively. Alternatively, “other” sites and mining sites most often had no responsible parties identified—25 and 18 percent, respectively.
EPA Does Not Have Comprehensive Data on the Extent of Orphan Shares at NPL Sites
Table 12: Information on Responsible Parties Identified at Nonfederal NPL Sites
Site type
Number of sites with
parties identified
Average number of
parties identified
Number of sites without
parties identified
Percentage of sites without
parties identified
Manufacturing 429 10 62 13
Mining 27 13 6 18
Multiple 40 123 2 5
Other 148 25 50 25
Recycling 115 201 7 6
Waste management 455 56 56 11
Total 1,214 71 183 13
Source: GAO analysis of EPA data.
Moreover, we found some evidence that the number of sites without responsible parties may be increasing. Specifically, for fiscal years 1983 through 1989, 1990 through 1999, and 2000 through 2007, the percentage of sites without responsible parties identified in EPA’s enforcement data increased from 10 to 14, and then 27 percent, respectively.65 However, the
65These percentages represent the number of nonfederal sites that did not have responsible parties identified in EPA’s data, out of the total number of nonfederal sites listed in each time period as follows: 89 out of 867 sites listed from fiscal years 1983 through 1989, 52 out of 374 sites listed from fiscal years 1990 through 1999, and 41 out of 151 sites listed from fiscal years 2000 through 2007. In addition, one site without a final listing date also did not have responsible parties identified in EPA’s data.
Page 59 GAO-09-656 Superfund

usefulness of these data is limited, in part, because the extent to which the data represent the actual number of sites without viable responsible parties is unclear. For example, EPA’s data identifying individual sites without responsible parties do not indicate whether the agency has not been able to identify parties at these sites despite significant search efforts, or whether EPA’s search efforts are still in their early stages. This distinction is important because the absence of responsible parties in EPA’s data may not indicate that the agency will never identify responsible parties for a site.66 EPA may take longer to identify and take enforcement action against responsible parties at one site than at another. If EPA knows that a responsible party might be liable for a site’s cleanup, but the agency has not taken certain actions against that party, the responsible party would not be identified in EPA’s database.67 Furthermore, recent advances in forensic auditing of insurance claims and chemical fingerprinting analyses may help to link responsible parties to sites where previously it was not possible to do so. As a result, EPA may eventually identify responsible parties at some of the sites where they are not currently identified.68 At the same time, however, EPA typically starts its search for responsible parties no later than when a site is listed on the NPL. Moreover, some of the changes EPA made to its enforcement process as part of its administrative reforms were designed to identify responsible parties earlier in the search process. Therefore, the longer a site has been on the NPL without identifying any responsible parties, the less likely it may be that EPA will identify parties for the site in the future.
In addition, we identified other problems with the comprehensiveness and reliability of EPA’s data on the responsible parties associated with sites.
66We did not obtain information from EPA about the status of the agency’s efforts to identify responsible parties at the 183 sites that did not have responsible parties identified in EPA’s data.
67EPA records a responsible party in its CERCLIS database as being associated with an individual site following any one of three actions: if the party (1) was issued a general or special notice letter of its potential liability under CERCLA, (2) was issued an order or referred for litigation to perform a cleanup action or reimburse response costs, or (3) entered into a settlement to perform a cleanup or pay for a response action.
68In 2004, an EPA working group recommended, among other things, that EPA explore alternative sources of funding for Superfund site activities, including the investigation of old insurance policies that might cover site costs. See EPA, Superfund: Building on the
Past, Looking to the Future (Washington, D.C., April 2004). According to EPA, following this recommendation the agency established a working group to examine these issues and developed a mechanism to assist regions in conducting insurance research. As a result, in some instances, the agency has made successful claims against insurance policies.
Page 60 GAO-09-656 Superfund

Although EPA’s data showed that the agency has identified responsible parties at most sites, it does not have complete data on how many sites have parties that were ultimately not viable or were unable to pay for some of their cleanup costs. For example, EPA has collected some data on the extent to which individual parties are not viable or had limited ability to pay for their Superfund site liability, but these data are incomplete. For some of these data, EPA only collected the information to evaluate the implementation of its administrative reforms, and according to the agency, the data are not reliable prior to fiscal year 1996 or after fiscal year 2004. EPA collects other data that provide information on the extent to which there are not viable responsible parties at sites, but these data are only reliable for sites that had a remedial action started since fiscal year 2004, according to the agency. Furthermore, at 27 sites, EPA’s data did not identify any responsible parties, although the data showed that EPA had taken enforcement actions.69 These sites represent an additional 15 percent of sites for which EPA’s data did not identify any responsible parties. According to an OECA official, EPA headquarters has been working with the regions to improve the quality of the responsible party data.
A
recover some of the money the party owes. However, EPA does not record
Finally, whether or not EPA identifies responsible parties at sites, its datacannot be used to determine the total value of the orphan share at sites. For example, even when a responsible party declares bankruptcy, EPand DOJ officials noted, the federal government may still be able to
69We accounted for these sites in our analysis of the number of sites for which EPA’s data did not show any identified responsible parties by adjusting the data based on the assumption that responsible parties had been identified at sites where EPA’s data showed that an enforcement action had been taken. However, we did not adjust the data for nine additional sites that did not have any responsible parties identified, but where there was an indication in EPA’s data that the enforcement action taken included a prospective purchaser agreement—an agreement in which EPA promises not to sue the purchaser of a contaminated site in exchange for that party’s agreement to perform cleanup work or provide funds toward cleaning up the site.
Page 61 GAO-09-656 Superfund
the balance this bankrupt party owes.70 For example, EPA noted that it records the amount the bankrupt party owes as determined by the bankruptcy court, rather than the difference between the amount sought by the agency in the “proof of claim” it files with the bankruptcy court and the amount allowed by the court. In addition, EPA places a cap on the value of the orphan share it records at sites. According to EPA officials, the total orphan share at a site is all the orphan shares of individual nonviable parties. However, because EPA’s policy is to limit offers to compensate for orphan shares to a maximum value of 25 percent of the future costs at a site, the orphan share value that EPA records in its data is capped at this 25 percent maximum value. As a result, if the site’s total orphan share exceeds 25 percent of future site costs, EPA’s data would not account for the full value of this share.
The extent to which EPA’s ability to identify viable responsible parties to help fund or conduct site cleanups changes over time could significantly affect the program. As noted earlier, EPA’s cost recoveries from responsible parties have provided the second largest source of funding for the Superfund trust fund, in addition to providing billions of dollars in estimated commitments for site work. If EPA cannot identify responsible parties for an increasing number of sites, or if an increasing number of
70In 2005, we reported that the extent to which businesses filing for bankruptcy had environmental liabilities was unknown because neither the federal government nor other sources collected this information. However, we found that in seeking to hold liable businesses responsible for their cleanup obligations, EPA faced challenges, including the ability of businesses to legally organize or restructure in ways that can limit their future expenditures for cleanups. Furthermore, we found that EPA could better ensure that bankrupt and other financially distressed businesses meet their cleanup obligations by making greater use of existing authorities. For example, at the time of the 2005 report, EPA had not implemented a 1980 statutory mandate under CERCLA to require businesses handling hazardous substances to provide assurance of their financial responsibility. We reported that requiring such assurance could help reduce the risk that the general public would have to assume financial responsibility for cleanup costs. See GAO, Environmental
Liabilities: EPA Should Do More to Ensure That Liable Parties Meet Their Cleanup
Obligations, GAO-05-658, (Washington, D.C.: Aug. 17, 2005). EPA officials indicated that the agency has increased the financial assurance requirements included in its settlement agreements by, for example, requiring responsible parties to provide external assurances—rather than self-assure—that they have the resources to complete agreed-upon work. However, a representative of one public interest group stated that EPA still does not have sufficiently thorough financial assurance requirements. In a recent decision, the federal district court for the Northern District of California ordered EPA to publish a list of classes of facilities for which financial assurance requirements will be required. This list is one of three requirements in section 108(b) of CERCLA related to ensuring that facilities involved with hazardous substances would remain financially responsible for any substances that were improperly disposed. See Sierra Club, et al v. Johnson, et al (N.D. Cal. 2008).
Page 62 GAO-09-656 Superfund

parties identified at sites are not financially viable, a greater proportion of cleanup activities may need to be funded by EPA using its Superfund appropriation. Also, if the trust fund receives less in reimbursements from cost recovery actions against responsible parties, appropriations from the general fund would need to increase in order to sustain the same level of cleanup activity. According to both DOJ and EPA officials, as well as a number of other Superfund experts we spoke with, the number of sites without viable responsible parties or where parties cannot pay for all of their cleanup costs is likely to increase, particularly as a result of poor economic conditions. They pointed to a recent growth in the number of cases filed in bankruptcy courts as evidence of this trend. The DOJ officials also noted an increase in the number of settlement agreements in which responsible parties state that financial issues limit their ability to pay for all of their cleanup costs. In addition, DOJ officials said that NPL sites are more likely to include sites without viable responsible parties because states with active cleanup programs often take on sites with responsible parties that are willing to conduct cleanup efforts. Other experts also noted that the longer a site remains on the NPL, the more likely it is that EPA will not be able to identify viable responsible parties.
NPL Site Cleanups Are Progressing, but the Amount of Work Remaining Is Unclear and May Be More Complex or Costly
Although cleanup actions have been initiated at many sites, some sites require additional efforts to address contamination, and the amount of work remaining at sites where actions to construct a remedy have not been completed is unclear. Furthermore, the sites that are not construction complete may require more complex or costly cleanup activities.
Remedial actions to address site contamination have been completed or begun at most of the sites listed on the NPL since the beginning of the Superfund program, according to EPA’s data. As of fiscal year 2007, approximately 70 percent of the 1,397 nonfederal NPL sites had reached EPA’s construction complete milestone.71 In addition, about one-half of the
Remedial Actions Have Been Implemented or Are Underway at Most NPL Sites, but the Amount of Work Remaining Is Unclear
71Through the end of fiscal year 2007, 306 nonfederal sites had been deleted from the NPL. One additional site was deleted, but was subsequently restored to the NPL. Almost all of the deleted sites reached EPA’s construction complete milestone prior to deletion; however, according to EPA, four sites were deleted and referred to other authorities without being declared construction complete. Because these sites are no longer active on the NPL, we counted them together with the sites considered construction complete for purposes of analysis.
Page 63 GAO-09-656 Superfund
422 sites that were not construction complete had some remedial action underway at the end of fiscal year 2007.72
However, data on the construction complete status of sites do not provide a clear picture of the amount of work remaining at sites.73 For example, according to one Superfund expert, sites with groundwater contamination can take a long time to clean up when the remedy is to pump and treat the water or to simply allow contaminants to degrade over time. Once a site reaches construction complete, decades may still be required until remedial actions clean up groundwater contamination to the selected standards, and continued federal funding may be necessary to implement these actions. At sites where the federal government, rather than a responsible party, implemented the groundwater remedial action, and where continued operation of the remedy is necessary to complete cleanup of ground or surface water, sites may receive federal funding for up to 10 years after the groundwater remedy is determined to be operational and functional. In such situations, after 10 years of remedy operation or upon completion of the remedial action (whichever is earlier), responsibility for the site and any additional implementation costs, are transferred to the state.74
The progress of cleanup is even less clear for sites that are not construction complete. Sites are often divided into smaller units (operable units), by geography, pathways of the contamination (e.g., groundwater),
72In the case of the one site that was declared construction complete, deleted from the NPL, and then subsequently restored, EPA data on the status of cleanup at the site indicated that the cleanup status was construction complete and not deleted as of the end of fiscal year 2007. As a result, we did not include this site among the 422 sites that were not construction complete. However, more recent information for this site (March 2009) indicates that EPA was in the process of studying and selecting a remedy for a portion of the site.
73In 2003, we reported that EPA acknowledged the limitations of the usefulness of construction completions as a measure of NPL site progress because, among other reasons, construction completions neither measure nor characterize the impacts of cleanup efforts on human health and the environment. To address future challenges associated with the Superfund program, we recommended that EPA develop indicators that could be used to measure program performance. EPA has developed some additional indicators, such as measuring the number of sites ready to return to productive use; however, these measures do not provide information on the amount of work remaining at sites.
74For remedial actions funded by EPA, where a long-term action is not necessary, EPA transfers the responsibility and cost of the operation and maintenance phase to the state when the site reaches construction complete and the remedy is determined to be operating and functional.
Page 64 GAO-09-656 Superfund
or type of remedy. These operable units may move through the Superfund cleanup process at different speeds, depending upon the scope of work or type of remedy selected for each operable unit. In addition, operable units may encompass significantly different scopes of work even within the same site. For example, an operable unit might be defined to account for certain activities not directly related to site cleanup, such as community outreach or providing alternative drinking water supplies in instances where a community’s drinking water has been contaminated. Alternatively, one Superfund expert noted that an operable unit might be a large stretch of river or a small parcel of land.
As a result of differences in the potential scope of work and remedies selected at operable units, it is difficult to aggregate data on the status of cleanups at individual operable units at sites to provide information on the status of cleanups at NPL sites overall. For example, one way that EPA records the progress of cleanup at sites is according to the least and most advanced cleanup stages of sites’ operable units.75 Of the 422 nonfederal sites that were not construction complete at the end of fiscal year 2007, 184 had 1 operable unit, while 238 had multiple operable units, ranging in number from 2 to 23. However, even at sites with only 1 operable unit, it is difficult to use EPA’s data on the least and most advanced stages of cleanup to determine the amount of work remaining at the site.76 According to EPA’s data, of the 184 sites with 1 operable unit, the agency
75Data on the least and most advanced stages of cleanup at operable units is not the only data that EPA has at its disposal to track the progress of cleanups at sites. Furthermore, EPA stated that the agency does have a clear understanding of the status of cleanup actions at sites. We did not assess whether EPA could provide detailed information on the cleanup status at individual sites; however, we found no information that would indicate EPA could not provide more detailed information if requested. Our purpose in obtaining and analyzing data on the least and most advanced stages of cleanup at operable units was to determine what information is available at an aggregated level that would provide congressional decision makers and others with an understanding of the status of cleanups at all sites. For this analysis, EPA officials recommended we use these data due to the extent of “anomalies” and “irregularities” in other data we considered analyzing to provide information on the status of cleanups.
76EPA noted that some operable units at sites that are not construction complete may be in the post-construction phase, where construction is complete at the operable unit, but the site itself has not reached construction complete. EPA stated that data on the operable units at sites in the post-construction phase would provide a more complete picture of the status of cleanup at these sites. EPA did not provide these data; rather, agency officials indicated that data on the post-construction status of operable units is available on site profile pages for individual sites on EPA’s Web site. These profile pages provide more detailed information on, among other things, the status of work at individual sites and the types of cleanup actions being implemented.
Page 65 GAO-09-656 Superfund
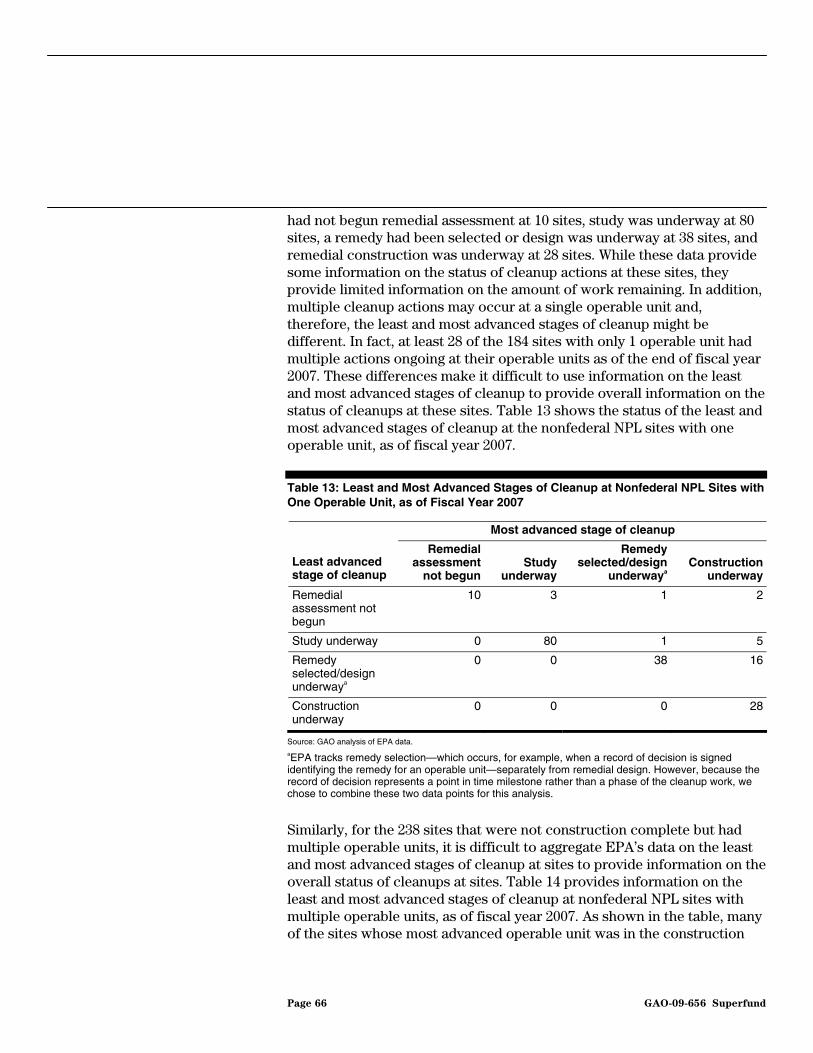
had not begun remedial assessment at 10 sites, study was underway at 80 sites, a remedy had been selected or design was underway at 38 sites, and remedial construction was underway at 28 sites. While these data provide some information on the status of cleanup actions at these sites, they provide limited information on the amount of work remaining. In addition, multiple cleanup actions may occur at a single operable unit and, therefore, the least and most advanced stages of cleanup might be different. In fact, at least 28 of the 184 sites with only 1 operable unit had multiple actions ongoing at their operable units as of the end of fiscal year 2007. These differences make it difficult to use information on the least and most advanced stages of cleanup to provide overall information on the status of cleanups at these sites. Table 13 shows the status of the least and most advanced stages of cleanup at the nonfederal NPL sites with one operable unit, as of fiscal year 2007.
Table 13: Least and Most Advanced Stages of Cleanup at Nonfederal NPL Sites with One Operable Unit, as of Fiscal Year 2007
Most advanced stage of cleanup
Least advanced stage of cleanup
Remedial assessment
not begunStudy
underway
Remedy selected/design
underwayaConstruction
underway
Remedial assessment not begun
10 3 1 2
Study underway 0 80 1 5
Remedy selected/design underwaya
0 0 38 16
Construction underway
0 0 0 28
Source: GAO analysis of EPA data. aEPA tracks remedy selection—which occurs, for example, when a record of decision is signed identifying the remedy for an operable unit—separately from remedial design. However, because the record of decision represents a point in time milestone rather than a phase of the cleanup work, we chose to combine these two data points for this analysis.
Similarly, for the 238 sites that were not construction complete but had multiple operable units, it is difficult to aggregate EPA’s data on the least and most advanced stages of cleanup at sites to provide information on the overall status of cleanups at sites. Table 14 provides information on the least and most advanced stages of cleanup at nonfederal NPL sites with multiple operable units, as of fiscal year 2007. As shown in the table, many of the sites whose most advanced operable unit was in the construction
Page 66 GAO-09-656 Superfund

underway stage had operable units at earlier stages in the cleanup process. For example, at 26 sites, the status of cleanup at the most advanced operable unit was construction underway, but the status of cleanup at the least advanced operable unit was remedial assessment not begun. Additionally, at 65 sites, the status of cleanup at the most advanced operable unit was construction underway, but the status of cleanup at the least advanced operable unit was study underway. As the table shows, there were only 18 of the 238 sites where the least and most advanced stages of cleanup of the operable units at these sites was construction underway.
Table 14: Least and Most Advanced Stages of Cleanup at Nonfederal NPL Sites with Multiple Operable Units, as of Fiscal Year 2007
Most advanced stage of cleanup
Least advanced stage of cleanup
Remedial assessment
not begunStudy
underway
Remedy selected/design
underwayaConstruction
underway
Remedial assessment not begun
1 4 8 26
Study underway 0 23 14 65
Remedy selected/design underwaya
0 0 12 67
Construction underway
0 0 0 18
Source: GAO analysis of EPA data. aEPA tracks remedy selection—which occurs, for example, when a record of decision is signed identifying the remedy for an operable unit—separately from remedial design. However, because the record of decision represents a point in time milestone rather than a phase of the cleanup work, we chose to combine these two data points for this analysis.
Furthermore, according to EPA officials, the agency is likely to complete cleanup actions at the easiest operable units at a site first. As a result, sites with operable units at early stages in the cleanup process (or operable units with individual cleanup actions at early stages in the cleanup process) could represent sites with more difficult operable units or actions. These operable units or actions could require relatively greater amounts of cleanup work in the future. As a result of these differences, the data on the status of cleanup at operable units, without details on the scope of the operable units and the remedies selected, provide only limited information about the work remaining at sites.
Page 67 GAO-09-656 Superfund
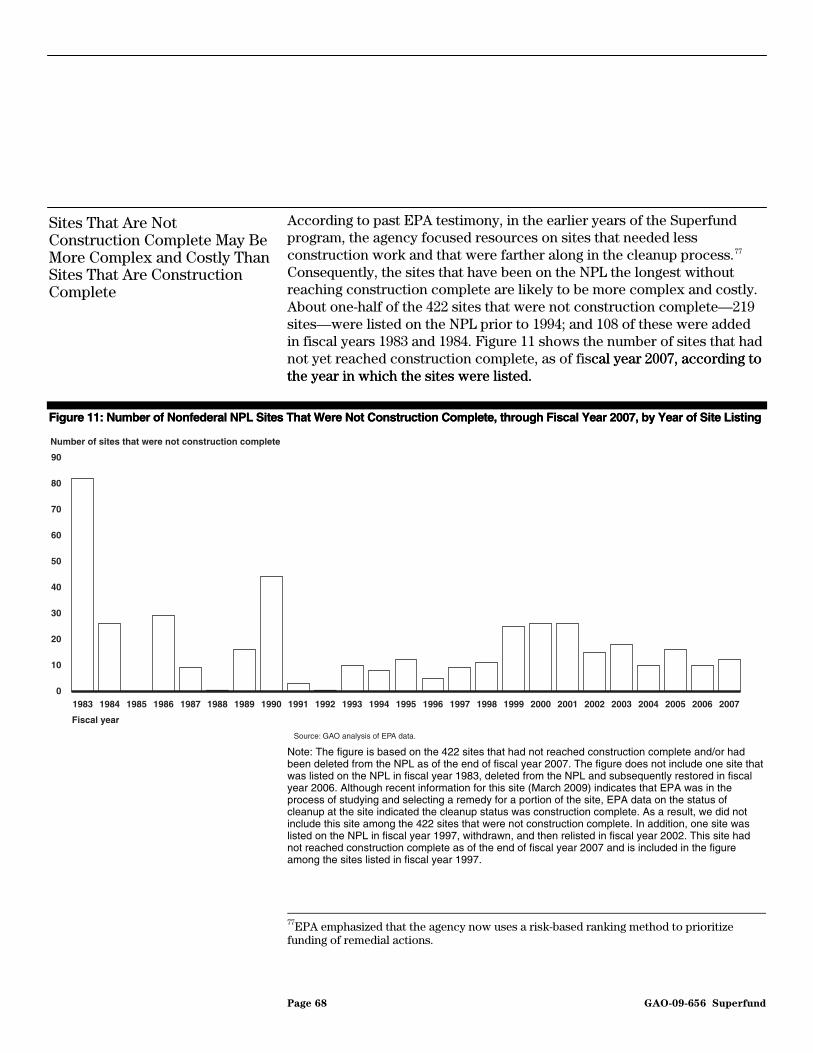
According to past EPA testimony, in the earlier years of the Superfund program, the agency focused resources on sites that needed less construction work and that were farther along in the cleanup process.77 Consequently, the sites that have been on the NPL the longest without reaching construction complete are likely to be more complex and costly. About one-half of the 422 sites that were not construction complete—219 sites—were listed on the NPL prior to 1994; and 108 of these were added in fiscal years 1983 and 1984. Figure 11 shows the number of sites that had not yet reached construction complete, as of fiscal year 2007, according to the year in which the sites were listed.
cal year 2007, according to the year in which the sites were listed.
Sites That Are Not Construction Complete May Be More Complex and Costly Than Sites That Are Construction Complete
Figure 11: Number of Nonfederal NPL Sites That Were Not Construction Complete, through Fiscal Year 2007, by Year of Site Listing Figure 11: Number of Nonfederal NPL Sites That Were Not Construction Complete, through Fiscal Year 2007, by Year of Site Listing
Number of sites that were not construction complete
Fiscal year
Source: GAO analysis of EPA data.
0
10
20
30
40
50
60
70
80
90
2007200620052004200320022001200019991998199719961995199419931992199119901989198819871986198519841983
Note: The figure is based on the 422 sites that had not reached construction complete and/or had been deleted from the NPL as of the end of fiscal year 2007. The figure does not include one site that was listed on the NPL in fiscal year 1983, deleted from the NPL and subsequently restored in fiscal year 2006. Although recent information for this site (March 2009) indicates that EPA was in the process of studying and selecting a remedy for a portion of the site, EPA data on the status of cleanup at the site indicated the cleanup status was construction complete. As a result, we did not include this site among the 422 sites that were not construction complete. In addition, one site was listed on the NPL in fiscal year 1997, withdrawn, and then relisted in fiscal year 2002. This site had not reached construction complete as of the end of fiscal year 2007 and is included in the figure among the sites listed in fiscal year 1997.
77EPA emphasized that the agency now uses a risk-based ranking method to prioritize funding of remedial actions.
Page 68 GAO-09-656 Superfund

By the end of fiscal year 2007, fewer mining, sediment, and groundwater sites—those sites that EPA and other experts indicated are among the most complex and costly to address—had reached construction complete than other types of sites. For example, mining sites had the lowest percentage of sites reaching construction complete, about 21 percent, although many of these sites were listed more recently. Among contaminated sediment and groundwater plume sites with no identifiable source, only about 55 percent had reached construction complete.78 For sediment sites in particular, one Superfund legal expert stated, the scope of a site’s cleanup makes a significant difference in the length of time it takes to address contamination at the site because it is often difficult to understand the link between the contamination and the environmental damage at such sites. As a result, the scope of the cleanup at these sites often expands to address a variety of issues, which increases the length of the cleanup effort.
Moreover, megasites reached construction complete less often than nonmegasites. Approximately 74 percent of nonmegasites had reached construction complete while only 37 percent of megasites had reached construction complete through 2007.79 In addition, the median length of time for nonmegasites to progress from site listing to construction complete was 10 years, compared with a median of about 15 years for megasites. As a result of these differences, the percentage of NPL sites that were not construction complete and that were megasites increased over time, from 12 percent of sites active at the end of fiscal year 1989 to 23 percent of sites active at the end of fiscal year 2007. Table 15 shows the number, percentage, and median length of time it took for individual types of sites, nonmegasites, and megasites to reach construction complete.
78Alternatively, 68 percent of the other subcategories of sites in the “other” site type had reached construction complete.
79In some cases, the data showed a relationship in the extent to which megasites and other types of sites had not reached construction complete as of fiscal year 2007. For example, 38 percent of the mining sites and 26 percent of the groundwater plume or contaminated sediment sites with no identifiable source that had not reached construction complete were megasites.
Page 69 GAO-09-656 Superfund

Table 15: Construction Complete Nonfederal NPL Sites by Site Type and Megasite Designation, through Fiscal Year 2007
Site type Number of NPL
sites Number of sites
construction completePercentage of sites
construction complete
Median number of years from site listing to
construction complete
Manufacturing 491 307 63 9.5
Mining 33 7 21 10.5
Multiple 42 30 71 9.2
Other 198 119 60 9.1
Recycling 122 78 64 10.3
Waste management 511 434 85 11.5
Total sites by type 1,397 975 70 10.3
Total nonmegasites 1,246 919 74 10.1
Total megasites 151 56 37 14.8
Source: GAO analysis of EPA data.
Note: Five sites were declared construction complete and deleted without having been formally listed on the NPL. For these sites, the analysis of the median number of years it took to reach construction complete is based on the dates when the sites were proposed for listing on the NPL. Four sites were deleted from the NPL without reaching construction complete, and for these sites, the median number of years analysis is based on the dates when the sites were deleted from the NPL. In addition, one site was declared construction complete, deleted, and then restored to the NPL. The median number of years analysis for this site is based on the dates when the site was originally listed on the NPL and declared construction complete. For one other site that was listed on the NPL, withdrawn, and then relisted before reaching construction complete, the median number of years analysis is also based on the dates when the site was originally listed on the NPL and declared construction complete.
EPA has recognized the challenges posed by certain types of sites and has taken a number of steps to address them. For example, EPA implemented special procedures to track certain large sediment sites because of the
Page 70 GAO-09-656 Superfund
significant challenge these sites can pose during the cleanup process.80 Of the 48 nonfederal sediment sites EPA was tracking using these procedures, almost one-half were megasites.81 Through the end of fiscal year 2007, EPA had spent an average of $31.3 million at each of these sites; however, only 9 of these sites had reached construction complete. In addition, because of the challenges mining sites pose to the Superfund program, EPA established the Abandoned Mine Lands Team to identify and coordinate alternative approaches to cleaning up these sites. However, the extent to which EPA is unable to identify viable responsible parties to assist with the cleanup of these and other NPL sites that are not construction complete could affect the agency’s ability to maintain continued cleanup progress.
80EPA defines contaminated sediment sites as sites with sand, soil, organic matter, or other materials that accumulate on the bottom of a water body and contain toxic or hazardous materials. The challenges posed by these sites include, among others, a potentially large number of contamination sources which may be difficult to control; the difficulty of cleanup in an aquatic environment, which often may be more complex from an engineering perspective, and may be more costly than cleaning up contamination in other areas; and widespread contamination. Many Superfund cleanups address contaminated sediments as one component of the cleanup of an entire site. At sites that EPA has identified as Tier 1 sites, or where the sediment action will address more than 10,000 cubic yards or more than 5 acres of contaminated sediment, EPA is requiring additional consultation during the remedy selection process. EPA’s list of Tier 1 sites does not include sites where EPA is still investigating contaminated sediment, but has not yet determined whether cleanup is needed. As a result, it may not include sediment sites added to the NPL more recently. EPA also established the Contaminated Sediments Technical Advisory Group to monitor the progress of, and provide advice regarding, a small number of large, complex, or controversial contaminated sediment Superfund sites, identified as Tier 2 sites. See EPA, Contaminated Sediment Remediation Guidance for Hazardous Waste Sites, EPA 540-R-05-012 (Washington, D.C., Dec. 2005).
81These data are based on the list of sites EPA was tracking as of May 2008.
Page 71 GAO-09-656 Superfund

Overall, both EPA’s Superfund appropriation and program expenditures have declined. As we reported in July 2008,82 since fiscal year 1981, the annual appropriation to EPA’s Superfund program has averaged approximately $1.2 billion in nominal dollars.83 In recent years, however, congressional appropriations for the Superfund program have declined when adjusted for inflation. Figure 12 shows appropriation levels in nominal and constant dollars since fiscal year 1981.
on. Figure 12 shows appropriation levels in nominal and constant dollars since fiscal year 1981.
Program Funding Has Decreased, While EPA’s Site Costs Have Increased; and Agency Reporting on Key Cost Indicators Is Insufficient
Figure 12: EPA’s Superfund Program Appropriation, Fiscal Years 1981 through 2007 Figure 12: EPA’s Superfund Program Appropriation, Fiscal Years 1981 through 2007
Dollars in millions
Fiscal year
Appropriation in 2007 dollars
Nominal appropriation
Source: GAO analysis of appropriations laws and the President’s Budget Appendices.
0
500
1,000
1,500
2,000
2,500
3,000
20072005200320011999199719951993199119891987198519831981
82See GAO-08-841R.
83Our guidance recommends we present budget numbers in nominal terms to match what has actually been enacted or proposed at the time, what is reported in budget documents, or both, rather than adjusting for inflation.
Page 72 GAO-09-656 Superfund

Similarly, EPA’s expenditures on Superfund program activities declined by 29 percent, or $1.8 billion to $1.3 billion, between fiscal years 1999 and 2007.84 During this period, EPA used approximately 77 percent of its Superfund expenditures for remedial and removal activities. Most of the remainder of EPA’s Superfund expenditures was spent for enforcement and administration-related activities.85 However, EPA’s expenditures on its remedial program declined by 37 percent from fiscal year 1999 through 2007, and accounted for the majority of the decline in Superfund program expenditures during this period. Figure 13 shows EPA’s Superfund expenditures for fiscal years 1999 through 2007.
84We limited our analysis of EPA’s overall expenditures on Superfund program activities to fiscal years 1999 through 2007 because EPA changed the way it accounted for certain budget items in fiscal year 1999, which made it difficult to obtain consistent data prior to that year.
85See GAO-08-841R for more detailed information on EPA’s expenditures for these activities.
Page 73 GAO-09-656 Superfund
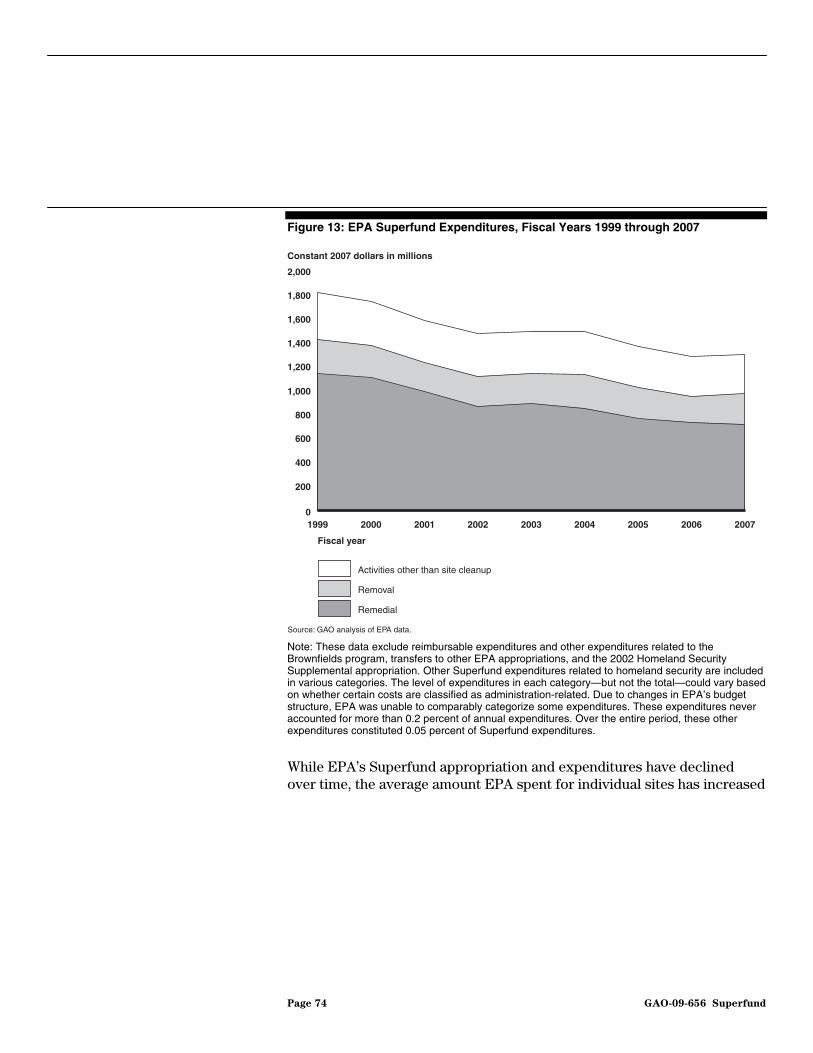
Figure 13: EPA Superfund Expenditures, Fiscal Years 1999 through 2007
Constant 2007 dollars in millions
Source: GAO analysis of EPA data.
Fiscal year
Activities other than site cleanup
Removal
Remedial
0
200
400
600
800
1,000
1,200
1,400
1,600
1,800
2,000
200720062005200420032002200120001999
Note: These data exclude reimbursable expenditures and other expenditures related to the Brownfields program, transfers to other EPA appropriations, and the 2002 Homeland Security Supplemental appropriation. Other Superfund expenditures related to homeland security are included in various categories. The level of expenditures in each category—but not the total—could vary based on whether certain costs are classified as administration-related. Due to changes in EPA’s budget structure, EPA was unable to comparably categorize some expenditures. These expenditures never accounted for more than 0.2 percent of annual expenditures. Over the entire period, these other expenditures constituted 0.05 percent of Superfund expenditures.
While EPA’s Superfund appropriation and expenditures have declined over time, the average amount EPA spent for individual sites has increased
Page 74 GAO-09-656 Superfund

in recent years.86 For example, EPA spent an average of approximately $7.5 million at sites that reached EPA’s construction complete milestonfiscal year 1999. EPA’s expenditures increased to an average of about $10.2 million in total expenditures per site at sites reaching construction complete in fiscal year 2007. Although the average amount EPA spent at sites reaching construction complete between fiscal years 1999 and 2007 increased in some years and decreased in others, overall, EPA’s site expenditure data showed an average annual increase of 13 percent per year during the period.
e in
In addition to increases in the amount EPA spends at individual sites that have reached construction complete in recent years, reports by EPA and its Inspector General indicate that the agency has consistently spent a relatively large percentage of its funds for site cleanup work at a relatively small number of sites since fiscal year 2003. For example, in 2004,87 the Inspector General reported that approximately one-half of EPA’s fiscal year 2003 funding for remedial actions, non-time critical removals, and long-term response actions went to 8 sites out of a total of 94 sites receiving funding.88 Similarly, according to EPA annual reports for fiscal
86These data represent the amount EPA has spent to clean up sites, rather than total site costs. We were unable to obtain data on total site costs because responsible parties are not required to report the amount they spend to clean up sites to EPA. EPA noted that instead of individual site costs increasing, an alternative explanation for EPA’s rising costs is that EPA is financing more cleanup work than it has in the past. This, in fact, could be another explanation for EPA’s rising costs. As we noted earlier in this section, the number of NPL sites without viable responsible parties to assist with cleanup may have increased in recent years, although it is unclear from EPA data. Some Superfund experts cited an increase in orphan sites or orphan shares at sites as a contributing factor to increased EPA site expenditures over time.
87EPA, Office of Inspector General, Congressional Request on Funding Needs for Non-
Federal Superfund Sites, 2004-P-00001 (Washington, D.C., Jan. 2004).
88A non-time critical removal action is a removal action the agency determines does not need to be implemented within the next 6 months. According to the Inspector General’s report, EPA regions annually request funding for remedial actions on a site-specific basis. Regions enter cost estimates into CERCLIS, and complete project evaluation forms for ongoing and new start projects with estimated costs of $600,000 or more. New construction starts are evaluated by the National Risk Based Priority Panel—a group of senior headquarters and regional officials whose analysis is used by management to make funding decisions—and the Inspector General’s report noted that in the past, EPA has emphasized funding of ongoing construction over new construction projects. According to EPA, the agency then requests funding for a specific fiscal year as part of the President’s annual appropriations request. Because this funding request is for a specific fiscal year, EPA indicated that it does not include an assessment of out-year funding needs. We did not evaluate EPA’s processes for budgeting and funding prioritization for this report.
Page 75 GAO-09-656 Superfund
years 2004 through 2008, the agency spent about one-half of its Superfund obligations for construction and post-construction activities at roughly 12 to 13 sites per year. It should be noted that not all sites require funding for remedial action construction in any particular year, and EPA may still be taking enforcement actions at a site to try to obtain a responsible party commitment to conduct the remedial action. Nevertheless, these data show that individual sites may require a significant commitment of agency resources on an annual basis.
In addition to the greater complexity of cleanup for sites that have not reached construction complete or were added more recently to the NPL, Superfund experts cited a number of factors that have contributed to EPA’s increased site expenditures. For example:
• With scientific advances, EPA may be able to conduct more thorough remedial investigation efforts, which could lead to more thorough remedial actions and potentially higher costs.
• New contaminant issues or remedial technologies could lead to increased site costs. For example, the intrusion of vapors into buildings from contaminants is a new issue that could increase costs at some sites.89
• Rising construction costs have contributed to higher EPA expenditures. In particular, according to an OSWER study, Superfund site construction costs escalated by 37 percent in recent years.
• The number of sites for which EPA cannot identify viable responsible parties to help pay for site cleanup activities has increased, according to DOJ officials.
Because of these trends, EPA may be hampered in its efforts to start new remedial actions at some sites or maintain the progress of cleanup at others, according to EPA’s Inspector General, the National Advisory Council for Environmental Policy and Technology (NACEPT),90 and EPA’s own annual Superfund accomplishment reports. In 2004, the Inspector
89Vapor intrusion involves the migration of vapors emitted from chemicals in buried wastes or contaminated groundwater through the ground and into the airspace of buildings at a site.
90NACEPT is an independent federal advisory committee that provides recommendations to the EPA Administrator on a broad range of environmental issues. The Superfund Subcommittee of NACEPT was formed in June 2002 to consider the role of the NPL, Superfund megasites, and Superfund program performance measures in the context of other federal, state, and tribal programs.
Page 76 GAO-09-656 Superfund
General estimated that the Superfund program had a funding shortfall of $174.9 million in fiscal year 2003.91 Furthermore, according to the Inspector General’s report, while EPA regions indicated they had funding for the majority of sites for fiscal year 2003, they did not have sufficient funding for some sites. For example, two regions were only able to initially fence sites rather than complete the removal of contaminated material, and construction activities did not begin at 11 sites. According to the Inspector General, when funding is insufficient, construction at NPL sites cannot begin; cleanups are performed in a less than optimal manner; and/or activities are stretched over longer periods of time.
Similarly, in April 2004, NACEPT reported that some NPL sites had completed remedial designs, but that remedial actions at these sites had slowed or had not yet begun because of insufficient funding, according to information provided by EPA.92 For example, the New Bedford Harbor megasite in New Bedford, Massachusetts, was ready for remedy construction in April 2004, but because of funding constraints, remedial action might be stretched out over 25 years, which was not optimal in terms of achieving a cost-effective remedy or for protecting public health and the environment.93
NACEPT identified four key categories of information that would help identify Superfund program trends: the (1) types of site conditions that are driving EPA remedy decisions at NPL sites; (2) impediments to cleanup progress at older sites, especially those listed on the NPL in the early 1980s; (3) number and type of potential future NPL sites; and (4) program expenditures and potential future costs. It noted that these data were particularly important for megasites because of the impact these sites could have on program funding needs and priorities. To this end, NACEPT recommended that EPA improve the information and data on the
91See EPA, Office of Inspector General, 2004-P-00001.
92See NACEPT, Final Report.
93The New Bedford site was listed on the NPL in fiscal year 1983, and is 1 of the 48 nonfederal NPL sites EPA has designated as Tier 1 contaminated sediment sites. As of the end of fiscal year 2007, the site had been divided into three operable units, the most advanced of which had remedial construction underway. The least advanced of these operable units was still in the study underway phase. Through fiscal year 2007, EPA had spent approximately $135.9 million on the site. According to EPA, to help expedite the cleanup process, the site is projected to receive between $25 and $35 million of the $600 million in additional funding provided for the Superfund program under the American Recovery and Reinvestment Act of 2009, Public Law 111-5, Title VII (2009).
Page 77 GAO-09-656 Superfund
Superfund program and publish an annual report that presents key data on, among other things, program progress, expenditures, and anticipated costs. In addition, a 2004 EPA working group stated that to more completely measure program success, EPA should compare dollars actually recovered with dollars potentially recoverable at sites with viable responsible parties.94 According to the working group’s report, as responsible parties continually press the agency to exclude some past costs from recovery by, for example, applying the agency’s ability to pay or orphan share compensation policies, EPA needs some way of ensuring that it is not compromising too much on past cost claims.
In response, in part, to the NACEPT recommendations, EPA began publishing annual reports of its Superfund program accomplishments, starting in fiscal year 2004.95 In these reports, EPA partially addressed the NACEPT recommendations. Specifically, EPA reported that it was able to fund all 19 new construction projects that were ready for funding in fiscal year 2007, but it reported a lack of funding in other years since fiscal year 2005. For fiscal years 2005, 2006, and 2008, respectively, EPA reported that 9 out of 26, 6 out of 24, and 10 out of 26 new construction projects that were ready for funding each year did not receive funding due to resource constraints.96 These reports also provide information on program outputs, such as the number of construction projects started or continued; and program outcomes, such as the amount of responsible party commitments EPA secured for site work, cost recovery, and oversight costs; the number
94See EPA, Superfund: Building on the Past, Looking to the Future.
95The Superfund Amendments and Reauthorization Act of 1986, Public Law 99-499 (Oct. 17, 1986), §212 required EPA to submit annual reports on the progress of implementing the Superfund program including, among other things, an estimate of the amount of resources necessary to complete program implementation. However, this reporting requirement was terminated, effective May 15, 2000, pursuant to the Federal Reports Elimination and Sunset Act of 1995, Public Law 104-66, as amended.
96In EPA’s report for fiscal year 2004, the agency reported data somewhat differently than in the other years, as the report did not specifically state how many new construction projects at sites were not funded. Rather, EPA’s report indicated that the agency obligated funds for 27 new construction projects; however, 19 sites that were ready for construction did not receive funding due to resource constraints.
Page 78 GAO-09-656 Superfund
of sites with human exposure under control;97 and the number of sites that are ready to return to productive use.
While these reports provide some information on program progress and financial constraints, they do not provide information on key indicators of future program costs, or other data that would help EPA more fully respond to the NACEPT report’s recommendations. In particular, these reports do not provide information on the number and cleanup status of megasites (especially mining and sediment sites), which could help indicate the types of conditions that are driving EPA’s remedy decisions at sites that were listed more recently, as well as the impediments to cleanup progress at older sites. Additionally, these reports do not provide information on the number of sites where responsible parties are financially unable to help pay for cleanup activities, or the potential impact on EPA’s ability to carry out cleanup activities when it cannot obtain reimbursement for agency cleanup costs from responsible parties. Such information could help indicate the factors that are driving program expenditures and potential future costs.
EPA’s Superfund enforcement actions have generally resulted in agreements with responsible parties that provided significant value to the program, particularly in terms of responsible parties’ commitments to conduct site work. In addition, EPA’s cost recoveries—historically, amounting to roughly one-third of the agency’s site expenditures—help replenish the Superfund trust fund so that EPA has funds to clean up other sites. Since the taxes dedicated to supporting the Superfund trust fund expired, these recoveries—including fines and penalties—have provided almost 20 percent of trust fund revenues. However, EPA’s ability to continue to recover its costs may be affected by the extent to which responsible parties are able to pay for site cleanups. A robust trust fund, whether replenished through cost recoveries or other sources of funding, has helped EPA to conduct cleanup activities on its own while continuing to use enforcement actions to encourage responsible parties to settle their liability. Additionally, CERCLA-related litigation and, potentially, its associated costs have declined in recent years. In part, this downward trend resulted from EPA’s changes to the enforcement process to, among
Conclusions
97This is reported under EPA’s Site-Wide Human Exposure measure, which is an indicator designed to document human health protection on a site-wide basis by measuring the agency’s progress in controlling unacceptable human exposures to contamination at a Superfund site.
Page 79 GAO-09-656 Superfund
other things, encourage parties to settle by providing compensation for orphan shares at sites. However, an increasing number of sites with orphan shares, as well as potential adjustments in parties’ decision making about how to resolve liability following recent or upcoming court decisions, could make it more difficult for EPA to reach settlements with responsible parties to pay for or conduct cleanup work.
Although a strong trust fund is important for EPA’s continued ability to enforce the Superfund program and clean up sites, EPA and others have reported financial constraints on these efforts. To help assess these financial constraints, EPA needs comprehensive and reliable data that can be aggregated to provide information on key issues, such as the (1) status and cost of cleanups at sites that are not construction complete, particularly sites where cleanup is likely to be complex and expensive; (2) extent to which sites lack responsible parties capable of paying for some or all of a site’s cleanup activities; and (3) financial impacts of having EPA shoulder these sites’ cleanup costs. However, EPA’s current data on these issues are not consistently comprehensive, reliable, or capable of being aggregated to provide clear program-wide information. For example, EPA’s data on the status of individual site cleanups cannot be aggregated to provide clear information on the amount of work remaining at sites overall. In addition, because EPA does not have comprehensive and reliable data on how many individual sites lack viable responsible parties or the total value of the orphan share at sites, the agency cannot aggregate its data to provide clear information on trends in the extent to which sites lack viable responsible parties. Also, without this information, EPA cannot determine the financial impacts that the absence of viable parties could have on the agency’s future cost recovery efforts. Information on these key issues is important for EPA to effectively plan the future course of the Superfund program, and the Congress needs such data to help it make more informed decisions about program funding and policy issues.
To assist the Congress in making decisions about funding the Superfund program, we are recommending that the Administrator, EPA, assess the comprehensiveness and reliability of the data the agency collects and, where necessary, improve the data for the purpose of providing aggregated information on the following issues:
Recommendations for Executive Action
• the status and cost of cleanups at individual sites, particularly complex and expensive sites;
Page 80 GAO-09-656 Superfund
• the extent to which there are viable responsible parties at NPL sites; and
• the potential financial impacts from EPA’s inability to obtain reimbursement for agency cleanup costs from nonviable responsible parties.
We are also recommending that the Administrator, EPA, aggregate these data, as appropriate, to provide clear and complete information on these issues, and provide this information to the Congress in the agency’s annual accomplishment reports.
We provided EPA, DOJ, and the Administrative Office of the U.S. Courts with a draft of this report for review and comment. DOJ and the Administrative Office of the U.S. Courts had no comments on the draft report, although the Administrative Office of the U.S. Courts provided one technical clarification which we incorporated into the report. In its written comments, EPA agreed with our recommendation to review the agency’s data on site cleanup status and costs and determine what additional aggregate information would be meaningful to provide to the Congress; however, EPA disagreed with our recommendations to provide aggregate data on the extent to which there are viable responsible parties at sites and the potential financial impacts of EPA’s inability to obtain reimbursement for agency cleanup costs from nonviable responsible parties. EPA did not specifically address our recommendation to provide any additional aggregated information to the Congress in its annual accomplishment reports.
Agency Comments and Our Evaluation
In commenting on our recommendation to provide aggregated data on site cleanup status and costs, EPA recognized that both site-specific and aggregate information are necessary to support congressional decision making. EPA indicated that it has made significant efforts to provide information to the public on individual site cleanups through the Superfund site profile pages available on the agency’s Web site. EPA also noted that there are limitations in the extent to which site-specific data can or should be aggregated because of the complexity and diversity of individual site cleanups. We agree that EPA’s Superfund site profile pages provide valuable information about individual sites. However, this information cannot be used to evaluate programmatic trends without a labor intensive process of collecting and analyzing data from potentially over 1,000 individual sites. Moreover, certain data central to understanding the status and future cost of Superfund site cleanups (particularly EPA-led
Page 81 GAO-09-656 Superfund
cleanups)—such as estimates of the amount of work or funding needed to reach cleanup goals—are not available on EPA’s Web site. EPA noted that some of this information may be sensitive on a site-specific basis. However, even data that is on EPA’s Web site, such as the cleanup status of sites’ operable units, cannot be easily aggregated to provide information on program trends. Therefore, to assess programmatic trends as it makes future funding decisions, it is important that EPA provide the Congress with aggregated data beyond what is available on the agency’s Web site. In this report, we recognize that there are challenges to compiling aggregated data on cleanup status, given the differences between sites and the way response actions are carried out. We also recognize that EPA has made progress in developing measures that provide information on the extent to which contamination at sites has been addressed. At the same time, additional improvement in EPA’s measures is necessary to provide the Congress with data to understand the amount and cost of remaining site work.
In disagreeing with our recommendations to provide aggregated data on the extent to which there are viable responsible parties and the potential financial impacts of nonviable responsible parties, EPA stated that such data would likely be of limited value because they are subject to change throughout the cleanup and enforcement process, and that information on compromises made pursuant to the agency’s orphan share policy alone does not allow it to make accurate predictions of future cost recoveries. We disagree with EPA’s comment that this information would be of limited value. The Congress needs a more comprehensive understanding of EPA’s future funding liabilities for site cleanups as it considers various proposals, such as whether to reinstate taxes to support the Superfund program. Key determinants of EPA’s future funding liabilities include both the amount of work remaining at sites and estimates of how much of this work EPA will likely need to pay for using its Superfund appropriation. Furthermore, the private sector and other federal agencies have taken steps to estimate their environmental liabilities; we believe that a better understanding of EPA’s future Superfund funding needs is essential as well.
In this regard, data on the extent to which sites that lack viable responsible parties and the potential financial impacts to EPA when responsible parties cannot pay for some or all of their cleanup obligations are critical elements for estimating EPA’s future funding needs. We recognize in this report that the Superfund enforcement process is a complex, lengthy, and iterative process. However, this does not preclude efforts to collect and aggregate these data, as many of the data elements
Page 82 GAO-09-656 Superfund
EPA currently collects and reports on other aspects of the Superfund program also change and must be updated regularly. In addition, while future economic conditions and enforcement outcomes are uncertain, EPA already has or could develop certain information that would form the basis of such a data collection effort. For example, at some sites, cleanup actions have been completed and the statute of limitations on cost recovery and other enforcement efforts may have passed. Data on the number of nonviable responsible parties and unrecovered costs at these sites could form the basis of an historical trend analysis. Also, as part of the enforcement process, EPA collects information from responsible parties about whether they claim to have a limited ability to pay for cleanup costs. This information, among other data, such as better data on the value of compromises made pursuant to EPA’s orphan share policy and the outcome of actions pursued against parties in bankruptcy courts, could help the agency estimate future potentially unrecoverable costs. We recognize that these data would be sensitive at the site-specific level and, therefore, we recommend that they be published only on an aggregated basis. We also recognize that aggregated data on the issues would—at best—be estimates and would likely need to be presented in terms of ranges to account for the uncertainties associated in the underlying data and methodological assumptions. However, we believe that on an aggregated level, these data would serve as important indicators of EPA’s potential funding needs to continue to ensure cleanup at nonfederal NPL sites.
EPA stated that it agreed with our findings with respect to trends in Superfund enforcement and litigation. However, EPA suggested that we clarify language in the report discussing the number of enforcement actions that result in responsible party work commitments or cost recovery, as compared to the estimated monetary value of these outcomes. EPA noted that the estimated value of responsible parties’ work commitments substantially exceeds that of the agency’s cost recoveries. We agree with EPA’s comment, and while our methodology was focused on evaluating the frequency with which different outcomes were achieved, we made a number of changes to reflect that the value of responsible parties’ work commitments was greater than EPA’s recovered costs.
EPA also stated that the report inaccurately describes the relationship between the Superfund trust fund and the level of annual appropriations for Superfund program activities. We agree with EPA that the balance of the trust fund has not significantly affected appropriations to the Superfund program. However, we disagree with EPA’s comment that we have mischaracterized the relationship between the trust fund and
Page 83 GAO-09-656 Superfund
appropriations to the Superfund program. When we refer to the balance of the trust fund in this report, we refer to the dedicated amount potentially available to be appropriated to the Superfund program. Since the balance of the trust fund has diminished to almost zero, it would be difficult for the Congress to increase the level of funding for the Superfund program because any additional appropriations must compete with other programs or uses of the general fund. Conversely, if the trust fund balance was substantial, the Congress could increase the Superfund program appropriation without increasing use of the general fund. The lack of a substantial trust fund balance may also present challenges in negotiations with recalcitrant responsible parties because of a perception that, due to competition for funds, the Congress is unlikely to substantially increase the level of the Superfund appropriation, which would allow EPA to take on additional cleanup work.
In addition, EPA suggested that we clarify references to the experts from which we gathered information for this report. In this report, we sometimes refer to these individuals collectively as Superfund experts, while in other instances, we refer to the experts more specifically, depending upon their positions and backgrounds if we determined that these might have significant bearing on the information they provided. We believe this approach is appropriate, given that all of the individuals we spoke with were, in various ways, experts on the Superfund program and/or CERCLA enforcement, and many were attorneys. Also, because of the variety of experts that we contacted, if we referred to the specific background of each individual for each statement he or she made, we believe the report would be unnecessarily cumbersome to read.
Finally, EPA provided a number of other technical comments and clarifications, which we incorporated, as appropriate. EPA’s written comments are presented in appendix III.
As agreed with your offices, unless you publicly announce the contents of
this report earlier, we plan no further distribution of it until 30 days from the date of this report. At that time, we will send copies of this report to the Administrator of EPA, the Attorney General of the United States, the Director of the Administrative Office of the U.S. Courts, and appropriate congressional committees. In addition, the report will be available at no charge on our Web site at http://www.gao.gov.
Page 84 GAO-09-656 Superfund
If you or your staffs have any questions about this report, please contact me at (202) 512-3841 or [email protected]. Contact points for our Offices of Congressional Relations and Public Affairs may be found on the last page of this report. Key contributors to this report are listed in
appendix IV.
John B. Stephenson irector, Natural Resources D
and Environment
Page 85 GAO-09-656 Superfund

List of Requesters
The Honorable James M. Inhofe Ranking Member Committee on Environment and Public Works United States Senate The Honorable John Thune United States Senate The Honorable John Campbell House of Representatives The Honorable Charles W. Dent House of Representatives The Honorable Mark Steven Kirk House of Representatives
Page 86 GAO-09-656 Superfund
Appendix I: Objectives, Scope, and
Methodology
Page 87 GAO-09-656
Appendix I: Objectives, Scope, and Methodology
This appendix provides information on the scope of work and the methodology used to examine the (1) outcomes of the Environmental Protection Agency’s (EPA) enforcement actions, and the factors considered by federal and private parties in reaching these outcomes; (2) trends, if any, in litigation to resolve Superfund liability; and (3) status and implementation costs of the Superfund program. As requested, we also provided detailed information on the costs of Superfund enforcement and administration activities in July 2008.1
To identify the outcomes of EPA’s enforcement actions, we first reviewed EPA’s process for enforcing the Superfund program, including applicable statutes, regulations, and EPA guidance. We also interviewed officials responsible for implementing and enforcing the Superfund program, including officials in EPA’s Office of Solid Waste and Emergency Response (OSWER), and Office of Enforcement and Compliance Assurance (OECA); as well as officials with the Department of Justice’s (DOJ) Environment and Natural Resources Division.
We obtained and analyzed data for fiscal years 1979 through 2007 on the outcomes of EPA’s enforcement actions from EPA’s Comprehensive Environmental Response, Compensation, and Liability Information System (CERCLIS). We generally limited our analyses to the results of completed actions taken at sites proposed for, listed on, or deleted from the National Priorities List (NPL), as of the end of fiscal year 2007.2 We collected data starting from fiscal year 1979 because the earliest Superfund enforcement action with a monetary value was achieved in that year. An EPA official told us that, although this outcome occurred before the Superfund program began, it was included among EPA’s Superfund enforcement outcomes because it concerned a site that was later listed on the NPL. Key variables for which we collected these data included
• the site at which the enforcement action was taken;
1GAO, Superfund: Funding and Reported Costs of Enforcement and Administration
Activities, GAO-08-841R (Washington, D.C.: July 18, 2008).
2These data included EPA (or federal-lead) actions at proposed, listed, and deleted NPL sites, as of the end of fiscal year 2007. In addition, according to an EPA official, in some instances, states take the primary lead in an enforcement action, and EPA generally plays only an advisory role in these actions. The official stated that the agency excludes the outcomes of these enforcement actions from its accomplishment reporting and, therefore, we excluded them from our analysis.
Superfund

Appendix I: Objectives, Scope, and
Methodology
• the type of action taken, such as whether EPA settled with or issued an order to a responsible party;
• the date when the action was completed;
• the type of outcome that resulted from the action, such as whether the action included cost recovery or site work (and what type of site work);
• EPA’s estimated value of the action, such as the amount of costs to be recovered or the estimated value of site work to be performed; and
• the responsible parties identified for individual sites.
To analyze these data, we worked with OECA officials to determine whether the processes used to take different types of actions should be considered administrative or judicial processes, and whether the outcomes of different types of actions should be considered consensual or nonconsensual. On the basis of this classification, we developed information on the extent to which EPA has used different types of processes and actions and achieved different types of outcomes concerning parties’ liability for Superfund site cleanups. Additionally, we used EPA data on the estimated value of its enforcement actions at NPL sites to calculate the value of EPA’s enforcement outcomes for fiscal years 1979 through 2007. These data included the values of past costs recovered, future costs obtained, responsible parties’ work commitments, and penalties that resulted from individual enforcement actions, although we did not evaluate the accuracy of EPA’s estimates.3 During the course of
3We consider EPA data on the monetary value of its enforcement activities to be estimates for several reasons. First, the value of the responsible party work commitments reported by EPA is an estimated value—or projected cost—of the activities these parties agree to perform and does not represent the actual amount of money spent by responsible parties at sites as a result of EPA’s enforcement activities. Second, the value of EPA’s past costs recovered, future costs obtained, and penalties assessed are values taken from enforcement documents, such as settlement agreements, and may not represent the actual amount of money paid by a responsible party. Third, the values reported in EPA’s data do not consistently represent the value of EPA’s enforcement outcomes as amended over time. An EPA official stated that the agency only recently added an amended enforcement action outcome in its database. Historically, the official said, EPA regions did not inform EPA headquarters of all modifications to their settlement agreements and orders; although he stated that EPA headquarters did work with the regions to update these data in CERCLIS when modifications were significant. Fourth, the values reported in EPA’s data do not include payments for future EPA oversight of work conducted by responsible parties or interest payments from responsible parties who arrange to pay EPA over time. Finally, EPA may assist states in taking enforcement actions, the results of which are not included in the total we present in this report.
Page 88 GAO-09-656 Superfund
Appendix I: Objectives, Scope, and
Methodology
our review, EPA told us that it continually corrects and updates its Superfund enforcement outcome data. The version of the data that we analyzed for this report was updated through June 2008. However, because of EPA’s ongoing effort to update the data, future analysis of this database may not match our results.
To obtain information on the factors that parties consider in resolving liability, we conducted 12 interviews with a variety of Superfund experts. We selected these experts on the basis of a number of factors, such as referrals from other interviewees, the past efforts of the individuals (or the organizations they represent) related to the Superfund program or Comprehensive Environmental Response, Compensation, and Liability Act (CERCLA) enforcement, and representation of a variety of perspectives. In addition to EPA and DOJ officials, the Superfund experts we interviewed included representatives of
• two professional organizations with knowledge of Superfund litigation and practice—the American Bar Association and the Environmental Law Institute;
• three law firms that represent responsible parties in Superfund litigation;
• three public interest groups—Earthjustice, the Natural Resources Defense Council, and Resources for the Future;
• one industry group—the Superfund Settlements Project; and
• an organization of state waste officials—the Association of State and Territorial Solid Waste Management Officials.
To obtain additional information on the types of actions EPA has taken to enforce the Superfund program, as well as to gain greater insight into the factors that influence EPA’s and other parties’ decisions on how to resolve CERCLA liability, we reviewed key documents detailing the decision-making process behind enforcement actions, as well as parties’ responses to these actions, from a nonprobability sample of 10 Superfund sites.4 To
4We requested and received information for 15 sites; however, on the basis of the limited information available for some sites, among other reasons, we reviewed enforcement documentation for only 10 sites. Key documents we requested and reviewed included agency decision memorandums for settlements and administrative actions, as well as documents referring actions to DOJ for judicial enforcement. We identified these documents as being the most likely to provide information on the factors influencing EPA’s and other parties’ decisions about how to resolve site liability by reviewing additional files for other sites and through our review of EPA guidance. We did not verify the accuracy of the information contained in these documents.
Page 89 GAO-09-656 Superfund
Appendix I: Objectives, Scope, and
Methodology
select these sites, we identified a pool of sites (1) that were not federal facilities, (2) where EPA had identified one or more responsible parties, and (3) which had reached construction complete during or after 1995. From this pool, we selected sites on the basis of the highest, average, and lowest values in terms of the number of responsible parties identified and the ratio of the monetary value of the enforcement outcome to enforcement expenditures. We then requested enforcement documentation for our sample of sites based on the number and type of enforcement actions taken at the sites; the extent to which the sites represented a variety of site types (e.g., recycling, manufacturing, or mining); site location (by EPA region); date the site reached construction complete; and total EPA spending at the site.
To examine trends in litigation to resolve Superfund liability, we created a database of litigation related to CERCLA, using data collected from the Public Access to Court Electronic Records (PACER) system.5 We conducted this effort because one of the congressional requesters’ original interests was in the amount of funds, including legal fees, spent by EPA and the private sector related to enforcing CERCLA. However, comprehensive data on the costs of litigation would be difficult to obtain, particularly because data for the private sector would be proprietary. Therefore, we determined that data on trends in the extent of CERCLA litigation would be the best information we could obtain for indicating the overall direction of trends in the cost of such litigation. We determined that the PACER system provided access to the most comprehensive set of cases that we could use to identify trends.
5The PACER system is operated by the Administrative Office of the U.S. Courts, which is the central support agency for the Judicial Branch. The PACER system provides users with access to documents related to cases filed in federal courts.
Page 90 GAO-09-656 Superfund
Appendix I: Objectives, Scope, and
Methodology
We searched the PACER system for civil cases filed in U.S. district courts under a CERCLA cause of action.6 We collected data for 88 of the 94 U.S. district courts, which represented nearly all of the courts for the 50 states and the District of Columbia.7 We searched district court records on a monthly basis, from the beginning of fiscal year 1994 through fiscal year 2007.8 We confined our data collection effort to this period because, after analyzing the
6We identified cases with a CERCLA cause of action by searching for civil cases with a cause of action listed in PACER that began with the digits “42:96.” We did not search for criminal cases or cases filed in bankruptcy courts. In addition, we did not search for cases in state or local courts, although litigation related to liability for the cleanup of Superfund sites may be filed in those courts. Moreover, we relied upon the cause of action listed in PACER for identifying CERCLA cases and, therefore, our methodology did not include those cases filed under multiple causes of action, including CERCLA, but which were categorized in PACER under a different cause of action. Trends in such litigation would not be represented in the data we collected and analyzed. In addition, data we collected from the PACER system does not solely represent litigation over NPL sites because the federal government, state governments, and other parties may initiate litigation under CERCLA related to both NPL and non-NPL sites.
7We excluded the federal district courts for the District of Guam, the District of the Northern Mariana Islands, the District of Puerto Rico, and the District of the Virgin Islands from our analysis. We also excluded the U.S. Federal Claims Court, which has a unique and specific jurisdiction that does not include Superfund claims. Finally, we were unable to obtain data for the federal district court for the Eastern District of Michigan because the court did not make case data available to PACER searches based on the cause of action during our study period, and neither Administrative Office of the U.S. Courts nor district court officials could provide any data on CERCLA cases filed in this district.
8We conducted our search on a monthly basis for each court because of the limitations of the PACER system, which allows users to search for cases under specific causes of action a maximum of 1 month and district at a time. For four district courts, we could not obtain case data based on cause of action searches of the PACER system. An official with the Administrative Office of the U.S. Courts provided a list of CERCLA cases filed in the federal district courts for the Central District of California, the Northern District of Georgia, and the District of Minnesota during the period of our study, using similar search criteria to ours and data the office receives from the districts. The official cautioned that since the cause of action field is not a required data element of the data the office collects, there may have been additional CERCLA cases in these districts that the office’s search did not identify. In addition, an official in the federal district court for the Western District of Wisconsin provided a list of CERCLA cases filed in that district. District court staff compiled the list using three methods: (1) searching Westlaw for case information that included a CERCLA statute number, as well as the names of judges who presided in the federal district court for the Western District of Wisconsin; (2) speaking to experienced clerks and judges in the court who would be responsible for Superfund cases and who could identify cases by memory; and (3) searching for cases filed under an “Environmental Matters” nature of suit, and reviewing the complaints for these cases to identify cases filed under a CERCLA cause of action. According to the district court official, this search methodology identified the majority of CERCLA cases that had been filed in the district, although he noted that additional cases (most likely cases filed earlier in the period of our study) may have been missed.
Page 91 GAO-09-656 Superfund
Appendix I: Objectives, Scope, and
Methodology
date ranges for each court’s PACER-accessible data, we determined that fiscal year 1994 was the first full fiscal year for which almost all district courts’ records were searchable through the PACER system.9
As a result of our monthly searches of the PACER system, as well as data provided by the Administrative Office of the U.S. Courts and district court officials, we compiled a database of 2,281 cases filed under a CERCLA cause of action in U.S. district courts from fiscal years 1994 through 2007.10 We then analyzed the docket—or record of activity—for each of these cases to obtain basic information about the cases, as well as data on their duration, complexity, and outcome. The case information we collected included (1) data on the docket number and case title, the district court in which the case was filed, and the cause of action and nature of suit under which the case was filed;11 (2) the dates when the case was filed and then
9Two district courts did not participate in the PACER system during the entire period of our study: the federal district court for the Northern District of West Virginia began participating in the PACER system in January 1994, and the federal district court for the Southern District of Indiana began participating in the PACER system in April 2002. A court official for the federal district court for the Northern District of West Virginia said that when the district began participating in the PACER system, it uploaded case filings back to the beginning of fiscal year 1994 into the system. Therefore, our search methodology would identify all cases filed under a CERCLA cause of action in the district back to the beginning of fiscal year 1994. However, an official with the federal district court for the Southern District of Indiana stated that the district did not record cause of action data in a searchable form in the PACER system until July 2002. Therefore, data on CERCLA cases filed in the district prior to July 2002 were unavailable.
10The cases we analyzed for this report did not include cases that were active during fiscal years 1994 through 2007, but which were filed prior to fiscal year 1994. In addition, some cases that were filed between fiscal year 1994 and 2007 were closed and then reopened during this time period. Such cases were identified more than once during our monthly searches of the PACER system; however, we only included one of each of these cases in our database. In addition, some cases were filed under a CERCLA cause of action with a “mc,” or miscellaneous, designation. We excluded such cases from our analysis, because these cases were less likely to represent litigation about CERCLA liability. Finally, some cases were transferred from one district court to another. For such cases, to avoid over counting the number of cases filed, we only counted them in the original district court in which they were filed.
11The nature of suit is a case-type classification used by the Administrative Office of the U.S. Courts.
Page 92 GAO-09-656 Superfund
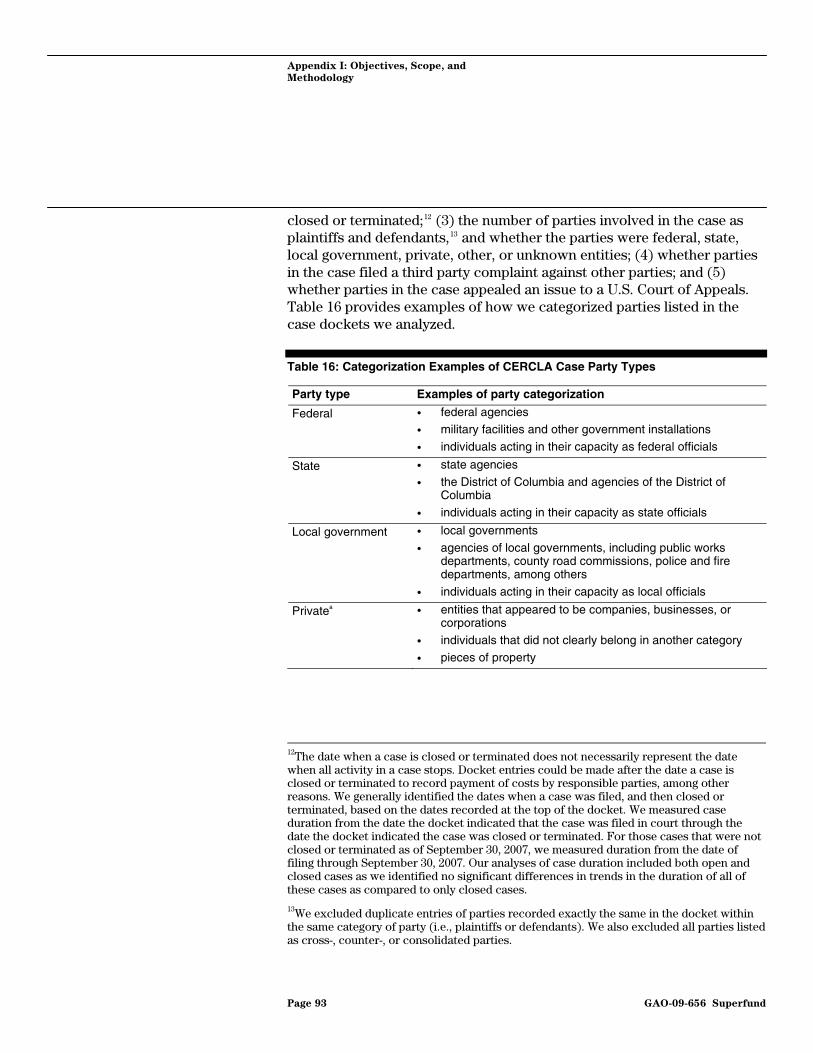
Appendix I: Objectives, Scope, and
Methodology
closed or terminated;12 (3) the number of parties involved in the case as plaintiffs and defendants,13 and whether the parties were federal, state, local government, private, other, or unknown entities; (4) whether parties in the case filed a third party complaint against other parties; and (5) whether parties in the case appealed an issue to a U.S. Court of Appeals. Table 16 provides examples of how we categorized parties listed in the case dockets we analyzed.
Table 16: Categorization Examples of CERCLA Case Party Types
Party type Examples of party categorization
Federal • federal agencies • military facilities and other government installations
• individuals acting in their capacity as federal officials
State • state agencies
• the District of Columbia and agencies of the District of Columbia
• individuals acting in their capacity as state officials
Local government • local governments
• agencies of local governments, including public works departments, county road commissions, police and fire departments, among others
• individuals acting in their capacity as local officials
Privatea • entities that appeared to be companies, businesses, or corporations
• individuals that did not clearly belong in another category
• pieces of property
12The date when a case is closed or terminated does not necessarily represent the date when all activity in a case stops. Docket entries could be made after the date a case is closed or terminated to record payment of costs by responsible parties, among other reasons. We generally identified the dates when a case was filed, and then closed or terminated, based on the dates recorded at the top of the docket. We measured case duration from the date the docket indicated that the case was filed in court through the date the docket indicated the case was closed or terminated. For those cases that were not closed or terminated as of September 30, 2007, we measured duration from the date of filing through September 30, 2007. Our analyses of case duration included both open and closed cases as we identified no significant differences in trends in the duration of all of these cases as compared to only closed cases.
13We excluded duplicate entries of parties recorded exactly the same in the docket within the same category of party (i.e., plaintiffs or defendants). We also excluded all parties listed as cross-, counter-, or consolidated parties.
Page 93 GAO-09-656 Superfund
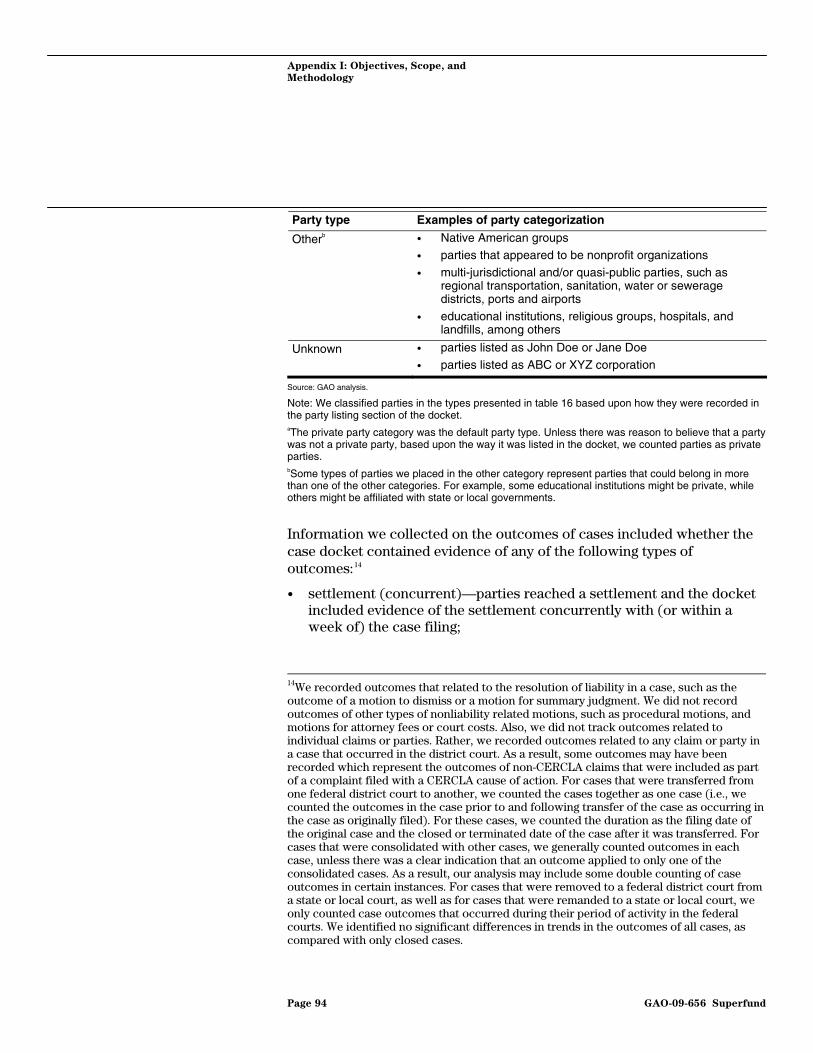
Appendix I: Objectives, Scope, and
Methodology
Party type Examples of party categorization
Otherb • Native American groups
• parties that appeared to be nonprofit organizations
• multi-jurisdictional and/or quasi-public parties, such as regional transportation, sanitation, water or sewerage districts, ports and airports
• educational institutions, religious groups, hospitals, and landfills, among others
Unknown • parties listed as John Doe or Jane Doe
• parties listed as ABC or XYZ corporation
Source: GAO analysis.
Note: We classified parties in the types presented in table 16 based upon how they were recorded in the party listing section of the docket. aThe private party category was the default party type. Unless there was reason to believe that a party was not a private party, based upon the way it was listed in the docket, we counted parties as private parties. bSome types of parties we placed in the other category represent parties that could belong in more than one of the other categories. For example, some educational institutions might be private, while others might be affiliated with state or local governments.
Information we collected on the outcomes of cases included whether the case docket contained evidence of any of the following types of outcomes:14
• settlement (concurrent)—parties reached a settlement and the docket included evidence of the settlement concurrently with (or within a week of) the case filing;
14We recorded outcomes that related to the resolution of liability in a case, such as the outcome of a motion to dismiss or a motion for summary judgment. We did not record outcomes of other types of nonliability related motions, such as procedural motions, and motions for attorney fees or court costs. Also, we did not track outcomes related to individual claims or parties. Rather, we recorded outcomes related to any claim or party in a case that occurred in the district court. As a result, some outcomes may have been recorded which represent the outcomes of non-CERCLA claims that were included as part of a complaint filed with a CERCLA cause of action. For cases that were transferred from one federal district court to another, we counted the cases together as one case (i.e., we counted the outcomes in the case prior to and following transfer of the case as occurring in the case as originally filed). For these cases, we counted the duration as the filing date of the original case and the closed or terminated date of the case after it was transferred. For cases that were consolidated with other cases, we generally counted outcomes in each case, unless there was a clear indication that an outcome applied to only one of the consolidated cases. As a result, our analysis may include some double counting of case outcomes in certain instances. For cases that were removed to a federal district court from a state or local court, as well as for cases that were remanded to a state or local court, we only counted case outcomes that occurred during their period of activity in the federal courts. We identified no significant differences in trends in the outcomes of all cases, as compared with only closed cases.
Page 94 GAO-09-656 Superfund

Appendix I: Objectives, Scope, and
Methodology
• settlement (nonconcurrent)—parties reached a settlement and the docket included evidence of the settlement more than a week after the case filing;
• dismissal (court)—the court dismissed parties or claims, not as a result of a settlement, such as when a court granted a defendant’s motion to dismiss claims against it;
• dismissal (voluntary)—a plaintiff dismissed parties or claims voluntarily and not as a result of a settlement;
• nonconsensual judgment—the court or jury made a judgment on liability (not accompanied by a settlement), or the court granted a motion for summary judgment or declared a party to be in default;15 and
• remand—the court remanded a case or individual claims to a state or local court.
t in
ncurrent
n of tions in the collection and analysis of data from the PACER
system.
n
Furthermore, we collected other information on case outcomes, such as whether (1) evidence indicated that parties may have reached a settlemenon issues of liability but evidence was unclear about a final settlement the case docket (possibly indicating an out-of-court settlement) or (2) there was minimal evidence of litigation activity prior to a noncosettlement.16 We then analyzed the data we collected to develop information on trends in CERCLA litigation. See below for a discussiothe limita
To help identify contributing factors for the trends in litigation, we discussed our preliminary findings with Superfund experts, focusing on why the number, duration, and complexity of CERCLA cases decreased from fiscal years 1994 through 2007. In particular, we obtained informatio
15A default judgment is a judgment in favor of the plaintiff when the defendant has not filed a meaningful response to pleadings within the time allowed or failed to appear before the court.
16We defined cases as having minimal evidence of litigation prior to nonconcurrent settlement as cases where (1) there was clear evidence that a nonconcurrent settlement was reached that resolved the liability issues in the case, and (2) the entries in the docket were limited to nonadversarial activities, such as providing parties with notice of the legal action, establishing legal representation, or filing motions to delay the proceedings while settlement negotiations were ongoing. If a docket included evidence of more adversarial types of activity, such as depositions or other discovery activities, motions to dismiss or motions for summary judgment, or the filing of counter-, cross-, or third party claims, we did not count a case as having minimal evidence of litigation.
Page 95 GAO-09-656 Superfund

Appendix I: Objectives, Scope, and
Methodology
on how certain factors, such as EPA efforts to promote settlements with responsible parties before filing a case in court, as well as court rulings oCERCLA liability issues, affected CERCLA litigation. We also discussed how trends in the amount, duration, and complexity of CERCLA litigation relate to the costs of such litigation. Finally, we discussed how certain kcourt decisions have affected CERCLA litigation, as well as h
n
ey ow some
ongoing cases could affect CERCLA litigation in the future.
PL
ly, to
has identified responsible parties with CERCLIS data on NPL sites.
as
EPA also updated its system in fiscal year 2004 and, because of this, EPA
To determine the status of the Superfund program, we collected andanalyzed data on final and deleted nonfederal NPL sites from EPA’s CERCLIS database. These data included the dates of NPL site listings toidentify trends in the number of sites that were added to the NPL from fiscal years 1983 through 2007, and data on site types to identify changes in the types of sites added to the NPL over time.17 Although the Superfund program began in fiscal year 1981, the first sites were not listed on the Nuntil fiscal year 1983 and, therefore, we considered this to be the initialtime frame for NPL site data we obtained and analyzed. In addition, to analyze the status of site cleanups, we used data on key milestones for operable units and sites identified in EPA’s CERCLIS database, including remedial assessment not begun, study underway, remedy selected, design underway, construction underway, and construction complete. Finalgain insight into the status of the Superfund program, we compared CERCLIS enforcement data on the number of sites at which EPA
To analyze the costs of implementing Superfund program activities, we obtained EPA data on overall program expenditures—also referred to outlays—from the agency’s Integrated Financial Management System (IFMS) database.18 EPA budget staff grouped expenditures into major categories, such as remedial and removal, based on their knowledge of the program. We limited our scope to fiscal years 1999 through 2007 because EPA changed the way it accounted for certain budget items in fiscal year1999, which made it difficult to obtain consistent data prior to that year.
17To identify Superfund site types, we relied on EPA’s primary site type classification, which grouped sites as manufacturing, mining, recycling, waste management, “multiple,” and “other” types of sites.
18These data excluded reimbursable expenditures and expenditures related to the Brownfields program, transfers to other appropriations, and the 2002 Homeland Security Supplemental appropriation.
Page 96 GAO-09-656 Superfund
Appendix I: Objectives, Scope, and
Methodology
budget officials created a crosswalk between the two time periods to ensure expenditure data were consistent.
In addition, we obtained and analyzed IFMS data on EPA’s site-specific expenditures at final and deleted nonfederal NPL sites for fiscal years 1990 through 2007.19 Site-specific expenditures prior to fiscal year 1990 were not readily available by fiscal year. For these expenditures, EPA incorporated data as a single amount when it went to the current IFMS system. As a result, we developed an approach to adjust pre-fisc1990 expenditures for inflation, which resulted in a range of valuesexpenditures at Superfund sites. For the minimum value, we assumed that all pre-fiscal year 1990 expenditures were made in fiscal year 1989. For the maximum value, we assumed that all pre-fiscal year 1990 expenditures were made in the year the site was proposed for the NPL.
al year for
20 We averaged these values to present information on site expenditures in this report.
To determine the sources of funding that support the Superfund trust fund, we reviewed the President’s Budget Appendices for fiscal years 1983 through 2009. These documents contain actual budget information from fiscal year 1981—the first year of the Superfund program—through fiscal year 2007. We reviewed these data with EPA budget experts to confirm their accuracy. We use nominal dollars when we refer to appropriated amounts. It is our policy to present what has actually been enacted or proposed at the time, what is reported in budget documents, or both. In contrast, for our analyses of the value of outcomes from EPA’s enforcement activities, as well as EPA’s Superfund program and site-specific expenditures, we converted all dollar figures into constant 2007 dollars.
Finally, we discussed the status of the Superfund program and its implementation costs during our interviews with Superfund experts. From these interviews, we obtained information on contributing factors for trends we identified in the Superfund program’s status and costs. We also reviewed relevant documents, such as the Superfund Program Implementation Manual; prior evaluations of the Superfund program, such as reports from GAO, EPA, the agency’s Inspector General, and others;
19These data included all appropriated site-specific Superfund expenditures except for reimbursable and Homeland Security Supplemental expenditures.
20There were some NPL sites that were not proposed for listing prior to fiscal year 1990, but had expenditures during this earlier period. At these sites, we assumed expenditures prior to fiscal year 1990 were made in fiscal year 1989.
Page 97 GAO-09-656 Superfund
Appendix I: Objectives, Scope, and
Methodology
information related to recent legal decisions and ongoing cases identified by experts; and interviewed agency officials in the Office of the Chief Financial Officer (OCFO).
To ensure the reliability of the data we used for this report, we reviewed the two relevant EPA databases: (1) CERCLIS, from which enforcement outcome and NPL site data were drawn, and (2) IFMS, from which expenditure data were drawn. For both data sources, we interviewed EPA officials about the methods the agency uses to ensure data reliability, manually and electronically reviewed the data, and compared the data with other published sources. For example, we compared expenditure data provided by EPA with agency obligation data and found that the data were somewhat similar for the years in which we had both sets of data—obligations ranged from 5 percent higher than expenditures to 16 percent lower than expenditures during fiscal years 2004 through 2007. We also followed up with EPA officials from OSWER, OECA, and OCFO with specific questions resulting from this review.
To understand the reliability and completeness of the data we collected from the PACER system, we interviewed officials with the Administrative Office of the U.S. Courts, as well as officials with seven federal district courts that collectively accounted for more than 25 percent of the cases identified during our review.21 We asked these officials about the collection, processing, and maintenance of case file data available through the PACER system. On the basis of these interviews, we determined that the information in case dockets would provide a complete and accurate record of the proceedings in a case, and we did not evaluate the accuracy of the entries to the individual dockets we collected and analyzed.
While the district court officials agreed that the PACER system provides complete, reliable access to case data, some officials also thought it possible that searching for cases by cause of action could miss certain cases if a CERCLA-related case was labeled with a non-CERCLA cause of action. To evaluate the extent to which this might occur, we tested our PACER search methodology by searching for all cases filed under an “Environmental Matters” nature of suit, and then examining non-CERCLA cases to determine if the words “CERCLA” or “Superfund” appeared in the
21The seven district courts for which we interviewed court officials included the federal district courts for the Northern District of California, the Western District of Michigan, the Eastern District of Pennsylvania, the District of Connecticut, the Western District of Washington, the District of Colorado, and the District of New Jersey.
Page 98 GAO-09-656 Superfund

Appendix I: Objectives, Scope, and
Methodology
text of the case docket. Using this methodology, we searched a nonrandom sample of 14 months out of the study period, from fiscal years 1994 through 2007 (or 8.3 percent of the 168-month study period).22 On the basis of this test, we estimate that our search methodology may undercount the number of CERCLA cases by about 15 percent because the cases were not listed in PACER as having a CERCLA cause of action.23 However, we did not evaluate whether these other cases, in which the words “CERCLA” or “Superfund” appeared, actually were CERCLA cases.
DOJ officials indicated that while the trends we identified through our review of CERCLA litigation represented their understanding of the trends in litigation based on their professional experience, the number of federal cases we identified in recent years was lower than was represented in data maintained by the department. As a result, we performed an additional test of the reliability of our PACER search methodology. We collected data from DOJ on federal CERCLA cases filed from fiscal years 1998 through 2007 and found that our database did not include approximately 30 percent of the cases in DOJ’s data. To determine why these cases were not listed with a CERCLA cause of action in the PACER system, we reviewed case documents for cases filed from fiscal years 2005 through 2007. The average percentage difference in the number of cases in DOJ’s data, compared with our data, was slightly higher over this 3-year period, at about 32 percent. However, through our review of case documents and additional information DOJ officials provided, we found that almost one-half of the cases that were in DOJ’s data but not in ours for fiscal years 2005 through 2007 should not have been identified as a result of our search of the PACER system because they (1) were filed in district courts for the U.S. territories, (2)
22To reduce potential bias in our nonrandom sample, we sampled alternate years and months throughout the 168-month study period, from fiscal year 1994 to 2007, to ensure that our test searches would encompass any broad changes in the way cases were filed over time, or yearly cyclical patterns. Sample years and months searched included: 1993 (November, December), 1995 (March, April), 1997 (January, February), 1999 (May, June), 2001 (July, August), 2003 (September, October), and 2005 (November, December).
23This percentage represents a possible error rate for CERCLA cases filed under an “Environmental Matters” nature of suit. We did not include other natures of suit in our test searches because officials with the Administrative Office of the U.S. Courts indicated that this was the nature of suit under which a CERCLA case would most likely be filed. In compiling our database of CERCLA litigation, we found that 80 percent of the cases filed under a CERCLA cause of action were filed under an “Environmental Matters” nature of suit. Overall, almost 95 percent of the cases filed under a CERCLA cause of action were filed under only four different natures of suit including “Environmental Matters.”
Page 99 GAO-09-656 Superfund
Appendix I: Objectives, Scope, and
Methodology
were filed in bankruptcy court, or (3) involved other differences in the way DOJ collects its data compared with our methodology for identifying CERCLA cases. For the remaining cases that were in DOJ’s data but not in ours for the 3-year period, it appeared as though either the court or the attorney filing the case had made an error in labeling the cause of action, based on information in case documents. From these tests, we determined that it is likely that our search methodology did not identify all of the cases related to CERCLA that were filed in U.S. district courts for fiscal years 1994 through 2007.
Furthermore, while the courts or attorneys may have made errors that caused CERCLA cases to be listed in PACER without a CERCLA cause of action, courts or attorneys may also have made errors that resulted in cases being listed under a CERCLA cause of action that were not actually related to CERCLA. To evaluate the likelihood that this occurred, we assessed the number of cases that were filed by “pro se” plaintiffs—individuals not represented by an attorney—which we believed might be an indicator of errors because individuals representing themselves might have less knowledge about how to file cases than an attorney. We found that 3 percent of the cases listed under a CERCLA cause of action in PACER were filed by “pro se” plaintiffs. We did not review court documents for these cases to determine if the cases were, in fact, related to CERCLA. Despite the potential that the CERCLA cases we identified might not represent the exact number of cases related to CERCLA from fiscal years 1994 through 2007 because of court errors or other factors, we believe that our methodology likely identified a large majority of the CERCLA cases filed in U.S. district courts during this period. Therefore, we determined that these data represent a reliable basis from which to analyze overall trends in CERCLA litigation during this period.
Finally, to further assess the reliability of the data we collected and analyzed, we discussed our preliminary findings during the interviews we conducted with Superfund experts. The experts generally indicated that the results of our analyses of enforcement outcomes, CERCLA litigation, and program status reflected their experience, or they provided explanations for the trends we observed. As a result of these efforts, we concluded that the data we collected and analyzed were sufficiently reliable for the purposes of this report. Where necessary in the report, we note potential limitations of these data.
We conducted this performance audit from August 2007 to July 2009, in accordance with generally accepted government auditing standards. Those standards require that we plan and perform the audit to obtain sufficient,
Page 100 GAO-09-656 Superfund

Appendix I: Objectives, Scope, and
Methodology
appropriate evidence to provide a reasonable basis for our findings and conclusions based on our audit objectives. We believe that the evidence obtained provides a reasonable basis for our findings and conclusions based on our audit objectives.
Page 101 GAO-09-656 Superfund
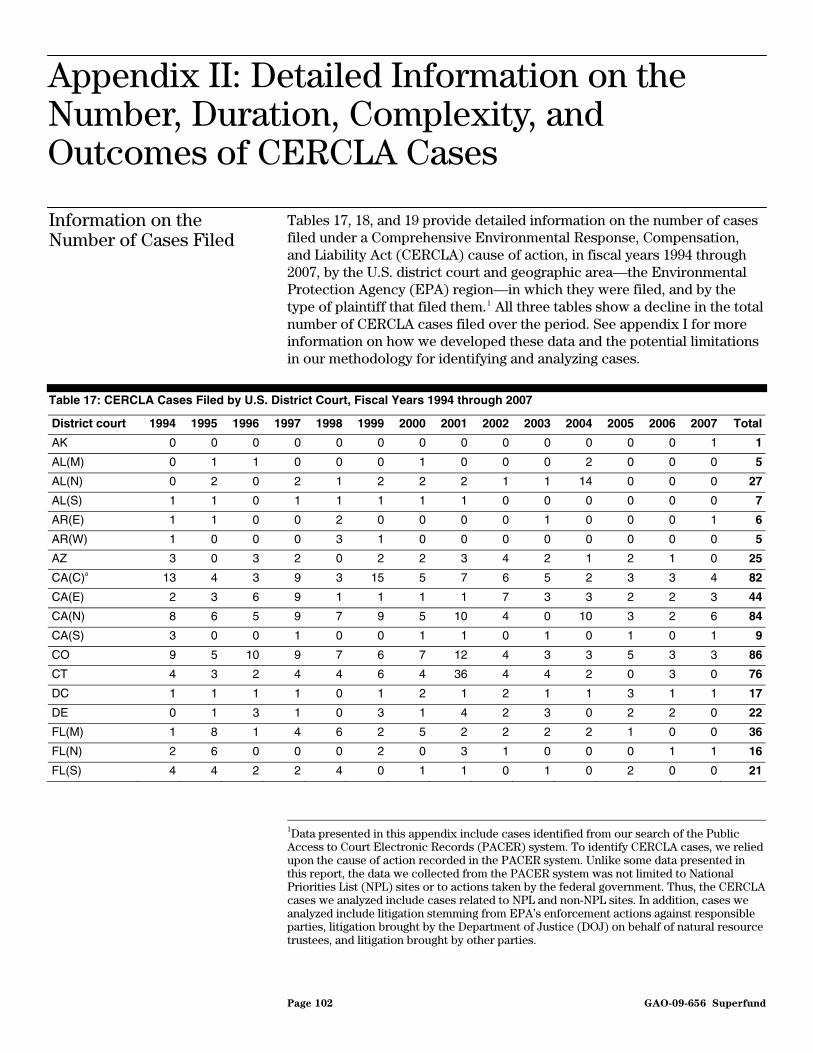
Appendix II: De
Number,
of CERCLA Cases
tailed Information on the
Duration, Complexity, and Outcomes
Page 102 GAO-09-656
Appendix II: Detailed Information on the Number, Duration, Complexity, and Outcomes of CERCLA Cases
Tables 17, 18, and 19 provide detailed information on the number of cases filed under a Comprehensive Environmental Response, Compensation, and Liability Act (CERCLA) cause of action, in fiscal years 1994 through 2007, by the U.S. district court and geographic area—the Environmental Protection Agency (EPA) region—in which they were filed, and by the type of plaintiff that filed them.1 All three tables show a decline in the total number of CERCLA cases filed over the period. See appendix I for more information on how we developed these data and the potential limitations in our methodology for identifying and analyzing cases.
Information on the Number of Cases Filed
Table 17: CERCLA Cases Filed by U.S. District Court, Fiscal Years 1994 through 2007
District court 1994 1995 1996 1997 1998 1999 2000 2001 2002 2003 2004 2005 2006 2007 Total
AK 0 0 0 0 0 0 0 0 0 0 0 0 0 1 1
AL(M) 0 1 1 0 0 0 1 0 0 0 2 0 0 0 5
AL(N) 0 2 0 2 1 2 2 2 1 1 14 0 0 0 27
AL(S) 1 1 0 1 1 1 1 1 0 0 0 0 0 0 7
AR(E) 1 1 0 0 2 0 0 0 0 1 0 0 0 1 6
AR(W) 1 0 0 0 3 1 0 0 0 0 0 0 0 0 5
AZ 3 0 3 2 0 2 2 3 4 2 1 2 1 0 25
CA(C)a 13 4 3 9 3 15 5 7 6 5 2 3 3 4 82
CA(E) 2 3 6 9 1 1 1 1 7 3 3 2 2 3 44
CA(N) 8 6 5 9 7 9 5 10 4 0 10 3 2 6 84
CA(S) 3 0 0 1 0 0 1 1 0 1 0 1 0 1 9
CO 9 5 10 9 7 6 7 12 4 3 3 5 3 3 86
CT 4 3 2 4 4 6 4 36 4 4 2 0 3 0 76
DC 1 1 1 1 0 1 2 1 2 1 1 3 1 1 17
DE 0 1 3 1 0 3 1 4 2 3 0 2 2 0 22
FL(M) 1 8 1 4 6 2 5 2 2 2 2 1 0 0 36
FL(N) 2 6 0 0 0 2 0 3 1 0 0 0 1 1 16
FL(S) 4 4 2 2 4 0 1 1 0 1 0 2 0 0 21
1Data presented in this appendix include cases identified from our search of the Public Access to Court Electronic Records (PACER) system. To identify CERCLA cases, we relied upon the cause of action recorded in the PACER system. Unlike some data presented in this report, the data we collected from the PACER system was not limited to National Priorities List (NPL) sites or to actions taken by the federal government. Thus, the CERCLA cases we analyzed include cases related to NPL and non-NPL sites. In addition, cases we analyzed include litigation stemming from EPA’s enforcement actions against responsible parties, litigation brought by the Department of Justice (DOJ) on behalf of natural resource trustees, and litigation brought by other parties.
Superfund
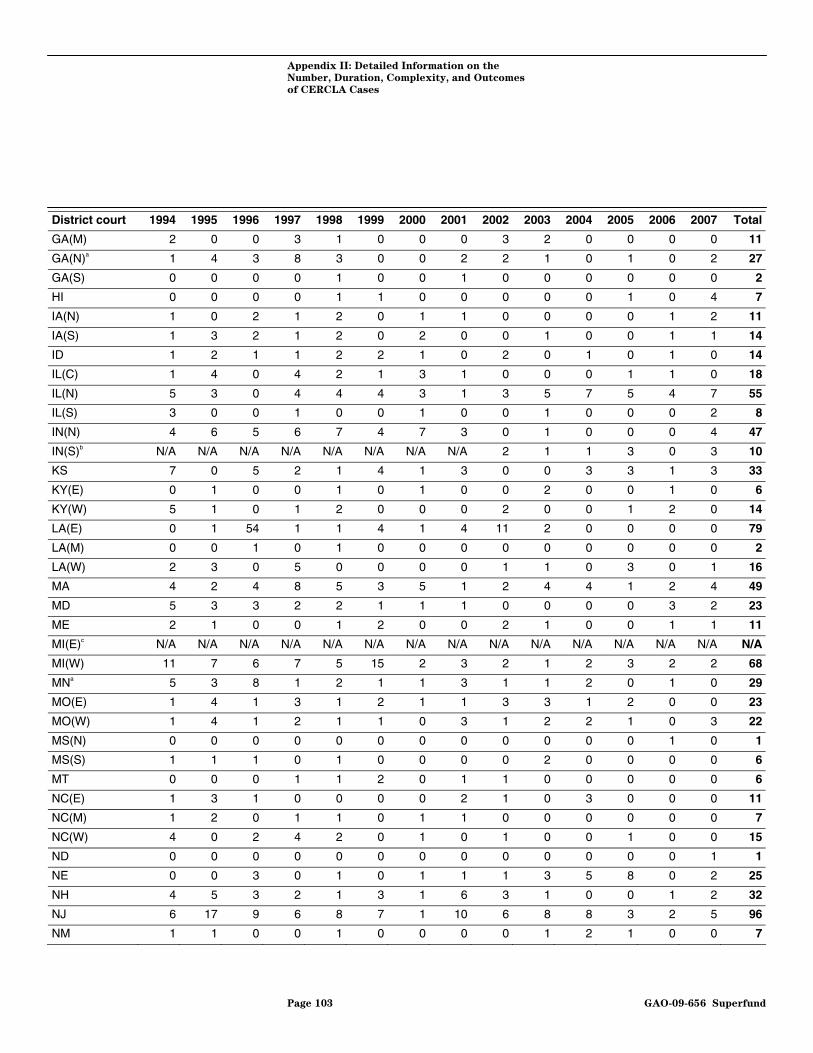
Appendix II: Detailed Information on the
Number, Duration, Complexity, and Outcomes
of CERCLA Cases
District court 1994 1995 1996 1997 1998 1999 2000 2001 2002 2003 2004 2005 2006 2007 Total
GA(M) 2 0 0 3 1 0 0 0 3 2 0 0 0 0 11
GA(N)a 1 4 3 8 3 0 0 2 2 1 0 1 0 2 27
GA(S) 0 0 0 0 1 0 0 1 0 0 0 0 0 0 2
HI 0 0 0 0 1 1 0 0 0 0 0 1 0 4 7
IA(N) 1 0 2 1 2 0 1 1 0 0 0 0 1 2 11
IA(S) 1 3 2 1 2 0 2 0 0 1 0 0 1 1 14
ID 1 2 1 1 2 2 1 0 2 0 1 0 1 0 14
IL(C) 1 4 0 4 2 1 3 1 0 0 0 1 1 0 18
IL(N) 5 3 0 4 4 4 3 1 3 5 7 5 4 7 55
IL(S) 3 0 0 1 0 0 1 0 0 1 0 0 0 2 8
IN(N) 4 6 5 6 7 4 7 3 0 1 0 0 0 4 47
IN(S)b N/A N/A N/A N/A N/A N/A N/A N/A 2 1 1 3 0 3 10
KS 7 0 5 2 1 4 1 3 0 0 3 3 1 3 33
KY(E) 0 1 0 0 1 0 1 0 0 2 0 0 1 0 6
KY(W) 5 1 0 1 2 0 0 0 2 0 0 1 2 0 14
LA(E) 0 1 54 1 1 4 1 4 11 2 0 0 0 0 79
LA(M) 0 0 1 0 1 0 0 0 0 0 0 0 0 0 2
LA(W) 2 3 0 5 0 0 0 0 1 1 0 3 0 1 16
MA 4 2 4 8 5 3 5 1 2 4 4 1 2 4 49
MD 5 3 3 2 2 1 1 1 0 0 0 0 3 2 23
ME 2 1 0 0 1 2 0 0 2 1 0 0 1 1 11
MI(E)c N/A N/A N/A N/A N/A N/A N/A N/A N/A N/A N/A N/A N/A N/A N/A
MI(W) 11 7 6 7 5 15 2 3 2 1 2 3 2 2 68
MNa 5 3 8 1 2 1 1 3 1 1 2 0 1 0 29
MO(E) 1 4 1 3 1 2 1 1 3 3 1 2 0 0 23
MO(W) 1 4 1 2 1 1 0 3 1 2 2 1 0 3 22
MS(N) 0 0 0 0 0 0 0 0 0 0 0 0 1 0 1
MS(S) 1 1 1 0 1 0 0 0 0 2 0 0 0 0 6
MT 0 0 0 1 1 2 0 1 1 0 0 0 0 0 6
NC(E) 1 3 1 0 0 0 0 2 1 0 3 0 0 0 11
NC(M) 1 2 0 1 1 0 1 1 0 0 0 0 0 0 7
NC(W) 4 0 2 4 2 0 1 0 1 0 0 1 0 0 15
ND 0 0 0 0 0 0 0 0 0 0 0 0 0 1 1
NE 0 0 3 0 1 0 1 1 1 3 5 8 0 2 25
NH 4 5 3 2 1 3 1 6 3 1 0 0 1 2 32
NJ 6 17 9 6 8 7 1 10 6 8 8 3 2 5 96
NM 1 1 0 0 1 0 0 0 0 1 2 1 0 0 7
Page 103 GAO-09-656 Superfund

Appendix II: Detailed Information on the
Number, Duration, Complexity, and Outcomes
of CERCLA Cases
District court 1994 1995 1996 1997 1998 1999 2000 2001 2002 2003 2004 2005 2006 2007 Total
NV 0 0 0 0 0 0 0 0 1 0 0 0 0 1 2
NY(E) 2 0 3 3 1 2 4 2 1 2 2 2 1 3 28
NY(N) 12 4 3 2 7 8 2 2 0 4 1 1 3 2 51
NY(S) 3 2 2 2 3 2 1 2 2 0 1 1 0 2 23
NY(W) 7 4 4 6 6 2 4 7 2 2 1 4 3 0 52
OH(N) 7 3 5 4 4 1 3 0 2 4 1 1 1 1 37
OH(S) 3 3 7 5 4 2 4 3 0 3 1 1 0 2 38
OK(E) 0 0 0 0 0 0 2 0 0 0 0 0 0 0 2
OK(N) 0 0 0 1 0 0 1 1 0 1 2 1 2 0 9
OK(W) 0 0 0 0 0 0 0 0 0 0 0 0 0 3 3
OR 4 2 2 11 3 3 2 1 0 1 3 1 1 1 35
PA(E) 7 9 10 6 11 14 10 12 16 6 4 7 8 5 125
PA(M) 3 4 6 2 1 6 3 1 2 1 0 1 0 1 31
PA(W) 6 4 5 4 3 1 1 0 1 1 0 3 3 1 33
RI 1 3 4 3 1 1 3 0 1 5 2 3 1 2 30
SC 2 5 2 1 4 2 3 3 0 3 2 2 6 3 38
SD 0 0 0 1 0 0 0 0 1 0 0 0 0 0 2
TN(E) 2 1 1 1 1 0 0 1 2 0 1 2 0 0 12
TN(M) 0 0 0 0 2 1 0 2 1 0 0 1 0 0 7
TN(W) 1 0 0 0 2 2 0 0 0 0 0 0 0 0 5
TX(E) 1 1 0 0 0 1 2 4 2 2 0 1 1 0 15
TX(N) 1 4 1 4 4 2 2 2 0 0 1 1 2 0 24
TX(S) 1 3 6 1 8 5 5 4 7 5 5 4 6 3 63
TX(W) 0 0 1 0 0 0 0 2 0 0 1 0 0 1 5
UT 2 3 6 5 4 3 0 2 2 1 4 2 2 2 38
VA(E) 2 3 0 3 2 1 1 0 0 1 2 3 1 0 19
VA(W) 0 0 0 1 1 3 3 2 1 1 0 1 0 0 13
VT 0 0 0 2 1 2 1 0 0 0 0 0 0 0 6
WA(E) 0 1 0 4 4 1 2 1 1 0 2 2 0 1 19
WA(W) 8 8 3 6 5 6 12 3 7 5 4 7 5 4 83
WI(E) 4 8 6 2 1 0 3 5 1 1 1 0 2 0 34
WI(W)a 0 1 1 0 0 0 0 0 1 0 1 2 0 1 7
WV(N) 0 0 0 0 1 0 1 1 0 5 1 0 0 0 9
WV(S) 0 1 0 0 0 1 0 0 1 0 0 2 0 0 5
WY 2 0 0 0 0 0 0 1 0 0 0 0 0 0 3
Total 214 204 230 209 187 180 149 197 142 125 124 118 91 111 2,281
Source: GAO analysis of data on cases filed in U.S. district courts.
Page 104 GAO-09-656 Superfund

Appendix II: Detailed Information on the
Number, Duration, Complexity, and Outcomes
of CERCLA Cases
Note: We excluded cases filed in the courts of the U.S. territories, as well as the U.S. Federal Claims Court, from our analysis. For states with multiple district courts, the courts are distinguished by geographic location, as shown by the letter in parentheses: (C) is central, (M) is middle, (E) is eastern, (W) is western, (N) is northern, and (S) is southern. aFor these district courts, we could not obtain case data based our search of the PACER system. However, the Administrative Office of the U.S. Courts provided a list of CERCLA cases filed in the federal district courts for the Central District of California, the Northern District of Georgia, and the District of Minnesota during the period of our study, using similar search criteria to ours and data provided to the Administrative Office of the U.S. Courts from the districts. In addition, an official in the federal district court for the Western District of Wisconsin provided a list of CERCLA cases filed in that district. bThe federal district court for the Southern District of Indiana did not record cause of action data in a searchable form in the PACER system until July 2002 and, therefore, the table does not include cases filed in this district before July 2002. cThis table does not include cases from the federal district court for the Eastern District of Michigan because the court did not record case data in PACER with the necessary information for our search methodology, and neither the Administrative Office of the U.S. Courts nor district court officials could provide data on CERCLA cases filed in this district.
Table 18: CERCLA Cases Filed in U.S. District Courts, According to the EPA Region Where the Courts Are Located, Fiscal Years 1994 through 2007
EPA region 1994 1995 1996 1997 1998 1999 2000 2001 2002 2003 2004 2005 2006 2007 Total
Region 1 15 14 13 19 13 17 14 43 12 15 8 4 8 9 204
Region 2 30 27 21 19 25 21 12 23 11 16 13 11 9 12 250
Region 3 24 26 28 20 21 31 23 22 25 19 8 22 18 10 297
Region 4 28 40 14 28 33 12 16 21 16 14 24 11 11 6 274
Region 5 43 38 38 34 29 28 27 19 12 18 16 16 11 22 351
Region 6 8 14 63 12 20 13 13 17 21 13 11 11 11 9 236
Region 7 11 11 14 9 8 7 6 9 5 9 11 14 3 11 128
Region 8 13 8 16 16 12 11 7 16 8 4 7 7 5 6 136
Region 9 29 13 17 30 12 28 14 22 22 11 16 12 8 19 253
Region 10 13 13 6 22 14 12 17 5 10 6 10 10 7 7 152
Total 214 204 230 209 187 180 149 197 142 125 124 118 91 111 2,281
Source: GAO analysis of data on cases filed in U.S. district courts.
Note: EPA regions 2 and 9 include district courts for the U.S. territories, which we excluded from our analysis.
Page 105 GAO-09-656 Superfund

Appendix II: Detailed Information on the
Number, Duration, Complexity, and Outcomes
of CERCLA Cases
Table 19: CERCLA Cases Filed by Type of Plaintiff, Fiscal Years 1994 through 2007
Type of plaintiff 1994 1995 1996 1997 1998 1999 2000 2001 2002 2003 2004 2005 2006 2007 Total
Federal 53 63 54 82 85 68 65 61 54 62 42 50 41 57 837
State 22 11 22 29 23 31 22 26 21 14 16 18 16 15 286
Other
Local government 9 15 5 4 3 12 8 7 2 3 4 10 4 2 88
Private parties 137 120 154 96 81 68 62 109 69 48 65 45 37 42 1,133
Other parties 6 7 5 6 5 8 6 7 6 3 4 3 3 2 71
Unknown parties 1 0 2 0 0 0 1 3 0 0 1 0 0 0 8
Other subtotal 153 142 166 106 89 88 77 126 77 54 74 58 44 46 1,300
Source: GAO analysis of data on cases filed in U.S. district courts.
Note: Cases are categorized in this table based on having at least one plaintiff of a given type. Because some cases have more than one type of plaintiff, the number of cases is over counted. For example, 81 of the 286 cases listed with a state plaintiff also have a federal plaintiff and are, therefore, counted in both categories in this table.
Information on Case Duration
Table 20 and figures 14 and 15 provide information on the duration of CERCLA cases filed in fiscal years 1994 through 2007, by the type of plaintiff and by the number of defendants in the case. Cases with federal and state plaintiffs were typically shorter in duration than cases filed by other plaintiffs, while cases with more defendants were typically longer in duration. The following information on case duration is based on our analysis of both open and closed cases. Approximately 92 percent of cases filed from fiscal years 1994 through 2007 were closed as of the end of fiscal year 2007. Analysis of only closed cases revealed no substantial differences in case duration.
Table 20: Duration of CERCLA Cases by Type of Plaintiff, Fiscal Years 1994 through 2007
Duration (months)
Type of plaintiff Average Median
Federal government 14.5 4.9
State government 15.1 4.6
Other plaintiff 22.0 15.2
All cases 18.6 10.2
Source: GAO analysis of data on cases filed in U.S. district courts.
Note: We measured case duration from the date the docket indicated that the case was filed in court through the date the docket indicated the case was closed or terminated. For those cases that were not closed or terminated as of September 30, 2007, we measured duration from the date of filing through September 30, 2007.
Page 106 GAO-09-656 Superfund
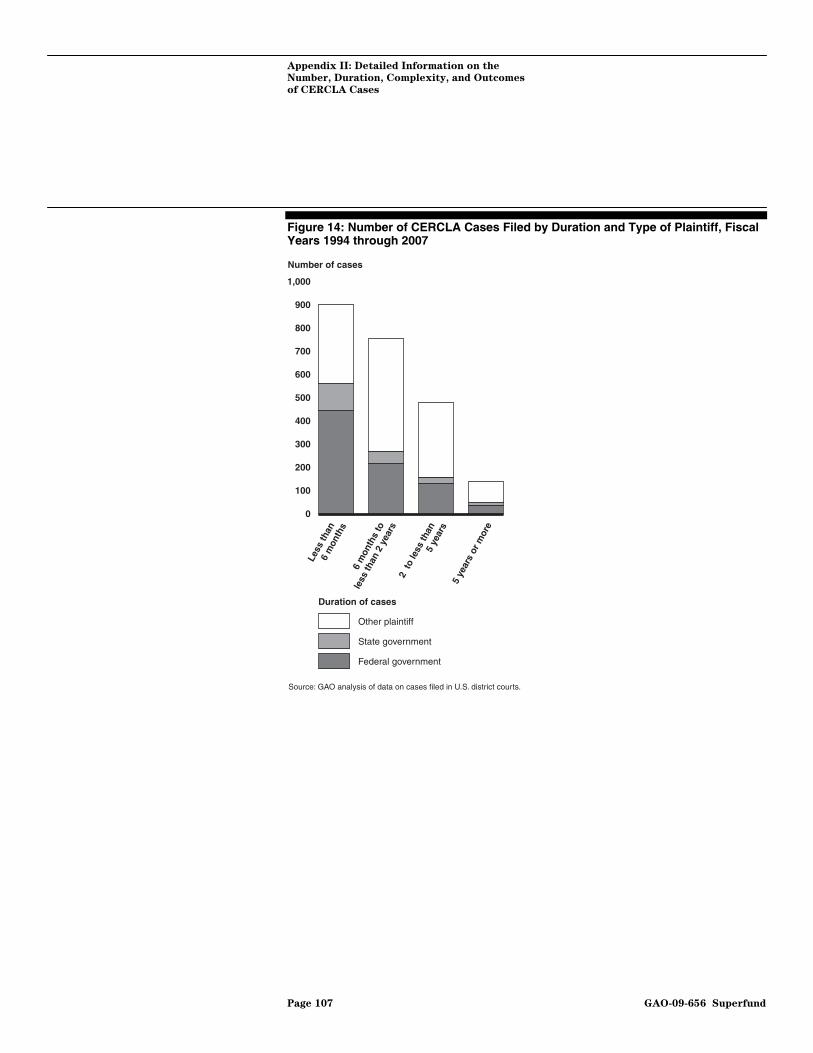
Appendix II: Detailed Information on the
Number, Duration, Complexity, and Outcomes
of CERCLA Cases
Figure 14: Number of CERCLA Cases Filed by Duration and Type of Plaintiff, Fiscal Years 1994 through 2007
Number of cases
Duration of cases
Other plaintiff
State government
Federal government
Source: GAO analysis of data on cases filed in U.S. district courts.
0
100
200
300
400
500
600
700
800
900
1,000
Les
s th
an
6
mon
ths
5 y
ears
or m
ore
2
to le
ss th
an
5 ye
ars
6 m
onth
s to
les
s th
an 2
yea
rs
Page 107 GAO-09-656 Superfund
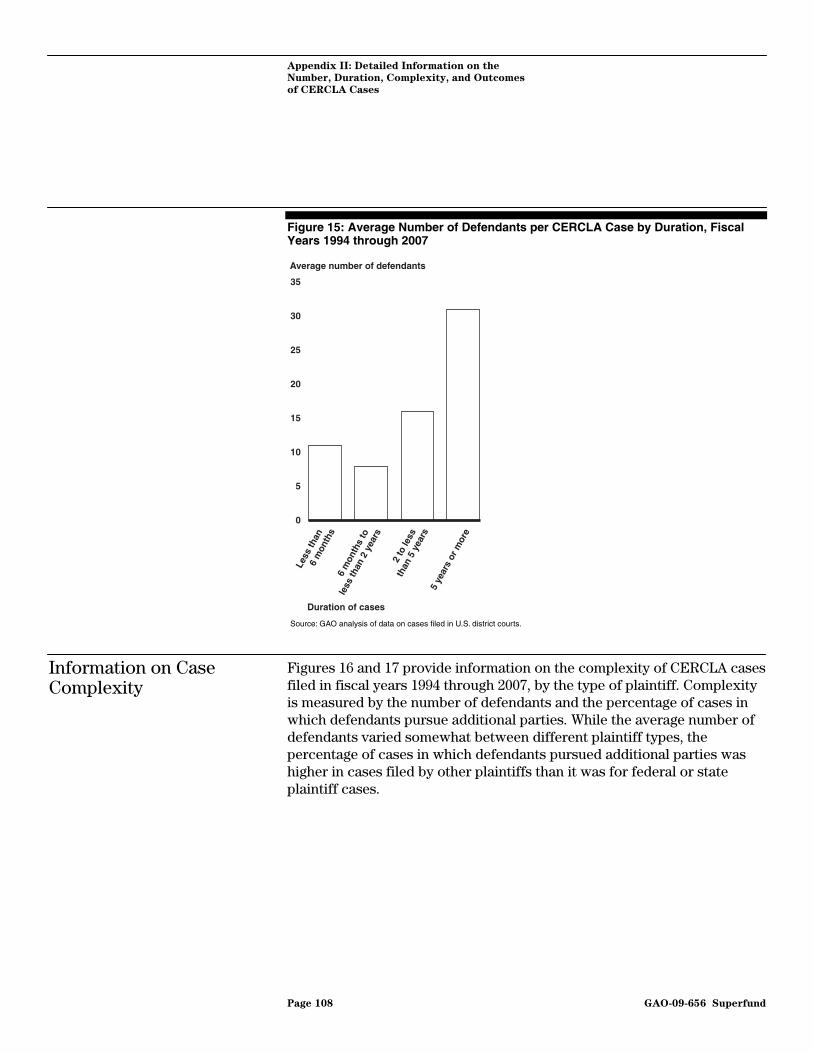
Appendix II: Detailed Information on the
Number, Duration, Complexity, and Outcomes
of CERCLA Cases
Figure 15: Average Number of Defendants per CERCLA Case by Duration, Fiscal Years 1994 through 2007
Average number of defendants
Duration of cases
0
5
10
15
20
25
30
35
5
yea
rs o
r mor
e
2
to le
ss
than
5 y
ears
6 m
onth
s to
less
than
2 y
ears
Les
s th
an
6 m
onth
s
Source: GAO analysis of data on cases filed in U.S. district courts.
Information on Case Complexity
Figures 16 and 17 provide information on the complexity of CERCLA cases filed in fiscal years 1994 through 2007, by the type of plaintiff. Complexity is measured by the number of defendants and the percentage of cases in which defendants pursue additional parties. While the average number of defendants varied somewhat between different plaintiff types, the percentage of cases in which defendants pursued additional parties was higher in cases filed by other plaintiffs than it was for federal or state plaintiff cases.
Page 108 GAO-09-656 Superfund
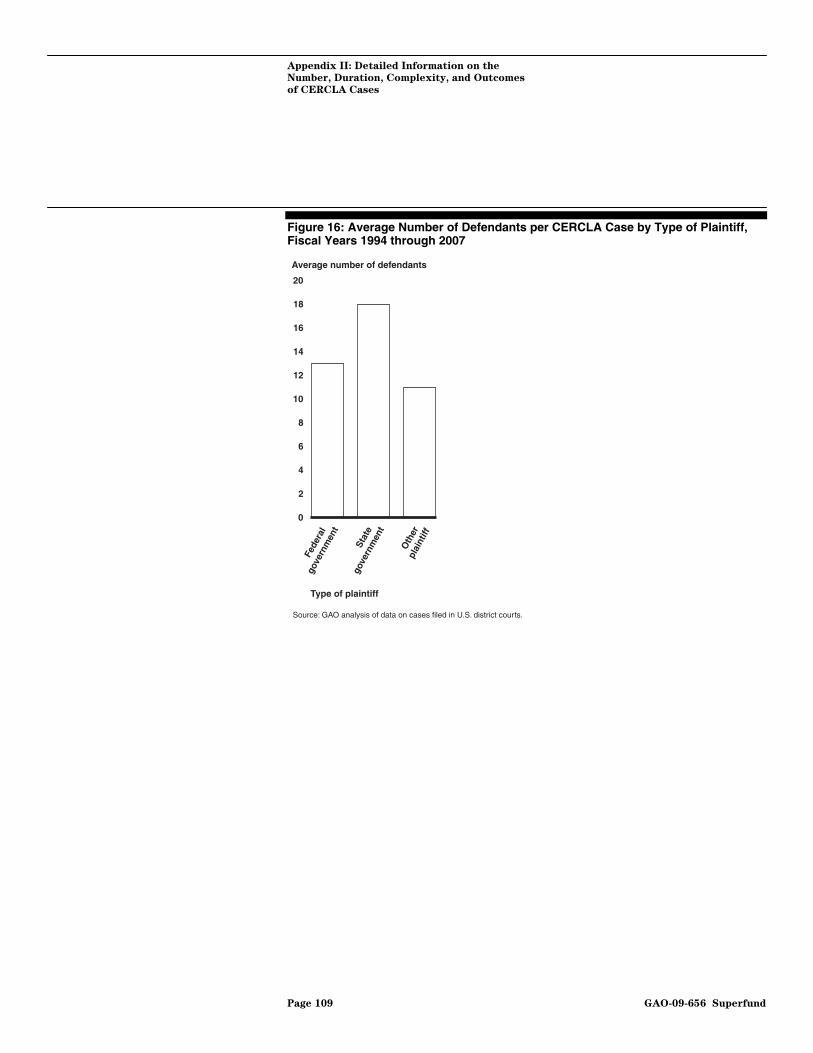
Appendix II: Detailed Information on the
Number, Duration, Complexity, and Outcomes
of CERCLA Cases
Figure 16: Average Number of Defendants per CERCLA Case by Type of Plaintiff, Fiscal Years 1994 through 2007
Average number of defendants
Source: GAO analysis of data on cases filed in U.S. district courts.
Type of plaintiff
0
2
4
6
8
10
12
14
16
18
20
Oth
er
plai
ntiff
St
ate
gov
ernm
ent
Fede
ral
gov
ernm
ent
Page 109 GAO-09-656 Superfund
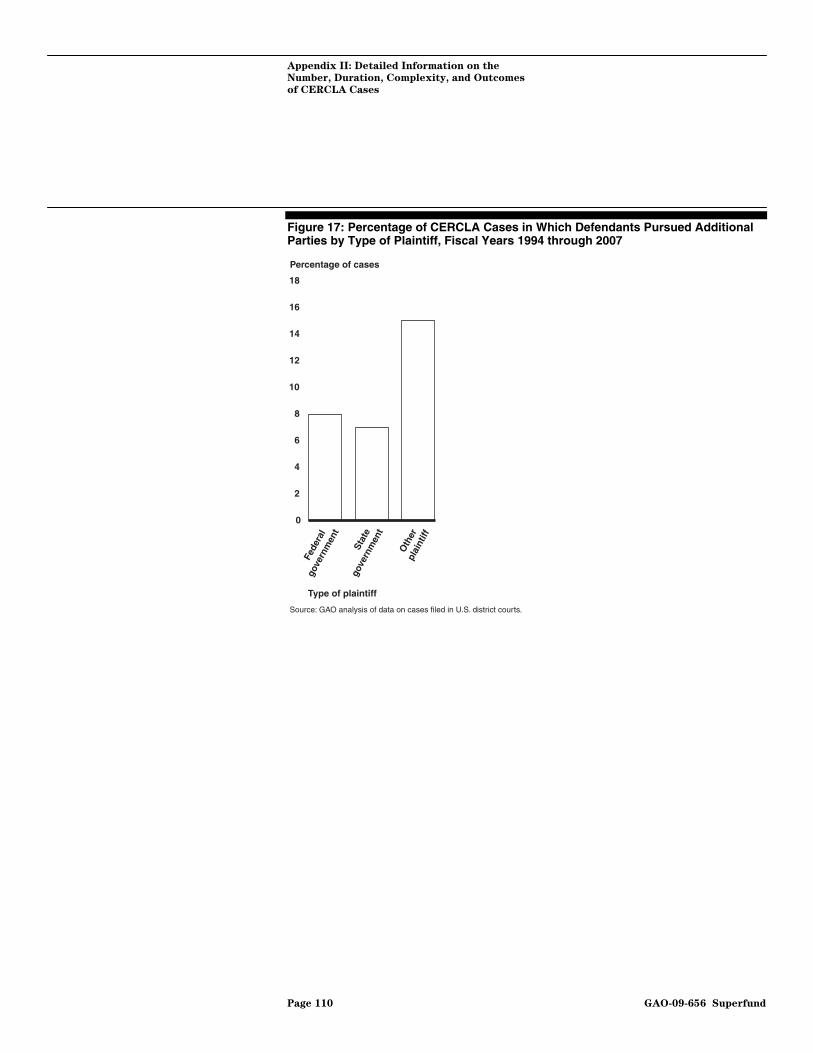
Appendix II: Detailed Information on the
Number, Duration, Complexity, and Outcomes
of CERCLA Cases
Figure 17: Percentage of CERCLA Cases in Which Defendants Pursued Additional Parties by Type of Plaintiff, Fiscal Years 1994 through 2007
Percentage of cases
Source: GAO analysis of data on cases filed in U.S. district courts.
Type of plaintiff
0
2
4
6
8
10
12
14
16
18
Oth
er
pla
intif
f
S
tate
gov
ernm
ent
F
eder
al
gov
ernm
ent
Page 110 GAO-09-656 Superfund
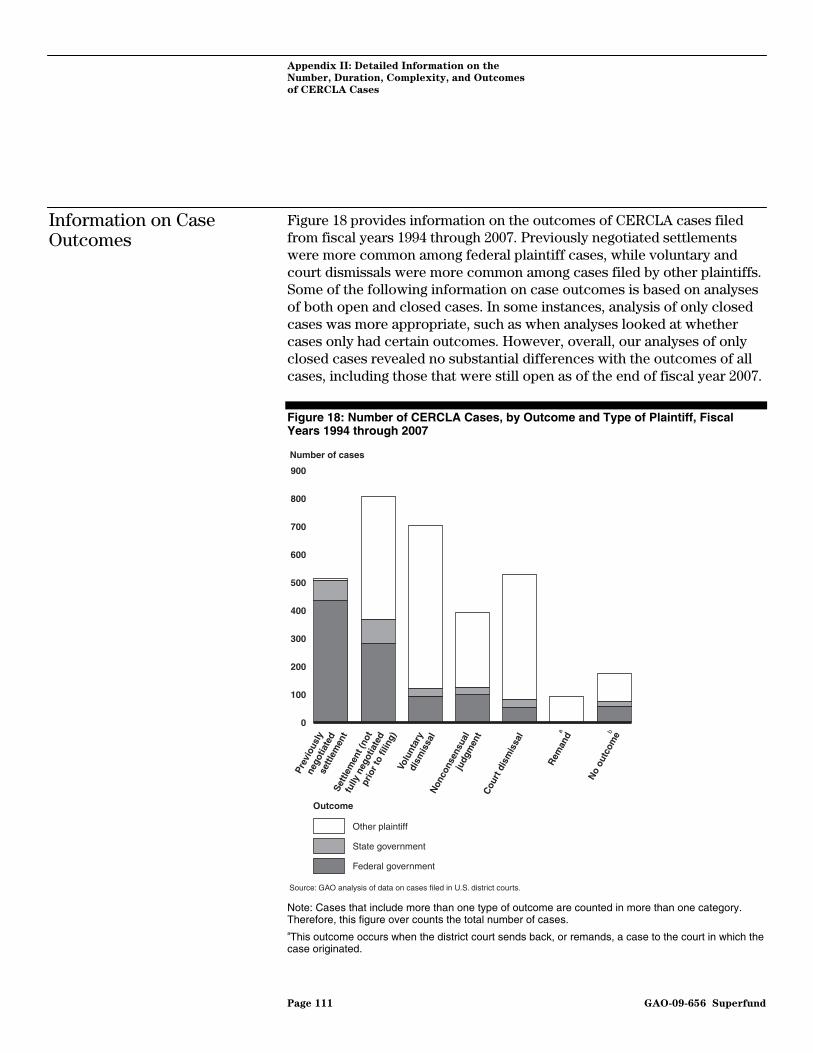
Appendix II: Detailed Information on the
Number, Duration, Complexity, and Outcomes
of CERCLA Cases
Information on Case Outcomes
Figure 18 provides information on the outcomes of CERCLA cases filed from fiscal years 1994 through 2007. Previously negotiated settlements were more common among federal plaintiff cases, while voluntary and court dismissals were more common among cases filed by other plaintiffs. Some of the following information on case outcomes is based on analyses of both open and closed cases. In some instances, analysis of only closed cases was more appropriate, such as when analyses looked at whether cases only had certain outcomes. However, overall, our analyses of only closed cases revealed no substantial differences with the outcomes of all cases, including those that were still open as of the end of fiscal year 2007.
Figure 18: Number of CERCLA Cases, by Outcome and Type of Plaintiff, Fiscal Years 1994 through 2007
Number of cases
Source: GAO analysis of data on cases filed in U.S. district courts.
0
100
200
300
400
500
600
700
800
900
No
outc
ome
Rem
and
Non
cons
ensu
al
jud
gmen
tC
ourt
dis
mis
sal
Volu
ntar
y
dism
issa
l
Settl
emen
t (no
t
fu
lly n
egot
iate
d
p
rior t
o fil
ing)
Prev
ious
ly
n
egot
iate
d
set
tlem
ent
Outcome
Other plaintiff
State government
Federal government
a b
Note: Cases that include more than one type of outcome are counted in more than one category. Therefore, this figure over counts the total number of cases. aThis outcome occurs when the district court sends back, or remands, a case to the court in which the case originated.
Page 111 GAO-09-656 Superfund
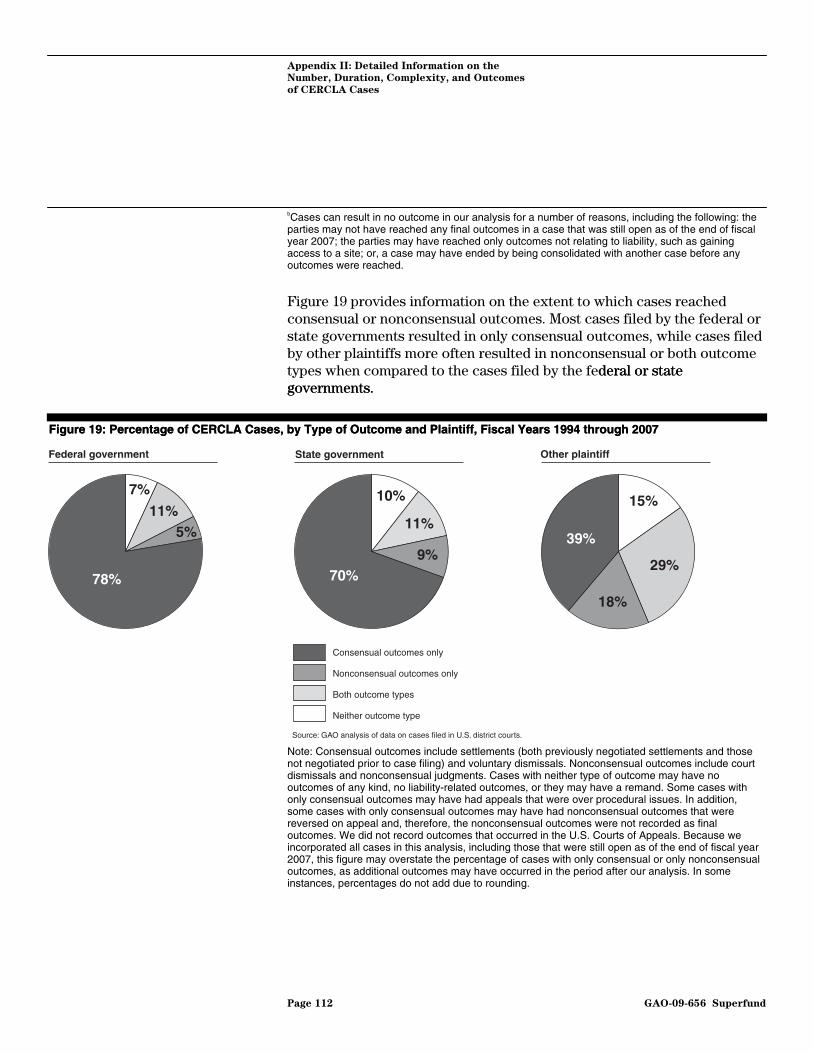
Appendix II: Detailed Information on the
Number, Duration, Complexity, and Outcomes
of CERCLA Cases
bCases can result in no outcome in our analysis for a number of reasons, including the following: the parties may not have reached any final outcomes in a case that was still open as of the end of fiscal year 2007; the parties may have reached only outcomes not relating to liability, such as gaining access to a site; or, a case may have ended by being consolidated with another case before any outcomes were reached.
Figure 19 provides information on the extent to which cases reached consensual or nonconsensual outcomes. Most cases filed by the federal or state governments resulted in only consensual outcomes, while cases filed by other plaintiffs more often resulted in nonconsensual or both outcome types when compared to the cases filed by the federal or state governments.
deral or state governments.
Figure 19: Percentage of CERCLA Cases, by Type of Outcome and Plaintiff, Fiscal Years 1994 through 2007 Figure 19: Percentage of CERCLA Cases, by Type of Outcome and Plaintiff, Fiscal Years 1994 through 2007
78%
5%11%
7%15%
18%
29%
39%
10%
70%
11%
9%
Federal government State government Other plaintiff
Source: GAO analysis of data on cases filed in U.S. district courts.
Consensual outcomes only
Nonconsensual outcomes only
Both outcome types
Neither outcome type
Note: Consensual outcomes include settlements (both previously negotiated settlements and those not negotiated prior to case filing) and voluntary dismissals. Nonconsensual outcomes include court dismissals and nonconsensual judgments. Cases with neither type of outcome may have no outcomes of any kind, no liability-related outcomes, or they may have a remand. Some cases with only consensual outcomes may have had appeals that were over procedural issues. In addition, some cases with only consensual outcomes may have had nonconsensual outcomes that were reversed on appeal and, therefore, the nonconsensual outcomes were not recorded as final outcomes. We did not record outcomes that occurred in the U.S. Courts of Appeals. Because we incorporated all cases in this analysis, including those that were still open as of the end of fiscal year 2007, this figure may overstate the percentage of cases with only consensual or only nonconsensual outcomes, as additional outcomes may have occurred in the period after our analysis. In some instances, percentages do not add due to rounding.
Page 112 GAO-09-656 Superfund
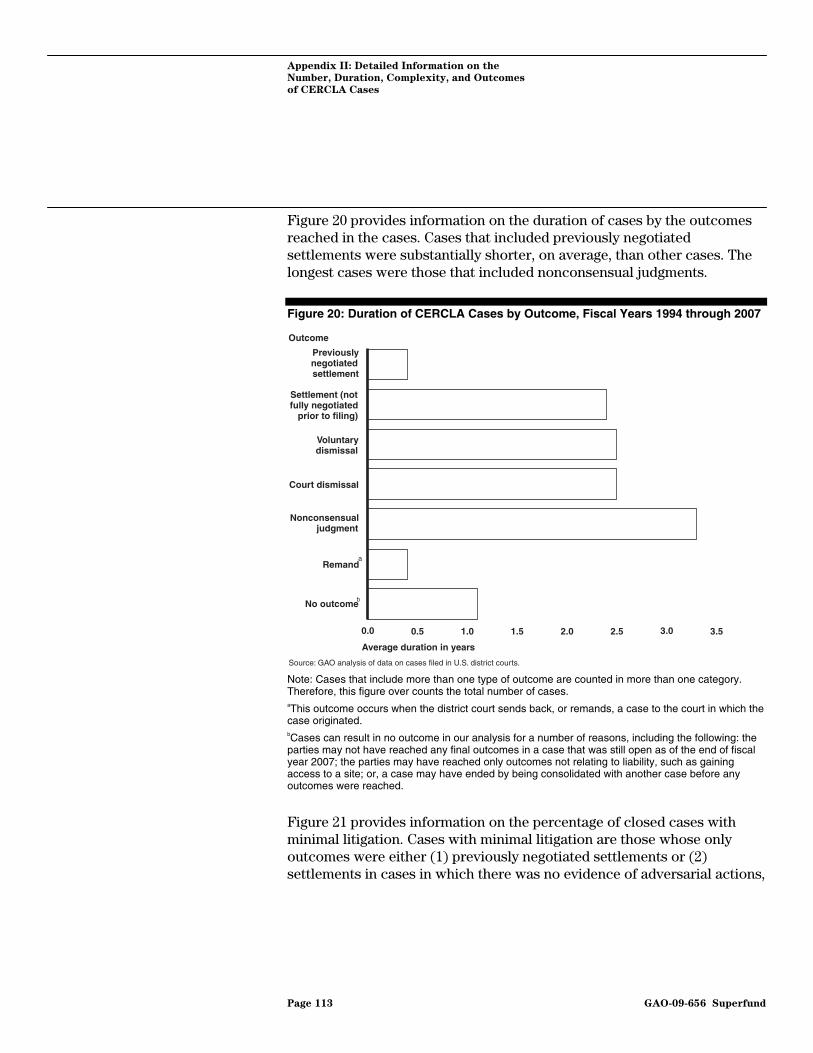
Appendix II: Detailed Information on the
Number, Duration, Complexity, and Outcomes
of CERCLA Cases
Figure 20 provides information on the duration of cases by the outcomes reached in the cases. Cases that included previously negotiated settlements were substantially shorter, on average, than other cases. The longest cases were those that included nonconsensual judgments.
Figure 20: Duration of CERCLA Cases by Outcome, Fiscal Years 1994 through 2007
0.0 0.5 1.0 1.5 2.0 2.5 3.0 3.5
No outcome
Remand
Nonconsensual judgment
Court dismissal
Voluntary dismissal
Settlement (not fully negotiated prior to filing)
Previously negotiated settlement
Average duration in years
Outcome
a
b
Source: GAO analysis of data on cases filed in U.S. district courts.
Note: Cases that include more than one type of outcome are counted in more than one category. Therefore, this figure over counts the total number of cases. aThis outcome occurs when the district court sends back, or remands, a case to the court in which the case originated. bCases can result in no outcome in our analysis for a number of reasons, including the following: the parties may not have reached any final outcomes in a case that was still open as of the end of fiscal year 2007; the parties may have reached only outcomes not relating to liability, such as gaining access to a site; or, a case may have ended by being consolidated with another case before any outcomes were reached.
Figure 21 provides information on the percentage of closed cases with minimal litigation. Cases with minimal litigation are those whose only outcomes were either (1) previously negotiated settlements or (2) settlements in cases in which there was no evidence of adversarial actions,
Page 113 GAO-09-656 Superfund
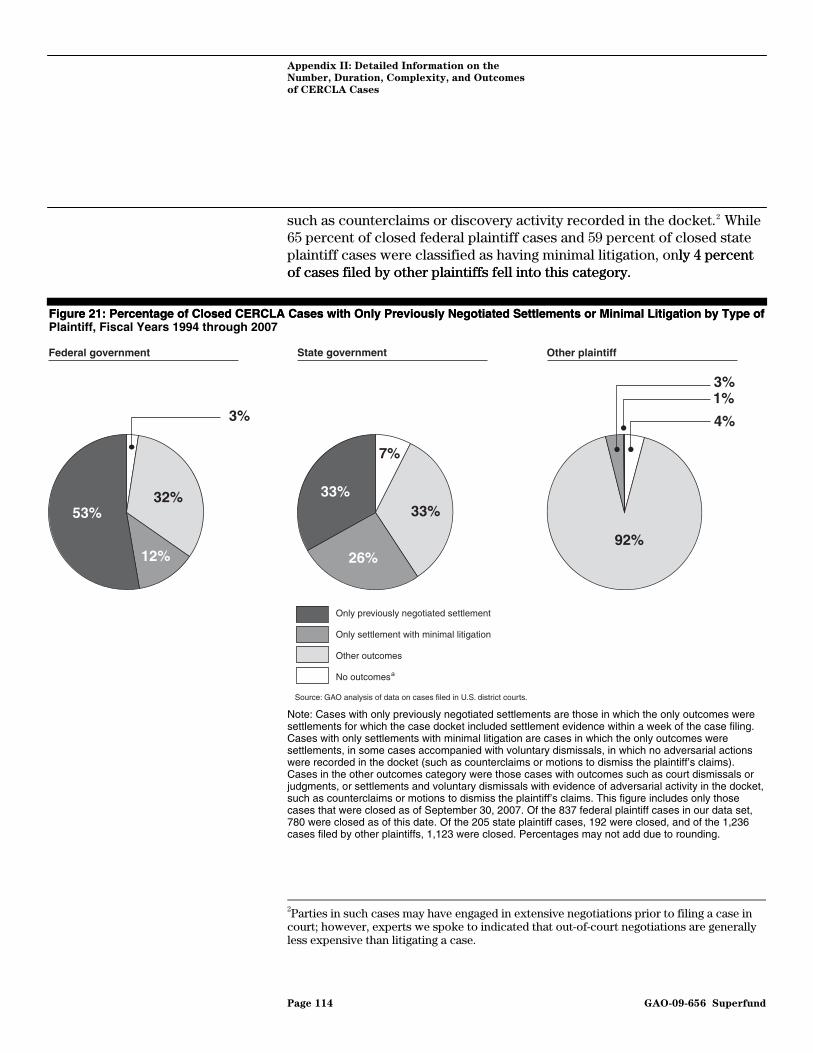
Appendix II: Detailed Information on the
Number, Duration, Complexity, and Outcomes
of CERCLA Cases
such as counterclaims or discovery activity recorded in the docket.2 While 65 percent of closed federal plaintiff cases and 59 percent of closed state plaintiff cases were classified as having minimal litigation, only 4 percent of cases filed by other plaintiffs fell into this category.
ly 4 percent of cases filed by other plaintiffs fell into this category.
Figure 21: Percentage of Closed CERCLA Cases with Only Previously Negotiated Settlements or Minimal Litigation by Type of Figure 21: Percentage of Closed CERCLA Cases with Only Previously Negotiated Settlements or Minimal Litigation by Type of Plaintiff, Fiscal Years 1994 through 2007
3%
53%32%
12%92%
3%1%
4%
33%
26%
7%
33%
Federal government State government Other plaintiff
Source: GAO analysis of data on cases filed in U.S. district courts.
Only previously negotiated settlement
Only settlement with minimal litigation
Other outcomes
No outcomesa
Note: Cases with only previously negotiated settlements are those in which the only outcomes were settlements for which the case docket included settlement evidence within a week of the case filing. Cases with only settlements with minimal litigation are cases in which the only outcomes were settlements, in some cases accompanied with voluntary dismissals, in which no adversarial actions were recorded in the docket (such as counterclaims or motions to dismiss the plaintiff’s claims). Cases in the other outcomes category were those cases with outcomes such as court dismissals or judgments, or settlements and voluntary dismissals with evidence of adversarial activity in the docket, such as counterclaims or motions to dismiss the plaintiff’s claims. This figure includes only those cases that were closed as of September 30, 2007. Of the 837 federal plaintiff cases in our data set, 780 were closed as of this date. Of the 205 state plaintiff cases, 192 were closed, and of the 1,236 cases filed by other plaintiffs, 1,123 were closed. Percentages may not add due to rounding.
2Parties in such cases may have engaged in extensive negotiations prior to filing a case in court; however, experts we spoke to indicated that out-of-court negotiations are generally less expensive than litigating a case.
Page 114 GAO-09-656 Superfund
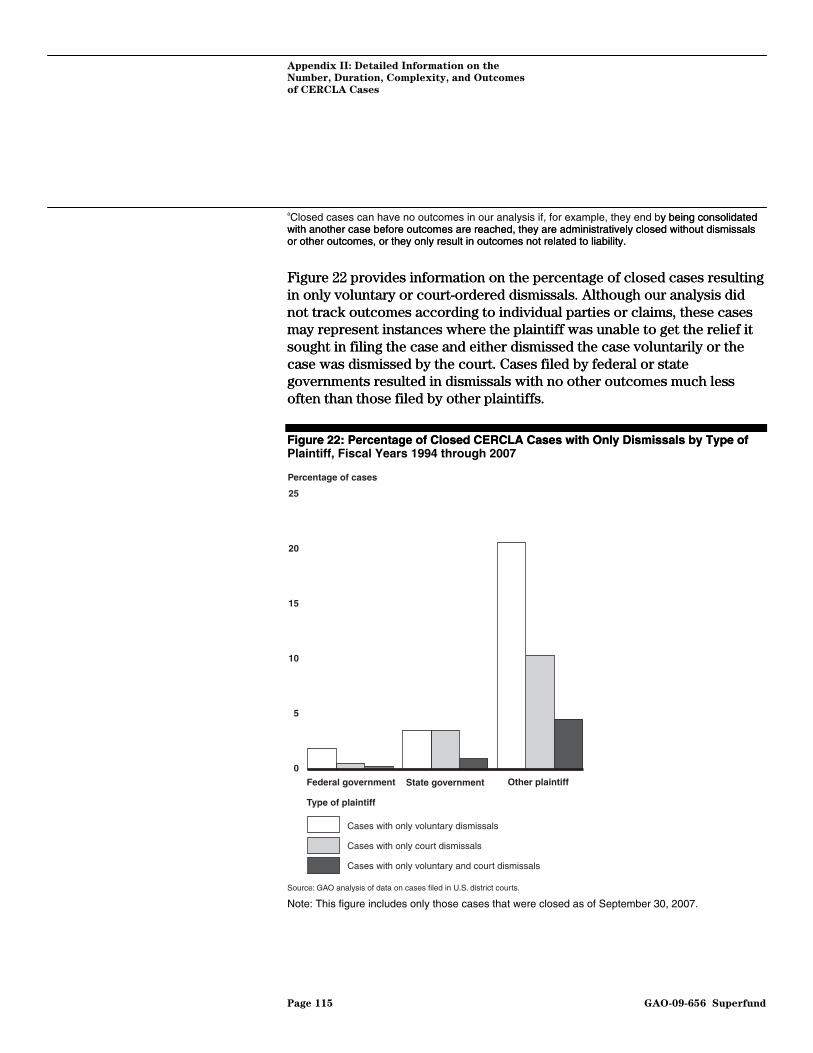
Appendix II: Detailed Information on the
Number, Duration, Complexity, and Outcomes
of CERCLA Cases
aClosed cases can have no outcomes in our analysis if, for example, they end by being consolidated with another case before outcomes are reached, they are administratively closed without dismissals or other outcomes, or they only result in outcomes not related to liability.
y being consolidated with another case before outcomes are reached, they are administratively closed without dismissals or other outcomes, or they only result in outcomes not related to liability.
Figure 22 provides information on the percentage of closed cases resulting in only voluntary or court-ordered dismissals. Although our analysis did not track outcomes according to individual parties or claims, these cases may represent instances where the plaintiff was unable to get the relief it sought in filing the case and either dismissed the case voluntarily or the case was dismissed by the court. Cases filed by federal or state governments resulted in dismissals with no other outcomes much less often than those filed by other plaintiffs.
Figure 22 provides information on the percentage of closed cases resulting in only voluntary or court-ordered dismissals. Although our analysis did not track outcomes according to individual parties or claims, these cases may represent instances where the plaintiff was unable to get the relief it sought in filing the case and either dismissed the case voluntarily or the case was dismissed by the court. Cases filed by federal or state governments resulted in dismissals with no other outcomes much less often than those filed by other plaintiffs.
Figure 22: Percentage of Closed CERCLA Cases with Only Dismissals by Type of Figure 22: Percentage of Closed CERCLA Cases with Only Dismissals by Type of Plaintiff, Fiscal Years 1994 through 2007
Percentage of cases
Source: GAO analysis of data on cases filed in U.S. district courts.
Cases with only voluntary dismissals
Cases with only court dismissals
Cases with only voluntary and court dismissals
Federal government State government Other plaintiff
0
5
10
15
20
25
Type of plaintiff
Note: This figure includes only those cases that were closed as of September 30, 2007.
Page 115 GAO-09-656 Superfund
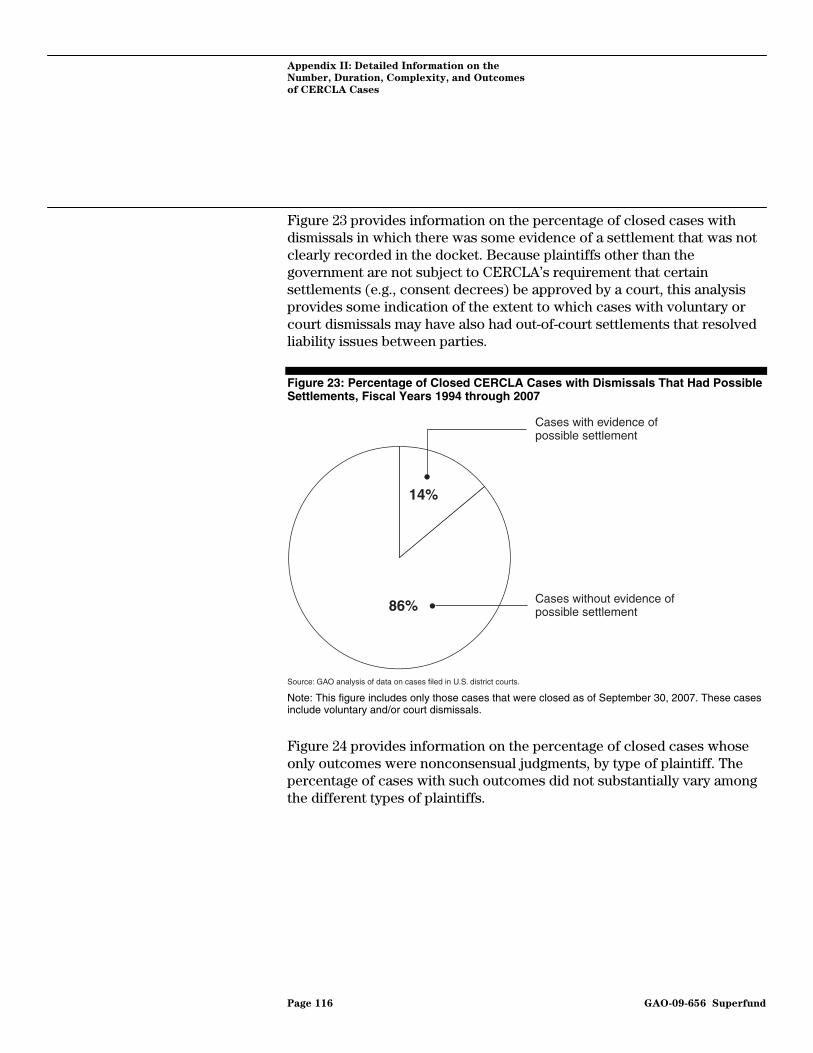
Appendix II: Detailed Information on the
Number, Duration, Complexity, and Outcomes
of CERCLA Cases
Figure 23 provides information on the percentage of closed cases with dismissals in which there was some evidence of a settlement that was not clearly recorded in the docket. Because plaintiffs other than the government are not subject to CERCLA’s requirement that certain settlements (e.g., consent decrees) be approved by a court, this analysis provides some indication of the extent to which cases with voluntary or court dismissals may have also had out-of-court settlements that resolved liability issues between parties.
Figure 23: Percentage of Closed CERCLA Cases with Dismissals That Had Possible Settlements, Fiscal Years 1994 through 2007
14%
86%
Source: GAO analysis of data on cases filed in U.S. district courts.
Cases with evidence of possible settlement
Cases without evidence of possible settlement
Note: This figure includes only those cases that were closed as of September 30, 2007. These cases include voluntary and/or court dismissals.
Figure 24 provides information on the percentage of closed cases whose only outcomes were nonconsensual judgments, by type of plaintiff. The percentage of cases with such outcomes did not substantially vary among the different types of plaintiffs.
Page 116 GAO-09-656 Superfund
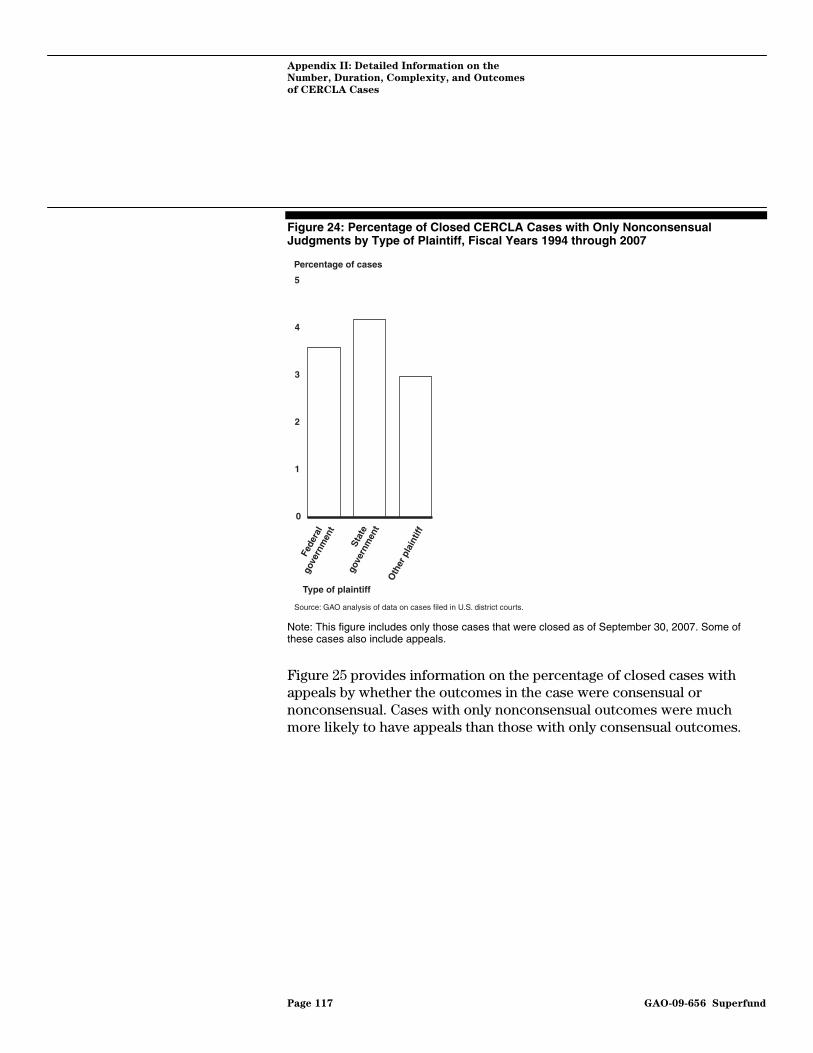
Appendix II: Detailed Information on the
Number, Duration, Complexity, and Outcomes
of CERCLA Cases
Figure 24: Percentage of Closed CERCLA Cases with Only Nonconsensual Judgments by Type of Plaintiff, Fiscal Years 1994 through 2007
Percentage of cases
Source: GAO analysis of data on cases filed in U.S. district courts.
0
1
2
3
4
5
Oth
er p
lain
tiff
Sta
te
g
over
nmen
t
Fed
eral
g
over
nmen
t
Type of plaintiff
Note: This figure includes only those cases that were closed as of September 30, 2007. Some of these cases also include appeals.
Figure 25 provides information on the percentage of closed cases with appeals by whether the outcomes in the case were consensual or nonconsensual. Cases with only nonconsensual outcomes were much more likely to have appeals than those with only consensual outcomes.
Page 117 GAO-09-656 Superfund

Appendix II: Detailed Information on the
Number, Duration, Complexity, and Outcomes
of CERCLA Cases
Figure 25: Percentage of Closed CERCLA Cases with Appeals by Type of Outcome, Fiscal Years 1994 through 2007
Percentage of cases
Source: GAO analysis of data on cases filed in U.S. district courts.
0
5
10
15
20
25
Cas
es w
ith o
nly
c
onse
nsua
l
outc
omes
outc
omes
C
ases
with
onl
y
nonc
onse
nsua
l
Note: This figure includes only those cases that were closed as of September 30, 2007. Appeals may occur on grounds related to liability outcomes or because of procedural issues. In addition, some cases with only consensual outcomes may have had nonconsensual outcomes that were reversed on appeal and, therefore, the nonconsensual outcomes were not recorded as final outcomes. We did not record outcomes that occurred in the U.S. Courts of Appeals.
Page 118 GAO-09-656 Superfund
Appendix III: Comments from the
Environmental Protection Agency
Appendix III: Comments from the Environmental Protection Agency
Page 119 GAO-09-656 Superfund

Appendix III: Comments from the
Environmental Protection Agency
Page 120 GAO-09-656 Superfund

Appendix III: Comments from the
Environmental Protection Agency
Page 121 GAO-09-656 Superfund
Appendix IV:
A
GAO Contact and Staff
cknowledgments
Page 122 GAO-09-656
Appendix IV: GAO Contact and Staff Acknowledgments
John B. Stephenson, (202) 512-3841 or [email protected]
In addition to the individual named above, Vincent P. Price, Assistant Director; Tim Bazzle; Miles Ingram; Krista Loose; Christopher Murray; Ira Nichols-Barrer; and Kathleen Padulchick made key contributions to this report. Elizabeth Beardsley, Michele Fejfar, Richard Johnson, and Carol Herrnstadt Shulman also made important contributions.
Superfund
GAO Contact
Staff Acknowledgments
(360933)
GAO’s Mission The Government Accountability Office, the audit, evaluation, and investigative arm of Congress, exists to support Congress in meeting its constitutional responsibilities and to help improve the performance and accountability of the federal government for the American people. GAO examines the use of public funds; evaluates federal programs and policies; and provides analyses, recommendations, and other assistance to help Congress make informed oversight, policy, and funding decisions. GAO’s commitment to good government is reflected in its core values of accountability, integrity, and reliability.
The fastest and easiest way to obtain copies of GAO documents at no cost is through GAO’s Web site (www.gao.gov). Each weekday afternoon, GAO posts on its Web site newly released reports, testimony, and correspondence. To have GAO e-mail you a list of newly posted products, go to www.gao.gov and select “E-mail Updates.”
Obtaining Copies of GAO Reports and Testimony
Order by Phone The price of each GAO publication reflects GAO’s actual cost of production and distribution and depends on the number of pages in the publication and whether the publication is printed in color or black and white. Pricing and ordering information is posted on GAO’s Web site, http://www.gao.gov/ordering.htm.
Place orders by calling (202) 512-6000, toll free (866) 801-7077, or TDD (202) 512-2537.
Orders may be paid for using American Express, Discover Card, MasterCard, Visa, check, or money order. Call for additional information.
Contact:
Web site: www.gao.gov/fraudnet/fraudnet.htm E-mail: [email protected] Automated answering system: (800) 424-5454 or (202) 512-7470
Ralph Dawn, Managing Director, [email protected], (202) 512-4400 U.S. Government Accountability Office, 441 G Street NW, Room 7125 Washington, DC 20548
To Report Fraud, Waste, and Abuse in Federal Programs
Congressional Relations
Chuck Young, Managing Director, [email protected], (202) 512-4800 U.S. Government Accountability Office, 441 G Street NW, Room 7149 Washington, DC 20548
Public Affairs
Please Print on Recycled Paper