GAO-06-630 Airline Deregulation: Reregulating the Airline Industry
United States Government Accountability Office
GAO Report to the Subcommittee on Aviation Operations, Safety, and Security, Committee on Commerce, Science, and Transportation, U.S. Senate
AIRLINE INDUSTRY
Potential Mergers and Acquisitions Driven by Financial and Competitive Pressures
July 2008
GAO-08-845
What GAO FoundWhy GAO Did This Study
HighlightsAccountability Integrity Reliability
July 2008
AIRLINE INDUSTRY
Potential Mergers and Acquisitions Driven by Financial and Competitive Pressures
Highlights of GAO-08-845, a report to the Subcommittee on Aviation Operations, Safety, and Security, Committee on Commerce, Science, and Transportation, U.S. Senate
The airline industry is vital to the U.S. economy, generating operating revenues of nearly $172 billion in 2007, amounting to over 1 percent of the U.S. gross domestic product. It serves as an important engine for economic growth and a critical link in the nation’s transportation infrastructure, carrying more than 700 million passengers in 2007. Airline deregulation in 1978, led, at least in part, to increasingly volatile airline profitability, resulting in periods of significant losses and bankruptcies. In response, some airlines have proposed or are considering merging with or acquiring another airline. GAO was asked to help prepare Congress for possible airline mergers or acquisitions. This report describes (1) the financial condition of the U.S. passenger airline industry, (2) whether the industry is becoming more or less competitive, (3) why airlines seek to merge with or acquire other airlines, and (4) the role of federal authorities in reviewing proposed airline mergers and acquisitions. To answer these objectives, we analyzed Department of Transportation (DOT) financial and operating data; interviewed agency officials, airline managers, and industry experts; and reviewed Horizontal Merger Guidelines and spoke with antitrust experts.
DOT and the Department of Justice (DOJ) provided technical comments, which were incorporated as appropriate.
Tsctmtpbcs C2pfsla6a Atbbarsoaro BDltDtaccaiiM
e
To view the full product, including the scope and methodology, click on GAO-08-845For more information, contact JayEtta Hecker at (202) 512-2834 or [email protected].
he U.S. passenger airline industry was profitable in 2006 and 2007 for the first time ince 2000, but this recovery appears short-lived because of rapidly increasing fuel osts. Legacy airlines (airlines that predate deregulation in 1978) generally returned o modest profitability in 2006 and 2007 by reducing domestic capacity, focusing on
ore profitable markets, and reducing long-term debt. Low-cost airlines (airlines hat entered after deregulation), meanwhile, continued to be profitable. Airlines, articularly legacy airlines, were also able to reduce costs, especially through ankruptcy- and near-bankruptcy-related employee contract, pay, and pension plan hanges. Recent industry forecasts indicate that the industry is likely to incur ubstantial losses in 2008 owing to high fuel prices.
ompetition within the U.S. domestic airline industry increased from 1998 through 006, as reflected by an increase in the number of competitors in city-to-city (city-air) markets, the presence of low-cost airlines in more of those markets, lower air ares, fewer dominated markets, and a shrinking dominance by a single airline at ome of the nation’s largest airports. The average number of competitors in the argest 5,000 city-pair markets rose to 3.3 in 2006 from 2.9 in 1998. This growth is ttributable to the increased presence of low-cost airlines, which increased nearly 0 percent. In addition, the number of largest 5,000 markets dominated by a single irline declined by 15 percent.
irlines seek to merge with or acquire other airlines with the intention of increasing heir profitability and financial sustainability, but must weigh these potential enefits against operational and regulatory costs and challenges. The principal enefits airlines consider are cost reductions—by combining complementary ssets, eliminating duplicate activities, and reducing capacity—and increased evenues from higher fares in existing markets and increased demand for more eamless travel to more destinations. Balanced against these potential benefits are perational costs of integrating workforces, aircraft fleets, and systems. In ddition, because most airline mergers and acquisitions are reviewed by DOJ, the elevant antitrust enforcement agency, airlines must consider the risks of DOJ pposition.
oth DOJ and DOT play a role in reviewing airline mergers and acquisitions, but OJ’s determination as to whether a proposed merger is likely substantially to
essen competition is key. DOJ uses an integrated analytical framework set forth in he Horizontal Merger Guidelines to make its determination. Under that process, OJ assesses the extent of likely anticompetitive effects in the relevant markets, in
his case, airline city-pair markets. DOJ further considers the likelihood that irlines entering these markets would counteract any anticompetitive effects. It also onsiders any efficiencies that a merger or acquisition could bring—for example, onsumer benefits from an expanded route network. Our analysis of changes in the irline industry, such as increased competition and the growth of low-cost airlines, ndicates that airline entry may be more likely now than in the past provided recent ncreases in fuel costs do not reverse these conditions. Additionally, the Horizontal
erger Guidelines have evolved to provide clarity as to the consideration of fficiencies, an important factor in airline mergers.
United States Government Accountability Office
Contents
Letter 1
Results in Brief 3 Background 6 U.S. Airlines’ Financial Condition Has Improved, but It Appears to
Be Short-lived 11 Domestic Airline Competition Increased from 1998 through 2006,
as Low-Cost Airlines Expanded 20 Airlines Seek to Combine to Increase Profits and Improve
Financial Viability, but Challenges Exist 28 The Department of Justice’s Antitrust Review Is a Critical Step in
the Airline Merger and Acquisition Process 33 Agency Comments 41
Appendix I Scope and Methodology 42
Appendix II Delta and Northwest Merger 45
Appendix III Number and Size of Dominated Markets by Airline
in the Top 5,000 Markets, 2006 49
Appendix IV GAO Contact and Staff Acknowledgments 50
Related GAO Products 51
Tables
Table 1: Top Five Markets Where Competition Could Be Reduced from Two Airlines to One Airline, 2006 47
Table 2: Top Five Markets Where Competition Could Be Reduced from Three Airlines to Two Airlines, 2006 48
Table 3: Small Communities (Nonhub Airports) Where Delta and Northwest Have Service and Where Competition Could Be Reduced as of Third Quarter 2007 48
Page i GAO-08-845 Airline Industry

Figures
Figure 1: Highlights of Domestic Airline Mergers and Acquisitions 8 Figure 2: Growth of Industry Capacity and Major Airline Mergers
and Acquisitions, 1979-2006 11 Figure 3: Operating Profit or Loss for Legacy and Low-Cost
Airlines, 1998-2007 12 Figure 4: Revenue Passenger Miles among Legacy and Low-Cost
Airlines, 1998-2007 13 Figure 5: Domestic Available Seat Miles among Legacy and Low-
Cost Airlines, 1998-2007 14 Figure 6: Unit Costs, Excluding Fuel, for Legacy and Low-Cost
Airlines, 1998-2007 16 Figure 7: Price of U.S. Jet Fuel, 2000—First Quarter 2008 19 Figure 8: Markets by Number of Competitors, 1998-2006 21 Figure 9: Average Number of Competitors by Distance (in miles),
Top 5,000 Markets, 1998-2006 22 Figure 10: Industry Share by Legacy and Low-Cost Airlines, 1998
and 2006 24 Figure 11: Average Fares by Distance, 1998-2006 25 Figure 12: The Number of Dominated and Nondominated Markets,
Top 5,000 Markets, 1998-2006 26 Figure 13: Change in Passenger Share at Selected Dominated
Airports by Dominant Airline, 1998 and 2006 28 Figure 14: Delta Air Lines and Northwest Airlines Domestic (lower
48) Route Map, February 2008 based on Official Airline Guide (OAG) Schedule Data 45
Figure 15: Delta Air Lines and Northwest Airlines International Route Map, February 2008 based on OAG Schedule Data 46
Figure 16: Number of Nonstop and One-Stop Markets Where Delta and Northwest Compete, Top 5,000 Markets, 2006 47
Page ii GAO-08-845 Airline Industry

Abbreviations
ASM available seat mile BTC Business Travel Coalition CASM cost per available seat mile DOJ Department of Justice DOT Department of Transportation FAA Federal Aviation Administration GDP gross domestic product LCC low-cost carrier PBGC Pension Benefit Guaranty Corporation RPM revenue per mile
This is a work of the U.S. government and is not subject to copyright protection in the United States. The published product may be reproduced and distributed in its entirety without further permission from GAO. However, because this work may contain copyrighted images or other material, permission from the copyright holder may be necessary if you wish to reproduce this material separately.
Page iii GAO-08-845 Airline Industry
United States Government Accountability Office
Washington, DC 20548
July 31, 2008
The Honorable John D. Rockefeller, IV Chairman The Honorable Kay Bailey Hutchison Ranking Member Subcommittee on Aviation Operations, Safety, and Security Committee on Commerce, Science, and Transportation United States Senate
The passenger airline industry is vital to the U.S. economy, with operating revenues of nearly $172 billion in 2007, equivalent to over 1 percent of the U.S. gross domestic product. It also serves as an important engine for economic growth and a critical link in the nation’s transportation infrastructure, carrying over 700 million passengers in 2007. The U.S. airline industry was deregulated in 1978, allowing market forces, rather than the federal government, to establish fares and service. Since 1978, the industry has experienced cyclical financial performance and numerous bankruptcies, mergers, and acquisitions, as the industry adjusted to an unregulated environment and changing market conditions.1 In recent years, the financial condition of legacy, or network, airlines—the largest segment of the passenger airline industry—deteriorated significantly even by historical standards.2 From 2001 to 2005, legacy airlines lost more than $33 billion, while four of them entered and exited bankruptcy. More recently, in 2006 and 2007 the airline industry returned to modest profitability only to confront rapidly increasing fuel costs and the expectation of renewed losses in 2008. These challenges and structural changes have spurred some airlines to explore mergers and acquisitions as a potential way to improve their competitive positions and financial
1Mergers generally refer to the combination of two companies into one company by mutual consent, while acquisitions (also called takeovers) refer to one company’s purchase of assets or equity in another company on friendly or hostile terms.
2The seven legacy airlines (Alaska Airlines, American Airlines, Continental Airlines, Delta Air Lines, Northwest Airlines, United Airlines, and US Airways) all predated industry deregulation in 1978, while the seven low-cost airlines (AirTran Airways, America West Airlines, ATA, Frontier Airlines, JetBlue Airways, Southwest Airlines, and Spirit Airlines) entered interstate service after 1978. In 2005, America West and US Airways merged under the name US Airways.
Page 1 GAO-08-845 Airline Industry

viability—for example, Delta Air Lines and Northwest Airlines announced plans to merge on April 14, 2008.3 Mergers and acquisitions, however, could also have anticompetitive effects, such as reduced competition and increased fares in some markets. Generally, before any airline merger or acquisition can be consummated, the Department of Justice (DOJ) carries out its antitrust enforcement responsibilities by evaluating whether the proposed merger is likely to substantially lessen competition and may challenge in court those that appear to be anticompetitive.
US Airways’ attempt to acquire Delta Air Lines in 2006, the merger announcement between Delta Air Lines and Northwest Airlines earlier this year, and the continued focus on potential airline mergers and acquisitions prompted interest in a broad assessment of the state of the industry, the factors that are driving continued interest in mergers and acquisitions, and the process the federal government uses to assess them. In order to assist Congress in understanding possible future airline mergers and acquisitions, GAO was asked to describe (1) the financial condition of the U.S. passenger airline industry, (2) whether the industry is becoming more or less competitive, (3) why airlines seek to merge with or acquire other airlines, and (4) the role of federal authorities in considering airline mergers and acquisitions.
To address these objectives, we conducted analysis using Department of Transportation (DOT) financial and operating data, reviewed historical documents and past studies, and conducted interviews. Specifically, to evaluate the financial condition of the domestic airline industry, we analyzed airline financial metrics; reviewed financial studies; and conducted interviews with airline managers, trade associations, financial analysts, and other industry experts. Our financial analysis relied on airline financial data reported to DOT by airlines from 1998 through 2007, as these were the most recent and complete annual data available. To evaluate changes in airline industry competition, we analyzed data from DOT’s Origin and Destination Survey, which includes fare and itinerary information on every 10th airline ticket sold; reviewed studies assessing competition; and interviewed current and former DOT officials and aviation industry experts. Our analysis of DOT data focused on passenger ticket data for the largest 5,000 domestic airline markets from 1998 through 2006.4 We excluded tickets with international, Hawaiian, or
3See appendix II for information on the Delta Air Lines and Northwest Airlines merger.
4These were the most recent data available at the time of our review.
Page 2 GAO-08-845 Airline Industry
Alaskan destinations or origins so that we could examine changes within contiguous domestic markets. To assess the reliability of all DOT data used by GAO, we reviewed the quality control procedures applied by DOT and subsequently determined that the data were sufficiently reliable for our purposes. To identify and evaluate the primary factors that airlines consider in deciding whether to merge with or acquire another airline, we reviewed studies and reports; assessed past airline mergers and acquisitions; and conducted interviews with DOT and DOJ officials, airline managers, financial analysts, academic researchers, and industry experts. In addition, to understand the government’s role in evaluating a proposed merger or acquisition, we discussed the merger review processes with DOJ officials and antitrust experts and reviewed available documentation addressing past mergers and acquisitions. We conducted this performance audit from May 2007 through July 2008 in accordance with generally accepted government auditing standards. Those standards require that we plan and perform the audit to obtain sufficient, appropriate evidence to provide a reasonable basis for our findings and conclusions based on our audit objectives. We believe that the evidence obtained provides a reasonable basis for our findings and conclusions based on our audit objectives.
The U.S. passenger airline industry was profitable in 2006 and 2007 for the first time since 2000, but high fuel prices will likely result in industry losses in 2008. Legacy airlines, which currently account for two-thirds of industry market share, realized collective operating profits of $1.8 billion in 2007, as compared to collective operating losses of nearly $33 billion from 2001 through 2005 which forced four legacy airlines into bankruptcy.5 Legacy airlines generally improved their financial positions and returned to modest operating profitability in recent years by reducing operating costs and domestic capacity, while focusing on more profitable international markets. Low-cost airlines, meanwhile, have continued to maintain modest profitability since 1998. From 2003 through 2007, the airline industry experienced a relatively steady increase in passenger traffic—as measured by revenue passenger miles—growing 14 percent. At the same time, and unlike in past recoveries, industry capacity—as
Results in Brief
5Seven legacy airlines accounted for these losses from 2001 to 2005. The four airlines filing for bankruptcy were Delta Air Lines, Northwest Airlines, United Airlines, and US Airways. In general, the legacy airlines were unprofitable at this time as a result of reduced demand following the September 11, 2001, terrorist attacks (and other external shocks), increased competition from low-cost airlines, and high cost structures.
Page 3 GAO-08-845 Airline Industry

measured by available seat miles—increased 9 percent. Legacy airlines were also able to reduce costs, especially through bankruptcy, which triggered contract and pay concessions from labor unions and the termination and transfer of employee pension plans. Although the industry saw profits in 2007, according to first quarter 2008 financial results and updated industry forecasts for the rest of the year, the industry is expected to incur substantial losses in 2008. Rapidly increasing fuel prices are forcing airlines to cut capacity.
From 1998 through 2006, the U.S. domestic airline industry became more competitive, as reflected by an increase in the number of competitors serving city-pair markets6 (e.g., New York–Los Angeles), the presence of low-cost airlines in more of those markets, lower average fares, fewer dominated markets, and a shrinking dominance by a single airline at some of the nation’s largest airports. The largest 5,000 city-pair markets—which account for more than 90 percent of passenger traffic—were serviced by more competitors on average in 2006 than in 1998.7 Overall, average fares have declined 20 percent in real terms since 1998, and the average number of competitors in the top 5,000 markets rose from 2.9 in 1998 to 3.3 in 2006.8 During the same period, there was tremendous growth of low-cost airlines. The number of top 5,000 markets serviced by at least one low-cost airline increased nearly 60 percent, from approximately 1,300 markets in 1998 to over 2,000 markets in 2006. Further evidence of increased competition can be seen in the reduced number of dominated markets—where a single airline carries 50 percent or more of passengers—in the top 5,000 markets. The number of markets dominated decreased from about 3,500 in 1998 to about 3,000 in 2006. In addition, although legacy airlines continued to dominate many of the largest airports, carrying at least 50 percent of airport passenger traffic,9 most saw a decrease in their share of total passenger traffic as more competitors—mainly low-cost airlines—moved in or expanded. In 2006, of the 30 largest airports, 16 were
6Air service markets are usually defined in terms of scheduled service between a point of origin and a point of destination. We refer to these markets as city-pair markets. The markets in our report include airlines providing both nonstop and connecting service.
7We defined an effective competitor as an airline with at least 5 percent of passengers within a city-pair market.
8Fares were inflation adjusted in 2006 dollars.
9Passenger traffic is measured by enplanements.
Page 4 GAO-08-845 Airline Industry
dominated by a single airline, but at 8 of those airports, the dominant airline had lost some passenger traffic since 1998.
Airlines consider mergers and acquisitions as a means to increase their profitability and financial viability, but must consider the operational and regulatory challenges to consummating a combination. Intended financial benefits stem from both cost reductions and increased revenues. Cost reductions may result from the elimination of duplicative operations—such as those at hubs or maintenance facilities—or by eliminating redundant city-pair service. On the revenue side, a merger or acquisition could generate additional revenues through increased fares on some routes as a result of capacity reductions or increased market share, although those fare increases may be transitory because other airlines could enter the affected markets and drive prices back down. Mergers or acquisitions could also attract more customers, and thus more revenue, by expanding airline networks to gain new city-pair combinations (domestically and internationally). Each merger or acquisition is different from others in terms of the extent to which cost reductions and revenue increases are factors. Balanced against these potential benefits are certain operational and regulatory challenges posed by mergers and acquisitions, which can be significant. For example, the integration of workforces is often particularly challenging and costly. New contracts must be negotiated, pilot seniority lists must be combined, and concessions may be required to gain labor support for mergers. Other significant operational challenges often involve the integration of aircraft fleets and information technology systems and processes. Demonstrating to DOJ, the relevant antitrust enforcement authority, that a merger or acquisition is not likely to be anticompetitive may also pose a significant challenge.
Both DOJ and DOT play a role in reviewing potential mergers and acquisitions, but DOJ’s determination of whether a merger or acquisition is likely substantially to lessen competition is key. If DOJ believes the transaction is anticompetitive and would harm consumers, it may petition a court to prohibit the transaction. For airlines, and many other industries, DOJ uses an analytical framework set forth in the Horizontal Merger
Guidelines (the Guidelines) to evaluate merger proposals.10 As part of that framework, DOJ uses an integrated five-part process that assesses (1) the
10The Guidelines were jointly developed by DOJ’s Antitrust Division and the Federal Trade Commission (FTC) and describe the inquiry process agencies follow in analyzing proposed mergers. The most current version of the Guidelines was issued in 1992; Section 4, relating to efficiencies, was revised in 1997.
Page 5 GAO-08-845 Airline Industry

relevant market (city-pairs in the case of airlines); (2) the potential anticompetitive effects resulting from a merger or acquisition; (3) the likelihood and impact of other airlines possibly entering a market and counteracting any anticompetitive effects; (4) “efficiencies” (benefits) that a merger would bring—for example, consumer benefits from an expanded route network—and (5) whether one of the airlines proposing to merge would fail and its assets exit the market in the absence of a merger or acquisition. These considerations allow DOJ to determine whether it should challenge the merger because it would raise antitrust concerns. DOT also plays a role in the merger review process, providing competition data to DOJ, and if DOJ does not challenge the merger or acquisition, DOT may review the financial and safety standing of the new combined airline. Our analysis of changes in the airline industry, prior to the recent spike in fuel prices, indicates that the likelihood of airline entry increased. Additionally, the Guidelines have evolved to provide clarity as to the consideration of efficiencies, an important factor in airline mergers.
We provided a draft of this report to DOT and DOJ for their review and comment. Both DOT and DOJ officials provided some clarifying and technical comments that we incorporated where appropriate.
The U.S. airline industry is principally composed of legacy, low-cost, and regional airlines, and while it is largely free of economic regulation, it remains regulated in other respects, most notably safety, security, and operating standards. Legacy airlines—sometimes called network airlines—are essentially those airlines that were in operation before the Airline Deregulation Act of 1978 and whose goal is to provide service from “anywhere to everywhere.”11 To meet that goal, these airlines support large, complex hub-and-spoke operations with thousands of employees and hundreds of aircraft (of various types), with service at numerous fare levels to domestic communities of all sizes and to international destinations. To enhance revenues without expending capital, legacy airlines have entered into domestic (and international) alliances that give them access to some portion of each others’ networks. Low-cost airlines generally entered the marketplace after deregulation and primarily operate less costly point-to-point service using fewer types of aircraft. Low-cost airlines typically offer simplified fare structures, which were originally aimed at leisure passengers but are increasingly attractive to business
Background
11Pub. L. No. 95-504, Oct. 24, 1978.
Page 6 GAO-08-845 Airline Industry
passengers because they typically do not have restrictive ticketing rules, which make it significantly more expensive to purchase tickets within 2 weeks of the flight or make changes to an existing itinerary. Regional airlines generally operate smaller aircraft—turboprops or regional jets with up to 100 seats—and provide service under code-sharing arrangements with larger legacy airlines on a cost-plus or fee-for-departure basis to smaller communities. Some regional airlines are owned by a legacy parent, while others are independent. For example, American Eagle is the regional partner for American Airlines, while independent Sky West Airlines operates on a fee-per-departure agreement with Delta Air Lines, United Airlines, and Midwest Airlines.12
The airline industry has experienced considerable merger and acquisition activity since its early years, especially immediately following deregulation in 1978 (fig. 1 provides a timeline of mergers and acquisitions for the eight largest surviving airlines). There was a flurry of mergers and acquisitions during the 1980s, when Delta Air Lines and Western Airlines merged, United Airlines acquired Pan Am’s Pacific routes, Northwest acquired Republic Airlines, and American and Air California merged. In 1988, merger and acquisition review authority was transferred from DOT to DOJ. Since 1998, and despite tumultuous financial periods, fewer mergers and acquisitions have occurred. In 2001, American Airlines acquired the bankrupt airline TWA, and in 2005 America West acquired US Airways while the latter was in bankruptcy. Certain other attempts at merging during that time period failed because of opposition from DOJ or employees and creditors. For example, in 2000, an agreement was reached that allowed Northwest Airlines to acquire a 50 percent stake in Continental Airlines (with limited voting power) to resolve the antitrust suit brought by DOJ against Northwest’s proposed acquisition of a controlling interest in Continental.13 A proposed merger of United Airlines and US Airways in 2000 also resulted in opposition from DOJ, which found that, in its view, the merger would violate antitrust laws by reducing competition, increasing air fares, and harming consumers on airline routes throughout the United States. Although DOJ expressed its intent to sue to block the transaction, the parties abandoned the transaction before a suit was filed. More recently, the 2006 proposed merger of US Airways and
12Both American Eagle and American Airlines are subsidiaries of AMR Corporation.
13GAO, Aviation Competition: Issues Related to the Proposed United Airlines-US Airways
Merger, GAO-01-212 (Washington, D.C.: Dec. 15, 2000) p. 10, footnote 6.
Page 7 GAO-08-845 Airline Industry
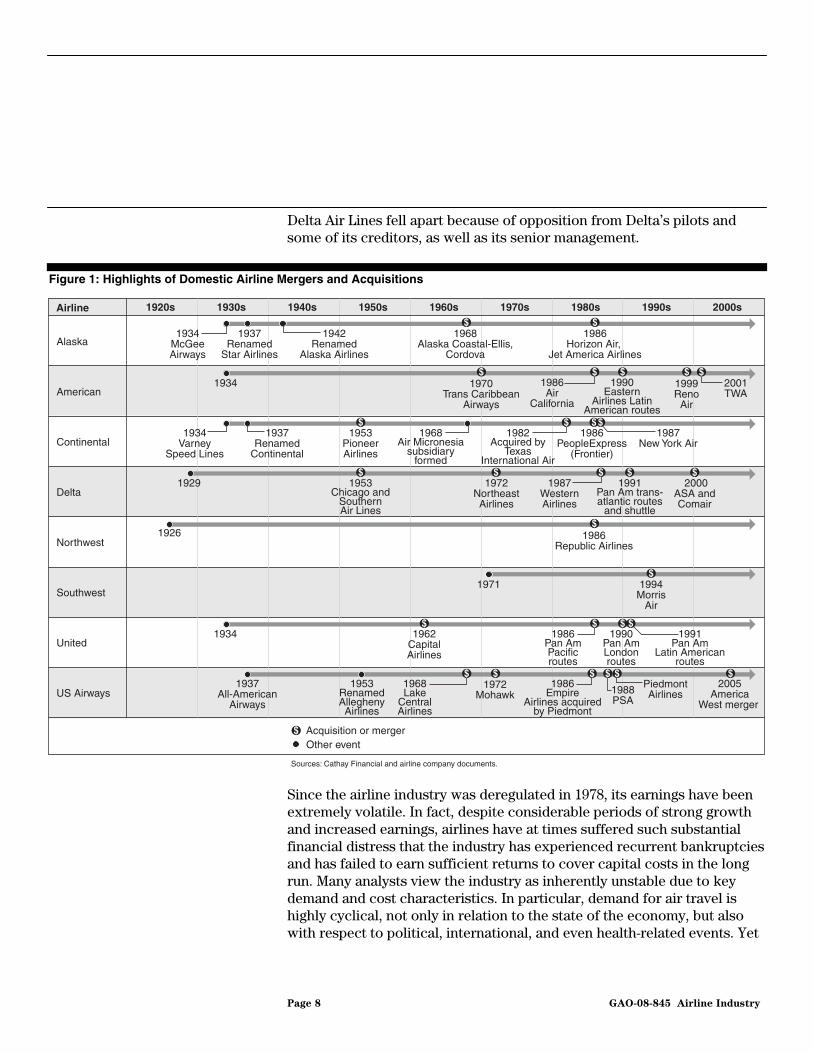
Delta Air Lines fell apart because of opposition from Delta’s pilots and some of its creditors, as well as its senior management.
Figure 1: Highlights of Domestic Airline Mergers and Acquisitions
Delta
Northwest
Continental
American
United
US Airways
Southwest
Alaska
1920s 1930s 1940s 1950s 1960s 1970s 1980s 1990s 2000sAirline
1934McGeeAirways
1942Renamed
Alaska Airlines
1968Alaska Coastal-Ellis,
Cordova
1986Horizon Air,
Jet America Airlines
1934 1970Trans Caribbean
Airways
1986Air
California
1990Eastern
Airlines LatinAmerican routes
1999Reno
Air
2001TWA
1929 1991Pan Am trans-atlantic routes
and shuttle
2000ASA andComair
1953Chicago and
SouthernAir Lines
1972NortheastAirlines
1987WesternAirlines
1934Varney
Speed Lines
1937Renamed
Continental
1953PioneerAirlines
1968Air Micronesia
subsidiaryformed
1982Acquired by
TexasInternational Air
1986PeopleExpress
(Frontier)
1987New York Air
1926 1986Republic Airlines
1971 1994Morris
Air
1991Pan Am
Latin Americanroutes
1934 1962CapitalAirlines
1986Pan AmPacificroutes
1990Pan AmLondonroutes
1937All-American
Airways
1953RenamedAlleghenyAirlines
1968Lake
CentralAirlines
1972Mohawk 1988
PSA
1986Empire
Airlines acquiredby Piedmont
2005America
West merger
Sources: Cathay Financial and airline company documents.
Acquisition or mergerOther event
1937Renamed
Star Airlines
PiedmontAirlines
Since the airline industry was deregulated in 1978, its earnings have been extremely volatile. In fact, despite considerable periods of strong growth and increased earnings, airlines have at times suffered such substantial financial distress that the industry has experienced recurrent bankruptcies and has failed to earn sufficient returns to cover capital costs in the long run. Many analysts view the industry as inherently unstable due to key demand and cost characteristics. In particular, demand for air travel is highly cyclical, not only in relation to the state of the economy, but also with respect to political, international, and even health-related events. Yet
Page 8 GAO-08-845 Airline Industry

the cost characteristics of the industry appear to make it difficult for firms to rapidly contract in the face of declining demand. In particular, aircraft are expensive, long-lived capital assets. And as demand declines, airlines cannot easily reduce flight schedules in the very near term because passengers are already booked on flights for months in advance, nor can they quickly change their aircraft fleets. That is, airplane costs are largely fixed and unavoidable in the near term. Moreover, even though labor is generally viewed as a variable cost, airline employees are mostly unionized, and airlines find that they cannot reduce employment costs very quickly when demand for air travel slows. These cost characteristics can thus lead to considerable excess capacity in the face of declining demand. Finally, the industry is also susceptible to certain external shocks—such as those caused by fuel price volatility. In 2006 and 2007, the airline industry generally regained profitability after several very difficult years. However, these underlying fundamental characteristics of the industry suggest that it will remain an industry susceptible to rapid swings in its financial health.
Since deregulation in 1978, the financial stability of the airline industry has become a considerable concern for the federal government due to the level of financial assistance it has provided to the industry through assuming terminated pension plans and other forms of assistance. Since 1978 there have been over 160 airline bankruptcies. While most of these bankruptcies affected small airlines that were eventually liquidated, 4 of the more recent bankruptcies (Delta, Northwest, United, and US Airways) are among the largest corporate bankruptcies ever, excluding financial services firms. During these bankruptcies, United Airlines and US Airways terminated their pension plans and $9.7 billion in claims were shifted to the Pension Benefit Guarantee Corporation (PGBC).14 Further, to respond to the shock to the industry from the September 11, 2001, terrorist attacks, the federal government provided airlines with $7.4 billion in direct
14PBGC was established under the Employee Retirement Income Security Act of 1974 (ERISA) and set forth standards and requirements that apply to defined benefit plans. PBGC was established to encourage the continuation and maintenance of voluntary private pension plans and to insure the benefits of workers and retirees in defined benefit plans should plan sponsors fail to pay benefits. PGBC operations are financed, for example, by insurance premiums paid by sponsors of defined benefit plans, investment income, assets from pension plans trusted by PBGC, and recoveries from the companies formerly responsible for the plans.
Page 9 GAO-08-845 Airline Industry
assistance and authorized $1.6 billion (of $10 billion available) in loan guarantees to six airlines.15
Although the airline industry has experienced numerous mergers and bankruptcies since deregulation, growth of existing airlines and the entry of new airlines have contributed to a steady increase in capacity.16 Previously, GAO reported that although one airline may reduce capacity or leave the market, capacity returns relatively quickly.17 Likewise, while past mergers and acquisitions have, at least in part, sought to reduce capacity, any resulting declines in industry capacity have been short-lived, as existing airlines have expanded or new airlines have expanded. Capacity growth has slowed or declined just before and during recessions, but not as a result of large airline liquidations. Figure 2 shows capacity trends since 1979 and the dates of major mergers and acquisitions.
15The six airlines receiving loan guarantees were Aloha, World, Frontier, US Airways, ATA, and America West.
16Capacity is defined as available scheduled airline seats.
17GAO, Commercial Aviation: Bankruptcy and Pensions Problems Are Symptoms of
Underlying Structural Issues, GAO-05-945 (Washington, D.C.: Sept. 30, 2005).
Page 10 GAO-08-845 Airline Industry
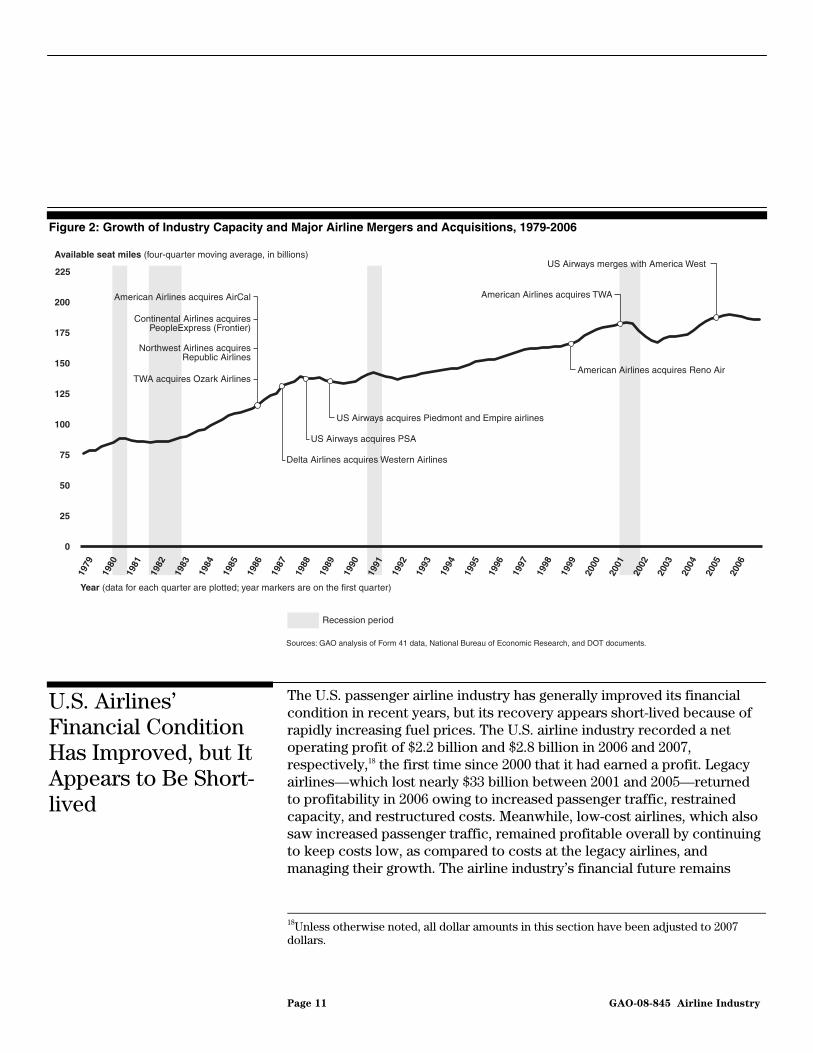
Figure 2: Growth of Industry Capacity and Major Airline Mergers and Acquisitions, 1979-2006
1979
1980
1981
1982
1983
1984
1985
1986
1987
1988
1989
1990
1991
1992
1993
1994
1995
1996
1997
1998
1999
2000
2001
2002
2003
2004
2005
2006
0
25
50
75
100
125
150
175
200
Available seat miles (four-quarter moving average, in billions)
Year (data for each quarter are plotted; year markers are on the first quarter)
Recession period
American Airlines acquires AirCal
American Airlines acquires Reno Air
Continental Airlines acquiresPeopleExpress (Frontier)
Delta Airlines acquires Western Airlines
Northwest Airlines acquiresRepublic Airlines
US Airways acquires PSA
US Airways acquires Piedmont and Empire airlines
US Airways merges with America West
Sources: GAO analysis of Form 41 data, National Bureau of Economic Research, and DOT documents.
225
TWA acquires Ozark Airlines
American Airlines acquires TWA
The U.S. passenger airline industry has generally improved its financial condition in recent years, but its recovery appears short-lived because of rapidly increasing fuel prices. The U.S. airline industry recorded a net operating profit of $2.2 billion and $2.8 billion in 2006 and 2007, respectively,18 the first time since 2000 that it had earned a profit. Legacy airlines—which lost nearly $33 billion between 2001 and 2005—returned to profitability in 2006 owing to increased passenger traffic, restrained capacity, and restructured costs. Meanwhile, low-cost airlines, which also saw increased passenger traffic, remained profitable overall by continuing to keep costs low, as compared to costs at the legacy airlines, and managing their growth. The airline industry’s financial future remains
U.S. Airlines’ Financial Condition Has Improved, but It Appears to Be Short-lived
18Unless otherwise noted, all dollar amounts in this section have been adjusted to 2007 dollars.
Page 11 GAO-08-845 Airline Industry

uncertain and vulnerable to a number of internal and external events—particularly the rapidly increasing costs of fuel.
Both Legacy and Low-Cost Airlines Improved Their Financial Positions in 2006 and 2007
The airline industry achieved modest profitability in 2006 and continued that trend through 2007. The seven legacy airlines had operating profits of $1.1 billion in 2006 and $1.8 billion in 2007, after losses totaling nearly $33 billion from 2001 through 2005. The seven low-cost airlines, after reaching an operating profit low of nearly $55 million in 2004, also saw improvement, posting operating profits of almost $958 million in 2006 and $1 billion in 2007. Figure 3 shows U.S. airline operating profits since 1998.
Figure 3: Operating Profit or Loss for Legacy and Low-Cost Airlines, 1998-2007
-12
-10
-8
-6
-4
-2
0
2
4
6
8
10
2007200620052004200320022001200019991998
2007 dollars in billions
Source: GAO analysis of DOT data.
Year
Legacy airlines
Low-cost airlines
Note: Following their merger in 2005, US Airways and America West 2006-2007 data are included with the legacy airlines. America West’s data from 1998 to 2005 are included with the low-cost airlines.
Page 12 GAO-08-845 Airline Industry
Page 13 GAO-08-845 Airline Industry
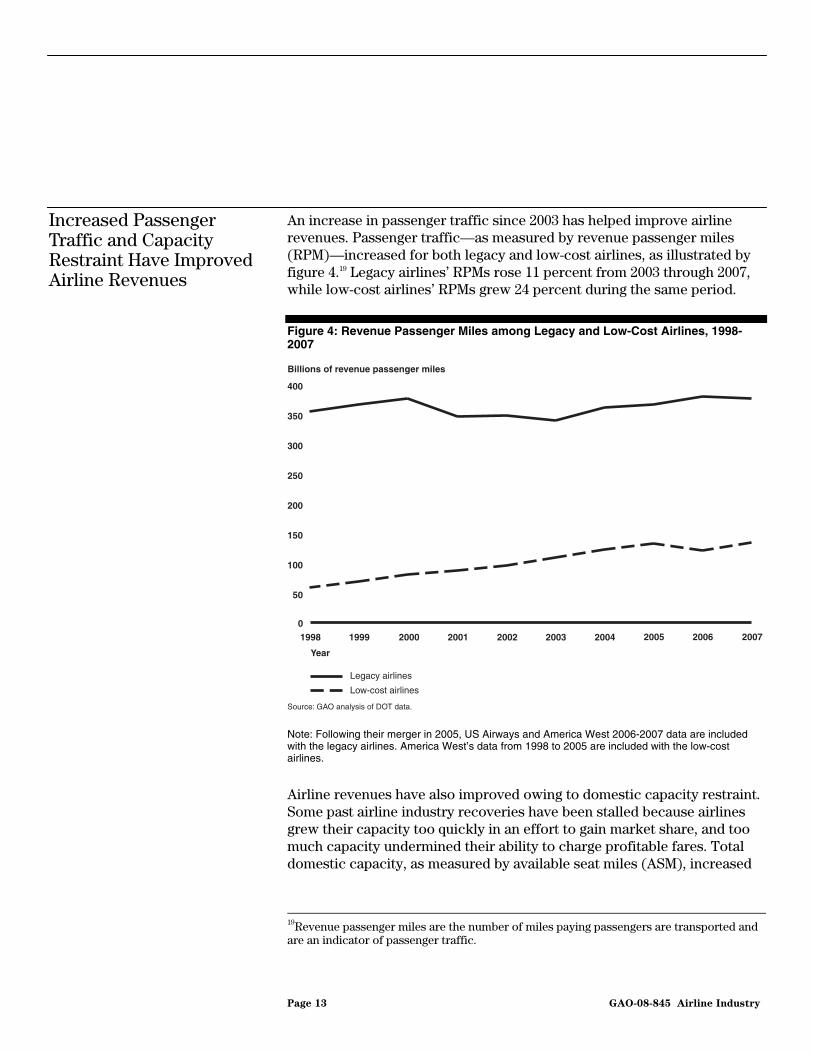
An increase in passenger traffic since 2003 has helped improve airline revenues. Passenger traffic—as measured by revenue passenger miles (RPM)—increased for both legacy and low-cost airlines, as illustrated by figure 4.19 Legacy airlines’ RPMs rose 11 percent from 2003 through 2007, while low-cost airlines’ RPMs grew 24 percent during the same period.
Figure 4: Revenue Passenger Miles among Legacy and Low-Cost Airlines, 1998-2007
Note: Following their merger in 2005, US Airways and America West 2006-2007 data are included with the legacy airlines. America West’s data from 1998 to 2005 are included with the low-cost airlines.
Airline revenues have also improved owing to domestic capacity restraint. Some past airline industry recoveries have been stalled because airlines grew their capacity too quickly in an effort to gain market share, and too much capacity undermined their ability to charge profitable fares. Total domestic capacity, as measured by available seat miles (ASM), increased
19Revenue passenger miles are the number of miles paying passengers are transported and are an indicator of passenger traffic.
Increased Passenger Traffic and Capacity Restraint Have Improved Airline Revenues
0
50
100
150
200
250
300
350
400
2007200620052004200320022001200019991998
Billions of revenue passenger miles
Source: GAO analysis of DOT data.
Year
Legacy airlines
Low-cost airlines
Page 14 GAO-08-845 Airline Industry
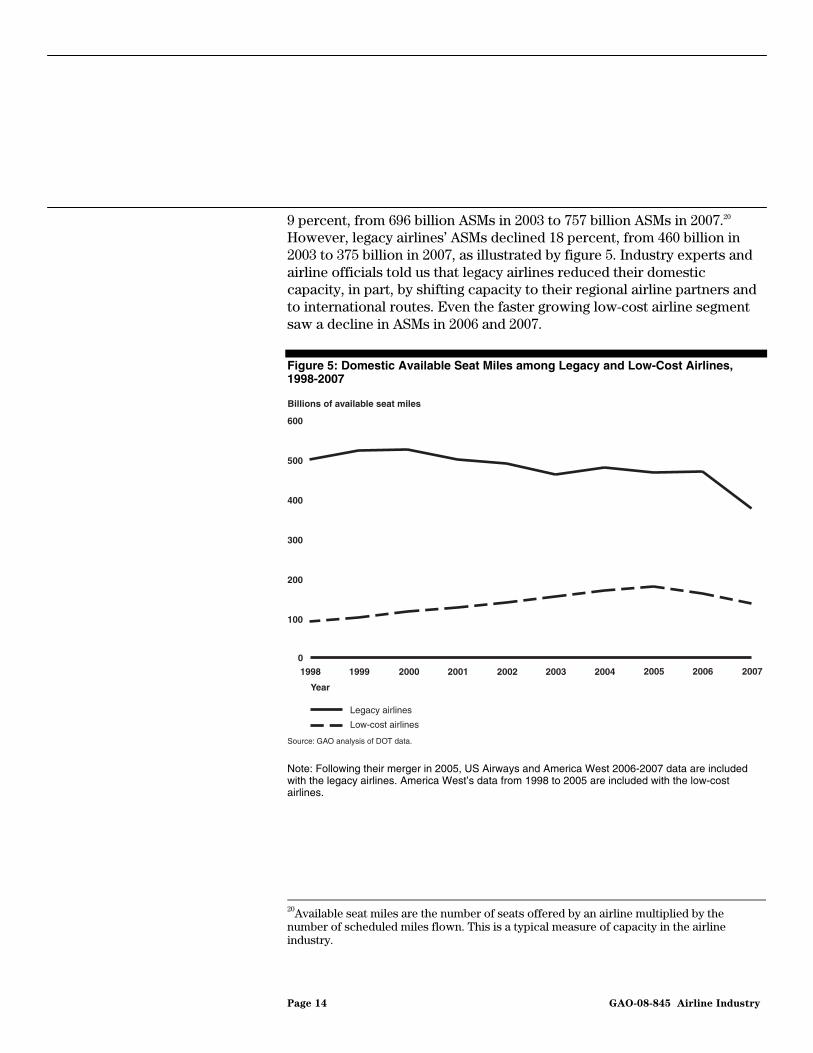
9 percent, from 696 billion ASMs in 2003 to 757 billion ASMs in 2007.20 However, legacy airlines’ ASMs declined 18 percent, from 460 billion in 2003 to 375 billion in 2007, as illustrated by figure 5. Industry experts and airline officials told us that legacy airlines reduced their domestic capacity, in part, by shifting capacity to their regional airline partners and to international routes. Even the faster growing low-cost airline segment saw a decline in ASMs in 2006 and 2007.
Figure 5: Domestic Available Seat Miles among Legacy and Low-Cost Airlines, 1998-2007
Note: Following their merger in 2005, US Airways and America West 2006-2007 data are included with the legacy airlines. America West’s data from 1998 to 2005 are included with the low-cost airlines.
20Available seat miles are the number of seats offered by an airline multiplied by the number of scheduled miles flown. This is a typical measure of capacity in the airline industry.
0
100
200
300
400
500
600
2007200620052004200320022001200019991998
Billions of available seat miles
Source: GAO analysis of DOT data.
Year
Legacy airlines
Low-cost airlines
Since 2004, legacy airlines have shifted portions of their domestic capacity to more profitable international routes. From 1998 through 2003, the legacy airlines maintained virtually the same 30/70 percent capacity allocation split between international and domestic capacity. However, during the period from 2004 to 2007, legacy airlines increased their international capacity by 7 percentage points to a 37/63 percent split between international and domestic capacities. International expansion has proven to be a source of substantial new revenues for the legacy airlines because they often face less competition on international routes. Moreover, international routes generate additional passenger flow (and revenues) through their domestic networks, helping to support service over routes where competition from low-cost airlines has otherwise reduced legacy airlines’ domestic revenues.
Cost Reduction and Bankruptcy Restructuring Efforts Have Also Improved Airline Financial Positions
The airlines have also undertaken cost reduction efforts—much of which occurred through the bankruptcy process—in an attempt to improve their financial positions and better insulate themselves from the cyclical nature of the industry. Excluding fuel, unit operating costs for the industry, typically measured by cost per available seat mile,21 have decreased 16 percent since reaching peak levels around 2001. A number of experts have pointed out that the legacy airlines have likely made most of the cost reductions that can be made without affecting safety or service; however, as figure 6 illustrates, a significant gap remains between legacy and low-cost airlines’ unit costs. A recent expert study examining industry trends in competition and financial condition found similar results, also noting that the cost gap between legacy and low-cost airlines still exists.22
21Cost per available seat mile (CASM) is calculated as operating expenses divided by total available seat miles. Calculating CASM allows comparisons across different sizes of airlines.
22See Randy Bennett, Patrick Murphy, and Jack Schmidt, “A Competitive Analysis of an Industry in Transition: The U.S. Scheduled Passenger Airline Industry.” Gerchick-Murphy Associates (Washington, D.C.) July 2007.
Page 15 GAO-08-845 Airline Industry

Figure 6: Unit Costs, Excluding Fuel, for Legacy and Low-Cost Airlines, 1998-2007
0
0.02
0.04
0.06
0.08
0.10
0.12
0.14
2007200620052004200320022001200019991998
Cost per available seat mile (in 2007 dollars)
Source: GAO analysis of DOT data.
Year
Legacy airlines
Low-cost airlines
Note: Following their merger in 2005, US Airways and America West 2006-2007 data are included with the legacy airlines. America West’s data from 1998 to 2005 are included with the low-cost airlines.
Many airlines achieved dramatic cuts in their operational costs by negotiating contract and pay concessions from their labor unions and through bankruptcy restructuring and personnel reductions. For example, Northwest Airlines pilots agreed to two pay cuts—15 percent in 2004 and an additional 23.9 percent in 2006, while in bankruptcy—to help the airline dramatically reduce operating expenses. Bankruptcy also allowed several airlines to significantly reduce their pension expenses, as some airlines terminated and shifted their pension obligations to PBGC. Legacy airlines in particular reduced personnel as another means of reducing costs. The average number of employees per legacy airline has decreased 26 percent, from 42,558 in 1998 to 31,346 in 2006. Low-cost airlines, on the other hand, have added personnel; however, they have done so in keeping with their increases in capacity. In fact, although total low-cost airline labor costs (including salaries and benefits) steadily increased from 1998 through 2007—from $2.8 billion to $5.0 billion—labor costs have accounted for roughly the same percentage (33 percent) of total operating expenses (including fuel) throughout the time period.
Page 16 GAO-08-845 Airline Industry
Although cost restructuring—achieved both through Chapter 11 bankruptcy reorganizations and outside of that process—has enabled most legacy airlines to improve their balance sheets in recent years, it still leaves the industry highly leveraged. Legacy airlines have significantly increased their total cash reserves from $2.7 billion in 1998 to $24 billion in 2007, thereby strengthening their cash and liquidity positions.23 Low-cost airlines also increased their total cash reserves. Industry experts we spoke with stated that this buildup of cash reserves is a strategic move to help the airlines withstand future industry shocks, as well as to pay down debts or return value to stockholders. Experts, however, also agreed that debt is still a problem within the industry, particularly for the legacy airlines. For example, legacy airlines’ assets-to-liabilities ratio (a measure of a firm’s long-term solvency) is still less than 1 (assets less than liabilities). In 1998, legacy airlines’ average ratio was 0.70, which improved only slightly to 0.74 in 2007. In contrast, while low-cost airlines have also added significant liabilities owing to their growth, their assets-to-liabilities ratio remains better than that of legacy airlines, increasing from 0.75 in 1998 to 1 in 2007.
Airlines’ Financial Turnaround May Be Short-lived
Because the financial condition of the airline industry remains vulnerable to external shocks—such as the rising cost of fuel, economic downturns, or terrorist attacks—the near-term and longer-term financial health of the industry remains uncertain. In light of increased fuel prices and softening passenger demand, the profit and earnings outlook has reversed itself, and airlines may incur record losses in 2008. Although the industry saw profits in 2007 and some were predicting even larger profits in 2008, experts and industry analysts now estimate that the industry could incur significant losses in 2008. In fact, although estimates vary, one analyst recently projected $2.8 billion in industry losses, while another analyst put industrywide losses between $4 billion and $9 billion for the year, depending on demand trends. More recently, the airline trade association, the Air Transport Association, estimated losses of between $5 billion and $10 billion this year, primarily due to escalating fuel prices. For the first quarter of 2008, airlines reported net operating losses of more than $1.4 billion.
23Liquidity is a measure of a firm’s ability to meet short-term liabilities with cash or marketable securities.
Page 17 GAO-08-845 Airline Industry
Many experts cite rising fuel costs as a key obstacle facing the airlines for the foreseeable future. The cost of jet fuel has become an ever-increasing challenge for airlines, as jet fuel climbed to over $2.85 per gallon in early 2008, and has continued to increase. By comparison, jet fuel was $1.11 per gallon in 2000, in 2008 dollars (Fig. 7 illustrates the increase in jet fuel prices since 2000). Some airlines, particularly Southwest Airlines, reduced the impact of rising fuel prices on their costs through fuel hedges;24 however, most of those airlines’ hedges are limited or, in the case of Southwest, will expire within the next few years and may be replaced with new but more expensive hedges. In an attempt to curtail operating losses linked to higher fuel costs, most of the largest airlines have already announced plans to trim domestic capacity during 2008, and some have added baggage and other fees to their fares. Additionally, nine airlines have already filed for bankruptcy or ceased operations since December 2007, with many citing the significant increase in fuel costs as a contributing factor.25
Fuel Costs Are Increasing and Other Costs May Increase
24Fuel hedging allows an airline to lock in on fuel purchase prices in advance of future delivery, thus protecting against anticipated increases in the price of fuel.
25The airlines recently filing for bankruptcy or ceasing operations include Air Midwest, Aloha Airlines, ATA Airlines, Big Sky Air, Champion Air, EOS Airlines, Frontier Airlines, MAXjet Airways, and Skybus Airlines.
Page 18 GAO-08-845 Airline Industry
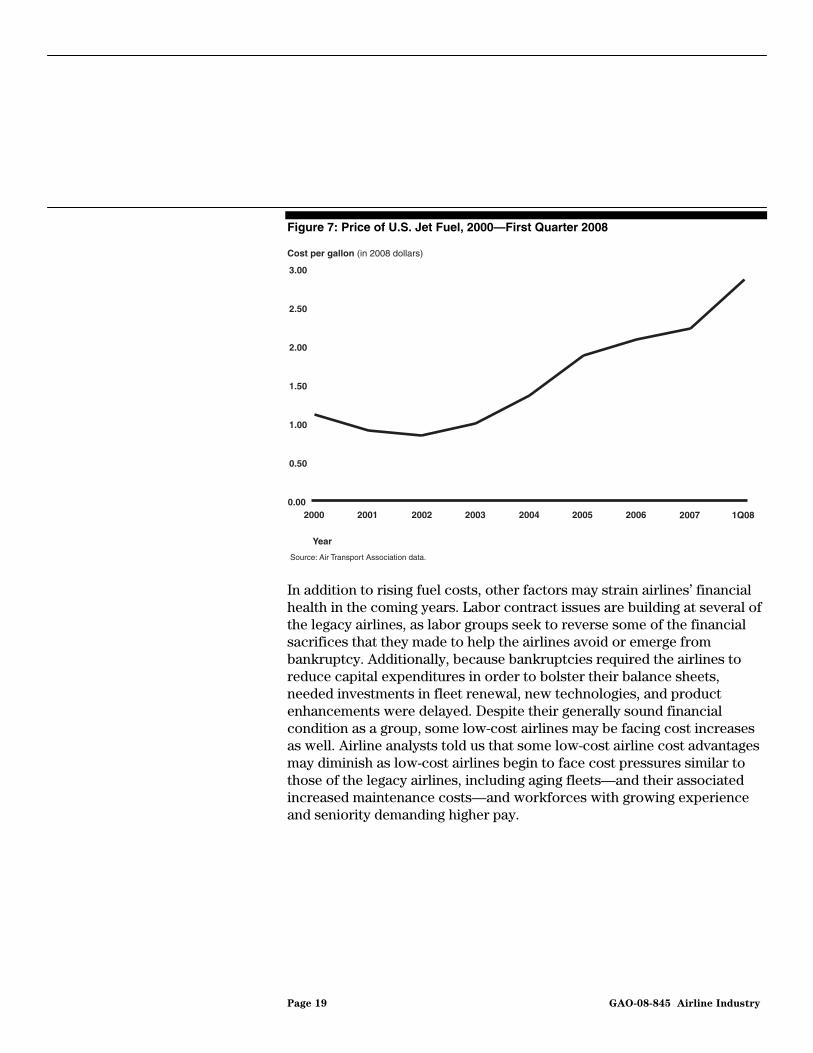
Figure 7: Price of U.S. Jet Fuel, 2000—First Quarter 2008
0.00
0.50
1.00
1.50
2.00
2.50
3.00
1Q0820072006200520042003200220012000
Cost per gallon (in 2008 dollars)
Source: Air Transport Association data.
Year
In addition to rising fuel costs, other factors may strain airlines’ financial health in the coming years. Labor contract issues are building at several of the legacy airlines, as labor groups seek to reverse some of the financial sacrifices that they made to help the airlines avoid or emerge from bankruptcy. Additionally, because bankruptcies required the airlines to reduce capital expenditures in order to bolster their balance sheets, needed investments in fleet renewal, new technologies, and product enhancements were delayed. Despite their generally sound financial condition as a group, some low-cost airlines may be facing cost increases as well. Airline analysts told us that some low-cost airline cost advantages may diminish as low-cost airlines begin to face cost pressures similar to those of the legacy airlines, including aging fleets—and their associated increased maintenance costs—and workforces with growing experience and seniority demanding higher pay.
Page 19 GAO-08-845 Airline Industry
The recent economic downturn and the long-term downward trend in fares create a challenging environment for revenue generation. Macroeconomic troubles—such as the recent tightening credit market and housing slump—have generally served as early indicators of reduced airline passenger demand. Currently, airlines are anticipating reduced demand by the fall of 2008. Additionally, domestic expansion of low-cost airline operations, as well as an increased ability of consumers to shop for lower fares more easily in recent years, has not only led to lower fares in general, but has also contributed to fare “compression”—that is, fewer very high-priced tickets are sold today than in the past. The downward pressure on ticket prices created by the increase of low-cost airline offerings is pervasive, according to a recent study and DOT testimony. Experts we spoke with explained that the increased penetration of low-fare airlines, combined with much greater transparency in fare pricing, has increased consumer resistance to higher fares.
Competition within the U.S. domestic airline market increased from 1998 through 2006 as reflected by an increase in the average number of competitors in the top 5,000 city-pair markets,26 the presence of low-cost airlines in more of these markets, lower fares, fewer dominated city-pair markets, and a shrinking dominance by a single airline at some of the nation’s largest airports. The average number of competitors has increased in these markets from 2.9 in 1998 to 3.3 in 2006.27 The number of these markets served by low-cost airlines increased by nearly 60 percent, from nearly 1,300 to approximately 2,000 from 1998 through 2006. Average round trip fares fell 20 percent, after adjusting for inflation, during the same period. Furthermore, approximately 500 fewer city-pair markets (15 percent) are dominated by a single airline. Similarly, competition has increased at the nation’s 30 largest airports.
Industry Faces Challenging Revenue Environment from Economic Downturns and Consumer Fare Expectations
Domestic Airline Competition Increased from 1998 through 2006, as Low-Cost Airlines Expanded
26The top 5,000 city-pair markets we analyzed accounted for 90 percent of all domestic passenger traffic in 2006.
27We defined an effective competitor to be an airline that carried at least 5 percent of passengers within a city-pair market.
Page 20 GAO-08-845 Airline Industry

The average number of competitors in the largest 5,000 city-pair market has increased since 1998. Overall, the average number of effective competitors—any airline that carries at least 5 percent of the traffic in that market—in the top 5,000 markets rose from 2.9 in 1998 to 3.3 in 2006. As figure 8 shows, the number of single airline (monopoly) markets decreased to less than 10 percent of the top 5,000 markets, while the number of markets with three or more airlines grew to almost 70 percent in 2006. Monopoly markets are generally the smallest city-pair markets, which lack enough traffic to support more than one airline.
Average Number of Competitors and Low-Cost Airline Penetration Has Increased in the Top 5,000 Markets
Figure 8: Markets by Number of Competitors, 1998-2006
0
10
20
30
40
50
60
70
80
200620052004200320022001200019991998
Percentage of markets
Source: GAO analysis of DOT data.
Year
One competitor
Two competitors
Three or more competitors
Note: This figure includes only passengers carried by an airline with at least 5 percent of the passengers in a city-pair market; therefore an unknown number of passengers in each market were not counted.
Longer-distance markets are more competitive than shorter-distance markets. For example, among the top 5,000 markets in 2006, longer-distance markets (greater than 1,000 miles) had on average 3.9 competitors, while routes of less than 250 miles had on average only 1.7 competitors (fig. 9). The difference exists in large part because longer-distance markets have more viable options for connecting over more hubs.
Page 21 GAO-08-845 Airline Industry
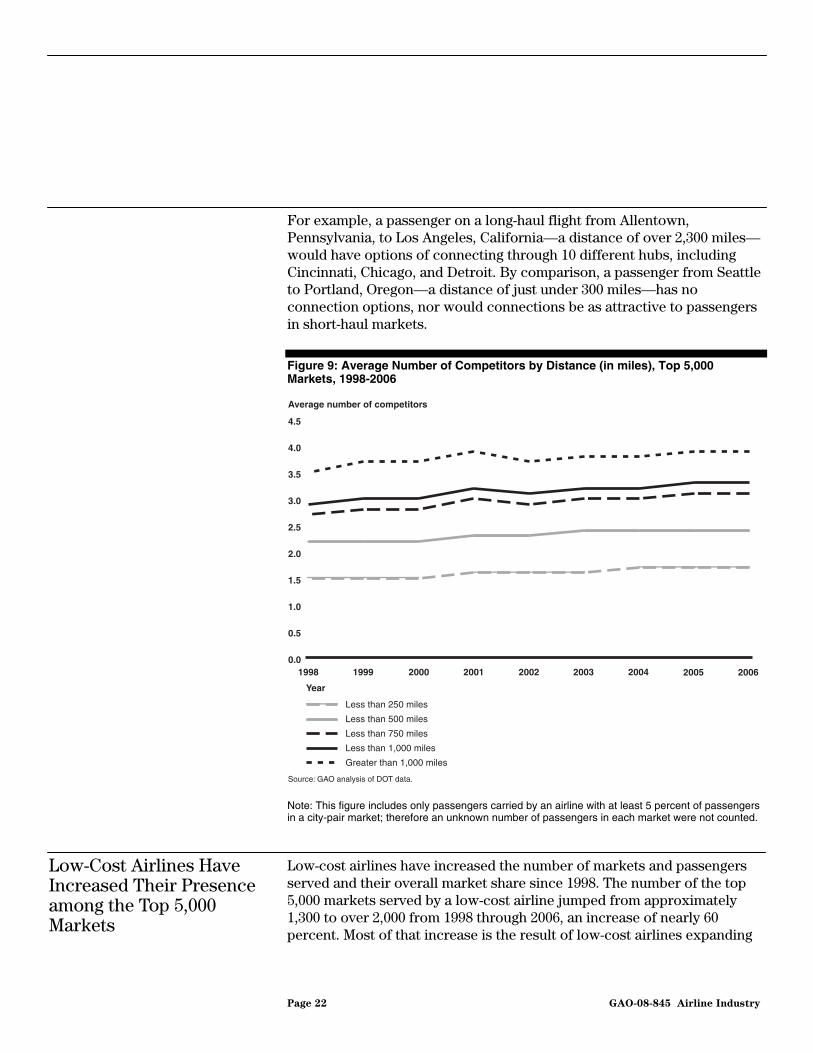
For example, a passenger on a long-haul flight from Allentown, Pennsylvania, to Los Angeles, California—a distance of over 2,300 miles—would have options of connecting through 10 different hubs, including Cincinnati, Chicago, and Detroit. By comparison, a passenger from Seattle to Portland, Oregon—a distance of just under 300 miles—has no connection options, nor would connections be as attractive to passengers in short-haul markets.
Figure 9: Average Number of Competitors by Distance (in miles), Top 5,000 Markets, 1998-2006
0.0
0.5
1.0
1.5
2.0
2.5
3.0
3.5
4.0
4.5
200620052004200320022001200019991998
Average number of competitors
Source: GAO analysis of DOT data.
Year
Less than 250 miles
Less than 500 miles
Less than 750 miles
Less than 1,000 miles
Greater than 1,000 miles
Note: This figure includes only passengers carried by an airline with at least 5 percent of passengers in a city-pair market; therefore an unknown number of passengers in each market were not counted.
Low-Cost Airlines Have Increased Their Presence among the Top 5,000 Markets
Low-cost airlines have increased the number of markets and passengers served and their overall market share since 1998. The number of the top 5,000 markets served by a low-cost airline jumped from approximately 1,300 to over 2,000 from 1998 through 2006, an increase of nearly 60 percent. Most of that increase is the result of low-cost airlines expanding
Page 22 GAO-08-845 Airline Industry

their service into longer-haul markets than they typically served in 1998. Specifically, the number of markets served by low-cost airlines that were longer than 1,000 miles has increased by nearly 45 percent since 1998. For example, in 1998 Southwest Airlines served about 360 markets over 1,000 miles, and by 2006 it served over 670 such markets.
Low-cost airlines’ expansion increased the extent to which they competed directly with legacy airlines. In 1998, low-cost airlines operated in 25 percent of the top 5,000 markets served by legacy airlines and provided a low-cost alternative to approximately 60 percent of passengers.28 By 2006, low-cost airlines were competing directly with legacy airlines in 42 percent of the top 5,000 markets (an additional 756 markets) and provided a low-cost alternative to approximately 80 percent of passengers.
In all, the growth of low-cost airlines into more markets and providing service to more passengers contributed to the shift in passenger traffic between legacy and low-cost airlines. Overall, low-cost airlines’ share of passenger traffic increased from 25 percent in 1998 to 33 percent in 2006, while legacy airlines’ domestic share of passenger traffic fell from 70 percent to 65 percent from 1998 through 2006 (see fig. 10). Low-cost airlines carried 78 million passengers in 1998 and 125 million in 2006—an increase of 59 percent.29
28These figures include only passengers carried by airlines with at least 5 percent of passengers in a city-pair market; therefore an unknown number of passengers in each market were not counted.
29In 2006, Southwest Airlines accounted for two-thirds of the passengers carried by low-cost airlines.
Page 23 GAO-08-845 Airline Industry

Figure 10: Industry Share by Legacy and Low-Cost Airlines, 1998 and 2006
Note: These figures include only passengers carried by airlines with at least 5 percent of passengers in a city-pair market; therefore an unknown number of passengers in each market were not counted. The legacy airline category also includes regional airline passengers. The category “other” includes airlines not classified as legacy or low-cost airlines such as Hawaiian Airlines, Aloha Airlines, and Allegiant Air.
Average Fares Have Declined for Both Legacy and Low-Cost Airlines
Airfares in the top 5,000 markets, one of the key gauges of competition, have fallen in real terms since 1998. From 1998 through 2006, the round-trip average airfare fell from $198 to $161 (in 2006 dollars), a decrease of nearly 20 percent. As figure 11 shows, average fares have fallen across all distances. In 1998, average fares ranged from $257 for trips longer than 1,000 miles to $129 for trips of 250 miles or less. Since that time, however, fares have fallen considerably on the longest trips, and as of 2006, averaged just $183, a drop of 29 percent since 1998. Average fares for the shortest trips have not fallen as much. For trips of 250 miles or less, average fares as of 2006 have fallen 6 percent, to $121.
Page 24 GAO-08-845 Airline Industry

Figure 11: Average Fares by Distance, 1998-2006
0
50
100
150
200
250
300
200620052004200320022001200019991998
2006 dollars
Source: GAO analysis of DOT data.
Year
Less than 250 miles
Less than 500 miles
Less than 750 miles
Less than 1,000 miles
Greater than 1,000 miles
Note: This figure includes only passengers carried by an airline with at least 5 percent of passengers in a city-pair market, therefore an unknown number of passengers in each market were not counted.
Average fares tend to be lower in markets where low-cost airlines are present. Prior studies have shown that the presence of low-cost airlines in a market is associated with lower fares for all passengers in that market. In 1998, over 1,300 of the top 5,000 markets had a low-cost airline present, with an average fare of $167, as opposed to the 3,800 markets without low-cost competition, where the average fares averaged around $250. This same relationship was maintained in 2006, when low-cost airlines’ presence grew to over 2,000 markets, and the average fare in these
Page 25 GAO-08-845 Airline Industry

markets was $153, while the average fare in 2006 legacy airline-only markets was $194.30
Fewer Markets Are Dominated by a Single Airline
The number of the top 5,000 markets dominated by a single airline has declined. Since 1998, the number of dominated markets—markets with one airline with more than 50 percent of passengers—declined as competitors expanded into more markets. The number of dominated markets declined by approximately 500 markets, from 3,500 to 3,000 (or 15 percent) from 1998 through 2006, while the number of nondominated markets correspondingly rose by approximately 500, from approximately 1,400 to 1,900 markets (or 37 percent). (See fig. 12.)
Figure 12: The Number of Dominated and Nondominated Markets, Top 5,000 Markets, 1998-2006
0
500
1,000
1,500
2,000
2,500
3,000
3,500
4,000
200620052004200320022001200019991998
Thousands
Source: GAO analysis of DOT data.
Year
Nondominated
Dominated
Note: This figure includes only passengers carried by an airline with at least 5 percent of passengers in a city-pair market; therefore an unknown number of passengers in each market were not counted.
30Because the markets that had low-cost airlines differed in 1998 and 2006, other factors that changed during that time frame, such as average distances flown, may also account for the price differences across the groupings of routes with and without low-cost competitors.
Page 26 GAO-08-845 Airline Industry
Although there are fewer dominated markets among the top 5,000 markets, further analysis shows that low-cost airlines have increased their share of dominated markets while legacy airlines lost share. In 1998 legacy airlines dominated approximately 3,000 of the top 5,000 markets, but in 2006 that number fell to approximately 2,400. At the same time, low-cost airlines increased their share of dominated markets from about 300 markets in 1998 to approximately 500 markets. Appendix III shows the number of dominated markets by airline in 2006. Low-cost airlines tend to operate in larger dominated markets than legacy airlines. For example, in 2006, legacy airlines carried an average of 55,000 passengers per dominated market, while low-cost airlines carried an average of 165,000 passengers per dominated market.31 This difference reflects the low-cost airlines’ targeting of high-density markets and the nature of hub-and-spoke networks operated by legacy airlines.
Competition Has Increased at the Nation’s Largest Airports
Competition has generally increased at the nation’s largest airports. Airline dominance at many of the largest domestic airports in the United States has decreased as competition has increased in the industry. Although legacy airlines have a dominant position—carrying at least 50 percent of passenger traffic—at 16 of the nation’s 30 largest airports.32 One-half of these 16 dominated airports saw a decline in passenger traffic from 1998 through 2006 (see app. III). Of the 16 airports dominated by a single airline, 14 were dominated by legacy airlines. At 9 of these airports, the second largest airline carried less than 10 percent of passenger traffic, while at the other 5 airports a low-cost airline carried 10 percent or more of passenger traffic.
31These figures include only passengers carried by an airline with at least 5 percent of passengers in a city-pair market; therefore an unknown number of passengers in each market were not counted.
32Large hub airports are those defined in 49 U.S.C. § 40102 as commercial service airports having at least 1 percent of passenger boardings. See also 49 U.S.C. § 47102.
Page 27 GAO-08-845 Airline Industry
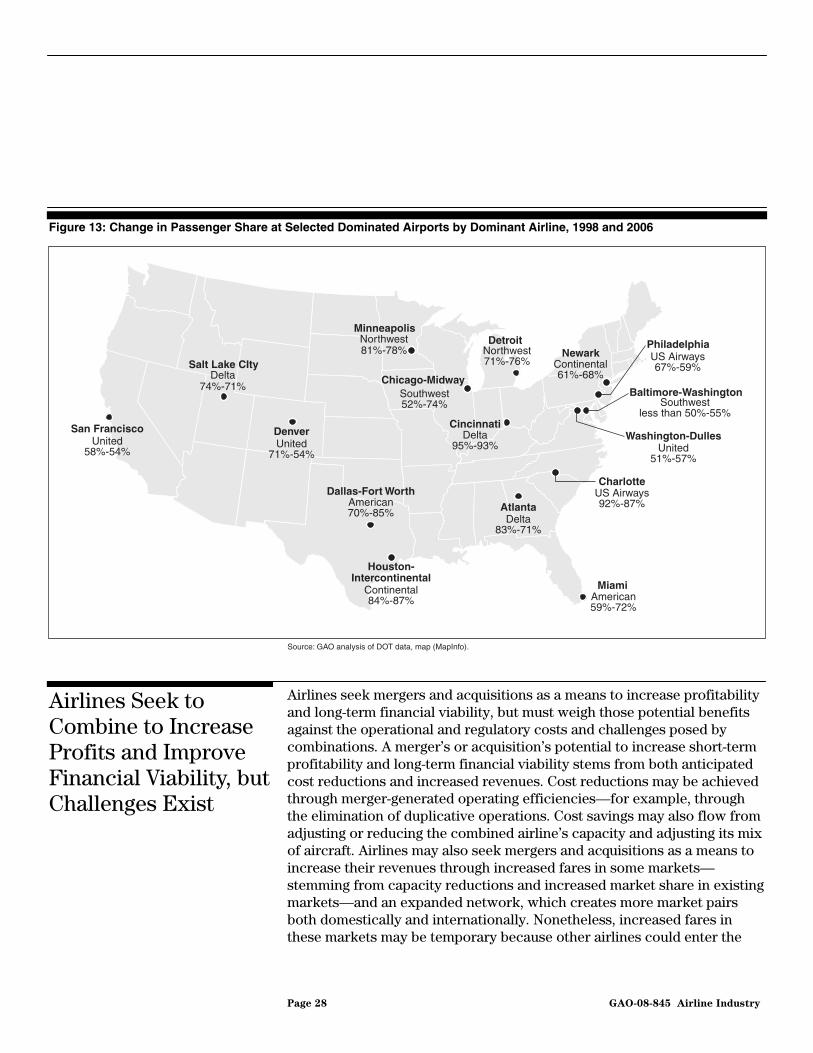
Figure 13: Change in Passenger Share at Selected Dominated Airports by Dominant Airline, 1998 and 2006
San Francisco
Charlotte
Houston-Intercontinental
Cincinnati
Dallas-Fort Worth
Detroit
Miami
Chicago-Midway
Minneapolis
NewarkPhiladelphia
Atlanta
Denver
Baltimore-Washington
Washington-Dulles
Salt Lake CItyDelta
74%-71%
Northwest81%-78%
Southwest52%-74%
Delta95%-93%
Northwest71%-76% Continental
61%-68%
US Airways67%-59%
Southwestless than 50%-55%
United51%-57%
US Airways92%-87%
American59%-72%
Delta83%-71%
Continental84%-87%
American70%-85%
United71%-54%
United58%-54%
Source: GAO analysis of DOT data, map (MapInfo).
Airlines seek mergers and acquisitions as a means to increase profitability and long-term financial viability, but must weigh those potential benefits against the operational and regulatory costs and challenges posed by combinations. A merger’s or acquisition’s potential to increase short-term profitability and long-term financial viability stems from both anticipated cost reductions and increased revenues. Cost reductions may be achieved through merger-generated operating efficiencies—for example, through the elimination of duplicative operations. Cost savings may also flow from adjusting or reducing the combined airline’s capacity and adjusting its mix of aircraft. Airlines may also seek mergers and acquisitions as a means to increase their revenues through increased fares in some markets—stemming from capacity reductions and increased market share in existing markets—and an expanded network, which creates more market pairs both domestically and internationally. Nonetheless, increased fares in these markets may be temporary because other airlines could enter the
Airlines Seek to Combine to Increase Profits and Improve Financial Viability, but Challenges Exist
Page 28 GAO-08-845 Airline Industry
affected markets and drive fares back down. Mergers and acquisitions also present several potential challenges to airline partners, including labor and other integration issues—which may not only delay (or even preclude) consolidation, but also offset intended gains. DOJ antitrust review is another potential challenge, and one that we discuss in greater detail in the next section.
Airline Mergers and Acquisitions Aim to Increase Profitability by Reducing Costs and Increasing Revenues
A merger or acquisition may produce cost savings by enabling an airline to reduce or eliminate duplicative operating costs. Based on past mergers and acquisitions and experts we consulted, a range of potential cost reductions can result, such as the elimination of duplicative service, labor, and operations—including inefficient (or redundant) hubs or routes—and operational efficiencies from the integration of computer systems, and similar airline fleets. Other cost savings may stem from facility consolidation, procurement savings, and working capital and balance sheet restructuring, such as renegotiating aircraft leases. According to US Airways officials and analyst reports, for example, the merger of America West and US Airways generated $750 million in cost savings through the integration of information technology, combined overhead operations, and facilities closings.
Airlines may also pursue mergers or acquisitions to more efficiently manage capacity—both to reduce operating costs and to generate revenue—in their networks. A number of experts we spoke with stated that given recent economic pressures, particularly increased fuel costs, one motive for mergers and acquisitions is the opportunity to lower costs by reducing redundant capacity. Experts have said that industry mergers and acquisitions could lay the foundation for more rational capacity reductions in highly competitive domestic markets and could help mitigate the impact of economic cycles on airline cash flow. In addition, capacity reductions from a merger or acquisition could also serve to generate additional revenue through increased fares on some routes; over the long-term, however, those increased fares may be brought down because other airlines, especially low-cost airlines, could enter the affected markets and drive prices back down. In the absence of mergers and acquisitions and facing ongoing cost pressures, airlines have already begun to reduce their capacity in 2008.
Airlines may also seek to merge with or acquire an airline as a way to generate greater revenues from an expanded network, which serves more city-pair markets, better serves passengers, and thus enhances competition. Mergers and acquisitions may generate additional demand by
Page 29 GAO-08-845 Airline Industry
providing consumers more domestic and international city-pair destinations. Airlines with expansive domestic and international networks and frequent flier benefits particularly appeal to business traffic, especially corporate accounts. Results from a recent Business Traveler Coalition (BTC) survey indicate that about 53 percent of the respondents were likely to choose a particular airline based upon the extent of its route network.33 Therefore, airlines may use a merger or acquisition to enhance their networks and gain complementary routes, potentially giving the combined airline a stronger platform from which to compete in highly profitable markets.
Mergers and acquisitions can also be used to generate greater revenues through increased market share and fares on some routes. For example, some studies of airline mergers and acquisitions during the 1980s showed that prices were higher on some routes from the airline’s hubs after the combination was completed.34 At the same time, even if the combined airline is able to increase prices in some markets, the increase may be transitory if other airlines enter the markets with sufficient presence to counteract the price increase. In an empirical study of airline mergers and acquisitions up to 1992, Winston and Morrison suggest that being able to raise prices or stifle competition does not play a large role in airlines’ merger and acquisition decisions.35 Numerous studies have shown, though, that increased airline dominance at an airport results in increased fare premiums, in part because of competitive barriers to entry.36 Several recent
33Respondents were travel managers responsible for negotiating and managing their firms’ corporate accounts.
34See Severin Borenstein, “Airline Mergers, Airport Dominance, and Market Power,” American Economic Review, Vol 80, May 1990, and Steven A. Morrison, “Airline Mergers: A Longer View,” Journal of Transport Economics and Policy, September 1996; and Gregory J. Werden, Andrew J. Joskow, and Richard L. Johnson, “The Effects of Mergers on Price and Output: Two Case Studies from the Airline Industry,” Managerial and Decision
Economics, Vol. 12, October 1991.
35See Steven A. Morrison, and Clifford Winston, “The Remaining Role for Government Policy in the Deregulated Airline Industry.” Deregulation of Network Industries: What’s
Next? Sam Peltzman and Clifford Winston, eds. Washington, D.C., Brookings Institution Press, 2000. pp. 1-40.
36See Severin Borenstein, 1989, “Hubs and High Fares: Dominance and Market Power in the U.S. Airline Industry,” RAND Journal of Economics, 20, 344-365; GAO, Airline
Deregulation: Barriers to Entry Continue to Limit Competition in Several Key Markets, GAO/RCED-97-4 (Washington, D.C.: Oct. 18, 1996); GAO, Airline Competition: Effects of
Airline and Market Concentration and Barriers to Entry on Airfares, GAO/RCED-91-101 (Washington, D.C.: Apr. 16, 1991).
Page 30 GAO-08-845 Airline Industry
merger and acquisition attempts (United and US Airways in 2000, Northwest and Continental in 1998) were blocked because of opposition by DOJ because of concerns about anticompetitive impacts. Ultimately, however, each merger and acquisition differs in the extent to which cost reductions and revenue increases are factors.
Cost reductions and the opportunity to obtain increased revenue could serve to bolster a merged airline’s financial condition, enabling the airline to better compete in a highly competitive international environment. For example, officials from US Airways stated that as a result of its merger with America West, the airline achieved a significant financial transformation, and they cited this as a reason why airlines merge. Many industry experts believe that the United States will need larger, more economically stable airlines to be able to compete with the merging and larger foreign airlines that are emerging in the global economy. The airline industry is becoming increasingly global; for example, the Open Skies agreement between the United States and the European Union became effective in March 2008.37 Open Skies has eliminated previous government controls on these routes (especially to and from London’s Heathrow Airport), presenting U.S. and European Union airlines with great opportunities as well as competition. In order to become better prepared to compete under Open Skies, global team antitrust immunity applications have already been filed with DOT.38 Antitrust immune alliances differ from current code-share agreements or alliance group partnerships because they allow partners not only to code-share but also to jointly plan and market their routes and schedules, share revenue, and possibly even jointly operate flights.39 According to one industry analyst, this close global cooperation may facilitate domestic consolidation as global alliance partners focus on maximizing synergies for both increasing revenues and reducing costs with their global alliance teams.
37Open Skies seeks to enable greater access of U.S. airlines to Europe, including expanded rights to pick up traffic in one country in Europe and carry it to another European or third country (referred to as fifth freedom rights). Additionally, the United States will expand EU airlines’ rights to carry traffic from the United States to other countries.
38Applications, filed in summer 2007 by SkyTeam members Air France, Alitalia, CSA Czech, Delta, KLM, and Northwest, were approved in 2008. In December 2006, DOT approved the addition of three members (Swiss International, LOT Polish, and TAP Air Portugal) to the Star Alliance’s already approved immunized alliance team of Austrian, Lufthansa, German, Scandanavian, and United.
39Code-sharing is a marketing arrangement in which an airline places its designator code on a flight operated by another airline and sells and issues tickets for that flight.
Page 31 GAO-08-845 Airline Industry
We identified a number of potential barriers to consummating a combination, especially in terms of operational challenges that could offset a merger’s or acquisition’s intended gains. The most significant operational challenges involve the integration of workforces, organizational cultures, aircraft fleets, and information technology systems and processes. Indeed, past airline mergers and acquisitions have proven to be difficult, disruptive, and expensive, with costs in some cases increasing in the short term as the airlines integrate. Airlines also face potential challenges to mergers and acquisitions from DOJ’s antitrust review, discussed in the next section.
Potential Challenges to Mergers and Acquisitions Include Integration Issues and Regulatory Challenges
Workforce integration is often particularly challenging and expensive, and involves negotiation of new labor contracts. Labor groups—including pilots, flight attendants, and mechanics—may be able to demand concessions from the merging airlines during these negotiations, several experts explained, because labor support would likely be required in order for a merger or acquisition to be successful. Some experts also note that labor has typically failed to support mergers, fearing employment or salary reductions. Obtaining agreement from each airline’s pilots’ union on an integrated pilot seniority list—which determines pilots’ salaries, as well as what equipment they can fly—may be particularly difficult. According to some experts, as a result of these labor integration issues and the challenges of merging two work cultures, airline mergers have generally been unsuccessful. For example, although the 2005 America West–US Airways merger has been termed a successful merger by many industry observers, labor disagreements regarding employee seniority, and especially pilot seniority, remain unresolved. More recently, labor integration issues derailed merger talks—albeit temporarily—between Northwest Airlines and Delta Air Lines in early 2008, when the airlines’ labor unions were unable to agree on pilot seniority list integration. Recently, the Consolidated Appropriations Act of 2008 included a labor protective provision that applies to the integration of employees of covered air carriers, and could affect this issue.40 Furthermore, the existence of distinct corporate cultures can influence whether two firms will be able to merge their operations successfully. For example, merger discussions between United Airlines and US Airways broke down in 1995 because the employee-owners of United feared that the airlines’ corporate cultures would clash.
40Pub. L. No. 110-161, Section 117, Dec. 26, 2007.
Page 32 GAO-08-845 Airline Industry

The integration of two disparate aircraft fleets may also be costly. Combining two fleets may increase costs associated with pilot training, maintenance, and spare parts. For example, a merger between Northwest and Delta would result in an airline with 10 different aircraft types. These costs may, however, be reduced post-merger by phasing out certain aircraft from the fleet mix. Pioneered by Southwest and copied by other low-cost airlines, simplified fleets have enabled airlines to lower costs by streamlining maintenance operations and reducing training times. If an airline can establish a simplified fleet, or “fleet commonality”—particularly by achieving an efficient scale in a particular aircraft—then many of the cost efficiencies of a merger or acquisition may be set in motion by facilitating pilot training, crew scheduling, maintenance integration, and inventory rationalization.
Finally, integrating information technology processes and systems can also be problematic and time-consuming for a merging airline. For example, officials at US Airways told us that while some cost reductions were achieved within 3 to 6 months of its merger with America West, the integration of information technology processes has taken nearly 2 ½ years. Systems integration issues are increasingly daunting as airlines attempt to integrate a complex mix of modern in-house systems, dated mainframe systems, and outsourced information technology. The US Airways-America West merger highlighted the potential challenges associated with combining reservations systems, as there were initial integration problems.
The DOJ’s review of airline mergers and acquisitions is a key step for airlines hoping to consummate a merger. The Guidelines provide a five-part integrated process under which mergers and acquisitions are assessed by DOJ. In addition, DOT plays an advisory role for DOJ and, if the combination is consummated, may conduct financial and safety reviews of the combined entity under its regulatory authority. Public statements by DOJ officials and a review of the few airline mergers and acquisitions evaluated by DOJ over the last 10 years also provide some insight into how DOJ applies the Guidelines to the airline industry. While each merger and acquisition review is case specific, our analysis shows that changes in the airline industry, such as increased competition in international and domestic markets, could lead to entry being more likely than in the past. Additionally, the Guidelines have evolved to provide clarity as to the consideration of efficiencies, an important factor in airline mergers.
The Department of Justice’s Antitrust Review Is a Critical Step in the Airline Merger and Acquisition Process
Page 33 GAO-08-845 Airline Industry
Most proposed mergers or acquisitions must be reviewed by DOJ. In particular, under the Hart-Scott-Rodino Act, an acquisition of voting securities and/or assets above a set monetary amount must be reported to DOJ (or the Federal Trade Commission for certain industries) so the department can determine whether the merger or acquisition poses any antitrust concerns.41 To analyze whether a proposed merger or acquisition raises antitrust concerns—whether the proposal will create or enhance market power or facilitate its exercise42—DOJ follows an integrated five-part analytical process set forth in the Guidelines.43 First, DOJ defines the relevant product and geographic markets in which the companies operate and determines whether the merger is likely to significantly increase concentration in those markets. Second, DOJ examines potential adverse competitive effects of the merger, such as whether the merged airlines will be able to charge higher prices or restrict output for the product or service it sells. Third, DOJ considers whether other competitors are likely to enter the affected markets and whether they would counteract any potential anticompetitive effects that the merger might have posed. Fourth, DOJ examines the verified “merger specific” efficiencies or other competitive benefits that may be generated by the merger and that cannot be obtained through any other practical means. Fifth, DOJ considers whether, absent the merger or acquisition, one of the firms is likely to fail, causing its assets to exit the market. The commentary to the Guidelines makes clear that DOJ does not apply the Guidelines as a step-by-step progression, but rather as an integrated approach in deciding whether the proposed merger or acquisition would create antitrust concerns.
The Department of Justice Uses the Guidelines to Identify Antitrust Concerns
41See 15 U.S.C. § 18a(d)(1). Both DOJ and the Federal Trade Commission have antitrust enforcement authority, including reviewing proposed mergers and acquisitions. DOJ is the antitrust enforcement authority charged with reviewing proposed mergers and acquisitions in the airline industry. Additionally, under the Hart-Scott-Rodino Act, DOJ has 30 days after the initial filing to notify companies that intend to merge whether DOJ requires additional information for its review. If DOJ does not request additional information, the firms can close their deal (15 U.S.C. § 18a(b)). If more information is required, however, the initial 30-day waiting period is followed by a second 30-day period, which starts to run after both companies have provided the requested information. Companies often attempt to resolve DOJ competitive concerns, if possible, prior to the expiration of the second waiting period. Any restructuring of a transaction—e.g., through a divestiture—is included in a consent decree entered by a court, unless the competitive problem is unilaterally fixed by the parties prior to the expiration of the waiting period (called a “fix-it first”).
42Market power is the ability to maintain prices profitably above competitive levels for a significant period of time.
43United States Department of Justice and Federal Trade Commission, Horizontal Merger
Guidelines (Washington, D.C., rev. Apr. 8, 1997).
Page 34 GAO-08-845 Airline Industry

DOJ first assesses competitive effects at a city-pair market level. In its review of past airline mergers and acquisitions, DOJ defined the relevant market as scheduled airline service between individual city-pair markets because, according to DOJ, that is the where airlines compete for passengers.44 Second, DOJ assesses likely potential adverse competitive effects---specifically, whether a merged airline is likely to exert market power (maintain prices above competitive levels for a significant period of time) in particular city-pair markets. Generally, a merger or acquisition raises anticompetitive concerns to the extent it eliminates a competitor from the markets that both airlines competed in.45 When United Airlines and US Airways proposed merging in 2000, DOJ concluded that the proposed merger would create monopolies or duopolies in 30 markets with $1.6 billion in revenues, lead to higher fares, and harm consumers on airline routes throughout the United States and on some international routes. The department was particularly concerned about reduced competition in certain markets—nonstop city-pair markets comprising the two airlines’ hub airports, certain other nonstop markets on the East Coast that were served by both airlines, some markets served via connecting service by these airlines along the East Coast, and certain other markets previously dominated by one or both of these airlines. DOJ estimated that the merger would have resulted in higher air fares for businesses and millions of customers. Similarly, in 2000 DOJ sought divestiture by Northwest Airlines of shares in Continental Airlines after the airline had acquired more than 50 percent of the voting interest in Continental. DOJ argued that the acquisition would particularly harm consumers in 7 city-pair markets that linked Northwest and Continental airport hubs, where the two airlines had a virtual duopoly. DOJ also pointed to potential systemwide effects of removing a large competitor. Although DOJ objected to the proposed merger of United and US Airways and the acquisition of Continental by Northwest, it did not challenge a merger
44More specifically, the relevant market has been defined as scheduled airline service between a point of origin and a point of destination. This is often, but not always, defined as a city-pair, but in some cases involving cities with multiple airports, the relevant market has been defined as an airport pair. In addition, DOJ has recognized that nonstop service between cities may be an important market because business travelers are less likely than leisure travelers to regard connecting service as a reasonable alternative. Thus, DOJ may see a transaction as competitively problematic because of its impact in a nonstop city-pair market.
45It is conceivable that a merger could also increase competition in some markets where both airlines had negligible presence before a merger, but combined the merged airlines created a stronger competitor in those markets.
Page 35 GAO-08-845 Airline Industry
between America West and US Airways in 2005 because it found little overlap between city-pair markets served by the two airlines.
DOJ, under the Guidelines’ third element, assesses whether new entry would counter the increased market power of a merged airline. If DOJ determines that the merger is likely to give the merging airlines the ability to raise prices or curtail service in a city-pair market, DOJ assesses whether a new entrant would likely begin serving the city-pair in response to a potential price increase to replace the lost competition and deter or counter the price increase. For such entry to resolve concerns about a market, the Guidelines require that it be “timely, likely, and sufficient” to counteract the likely anticompetitive effects presented by the merger. According to DOJ, the inquiry considers an entry time horizon of 2 years and is fact specific rather than based on theory.46 Some factors that may be considered in assessing likelihood of entry include whether a potential entrant has a hub in one of the cities in a city-pair market of concern so that the potential entrant is well placed to begin service, whether there are constraints (such as slot controls or shortage of gates) that could limit effective entry, and whether the potential entrant would be able to provide the frequency of service that would be required to counteract the merged firm’s presence. For example, if the merging parties operate the only hubs at both end points of a market, it is unlikely that a new entrant airline would find it profitable to offer an effective level of service. In its complaint challenging Northwest Airlines’ attempted acquisition of a controlling interest in Continental, DOJ alleged that significant entry barriers limited new competition for the specific city-pair markets of issue. For example, the complaint alleged that airlines without a hub at one of the end points of the affected hub-to-hub markets were unlikely to enter due to the cost advantages of the incumbents serving that market. In city-pair markets where the merging airlines would have a large share of passengers traveling on connecting flights, DOJ asserted that other airlines were unlikely to enter due to factors such as the light traffic on these routes and the proximity of Northwest’s and Continental’s hubs to the markets as compared to other airlines’ more distant hubs.
Fourth, DOJ considers whether merger-specific efficiencies are “cognizable,” that is, whether they can be verified and do not arise from
46Remarks by J. Bruce McDonald, Deputy Assistant Attorney General, Antitrust Division, Department of Justice, presented to the Regional Airline Association President’s Council Meeting, Washington, D.C., November 3, 2005.
Page 36 GAO-08-845 Airline Industry
anticompetitive reductions in output or services. Cognizable efficiencies, while not specifically defined under the Guidelines, could include any consumer benefit resulting from a merger—including enhanced service through an expanded route network and more seamless travel—as well as cost savings accruing to the merged airline (for example, from reducing overhead or increased purchasing power that may ultimately benefit the consumer).47 Because efficiencies are difficult to quantify and verify, DOJ requires merger partners to substantiate merger benefits. DOJ considers only those efficiencies likely to be accomplished by the proposed merger and unlikely to be achieved through practical, less restrictive alternatives, such as code-sharing agreements or alliances. For example, in its October 2000 complaint against Northwest Airlines for its acquisition of a controlling interest in Continental, DOJ noted that Northwest had not adequately demonstrated that the efficiencies it claimed from the merger could not be gained from other, less anticompetitive means, particularly their marketing alliance, which DOJ did not challenge.
Finally, DOJ considers the financial standing of merger partners—if one of the partners is likely to fail without the merger and its assets were to exit the market. According to the Guidelines, a merger isn’t likely to create or enhance market power or facilitate its exercise if imminent failure of one of the merging firms would cause the assets of that firm to exit the relevant market. For instance, the acquisition of TWA by American Airlines in 2001 was cleared because TWA was not likely to emerge from its third bankruptcy and there was no less anticompetitive purchaser.
In making its decision as to whether the proposed merger is likely anticompetitive—whether it is likely to create or enhance market power or facilitate its exercise—DOJ considers the particular circumstances of the merger as it relates to the Guidelines’ five-part inquiry. The greater the potential anticompetitive effects, the greater must be the offsetting verifiable efficiencies for DOJ to clear a merger. However, according to the Guidelines, efficiencies almost never justify a merger if it would create a monopoly or near monopoly. If DOJ concludes that a merger threatens to deprive consumers of the benefits of competitive air service, then it will seek injunctive relief in a court proceeding to block the merger from being consummated. In some cases, the parties may agree to modify the proposal to address anticompetitive concerns identified by DOJ—for example, selling airport assets or giving up slots at congested airports—in
47Cost savings cannot just be from a reduction in output or service.
Page 37 GAO-08-845 Airline Industry
which case DOJ ordinarily files a complaint along with a consent decree that embodies the agreed-upon changes.
The Department of Transportation Also Reviews Proposed Mergers to Ensure That They Are in the Public Interest
DOT conducts its own analyses of airline mergers and acquisitions. While DOJ is responsible for upholding antitrust laws, DOT will conduct its own competitive analysis and provide it to DOJ in an advisory capacity. In addition, presuming the merger moves forward after DOJ review, DOT can undertake several other reviews if the situation warrants it. Before commencing operations, any new, acquired, or merged airlines must obtain separate authorizations from DOT—“economic” authority from the Office of the Secretary and “safety” authority from the Federal Aviation Administration (FAA). The Office of the Secretary is responsible for deciding whether applicants are fit, willing, and able to perform the service or provide transportation. To make this decision, the Secretary assesses whether the applicants have the managerial competence, disposition to comply with regulations, and financial resources necessary to operate a new airline. FAA is responsible for certifying that the aircraft and operations conform to the safety standards prescribed by the Administrator, for instance, that the applicants’ manuals, aircraft, facilities, and personnel meet federal safety standards. Also, if a merger or other corporate transaction involves the transfer of international route authority, DOT is responsible for assessing and approving all transfers to ensure that they are consistent with the public interest. DOT is responsible for approving such matters to ensure that they are consistent with the public interest.48 Finally, DOT also reviews the merits of any airline merger or acquisition and submits its views and relevant information in its possession to the DOJ. DOT also provides some essential data that DOJ uses in its review.
4849 U.S.C. § 41105. DOT must specifically consider the transfer of certificate authority’s impact on the financial viability of the parties to the transaction and on the trade position of the United States in the international air transportation market, as well as on competition in the domestic airline industry.
Page 38 GAO-08-845 Airline Industry
Changes in the airline industry’s structure and in the Guidelines may affect the factors considered in DOJ’s merger review process. DOJ’s review is not static, as it considers both market conditions and current antitrust thinking at the time of the merger review. According to our own analysis and other studies, the industry has grown more competitive in recent years, and if that trend is not reversed by increased fuel prices, it will become more likely that market entry by other airlines, and possibly low-cost airlines, will bring fares back down in markets in which competition is initially reduced due to a merger. In addition, the ongoing liberalization of international markets and, in particular, cross-Atlantic routes under the U.S.-European Union Open Skies agreement, has led to increased competition on these routes. Finally, as DOJ and the Federal Trade Commission have evolved in their understanding of how to integrate merger-specific efficiencies into the evaluation process, the Guidelines have also changed.
Changes in the Airline Industry and in the Guidelines May Affect the Factors Considered in DOJ’s Merger Review Process
Increased Competition Indicates That Airline Entry May Be More Likely than in the Past
A variety of characteristics of the current airline marketplace indicate that airline entry into markets vacated by a merger partner may be more likely than in the past, unless higher fuel prices substantially alter recent competitive trends in the industry. First, as we have noted, competition on airline routes—spurred by the growth and penetration of low-cost airlines—has increased, while the dominance of legacy airlines has been mitigated in recent years. According to our study, about 80 percent of passengers are now flying routes on which at least one low-cost airline is present. Moreover, some academic studies suggest that low-cost carrier presence has become a key factor in competition and pricing in the industry in recent years. Two articles suggest that the presence of Southwest Airlines on routes leads to lower fares and that even their presence—or entry into end-point airports of a market pair—may be associated with lower prices on routes.49 Another recent study found that fare differentials between hub and nonhub airports—once measured to be quite substantial—are not as great as they used to be, which suggests a declining relevance of market power stemming from airline hub dominance.50 The study did find, however that when there is little presence
49See Steven A. Morrison, “Actual, Adjacent, and Potential Competition: Estimating the Full Effects of Southwest Airlines,” Journal of Transport Economics and Policy, Vol. 35, part 2, May 2001, and Austan Goolsbee and Chad Syverson, “How Do Incumbents Respond to the Threat of Entry? Evidence from the Major Airlines,” Quarterly Journal of Economics, forthcoming.
50See Severin Borenstein, “U.S. Domestic Airline Pricing, 1995-2004,” University of California at Berkeley, Competition Policy Center Working Papers, working paper No. CPC05-48, January 2005.
Page 39 GAO-08-845 Airline Industry

of low-cost airlines at a major carrier’s hub airport, the hub premium continues to remain substantial. However, our competition analysis and these studies predate the considerable increase in fuel prices that has occurred this year and, if permanent, could affect competition and airlines’ willingness to expand into new markets.
In some past cases, DOJ rejected the contention that new entry will be timely, likely, and sufficient to counter potential anticompetitive effects. For example, in 2000, when DOJ challenged Northwest Airline’s proposed acquisition of a controlling interest in Continental Airlines, a DOJ official explained that the department considered it unrealistic to assume that the prospect of potential competition—meaning the possibility of entry into affected markets by other airlines—would fully address anticompetitive concerns, given network airline hub economics at the time.51
Merger Guidelines Have Evolved to Reflect Federal Antitrust Authorities’ Greater Understanding of Efficiencies
The Guidelines have been revised several times over the years, and particularly the most recent revision, in 1997, reflects a greater understanding by federal antitrust authorities in how to assess and weigh efficiencies. In 1968, the consideration of efficiencies was allowed only as a defense in exceptional circumstances. In 1984, the Guidelines were revised to incorporate efficiencies as part of the competitive effects analysis, rather than as a defense. However, the 1984 Guidelines also required “clear and convincing” evidence that a merger will achieve significant net efficiencies. In 1992, the Guidelines were revised again, eliminating the “clear and convincing” standard. The 1997 revision explains that efficiencies must be “cognizable,” that is, merger-specific efficiencies that can be verified and are net of any costs and not resulting solely from a reduction in service or output. In considering the efficiencies, DOJ weighs whether the efficiencies may offset the anticompetitive effects in each market.52 According to the Guidelines, in some cases, merger efficiencies are not strictly in the relevant market, but are so inextricably linked with it that a partial divestiture or other remedy could not feasibly eliminate the anticompetitive effect in the relevant
51Statement of John M. Nannes, Deputy Assistant Attorney General Antitrust Division, before the Committee on Judiciary,U.S. House of Representatives, Concerning Airline Hubs and Mergers, June 14, 2000.
52The evolution in the Guidelines’ consideration of efficiencies is thoroughly explained in a paper by two former DOJ officials in 2003, see William J. Kolasky and Andrew R. Dick, “The Merger Guidelines and the Integration of Efficiencies into Antitrust Review of Horizontal Mergers,” Antitrust Law Journal 71, 1 (2003): 207-251.
Page 40 GAO-08-845 Airline Industry
market without sacrificing the efficiencies in other markets.53 Under those circumstances, DOJ will take into account across-the-board efficiencies or efficiencies that are realized in markets other than those in which the harm occurs. According to DOJ and outside experts, the evolution of the Guidelines reflects an attempt to provide clarity as to the consideration of efficiencies, an important factor in the merger review process.
We provided a draft of this report to DOT and DOJ for their review and comment. Both DOT and DOJ officials provided some clarifying and technical comments that we incorporated where appropriate.
Agency Comments
We provided copies of this report to the Attorney General, the Secretary of Transportation, and other interested parties and will make copies available to others upon request. In addition, this report will be available at no charge on our Web site at http://www.gao.gov.
If you or your staff have any questions on matters discussed in this report, please contact me on (202) 512-2834 or at [email protected]. Contact points for our Offices of Congressional Relations and Public Affairs may be found on the last page of this report. Key contributors to this report can be found in appendix IV.
JayEtta Z. Hecker Director, Physical Infrastructure Issues
53See footnote 36, p. 31 of the Horizontal Merger Guidelines (Revised April 8, 1997).
Page 41 GAO-08-845 Airline Industry
Appendix I: Scope and Methodology
Page 42 GAO-08-845 Airline Industry
Appendix I: Scope and Methodology
To review the financial condition of the U.S. airline industry, we analyzed financial and operational data, reviewed relevant studies, and interviewed industry experts. We analyzed DOT Form 41 financial and operational data submitted to DOT by airlines between the years 1998 through 2007. We obtained these data from BACK Aviation Solutions, a private contractor that provides online access to U.S. airline financial, operational, and passenger data with a query-based user interface. To assess the reliability of these data, we reviewed the quality control procedures used by BACK Aviation and DOT and subsequently determined that the data were sufficiently reliable for our purposes. We also reviewed government and expert data analyses, research, and studies, as well as our own previous studies. The expert research and studies, where applicable, were reviewed by a GAO economist or were corroborated with additional sources to determine that they were sufficiently reliable for our purposes. Finally, we conducted interviews with government officials, airlines and their trade associations, credit and equity analysts, industry experts, and academics. The analysts, experts, and academics were identified and selected based on literature review, prior GAO work, and recommendations from within the industry.
To determine if and how the competitiveness of the U.S. airline industry has changed since 1998, we obtained and stratified DOT quarterly data on the 5,000 largest city-pair markets for calendar years 1998 through 2006. These data are collected by DOT based on a 10 percent random sampling of tickets and identify the origin and destination airports. These markets accounted for about 90 percent of all passengers in 2006. We excluded tickets with interlined flights—a flight in which a passenger transfers from one to another unaffiliated airline—and tickets with international, Alaskan, or Hawaiian destinations. Since only the airline issuing the ticket is identified, regional airline traffic is counted under the legacy parent or partner airline. To assess the reliability of these data, we reviewed the quality control procedures DOT applies and subsequently determined that the data were sufficiently reliable for our purposes. To analyze changes in competition based on the size of the passenger markets, we divided the markets into four groupings. Each group is composed of one-quarter of the total passenger traffic in each year. To stratify these markets by the number of effective competitors operating in a market, we used the following categories: one, two, three, four, and five or more effective competitors, where a airline needed to have at least a 5 percent share of the passengers in the city-pair market to be considered an effective competitor in that market. To stratify the data by market distance, we obtained the great circle distance for each market using the DOT ticket data via BACK Aviation and then grouped the markets into five distance

Appendix I: Scope and Methodology
categories: up to 250 miles, 251-500 miles, 501-750 miles, 751-1,000 miles, and 1,001 miles and over. For the purposes of this study, we divided the airline industry into legacy and low-cost airlines. While there is variation in the size and financial condition of the airlines in each of these groups, there are more similarities than differences for airlines in each group. Each of the legacy airlines predate the airline deregulation of 1978, and all have adopted a hub-and-spoke network model, can be more expensive to operate than a simple point-to-point service model. Low-cost airlines have generally entered interstate competition since 1978,1 are smaller, and generally employ a less costly point-to-point service model. Furthermore, the seven low-cost airlines (Air Tran, America West, ATA, Frontier, JetBlue, Southwest, and Spirit)2 had consistently lower unit costs than the seven legacy airlines (Alaska, American, Continental, Delta, Northwest, United, and US Airways). For this analysis, we continued to categorize US Airways as a legacy airline following its merger with America West in 2005, and included the data for both airlines for 2006 and 2007 with the legacy airlines and between 1998 through 2005 we categorized America West as a low-cost airline.
To determine if competition has changed at the 30 largest airports, we analyzed DOT T-100 enplanement data for 1998 and 2006 to examine the changes in passenger traffic among the airlines at each airport. The T-100 database includes traffic data (passenger and cargo), capacity data, and other operational data for U.S. airlines and foreign airlines operating to and from the United States. The T-100 and T-100(f) data files are not based on sampled data or data surveys, but represent a 100 percent census of the data. To assess the reliability of these data, we reviewed the quality control procedures DOT applies and subsequently determined that the data were sufficiently reliable for our purposes.
To determine the potential effects on competition between the merger of Delta Air Lines and Northwest Airlines explained in appendix II, we examined whether the merger might reduce competition within given airline markets. We defined an effective competitor as an airline that has a market share of at least 5 percent. To examine the potential loss of competition under the merger, we determined the extent to which each airline’s routes overlap by analyzing 2006 data from DOT on the 5,000
1Southwest operated within the state of Texas prior to deregulation.
2Since 2008, ATA has filed for bankruptcy under Chapter 11 and plans to liquidate and Frontier has filed to reorganize under Chapter 11.
Page 43 GAO-08-845 Airline Industry
Appendix I: Scope and Methodology
busiest domestic city-pair origin and destination markets. To determine the potential loss of competition in small communities, we analyzed origin and destination data (OD1B) for the third quarter of 2007 to determine the extent to which airlines’ routes overlap. We defined small communities as those communities with airports that are defined as “nonhubs” by statute in 49 U.S.C. § 47102(13).3
To identify the key factors that airlines consider in deciding whether to merge with or acquire another airline, we reviewed relevant studies and interviewed industry experts. We reviewed relevant studies and documentation on past and prospective airline mergers in order to identify the factors contributing to (or inhibiting) those transactions. We also met with DOT and Department of Justice (DOJ) officials, airline executives, financial analysts, academic researchers, and industry consultants to discuss these factors and their relative importance.
To understand the process and approach used by federal authorities in considering airline mergers and acquisitions, we reviewed past and present versions of the Guidelines, DOT statutes and regulations, and other relevant guidance. We also analyzed legal documents from past airline mergers and published statements by DOT and DOJ officials to provide additional insight into how DOJ and DOT evaluate merger transactions. Finally, we discussed the merger review process with DOJ and DOT officials and legal experts. We conducted this performance audit from May 2007 through July 2008 in accordance with generally accepted government auditing standards. Those standards require that we plan and perform the audit to obtain sufficient, appropriate evidence to provide a reasonable basis for our findings and conclusions based on our audit objectives. We believe that the evidence obtained provides a reasonable basis for our findings and conclusions based on our audit objectives.
3A nonhub is a commercial service airport that has less than 0.05 percent of the passenger boardings.
Page 44 GAO-08-845 Airline Industry
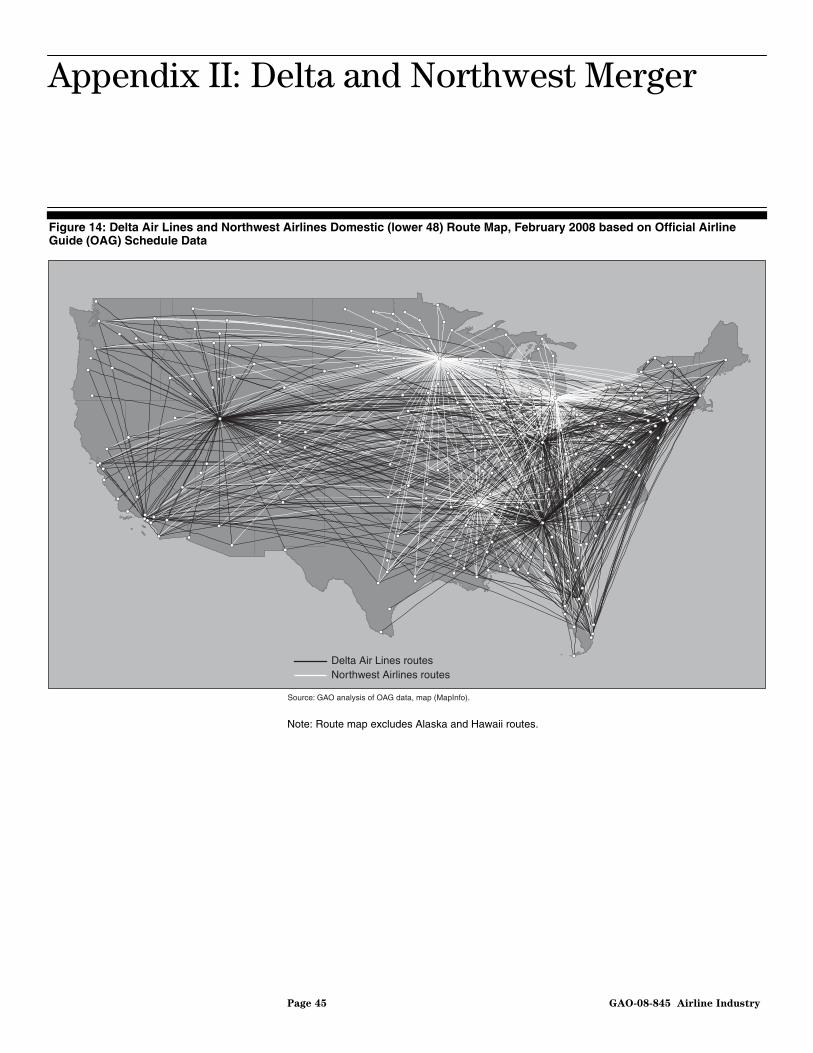
Appendix
II: Delta and Northwest Merger
Page 45 GAO-08-845 Airline Industry
Appendix II: Delta and Northwest Merger
Figure 14: Delta Air Lines and Northwest Airlines Domestic (lower 48) Route Map, February 2008 based on Official Airline Guide (OAG) Schedule Data
Northwest Airlines routesDelta Air Lines routes
Source: GAO analysis of OAG data, map (MapInfo).
Note: Route map excludes Alaska and Hawaii routes.
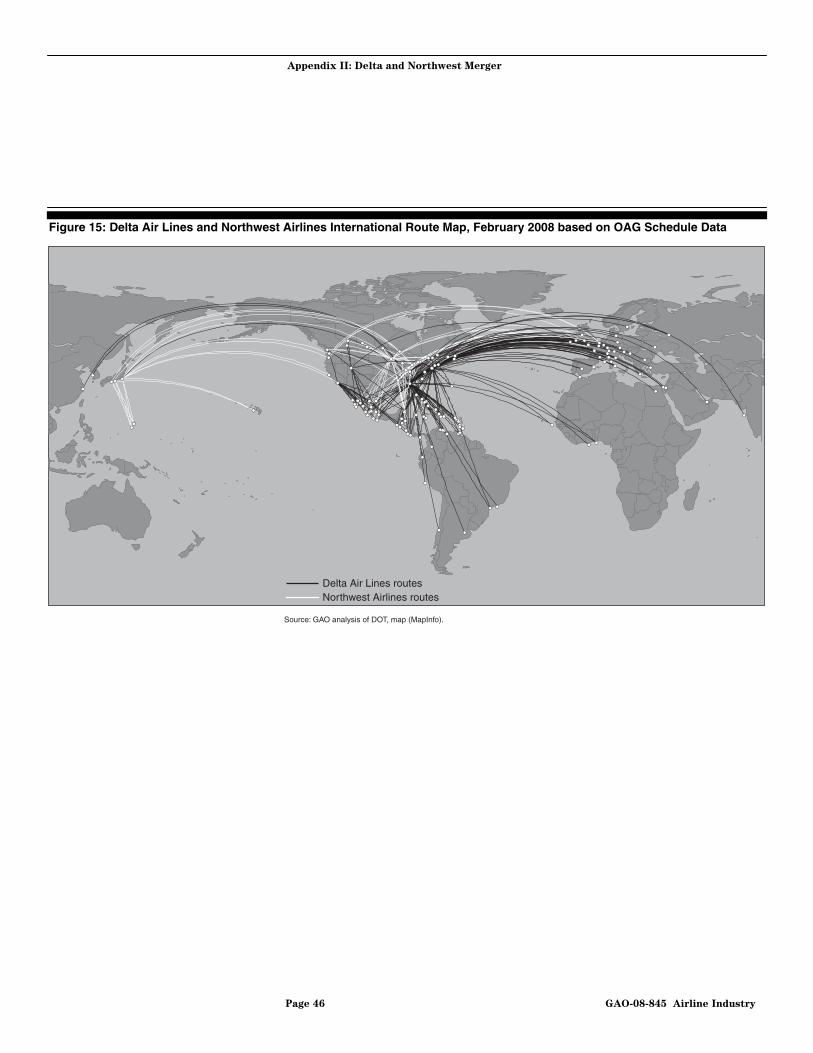
Appendix II: Delta and Northwest Merger
Figure 15: Delta Air Lines and Northwest Airlines International Route Map, February 2008 based on OAG Schedule Data
Source: GAO analysis of DOT, map (MapInfo).
Northwest Airlines routesDelta Air Lines routes
Page 46 GAO-08-845 Airline Industry

Appendix II: Delta and Northwest Merger
Figure 16: Number of Nonstop and One-Stop Markets Where Delta and Northwest Compete, Top 5,000 Markets, 2006
0
100
200
300
400
500
600
8 to 77 to 66 to 55 to 44 to 33 to 22 to 1
Number of markets subject to a loss of competition due to merger
Source: GAO analysis of DOT data.
Change in competition
Table 1: Top Five Markets Where Competition Could Be Reduced from Two Airlines to One Airline, 2006
Market (city-pair) Passengers Percentage of total
Cincinnati, OH-Minneapolis, MN 54,240 13.5%
Fort Walton Beach, FL–Washington, DC 31,050 7.8%
Cincinnati, OH–Detroit. MI 28,870 7.2%
Cincinnati, OH–Manchester, NH 23,070 5.8%
Panama City, FL–Washington, DC 17,480 4.3%
Subtotal top five 154,710 38%
Remaining 29 markets 247,230 62%
Source: GAO analysis of DOT data.
Note: Passengers are included only if carried by an airline that was considered an effective competitor with at least 5 percent of the passengers in a city-pair market; therefore an unidentifiable number of passengers in each is not represented.
Page 47 GAO-08-845 Airline Industry
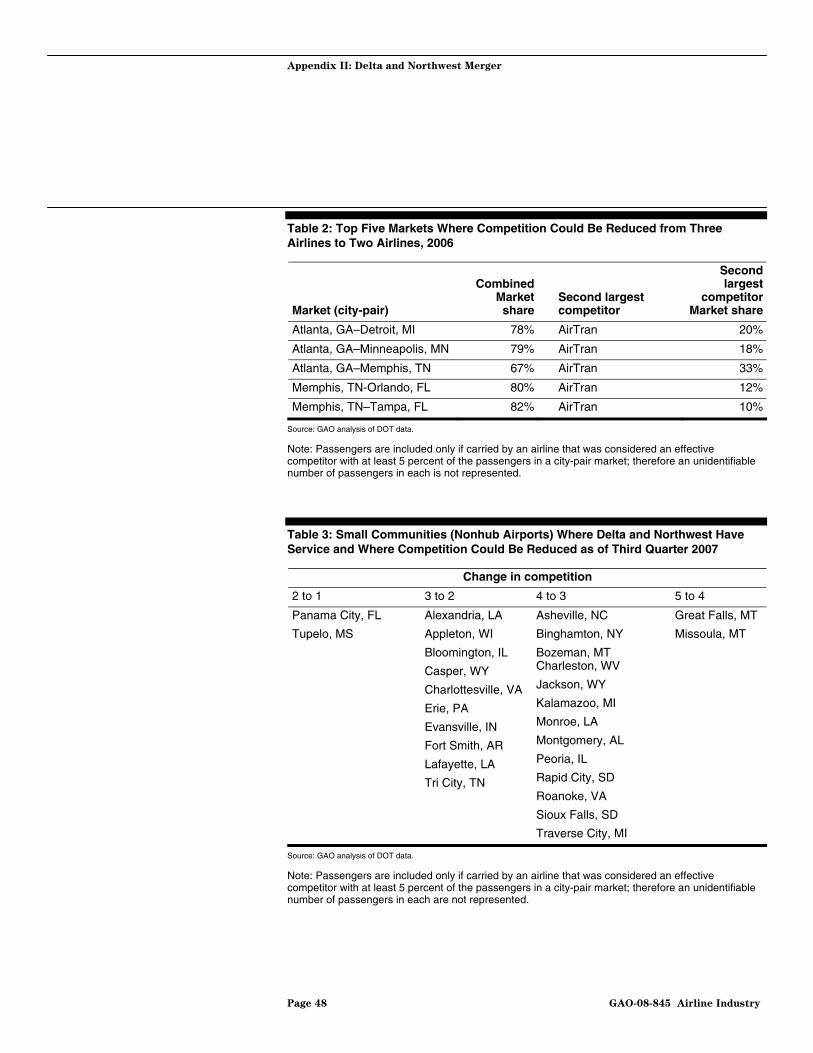
Appendix II: Delta and Northwest Merger
Table 2: Top Five Markets Where Competition Could Be Reduced from Three Airlines to Two Airlines, 2006
Market (city-pair)
Combined Market share
Second largest competitor
Second largest
competitor Market share
Atlanta, GA–Detroit, MI 78% AirTran 20%
Atlanta, GA–Minneapolis, MN 79% AirTran 18%
Atlanta, GA–Memphis, TN 67% AirTran 33%
Memphis, TN-Orlando, FL 80% AirTran 12%
Memphis, TN–Tampa, FL 82% AirTran 10%
Source: GAO analysis of DOT data.
Note: Passengers are included only if carried by an airline that was considered an effective competitor with at least 5 percent of the passengers in a city-pair market; therefore an unidentifiable number of passengers in each is not represented.
Table 3: Small Communities (Nonhub Airports) Where Delta and Northwest Have Service and Where Competition Could Be Reduced as of Third Quarter 2007
Change in competition
2 to 1 3 to 2 4 to 3 5 to 4
Panama City, FL
Tupelo, MS
Alexandria, LA
Appleton, WI
Bloomington, IL
Casper, WY
Charlottesville, VA
Erie, PA
Evansville, IN
Fort Smith, AR
Lafayette, LA
Tri City, TN
Asheville, NC
Binghamton, NY
Bozeman, MT Charleston, WV
Jackson, WY
Kalamazoo, MI
Monroe, LA
Montgomery, AL
Peoria, IL
Rapid City, SD
Roanoke, VA
Sioux Falls, SD
Traverse City, MI
Great Falls, MT
Missoula, MT
Source: GAO analysis of DOT data.
Note: Passengers are included only if carried by an airline that was considered an effective competitor with at least 5 percent of the passengers in a city-pair market; therefore an unidentifiable number of passengers in each are not represented.
Page 48 GAO-08-845 Airline Industry

Appendix III: Number and Size of Dominated
Markets by Airline in the Top 5,000 Markets,
2006
Page 49 GAO-08-845 Airline Industry
Appendix III: Number and Size of Dominated Markets by Airline in the Top 5,000 Markets, 2006
Number of markets Passengers
Southwest 407 55,065,710
Delta 643 21,433,770
American 325 18,297,130
Northwest 464 15,530,460
Continental 201 11,211,870
US Airways 444 11,133,960
United 266 8,820,110
Alaska 92 7,248,730
AirTran 60 2,991,470
Midwest 29 2,314,120
Allegiant 52 1,817,930
jetBlue 9 1,650,210
Frontier 15 1,086,580
Spirit 9 905,410
All 3,028 159,916,720
Source: GAO analysis of DOT data.
Appendix IV:
A
GAO Contact and Staff
cknowledgments
Page 50 GAO-08-845 Airline Industry
Appendix IV: GAO Contact and Staff Acknowledgments
JayEtta Hecker (202) 512-2834 or [email protected]
In addition to the contact named above, Paul Aussendorf, Assistant Director; Amy Abramowitz; Lauren Calhoun; Jessica Evans; Dave Hooper; Delwen Jones; Mitchell Karpman; Molly Laster; Sara Ann Moessbauer; Nick Nadarski; and Josh Ormond made key contributions to this report.
GAO Contact
Staff Acknowledgments
Related GAO Products
Page 51 GAO-08-845 Airline Industry
Related GAO Products
Airline Deregulation: Reregulating the Airline Industry Would Likely
Reverse Consumer Benefits and Not Save Airline Pensions. GAO-06-630. Washington, D.C.: June 9, 2005.
Commercial Aviation: Bankruptcy and Pension Problems Are Symptoms
of Underlying Structural Issues. GAO-05-945. Washington, D.C.: Sept. 30, 2005.
Private Pensions: The Pension Benefit Guaranty Corporation and Long-
Term Budgetary Challenges. GAO-05-772T. Washington, D.C.: June 9, 2005.
Private Pensions: Government Actions Could Improve the Timeliness
and Content of Form 5500 Pension Information. GAO-05-294. Washington, D.C.: June 3, 2005.
Private Pensions: Recent Experiences of Large Defined Benefit Plans
Illustrate Weaknesses in Funding Rules. GAO-05-294. Washington, D.C.: May 31, 2005.
Commercial Aviation: Legacy Airlines Must Further Reduce Costs to
Restore Profitability. GAO-04-836. Washington, D.C.: August 11, 2004.
Private Pensions: Publicly Available Reports Provide Useful but Limited
Information on Plans’ Financial Condition. GAO-04-395. Washington, D.C.: March 31, 2004.
Private Pensions: Multiemployer Plans Face Short- and Long-Term
Challenges. GAO-04-423. Washington, D.C.: March 26, 2004.
Private Pensions: Timely and Accurate Information Is Needed to
Identify and Track Frozen Defined Benefit Plans. GAO-04-200R. Washington, D.C.: December 17, 2003.
Pension Benefit Guaranty Corporation: Single-Employer Pension
Insurance Program Faces Significant Long-Term Risks. GAO-04-90. Washington, D.C.: October 29, 2003.
Commercial Aviation: Air Service Trends at Small Communities since
October 2000. GAO-02-432. Washington, D.C.: March 29, 2002.
(544140)
GAO’s Mission The Government Accountability Office, the audit, evaluation, and investigative arm of Congress, exists to support Congress in meeting its constitutional responsibilities and to help improve the performance and accountability of the federal government for the American people. GAO examines the use of public funds; evaluates federal programs and policies; and provides analyses, recommendations, and other assistance to help Congress make informed oversight, policy, and funding decisions. GAO’s commitment to good government is reflected in its core values of accountability, integrity, and reliability.
The fastest and easiest way to obtain copies of GAO documents at no cost is through GAO’s Web site (www.gao.gov). Each weekday, GAO posts newly released reports, testimony, and correspondence on its Web site. To have GAO e-mail you a list of newly posted products every afternoon, go to www.gao.gov and select “E-mail Updates.”
The first copy of each printed report is free. Additional copies are $2 each. A check or money order should be made out to the Superintendent of Documents. GAO also accepts VISA and Mastercard. Orders for 100 or more copies mailed to a single address are discounted 25 percent. Orders should be sent to:
U.S. Government Accountability Office 441 G Street NW, Room LM Washington, DC 20548
To order by Phone: Voice: (202) 512-6000 TDD: (202) 512-2537 Fax: (202) 512-6061
Contact:
Web site: www.gao.gov/fraudnet/fraudnet.htm E-mail: [email protected] Automated answering system: (800) 424-5454 or (202) 512-7470
Ralph Dawn, Managing Director, [email protected], (202) 512-4400 U.S. Government Accountability Office, 441 G Street NW, Room 7125 Washington, DC 20548
Chuck Young, Managing Director, [email protected], (202) 512-4800 U.S. Government Accountability Office, 441 G Street NW, Room 7149 Washington, DC 20548
Obtaining Copies of GAO Reports and Testimony
Order by Mail or Phone
To Report Fraud, Waste, and Abuse in Federal Programs
Congressional Relations
Public Affairs
PRINTED ON RECYCLED PAPER