GAO-07-463 Medicare Physician Payments: Medicare and ...
40
United States Government Accountability Office GAO Report to the Subcommittee on Health, Committee on Ways and Means, House of Representatives MEDICARE PHYSICIAN PAYMENTS Medicare and Private Payment Differences for Anesthesia Services July 2007 GAO-07-463
Transcript of GAO-07-463 Medicare Physician Payments: Medicare and ...
United States Government Accountability Office
GAO Report to the Subcommittee on Health, Committee on Ways and Means, House of Representatives
MEDICARE PHYSICIAN PAYMENTS
Medicare and Private Payment Differences for Anesthesia Services
July 2007
GAO-07-463

What GAO Found
United States Government Accountability Office
Why GAO Did This Study
HighlightsAccountability Integrity Reliability
July 2007
MEDICARE PHYSICIAN PAYMENTS
Medicare and Private Payment Differences for Anesthesia Services
Highlights of GAO-07-463, a report to the Subcommittee on Health, Committee on Ways and Means, House of Representatives
In 2005 Medicare paid over $1.4 billion for anesthesia services. These services are generally provided by anesthesia practitioners, such as anesthesiologists and certified registered nurse anesthetists (CRNAs). A government-sponsored study found that Medicare payments for anesthesia services are lower than private payments. Congress is concerned that this difference may create regional discrepancies in the supply of anesthesia practitioners, and asked GAO to explore this issue. GAO examined (1) the extent to which Medicare payments for anesthesia services were lower than private payments across Medicare payment localities in 2004, (2) whether the supply of anesthesia practitioners across Medicare payment localities in 2004 was related to the differences between Medicare and private payments for anesthesia services or the concentration of Medicare beneficiaries, and (3) compensation levels for anesthesia practitioners in 2005 and trends in graduate training. GAO used claims data from two anesthesia service billing companies that bill private insurance payers and Medicare to calculate payments by payer for seven anesthesia services in 41 Medicare payment localities. GAO also used data from the Centers for Medicare & Medicaid Services (CMS) and other sources to determine practitioner supply and Medicare beneficiary concentration in 87 Medicare payment localities.
GAO found that in 2004 average Medicare payments for a set of seven anesthesia services provided by anesthesiologists alone were 67 percent lower than average private insurance payments in 41 Medicare payment localities—geographic areas established by CMS to account for geographic variations in the relative costs of providing physician services. In 2004, there was no correlation between the overall supply of anesthesia practitioners—that is, the total number of both anesthesiologists and CRNAs per 100,000 people—and either the difference between Medicare and private insurance payments for anesthesia services or the concentration of Medicare beneficiaries in the Medicare payment localities included in GAO’s analyses. However, when GAO examined the supply of anesthesiologists and CRNAs separately, GAO found correlations between practitioner supply and payment differences and practitioner supply and beneficiary concentration. Specifically, GAO found that in 2004, the supply of CRNAs tended to decrease as the difference between Medicare and private insurance payments for anesthesia services increased in 41 Medicare payment localities. GAO also found that in 2004 the supply of anesthesiologists tended to decrease as the concentration of Medicare beneficiaries increased across 87 Medicare payment localities, while the supply of CRNAs tended to increase as the concentration of Medicare beneficiaries increased across these Medicare payment localities. For 2005, compensation for anesthesia practitioners was reported to compare favorably with other practitioners, according to information from medical group practices from across the country that responded to a survey of Medical Group Management Association (MGMA) member organizations. The 2005 median annual compensation for general anesthesiologists--approximately $354,240--was over 10 percent higher than the median annual compensation for specialists and over twice the compensation for generalists. For 2005, MGMA-reported median annual compensation for CRNAs–approximately $131,400--was over 40 percent higher than the MGMA-reported median annual compensation for either nurse midwives or nurse practitioners and over 35 percent higher than the MGMA-reported median annual compensation for physician assistants. The number of anesthesiology residency positions offered through the National Resident Matching Program and the number of nurse anesthesia graduates have increased in recent years. CMS stated that the study provided a good summary of information collected from a variety of sources on anesthesia payments and the supply of anesthesia practitioners.
www.gao.gov/cgi-bin/getrpt?GAO-07-463. To view the full product, including the scope and methodology, click on the link above. For more information, contact Kathleen King at (202) 512-7114 or [email protected].

Contents
Letter 1
Results in Brief 7Background 8 Average Medicare Payments for Anesthesia Services Provided by
Anesthesiologists Alone Ranged from 51 Percent to 77 Percent Lower than Average Private Payments 14
Overall Supply of Anesthesiologists and CRNAs Combined Was Not Correlated with Payment Differences for Anesthesia Services or Concentration of Medicare Beneficiaries 15
Compensation of Anesthesia Practitioners Was Reported to Compare Favorably with Other Practitioners, and Anesthesiology Residencies and Nurse Anesthesia Graduates Have Increased 17
Agency and External Comments and Our Evaluation 18
Appendix I Scope and Methodology 21
Appendix II Comments from the Centers for Medicare &
Medicaid Services 30
Appendix III GAO Contacts and Staff Acknowledgments 33
Related GAO Products 34
Tables
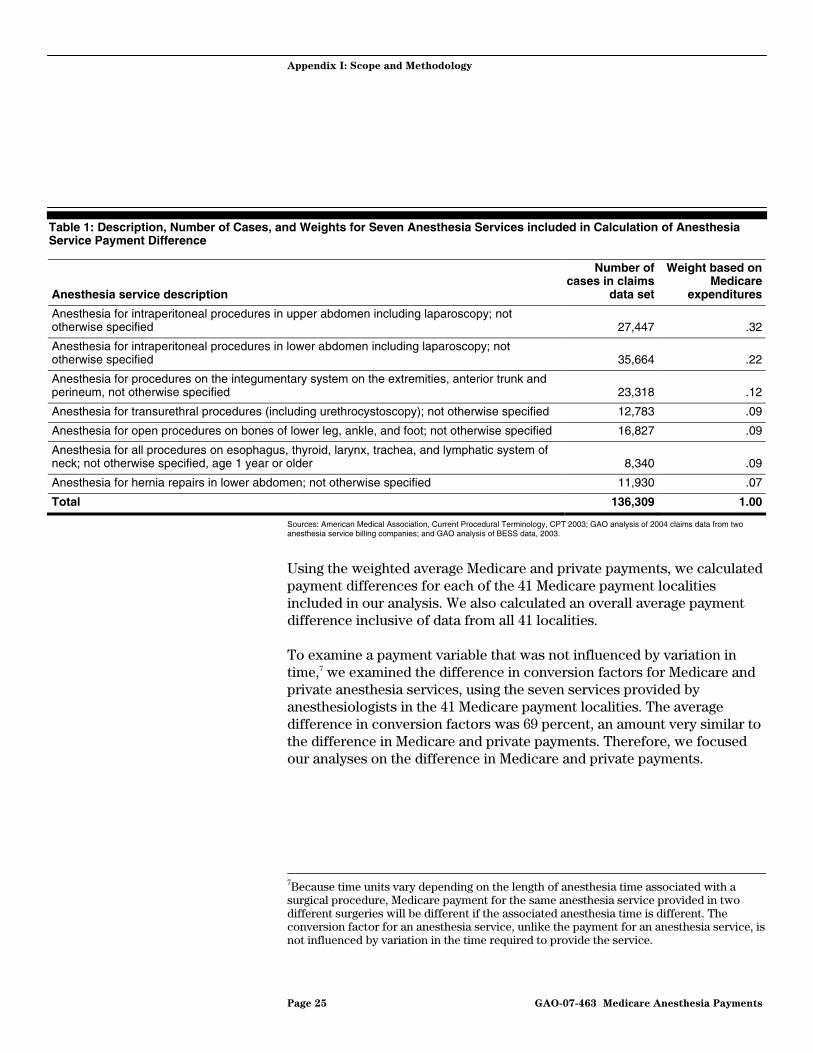
Table 1: Description, Number of Cases, and Weights for Seven Anesthesia Services included in Calculation of Anesthesia Service Payment Difference 25
Table 2: Average and Range of Anesthesia Practitioner Supply per 100,000 People, 2004 26
Table 3: Average and Range of Medicare Beneficiary Concentration, 2004 27
Page i GAO-07-463 Medicare Anesthesia Payments
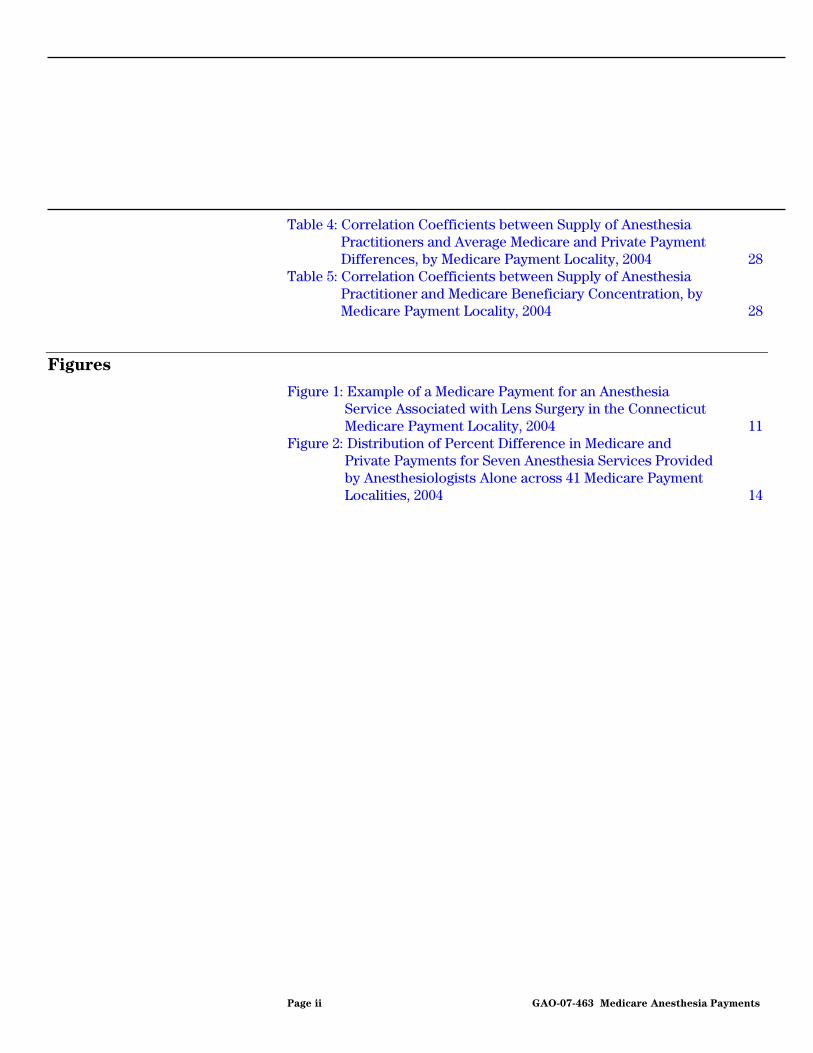
Table 4: Correlation Coefficients between Supply of Anesthesia Practitioners and Average Medicare and Private Payment Differences, by Medicare Payment Locality, 2004 28
Table 5: Correlation Coefficients between Supply of Anesthesia Practitioner and Medicare Beneficiary Concentration, by Medicare Payment Locality, 2004 28
Figures
Figure 1: Example of a Medicare Payment for an Anesthesia Service Associated with Lens Surgery in the Connecticut Medicare Payment Locality, 2004 11
Figure 2: Distribution of Percent Difference in Medicare and Private Payments for Seven Anesthesia Services Provided by Anesthesiologists Alone across 41 Medicare Payment Localities, 2004 14
Page ii GAO-07-463 Medicare Anesthesia Payments

Abbreviations
AA Anesthesiologist Assistant AANA American Association of Nurse Anesthetists AMA American Medical Association ASA American Society of Anesthesiologists BESS Medicare Part B Extract Summary System CCNA Council on Certification of Nurse Anesthetists CMS Centers for Medicare & Medicaid Services CRNA Certified Registered Nurse Anesthetist HMO Health Maintenance Organization MedPAC Medicare Payment Advisory Commission MGMA Medical Group Management Association NRMP National Resident Matching Program PPRC Physician Payment Review Commission RVU relative value unit
This is a work of the U.S. government and is not subject to copyright protection in the United States. It may be reproduced and distributed in its entirety without further permission from GAO. However, because this work may contain copyrighted images or other material, permission from the copyright holder may be necessary if you wish to reproduce this material separately.
Page iii GAO-07-463 Medicare Anesthesia Payments
United States Government Accountability Office
Washington, DC 20548
July 27, 2007
The Honorable Pete Stark Chairman The Honorable Dave Camp Ranking Minority Member Subcommittee on Health Committee on Ways and Means House of Representatives
In 2005, Medicare—the federal program that helps pay for physician and other health care services furnished to the nation’s elderly and disabled—paid over $1.4 billion for anesthesia services, which are services associated with the administration of anesthesia to patients undergoing surgical or other invasive procedures.1 Anesthesia services can be delivered in a variety of settings and are generally provided by anesthesia practitioners, which include anesthesiologists and certified registered nurse anesthetists (CRNAs).
Before 1992, Medicare paid for physician services, which include anesthesia services, using a methodology based on physicians’ historical charges. In 1992, this methodology was replaced by a physician fee schedule that based payments for physician services on the amount of resources used to provide each service relative to all other services, adjusted for differences in the costs of providing the service across geographic areas, known as Medicare payment localities.2 Under the new physician fee schedule, Medicare payments for some specialties were expected to increase while payments for other specialties, including anesthesiology, were expected to decrease compared with the payments
1Centers for Medicare & Medicaid Services (CMS), Medicare Part B physician/supplier data, 2005. CMS is the agency that administers the Medicare program. The $1.4 billion represents payments made under Medicare Part B, which helps pay for physician and other noninstitutional health care services provided to Medicare beneficiaries.
2CMS established Medicare payment localities to reflect geographic variations in the relative costs required to provide physician services. For the purposes of this report, we refer to “Medicare payment localities” as “payment localities” or “localities.” There are 89 payment localities. Localities can encompass large geographic areas, from cities to entire states. Many localities contain several cities, towns, and rural areas with distinct characteristics and populations.
Page 1 GAO-07-463 Medicare Anesthesia Payments

based on physicians’ historical charges. After the first year the physician fee schedule was in effect, Medicare payments for some physician specialties—such as general and family practice—increased while payments for other specialties—such as surgery—decreased. An analysis of 1992 data by the Physician Payment Review Commission (PPRC) found that Medicare payments per service for general and family practitioners increased by 10 percent, while payments per service for surgical specialties decreased by 8 percent overall during this time period.3
While there have been increases in Medicare payments for anesthesia services since the implementation of the physician fee schedule,4 anesthesia practitioners have maintained that Medicare payments for anesthesia services are too low, especially when compared with the payments for such services made by private insurance payers.5 In a 2002 survey of health plans sponsored by the Medicare Payment Advisory Commission (MedPAC), researchers estimated that Medicare payments for anesthesia services were about 61 percent lower than private insurance payments.6,7,8 In contrast, a more recent analysis conducted for MedPAC of 2004 claims data found that Medicare payments for physician services,
3According to CMS, the first-year impact of the physician fee schedule on anesthesia service payments was not calculated.
4Medicare payments for physician services, including anesthesia services, are updated by CMS on an annual basis, and except in 2002 when the update was negative and in 2006 and 2007 when the updates were zero, the annual payment updates have resulted in annual increases in payments for physician services. In addition to these annual updates, payments for physician services can also be adjusted to reflect reviews of the valuation of individual services. As a result of these reviews, payments for anesthesia services were increased in 1997 and again in 2003.
5The differences between Medicare and private payments for anesthesia services are not a legal criterion for determining Medicare payment reasonableness.
6MedPAC is an independent federal body that advises the U.S. Congress on issues affecting the Medicare program.
7For the purposes of this report, we also refer to “private insurance payments” as “private payments.”
8Dyckman & Associates, Survey of Health Plans Concerning Physician Fees and Payment
Methodology: A Study Conducted by Dyckman & Associates for the Medicare Payment
Advisory Commission, No. 03-7 (Washington, D.C.: MedPAC, August 2003).
Page 2 GAO-07-463 Medicare Anesthesia Payments

excluding anesthesia services, were, on average, 17 percent lower than private payments.9
Congress is concerned that regional differences between Medicare and private payments for anesthesia services may create discrepancies in the supply of anesthesia practitioners, which in turn could adversely affect access to services for Medicare beneficiaries in some areas. In particular, there is a concern that anesthesia practitioners will choose to practice in areas where private payments for anesthesia services are highest relative to Medicare payments and avoid areas where Medicare beneficiaries are more concentrated relative to the general population. While we previously reported on the impact of income—of which Medicare payments are one source—on physicians’ decisions on where to locate and on Medicare beneficiary access to physician services, our work did not focus on specific specialists such as anesthesiologists or nonphysician practitioners such as CRNAs. In 2005 we reported that physician income, regardless of its source, was generally not a primary factor influencing physicians’ decisions to locate in rural areas,10 and in 2006 we reported evidence of recent increases in Medicare beneficiary access to physician services.11 However, the difference between Medicare and private payments for anesthesia services is larger than the difference in payments for other physician services, raising the concern that Medicare payment levels could affect where anesthesia practitioners locate and more generally whether interest in anesthesiology as a profession is also affected.
You asked us to examine the difference between Medicare and private payments for anesthesia services, and whether the supply of anesthesiologists in an area relative to the general population is related to the concentration of Medicare beneficiaries in the area. In this report, we describe (1) the extent to which Medicare payments for anesthesia services were lower than private payments across Medicare payment
9MedPAC, Report to the Congress, Medicare Payment Policy (Washington, D.C.: March 2006).
10GAO, Medicare Physician Fees: Geographic Adjustment Indices Are Valid in Design,
but Data and Methods Need Refinement, GAO-05-119 (Washington, D.C.: Mar. 11, 2005).
11GAO, Medicare Physician Services: Use of Services Increasing Nationwide and
Relatively Few Beneficiaries Report Major Access Problems, GAO-06-704 (Washington, D.C.: July 21, 2006). We found that two indicators of access to physician services—the proportion of beneficiaries who received services and the number of services provided to beneficiaries—suggest that Medicare beneficiaries’ access to physician services increased from April 2000 to April 2005.
Page 3 GAO-07-463 Medicare Anesthesia Payments
localities in 2004, (2) whether the supply of anesthesia practitioners across Medicare payment localities in 2004 was related to the differences between Medicare and private payments for anesthesia services or to the concentration of Medicare beneficiaries in these localities, and (3) compensation levels for anesthesia practitioners compared to other health care practitioners in 2005 and trends in the number of anesthesiology residency positions and the number of graduates of nurse anesthesia programs.
To examine the extent to which Medicare payments for anesthesia services were lower than private payments, we used 2004 anesthesia service claims data from two billing companies that bill and track payments from private payers and Medicare on behalf of anesthesia practitioners. The two billing companies together provided billing services on behalf of over 10 percent of all anesthesiologists in the country in 2004. Although the anesthesia service claims data from the two companies may not be generalizeable to all anesthesia services provided by anesthesiologists, billing company officials stated that their claims data were generally representative of other companies that provide billing for anesthesia services and that anesthesia practitioner groups that did not use billing services were not that different from groups that did use billing services.12 We ranked the anesthesia service codes present in the claims data in order of prevalence across the Medicare payment localities represented in the billing companies’ claims data. Based on the rankings and prevalence across localities, we identified a set of seven anesthesia services provided by anesthesiologists alone that were most prevalent and well represented across the Medicare payment localities included in the claims data.13,14 We retained claims data for all seven of these anesthesia
12Due to the proprietary nature of the data and concerns about identification of providers or beneficiaries, billing companies could not provide payment information at a smaller geographic level—for example, the county or zip code level.
13We did not have a sufficient volume of claims for anesthesia services provided by CRNAs alone to include data from CRNA-performed services in our analysis. We also did not include data for anesthesia services provided by anesthesiologists with the involvement of other anesthesia practitioners because the billing information for these services from the two billing companies was not consistent and we therefore determined it to be not reliable.
14In 2004, there were 270 different codes for anesthesia services, which are generally classified according to the general area of surgical intervention receiving anesthesia. Because we did not have claims information for each of these 270 anesthesia services in each Medicare payment locality, we focused our analysis on a set of anesthesia services that were the most prevalent and well represented in our claims file.
Page 4 GAO-07-463 Medicare Anesthesia Payments

services in 41 of Medicare’s 89 payment localities to include in our analyses. See table 1 in appendix I for descriptions of the seven selected anesthesia services. Using these data, we calculated payment differences—that is, the percentage by which Medicare payments were lower than private payments, calculated as the difference between average private and Medicare payments as a percentage of average private payments—for the seven selected anesthesia services in each of the 41 Medicare payment localities.
To determine whether the supply—that is, the number—of anesthesia practitioners was related to the differences between Medicare and private payments for anesthesia services, we examined the correlation between the payment differences for the set of seven anesthesia services provided in the 41 Medicare payment localities and the supply of anesthesia practitioners in the same 41 localities and determined whether they were statistically significant.15 Due to data limitations, our analyses of payment differences were based on anesthesia services performed by anesthesiologists alone. However, we included CRNA supply in our analysis of anesthesia practitioner supply because we had sufficient data on their supply and because they are major providers of anesthesia services to Medicare beneficiaries.16 To estimate the supply of anesthesia practitioners, we used 2004 data from the American Medical Association (AMA), the American Association of Nurse Anesthetists (AANA), the U.S. Census Bureau, and Centers for Medicare & Medicaid Services (CMS) to determine the number of anesthesia practitioners—both anesthesiologists and CRNAs, separately and combined—per 100,000 people. To determine whether the supply of anesthesia practitioners was related to the concentration of Medicare beneficiaries,17 we examined the correlation between the supply of anesthesia practitioners and the concentration of Medicare beneficiaries in the general population across 87 of Medicare’s
15A correlation coefficient measures the strength and direction of linear association between two variables without controlling for the effects of other characteristics as in a multivariate analysis.
16Because we did not have anesthesiology assistant supply data, these providers were excluded from our supply analysis.
17The concentration of Medicare beneficiaries is the percentage of Medicare beneficiaries in the general population.
Page 5 GAO-07-463 Medicare Anesthesia Payments

payment localities and determined whether they were statistically significant.18
To compare compensation levels of anesthesia practitioners with those of certain other physicians and nonphysician practitioners, we obtained 2005 compensation information from the Medical Group Management Association’s (MGMA) Physician Compensation and Production Survey,
2006 Report Based on 2005 Data. The MGMA report contains compensation information for physicians and nonphysician practitioners from MGMA member organizations that participated in the survey. MGMA member organizations include medical group practices from across the country. To examine selected trends in the number of anesthesiology residency positions and in the number of graduates of nurse anesthesia programs, we used data from the National Resident Matching Program (NRMP) and the Council on Certification of Nurse Anesthetists (CCNA).19 We used these data to examine the number of anesthesiology residency positions offered and filled through the NRMP between 2000 and 2006 and to examine trends in the number of newly graduated nurse anesthetists between 1999 and 2006.
Our analyses aggregated data to the Medicare payment locality level and as a result may not capture variations in payment differences, anesthesia practitioner supply, and Medicare beneficiary concentration that might exist below the locality level. Additionally, we do not know if the payment differences, anesthesia practitioner supply, or Medicare beneficiary concentrations calculated at the locality level are representative of all areas within a locality, particularly for localities that encompass entire states. We limited our correlation analyses to determining whether a statistically significant association existed between the supply of anesthesia practitioners and payment differences or Medicare beneficiary concentration. However, practitioners’ decisions on where to locate could be influenced by many other factors and at levels not captured by our analysis at the Medicare payment locality level.
18This correlation analysis included data from the payment localities representing the 50 states and the District of Columbia. We did not consider data from Puerto Rico, the Virgin Islands, and Guam. The analysis was therefore based on data from 87 of Medicare’s 89 payment localities.
19The NRMP places medical school graduates in residencies. Residencies are 3- to 7-year graduate medical programs that physicians in the United States must complete in order to provide direct patient care. NRMP administrators estimate that the program fills approximately 80 to 90 percent of residencies nationwide each year.
Page 6 GAO-07-463 Medicare Anesthesia Payments
To ensure the reliability of the data we used, we interviewed officials from the billing companies and other organizations that provided us with data, and reviewed documentation relating to anesthesia service claims, anesthesia practitioner supply, and Medicare beneficiary information. We tested the internal consistency and reliability of all the data and determined they were adequate for our purposes. For more information on our scope and methodology and on the reliability of our data, see appendix I. We performed our work from September 2004 through May 2007 in accordance with generally accepted government auditing standards.
In 2004, average Medicare payments for a set of seven anesthesia services provided by anesthesiologists alone were lower than average private payments in 41 Medicare payment localities, and ranged, on average, from 51 percent lower to 77 percent lower than private payments. For all 41 payment localities, Medicare payments were lower than private payments by an average of 67 percent. In 2004, average Medicare payments for the set of seven anesthesia services ranged from $177 to $303 across the 41 payment localities, a range of 71 percent. In contrast, average private payments for the same set of seven anesthesia services in that same year ranged from $472 to over $1,300 across these localities, a range of 177 percent.
Results in Brief
In 2004, there was no correlation between the overall supply of anesthesia practitioners—that is, the total number of both anesthesiologists and CRNAs per 100,000 people—and either the difference between Medicare and private insurance payments for anesthesia services or the concentration of Medicare beneficiaries in the Medicare payment localities included in our analyses. However, when we examined the supply of anesthesiologists and CRNAs separately, we found correlations between practitioner supply and payment differences and practitioner supply and beneficiary concentration. Specifically, we found that in 2004, the supply of CRNAs tended to decrease as the difference between Medicare and private insurance payments for anesthesia services increased in 41 Medicare payment localities. We also found that in 2004, the supply of anesthesiologists tended to decrease as the concentration of Medicare beneficiaries increased across 87 Medicare payment localities, while the supply of CRNAs tended to increase as the concentration of Medicare beneficiaries increased across these Medicare payment localities.
For 2005, compensation for anesthesia practitioners was reported to compare favorably with other practitioners, according to information from
Page 7 GAO-07-463 Medicare Anesthesia Payments
medical group practices from across the country that responded to a survey of MGMA member organizations. The 2005 median annual compensation for general anesthesiologists—approximately $354,240—was over 10 percent higher than the median annual compensation for specialists and over twice the compensation for generalists. For 2005, MGMA-reported median annual compensation for CRNAs—approximately $131,400—was over 40 percent higher than the MGMA-reported median annual compensation for either nurse midwives or nurse practitioners and over 35 percent higher than the MGMA-reported median annual compensation for physician assistants. The number of anesthesiology residency positions offered through the NRMP and the number of nurse anesthesia graduates have increased in recent years.
We provided a draft of this report to CMS and to two external commenters for their review. CMS stated that our study provides a good summary of information collected from a variety of sources on anesthesia payments and the supply of anesthesia practitioners. One of the external commenters generally agreed with our findings, while the other agreed with our finding concerning payment differences for anesthesia services but expressed concern with our finding dealing with supply. CMS’ written comments appear in appendix II.
Anesthesia services are generally administered by anesthesia practitioners, such as anesthesiologists and CRNAs. In 2004, there were approximately 42,000 anesthesiologists and 30,000 CRNAs in the United States. Anesthesiologists are physicians who have completed a bachelor’s degree, medical school, and an anesthesiology residency, typically 4 years in length. CRNAs are licensed as registered professional nurses and have completed a bachelor’s degree and a 2- or 3-year nurse anesthesia graduate program. In our prior work, we showed that physician specialists, who include anesthesiologists, tend to locate in metropolitan areas.20,21
Background
20GAO, Physician Workforce: Physician Supply Increased in Metropolitan and
Nonmetropolitan Areas but Geographic Disparities Persisted, GAO-04-124 (Washington, D.C.: Oct. 31, 2003).
21Metropolitan areas are metropolitan statistical areas, primary metropolitan statistical areas, or New England county metropolitan areas as of 2001.
Page 8 GAO-07-463 Medicare Anesthesia Payments

Anesthesia services can be provided in several ways. Anesthesia services can be provided by anesthesiologists alone, by anesthesiologists working with CRNAs or other practitioners,22 or by CRNAs alone. In 2004, proportionally more anesthesia services provided to Medicare beneficiaries were provided by anesthesiologists working as the sole anesthesia practitioner and by anesthesiologists working with another practitioner, such as a CRNA, compared to the proportion of anesthesia services provided by CRNAs as the sole anesthesia practitioner.23
CRNAs can directly bill Medicare for the provision of anesthesia services.24 In order to receive Medicare payment for anesthesia services, CRNAs generally are required to practice under the supervision of a physician or an anesthesiologist, except in states that have obtained an exemption from this requirement from CMS.25 As of May 2007, CMS reports that 14 states had requested and obtained this exemption, which would allow CRNAs to practice independently without physician supervision in a variety of inpatient and outpatient settings.26
22Other practitioners who can be involved in the provision of anesthesia services include anesthesiologist assistants (AAs) and medical residents. AAs are nonphysician anesthesia practitioners who complete a 2-year graduate anesthesia training program and who work only under the direction of anesthesiologists. Medical residents, physicians in graduate medical training, can also be involved in the provision of anesthesia services, but do not receive Medicare Part B reimbursement for their role in providing anesthesia services.
23GAO analysis of 2004 Medicare Part B Extract Summary System (BESS) data.
24Anesthesia services furnished by hospital-employed or contracted CRNAs or AAs at qualified rural hospitals (including critical access hospitals) can be paid on a reasonable cost basis and not under the physician fee schedule.
25Facilities must comply with Medicare Conditions of Participation in order to participate in the Medicare program. Beginning in 2001, CMS provided an exemption allowing CRNAs to practice without physician supervision in hospitals, critical access hospitals, and ambulatory surgical centers, and still receive reimbursement for the anesthesia services they deliver to Medicare beneficiaries. In order for a state to qualify for this exemption, the governor of the state must submit a letter to CMS, attesting that this exemption is in the best interest of the state’s citizens and that the exemption is consistent with state law. See 42 C.F.R. §§ 416.42(d); 482.52(c); 485.639(e).
26The 14 states that have taken this exemption are Alaska, Idaho, Iowa, Kansas, Minnesota, Montana, Nebraska, New Hampshire, New Mexico, North Dakota, Oregon, South Dakota, Washington, and Wisconsin. However, in these states, hospitals, critical access hospitals, and ambulatory surgical centers may independently require physician supervision for CRNAs.
Page 9 GAO-07-463 Medicare Anesthesia Payments

Anesthesiologists derive approximately 28 percent of their income from Medicare.27 CRNAs derive approximately 35 percent of their patient mix from Medicare.28 In the Omnibus Budget Reconciliation Act of 1989,29 Congress required the establishment of a national Medicare physician fee schedule which sets payment rates for services provided by physicians and other practitioners. Under the Medicare physician fee schedule, Medicare payments for anesthesia services are generally the lesser of the actual charge for the service or the anesthesia fee schedule amount. Payments for anesthesia services are subject to the same annual updates as all other services paid under the physician fee schedule. However, Medicare payments for anesthesia services are calculated differently than payments for other services covered by the physician fee schedule. Specifically, Medicare fee schedule payments for anesthesia services are calculated using both “base” and “time” units. The relative complexity of an anesthesia service is measured by base units; the more activities that are involved, the more base units assigned by Medicare.30 The time spent performing an anesthesia service is measured continuously from when the anesthesia practitioner begins preparing the patient for services and ends when the patient may be safely placed in postoperative care and is measured by 15-minute units of time with portions of time units rounded to one decimal place. The sum of the base and time units are converted into a dollar payment amount by multiplying the sum by an anesthesia service-specific conversion factor, which also accounts for regional differences in the cost of providing services.31 As such, each Medicare payment locality has a unique anesthesia conversion factor assigned by CMS.
Medicare’s Calculation of Payments for Anesthesia Services
27J.D.Wassenaar and S.L. Thran, eds. American Medical Association, Physician
Socioeconomic Statistics: 2000 - 2002 Edition (Chicago: 2001).
28The CRNA estimate of percent of patient mix from Medicare is based on informal surveys of AANA members.
29See Pub. L. No. 101-239, §6102(a), 103 Stat. 2106, 2169-84 (1989) (adding §1848 to the Social Security Act) (codified, as amended, at 42 U.S.C. §1395w-4).
30CMS determines its base units largely on the base units formulated by the American Society of Anesthesiologists in its 1988 Relative Value Guide. Medicare’s anesthesia service base units range from 1 to 30 and are uniform nationwide. With the exception of the base units assigned to cataract or iridectomy surgery, all of Medicare’s base units are taken from the Relative Value Guide.
31A conversion factor is a dollar amount that translates a service’s relative value into an actual payment amount. CMS established a separate conversion factor for anesthesia services, apart from the general conversion factor for medical and surgical services.
Page 10 GAO-07-463 Medicare Anesthesia Payments

The calculation of the Medicare payment for an anesthesia service associated with a lens surgery—the most common anesthesia service provided to Medicare beneficiaries in 2004—performed by an anesthesiologist or a CRNA working without another anesthesia practitioner is shown in figure 1. Subject to certain exceptions, Medicare payments for anesthesia services provided by anesthesiologists and CRNAs are equal in most situations.32 For illustrative purposes, we assumed that the service was provided in the Connecticut payment locality and took 21 minutes to perform. In 2004, the total Medicare payment for this service would have been $99.31, which was equal to the product of the anesthesia service conversion factor specific to the locality ($18.39) and the sum of the base and time units associated with the anesthesia service (5.4 total units).
Figure 1: Example of a Medicare Payment for an Anesthesia Service Associated with Lens Surgery in the Connecticut Medicare Payment Locality, 2004
Source: GAO.
$99.31=x $18.395.4 total units
+
The conversion factor in Connecticut’s
Medicare payment locality is$18.39
4 base units for lens surgery
1.4 time units(21 minutes)
Medicarepayment
Note: This hypothetical payment includes beneficiary obligations.
In contrast, Medicare payments for other physician services are calculated using relative value units (RVUs) that correspond to the different resources required to provide physician services. The RVUs are each adjusted to account for geographic differences in the cost of providing services, summed, and then multiplied by a general fee schedule
32Currently, Medicare payments for anesthesia services provided by anesthesiologists alone, by anesthesiologists working with CRNAs, and by CRNAs alone are equivalent. Medicare payments for anesthesiologists and CRNAs involved in the same service may not be equivalent when the anesthesiologist is supervising more than four anesthesia services concurrently.
Page 11 GAO-07-463 Medicare Anesthesia Payments

conversion factor, which is applicable across all Medicare payment localities.
Physicians who bill Medicare for services can accept Medicare’s payment as payment in full (with the exception of the ability to bill a Medicare beneficiary for 20 percent coinsurance plus any unmet deductible). This is known as accepting assignment. Or they may exercise an option to bill a Medicare beneficiary for the difference between Medicare’s payment and its limiting charge. This is known as balance billing.33 High rates of assignment may serve as an indicator of physicians’ willingness to serve Medicare beneficiaries. In April 2004, 99.4 percent of the anesthesia services provided by anesthesiologists to Medicare beneficiaries were provided by anesthesiologists who accepted Medicare payment as payment in full. The anesthesiologists’ assignment rate for anesthesia services was comparable to rates for other hospital-based specialists, such as pathologists (99.4 percent) and radiologists (99.6 percent), and was higher than the rate for all other physicians (98.8 percent).34
In addition to anesthesia services, anesthesiologists and CRNAs can also provide other nonanesthesia types of physician services covered by Medicare. Payments for these other physician services—which can include medical services such as office visits, and procedures such as pain management services—represented approximately 31 percent of anesthesiologists’ and 2 percent of CRNAs’ revenue from Medicare in 2004.35 Because payment for these services is determined by a different formula than anesthesia services, a significant portion of these Medicare payments are closer to private payments levels for the same services, in
Physician Acceptance of Medicare’s Payment as Payment in Full
Anesthesia Practitioners Can also Provide Other Physician Services
33Physicians who sign Medicare participation agreements—referred to as participating physicians—must accept assignment for all the covered services they provide to Medicare beneficiaries. See 42 U.S.C. §1395u(h)(l). Those who do not sign participation agreements—referred to as nonparticipating physicians—can either opt to accept assignment on a service-by-service basis or not at all. Only nonparticipating providers have the option to balance bill. Physicians who balance bill currently cannot charge Medicare beneficiaries more than 115 percent of 95 percent of the Medicare approved amount, or 109.25 percent of the allowed Medicare payment—an amount known as the limiting charge. See 42 U.S.C. §1395u(j). Physicians may decide their participation status on an annual basis.
34GAO analysis of CMS data, April 2004.
35GAO analysis of Medicare BESS data, 2004.
Page 12 GAO-07-463 Medicare Anesthesia Payments

contrast to the difference in payments for anesthesia services. According to a MedPAC-sponsored analysis, the average difference between Medicare and private payments for medical services such as office visits and for procedures provided in 2001 was 5 percent and 25 percent, respectively.36
Market Factors Influence Private Payments
Most private payers, like Medicare, determine payments for anesthesia services using base units, time units, and anesthesia-specific conversion factors. Unlike the Medicare program, however, private payers can set their fees in response to market forces such as managed care prevalence and the extent of competition among providers. For example, private anesthesia conversion factors are generally negotiated between payers and anesthesia practitioners. In addition, some private payers use different methods to determine time units, such as rounding up fractional time units to the next whole number or using 10-minute increments for each time unit, which can result in higher anesthesia payments. When setting payment rates, some private payers also allow higher payments for certain patient-related factors such as extremes in age.
In our prior work we found that private payments for physician services, excluding anesthesia and some other services, differed by about 100 percent between the lowest- and the highest-priced metropolitan areas and were responsive to market forces, such as regional differences in the extent of competition among hospitals and health maintenance organizations’ (HMOs) ability to leverage prices.37 For example, we found that areas with less competition and lower levels of HMO price leverage had higher payments than areas with more competition and greater levels of HMO price leverage. We have also reported that because private payers can adjust their payment levels to account for market forces, their
36Direct Research, LLC, Medicare Physician Payment Rates Compared to Rates Paid by
the Average Private Insurer, 1999 – 2001: A Study Conducted by Direct Research, LLC
for the Medicare Payment Advisory Commission, No. 03-6 (Washington, D.C.: MedPAC, August 2003).
37GAO, Federal Employees Health Benefits Program: Competition and Other Factors
Linked to Wide Variation in Health Care Prices, GAO-05-856 (Washington, D.C.: Aug. 15, 2005).
Page 13 GAO-07-463 Medicare Anesthesia Payments

payment levels vary more than Medicare payments across geographic areas.38
We found that average Medicare payments for a set of seven anesthesia services provided by anesthesiologists alone were lower than average private payments in 41 Medicare payment localities in 2004, and ranged, on average, from 51 percent lower to 77 percent lower than private payments (see fig. 2). For all 41 payment localities, Medicare payments were lower than private payments by an average of 67 percent. In 2004, the average Medicare payment for a set of seven anesthesia services was $216, and the average private payment for the same set of anesthesia services was $658.
Average Medicare Payments for Anesthesia Services Provided by Anesthesiologists Alone Ranged from 51 Percent to 77 Percent Lower than Average Private Payments
Figure 2: Distribution of Percent Difference in Medicare and Private Payments for Seven Anesthesia Services Provided by Anesthesiologists Alone across 41 Medicare Payment Localities, 2004
0
2
4
6
8
10
12
14
75 - 7770 - 7465 - 6960 - 6451 - 59
Number of localities
Source: GAO analysis of 2004 claims data from two anesthesia service billing companies.
Distribution of percent difference in Medicare and private payments, 2004
Medicare payments varied less than private payments across the 41 payment localities. In 2004, average Medicare payments for the set of
38GAO, Medicare Physician Fees: Geographic Adjustment Indices Are Valid in Design,
but Data and Methods Need Refinement, GAO-05-119 (Washington, D.C.: Mar. 11, 2005).
Page 14 GAO-07-463 Medicare Anesthesia Payments
seven anesthesia services ranged from $177 to $303 across the 41 payment localities, a range of 71 percent. In contrast, average private payments for the same set of seven anesthesia services in that same year ranged from $472 to over $1,300 across these localities, a range of 177 percent.
In 2004, there was no correlation between the overall supply of anesthesia practitioners—that is, the total number of both anesthesiologists and CRNAs per 100,000 people—and either the difference between Medicare and private payments for anesthesia services or the concentration of Medicare beneficiaries in the Medicare payment localities included in our analyses.39 However, when we examined the supply of anesthesiologists and CRNAs separately, we found correlations between practitioner supply and payment differences and practitioner supply and beneficiary concentration. Specifically, we found that in 2004, the supply of CRNAs tended to decrease as the difference between Medicare and private payments for anesthesia services increased in 41 Medicare payment localities. We also found that in 2004, the supply of anesthesiologists tended to decrease as the concentration of Medicare beneficiaries increased across 87 Medicare payment localities, while the supply of CRNAs tended to increase as the concentration of Medicare beneficiaries increased across these Medicare payment localities.
We found no correlation between the overall supply of anesthesia practitioners per 100,000 people and the difference in Medicare and private payments for anesthesia services across 41 of Medicare’s payment localities in 2004. The supply of anesthesia practitioners varied across the 41 localities independent of the payment differences in these localities and the payment differences varied independently of the supply of anesthesia practitioners in the localities. When we considered anesthesiologists and CRNAs separately, we found a relationship between the supply of CRNAs and the payment differences for anesthesia services across the 41 Medicare payment localities in 2004. Specifically, there tended to be fewer CRNAs in the localities with the larger differences between Medicare and private payments for anesthesia service. For example, on average, there were about 11.5 CRNAs per 100,000 people in the localities where private
Overall Supply of Anesthesiologists and CRNAs Combined Was Not Correlated with Payment Differences for Anesthesia Services or Concentration of Medicare Beneficiaries
Overall Supply of Anesthesia Practitioners Was Not Correlated with Payment Differences for Anesthesia Services, While Supply of CRNAs Was Related
39The difference between Medicare and private payments for anesthesia services is based on seven anesthesia services provided by anesthesiologists alone in 41 Medicare payment localities in 2004. See app. I for more details.
Page 15 GAO-07-463 Medicare Anesthesia Payments

payments exceeded Medicare payments by about 59 percent, while there were fewer CRNAs—on average, about 7.5 per 100,000 people—in the localities where private payments exceeded Medicare payments by about 73 percent. In contrast, we did not find an association between the supply of anesthesiologists and the differences between Medicare and private payments for anesthesia services across the same 41 localities.
Overall Supply of Anesthesia Practitioners Was Not Correlated with Concentration of Medicare Beneficiaries, While Supply of Anesthesiologists and CRNAs Was Related
We found no correlation between the overall supply of anesthesia practitioners and the concentration of Medicare beneficiaries across 87 Medicare payment localities in 2004. The overall supply of anesthesia practitioners—the number of both anesthesiologists and CRNAs combined per 100,000 people—varied across the 87 localities independent of the number of Medicare beneficiaries in these localities.
We found that the supply of anesthesiologists and the supply of CRNAs were each correlated with the concentration of Medicare beneficiaries across 87 payment localities in 2004. However, we found the opposite relationship between the concentration of Medicare beneficiaries and the supply of anesthesiologists and the supply of CRNAs. We generally found fewer anesthesiologists in localities with a greater concentration of Medicare beneficiaries. For example, in 2004, in localities where on average 17 percent of the population was made up of Medicare beneficiaries, there were 13 anesthesiologists per 100,000 people. For localities where, on average, 11 percent of the population was made up of Medicare beneficiaries, the supply of anesthesiologists was relatively higher at 16 per 100,000 people. In contrast, we generally found more CRNAs in localities with higher concentrations of Medicare beneficiaries. For example, in 2004, on average, there were 14 CRNAs per 100,000 people in localities where the proportion of Medicare beneficiaries was 17 percent, on average, but half that supply—7 CRNAs per 100,000 people—in localities where 11 percent of the population was Medicare beneficiaries. The larger supply of CRNAs in localities with greater concentrations of Medicare beneficiaries appeared to offset the smaller anesthesiologist supply in these localities so that, in total, there was no relationship between the overall supply of anesthesia practitioners and the concentration of Medicare beneficiaries across the 87 localities in 2004.
Page 16 GAO-07-463 Medicare Anesthesia Payments

For 2005, compensation for anesthesia practitioners was reported to compare favorably to that of other physicians and nonphysician practitioners, according to information from medical group practices from across the country that responded to a survey of MGMA member organizations. The 2005 median annual compensation for general anesthesiologists—approximately $354,240—was over 10 percent higher than the median annual compensation for specialists and over twice the compensation for generalists.40,41 When compared to other hospital-based specialists, the MGMA-reported median annual compensation for general anesthesiologists was higher than that for three categories of pathologists and less than that for three categories of radiologists.42 For example, the MGMA-reported median annual compensation for general anesthesiologists was approximately 10 percent higher than the MGMA-reported median annual compensation for anatomic and clinical pathologists. MGMA data also showed that the median annual compensation for pain management anesthesiologists and pediatric anesthesiologists exceeded the median annual compensation for general anesthesiologists and all categories of pathologists and radiologists. Similarly, for 2005, the MGMA-reported median annual compensation for CRNAs—approximately $131,400—was higher than the MGMA-reported median annual compensation for other nonphysician practitioners such as nurse practitioners, nurse midwives, and physician assistants. For
Compensation of Anesthesia Practitioners Was Reported to Compare Favorably with Other Practitioners, and Anesthesiology Residencies and Nurse Anesthesia Graduates Have Increased
40MGMA, Physician Compensation and Production Survey: 2006 Report Based on 2005
Data. The compensation information collected by MGMA is self-reported by practitioners and includes information for employed and contracted physician and nonphysician practitioners. To collect compensation data, MGMA mailed surveys to over 12,000 of its member organizations, which include medical group practices and other types of organizations involved in physician practice management. The response rate was approximately 16 percent. MGMA defines compensation to include the amounts reported on a W-2, 1099, or K1 (for partnerships) plus all voluntary salary reductions. MGMA instructs respondents to include the following sources of compensation: salary, bonus and/or incentive payments, research stipends, honoraria, and distribution of profits.
41In the 2006 MGMA Physician Compensation and Production Survey, “general anesthesiology” referred to anesthesiologists who did not subspecialize. The “all generalist” specialty category included family practice (without obstetrics), internal medicine, and pediatric/adolescent medicine. The “all specialist” category included anesthesiology, cardiology, dermatology, emergency medicine, gastroenterology, hematology/oncology, neurology, obstetrics/gynecology, ophthalmology, orthopedic surgery, otorhinolaryngology, psychiatry, pulmonary medicine, diagnostic radiology, general surgery, and urology.
42MGMA reported compensation for three categories each of anesthesiologists (general, pain management, and pediatric), pathologists (anatomic & clinical, anatomic, and clinical), and radiologists (diagnostic invasive, diagnostic noninvasive, and nuclear medicine). MGMA did not report compensation information for general pathologists or general radiologists.
Page 17 GAO-07-463 Medicare Anesthesia Payments

example, the MGMA-reported median annual compensation for CRNAs was over 40 percent higher than the MGMA-reported median annual compensation for either nurse midwives or nurse practitioners and over 35 percent higher than the MGMA-reported median annual compensation for physician assistants.
The number of anesthesiology residency positions offered through the NRMP and the number of nurse anesthesia graduates have increased in recent years. From 2000 to 2006 the number of residency positions available in anesthesiology through the NRMP increased from 1,005 to 1,311, and the number of these positions that were filled increased from 802 to 1,287. By 2006, the anesthesiology residency match rate—the percentage of positions that have been filled—was 98 percent. This rate was higher than the rate for pathologists, radiologists, and all physicians in 2006. In addition, there has been a significant increase in the number of newly graduated nurse anesthetists. According to the Council on Certification of Nurse Anesthetists (CCNA), in 1999, nurse anesthesia programs produced 948 new graduates; in 2005, that number had increased to 1,790, an overall increase of 89 percent.
We provided a draft of this report to CMS and to two external commenters that represent anesthesia service practitioners; the AANA and the American Society of Anesthesiologists (ASA). CMS’s written comments are reprinted in appendix II.
Agency and External Comments and Our Evaluation
CMS stated that our study provides a good summary of information collected from a variety of sources on anesthesia payments and the supply of anesthesia practitioners but was concerned that our analysis of payment differences for anesthesia services did not include four of the top five Medicare anesthesia services in terms of Medicare payments. CMS noted that private payer rates are not a criterion under the law to determine whether Medicare physician payments are reasonable and stated that the Medicare and private payment differences for anesthesia services do not necessarily indicate a deficiency in Medicare payment rates. CMS also suggested that the report should mention that the services of CRNAs in most rural hospitals and critical access hospitals are paid on a reasonable cost basis—not under the physician fee schedule—and that payments based on reasonable costs could affect Medicare and private payment differences for anesthesia services in these areas.
Page 18 GAO-07-463 Medicare Anesthesia Payments
One of the external commenters generally agreed with our findings. The other external commenter agreed with our finding regarding payment differences for anesthesia services, but like CMS questioned our choice of the anesthesia services included in our analysis of payment differences. This external commenter was also concerned regarding our finding related to supply of anesthesia practitioners and believed that we overestimated the supply of anesthesiologists based on analysis of its own association membership counts. Both external commenters stated that we should have addressed aspects of payments to anesthesia service practitioners that were not included in our analysis. Specifically, one external commenter stated we should have examined the use of stipends by hospitals to augment anesthesiologists’ compensation. The other external commenter stated we should have included analysis of Medicare and private anesthesia service payments to CRNAs, including analysis of anesthesia services during which CRNAs work with anesthesiologists or provide the services as the sole anesthesia practitioner.
We carefully considered which anesthesia services to include in our analysis of Medicare and private payment differences for anesthesia services, but were not able to include all of the high-volume Medicare anesthesia services. In order to calculate the difference between Medicare and private payments for anesthesia services and include the maximum number of localities in our analysis, it was essential to include anesthesia services that were high volume for both Medicare and the private sector. Some anesthesia services that were high volume for Medicare beneficiaries, for example anesthesia for lens surgery, were not as high volume for private patients and were not included for that reason. We agree with CMS that differences between Medicare and private payments for anesthesia services are not a statutory criterion for determining Medicare payments for these services and added this clarification to our report. We also clarified that Medicare payments for CRNA anesthesia services provided in rural and critical access hospitals could be paid on a reasonable cost basis and added a statement to the report stating this fact. However, we did not determine the extent to which Medicare and private payments to CRNAs practicing in rural and critical access hospitals differed as this was beyond the scope of our study.
In response to the external commenter’s concern regarding the accuracy of our estimate of the supply of anesthesiologists, we believe the AMA data that we used to calculate the supply of anesthesiologists represent the most complete and accurate data source for analyzing physician supply, and that the external commenter estimates of supply based on association membership counts may underestimate supply because it is
Page 19 GAO-07-463 Medicare Anesthesia Payments
likely that some anesthesiologists do not belong to the association. Additionally, we checked our calculations regarding the supply of anesthesiologists and verified that we had removed inactive and nonpracticing anesthesiologists from our supply estimates. We did not include a discussion of stipends paid by hospitals to anesthesia service practitioners. Stipends are reported to be paid to a variety of specialists, including anesthesiologists, for several reasons, including to compensate specialists for treating a high proportion of Medicare beneficiaries, 24-hour coverage of trauma units, and to help cover costs associated with treating uninsured patients. As our study focused on Medicare and private payments for anesthesia services and overall compensation for anesthesia practitioners, it was beyond the scope of our study to examine this issue in further detail. We agree with the external commenter that it would have been preferable to include payments for CRNA anesthesia services in our analysis, but were not able to do this due to data limitations.
The external commenters provided us with technical comments and clarifications, which we incorporated as appropriate.
As arranged with your offices, unless you publicly announce the contents
of this report earlier, we plan no further distribution of it until 30 days from the date of this letter. We are sending copies of this report to the Administrator of CMS and interested congressional committees. We will also make copies available to others upon request. The report is available at no charge on the GAO Web site at http://www.gao.gov.
If you or your staffs have any questions, please contact me at (202) 512-7114 or [email protected]. Contact points for our Offices of Congressional Relations and Public Affairs may be found on the last page of this report. Staff members that made major contributions to this report are listed in appendix III.
Kathleen M. King Director, Health Care
Page 20 GAO-07-463 Medicare Anesthesia Payments

Appendix I: S
cope and Methodology
Page 21 GAO-07-463
Appendix I: Scope and Methodology
This appendix describes in detail the data and methods we used to calculate differences in Medicare and private anesthesia service payments, anesthesia practitioner supply, and Medicare beneficiary concentration. It also describes the correlation analyses we conducted to determine the relationship between anesthesia practitioner supply measures, differences in anesthesia service payments, and Medicare beneficiary concentration. Finally, this appendix addresses data reliability issues and limitations related to our studies.
To examine the extent to which Medicare payments for anesthesia services were lower than private payments across Medicare payment localities in 2004,1 we used anesthesia service claims data from two billing companies that bill and track payments from private payers and Medicare and calculated payments by payer for services provided by anesthesiologists alone at the Medicare payment locality level. This provided us with average Medicare and private payments for a set of anesthesia services. We then calculated payment differences—that is, the percentage by which Medicare payments were lower than private payments, calculated as the difference between average private and Medicare payments as a percent of average private payments—for each of the localities included in our analysis.
Difference in Medicare and Private Payments for Anesthesia Services
To calculate the difference between Medicare and private payments for anesthesia services, we used 2004 anesthesia service claims data from two companies that bill private payers and Medicare on behalf of anesthesia practitioners.2 We obtained names of several billing companies from interviews with industry experts who were knowledgeable about industry
1Medicare payments for anesthesia services are paid using a system of “base” and “time” units. The relative complexity of an anesthesia service is measured by base units; the more activities that are involved, the more base units assigned by Medicare. The time spent performing an anesthesia service is measured continuously from when the anesthesia practitioner begins preparing the patient for services and ends when the patient may be safely placed in postoperative care and is measured by 15-minute units of time with portions of time units rounded to one decimal place. The sum of the base and time units are converted into a dollar payment amount by multiplying the sum by an anesthesia service-specific conversion factor, which also accounts for regional differences in the cost of providing services.
2Anesthesia practitioners are likely to use billing companies because they usually provide services in hospital settings and may not have their own private offices or staff to perform billing functions, such as submitting claims to insurers and collecting receivables from patients.
Medicare Anesthesia Payments

Appendix I: Scope and Methodology
billing practices. We chose to use anesthesia service claims data from billing companies because such data contain claims from many different insurers in an area. The two billing companies from which we obtained claims data together provided billing services on behalf of over 10 percent of all anesthesiologists in the country in 2004. Although the anesthesia service claims data from the two companies may not be generalizeable to all anesthesia services provided by anesthesiologists, billing company officials stated that their claims data were generally representative of other companies that provided billing for anesthesia services and that anesthesia practioner groups that did not use billing services were not that different from groups that did use billing services.
The billing companies provided us with claims data for anesthesia services provided in 2004, including payment information for the 27 highest-expenditure anesthesia services paid for by Medicare in 2003, which accounted for approximately 70 percent of Medicare anesthesia service expenditures in 2003.3 The specific information the billing companies provided included data on the type of payer; the anesthesia service code; payment modifiers that specified the type of anesthesia practitioner involved; total minutes of time required to perform the service; payments, including insurer and beneficiary payments; and the Medicare payment locality in which the service was provided. Due to the proprietary nature of the data and concerns about identification of providers or beneficiaries, the billing companies could not provide payment information at a smaller geographic level. Therefore, Medicare payment localities were the smallest areas for which we could examine payments for anesthesia services. Only claims for which fee-for-service Medicare was the payer were included in our calculation of Medicare payments. For our calculation of private payments for these services, we included fee-for-service, preferred provider organization, and managed care claims from all commercial payers. Average payments included payments made by insurers as well as patient obligations such as deductibles and coinsurance payments. Because our study compared Medicare and private payments only, we excluded the billing companies’ claims from other payers of anesthesia services, such as Medicaid and workers’ compensation funds. We also excluded any claims for which we could not definitively identify the payer.
3The 27 highest Medicare expenditure anesthesia services were identified from our analysis of the 2003 Medicare Part B Extract Summary System (BESS) file.
Page 22 GAO-07-463 Medicare Anesthesia Payments
Appendix I: Scope and Methodology
Although both billing companies provided claims data, one company provided information at the individual claims level while the other company provided claims information summarized to the case level. For the individual claims-level data, we excluded claims from the analysis if the average anesthesia service payment was greater than or less than 3 standard deviations from the log of the average anesthesia service payment, specific to each anesthesia service, Medicare payment locality, and payer. We applied similar criteria to anesthesia service conversion factors (which we calculated as the total payment for the service divided by the sum of the base and time units associated with the service) in the individual claims-level data. Because data from the other company were summarized, we were not able to apply similar exclusion criteria. Instead, prior to providing the claims data to us, the billing company excluded claims if an individual Medicare or private anesthesia service payment was less than 10 percent of the Medicare allowable payment for the locality in which the service was provided or if the receivable was greater than $50.4,5 We excluded claims paid by Medicare from the data provided by either billing company if the Medicare anesthesia conversion factor did not match any of the Centers for Medicare & Medicaid Services’ (CMS) established conversion factors, based on the localities present in the data. We examined descriptive statistics for both data sets after all exclusions were applied and determined that it would be appropriate to merge the two data sets to calculate payment differences.
After applying these and other exclusion criteria, we ranked the anesthesia service codes in order of prevalence across the Medicare payment localities represented in the billing companies’ claims data. Based on the rankings and prevalence across localities, we identified a set of seven anesthesia services that were most prevalent and well represented across the Medicare payment localities included in the claims data. We balanced the need for maximizing the number of localities with having a set of anesthesia services that were prevalent in all of the localities chosen. In our final data set we retained billing company claims data for all seven of
4The receivable was the difference between the insurer-specific allowable and the received payment.
5A receivable less than 10 percent of the Medicare allowable for the locality or greater than $50 would indicate that the claim had not been fully paid by the insurer or the patient.
Page 23 GAO-07-463 Medicare Anesthesia Payments

Appendix I: Scope and Methodology
these anesthesia services in 41 different Medicare payment localities.6 These seven anesthesia services were services provided by anesthesiologists only. We did not have a sufficient volume of claims for anesthesia services provided by certified registered nurse anesthetists (CRNAs) alone to include data from CRNA-performed services in our analysis. We also did not include data for anesthesia services provided by anesthesiologists with the involvement of other anesthesia practitioners because the billing data for these services from the two billing companies were not consistent and we therefore determined them to be not reliable.
Medicare and private payments were both weighted to account for the relative national expenditures for each of the seven anesthesia services by Medicare in 2003 (see table 1). For example, because anesthesia services for intraperitoneal procedures in the upper abdomen including laparoscopy accounted for approximately one-third of Medicare expenditures for the seven selected codes combined, approximately one-third of the overall average payment we calculated for each locality was based on payments for this service. There were far fewer Medicare expenditures associated with anesthesia for hernia repairs in the lower abdomen, not otherwise specified and therefore payments for these services had a much smaller weight in overall average payment calculations. Over 136,000 Medicare and private anesthesia service cases were included in our calculation of payment differences.
6The 41 payment localities included in the payment difference analysis include 13 localities which are whole states, 18 urban and/or suburban areas, and 10 additional statewide areas (not including already specified urban and/or suburban areas). Nine of the localities are located in the U.S. Census region of the West, while 8 are represented in the Midwest region. The South and Northeast regions each had 12 localities.
Page 24 GAO-07-463 Medicare Anesthesia Payments
Appendix I: Scope and Methodology
Table 1: Description, Number of Cases, and Weights for Seven Anesthesia Services included in Calculation of Anesthesia Service Payment Difference
Anesthesia service description
Number of cases in claims
data set
Weight based on Medicare
expenditures
Anesthesia for intraperitoneal procedures in upper abdomen including laparoscopy; not otherwise specified 27,447 .32
Anesthesia for intraperitoneal procedures in lower abdomen including laparoscopy; not otherwise specified 35,664 .22
Anesthesia for procedures on the integumentary system on the extremities, anterior trunk and perineum, not otherwise specified 23,318 .12
Anesthesia for transurethral procedures (including urethrocystoscopy); not otherwise specified 12,783 .09
Anesthesia for open procedures on bones of lower leg, ankle, and foot; not otherwise specified 16,827 .09
Anesthesia for all procedures on esophagus, thyroid, larynx, trachea, and lymphatic system of neck; not otherwise specified, age 1 year or older 8,340 .09
Anesthesia for hernia repairs in lower abdomen; not otherwise specified 11,930 .07
Total 136,309 1.00
Sources: American Medical Association, Current Procedural Terminology, CPT 2003; GAO analysis of 2004 claims data from two anesthesia service billing companies; and GAO analysis of BESS data, 2003.
Using the weighted average Medicare and private payments, we calculated payment differences for each of the 41 Medicare payment localities included in our analysis. We also calculated an overall average payment difference inclusive of data from all 41 localities.
To examine a payment variable that was not influenced by variation in time,7 we examined the difference in conversion factors for Medicare and private anesthesia services, using the seven services provided by anesthesiologists in the 41 Medicare payment localities. The average difference in conversion factors was 69 percent, an amount very similar to the difference in Medicare and private payments. Therefore, we focused our analyses on the difference in Medicare and private payments.
7Because time units vary depending on the length of anesthesia time associated with a surgical procedure, Medicare payment for the same anesthesia service provided in two different surgeries will be different if the associated anesthesia time is different. The conversion factor for an anesthesia service, unlike the payment for an anesthesia service, is not influenced by variation in the time required to provide the service.
Page 25 GAO-07-463 Medicare Anesthesia Payments

Appendix I: Scope and Methodology
To estimate anesthesia practitioner supply at the locality level, we used data from the American Medical Association (AMA), the American Association of Nurse Anesthetists (AANA), the U.S. Census Bureau, and CMS. Only active anesthesiologists and CRNAs practicing in the 50 states and the District of Columbia were included in our analysis.8,9 We assigned anesthesia practitioners and the number of total U.S. general population residents to 87 Medicare payment localities.10, ,11 12 To determine supply per 100,000 people, we divided the number of anesthesia practitioners in each locality by the total resident population in the same locality, multiplied by 100,000. (See table 2).
Supply of Anesthesia Practitioners
Table 2: Average and Range of Anesthesia Practitioner Supply per 100,000 People, 2004
Anesthesia practitioner supply per 100,000 people Average Minimum Maximum
Anesthesiologist supply 15.12 4.32 46.91
CRNA supply 10.47 1.66 31.52
Total anesthesia practitioner supply 25.59 12.47 52.15
Source: GAO analysis of AMA, AANA, U.S. Census Bureau, and CMS data.
Note: N=87 Medicare payment localities.
8Anesthesiologists were considered active if they were currently practicing, not employed by the federal government, and involved in direct patient care.
9Anesthesiologists were identified in the AMA database if they listed their major specialty as anesthesiology, pain management, critical care anesthesiology, or pediatric anesthesiology.
10Only 87 of CMS’s 89 payment localities were included because our analysis was restricted to the 50 states and the District of Columbia. Therefore, the localities of Puerto Rico and the Virgin Islands were excluded. Though Hawaii and Guam share a locality, Guam was also excluded separately.
11Only resident population data from the 50 states and the District of Columbia were used in our analysis.
12Observations without a reliable geographic locator were excluded.
Page 26 GAO-07-463 Medicare Anesthesia Payments

Appendix I: Scope and Methodology
To estimate the concentration of Medicare beneficiaries at the locality level, we used CMS and U.S. Census Bureau data. Using a geographic crosswalk file, we assigned the number of beneficiaries enrolled in Medicare and the number of total U.S. general population residents to Medicare payment localities. We then computed the percentage of Medicare beneficiaries in the general population to estimate the concentration of Medicare beneficiaries in each Medicare payment locality. (See table 3).
Table 3: Average and Range of Medicare Beneficiary Concentration, 2004
Variable Average Minimum Maximum
Medicare beneficiary concentration (percent) 14 8 20
Source: GAO analysis of U.S. Census Bureau and CMS data.
Note: N=87 Medicare payment localities.
To measure the relationship between the supply of anesthesia practitioners, the difference in average Medicare and private payments, and the concentration of Medicare beneficiaries at the locality level, we performed correlation analyses. A correlation coefficient measures the strength and direction of linear association between two variables without controlling for the effects of other characteristics as in a multivariate analysis.13
Concentration of Medicare Beneficiaries
Correlation Analysis
We calculated correlations between three measures of anesthesia practitioner supply—anesthesiologists, CRNAs, and total (anesthesiologists and CRNAs combined)—and differences in payments in 41 Medicare payment localities. We also calculated correlations between the three supply measures and the concentration of Medicare beneficiaries in 87 Medicare payment localities. (See tables 4 and 5 below.)
13Correlation coefficients may be negative (as one variable increases, the other decreases) or positive (as one variable increases, the other variable also increases). They range from -1.0, indicating a perfectly negative association, to +1.0, indicating a perfectly positive association. A correlation coefficient of 0 indicates no association.
Page 27 GAO-07-463 Medicare Anesthesia Payments

Appendix I: Scope and Methodology
Table 4: Correlation Coefficients between Supply of Anesthesia Practitioners and Average Medicare and Private Payment Differences, by Medicare Payment Locality, 2004
Payment differences
Anesthesia practitioner supply Correlation coefficients
Anesthesiologist 0.16
CRNA -0.35**
Total anesthesia practitioner -0.09
Sources: GAO analysis of anesthesia service claims data from two billing companies, AMA, AANA, U.S. Census Bureau, and CMS.
Notes: N=41 Medicare payment localities. ** = statistically significant at the 5 percent level.
Table 5: Correlation Coefficients between Supply of Anesthesia Practitioners and Medicare Beneficiary Concentration, by Medicare Payment Locality, 2004
Medicare beneficiary concentration
Anesthesia practitioner supply Correlation coefficients
Anesthesiologist -0.21*
CRNA 0.40***
Total anesthesia practitioner 0.14
Sources: GAO analysis of AMA, AANA, U.S. Census Bureau, and CMS.
Notes: N=87 Medicare payment localities.
* = statistically significant at the 10 percent level.
*** = statistically significant at the 1 percent level.
We used a variety of data sources in our analysis, including anesthesia service claims data from two billing companies, the AMA, the AANA, the U.S. Census Bureau, CMS, the National Resident Matching Program (NRMP), and the Medical Group Management Association (MGMA). We tested the internal consistency and reliability of all our data sources and determined they were adequate for our purposes. The files containing the billing company data, which were used by the two companies to record bills and payments, were subjected to various internal controls, including spot checks, batch totals, and balancing controls as reported by the two companies. Although we did not review these internal controls, we did assess the reliability of the billing company data. We conducted extensive interviews with representatives from both companies to gain an understanding of the completeness and accuracy of the data the companies provided. We also reviewed all information provided to us concerning the data, including data dictionaries and file layouts.
Data Reliability and Study Limitations
Page 28 GAO-07-463 Medicare Anesthesia Payments

Appendix I: Scope and Methodology
Additionally, we examined the data for errors, missing values, and values outside of expected range and computed payment differences from each company’s data separately and found them to be comparable. Finally, we determined that our calculation of anesthesia service payment differences was comparable with the results of a MedPAC-sponsored study. We also assessed the reliability of median compensation information reported by MGMA. Although multiple compensation surveys are available, we chose to use MGMA as our data source because it has been used as a source in a number of peer-reviewed articles, and it contains comprehensive information on various aspects of physician compensation. Through interviews with MGMA officials, we learned of the steps taken by MGMA to ensure the reliability of the data the association published on median compensation, including comparisons with other industry studies on physician and nonphysician compensation and year-to-year analyses of respondents.
We identified several potential limitations of our analyses. First, while we used payment data from 41 different Medicare payment localities, we do not know if the payment data are representative of all 89 of Medicare’s payment localities. Second, we did not have sufficient payment information to calculate payment differences for anesthesia services provided by anesthesiologists working with other anesthesia practitioners or anesthesia services provided solely by CRNAs. As a result, we do not know if payment differences for services provided in these ways would have been different than payment differences for anesthesia services provided by anesthesiologists alone. Third, we limited our analyses to determining whether the supply of anesthesia practitioners was linearly associated with payment differences or Medicare beneficiary concentration. However, practitioners’ decisions on where to locate could be influenced by many other factors not included in our analyses. We also identified potential limitations with MGMA’s compensation data. The data were based on a survey of MGMA member organizations which are reported to overrepresent large medical groups. In addition, the MGMA survey response rate of 16 percent raises the possibility that their compensation data may not be representative of the compensation of all physician and nonphysician practitioners. We performed our work from September 2004 through May 2007 in accordance with generally accepted government auditing standards.
Page 29 GAO-07-463 Medicare Anesthesia Payments

Appendix II: Comments from the Centers for
Medicare & Medicaid Services
Appendix II: Comments from the Centers for Medicare & Medicaid Services
Page 30 GAO-07-463 Medicare Anesthesia Payments

Appendix II: Comments from the Centers for
Medicare & Medicaid Services
Page 31 GAO-07-463 Medicare Anesthesia Payments
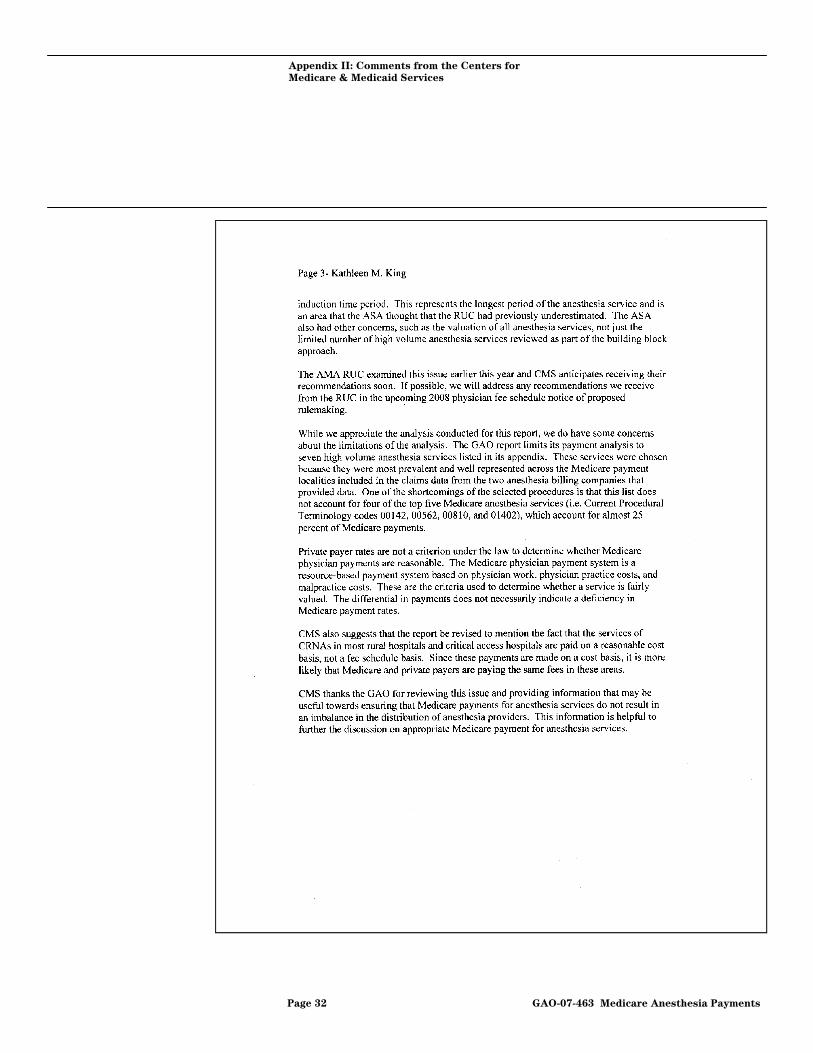
Appendix II: Comments from the Centers for
Medicare & Medicaid Services
Page 32 GAO-07-463 Medicare Anesthesia Payments
Appendix III: GAO
Contacts and Staff Acknowledgments
Page 33 GAO-07-463
Appendix III: GAO Contacts and Staff Acknowledgments
Kathleen M. King, (202) 512-7114 or [email protected]
In addition to the contact named above, Christine Brudevold, Assistant Director; Stella Chiang; Krister Friday; Jawaria Gilani; and Ba Lin made key contributions to this report.
GAO Contacts
Acknowledgments
Medicare Anesthesia Payments

Related GA
O Products
Page 34 GAO-07-463
Related GAO Products
Medicare Physician Services: Use of Services Increasing Nationwide
and Relatively Few Beneficiaries Report Major Access Problems. GAO-06-704. Washington, D.C.: July 21, 2006.
Federal Employees Health Benefits Program: Competition and Other
Factors Linked to Wide Variation in Health Care Prices. GAO-05-856. Washington, D.C.: August 15, 2005.
Medicare Physician Fees: Geographic Adjustment Indices Are Valid in
Design, but Data and Methods Need Refinement. GAO-05-119. Washington, D.C.: March 11, 2005.
Physician Workforce: Physician Supply Increased in Metropolitan and
Nonmetropolitan Areas but Geographic Disparities Persisted. GAO-04-124. Washington, D.C.: October 31, 2003.
(290414) Medicare Anesthesia Payments
GAO’s Mission The Government Accountability Office, the audit, evaluation and investigative arm of Congress, exists to support Congress in meeting its constitutional responsibilities and to help improve the performance and accountability of the federal government for the American people. GAO examines the use of public funds; evaluates federal programs and policies; and provides analyses, recommendations, and other assistance to help Congress make informed oversight, policy, and funding decisions. GAO’s commitment to good government is reflected in its core values of accountability, integrity, and reliability.
The fastest and easiest way to obtain copies of GAO documents at no cost is through GAO’s Web site (www.gao.gov). Each weekday, GAO posts newly released reports, testimony, and correspondence on its Web site. To have GAO e-mail you a list of newly posted products every afternoon, go to www.gao.gov and select “Subscribe to Updates.”
The first copy of each printed report is free. Additional copies are $2 each. A check or money order should be made out to the Superintendent of Documents. GAO also accepts VISA and Mastercard. Orders for 100 or more copies mailed to a single address are discounted 25 percent. Orders should be sent to:
U.S. Government Accountability Office 441 G Street NW, Room LM Washington, D.C. 20548
To order by Phone: Voice: (202) 512-6000 TDD: (202) 512-2537 Fax: (202) 512-6061
Contact:
Web site: www.gao.gov/fraudnet/fraudnet.htm E-mail: [email protected] Automated answering system: (800) 424-5454 or (202) 512-7470
Gloria Jarmon, Managing Director, [email protected] (202) 512-4400 U.S. Government Accountability Office, 441 G Street NW, Room 7125 Washington, D.C. 20548
Paul Anderson, Managing Director, [email protected] (202) 512-4800 U.S. Government Accountability Office, 441 G Street NW, Room 7149 Washington, D.C. 20548
Obtaining Copies of GAO Reports and Testimony
Order by Mail or Phone
To Report Fraud, Waste, and Abuse in Federal Programs
Congressional Relations
Public Affairs
PRINTED ON RECYCLED PAPER