GAMMA’S PORTABLE RADAR INTERFEROMETER - FIG · GAMMA’S PORTABLE RADAR INTERFEROMETER Charles...
10
1 GAMMA’S PORTABLE RADAR INTERFEROMETER Charles WERNER, Tazio STROZZI, Andreas WIESMANN, and Urs WEGMÜLLER Gamma Remote Sensing AG, Switzerland Abstract: Satellite interferometry has been used extensively for ground-motion monitoring with good success. In the case of landslides, for example, space-borne SAR interferometry has a good potential to get an overview on the slope stability. The role of a space-borne INSAR as an element in a landslide or rock fall warning system is constrained by the specific space-borne SAR imaging geometry, the typical multiple-week repeat-interval, and uncertainties in the data availability. Most of these limitations can be overcome with an in situ radar imaging system. GAMMA has developed a portable radar interferometer that utilizes real-aperture antennas to obtain high azimuth resolution. Images are acquired line by line while rotating the transmitting and receiving antennas about a vertical axis. Phase differences between successive images acquired from the same location are used to determine line-of- sight displacements. The instrument operates at 17.2 GHz and has measurement sensitivity better than 1 mm. The instrument uses two receiving antennas with a short baseline to form an interferometer. Phase differences between simultaneous acquisitions by these antennas are used to calculate the precise look angle relative to the baseline, permitting derivation of the surface topography. Expected statistical noise in the height measurements is on the order of 1 meter. In this contribution the design, measurement principles and characteristics of GAMMA’s Portable Radar Interferometer are presented. 1. INTRODUCTION Satellite interferometry has been used extensively for ground-motion monitoring with good success. In the case of landslides space-borne SAR interferometry has good potential to obtain an overview of slope stability. Furthermore, relatively slow, temporally uniform movements can be quantitatively monitored from space. Of particular interest is the two dimensional coverage potentially achieved and that there are rich data archives readily available to be explored for the time after 1991. The results achieved have caught the interest of a relatively wide user community involved in a broad range of applications. Nevertheless, some important requirements cannot be met by satellite SAR interferometry. Given the typical multiple-week repeat-interval, some uncertainties what concerns the data availability, some delay in getting the data as well as limitations related to the SAR imaging geometry, signal decorrelation and other problems this technique is for example clearly not sufficient as a landslide or rock fall warning system. In other cases the spatial resolution or the sensitivity of the space-borne INSAR technique may be insufficient.
Transcript of GAMMA’S PORTABLE RADAR INTERFEROMETER - FIG · GAMMA’S PORTABLE RADAR INTERFEROMETER Charles...

1
GAMMA’S PORTABLE RADAR INTERFEROMETER
Charles WERNER, Tazio STROZZI, Andreas WIESMANN, and Urs WEGMÜLLER
Gamma Remote Sensing AG, Switzerland
Abstract: Satellite interferometry has been used extensively for ground-motion monitoring with good success. In the case of landslides, for example, space-borne SAR interferometry has a good potential to get an overview on the slope stability. The role of a space-borne INSAR as an element in a landslide or rock fall warning system is constrained by the specific space-borne SAR imaging geometry, the typical multiple-week repeat-interval, and uncertainties in the data availability. Most of these limitations can be overcome with an in situ radar imaging system. GAMMA has developed a portable radar interferometer that utilizes real-aperture antennas to obtain high azimuth resolution. Images are acquired line by line while rotating the transmitting and receiving antennas about a vertical axis. Phase differences between successive images acquired from the same location are used to determine line-of-sight displacements. The instrument operates at 17.2 GHz and has measurement sensitivity better than 1 mm. The instrument uses two receiving antennas with a short baseline to form an interferometer. Phase differences between simultaneous acquisitions by these antennas are used to calculate the precise look angle relative to the baseline, permitting derivation of the surface topography. Expected statistical noise in the height measurements is on the order of 1 meter. In this contribution the design, measurement principles and characteristics of GAMMA’s Portable Radar Interferometer are presented.
1. INTRODUCTION
Satellite interferometry has been used extensively for ground-motion monitoring with good success. In the case of landslides space-borne SAR interferometry has good potential to obtain an overview of slope stability. Furthermore, relatively slow, temporally uniform movements can be quantitatively monitored from space. Of particular interest is the two dimensional coverage potentially achieved and that there are rich data archives readily available to be explored for the time after 1991. The results achieved have caught the interest of a relatively wide user community involved in a broad range of applications. Nevertheless, some important requirements cannot be met by satellite SAR interferometry. Given the typical multiple-week repeat-interval, some uncertainties what concerns the data availability, some delay in getting the data as well as limitations related to the SAR imaging geometry, signal decorrelation and other problems this technique is for example clearly not sufficient as a landslide or rock fall warning system. In other cases the spatial resolution or the sensitivity of the space-borne INSAR technique may be insufficient.

2
In recent years several in situ radars have been developed and used for applications including measurement of landslides and volcanoes [1, 2]. To achieve good azimuth resolution these systems acquire data along a linear track to form a synthetic aperture. These systems are clearly complementary to the space-borne technique and show good potential. Furthermore, laser scanners and photogrammetry systems are being used for similar purposes.
2. MOTIVATION FOR TERRESTRIAL INTERFEROMETRIC OBSERVAT IONS
In our contacts with important users of slope and rock instability information we identified a significant demand for two-dimensional, readily available and accurate measurements. Over the last years ground-based SAR instruments used for this purpose demonstrated a good potential for deformation mapping and monitoring. An important aspect is that these in situ instruments can be used more specifically to monitor landslides, rock falls, or infrastructure than space-borne systems. The observation geometry and observation times can more freely be selected and can be used to optimise the measurements for the specific case. The ground-based radar instruments are also quite complementary to ground-based laser scanners. Strengths of the radar systems can measure up to several km in distance and have high sensitivity for measurements of motion. Another important advantage is that the correspondence of repeat measurements is very well controlled through the coherence of the interferograms.
Considering this potential we decided to develop a ground-based radar system for this purpose. In our design we included some new concepts to optimise the performance of the instrument. Important design objectives which were only partially realized in previous instruments include:
• Similar spatial resolution as existing ground based radar systems • Similar deformation sensitivity as existing ground based radar systems • Similar or better applicability range as existing ground based radar systems • System shall be portable • Coverage of a wide view angle in a single image • Reduction of image acquisition time • Measurement of topography as an additional product, but also for use in the
georeferencing of the deformation results •
Taking this into account we came to the instrument described in the following.
3. INSTRUMENT DESCRIPTION
As a consequence, GAMMA has developed a portable radar interferometer (Figures 1 and 2). Unlike previous terrestrial radar instruments [1,2] it does not use aperture synthesis to obtain good azimuth resolution. Our instrument uses real-aperture antennas, 2 meters in length. There is one antenna used to transmit and two receiving antennas. The three antennas are mounted parallel to one another on a rigid 1 meter high tower mounted on a precision rotational scanner. The radar image is built up line by line by azimuthally rotating the antennas about the vertical axis. The two receiving antennas are separated vertically forming a spatial interferometer useful for measurement of height information.

3
Each antenna is mounted in a carbon-fibre truss designed to both light and rigid. Curvature of the antennas beyond a few mm could seriously degrade the image resolution. The antenna positions can be adjusted vertically and there is the facility to slightly change the rotational angle of one antenna with respect to the central antenna for precise pointing. The antennas can be tilted vertically to illuminate the region of interest. In elevation, the antennas have a beamwidth of approximately 45 degrees.
In addition to the antennas and scanner, the instrument has a digital chirp generator, a microwave assembly that contains the transmitter and 2 independent receivers, an analog to digital converter (ADC), and a laptop computer. The laptop computer controls the data acquisition and is used for later data analysis.
A relatively high radar frequency of 17.2 GHz was chosen both to obtain good azimuth resolution and high sensitivity to motion. A temporary permit has been obtained from the governmental communications office to operate at this frequency in Switzerland
The instrument is portable and can be battery operated. The installation effort is relatively small and individual measurements can be taken in less than 15 minutes for an 80 degree scan.
4. 2D IMAGE GENERATION
The radar is obtains range resolution using the FM-CW (Frequency Modulated-Continuous Wave) technique that is especially well suited for near-range imaging. Azimuth resolution is obtained using narrow-beam antennas.
4.1. FM-CW radar
The radar uses the FM-CW approach to obtain range resolution. A linear frequency ramp is transmitted that covers the frequency range of 17.1 to 17.2 GHz. The range resolution of the radar δr is determined by the 200 MHz bandwidth and is equal to approximately 75 cm.
B
cr 2
≈δ (1)
This chirp signal is generated using a direct digital synthesizer and is translated to 2.15 GHz using a frequency translation loop. The chirp is then multiplied by a factor of 8 to operating frequency and amplified. Transmitter output power is 63 mW. The duration of the chirp can be programmed in the range 256 micro-seconds to 8 ms.
FM-CW radars work best at relatively close range where the echo is received simultaneously while transmitting. For this reason the instrument has separate receive and transmit antennas. Given that the chirp is linear, there will be a constant frequency offset between the transmitted and echo chirp signals that is dependent on the slant range ρ:
cT
Bf
ρ2=∆ (2)
The echo consists of returns for scatterers in the scene with various delay times τ=2ρ/c that are dependent on the slant range. Consequently, each of the echoes has a different frequency offset where Τ is the chirp duration, and B is the bandwidth as shown in Figure 3. Processing the data to get a range profile is obtained by performing an FFT on the data samples.

4
Figure 1 - Portable Radar Interferometer Hardware components
Figure 2 - Deployed radar interferometer showing the rotational scanner, antenna support structure, antennas, and microwave assembly.
Figure 3 - Relationship between FM-CW radar transmitted and received signals. The time delay translates into a frequency difference ∆f.
In the receiver, the input signals are amplified and mixed with the transmitted chirp. The difference signal has a bandwidth of several MHz depending on the range chirp rate and distance. The video amplifier after the mixer has a low frequency cutoff to suppress signals due to direct coupling between the transmit and receive antennas and from scatterers located close to the radar. The particular chirp chosen for an application depends on the nearest range of interest. Near range imaging uses the shorter chirp signals, while far range imaging
τ
Transmit Frequency
Time
Chirp Duration ΤΤΤΤ ~2ms
B
Echoes
Transmit Chirp ∆∆∆∆f
c
ρτ 2=
5
applications use the longer duration chirps. The output of the video amplifiers is digitized at sample rate of 10 MHz and stored in the laptop computer for later analysis.
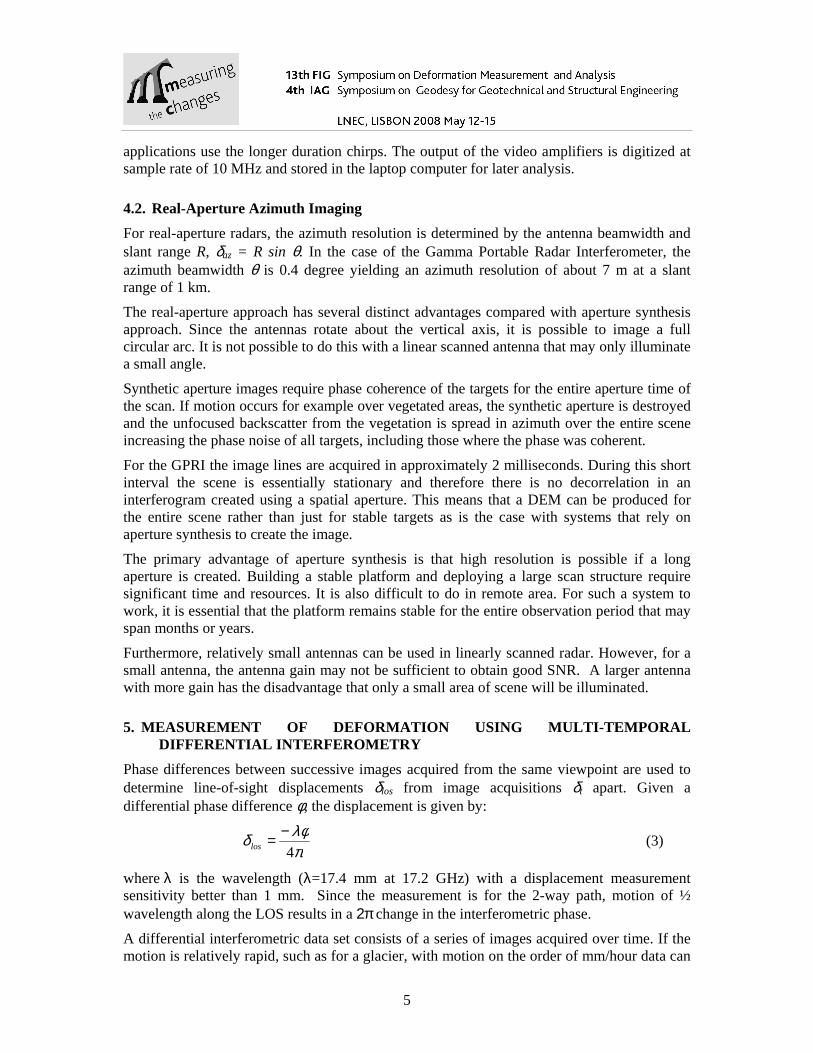
4.2. Real-Aperture Azimuth Imaging
For real-aperture radars, the azimuth resolution is determined by the antenna beamwidth and slant range R, δaz = R sin θ. In the case of the Gamma Portable Radar Interferometer, the azimuth beamwidth θ is 0.4 degree yielding an azimuth resolution of about 7 m at a slant range of 1 km.
The real-aperture approach has several distinct advantages compared with aperture synthesis approach. Since the antennas rotate about the vertical axis, it is possible to image a full circular arc. It is not possible to do this with a linear scanned antenna that may only illuminate a small angle.
Synthetic aperture images require phase coherence of the targets for the entire aperture time of the scan. If motion occurs for example over vegetated areas, the synthetic aperture is destroyed and the unfocused backscatter from the vegetation is spread in azimuth over the entire scene increasing the phase noise of all targets, including those where the phase was coherent.
For the GPRI the image lines are acquired in approximately 2 milliseconds. During this short interval the scene is essentially stationary and therefore there is no decorrelation in an interferogram created using a spatial aperture. This means that a DEM can be produced for the entire scene rather than just for stable targets as is the case with systems that rely on aperture synthesis to create the image.
The primary advantage of aperture synthesis is that high resolution is possible if a long aperture is created. Building a stable platform and deploying a large scan structure require significant time and resources. It is also difficult to do in remote area. For such a system to work, it is essential that the platform remains stable for the entire observation period that may span months or years.
Furthermore, relatively small antennas can be used in linearly scanned radar. However, for a small antenna, the antenna gain may not be sufficient to obtain good SNR. A larger antenna with more gain has the disadvantage that only a small area of scene will be illuminated.
5. MEASUREMENT OF DEFORMATION USING MULTI-TEMPORAL DIFFERENTIAL INTERFEROMETRY
Phase differences between successive images acquired from the same viewpoint are used to determine line-of-sight displacements δlos from image acquisitions δt apart. Given a differential phase difference φ, the displacement is given by:
πλφδ
4
−=los (3)
where λ is the wavelength (λ=17.4 mm at 17.2 GHz) with a displacement measurement sensitivity better than 1 mm. Since the measurement is for the 2-way path, motion of ½ wavelength along the LOS results in a 2π change in the interferometric phase.
A differential interferometric data set consists of a series of images acquired over time. If the motion is relatively rapid, such as for a glacier, with motion on the order of mm/hour data can

6
be acquired on a single day. Otherwise, for slower moving features, several months may pass between observations. Ideally, the images are acquired from exactly the same position such that there is no phase signal due to topography. The basic geometry for interferometric data acquisition is shown in Figure 4.
Figure 4: Interferometric image geometry showing the baseline B with parallel and perpendicular components and the slant range vectors ρ1 and ρ2.
The images acquired from position 1 are from position 2 are precisely coregistered and the phase difference between the complex image samples is calculated. The contributions of the differential phase φ in the interferogram are:
(4)
Where the φtopo is due the topographic component, φdispl is the displacement phase, φatmos is the atmospheric phase and φnoise is thermal noise. The sensitivity of the topographic related errors is determined by the size of the baseline since the topographic phase is given by:
(5)
In the GPRI the residual baseline is on the order of 1 cm and appears as a range phase ramp. Given an existing DEM, or a height model determined using the GPRI spatial interferometer, it is possible to estimate this small baseline and subtract the topographic signal.
The principle source of error for differential interferometry is due to variations in the path delay due to changes in temperature, pressure and humidity [3, 4]. In this regard in situ radar measurements are advantageous because many observations can be combined using stacking or time series analysis methods [5]. Assuming that the deformation process is constant the average velocity iδ& of pixel i given N interferograms with time intervals tj is given by:
(6)
Br
1ρ
2ρ
⊥B
Position 2
Position 1
||Bγ
noiseatmosdispl
noiseatmosdispltopo
rrB φλπ
λπ
λπφ
φφφφφ
+++=
+++=
444||
4
⊥−= Bd
d
λπ
θφ
( ) ∑∑==
∆
∆−
≈∆
∆=
N
jjjijii
N
j j
iji tt
t
t
1
22
,
2
12
44
var4
δλπφ
πλδ
φπλδ &&&

7
In the GPRI there are actually two differential interferograms acquired given that there are two receiving channels. The complex interferograms from each of these channels can be averaged to improve the SNR. However, since the atmospheric phase delay and topographic phase errors are nearly identical, the average counts as a single observation in Equations 6.
The phase data must be unwrapped to be interpreted as distance. Phase unwrapping is defined as the process of adding integer multiples of 2π to the wrapped phase values to become a continuous function that is directly proportional to the difference in path length. A constant phase offset must also be estimated to take into account various relative delays in the electronics between channels or observations. For phase unwrapping to be successful, the targets should only move a fraction of a wavelength between observations. The constant phase offset can be determined using 1 or more control points in the scene where there is no deformation between observations.
6. DEM GENERATION WITH INTEROMETRY USING A SPATIAL BAS ELINE
The portable interferometer has been constructed with two independent receivers in order that signals can be received using two antennas with a fixed offset to form a spatial interferometer. This baseline is currently set to 15 cm, but could be extended to 85 cm with the current tower configuration. The phase difference of the images received by the two receiving antennas can be used to precisely measure the elevation angle γ relative to the baseline. Given the baseline geometry, including the length and orientation, it is then possible to determine the 3D position of each scatterer in the scene [6]. The geometry of the GPRI is close to ideal for measuring heights because the vertical antenna baseline is close to perpendicular to the observation direction.
The solution of the 3-dimensional position of each point Pr
relative to a reference position1Pr
on the antenna tower is obtained using the known baseline vectorBr
, slant-range ρ, rotational azimuth angle θ, and the elevation angle γ of the point derived using the interferometric phase φ. To begin, construct a Cartesian coordinate system with the baseline is along the z axis, and parallel to the rotation axis. The x and y axes of this system are perpendicular and lie in the plane perpendicular to the rotation axis. The x-axis of the local system points in the direction of the antenna beam at the centre of the imaging arc. The radar information as the following vector equations:
These three equations can be solved to determine the position vector of the point in the local coordinate system. These position vectors in the local baseline referenced coordinate system can then be transformed to map coordinates knowing the position 1P
r in map coordinates, and
( )
( )
( )(10) sinsinˆ
(9) cossinˆ
(8) cos4
1
1
1
1
1
1
θγ
θγ
γπ
λφ
=⋅−−
=⋅−−
=−=−
−⋅
yPP
PP
xPP
PP
BPP
PPB
rr
rr
rr
rr
rr
rrv

8
the Euler angles of the baseline coordinates relative to the local North, East, and Down coordinate system.
As with the differential interferometric phase, the interferogram phase values are wrapped and need to be unwrapped before they can be converted to heights. For the spatial interferometer, the absolute phase constant can be determined using 1 or more control points in the scene with known 3-D coordinates.
7. MEASUREMENT APPROACH
The GPRI is field transportable and can be set up for operation within 30 minutes. Correct positioning of the instrument is crucial to getting good results. Since motion is detected along the line-of-sight, a position should be selected where the motion signal has a significant component along the LOS. The measurement schedule can be determined from the expected deformation velocities. Over the measurement campaign, the expected motion should exceed a few mm.
The study region for measurement of deformation should contain numerous targets such as buildings, rock faces, and boulders that have scattering phase that is not influenced by the weather or wind. The angular image arc should cover the deforming features as well as areas that are known to be stable. Sufficient images should be collected to allow stacking of the interferograms to remove small-scale atmospheric phase signals.
At the start of the measurement campaign, the instrument should be set up on a stable area preferably on rock or pavement. After the instrument has been positioned it can be fixed to the ground with screws using plastic or metal anchors. These positions should be carefully marked so that the tripod can be mounted at the same position at a later time. The antenna structure should be levelled using a spirit level as accurately as possible and the height of the tower reference point carefully measured with an accuracy of a few mm and recorded. This information can then be used to set the antenna scanner as close as possible to the same position for subsequent measurements.
After the instrument has been set up, the operation is confirmed by acquiring a set of echoes and plotting both the raw data samples and the echo profile. The particular chirp that is selected depends on the maximum distance such that the echo spectrum matches the frequency bandpass of the receiver video amplifier. The video amplifier amplifies signals between 0.1 and 4 MHz and has a programmable gain between 40 and 80 dB.
When the test area has been identified, the antenna is pointed in the direction of the centre of the intended image arc. The positioner permits readout of position with an accuracy of .087degrees. This value should be recorded such that images acquired at later times or subsequent deployments match.
After the GPRI has been deployed and powered up a pair of image acquisitions can be performed. For the first acquisition an interferogram and correlation map using image data from the upper and lower antennas can be calculated and displayed using the Gamma software. These data are used to confirm the image region. Furthermore, high coherence in the radar image confirms that the antennas are coregistered. A temporal interferogram using data from both acquisitions can be used to evaluate the temporal coherence characteristics of the scene. Differential interferometry requires that there are stable scatterers within the region of interest. The distribution of scatterers must be dense enough for successful phase unwrapping.

9
The data acquisition should be at least 20 to 30 images to permit interferogram stacking to reduce the atmospheric phase noise.
8. DATA PROCESSING AND EXAMPLES
Data processing of the GPRI data involves focusing the range echoes using an FFT. After the initial focusing the images are processed using the same processing steps as for standard SAR interferometry [7]. These steps include interferogram generation, phase unwrapping, multi-looking, and stacking to reduce atmospheric phase. Terrain geocoding and generation of DEMs from the spatial interferograms requires software that is specifically adapted to the polar scanning geometry.
The GPRI has been deployed at several sites including the Tessina landslide in Northern Italy and the Rhône glacier in the Valais region of Switzerland. Figure 5 shows the Rhône glacier and the associated GPRI intensity image with 2m pixel spacing in Figure 6. The radar is located at the apex of the wedge and the images covers range out to 2.15 km and an angular arc of 70 degrees. Note that there is significant shadow in the image due to the very large incidence angles.
Figure 5 - Rhône glacier view from radar installation location.
Figure 6 - GPRI intensity image of the Rhône glacier acquired on 17-Oct-2007 resampled to rectangular format.
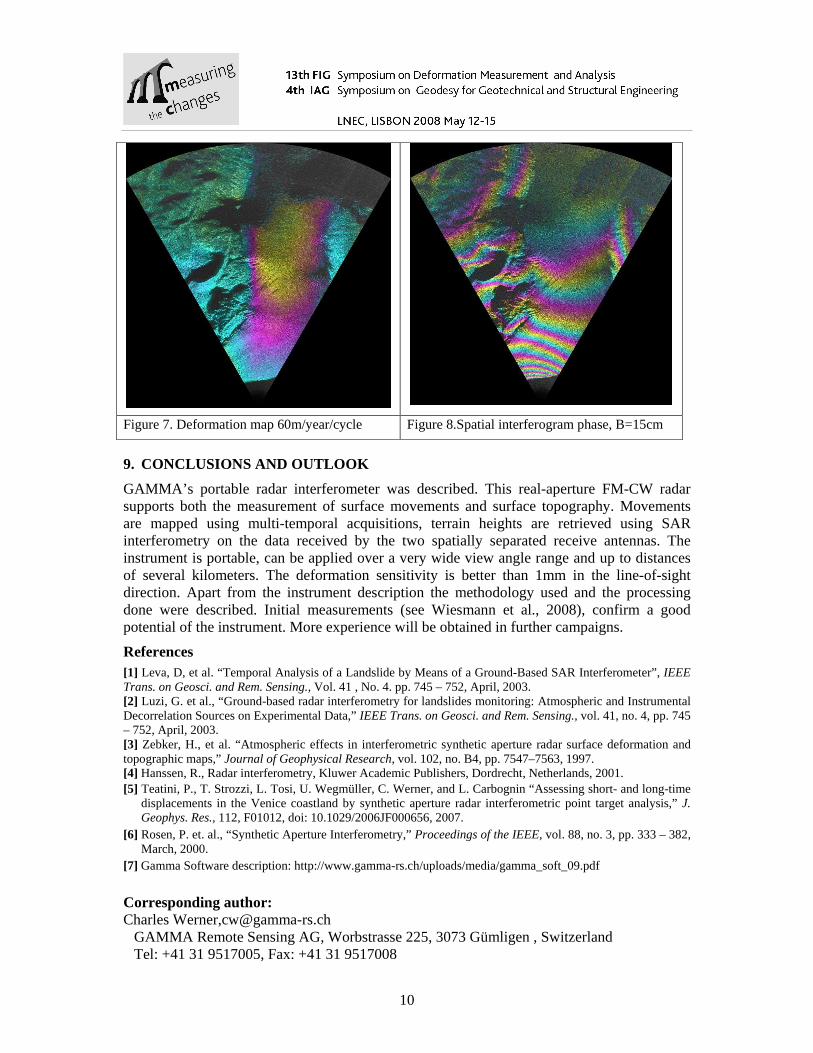
The Rhône glacier has average velocity of about 4 mm/hour along the line of sight in the GPRI data (35 m/year) as shown in Figure 7. A full colour cycle represents a rate of 60 m/year. This deformation map was created by stacking images acquired over approximately 80 minutes. In Figure 8 we show the interferogram produced from the upper and lower antennas. In this image each fringe represents a path length difference of 8.74 mm. This phase can be unwrapped and used to generate a DEM of the glacier.
10
Figure 7. Deformation map 60m/year/cycle Figure 8.Spatial interferogram phase, B=15cm
9. CONCLUSIONS AND OUTLOOK
GAMMA’s portable radar interferometer was described. This real-aperture FM-CW radar supports both the measurement of surface movements and surface topography. Movements are mapped using multi-temporal acquisitions, terrain heights are retrieved using SAR interferometry on the data received by the two spatially separated receive antennas. The instrument is portable, can be applied over a very wide view angle range and up to distances of several kilometers. The deformation sensitivity is better than 1mm in the line-of-sight direction. Apart from the instrument description the methodology used and the processing done were described. Initial measurements (see Wiesmann et al., 2008), confirm a good potential of the instrument. More experience will be obtained in further campaigns.
References [1] Leva, D, et al. “Temporal Analysis of a Landslide by Means of a Ground-Based SAR Interferometer”, IEEE Trans. on Geosci. and Rem. Sensing., Vol. 41 , No. 4. pp. 745 – 752, April, 2003. [2] Luzi, G. et al., “Ground-based radar interferometry for landslides monitoring: Atmospheric and Instrumental Decorrelation Sources on Experimental Data,” IEEE Trans. on Geosci. and Rem. Sensing., vol. 41, no. 4, pp. 745 – 752, April, 2003. [3] Zebker, H., et al. “Atmospheric effects in interferometric synthetic aperture radar surface deformation and topographic maps,” Journal of Geophysical Research, vol. 102, no. B4, pp. 7547–7563, 1997. [4] Hanssen, R., Radar interferometry, Kluwer Academic Publishers, Dordrecht, Netherlands, 2001. [5] Teatini, P., T. Strozzi, L. Tosi, U. Wegmüller, C. Werner, and L. Carbognin “Assessing short- and long-time
displacements in the Venice coastland by synthetic aperture radar interferometric point target analysis,” J. Geophys. Res., 112, F01012, doi: 10.1029/2006JF000656, 2007.
[6] Rosen, P. et. al., “Synthetic Aperture Interferometry,” Proceedings of the IEEE, vol. 88, no. 3, pp. 333 – 382, March, 2000.
[7] Gamma Software description: http://www.gamma-rs.ch/uploads/media/gamma_soft_09.pdf
Corresponding author: Charles Werner,[email protected]
GAMMA Remote Sensing AG, Worbstrasse 225, 3073 Gümligen , Switzerland Tel: +41 31 9517005, Fax: +41 31 9517008