Gamification in Skills Management · 2016-10-12 · ... support and understanding, throughout my...
107
Gamification in Skills Management Personal Profile Monitoring José Carlos Marques Araújo Master of Information Systems for Management Thesis Advisor: Prof. Dr. Gabriel Pestana August, 2016
Transcript of Gamification in Skills Management · 2016-10-12 · ... support and understanding, throughout my...

Gamification in Skills ManagementPersonal Profile Monitor ing
José Carlos Marques Araújo
Master of Information Systems for Management
Thesis Advisor:
Prof. Dr. Gabriel Pestana
August, 2016

ii
AcknowledgementsI start by thanking my biggest source of strength and passion: my family. Without them,
I could never find the willness, courage and stamina throughout this tough Master Thesis
journey. The truth is that there are so many people that I would like to thank for a huge variety
of reasons along this Master Thesis journey:
To my SAP colleagues: Khaled Musilhy, my dearest Egyptian friend, for all his trust in
my capabilities during the time that we worked together for the MENA region and his very
laudatory words, which incentivated me to embrace this new challenge; Simon Anstey, for all
his commitment and availability during these 8 years, in addition to his enthusiastic words in
the recommendation letter; Michael Depner, my mentor, for all his guidance and wise advises,
besides his listening and coaching skills; Andreas Wirth, my Line Manager, for believing in my
talent potential and encouraging my behavioral techniques and methods changes, to become a
better professional. Last, but not least, Paul Taylor, my trusted research advisor, always
available to help with additional material and his valuable help, and patience, on reviewing
some texts.
To my UE colleagues: Manuel, Jorge, João and Bruno, for all their friendship and
partnership at all times, helping me moving on and achieve my goals. I would also like to thank
all the staff of Universidade Europeia for their cooperation, support and understanding,
throughout my study years
My grateful appreciation to my enthusiastic advisor, Professor Dr. Gabriel Pestana. I am
very grateful for his persistence and guidance, where his knowledge, inspiration and
unsurpassed guidance have showed me other perspectives in doing research. His
encouragement, patience and care have been invaluable.
And, last but not least, special thanks to my girlfriend, Ana, for her love, unmatched
patience, caring and understanding throughout this tough journey. Thank you for believing in
me and for providing me the time and space needed for this journey. The eagerness and
determination to demonstrate that such a journey is possible, whatever obstacles you face, was
my biggest challenge, hoping to continue to be seen as an example to my lifetime love: my son!

iii
Table of Contents
Acknowledgements ............................................................................................................... ii
Table of Contents ................................................................................................................. iii
List of Figures ........................................................................................................................vList of Tables ...................................................................................................................... vii
List of Acronyms ................................................................................................................ viii
Abstract ................................................................................................................................ ix
1. Introduction ....................................................................................................................1
1.1. Context .....................................................................................................................1
1.2. Overview ..................................................................................................................2
1.3. Objectives ................................................................................................................3
1.4. Motivations ..............................................................................................................41.5. Design Science Research Methodology ....................................................................9
1.6. Report Organization ............................................................................................... 10
2. State of the art ............................................................................................................... 10
2.1. Revised Framework for Design Science Research Activities................................... 10
2.2. Visual Analytics Framework .................................................................................. 16
2.3. Talent Management from the Skills perspective ...................................................... 21
2.4. Gamification .......................................................................................................... 25
3. Skills Management Awareness Model........................................................................... 293.1. The role of Active@Work in Skills Management ................................................... 29
3.2. Workforce Skills Analysis ...................................................................................... 31
3.3. Metadata Info-Structures ........................................................................................ 35
3.3.1. Skills Metadata Management ........................................................................... 35
3.3.2. Mockups configuration of Metadata ................................................................ 39
3.3.3. Domain model ................................................................................................. 45
4. Results .......................................................................................................................... 50
4.1. Skills Development module .................................................................................... 50
4.2. Case Study – Active@Work ................................................................................... 524.2.1. List of actors and roles participating in the specified scenarios ........................ 54
4.2.2. Generic scenarios ............................................................................................ 55
4.3. Case Study – Conceptual Framework to the Mockups Design................................. 58
5. Conclusions and Future Challenges............................................................................... 59

iv
5.1. Conclusions ............................................................................................................ 60
5.2. Future Challenges ................................................................................................... 61
References ............................................................................................................................ 62
Annex A – Skills Management Metadata Framework ........................................................... 66
Annex B – Skills Development Module Requirements ......................................................... 74
Annex C – Skills Development Module Mockups ................................................................. 80Annex D – Skills Development Module Indicators & Metrics ............................................... 84
Annex E – Skills Development Module Domain Model ........................................................ 91
v
List of Figures
Figure 1. Decomposition of the population by age-groups (source: European Commission,
2015) ......................................................................................................................................5
Figure 2. Demographic old-age dependency ratio (65+/(15-64)) (source: European
Commission, 2015).................................................................................................................6
Figure 3. Historical participation rates: workers aged 55 to 64 (source: European Commission,
2015) ......................................................................................................................................7
Figure 4. Share of population aged 55-64 years with education level below upper secondary
(source: OECD, 2014) ............................................................................................................8
Figure 5. General Model for Generating and Accumulating Knowledge (source: Owen, 1997)
............................................................................................................................................. 12
Figure 6. DSR Model & Cognitive Processes (adapted from: Dasgupta, 1996; Purao, 2002;
Takeda et al., 1990; V. Vaishnavi & Kuechler, 2004) ........................................................... 13
Figure 7. Visual Analytics process (source: Daniel A. Keim et al., 2010) .............................. 17
Figure 8. Mockup of the Personal Skills Dashboard layout ................................................... 32
Figure 9. Mockup of the Personal Skills – Certification layout .............................................. 33
Figure 10. Mockup of the Training Catalogue Dashboard layout........................................... 34
Figure 11. Mockup of the Personal Skills Dashboard Indicators layout ................................. 36
Figure 12. Mockup of the Personal Skills – Education layout................................................ 38
Figure 13. Skills Management – Metadata configuration interface ........................................ 41
Figure 14. Metadata Configuration - Parameters ................................................................... 42
Figure 15. Metadata Configuration - Metrics ........................................................................ 43
Figure 16. Metadata Configuration - Indicators ..................................................................... 44
Figure 17. Skills Management domain model using the UML Notation (with Mxxx type
classes) ................................................................................................................................. 47
Figure 18. Skills Management domain model using the UML Notation (with Mxxx and Vxxx
type Classes) ........................................................................................................................ 49
Figure 14. Virtual Assistant Tool Architecture ...................................................................... 53
Figure 17. Metadata Configuration - Lists............................................................................. 66
Figure 18. Metadata Configuration – Parameters .................................................................. 67
Figure 19. Metadata Configuration – Parameters Expanded .................................................. 68
Figure 21. Metadata Configuration – Metrics ........................................................................ 69

vi
Figure 22. Metadata Configuration – Metrics Expanded ....................................................... 70
Figure 24. Metadata Configuration – Indicators .................................................................... 71
Figure 25. Metadata Configuration – Indicator Expanded ..................................................... 72
Figure 26. Metadata Configuration – Types of Thresholds .................................................... 73
Figure 22. Mockup of the Staff Profile Dashboard layout ..................................................... 80
Figure 23. Mockup of the Staff Profile – Staff Experience Skills layout ................................ 81
Figure 24. Mockup of the Target Profile Dashboard layout ................................................... 82
Figure 25. Mockup of the Target Profile – Search Results layout .......................................... 83
Figure 32. Skills Management domain model – Phase I ........................................................ 95
Figure 33. Skills Management domain model – Phase II ....................................................... 96
Figure 34. Skills Management domain model – Phase III ...................................................... 97
Figure 34. Skills Management domain model – Phase IV ..................................................... 98

vii
List of Tables
Table 1. Comparison of DSR Steps According to Literature (source: adapted from Rocha,
Formoso, Tzortzopoulos-Fazenda, Koskela, & Tezel, 2012) ................................................. 11
Table 2. Curriculum Vitae Evaluation - CE (Description, Formula and Example) ................. 37
Table 3. Academic Qualifications - AQ (Factor, Weight and Description) ............................ 39
Table 4. List of components identified for the SDM.............................................................. 53
Table 5. List of actors identified for the SDM ....................................................................... 55
Table 6. List of Generic Scenarios ........................................................................................ 55
Table 7. Requirements assigned to the SDM ......................................................................... 74
Table 8. Curriculum Vitae Evaluation - CE (Description, Formula and Example) ................. 84
Table 9. Peer Average - PA (Description, Formula and Example) ......................................... 85
Table 10. Assessment - AS (Description, Formula and Example).......................................... 85
Table 11. Ranking - RK (Description, Formula and Example) .............................................. 86
Table 12. CV Composition - CC (Description, Formula and Example) ................................. 86
Table 13. Academic Qualifications - AQ (Factor, Weight and Description) .......................... 87
Table 14. General Professional Experience - GPE (Factor, Weight and Description) ............ 88
Table 15. Specific Professional Experience – SPE (Factor, Weight and Description) ............ 88
Table 16. General Professional Qualification - GPQ (Factor, Weight and Description) ......... 89
Table 17. Specific Professional Qualification - SPQ (Factor, Weight and Description) ......... 89
Table 18. Language Qualification - LQ (Factor, Weight and Description) ............................. 90
Table 19. Endorsements Qualification - EQ (Factor, Weight and Description) ...................... 90
Table 20. Competencies Qualification - CQ (Factor, Weight and Description) ...................... 90

viii
List of Acronyms
AAL Active and Assisted LivingCV Curriculum VitaeDSR Design Science ResearchDSRM Design Science Research MethodologyDSS Decision Support systemEC European CommissionEM Extrinsic MotivationERD Entity Relationship DiagramEU European UnionGPE General Professional ExperienceGUI Graphical User InterfaceHCM Human Capital ManagementHR Human ResourcesHRMS Human Resource Management SystemIA Intelligent AgentIM Intrinsic motivationIS Information SystemISCED International Standard Classification of EducationITIL Information Technology Infrastructure LibraryNIESR National Institute of Economic and Social ResearchOECD Organization for Economic Co-operation and DevelopmentPC Personal ComputerPMBOK Project Management Body of KnowledgeR&D Research and DevelopmentSDM Skills Development ModuleSE Self-esteemSPE Special Professional ExperienceTM Talent ManagementUK United KingdomUI User InterfaceUOD Universe of DiscourseVAT Virtual Assistance Tool

ix
AbstractEmployees are the human capital which, to a great extent, contributes to the success and
development of high-performance and sustainable organizations. In a work environment, there
is a need to provide a tool for tracking and following-up on each employees' professional
progress, while staying aligned with the organization’s strategic and operational goals and
objectives.
The research work within this Thesis aims to contribute to improve employees' self-
awareness and auto-regulation; two predominant research areas are also studied and analyzed:
Visual Analytics and Gamification. The Visual Analytics enables the specification of
personalized dashboard interfaces with alerts and indicators to keep employees aware of their
skills and to continuously monitor how to improve their expertise, promoting simultaneously
behavioral change and adoption of good-practices. The study of Gamification techniques with
Talent Management features enabled the design of new processes to engage, motivate, and
retain highly productive employees, and to foster a competitive working environment, where
employees are encouraged to be involved in new and rewarding activities, where knowledge
and experience are recognized as a relevant asset. The Design Science Research was selected
as the research methodology; the creation of new knowledge is therefore based on an iterative
cycle addressing concepts such as design, analysis, reflection, and abstraction.
By collaborating in an international project (Active@Work), funded by the Active and
Assisted Living Programme, the results followed a design thinking approach regarding the
specification of the structure and behavior of the Skills Development Module, namely the
identification of requirements and the design of an innovative info-structure of metadata to
support the user experience. A set of mockups were designed based on the user role and main
concerns. Such approach enabled the conceptualization of a solution to proactively assist the
management and assessment of skills in a personalized and dynamic way. The outcomes of this
Thesis aims to demonstrate the existing articulation between emerging research areas such as
Visual Analytics and Gamification, expecting to represent conceptual gains in these two
research fields.
Keywords: Visual Analytics, Skills Management, Self-Awareness, Semantic Context,Monitoring Events, Gamification

1
1. IntroductionThis chapter provides an introduction to the research work performed within the scope
of this Master’s Thesis, outlining Gamification and Visual Analytics as the main research areas.
The research challenge can be expressed as how to efficiently manage and monitor events using
graphical interfaces such as personalized interactive Dashboards, enabling employees to access
relevant information and simultaneously to promote self-awareness and auto-regulation. These
self-awareness and auto-regulation behaviors are supported by the Skills Development Module
(SDM). This module intends to encourage employees to upskill their competencies as well as
their career progress, enriching in this way their Curriculum Vitae (CV), matching in a more
proficient way the increasing demands of business needs in extremely competitive
environments. The section also considers the formulation of the problem to which the work will
cope and the main concepts to investigate. Innovative achievements were attained by showing
that Gamification and Visual Analytics are correlated and complement each other, based on a
methodological approach developed with the knowledge acquired through the study of Design
Science Research Methodology (DSRM). Finally, it ends by describing the structure of the
document.
1.1. ContextThe current socio-economic situation in Europe was taken by the European governments
as a reason to raise the retirement age, supported by some studies that have shown that working
beyond the retirement age can be beneficial to the individual’s physical and mental health
(European Commission, 2015a). However, there is at least one challenging hurdle to capitalize
on the benefit of employing older individuals in organizations; this is the lack of innovative
paradigm-changing solutions. These solutions are meant to assist older individuals in staying
active and efficient, especially in a context where the overall labor force is becoming older and
less experienced. This is extremely important, since organizations recognize that older, yet
experienced, employees are very valuable assets, and this cannot be neglected or even
comparable to younger employees, which are less skilled and experienced. There is also a myth
about older employees and an alleged inability to learn new skills. However, research shows
learning is not an age-dependent factor (Charness & Czaja, 2006). Because ever-evolving
technology affects the workplace, there is a need to support employees in acquiring new skills
to remain proficient in an increasingly competitive working environment.

2
Thus, the existing solutions should provide appropriate skills management
recommendations that tap into the specific motivations and needs of each employee, using
Gamification techniques to challenge them for competitiveness, or by acquiring new
skills/competencies or by investing in career progression as determinants to meet business
demands.
The aim to create innovative paradigm-changing solutions and the opportunity to
collaborate in the Active@Work project (http://www.activeatwork.eu/), an European Union
(EU) funded R&D project with a duration of 30 months starting in December 2015, was
strengthened with the interest on research predominant areas such as Visual Analytics,
Gamification and Talent Management, combined with the challenge to design an innovative
solution for the SDM.
1.2. OverviewThe research work within this Thesis consists on the following requirements:
· Define an info-structure of metadata to support dynamic creation of indicators, taking into
consideration the user profile and/or role/function, without any need of intervention from
the IT department.
· Develop the SDM solution to maintain employees’ self-conscious and informed about their
assessment and the need for CV adjustments, to meet organizations skills & competencies
demands.
· Autonomous management mechanism of CV in a standardized way (another SDM feature),
enabling employees to have information on what are the most valued skills for the
organization (through the training catalogue).
To accomplish such research the following three main domains were analyzed: Visual
Analytics, Gamification and Talent Management. By applying Gamification techniques, such
as instant feedback & (healthy) competitiveness for desired actions and indicators for merit,
performance and reputation, the solution promotes employees’ self-awareness, increasing their
motivation to seek out new skills, eventually contributing to improve the CV. The solution also
intends to develop, motivate, and retain productive, engaged employees, pointing in this way
to goals related of Talent Management aspects, creating a good alignment to meet organizations

3
strategic and operational goals and objectives 1 . Goals and objectives are often used
interchangeably, but the main difference comes in their level of concreteness. Objectives are
very concrete, whereas goals are less structured. The solution had to comply with multi-
platform and mobility requirements (e.g., PC, tablets or smartphones), capable to interact with
the end-user in a very seamless and personalized way. Usability requirements are therefore a
major concern to dynamically adjust interaction and notifications in conformity to the end-user
needs.
1.3. ObjectivesThe SDM intends to provide a contribution to the functionalities to be provided by the
Virtual Assistant tool (VAT) that is a core component within the software architecture of the
Active@work project. This integration intends to create a highly motivating and rewarding
environment that makes it easy for employees to manage and develop their skills, promoting
engagement and motivation to fit into organization needs and expectations. Within this context,
the SDM addresses the following research areas: Visual Analytics, Gamification and Talent
Management.
· Visual Analytics, this interactive technique of information visualization, enables enables
the employee to get access, in real-time and based on metadata characterizing the user
profile and/or role/function, to some relevant information through interactive dashboards.
These dashboards provide employees a clear perception of their strengths and weaknesses,
by means of indicators (e.g. CV Evaluation, ranking and CV composition) and events (alerts,
warnings and recommendations) which are dynamically triggered by an Intelligent Agent
(IA). Developing self-awareness helps the employees to have the opportunity to make
changes in behavior and motivation aspects, which may be extremely important in case the
employee's CV (i.e., perceived skills or expertise) start to lose relevance, in an increasing
competitive working environment.
· Gamification, by adopting data-driven elements and techniques that game designers use to
engage employees, reward and recognize individuals and keep people motivated to achieve
- sometimes extremely - ambitious results, adding value to business and promoting loyalty.
Organizations are continuously being challenged to effectively encourage employees to
1 Cfr: Talent Management, accessed on 13/02/2016
4
achieve basic business goals and develop working environments driven by healthy
competitive practices. If serious gaming techniques become part of the Organizations'
working culture, it will encourage employees to continuously seek to improve their CV. In
such working environment, self-awareness can be seen as a way to "play" with alerts and
recommendations triggered dynamically by an Intelligent Agent (IA), which motivates
employees to constantly invest effort in auto-regulation to improve their performance (e.g.,
rank classification, career development, encourage ambition and self-achievement).
· Talent Management, by adopting processes designed to engage, motivate and retain highly
productive employees, it is possible to combine Skills Management & monitoring related
critical capabilities with information visualization techniques, helping organizations to
maximize potential use of Talent Management technology. Through a training catalogue
with specific skills offering, employees can search and manifest interest in some training(s)
offers or seek for career options. In some cases, a workflow approval is required (e.g.,
training courses requiring a fee payment), these requests are sent to the employee supervisor
for further approval/rejection.
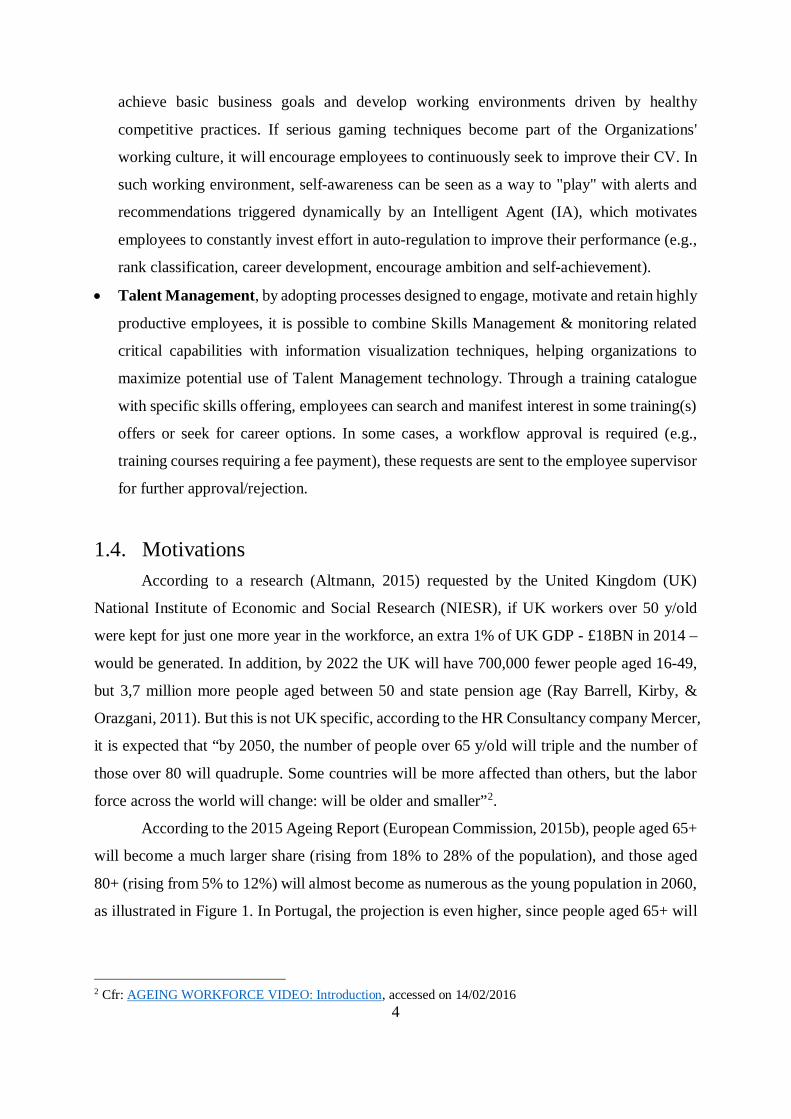
1.4. MotivationsAccording to a research (Altmann, 2015) requested by the United Kingdom (UK)
National Institute of Economic and Social Research (NIESR), if UK workers over 50 y/old
were kept for just one more year in the workforce, an extra 1% of UK GDP - £18BN in 2014 –
would be generated. In addition, by 2022 the UK will have 700,000 fewer people aged 16-49,
but 3,7 million more people aged between 50 and state pension age (Ray Barrell, Kirby, &
Orazgani, 2011). But this is not UK specific, according to the HR Consultancy company Mercer,
it is expected that “by 2050, the number of people over 65 y/old will triple and the number of
those over 80 will quadruple. Some countries will be more affected than others, but the labor
force across the world will change: will be older and smaller”2.
According to the 2015 Ageing Report (European Commission, 2015b), people aged 65+
will become a much larger share (rising from 18% to 28% of the population), and those aged
80+ (rising from 5% to 12%) will almost become as numerous as the young population in 2060,
as illustrated in Figure 1. In Portugal, the projection is even higher, since people aged 65+ will
2 Cfr: AGEING WORKFORCE VIDEO: Introduction, accessed on 14/02/2016

5
rise from 20% to 35% of the population and those aged 80+ will become more numerous than
the young population in 2060 (16% versus 11%).
Figure 1. Decomposition of the population by age-groups (source: European Commission,2015)
Because of these different trends among age groups, the demographic old-age
dependency ratio (people aged 65 or above relative to those aged 15- 64) is projected to increase
from 27.8% to 50.1% in the EU as a whole over the projection period (from 2013 to 2060), as
illustrated in Figure 2. Demographic old-age dependency ratio (65+/(15-64)) (source: European
Commission, 2015). In Portugal, people aged 65+ relative to those aged 15-64 is projected to
increase from 29,8% to 63%, significantly above the average projected for the EU in 2060. This
implies that the EU would move from having four working-age people for every person aged
over 65 years to only two working-age persons.
The expectable impacts of these projections are especially relevant for this Thesis, for
two main reasons:
· Foreseeable raise of the retirement age in the mid/long term;
· Greater demand/consciousness for active aging policies (organizations will need to keep
their senior resources for a longer period time).

6
Figure 2. Demographic old-age dependency ratio (65+/(15-64)) (source: EuropeanCommission, 2015)
The 2015 Ageing Report also provides Labor Force projections, where it is mentioned
that, due to pension reforms raising the statutory retirement age or the state pension age, the
participation rates of men aged 55-65 in the labor market has increased in most countries since
the turn of the century, as illustrated in Figure 3. In the EU, the participation rates of people of
both genres aged 55-65 in the labor market has increased from 45,1% (in 2005) to 54,3% (in
2013). In Portugal, for a longer comparison period (from 1990 to 2013), the participation rates
of people of both genres aged 55-65 in the labor market has increased from 47,6% (in 1990) to
54,1% (in 2013), which is in line with the EU average figures.

7
Figure 3. Historical participation rates: workers aged 55 to 64 (source: EuropeanCommission, 2015)
In addition to the aging and demographic challenges and how will this affect the labor
force across the world, sustained by the projections from the 2015 Ageing Report illustrated
above, it's equally important to evaluate the Education qualifications level, as well as the
skills/competencies from these senior employees.
According to the “Educational attainment and labour-force status Indicators”, from the
Organisation for Economic Co-operation and Development (OECD), regarding the labour force
status and the educational attainment level published in “OECD Education at a Glance 2015”,
(which includes data for 2000, 2005, 2010 and 2014), the lack of educational literacy in people
of both genres aged 55-65, as illustrated in Figure 4, can be seen as an obstacle to the continued
employability of an increasingly aging population. In this Figure the search criteria was the
International Standard Classification of Education (ISCED) level “Upper Secondary” (i.e.
immediately below higher education) education level (UNESCO, 1997).

8
Figure 4. Share of population aged 55-64 years with education level below upper secondary (source: OECD, 2014)
The graph objectively shows that there are a few countries, such as Portugal, Spain, Italy and Greece, where >=50% of the population aged 55-64 has an
education level below “Upper Secondary”. Portugal is illustrated as one of the countries with the most serious gap in the senior population with academic
qualifications of higher education. From this graph it is possible to infer the relevance OECD report and consequently the relevance of having a tool such as the
SDM to support adult senior to proficiently and proactively management their skills, encouraging and motivating them to continuously improve their skills or acquire
new ones.

9
1.5. Design Science Research MethodologyDesign science research (DSR) is a set of analytical techniques and perspectives for
performing research in Information System (IS). DSR involves the creation of new knowledge
through the design of novel and innovative artifacts. It also helps the analysis of such artifacts
to improve and understand the behavior of aspects related to Information Systems (Kuechler &
Vaishnavi, 2008). A designed artifact is an object with material and/or immaterial
characteristics that is designed and created intentionally by one or more human beings, such as
algorithms, human/computer interfaces, and system design methodologies or languages.
In the last century, natural sciences almost drove out ‘design’ from professional school
curricula in all professions, with the exception of management, computer science and chemical
engineering (Simon, 1996). To bring the design activity back to the an intellectual level, (Simon,
1996) makes a clear distinction between “natural science” and “science of the artificial” (design
science), where design science is seen as knowledge in the form of constructs, techniques and
methods for creating artifacts that satisfy given sets of functional requirements. DSR is the
research that creates this type of missing knowledge using design, analysis, reflection, and
abstraction.
The main goal of DSR is to develop knowledge that professionals can use to design
solutions for their area of research/concern (i.e., a problem domain). This mission can be
compared to the one of the ‘explanatory sciences’, like the natural sciences and sociology,
which is to develop knowledge to describe, explain and predict (van Aken, 2005). Hevner states
that the main purpose of DSR is to achieve knowledge and understanding of a problem domain
by building and application of a designed artifact (A. R. Hevner, March, Park, & Ram, 2004).
Gamifying up skilling activities can be beneficial as it can better engage employees and
result in better competencies. However, incorporating game-thinking in non-game contexts
such as up skilling activities can be difficult because it requires an appropriate mix of science,
interaction, and experience. DSR can help overcome this issue. Through a search process for
determining an appropriate solution for a given problem domain, combined with an active
participation of the end user in the specification and conceptual model validation, DSR allows
multiple iterative cycles over which the solution is incrementally refined, addressing the
objectives praised in this Thesis and resulting in a successful implementation. (Cheong, Cheong,
& Filippou, 2013).

10
1.6. Report OrganizationThis Thesis is structured as follow. The second chapter presents a literature review of
the state-of-the-art regarding the three predominant research areas, it analyzes and discusses the
information published about the Thesis subject. This chapter introduces the DSR, Visual
Analytics Framework, Talent Management from the Skills perspective and Gamification. The
third chapter focus on the research challenges, namely how it started, what was achieved and
how it can be improved. It details how the research study was conducted, including the
theoretical framework reference and assumptions. The forth chapter presents the expected
results that support the proposed solution to the identified problem. Finally, the Thesis structure
ends with the fifth chapter presenting the main conclusions and a reflection on the results
obtained from the research work with some guidelines regarding future work.
2. State of the artThis chapter presents a literature review of the current state-of-the-art, which seeks to
gather, analyze and discuss information published around the subjects covered within this
Thesis. It provides a theoretical foundation to the research objectives and refers what has
already been researched or published in topics similar to the one approached in this Thesis.
2.1. Revised Framework for Design Science Research ActivitiesDesign can be thought of a mapping from function space - a functional requirement
constituting a point in this multidimensal space - to attribute space, where an artifact satisfying
the mapping constitutes a point in that space (Takeda, Veerkamp, Tomiyama, & Yoshikawa,
1990). Design Science is then knowledge in the form of constructs, techniques and methods for
performing this mapping, models, theory - the know-how for creating artifacts that satisfy a
given sets of functional requirements. DSR is research that creates this type of missing
knowledge using design, analysis, reflection and abstraction.
There are many excellent models of the research process of DSR (A. Hevner, 2007;
Kasanen, Lukka, & Siitonen, 1993; Kuechler & Vaishnavi, 2008; March & Smith, 1995; Peffers,
Tuunanen, Rothenberger, & Chatterjee, 2007) being reported in high impact journals. A
comparison of research steps among those models is presented in Table 1. Based on this table,
it can be argued that the core processes involved in DSR are:

11
1) Establishing Awareness of Problem – as highlighted in blue colour;
2) DSR (Development of the Artifacts and Evaluation) – as highlighted in green
colour;
3) Theory building/Conclusions – as highlighted in purple colour.
Table 1. Comparison of DSR Steps According to Literature (source: adapted from Rocha,Formoso, Tzortzopoulos-Fazenda, Koskela, & Tezel, 2012)
This Thesis has chosen to work around the research process proposed by (Dasgupta,
1996; Purao, 2002; Takeda et al., 1990; V. Vaishnavi & Kuechler, 2004), Figure 6 provides a
short overview of the loop schema, which is a well-known cycle to any researchers, who
adopted or studied the DSR methodological approach. A general model that shows how
knowledge is being generated and accumulated as in Figure 5 is also helpful in understanding
the DSR process.

12
Figure 5. General Model for Generating and Accumulating Knowledge (source: Owen, 1997)
As presented by Qwen, “Knowledge is generated and accumulated through action.
Doing something and judging the results is the general model. The process is shown as a cycle
in which knowledge is used to create works, and works are evaluated to build knowledge”
(Owen, 1997). Indeed, DSR will contribute to the production of new knowledge. In general, it's
recommendable to produce a new product using state-of-practice application of techniques and
available components. In most cases, product design efforts are preceded by many discussions,
alignments and meetings to check out the risks, probability and evaluation of the design effort.
The risks identified "we don't know how to do this yet" areas that are precisely the targets of
DSR efforts (V. K. Vaishnavi & Kuechler, Jr., 2007).
A typical DSR workflow is summarized in Figure 6. It combines the approach from
(Dasgupta, 1996; Purao, 2002; V. Vaishnavi & Kuechler, 2004), which focus on the DSR
process model, with the approach from (Takeda et al., 1990), which focus on the Cognitive
processes.
The DSR follows a user-centric approach. It starts with a survey about the project scope
to achieve a preliminary awareness of the challenges related to the scope of the problem domain,
identifying hypothesis to be tested and evaluated using information artifacts. An active
participation of the end-user is required in testing and evaluating the identified artifacts on each
process step, execution generates outcome which might contribute, after being analyzed, to
generate findings to feed the knowledge about the research problem that is being studied, in a
continuous cognitive improvement process. The analysis of the results might provide additional

13
inputs or contribute to redesign some services that will also be considered as a relevant
information in achieving a better understanding about the problem domain, as well as the
identification of stakeholders concerns and interests in the system. A description of the five
process steps (Awareness of Problem, Suggestion, Development, Evaluation and Conclusion)
are presented in Figure 6.
Figure 6. DSR Model & Cognitive Processes (adapted from: Dasgupta, 1996; Purao, 2002;Takeda et al., 1990; V. Vaishnavi & Kuechler, 2004)
* An operational principle can be defined as “any technique/frame/reference about a class of artifacts or its
characteristics that facilitates creation, manipulation and modification of artifactual forms” (Dasgupta, 1996; Purao,
2002)
· Awareness of the Problem - DSR is often referenced as "Improvement Research" and this
designation emphasizes the problem-solving/performance-improving nature of the activity.
All Design begins with Awareness of Problem, which is not only identified but also defined,
leading to “more time defining the problem before deciding to build a tool” (Purao, 2002).
In this Thesis, the context of ever-evolving technology affecting the workplace, increases
the need to support employees in quickly learning new skills, by improving their self-
14
awareness and auto-regulation. In addition, and by collaborating in an international project
(Active@Work), there is also a strong focus on promoting active aging measures in the
workplace, at the same time that improves senior employees’ life quality, due to the lack of
innovative paradigm-changing solutions.
· Suggestion - The Suggestion phase follows immediately behind the proposal and it’s
intimately connected with it as the dotted line around Proposal and Tentative Design (the
output of the Suggestion phase) indicates. This is an essential creative step wherein new
functionality is envisioned based on a novel configuration of either existing or new and
existing elements. “Suggestions for a problem solution are abductively drawn from the
existing knowledge base for the problem area, which may or not be adequate for the problem
identified, depending on possible knowledge gaps” (Peirce, 1931). An attempt is made at
creatively solving the problem, based on the existing knowledge. The SDM addressed in
this Thesis intends to provide a set of functionalities to create a highly motivating and
rewarding environment that makes it easy for employees to manage/develop their skills,
promoting engagement and motivation. To achieve it, the proposal is to explore two
predominant research areas: Visual Analytics, Gamification and Talent Management.
· Development - The Tentative Design is further developed and implemented in this phase.
The techniques for implementation will, of course, vary depending on the artifact to be
created, such as algorithms, human/computer interfaces, and system design methodologies
or languages. An expert system embodying assumptions about human cognition in
emergent areas like the ones described in this Thesis: Gamification and Visual Analytics,
will require innovation paradigm-changing solutions, in order to meet business needs. The
implementation itself can be very straightforward and may not involve novelty, beyond the
state-of-practice for the given artifact. The solution - a tentative design - is used to
implement an artifact. Partially or fully successful implementations are then evaluated
according to a functional specification during the Evaluation stage. The main objectives of
this Thesis are outlined on events management/monitoring through Visual Analytics
dynamic/personalized dashboard interfaces, where the generated artifacts corresponds to a
set of mockups (see Chapter 3 for more details).
· Evaluation - Once constructed, the artifact is evaluated according to criteria that is
frequently made explicit in the Proposal (Awareness of Problem phase). The evaluation
phase contains an analytic sub-phase in which hypotheses are made about the behaviour of
the artifact. The results acquired in the construction of the artifact are compiled, in order to
15
feedback another round of Suggestion (circumscription arrows of the Figure above). This
leads to a new design, frequently preceded by new literature research in directions suggested
by deviations. In this Thesis, the preliminary mockups were presented as a baseline for
discussion with the Active@Work project team members, to check if it satisfies user needs
and intended uses. The outcome of these discussions lead to another round of Suggestion,
where proposed adjustments to the design were made based on deviations. Development,
Evaluation and further Suggestion are frequently iteratively performed in the course of the
research effort. The basis of the iteration, the flow from partial completion of the cycle back
to the Awareness of Problem, is indicated by the Circumscription arrow. The
Circumscription process is especially important to understanding design science research
process because it generates understanding that could only be gained from the specific act
of construction. Circumscription is a formal logical model method (McCarthy, 1980) that
assumes that every fragment of knowledge is valid only in certain situations. Discovering
that things don't work "according to theory" is part of the DSR learning process. This is part
of the incomplete nature of any knowledge base and it contributes with valuable constraint
knowledge to the understanding of the "always incomplete theories" that abductively
motivated the original research.
· Conclusion - This phase is the end of a research cycle or of a specific research effort. The
results of the effort are consolidated and the knowledge acquired in the effort is frequently
categorized as either "firm" - facts or behaviour that have been learned and can be repeatably
applied or as "loose ends" - anomalous behaviour that defies explanation and may well serve
as the subject of further research. Depending on the type of knowledge contribution and the
state of knowledge in the area of research, the expectations on the nature and depth of
knowledge contribution outputs can vary. The creative cognitive processes of reflection and
abstraction are used in the Conclusion phase to make knowledge contributions of principles
and possibly design theories. At the conclusion of the research project, the overall
contribution made by the research project to advance knowledge in the research area needs
to be argued. In this Thesis, through the combination of Gamification techniques with
Talent Management, new processes are designed to engage, motivate, and retain highly
productive employees, fostering a competitive working environment, where
dynamic/personalized Dashboards enables employees to monitor to access relevant
information, promoting self-awareness & auto-regulation mechanisms.
16
The credibility of the research findings is an important aspect of any research work
success and is influenced with the appropriate selection of research methodology. Research
methodology is the overall approach to be used in the research work process from the theoretical
foundations of the research object to the collection and analysis of the data. In this context,
DSRM has been presented and justified as the research methodology adopted for this Thesis
using design, analysis, reflection and abstraction for achieving a better understanding about the
problem scope, environment and in the identification of stakeholders concerns and interests in
the system. A typical DSR workflow, which combines the DSR process model-focus with the
Cognitive process-focus can be defined in five process steps (Awareness of Problem,
Suggestion, Development, Evaluation and Conclusion), the same approach was followed in the
specification and development of the SDM in this Thesis.
2.2. Visual Analytics FrameworkVisual analytics is an emerging research discipline that intends to ensure the best
possible use of enormous loads of information in a wide variety of applications by combining
typical methods of Business Intelligence with the visual perception and analysis capabilities of
the human user.
The visual analytics is characterized through interaction between data, visualizations,
models about the data, and the users in order to discover knowledge (D. A. Keim, Kohlhammer,
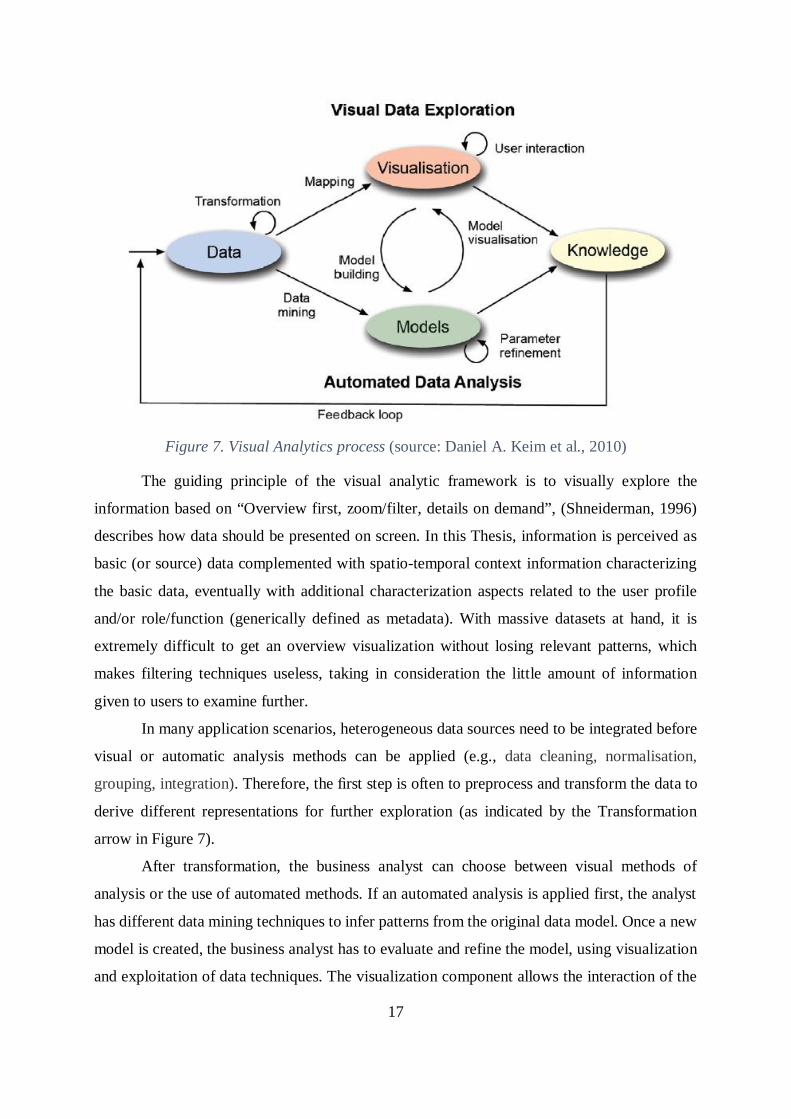
Ellis, & Mansmann, 2010). Figure 7 illustrates an abstract overview of the different stages
(represented through ovals) and their transitions (arrows) in the visual analytics process. The
visual analytics process aims at tightly coupling automated analysis methods and interactive
visual representations.
17
Figure 7. Visual Analytics process (source: Daniel A. Keim et al., 2010)
The guiding principle of the visual analytic framework is to visually explore the
information based on “Overview first, zoom/filter, details on demand”, (Shneiderman, 1996)
describes how data should be presented on screen. In this Thesis, information is perceived as
basic (or source) data complemented with spatio-temporal context information characterizing
the basic data, eventually with additional characterization aspects related to the user profile
and/or role/function (generically defined as metadata). With massive datasets at hand, it is
extremely difficult to get an overview visualization without losing relevant patterns, which
makes filtering techniques useless, taking in consideration the little amount of information
given to users to examine further.
In many application scenarios, heterogeneous data sources need to be integrated before
visual or automatic analysis methods can be applied (e.g., data cleaning, normalisation,
grouping, integration). Therefore, the first step is often to preprocess and transform the data to
derive different representations for further exploration (as indicated by the Transformation
arrow in Figure 7).
After transformation, the business analyst can choose between visual methods of
analysis or the use of automated methods. If an automated analysis is applied first, the analyst
has different data mining techniques to infer patterns from the original data model. Once a new
model is created, the business analyst has to evaluate and refine the model, using visualization
and exploitation of data techniques. The visualization component allows the interaction of the

18
analyst with the automated methods, to modify the settings or choosing other algorithms. The
goal is to refine and assess the appropriateness of the knowledge generated when implementing
the selected models.
Overall, this process intends to speed up the generation of knowledge, through the
analysis of data according to its value and interest (semantic context), highlighting the most
relevant aspects of data, while providing models of interaction which allows the user to get
more details about data, in their process of search and understanding of data. The Visual
Analytics framework includes a set of concepts, all essential for effective analysis (D. Keim et
al., 2008), the ones considered as the most relevant for this Thesis are:
· Visualization – this is a core concept that can be classified as "Scientific Visualization"
(Friendly, 2009) when it refers to abstract data visualization where there is the need to infer
spatio-temporal context (e.g., numbers and alphanumeric data with timestamps and
georeferenced data). A visual analytics approach, with spatio-temporal regions, to forecast
hotspots is presented in (Maciejewski et al., 2011). A typical interactive spatio-temporal
visualization system is also presented in BirdVis (Ferreira et al., 2011) with geographic data
views to understand bird populations. The capability to interact with this information is
extremely important and, as such, different approaches using automatic data analysis
techniques such as clustering or size reduction have been studied.
· Data Analysis (also known as Data Mining or Knowledge Discovery) - the inclusion of
the concept of data analysis in this paradigm is due to the need for automatic extraction of
knowledge from raw data and streamline the entire Visual Analytics process. There are
several approaches to the development of computational methods that automatically
analyze and extract useful information. The supervised learning approach requires a data
sample so that the solution can "learn" from there and use, for example, deterministic and
probabilistic algorithms, decision trees and neural networks. The unsupervised approach
requires no prior knowledge of information, meaning that data are automatically grouped
based on similarity criteria. The clustering algorithms are an example of a technique used
in this approach.
· Data Management - Efficient management of data from different sources of information
constitutes an essential element of Visual Analytics paradigm. A primary condition for data
processing and analysis is an integrated and consistent data basis (Han, Kamber, & Pei,
2011). With the advent of the Internet and the ease of getting a large amount of
heterogeneous data, came also new challenges in this domain, particularly in developing
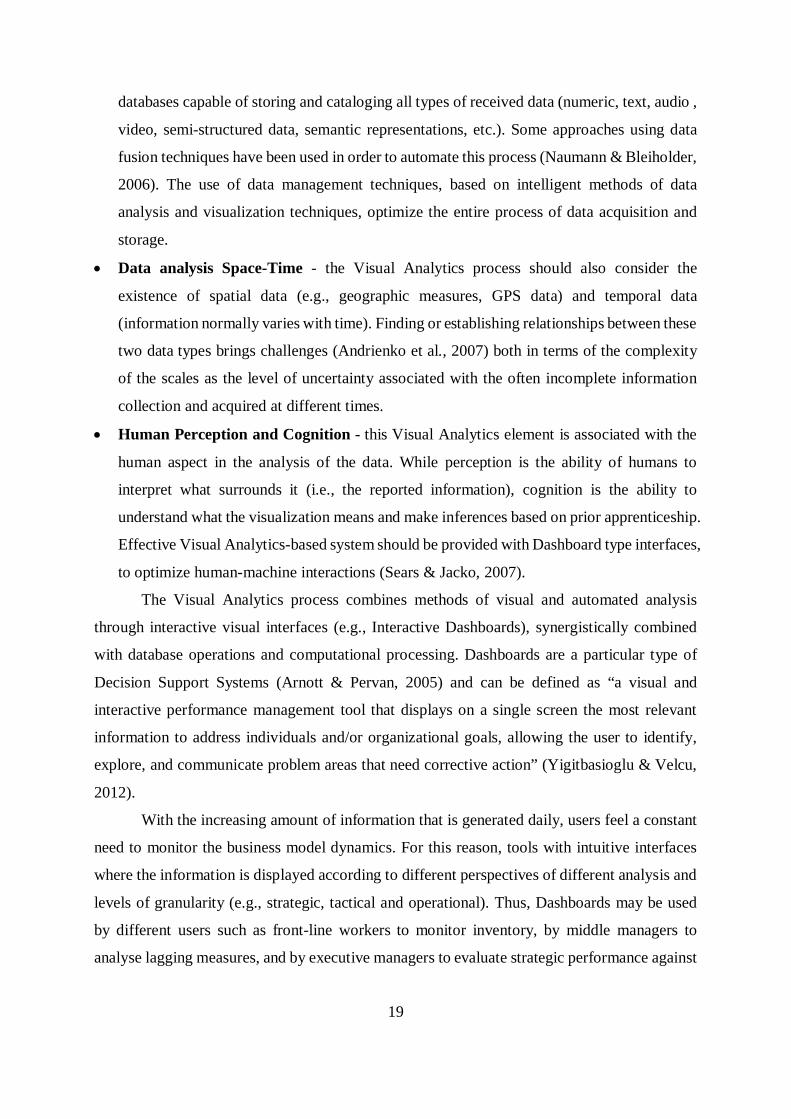
19
databases capable of storing and cataloging all types of received data (numeric, text, audio ,
video, semi-structured data, semantic representations, etc.). Some approaches using data
fusion techniques have been used in order to automate this process (Naumann & Bleiholder,
2006). The use of data management techniques, based on intelligent methods of data
analysis and visualization techniques, optimize the entire process of data acquisition and
storage.
· Data analysis Space-Time - the Visual Analytics process should also consider the
existence of spatial data (e.g., geographic measures, GPS data) and temporal data
(information normally varies with time). Finding or establishing relationships between these
two data types brings challenges (Andrienko et al., 2007) both in terms of the complexity
of the scales as the level of uncertainty associated with the often incomplete information
collection and acquired at different times.
· Human Perception and Cognition - this Visual Analytics element is associated with the
human aspect in the analysis of the data. While perception is the ability of humans to
interpret what surrounds it (i.e., the reported information), cognition is the ability to
understand what the visualization means and make inferences based on prior apprenticeship.
Effective Visual Analytics-based system should be provided with Dashboard type interfaces,
to optimize human-machine interactions (Sears & Jacko, 2007).
The Visual Analytics process combines methods of visual and automated analysis
through interactive visual interfaces (e.g., Interactive Dashboards), synergistically combined
with database operations and computational processing. Dashboards are a particular type of
Decision Support Systems (Arnott & Pervan, 2005) and can be defined as “a visual and
interactive performance management tool that displays on a single screen the most relevant
information to address individuals and/or organizational goals, allowing the user to identify,
explore, and communicate problem areas that need corrective action” (Yigitbasioglu & Velcu,
2012).
With the increasing amount of information that is generated daily, users feel a constant
need to monitor the business model dynamics. For this reason, tools with intuitive interfaces
where the information is displayed according to different perspectives of different analysis and
levels of granularity (e.g., strategic, tactical and operational). Thus, Dashboards may be used
by different users such as front-line workers to monitor inventory, by middle managers to
analyse lagging measures, and by executive managers to evaluate strategic performance against

20
objectives. In this Thesis, the approach to the concept of interactive and personalized
Dashboards advocated in the SDM was designed to incorporate the following concepts:
· Self-Awareness, capacity of introspection and the ability to recognize where the employee
currently is, in comparison with his peers, objectives and commitments. Through building
self-awareness, the employee will have a clearer understanding of the areas of behaviour
that he needs to manage more effectively. In this Thesis, this self-awareness culture,
supported by the SDM, is promoted by addressing employees' needs to access relevant
information, encouraging them to career development and progress, enriching their CV to
match the increasing business needs of an extremely competitive employment environment.
· Auto-Regulation, compliance with goals and inference deviations from the objectives and
commitments. In this area, the incorporation of progress monitoring techniques, combined
with Gamification techniques, presents additional stimulus in overcoming the challenges.
In this Thesis, the analysis of auto-regulation in collaborative environments brings
incentives resulting from teamwork, mutual support and share of experiences, possibly
complemented with mentoring actions by more experienced colleagues (e.g., senior
employees) or upper rated in the ranking. The visibility and risk exposure triggered by
events (e.g., certification is about to expire, employee interests in the current position or
where the employee plans to move in the short / medium term) according to the user model
(e.g., user profile and/or role/function) tend to monitor the adoption of desired behaviors
and therefore an overall improvement of the results.
· Data analytics, science of examining raw data with the purpose of extracting knowledge
from that information. In this Thesis, the analysis of raw data, according to its value and
interest (context), is key to support the user's decision process. The SDM is a Decision
Support System (DSS), intended to help decision makers (i.e. employees), by providing
them all the relevant information, regarding the actions that must be performed. The
timestamp data reported, together with the information representation of data (e.g., context
and semantics) define the metadata info-structure of support to the data
characterization/business model.
In this Thesis, the incorporation of Visual Analytics will explore the combination of
typical methods of Business Intelligence with the visual perception and analysis capabilities of
the human user, to ensure the best possible use of the increasing amount of information received.
Thus, the SDM will make use of Visual Analytics concepts like Data Analysis (via metadata
info-structure of support to the data characterization/business model) and Human Interaction

21
and Cognition (via Self-Awareness and Auto-Regulation). Through intuitive
interactive/personalized Dashboards, most relevant information is displayed according to
different perspectives of different analysis and levels of granularity, enabling it to be used by
different users and allowing them to identify, explore, and communicate problem areas that
need corrective action, in order to achieve one or several individual and/or organizational goals.
2.3. Talent Management from the Skills perspectiveTalent management (TM) is the science of using strategic human resource planning to
improve business value and to make it possible for companies and organizations to reach their
goals. Everything done to recruit, retain, develop, reward, engage and make people perform
forms a part of talent management as well as strategic workforce planning. A talent-
management strategy needs to link to business strategy to make sense.
For supporting an organization's need to plan, attract, retain, develop, reward and engage
talent, an integrated set of applications is required. Such applications include workforce
planning, talent acquisition/onboarding, performance appraisal/assessment, goal management,
learning management, competency management, and career development, among others. These
functional components align with the key human capital management (HCM) processes of plan
to source, acquire to onboard, perform to reward and assess to develop. A further boost to the
TM market is offered with functionalities to improve workforce engagement and collaboration,
as well as to provide greater analysis and even predictive insights to improve decision making
around workforce actions.
According to “Critical Capabilities for Talent Management Suites” report (Gartner,
2015), “providers of TM solutions are aggressively adding new features to keep up with demand
for workforce effectiveness in the digital workplace, but offerings still vary significantly”. For
this reason, “HR leaders should focus on a product's critical capabilities when evaluating the
evolving vendor landscape”.
Software Vendors rated as Leaders are not necessarily rated highest in specific use cases.
This report is a product-focused evaluation and analyses TM according to seven critical
capabilities (Recruiting, Onboarding, Performance and Goals, Learning Management,
Compensation Management, Career and Succession, and Reporting and Analytics Tools)
against four use cases (Attract and Retain Talent, Develop the Workforce, Pay for Performance,
High-Volume Talent Management), to identify which ones most closely fits organizations
potential use of TM technology.

22
In this Thesis, from these seven critical capabilities presented in this report, the most
relevant ones, from a Skills Management & monitoring perspective, are: Onboarding,
Performance and Goals, Learning Management, Career and Succession and Reporting and
Analytics Tools, which are described below.
· Onboarding, bridges the gap between candidates and employees. Involves form and task
completion, integration to a core Human Resource Management System (HRMS) for hiring
process management, integrated talent processes and support newcomers in their first
working day - "Day 1". In this domain, what is addressed in this Thesis is that senior
employees can take part on the Onboarding process. The reason for this is that the
experience and the knowledge of the organization culture detained by senior employees are
valuable assets to be shared with newcomers. Such approach would provide a relevant role
for older employees to be involved in onboarding tasks of new employees, providing at the
same time a strong message of recognition where their knowledge and experience are
considered as important information to share.
· Performance and Goals, tools to align the workforce with organization and team strategic
and operational goals and objectives, establish individual and team goals, evaluate
performance, and provide periodic feedback. Performance appraisals, goal management,
competency/skill assessments, development planning, and manager and peer feedback are
common elements. In this Thesis, the Visual Analytics Dashboards are defined as a visual
and interactive performance management tool that displays on a single screen, by means of
indicators, the most relevant information needed to achieve one or several individual and/or
organizational goals, allowing the user to identify, explore, and identify which areas require
the user attention and action.
· Learning Management, includes tools to develop, offer and track learning, create/manage
content, manage skills and competency development, and engage in multimodal learning
(e.g., class, video, mobile, offline, social, and discussions). In this Thesis, it's described an
interactive training environment (Training Catalogue), which enables the employee to
enroll in the advised training offers, increasing their skills, abilities and the overall CV
Evaluation, in order to stay aligned with the organization’s strategic and operational goals
and objectives.
· Career and Succession, how employees and organizations can together build career and
succession plans, using employee/talent profiles, career plans/paths, visualization (e.g., org
charting and n-box grids), talent pool management, succession planning, talent

23
review/assessment, and impact analysis. In this Thesis, the Visual Analytics Dashboards
enables visibility and risk exposure triggered by events (e.g., certification is about to expire)
and provides specific skills trainings and career options (e.g., employee interests in the
current position or where the employee plans to move in the short / medium term) according
to the user model (e.g., user profile and/or role/function), in order to increase employees'
skills and abilities and carry out their responsibilities into the company.
· Reporting and Analytics Tools, this value is the average product satisfaction rating from
customer reference feedback on the full range of reporting and analytic tools, including
standard reports, ad hoc report tools, metrics dashboards, and embedded analytics in
business application processes or predictive analytics. In this Thesis, through Visual
Analytics Dashboard interfaces alert mechanisms and indicators, employees are enabled to
perform a monitoring progress of their skills and performance, promoting an immediate
behavioral change and adoption of best-practices.
This Critical Capabilities report analysis differentiates each vendor's solution based on
the four most common use cases for TM, where the importance of specific functionality
depends of the business context.
· Attract and Retain Talent - Organizations embracing a TM approach prioritize
Recruiting/onboarding, performance/goals management, career/succession management
and learning management over other criteria. In this use case, organizations focus on
attracting, evaluating and selecting candidates for available openings, reinforcing their
employment brand with a smooth and effective onboarding, and retaining top performers
with a broad set of performance management, talent review and career development
processes. Organizations embracing this use case tend to be growing within their market
segments and/or expanding into other segments and geographies.
The SDM addressed in this Thesis follows a similar approach, it also intends to stimulate
the user interest in improving his/her skills and to keep the user engaged, informed and
motivated to keep using the SDM. The main goal is to help organizations to retain their
most productive and talented employees. The combination of these functionalities with
Gamification techniques like reputation and recognition induction, will foster a healthy
competitiveness and create high-performance and sustainable organizations that meets their
strategic and operational goals and objectives.
· Develop the Workforce - Organizations embracing a TM approach prioritize learning
management, performance/goals management, and career/succession management over

24
other criteria. In this case, the focus is on improving and measuring the capabilities of the
employee, not only for enhanced worker performance in current positions, but also to fit
with other roles or even job opportunities. These organizations career promotions tend to
be from inside (as opposed from outside recruitment), this is a typical recognition of the
value of long-term workers as opposed to sort-terms workers who easily leave the
organization in the first opportunity they find attractive. As a result, providing personalized
learning plans and measure employees’ learning effectiveness are top priorities.
Through the combination of Gamification and information visualization mechanisms and
indicators, the SDM addressed in this Thesis intends to keep employees aware about their
skills and performance and encourage them to upskill their competencies and invest on
career progress. These new skills can be selected through dynamic events triggered by an
IA and based on metadata from the user profile and/or role/function, or via a training
catalogue which has an enormous and diverse skills offering, where employees can search
and submit their skill(s) request(s). Based on the reported interests, career ambition or role
needs, the system is able to provide recommendations regarding which soft and hard skills
are more adjusted to the employee interests, in order to increase employees' skills and
abilities and carry out their responsibilities into the company.
· Pay for Performance - Organizations embracing a TM approach prioritize
performance/goals management, and compensation planning functionality, trying to
strengthen the link between workforce pay and performance. In this use case, organizations
focus on attempting to strengthen the link between perceived performance and the various
forms of compensation (base pay, bonuses, incentives and equities, for example) paid to
workers by deploying such processes as goals management, robust performance appraisal,
and comprehensive compensation planning.
The use of gaming techniques (e.g., scoring, ranking) can motivate employees to constantly
invest effort to improve their performance (e.g., rank classification, encourage
ambition/self-achievement) and introduce reward mechanisms to promote behavior change
by encouraging/challenging the user. These rewards should be allocated for compensation
of progress and should focus on tying individual performance and compensation to business
outcomes. In the context of the SDM, employees may not enjoy learning new competencies,
yet they are motivated to continue doing so because of the possibility of something tangible
(e.g., monetary compensation, promotion) at the end of the process.

25
· High-Volume Talent Management - Organizations embracing a TM approach are in high-
volume/high-turnover industries and stress efficient recruiting/onboarding,
performance/goals management and learning management over other criteria. In this use
case, organizations tend to employ large numbers of workers (often hourly/low-level
salaried) in substantively similar roles, and the focus is on maintaining headcount levels by
hiring and deploying workers as quickly and efficiently as possible. A straightforward and
effective assessment of the employee's ability to meet current job responsibilities is key,
with a short-term learning focus on getting staff trained quickly and ready for immediate
and next roles.
The SDM addressed in this Thesis intends to improve and strengthen employee skills. In
order to provide adaptive and personalized learning plans and recommendations, it will be
necessary the combination of immersive advanced learning capabilities in order to obtain
highly personalized learning experiences. This is particularly true for key learning
indicators and indicators about the employee skilled level. Machine learning techniques and
algorithms can help improve the quality of the diagnostic information presented by TM, in
order to provide recommendations more adjusted to the profile / role of each user.
The “Critical Capabilities for Talent Management Suites” report (Gartner, 2015),
demonstrates that Critical Capabilities analysis differentiates the appropriateness of each
vendor's solution based on the four most common use cases for TM. In this Thesis, the
incorporation of TM will explore the combination of information visualization techniques with
Skills Management & monitoring related critical capabilities like Onboarding, Performance and
Goals, Learning Management, Career and Succession and Reporting and Analytics Tools
against the most common use cases for TM like Attract and Retain Talent, Develop the
Workforce, Pay for Performance and High-Volume Talent Management. Thus, the SDM
addressed in this Thesis, by adopting processes designed to engage, motivate, and retain highly
productive employees, intends to help organizations to maximize potential use of TM
technology, creating a high-performance and sustainable working environment that meets their
strategic and operational goals and objectives.
2.4. GamificationGamification is an emerging concept that started in 2010 and which still does not have
a precise definition because its scope and applicability to new domains increases each year,

26
therefore a consensual definition has not yet been agreed on. One of the definitions that found
widespread acceptance defines Gamification as the use of game-thinking and game mechanics
in non-game contexts in order to engage users and solve problems (Huotari & Hamari, 2012).
Another relevant definition for Enterprise Gamification, as an empathy-based process
of introducing, transforming and operating a service with affordances for gameful experiences
to teach, engage, entertain, and measure to support players’ overall value creation for indirectly
supporting an entity’s overall value creation (Herger, 2014).
In simple terms, it is a fun, outcome-based process of using “game” elements techniques
that game designers use to engage employees, reward and recognize individuals and keep
people motivated to achieve - sometimes extremely - ambitious results, adding value to business
and promoting loyalty. Organizations continuously encourage employees to achieve business
goals and are challenged to promote working environments driven by healthy competitive
practices. Using gaming techniques (e.g. scoring, rewards, badges, etc.) can encourage
employees to constantly invest effort to improve their performance (e.g. rank classification,
career development, encourage ambition and self -achievement) and stay aligned with the
organization’s strategic and operational goals and objectives. This is seen as a powerful 21st
century way of stoking the competitive nature of human beings — particularly millennials (i.e.,
a person reaching young adulthood around the year 2000) who have grown up in a digital world
where gaming is often the rule not the exception (Senthil Rajamarthandan, 2015).
To properly leverage Gamification, organizations must first understand basic game
mechanics that successfully engage employees. A company willing to explore and apply
Gamification activities should start by identifying ways to encourage participants to achieve
key goals — and those goals should be aligned with the organization’s strategic and operational
goals and objectives. Gamification can be adopted by organizations for internal (workforce) or
external (customers and/or partners) initiatives. In this thesis, the focus will be on internal
initiatives.
In the traditional feedback cycle, only at the end of the civil year employees receive
feedback related to their global performance assessment, usually done by their hierarchical
supervisor or management structure. By changing existing processes, organizations can achieve
fast and meaningful/accurate feedback, accelerating employees' growth and learning.
Unfortunately, in most organizations, short-term goals are unclear, particularly as the business
environment evolves quickly, making change inevitable. Moreover, business rules often lack

27
transparency; rewards and recognition are rarely given to participants who consistently exceeds
expectations across all dimensions throughout the year.
Organizations need to change their working mindset and establish small wins, with
intermediate milestones and guidelines to master new skills, keeping employees motivated to
continuously contribute to add value to business, meaning to be a valuable asset to the
organization. To increase competitive advantage, the organization should adopt tools to enable
employees to earn rewards and respect/recognition within their peer groups, as well as to
monitoring their skills and compere each competency with the ones required by the organization
or detained by the peer group or even by relevant competitors. The key is to create competition
in a scalable and automated way that can be used to drive repeatable results in a sustainable
manner. Driving competition, cooperation, networking and knowledge-sharing among
employees is critical to achieve short and long-term organization’s strategic and operational
goals and objectives.
Under this Thesis, motivation, challenges and competitiveness are seen as key elements
for the construction of a successful organizational network, eager to interact with the tools to
recognize their added value and above all to become promoters in using the SDM. This strategy
is based on the principle that motivation is a key pillar to retain and attract employees. Building
trust in relationships increases retention, engagement and rewarding of these employees,
gradually creates a motivated community committed to success factors relevant to both the
employee and the organization. In the literature it is possible to find two driving forces: intrinsic
motivation related to inner strength (Mekler, Brühlmann, Tuch, & Opwis, 2015) and extrinsic
motivation related to the surrounding context (i.e., with external factors).
· Intrinsic motivation (IM) drives behaviors that result in internal rewards, like enjoyment,
positive feelings and happiness. With increasing IM, people have a genuine desire for the
activity, leading to an increase of their self-esteem (SE), and therefore a greater propensity
to complete tasks, predisposal to cooperate and eagerness to learn. As a consequence,
significant improvements in the process of learning / using the SDM leads to a deeper
understanding and the creation of fitness. In other words, greater willingness to look at the
SDM as a personal tool set for themselves without third-party interference, addressing their
concerns, needs and interests.
· Extrinsic Motivation (EM) involves doing something for its external rewards, like money
or something tangible. The application of extrinsic motivational elements is suitable for
specific situations, where people have resistance (or little interest) to the initial

28
implementation of a particular activity or adoption of a new technology (i.e. a typical
behavior of resistance to change). In this scenario, the introduction of reward mechanisms
can promote behavior change by encouraging / challenging the user. These rewards should
be allocated for compensation of progress and should be directly linked to the performance
of a specific behavior. In the context of the SDM, employees may not enjoy learning new
competencies, yet they are motivated to continue doing so because of the possibility of
something tangible (e.g., monetary compensation, promotion) at the end of the process.
Gamification uses an approach based on empathy (with origins in Interaction Design
and DSR), introducing concepts built on observation of the experiences, needs and preferences
of the users. It provides a search process for determining an appropriate solution for a given
problem, for a number of iterative cycles over which the solution is incrementally refined,
ultimately resulting in a successful implementation and improving the human-machine
interface. In the scope of the SDM, the following Gamification techniques were analyzed and
considered to be applied within the Active@Work project:
· Merit & Leadership Board - an emerging practice in the prospective organizations to
assign leaderboards in different areas of knowledge. The presence in the top-performers
board will be a diffusion mechanism of leadership and mastery of assigned functions and
goals (over)achieved. The connection to an organizational networks represents a leverage
to create competition through levels of excellence and will contribute to the enhancement
of the CV.
· Levels and Reputation (Scoring & Ranking) - techniques that induce feelings of pride,
professionalism and therefore of greater responsibility in the user-subscribed challenges.
These techniques stimulate commitments in terms of engagement and involvement of the
user in his career progress, to improve its ranking in order to match or exceed those with a
rating better and therefore to a better position in the league table (i.e., ranking).
· Competition - this technique intends to stimulate behaviors of healthy competition,
promoting group dynamics and therefore stimulate cooperation between employees or
employees' groups. In a pragmatic approach, this technique is used to describe a situation
in which success is measured in terms of results.
· Points (Point System) - common technique in loyalty systems, it intends to incorporate
best practices to create tools of promoting and retaining talent, able to fidelize talents
rewarding them with the chance to make use of the benefits associated with points earned
in the SDM. In practice, it is a technique to motivate and encourage desired behaviors.

29
In this Thesis, the incorporation of Gamification will explore paradigms based on game
theory and take advantage of technological advances to benefit employees and organizations.
Thus, the SDM will make use of concepts like Merit Boards (via Assessments), Levels &
Reputation (via Scoring & Ranking) for, through a Skills Management interface (see section
3.3.2 for more details) using data analysis techniques expressed in indicators (i.e. Dashboards
type interfaces), provide information to the employee regarding their skills, recognition of their
efforts, stimulating competition and motivation to improve their CV.
3. Skills Management Awareness ModelThis chapter describes how the research challenges were conducted, including the
research work related to theoretical frameworks and assumptions. The chapter also provides a
description to the assessment of the suitability of the proposed method, reliability of the
expected outcomes and validity of the model flexibility and applicability to other TM domains.
The proposed solution for the problem identified in Chapter 1 is also presented.
3.1. The role of Active@Work in Skills ManagementThe theoretical framework associated to the research work that supports this Thesis
aims to contribute to improve employees' self-awareness and auto-regulation, through the
specification of the SDM, a software component that is part of the overall architecture of the
Active@Work project (see chapter 4 for more details). In this Thesis, two predominant research
areas are object of great interest: Visual Analytics and Gamification. The Visual Analytics
provided the theoretical foundation to specify personalized dashboard interfaces with a set of
indicators defined in an innovative way. Based on an info-structure, each indicator can be
specified dynamically by the business user at run time without requiring the intervention of any
programmer. Associated to each indicator a set of thresholds will trigger notifications whenever
those thresholds are exceeded keeping the user aware whenever their intervention is required.
The incorporation of Gamification techniques like Merit Boards (via Assessments),
Levels & Reputation (via Scoring & Ranking), Points (via CV Evaluation) and (healthy)
competiveness, through data analysis techniques expressed in indicators (i.e. Dashboards type
interfaces), intends to take advantage of technological advances to promote employee’s
awareness regarding their skills, recognition of their efforts, stimulating competition and
30
motivation for auto-regulation, in order to keep the CV aligned with the expertise required or
valorized by the organization, benefiting both parts.
Through the combination of Gamification techniques with Talent Management,
processes designed to engage, motivate, and retain highly productive employees were adopted,
to foster a sustainable and competitive working environment, where employees are encouraged
to develop new skills or invest in career options. The SDM addressed in this Thesis provides a
way to assist employees in keeping their CV aligned with what is required from the employer
point-of-view as well as from an academic or professional perspective keeping the employee
aware about recommendation to improve the skills level so that the CV assessment is kept at
higher rates.
Within the scope of the Active@Work project, the management of employees skills is
foreseen as a critical requirement in promoting a healthy but competitive and demanding work
environment where each employee is encourage to continuously improve his/her knowledge
and expertise. This effort is publically recognized by the organization through the adoption of
a solution with the capabilities defined for the SDM. Such approach is particularly adjusted in
the area of Consulting and IT Service Delivery (White-collar workers 3 ) with a focus on
promoting active aging initiatives in the workplace. By encouraging senior employees to share
their valuable skills and expertise with less experienced employees or newcomers, the
theoretical foundation is to keep them motivated, increasing at the same time team spirit. The
Active@Work architecture consists on the following modules (see Chapter 4 for more details):
· A Cognitive module, this module is responsible to represent the conditions of the work
environment providing a catalogue of services to assist the user in their daily work, avoiding
critical clinical situations (i.e., surveillance of clinical parameters by periodically collecting
data from wearable bio-sensors and by analyzing data related to the quality of the work
space environment, data collected through environmental sensors), assuring in this way
workers well-being at the work environment;
· A Collaborative module, to promote active participations and interactions between
employees, sharing of experiences amongst senior and younger employees. Provide a
collaborative environment to endorse innovative ideas as well as the establishment of
mentoring services;
3 Cfr: White-collar_worker, accessed on 28/05/2016

31
· A Skills Development module, intends to provide support for the employees to engage in
new and rewarding activities, where senior employee’s knowledge and expertise can be an
important asset. The major goal of this module is to provide a user-friendly environment
for employees to manage/develop their skills within the organization. This is the module
addressed in this Thesis.
3.2. Workforce Skills AnalysisIn the scope of the SDM, the Visual Analytics Framework provides a combination of
automated analysis techniques with interactive techniques of information visualization. The
objective aims to enhance comprehension of large data sets (i.e., Big Data) for analysis through
interactive visual interfaces (i.e., Dynamic Dashboards). The incorporation of Gamification
techniques will explore paradigms based on game theory and take advantage of technological
advances to benefit employees. The objective aims to make use of techniques like Merit Boards
(i.e., Assessments), Levels & Reputation (i.e., Scoring & Ranking) and Points (i.e., CV
Evaluation) to provide relevant information to the employee regarding their skills through data
analysis techniques expressed in indicators. The articulation of these scientific research areas
intends to improve employees’ self-awareness and auto-regulation:
· Self-Awareness, the interactive/dynamic Dashboard interfaces are presented as a
monitoring instrument, combined with key elements like motivation, challenges and healthy
competitiveness, enabling the employee to continuously monitor his/her ranking in relation
to his peers, objectives and commitments. Figure 8 provides an overview of the employees’
Personal Skills Dashboard – the section mapped with the A letter. This graphical interface
presents the information structured into sections to streamline and enable the reading of the
information in an eye-blink. For instance, the section mapped with the B letter, provides
information related to indicators such as: the “CV evaluation”, “Assessment”, “Peers
Average”, “Ranking” position and “Employee CV composition” (i.e., pie chart) are showed.
A detailed explanation about these kind of indicators are presented in section 3.3.1. The
section mapped with the C letter, provides information related to “My Messages” area,
where alert display features with different levels of severity – Alerts, Warnings and
Recommended. This kind of alerts are triggered via multichannel and are also presented in
section “My Training History”, where the employee can check either the most recent
training courses or the full list of trainings attended - the section mapped with the D letter.

32
Figure 8. Mockup of the Personal Skills Dashboard layout
By accessing this relevant information, by means of alert mechanisms and indicators, the
interface capabilities of the Personal Skills Dashboard enables employees to promote
changes in their behavior, which may be extremely important in cases where the employee's
CV may lose significant relevancy (e.g., acknowledged competencies versus required skills
for the current position), in an increasing competitive working environment. The Skills
Management interface (see section 3.3.2 for more details) enables the business user to
configure the most relevant indicators, according to the organization’s strategic and
operational goals and objectives.
· Auto-Regulation, in the SDM, the Dashboard is also responsible for keeping the user
constantly informed about events requiring his/her immediate attention. Figure 9 illustrates
a structure of employees’ competencies (Personal Skills) classification, grouped by Hard &
Soft Skills categories, and sub grouped in parameters, which represents employee’s skills –
the section mapped with the A letter. Within the detail of each parameter, whenever
applicable the user is informed about the risk of expiring some certification (i.e.,
professional expertise), through the Status field – the section mapped with the B letter. In
response to such notification, the employee can trigger a workflow by activating the “Assign”
option, one of the possible operations/status of the Action field, that allows to mitigate the
risk associated to the Alert -– the section mapped with the C letter.
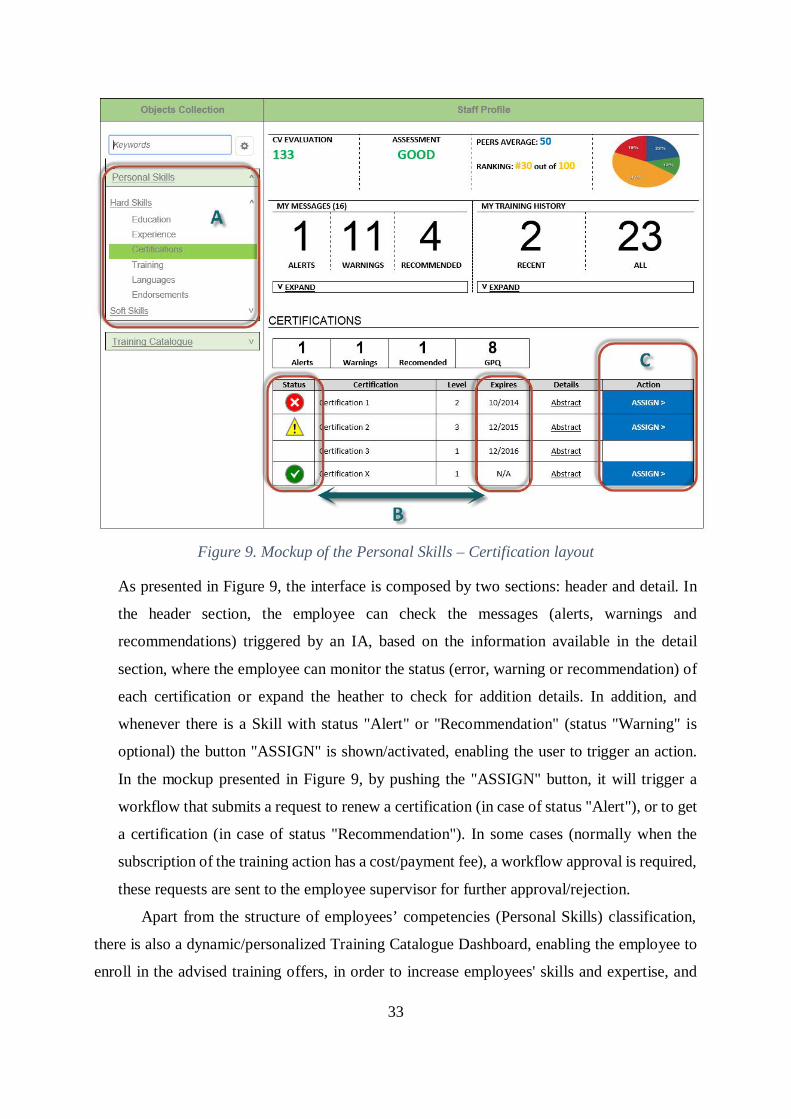
33
Figure 9. Mockup of the Personal Skills – Certification layout
As presented in Figure 9, the interface is composed by two sections: header and detail. In
the header section, the employee can check the messages (alerts, warnings and
recommendations) triggered by an IA, based on the information available in the detail
section, where the employee can monitor the status (error, warning or recommendation) of
each certification or expand the heather to check for addition details. In addition, and
whenever there is a Skill with status "Alert" or "Recommendation" (status "Warning" is
optional) the button "ASSIGN" is shown/activated, enabling the user to trigger an action.
In the mockup presented in Figure 9, by pushing the "ASSIGN" button, it will trigger a
workflow that submits a request to renew a certification (in case of status "Alert"), or to get
a certification (in case of status "Recommendation"). In some cases (normally when the
subscription of the training action has a cost/payment fee), a workflow approval is required,
these requests are sent to the employee supervisor for further approval/rejection.
Apart from the structure of employees’ competencies (Personal Skills) classification,
there is also a dynamic/personalized Training Catalogue Dashboard, enabling the employee to
enroll in the advised training offers, in order to increase employees' skills and expertise, and

34
with this, to increase the corresponding overall CV Evaluation indicator. Figure 10 provides an
overview of the employees’ Training Catalogue Dashboard - the section mapped with the A
letter. This graphical interface presents the information structured into sections to streamline
and enable the reading of the information in an eye-blink. For instance, the section mapped with
the B letter, provides information related to indicators such as: total number of trainees, total
number of sessions and average score for the attended trainings. The section mapped with the
C letter, provides information related to “My Skills Plan” area, where the employee can check,
per Skill Type (e.g., Hard Skills) and Category (e.g., Certifications) and with different levels of
relevance – Alerts, Assignments and Recommendations - the list of Training sessions already
scheduled and assigned to his/her name (Alerts), the list of Training sessions approved by the
business user (Assignments), or the list of Training sessions dynamically recommended by the
SDM, based on the user profile and/or role/function.
Figure 10. Mockup of the Training Catalogue Dashboard layout
The dynamic/personalized Training Catalogue Dashboard interfaces enables employees to
access the information of the most requested training offers, and choose the skills training
offers that most contributes for enriching their CV according to current business needs.
The specification of these two Dashboards required the definition of a metadata info-
structure capable of integrating all the knowledge about User Models and respective archetypes
(i.e., an original model or type after which other similar things are patterned; a prototype)
information. Data analysis assumes a strategic dimension in the generation of multidimensional
information according to the user profile and/or role/function. The value of metadata aims to

35
more efficiently classify and organize information, as well as to yield deeper insight into the
actions taking place across the organization, providing more intelligence and higher quality
information to fuel big data initiatives, automation, compliance, data sharing and collaboration.
3.3. Metadata Info-StructuresMetadata is "data that provides information about other data"4. While the metadata
application is manifold covering a large variety of fields, there are specialised and well-accepted
models to specify types of metadata. These can be distinguished between three distinct types:
Descriptive, Structural and Administrative (“Understanding Metadata,” 2004). Descriptive
metadata describes a resource for purposes such as discovery and identification. It can include
elements such as title, abstract, author and keywords. Structural metadata is used to characterize
the structure of database objects such as tables, columns, keyword (from a business point of
view) and indexes. Administrative metadata provides information to help manage a resource,
such as when and how it was created, file type and other technical information.
The SDM addressed in this Thesis is aligned with a solution based on structural and
descriptive metadata, which allows a business user to dynamically characterize the data
structure of the objects used by the software components of the proposed solution (e.g., Personal
Skills, Training Catalogue and the corresponding Dashboards), composed by indicators with
different types of assessment. This approach provides a full flexibility, enabling business user
to maintain the structure of attributes that characterize each of the parameters available on the
system, in addition to complete flexibility in configuring the layout (i.e., dynamic specification
of descriptive attributes) according to their information needs, without any intervention from
the IT department.
3.3.1.Skills Metadata ManagementThe maintenance of the structure of attributes that characterize each of the parameters
available on the system needs to be kept up-to-date and an appropriate approach for managing
metadata needs to be set. In this Thesis the management of Metadata corresponds to an end-to-
end process and governance framework for creating, controlling, enhancing, attributing,
defining and managing a metadata schema, model or other structured aggregation system, either
4 Cfr: Metadata, accessed on 07/05/2016

36
independently or within a repository and the associated supporting processes (often to enable
the management of content).
In the SDM, the Personal Skills Dashboard illustrated in Figure 11 presents a set of
indicators providing measurements related to skills monitoring from different perspectives,
structured into sections to streamline and assist the reading of the information. For instance, the
indicator “CV Evaluation” is represented in the section mapped with the A letter, the indicator
“Assessment” is represented in the section mapped with the B letter and the indicators “Peers
Average”, “Ranking” position and “CV composition” are represented in the section mapped
with the C letter.
Figure 11. Mockup of the Personal Skills Dashboard Indicators layout
The values of each indicator are fed through Gamification techniques. For instance, the
value 133 shown for the indicator “CV Evaluation”, expressed as CE for simplification, is
obtained through a quantitative calculation of all the employee Hard & Soft Skills metrics, by
a means of a formula defined by the business user. This means that, the more
skills/competencies the employee has, the higher the “CE” indicator value will be. The
complete expression of the CE formula is presented in Table 2.
.
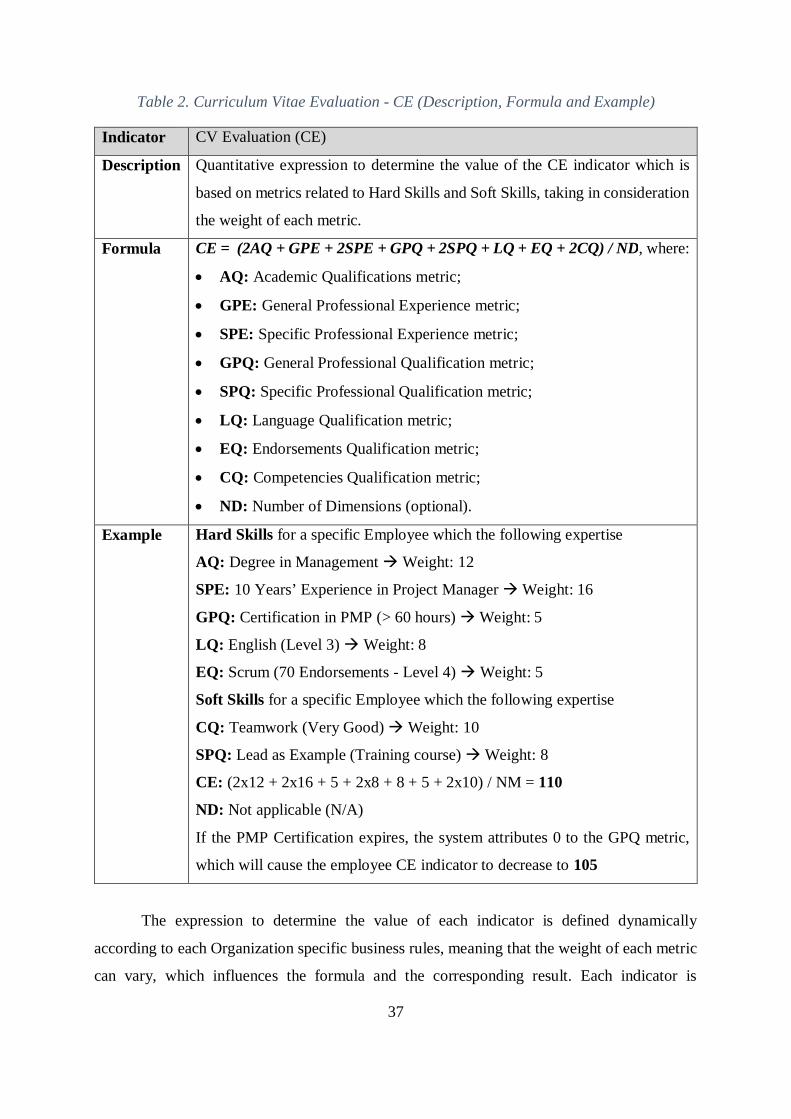
37
Table 2. Curriculum Vitae Evaluation - CE (Description, Formula and Example)
Indicator CV Evaluation (CE)
Description Quantitative expression to determine the value of the CE indicator which is
based on metrics related to Hard Skills and Soft Skills, taking in consideration
the weight of each metric.
Formula CE = (2AQ + GPE + 2SPE + GPQ + 2SPQ + LQ + EQ + 2CQ) / ND, where:
· AQ: Academic Qualifications metric;
· GPE: General Professional Experience metric;
· SPE: Specific Professional Experience metric;
· GPQ: General Professional Qualification metric;
· SPQ: Specific Professional Qualification metric;
· LQ: Language Qualification metric;
· EQ: Endorsements Qualification metric;
· CQ: Competencies Qualification metric;
· ND: Number of Dimensions (optional).
Example Hard Skills for a specific Employee which the following expertise
AQ: Degree in Managementà Weight: 12
SPE: 10 Years’ Experience in Project Managerà Weight: 16
GPQ: Certification in PMP (> 60 hours)à Weight: 5
LQ: English (Level 3)à Weight: 8
EQ: Scrum (70 Endorsements - Level 4)à Weight: 5
Soft Skills for a specific Employee which the following expertise
CQ: Teamwork (Very Good)à Weight: 10
SPQ: Lead as Example (Training course)à Weight: 8
CE: (2x12 + 2x16 + 5 + 2x8 + 8 + 5 + 2x10) / NM = 110
ND: Not applicable (N/A)
If the PMP Certification expires, the system attributes 0 to the GPQ metric,
which will cause the employee CE indicator to decrease to 105
The expression to determine the value of each indicator is defined dynamically
according to each Organization specific business rules, meaning that the weight of each metric
can vary, which influences the formula and the corresponding result. Each indicator is

38
characterized by a set of metadata, namely: an Indicator type (e.g., Cost, Benefit, On Target), a
set of thresholds to define distinct severity levels and dynamically triggers alert notifications,
whenever the corresponding values exceed the defined range for each predefined threshold. A
detailed list of the indicators defined within the scope of this thesis are described in Annex D.
In the SDM, an example of the maintenance of the structure of attributes that
characterize each of the parameters which represents employees' skills is illustrated in Figure
12. The section mapped with the A letter, presents the structure of employees’ competencies
(Personal Skills), grouped by two main categories (Hard & Soft Skills) and subdivided in
Parameters (e.g., Education). The section mapped with the B letter, represents the information
associated to the characterization of the parameter “Education” that was assigned to the
category Hard Skills. The description of the selected parameter “Education” is accomplished
based on a set of attributes, which are managed dynamically using the interface of the Skills
Management (see section 3.3.2 for more details). In this case, the value of the Academic
Qualifications (AQ) metric is determined based on the information listed on each row, meaning
that depending on the number of academic qualifications detained by a specific employee, the
higher the value of the AQ metric. This kind of correlation corresponds to a predefined formula
that is defined using the Skills Management interface. The current value of the AQ is
represented in Figure 12 with the C letter.
Figure 12. Mockup of the Personal Skills – Education layout
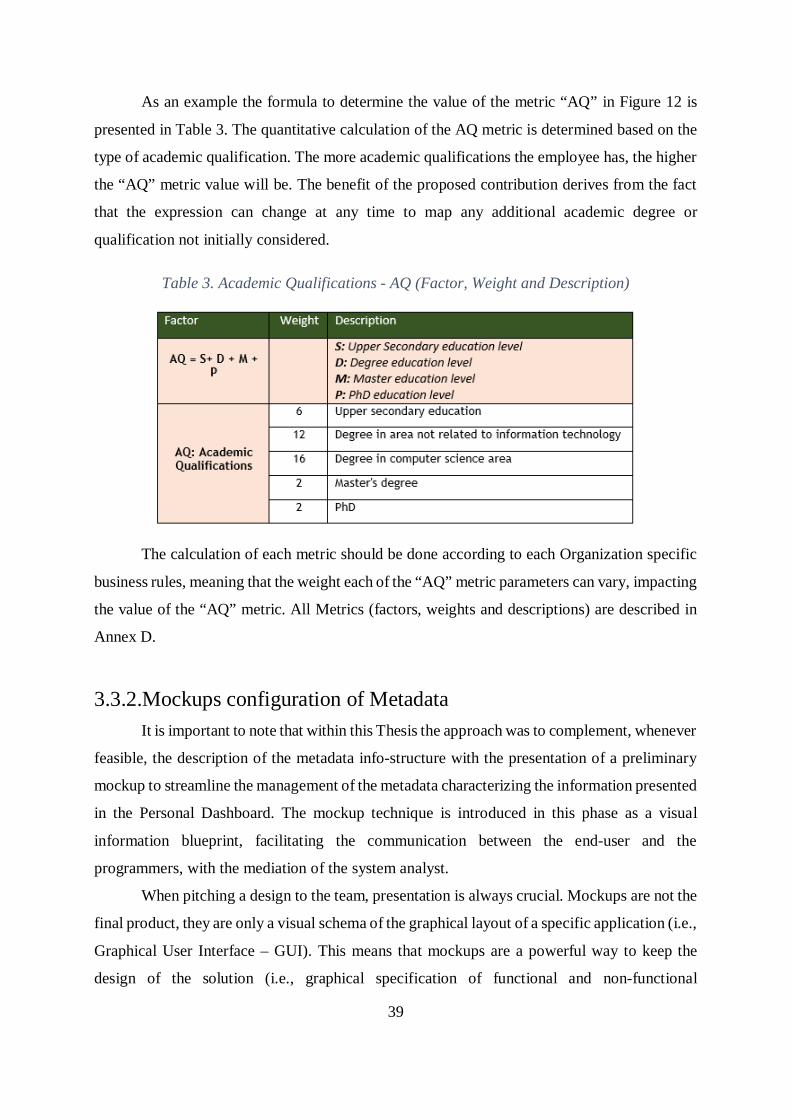
39
As an example the formula to determine the value of the metric “AQ” in Figure 12 is
presented in Table 3. The quantitative calculation of the AQ metric is determined based on the
type of academic qualification. The more academic qualifications the employee has, the higher
the “AQ” metric value will be. The benefit of the proposed contribution derives from the fact
that the expression can change at any time to map any additional academic degree or
qualification not initially considered.
Table 3. Academic Qualifications - AQ (Factor, Weight and Description)
The calculation of each metric should be done according to each Organization specific
business rules, meaning that the weight each of the “AQ” metric parameters can vary, impacting
the value of the “AQ” metric. All Metrics (factors, weights and descriptions) are described in
Annex D.
3.3.2.Mockups configuration of MetadataIt is important to note that within this Thesis the approach was to complement, whenever
feasible, the description of the metadata info-structure with the presentation of a preliminary
mockup to streamline the management of the metadata characterizing the information presented
in the Personal Dashboard. The mockup technique is introduced in this phase as a visual
information blueprint, facilitating the communication between the end-user and the
programmers, with the mediation of the system analyst.
When pitching a design to the team, presentation is always crucial. Mockups are not the
final product, they are only a visual schema of the graphical layout of a specific application (i.e.,
Graphical User Interface – GUI). This means that mockups are a powerful way to keep the
design of the solution (i.e., graphical specification of functional and non-functional
40
requirements) within the project boundaries. In this way, it is possible to graphically express
the metadata info-structure in an early stage of the project.
The Skills Management corresponds to a software component of the SDM and it aims
to provide a graphical interface to streamline the management of the metadata associated to the
informational artefacts presented in the Personal Dashboard, namely, characterization of the
indicators, characterization of the metrics, characterization of any descriptive attribute or even
defining lists of predefined values. The Skills Management interface implements a Metadata
Framework to assist business users in dynamically managing the data structures for both the
Personal Skills Dashboard and Training Catalogue Dashboards. As presented in Figure 13 the
interface is composed by four main components, correlated with each other: Lists, Parameters,
Metrics and Indicators, displayed through a tab menu. These four tabs have a logical precedence
that needs to be followed to create, for instance, a standard description to the possible values of
a specific attribute to be used as a relevant determinant to the formula of a metric that is used
by a specific indicator.
Whenever the business user needs to create a new parameter (e.g., Education), for the
category “Hard Skills” under the employees’ competencies (Personal Skills), the user should
start by selecting the “Lists” tab. The “Lists” tab enables the business user to define a list of
values which can be assigned, if required, to the attributes presented as headlines for the (Skills)
Parameter selected in the “Personal Skills/Training Catalogue” menu. When a new “List” is
created, the business user should define a name (e.g. List of AQs – Academic Qualifications)
and select the type of the field in the “List Type” cell. The user should also define if the List
should be active or not by selecting the “Active” option. The list of values created should be
assigned to a “Parameter” attribute whenever the business user needs to restrict the input to the
domain of values expressed by the selected list. For more details about the creation of a list of
values see Annex A.

41
Figure 13. Skills Management – Metadata configuration interface
The “Parameters” tab provides a way to dynamically define the set of metadata that
represents the data structure of a skills parameter, enabling the business user to define the
attributes of the (Skills) Parameter selected in the “Personal Skills/Training Catalogue” menu.
For the new parameter to be created (i.e., Education), the business user starts by filling the
“Skills Parameter” and the “Tooltip” (i.e., message which appears when a cursor is positioned
over an element in a GUI) cells with “Education”. Then, the business user has to classify it as
“Personal Skills” in the “Parameter Group” cell and as “Hard Skills” in the “Skills Group” cell.
The “Parameters” UI is illustrated in the Figure 14 below.

42
Figure 14. Metadata Configuration - Parameters
When the business user presses the “Expand” icon, the configuration of the metadata
available enables the business user to configure the name of the attributes to be presented as
headlines in the Workspace area. In addition to the name of the attributes, the configuration of
the metadata available allows the business user to specify a “Field Description” and select the
type of the field in the “Field Type” cell. The business user should also specify if the field is
“Mandatory/Optional” in the “Required” cell and the “Yes/No” option in the “Visible” cell. In
case the “Mandatory” option in selected in the “Required” cell, the “Visible” cell should
automatically be filled with “Yes”, due to the dependency between both fields. Finally, the
business user should decide to define if the field should have a default single value, by filling
the “Default Single” cell or it should have a default list of values, by selecting the required “List
Name” in the “Default List Name” cell. In the figure above, the list of values illustrated in
Figure 13 (i.e., List of AQs) is assigned to the “Level” attribute. In this way, it is possible to
restrict the list of values that the attribute “Level” can assume. Any of the attributes created
should be assigned to a “Metric” whenever the business user needs to create a set of rules (i.e.,
formula) and the corresponding values (i.e., weight) for such attribute. For more details about
“Parameters” check Annex A.
The “Metrics” tab, provides a way to dynamically define the set of metadata that
characterize the structure of a Metric. It enables the business user to dynamically define a new

43
metric and define the corresponding expression (i.e., formula) that will determine the value of
the newly created metric. For each Metric, one or several rules (and the corresponding values,
i.e., weights), can be created. For the new “Skills Parameter” created (i.e., Education), the
business user starts by filling the “Metric Name” and the “Metric Description” cells. The
assigned skill parameter “Education” shall be used as a category of the selected ”Metric” and
the cell “Field Name” can only be activated once a valid option is selected for this cell, due to
the dependency between both fields. This means that the list of values to be presented in the
“Field Name” cell are dependent on the selected “Skills Parameter”. Finally, the cell “List Name”
can only be activated once an option is selected in the “Field Name” cell, due to the dependency
between both fields. In case the “Field Name” selected is already assigned to a “List Name”,
the “List Name” cell is automatically filled with the “List” assigned (i.e., List of AQs).
Otherwise, the business user should decide to define if the metric should have a default list of
values, by selecting the required “List Name”. The “Metrics” UI is illustrated in the Figure 15
below.
Figure 15. Metadata Configuration - Metrics
When the business user presses the “Expand” icon, the configuration of the metadata
available enables the business user to specify a “Metric Expression” and a “Metric Value”, as
illustrated above. In case the “List Name” cell is filled, the “List Name” values of the selected
“List Name” are automatically assigned to the “Metric Expression” cell and the business user
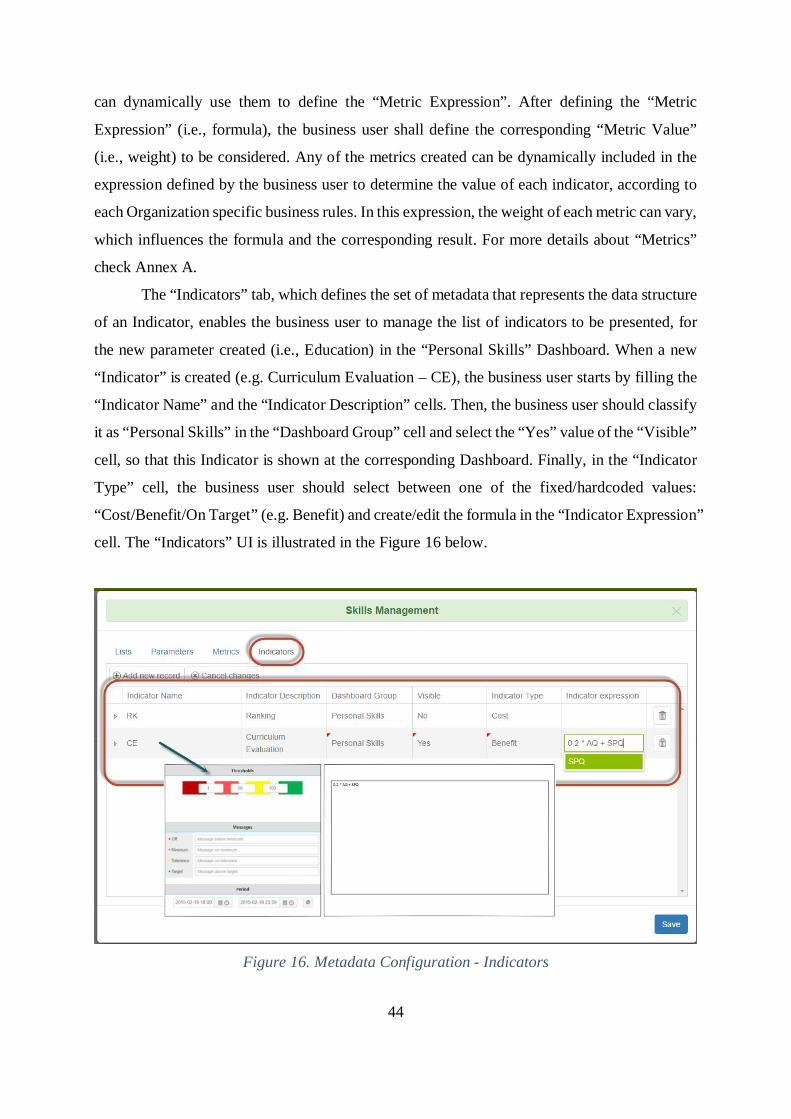
44
can dynamically use them to define the “Metric Expression”. After defining the “Metric
Expression” (i.e., formula), the business user shall define the corresponding “Metric Value”
(i.e., weight) to be considered. Any of the metrics created can be dynamically included in the
expression defined by the business user to determine the value of each indicator, according to
each Organization specific business rules. In this expression, the weight of each metric can vary,
which influences the formula and the corresponding result. For more details about “Metrics”
check Annex A.
The “Indicators” tab, which defines the set of metadata that represents the data structure
of an Indicator, enables the business user to manage the list of indicators to be presented, for
the new parameter created (i.e., Education) in the “Personal Skills” Dashboard. When a new
“Indicator” is created (e.g. Curriculum Evaluation – CE), the business user starts by filling the
“Indicator Name” and the “Indicator Description” cells. Then, the business user should classify
it as “Personal Skills” in the “Dashboard Group” cell and select the “Yes” value of the “Visible”
cell, so that this Indicator is shown at the corresponding Dashboard. Finally, in the “Indicator
Type” cell, the business user should select between one of the fixed/hardcoded values:
“Cost/Benefit/On Target” (e.g. Benefit) and create/edit the formula in the “Indicator Expression”
cell. The “Indicators” UI is illustrated in the Figure 16 below.
Figure 16. Metadata Configuration - Indicators
45
When the business user presses the “Expand” icon, the configuration of the metadata
available enables the business user to define the values from the corresponding fields of the
“Thresholds” and “Messages” sections, as well as to set the “Period of validity” of the Indicator
and create/edit the formula in the “Indicator Expression” cell, as illustrated above. For more
details about “Indicators” check Annex A.
The SDM was designed based on the implementation of some Gamification techniques
(e.g., Merit Boards, Reputation, Points and Competition) to encourage and motivate users to
modify their behaviour and adopt best practices. For achieving it, it is important to create
attractive and user-friendly applications that foster people to take the measurements that
organizations need. In this Thesis, DSR was adopted because it follows a user-centric approach
that encourages the use of the mockups technique for an active interaction with the different
stakeholders in the validation of non-functional requirements. This approach streamlines
communication and promotes a more expeditiously contributions collection, leading to an
iterative process of continuous improvement. The purpose here is to learn from the
stakeholder’s feedback and if necessary iterate back to prior stages to improve the mockups.
Voting in the team or ideally with the end-users can select the best drafts, which shall be taken
as a basis for the final solution development. This approach was followed in the Active@Work
project, where the users analyzed the mockups online and provide feedback/improvement
recommendations and the project developers contributed with questions which helped to
improve the level of usability and clearness of the SDM GUI.
The use of conceptual domain models is an important part of this process as they define
the Universe of Discourse (UoD) and facilitates the proper semantic integration of the
information within a domain.
3.3.3.Domain modelA domain model is a conceptual model containing the concepts of importance to a
certain domain (i.e., business context) as well as the relationships between these concepts. It
represents the ‘things’ that exist or events that transpire in the business environment. The
domain model is a high level logical view of information requirements and structure. The
domain model is at a high level of abstraction and should not be confused with database models
or schemas, which will be at a much greater level of detail. The domain model is not concerned
with the way in which data or information is physically held or processed. It may include
concepts and data which are not currently implemented or stored exactly as modelled. This

46
means that the domain model can include other data that may reside in a variety of physical
databases or file systems under the control of distinct software modules. As such, it represents
information that will be shared across the research project and which is necessary for the
development team to carry on normal operations, monitor performance and make operational
decisions.
The Skills Management Metadata Framework domain model presented in Figure 17 was
designed using the UML Notation. The classes prefixed with the letter “M” correspond to
Technical/Structural metadata classes and are used to store and manage metadata. The letter
“M” type classes represent the list of Tabs described in section 3.3.2 (i.e., Lists, Parameters,
Metrics and Indicators) and are used to store the list of attributes that describe the values
recorded in classes prefixed with the letter “V” (to be described later in this section). Each one
of these letter “M” type classes are divided in two subtypes:
• MxxxH, used to identify header-related metadata;
• MxxxL, used to identify lines-related metadata;
When the business user needs to create a new parameter (e.g., Education), for the
category “Hard Skills” under the employees’ competencies (Personal Skills), it should start by
creating a “List”. Whenever a new “List” is created, one new entry is created in the “MListH”
class (with the header information, e.g., List Name) and as many entries in the “MListL” class
as the number of values defined (e.g., List AQ is composed by 4 values, means 4 entries in the
MListL class). The list of values created should be assigned to a “Parameter” attribute
whenever the business user needs to restrict the input to the domain of values expressed by the
selected list.
The next step is to create the (skills) parameter (i.e., Education) by using the “Parameters”
tab. Whenever a new “Parameter” is created, one new entry is created in the “MParameterH”
class (with the header information, e.g., Tooltip) and as many entries in the “MParameterL”
class as the number of attributes defined (e.g., assuming that the Education parameter is
composed by 3 attributes, means 3 entries in the MParameterL). In addition, a new class (e.g.,
VSS_Education) is automatically generated with the attributes defined for the Parameter
created. The classes prefixed with the letter “V” correspond to Descriptive metadata classes and
are used to store and manage Skills-Management related data. Each one of these prefixed letter
“V” type classes are divided in two subtypes:
· VSSxxx, used to identify Staff Skills (SS)-related data;
· VTCxxx, used to identify Training Catalogue (TC)-related data.

47Figure 17. Skills Management domain model using the UML Notation (with Mxxx type classes)

48
For each prefixed letter “V” type classes, there are two fixed attributes: Status and
Action, which are automatically created and have pre-defined values:
· Status, Empty, Error , Warning and Recommendation;
· Action, Empty, Assign, Open, In Analysis, Approved, Rejected and Scheduled.
These two attributes are mandatory, in order to evaluate the status of the employees’
skill parameter and trigger an Action, whenever a specific skills becomes invalid (e.g., expired
certification).
The Skills Management Metadata Framework domain model, using the UML Notation
(with classes prefixed with the “M” & “V” letters), is illustrated in the Figure 18 below. The
business user can dynamically adjust the metadata characterization of the elements (e.g.,
add/remove attributes) from the prefixed letter “V” type classes generated, as required and
accordingly in the “MParameterL” class.
In case the business user wants to dynamically assign a metric to each attribute of the
new parameter created (i.e., Education), it should use the “Metric” tab. Whenever a new “Metric”
is created, one new entry is created in the “MMetricH” class (with the header information, e.g.,
Metric Name) and as many entries in the “MMetricL” class as the number of combinations of
“Expressions” (i.e., formula) and “Values” (i.e., weight) defined (e.g., List of AQs selected is
composed by 4 values, means 4 entries in the MMetricL class).
Any of the metrics created can be dynamically included in the expression defined by the
business user to create an indicator for the new parameter (i.e., Education) in the “Personal
Skills” Dashboard. Whenever a new “Indicator” is created (e.g. Curriculum Evaluation – CE),
one new entry is created in the “MIndicator” class (with the Indicator information, e.g.,
Indicator Name) and in the “Thresholds” class (with the Thresholds information, depending
on the Indicator type selected, e.g., Cost/Benefit/On Target). For more details about the SDM
Domain Model check Annex E.
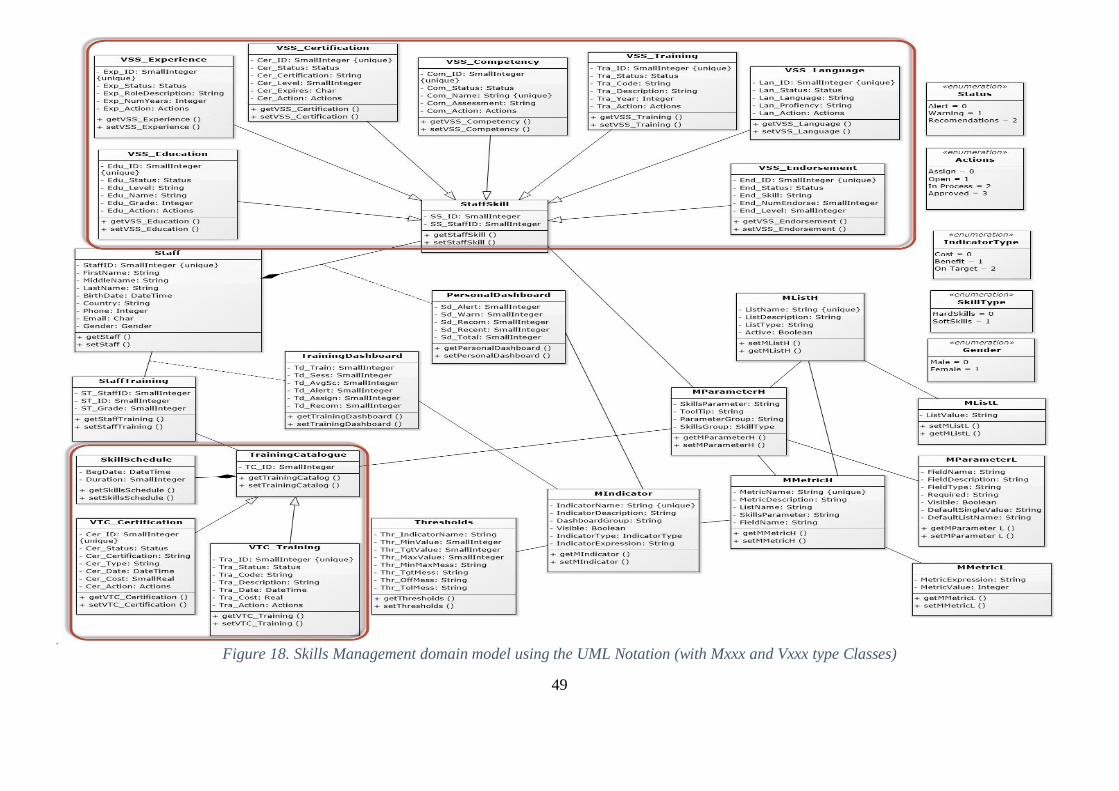
49
dddd
Figure 18. Skills Management domain model using the UML Notation (with Mxxx and Vxxx type Classes)
50
The domain model addresses the following goals:
· Provide a conceptual framework of the things in the problem space;
· Capture the most important concepts (business object) in the context of the business;
· Foundation for use case/workflow modelling;
· Helps to focus on semantics and provides a glossary of terms – noun based.
The domain model approach is to identify concepts pertinent to the domain that need to be
modelled in software. The concepts include the data involved in the business and rules the business
uses in relation to that data. A domain model generally uses the vocabulary of the business domain
so that a representation of the model can be used to communicate with non-technical stakeholders in
describing requirements, processes, rules or other things, that need to be understood in the same way.
4. ResultsThis chapter outlines hoe the specified domain model and specification of the SDM were
applied to the case study hold by the research Active@Work project, presenting simultaneously the
project main goals and web site form more information related to the research challenges addressed
within this AAL project. An assessment of the achievements accomplished within this thesis are also
provided, taking into account the role and contribution within the Active@Work project as well as
the accomplishment of the research hypothesis formulated in Chapter 1. The Chapter ends by
presenting some conclusions related to the results, emphasizing the theoretical and practical
consequences.
4.1. Skills Development moduleThe expected results of the Skills Development Module include:
Through Visual Analytics dynamic/personalized dashboard interfaces alert mechanisms and
indicators, promoting employees' self-awareness of their skills, overall curriculum evaluation and
enabling comparison with his/her peers. It also reflects the employees' resume organization relevance
in the short/medium term, by providing recommendations about how the employee should progress
in his/her training or knowledge based on skills, role/function and a global classification in
comparison to the average skills for the career option the employee wants to apply to, to stay aligned
with the organization’s strategic and operational goals and objectives. In terms of profile management,
employees can also take great advantage from the Intelligent Agent (IA) help, namely through data
collection from social network websites (e.g., LinkedIn).
51
Through a Business Rule Manager (this advantage comes from the collaboration with the
Active@Work R&D project and it benefits the skills development module, although it is not in the
scope of this Thesis), by delivering a rule engine, enabling the dynamic configuration of business
rules, applicable to the CV valorization.
Through Gamification techniques exploring paradigms based on game theory and taking
advantage of technological advances, to benefit employees and organizations. Organizations are
continuously being challenged to effectively encourage employees to achieve basic business goals
and develop working environments driven by healthy competitive practices. If serious gaming
techniques become part of the Organizations' working culture, it will encourage employees to
continuously seek to improve their CV. In such working environment, self-awareness can be seen as
a way to "play" with alerts and recommendations triggered dynamically by an Intelligent Agent (IA),
which motivates employees to constantly invest effort in auto-regulation to improve their
performance (e.g., rank classification, career development, encourage ambition and self-
achievement).
Through the combination of Gamification techniques with Talent Management, adopting
processes to engage, motivate, and retain highly productive employees, it is possible to combine Skills
Management & monitoring related critical capabilities with information visualization techniques,
helping organizations to maximize potential use of Talent Management technology. Through a
training catalogue with specific skills offering, employees can search and manifest interest in some
training(s) offers or seek for career options, and carry out their responsibilities into the Organization.
Motivation, challenges and competitiveness are seen as key elements for the construction of
a successful organizational network. These processes, combined with information visualization
techniques, keep employees aware about skills and performance related information, such as:
• Current score and ranking position;
• Classification of types of training activities;
• List of training actions taken, including certification and expiration date (a professional
certification can expire after a predefined period);
• List of trainings actions and certifications recommended based on the employee profile
and/or role/function within the company - in this case there may be a set of training sessions or
mandatory professional certifications (e.g., PMBOK, ITIL, etc.);
• Warnings in advance if the score is to be decreased in any way (due for instance to a
certification that will expire or if a professional training actions with more than five years will no
longer be considered relevant).
52
4.2. Case Study – Active@WorkActive@Work is an EU project, funded by the AAL Programme and co-funded by the EC,
with the main goal to provide a web-based solution to assist senior employees, in particular those
close to retirement age, in order to perform their job efficiently without risking their health condition.
The Active@Work focus is an integrated approach to manage the negative impacts of aging both
physiologically and psychologically, while taking the advantage of senior employees’ valuable
experiences. Senior employees who are close to their retirement age are concern with realizing some
changes in their psychological and physiological systems. Most of the time these changes are not easy
to realize from outside and even the person himself ignores these signs and changes. The fact that it
is not easy to accept these changes would be the reason of this ignorance. Thus, Active@Work as an
assistant system has the goal to help the senior employees who are going through this phase of life to
spontaneously do their daily duties at work and deal with psychological and physiological demands
of normal aging.
The main scientific challenges for Active@Work are the management and extraction of useful
information from vast amounts of environmental and physiological data, the development of a
customized system to influence behavioral change, and developing a solution applicable in differing
working environment. In order to meet these challenges, Active@Work will investigate: (i) how best
to provide the dynamic accurate measurement and data transfer of useful information about end-user,
(ii) how best to use physiological and environmental data to improve the senior employees well-being
and influence end-users to modify their behavior, (iii) how to arrive at the best business model to
convert a promising technology into a useful and cost-effective product, and (iv) how to demonstrate
and validate the new methodologies on two case studies in Spain and Belgium.
The Active@Work project intends to follow the next generation design architecture, by
creating a platform, or more precisely a modular architecture. Creating appropriate modular
architectures is, in nowadays, key to support new kinds of business strategies. The modular
architecture is a two-part definition:
· Decomposition of the overall functionalities of a product into a set of component parts;
· Specification of the interface between the components, in order to interact together in the product
as a system.
The Modular architecture of the Active@Work project, with a high-level view of the project
components (i.e modules) is illustrated in Figure 19. The expected results of this contribution are
described in this Thesis, by defining the specification of the structure and behavior of the SDM.

53
Figure 19. Virtual Assistant Tool Architecture
The SDM addressed in this Thesis intends to provide a solution able to create a highly
motivating and rewarding environment that makes it easy for employees to manage/develop their
skills, promoting engagement and motivation to fit into organization needs and expectations. This
solution is composed by two main components: Personal Skills, Training Catalogue and the
corresponding Dashboards. Each one of these components is described in Table 4 below.
Table 4. List of components identified for the SDM
Component Personal Skills
Sections(Dashboard) · Overall, where relevant information indicators like employee
CV evaluation (overall calculation), assessment and Employee
CV composition (each pie chart slice represents a different
Skills Parameter), ranking position and Peers average can be
seen;
· My Messages, where notifications like Alerts, Messages and
Recommendations can be checked;
· My Training History, where the most recent training courses
or the full list of trainings attended can be checked.
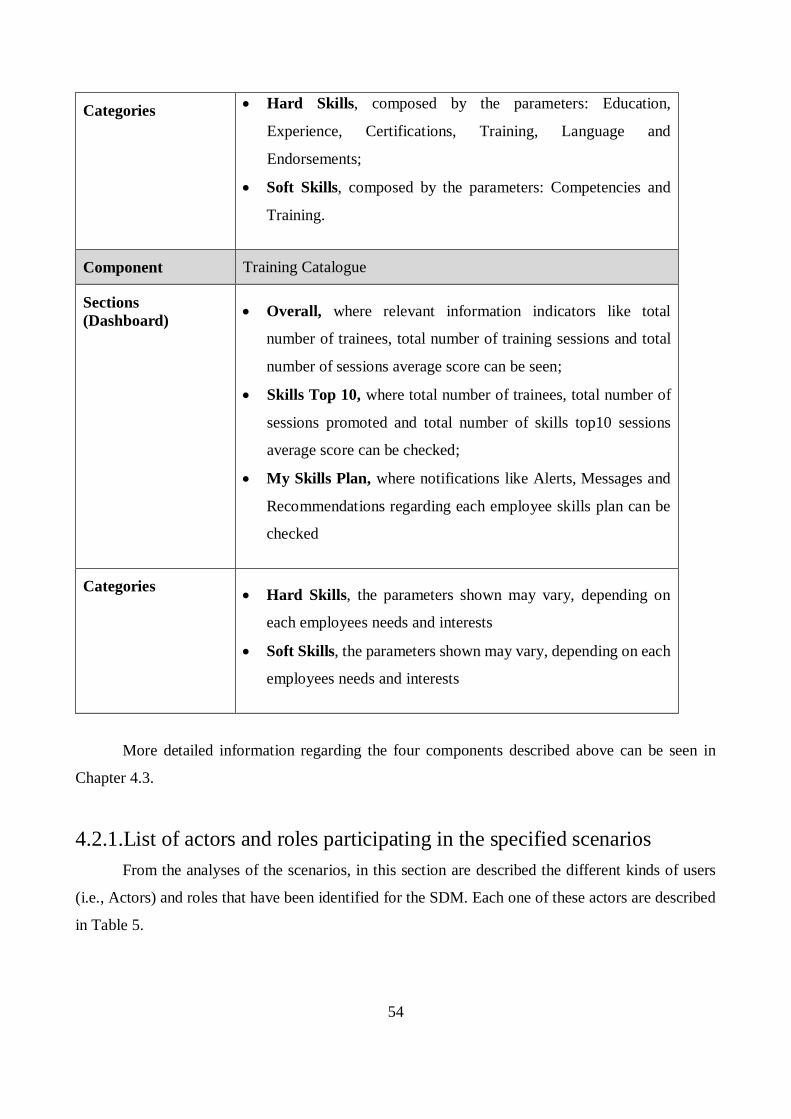
54
Categories · Hard Skills, composed by the parameters: Education,
Experience, Certifications, Training, Language and
Endorsements;
· Soft Skills, composed by the parameters: Competencies and
Training.
Component Training Catalogue
Sections(Dashboard) · Overall, where relevant information indicators like total
number of trainees, total number of training sessions and total
number of sessions average score can be seen;
· Skills Top 10, where total number of trainees, total number of
sessions promoted and total number of skills top10 sessions
average score can be checked;
· My Skills Plan, where notifications like Alerts, Messages and
Recommendations regarding each employee skills plan can be
checked
Categories · Hard Skills, the parameters shown may vary, depending on
each employees needs and interests
· Soft Skills, the parameters shown may vary, depending on each
employees needs and interests
More detailed information regarding the four components described above can be seen in
Chapter 4.3.
4.2.1.List of actors and roles participating in the specified scenariosFrom the analyses of the scenarios, in this section are described the different kinds of users
(i.e., Actors) and roles that have been identified for the SDM. Each one of these actors are described
in Table 5.

55
Table 5. List of actors identified for the SDM
Actor(s) Employee (junior/senior)
Role Trainee - Someone who is the consumer/receiver of the content in order to
improve a skill or learn new things or solve a task related to a problem in the
working environment
Actor(s) Employee (junior/senior), manager, external stakeholder who has the relevant
knowledge
Role Producer of the content - Someone who can create a content (learning material,
course) based on a request
Actor(s) Employee (junior/senior), manager (operational, health, environment,
supervisor, moderator)
Role Requestor of the content - Someone who request for a new content or changing
an existing content when he/she sees an opportunity or a need for that
Actor(s) Manager
Role Administrator/Moderator - Someone who is responsible for managing the
accounts (governing data access), organizing the knowledge structure and
reviewing and publishing the content
4.2.2.Generic scenariosIn this section are described the generic business scenarios of usage of the SDM. The scenarios
have been defined through different refinement phases. Each scenario is expressed in natural language,
describing a specific interaction between a user (actor) and the system. While each scenario covers
one specific goal, they are strictly related each other as they share the same devices and data. Each
one of these scenarios are described in Table 6.
Table 6. List of Generic Scenarios
Goal Management of skill alignment with individuals goals
Description The skill development module provides the employee a single point to report
his/her professional curriculum vitae (CV), which includes the presentation
of data related to the employee assessment and ranking within the
organization. This kind of dynamic dashboard intends to help the employee
too improve and manage his professional profile/expertise. Based on the

56
reported interests, career ambition or role needs, the system is able to provide
recommendations regarding which soft and hard skills are more adjusted to
the employee interests. Possibility to configure the system to inform when a
specific training course is offered within the company training catalogue or
apply to a scholarship to enroll into a new academic course/degree. Enable
older adults to change their area of interest within the organization by
providing information about the new expertise they need to acquire to carry
out new roles. The approach is to empower senior employees to continue
managing their occupation in their working environment, help all employees
to be aware about their position within the organization assessment, raise
their operational and cognitive skills or to acquire new ones
Target Group: All employees and the corresponding supervisor
Intervention The system will implement a workflow to request the supervisor the
acceptance of the employee enrolment in a set of certification or training
actions. This workflow is triggered when the employee acknowledges the
system training (or certification) recommendations or selects a new training
course available in the training catalogue. Based on the reported information
and on the selection of the intended training action, the Skills Manager will
handle the administrative procedure to enroll the employee in the training
actions requiring approval from the supervisor. After completing the process
of obtaining authorization to enroll in the requested training actions, the next
step is to proceed with the enrolment of the student in the corresponding
training actions in order to monitor the achievement/assessment of the
employee in each training action. If no approval is required and no
inconsistency is detected, the Skills Manager automatically handles the
enrolment of the employee.
Goal Skills manager to assist employees in organizing their training agenda
Description The employee will have the possibility to semantically search for specific
training courses or specify what kind of new role or functions (s)he is about
to attend or is willing to obtain. The employee can also configure a set of
preferences on topics or types of training actions. This information is
registered by the system. The Skills Manager (a software component acting

57
as an intelligent agent) based on those preferences will perform a pre-
validation of the reported information and alert for inconsistencies or provide
some recommendations. If any inconsistency is detected (e.g., constrains due
to precedence between some of the selected training actions) the Skills
Manager will alert the user about those constrains and provide, whenever
possible, alternative solutions. If no inconsistency is detected, the Skills
Manager activates the authorization procedure to the employee supervisor.
The decision is communicated to the employee and for all approved
situations, the employee is asked to enroll in one of the available class’s
schedule. The attendance of the employee to each enrolled class is stored in
the system and if the employee fails to attend the classes, a notification is
generated
Target Group: All employees and the corresponding supervisor
Intervention The system will assist the employee in choosing the set of training action
that best suit the valorization of the employee career within the organization.
To accomplish such goals the employee has to provide information about
what role (s)he willing to attend, or aims to attend in the medium term. The
Skills Manager will act proactively reminding the employee about the start
dates of the training actions and by providing statistical data regarding the
number of enrolments, total number of employees who already concluded
the training action, including information about the average assessment in
each of the selected training actions.
Goal Motivate and inform the employee about his classification
Description The employee personal dashboard provides a layout with a summary of the
classification and assessment of the employee. This information includes
statistical data about the current ranking position and assessment.
Information related to the expertise and competencies more valorized by the
organization or more aligned with the current role of the employee are also
provided. The Skills Manager will monitor the information and provide
recommendation regarding improvements and/or alert the employee about
which skills need to be improved or upgraded.

58
The system also mitigates the risk of losing a professional certification. The
system will act preventively by warning the employee about the need to
renew a certification or by alerting when it is time for the employee to enroll
into a new certification level.
Target Group: All employees
Intervention Improve and strengthen employee skills to progress in their career or
improve their classification in the organization ranking. In order to provide
adaptive and personalized learning plans and recommendations, it will be
necessary the combination of immersive advanced learning capabilities (set
of metadata characterizing the employee professional and literacy profile) in
order to obtain highly personalized learning experiences. This is particularly
true for key learning indicators and indicators about the employee skilled
level in addition to indicators describing how employees are performing in
the training courses.
4.3. Case Study – Conceptual Framework to the Mockups DesignIt is also important to note that within this Thesis the approach was to complement, whenever
feasible, the description of the scenario with the presentation of a preliminary mockup to express non-
functional requirements regarding the system UI. The mockup technique is introduced in this phase
as a visual information blueprint, facilitating the communication between all team members.
When pitching a design to the team, presentation is always crucial. Mockups are not the final
product, they are only a visual schema of the system UI. This means that mockups are a powerful
way to keep the design of the solution (i.e., graphical specification of requirements) within the project
boundaries - scope and objectives. In this way, it is possible to graphically express functional and
non-functional requirements in an early stage of the project execution, reducing the risk of
misinterpretations as well as the effort in describing requirements in a way that is understood by
everyone in the same way.
The SDM addressed in this Thesis intends to provide four main components able to assist
employees managing their skills, promoting engagement and motivation to fit into organization’s
strategic and operational goals and rapidly changing needs: Personal Skills, Training Catalogue and
the corresponding Dashboards.

59
· The Personal Skills and Personal Skills Dashboard were designed based on information
visualization techniques, to create a graphical interactive environment addressing the employee
concerns and to assist his/her decision making process regarding the information provided by
each parameter reported in the Personal Skill component. The information presented to the
employee is related to his/her current skills assessment, curriculum evaluation and ranking
position, as well as to monitor its progression and alignment with the organization needs, through
an IA triggering events (alerts, warnings and recommendations). This intends to promote
employees’ self-awareness. By having a better understanding of themselves, this empowers
employees to make changes and to build on their areas of strength as well as identify areas where
they would like to make improvements. Self-awareness is often a first step to goal setting5, in
order to be aligned with the organization needs. A mockup of this dashboard can be seen in Annex
C, Figure 28.
· The Training Catalogue and Training Catalogue Dashboard were also designed based on
information visualization techniques, enabling a graphical interactive training environment to
support employees to learn new skills quickly and engage in new activities, in an increasing
competitive working environment. In nowadays, to have high performance and sustainable
organizations, that meets its strategic and operational goals and objectives, it's key to implement
Talent Management programs, which are design to attract, develop, motivate, and retain
productive and engaged employees. This can be achieved through an IA triggering events (alerts,
assignments and recommendations) to create a dynamic Skills Plan, to ensure access to the
employees with the skills, knowledge, and behaviors essential for the achievement of the
organizations strategic objectives and/or demands. A mockup of this dashboard can be seen in
Annex C, Figure 30.
5. Conclusions and Future ChallengesThis chapter presents a reflection on the results obtained from the research work developed,
where the achieved contributions should be explained, assessing the contributions to the proposed
objectives. It is fundamental to create a summary of the demonstration presented in the development
(i.e., previous sections) leading to a conclusion about this research thesis accuracy and relevance,
according to the addressed point of view.
5 Cfr: Self Awareness, accessed on 13/02/2016

60
It should also be dedicated a part of this section to explain a possible future research work,
based on/following this research work.
5.1. ConclusionsThis Thesis was undertaken based on the landscape of skills management that reveals existing
problems regarding the need to promote employees’ self-awareness and auto-regulation, increasing
their motivation and challenging them to acquiring new skills/competencies or investing in career
progression, supported by the SDM as an innovative way to stay aligned with the organization’s
strategic and operational goals and objectives.
The research methodology selected was the DSR, where the existing process has been adapted
for a better establishment of awareness towards the problems, through a survey about the project
scope to achieve a preliminary awareness of the challenges related to the scope of the research
problem. The Identified hypothesis to be tested and evaluated using information artifacts contributed
to deliver a better quality of research findings in the particular context of the research. DSR process
facilitates the development of conceptual solutions, in contrast to the mainstream case where
embodied solutions are developed.
The overall aim of this Thesis was expected to be addressed through exploring two
predominant research areas: Visual Analytics and Gamification. Through Visual Analytics
personalized/interactive dashboard interfaces alert mechanisms and indicators to keep employees
aware of their skills and performance, promoting behavioral change and adoption of best-practices.
This strategy is based on the principle that motivation is a key pillar to retain and attract employees.
The ratio of intrinsic and extrinsic motivations driving forces was adopted in this Thesis as a truly
innovative approach from the perspective of self-awareness and auto-regulation. Through the
combination of Gamification techniques with Talent Management, new processes are adopted to
engage, motivate, and retain highly productive employees. By fostering a competitive working
environment, employees are encouraged to engage in new and rewarding activities. Building trust in
relationships increases retention, engagement and rewarding of these employees, gradually creates a
motivated community committed to success factors relevant to both the employee and the
organization.
By collaborating in an international project (Active@Work) funded by the AAL Programme
and co-funded by the EC, this research study contribution is described through the SDM as a
particular type of DSS. This research study aimed to demonstrate the existing articulation between

61
emerging research areas such as Visual Analytics and Gamification, expecting to represent conceptual
gains in the field.
5.2. Future ChallengesThe conceptual solutions are recommended to be used as guidance in developing new practical
solutions in the future. A future area of research, based on the outcome of this Thesis, could be an IA
solution, a software component which uses machine learning techniques and algorithms, improving
the quality of the diagnostic information presented. This concept is based on automated learning,
which means that machines (i.e., IA) can learn from the available data and has various algorithms.
These algorithms are organized into taxonomies and semantic contexts in order to address results
desired/expectable. The most common types of algorithms include Supervised Learning,
Unsupervised Learning, Semi-supervised Learning, Reinforcement Learning, Transduction and
Learning to Learn.
Through algorithms that can learn and make predictions based on the generated knowledge
from the available data, together with metadata info-structure defined for the SDM, the Intelligent
Agent solution aims to contribute for the employees’ awareness of the risk associated to CV
evaluation, through:
· Support automatic employees’ notifications;
· Monitor the achievement/assessment of the employee in each training action;
· Pre-validate the reported information (list of training actions selected by the user);
· Alert for inconsistencies (constrains due to precedence between some of the selected training
actions).
A final future research activity is to get SDM more widely known to the research communities.
The researcher intends to write and publish a paper, expecting that will help more discussion or
critique made on these kind of innovative paradigm-changing solutions.

62
ReferencesAltmann, R. (2015). A New Vision for Older Workers : Retain , Retrain , Recruit. United Kingdom.
Retrieved fromhttps://www.gov.uk/government/uploads/system/uploads/attachment_data/file/411420/a-new-vision-for-older-workers.pdf
Andrienko, G., Andrienko, N., Jankowski, P., Keim, D., Kraak, M. J., MacEachren, A., & Wrobel,S. (2007, November 11). Geovisual analytics for spatial decision support: Setting the researchagenda. International Journal of Geographical Information Science. Taylor & Francis.http://doi.org/10.1080/13658810701349011 <http://dx.doi.org/10.1080/13658810701349011>
Arnott, D., & Pervan, G. (2005). A critical analysis of decision support systems research. Journal ofInformation Technology, 20(2), 67–87. http://doi.org/10.1057/palgrave.jit.2000035
Charness, N., & Czaja, S. J. (2006). Older Worker Training: What We Know and Don’t Know.Retrieved from http://www.aarp.org/ppi
Cheong, C., Cheong, F., & Filippou, J. (2013). Using Design Science Research to IncorporateGamification into Learning Activities. In Pacific Asia Conference on Information Systems (pp.1–14). USA. Retrieved fromhttps://www.researchgate.net/publication/247152636_Using_Design_Science_Research_to_Incorporate_Gamification_into_Learning_Activities
Dasgupta, S. (1996). Technology and Creativity (First Edit). Oxford University Press.
European Commission. (2015a). Innovation for Active & Healthy Ageing. Retrieved fromhttps://ec.europa.eu/research/innovation-union/pdf/active-healthy-ageing/ageing_summit_report.pdf
European Commission. (2015b). The 2015 Ageing Report: Underlying Assumptions and ProjectionMethodologies. European Economy series (Vol. 3217). Retrieved fromhttp://ec.europa.eu/economy_finance/publications/
Ferreira, N., Lins, L., Fink, D., Kelling, S., Wood, C., Freire, J., & Silva, C. (2011). BirdVis:visualizing and understanding bird populations. IEEE Transactions on Visualization andComputer Graphics, 17(12), 2374–83. http://doi.org/10.1109/TVCG.2011.176
Friendly, M. (2009). Milestones in the history of thematic cartography , statistical graphics , anddata visualization ∗.
Gartner. (2015). Critical Capabilities for Talent Management Suites.
Han, J., Kamber, M., & Pei, J. (2011). Data Mining: Concepts and Techniques. Retrieved fromhttp://dl.acm.org/citation.cfm?id=1972541
Herger, M. (2014). Enterprise Gamification: Engaging People by Letting Them Have Fun.CreateSpace Independent Publishing Platform. Retrieved from

63
https://books.google.pt/books/about/Enterprise_Gamification.html?id=yASLoAEACAAJ&pgis=1
Hevner, A. (2007). A Three Cycle View of Design Science Research. Scandinavian Journal ofInformation Systems. Retrieved from http://aisel.aisnet.org/sjis/vol19/iss2/4
Hevner, A. R., March, S. T., Park, J., & Ram, S. (2004). Design science in information systemsresearch. MIS Quarterly, 28(1), 75–105. Retrieved fromhttp://dl.acm.org/citation.cfm?id=2017212.2017217
Huotari, K., & Hamari, J. (2012). Defining gamification: a service marketing perspective. InProceeding of the 16th International Academic MindTrek Conference (pp. 17–22). Tampere,Finland.
Kasanen, E., Lukka, K., & Siitonen, A. (1993). The Constructive Approach in ManagementAccounting Research, 5, 243–264. Retrieved fromhttps://www.researchgate.net/publication/237068040_The_Constructive_Approach_in_Management_Accounting_Research
Keim, D. A., Kohlhammer, J., Ellis, G., & Mansmann, F. (2010). Mastering the Information Age -Solving Problems with Visual Analytics. Eurographics Association, Goslar. Retrieved fromhttps://books.google.de/books/about/Mastering_the_Information_Age_Solving_Pr.html?hl=de&id=vdv5wZM8ioIC&pgis=1
Keim, D., Andrienko, G., Fekete, J.-D., Görg, C., Kohlhammer, J., & Melançon, G. (2008). VisualAnalytics: Definition, Process and Challenges. Springer. Retrieved from http://hal-lirmm.ccsd.cnrs.fr/lirmm-00272779
Kuechler, B., & Vaishnavi, V. (2008). On theory development in design science research: anatomyof a research project. European Journal of Information Systems, 17(5), 489–504.http://doi.org/10.1057/ejis.2008.40
Maciejewski, R., Hafen, R., Rudolph, S., Larew, S. G., Mitchell, M. A., Cleveland, W. S., & Ebert,D. S. (2011). Forecasting Hotspots-A Predictive Analytics Approach. IEEE Transactions onVisualization and Computer Graphics, 17(4), 440–53. http://doi.org/10.1109/TVCG.2010.82
March, S. T., & Smith, G. F. (1995). Design and natural science research on informationtechnology. Decision Support Systems, 15(4), 251–266. http://doi.org/10.1016/0167-9236(94)00041-2
McCarthy, J. (1980). Circumscription—A form of non-monotonic reasoning. Artificial Intelligence,13(1-2), 27–39. http://doi.org/10.1016/0004-3702(80)90011-9
Mekler, E. D., Brühlmann, F., Tuch, A. N., & Opwis, K. (2015). Towards understanding the effectsof individual gamification elements on intrinsic motivation and performance. Computers inHuman Behavior. http://doi.org/10.1016/j.chb.2015.08.048
Naumann, F., & Bleiholder, J. (2006). Data Fusion in Three Steps : Resolving Inconsistencies at

64
Schema. Bulletin of the Technical Committee on Data Engineering, 1–11.
Owen, C. L. (1997). Design research: building the knowledge base. Design Studies, 19(1), 9–20.http://doi.org/10.1111/j.1365-2354.2009.01132.x
Peffers, K., Tuunanen, T., Rothenberger, M. A., & Chatterjee, S. (2007). A Design ScienceResearch Methodology for Information Systems Research. Journal of ManagementInformation Systems, 24(3), 45–77. http://doi.org/10.2753/MIS0742-1222240302
Peirce, C. S. (1931). Collected Papers of Charles Sanders Peirce. (C. Hartshorne & P. Weiss, Eds.).Cambridge: Harvard University Press.
Purao, S. (2002). Design research in the technology of information systems: Truth or dare.Retrieved fromhttps://www.researchgate.net/publication/228606379_Design_research_in_the_technology_of_information_systems_Truth_or_dare
Ray Barrell, Kirby, S., & Orazgani, A. (2011). The macroeconomic impact from extending workinglives (No. 95). London. Retrieved fromhttps://www.gov.uk/government/uploads/system/uploads/attachment_data/file/214392/WP95.pdf
Rocha, C. G. da, Formoso, C. T., Tzortzopoulos-Fazenda, P., Koskela, L., & Tezel, A. (2012).DESIGN SCIENCE RESEA RCH IN LEAN CONSTRUCTION : PROCES S ANDOUTCOMES.
Sears, A., & Jacko, J. A. (2007). The Human-Computer Interaction Handbook: Fundamentals,Evolving Technologies and Emerging Applications, Second Edition. CRC Press. Retrievedfrom https://books.google.com/books?id=A8TPF_O385AC&pgis=1
Senthil Rajamarthandan. (2015). Using Gamification to Build a Passionate and Quality-DrivenSoftware Development Team, (february 2014).
Shneiderman, B. (1996). The Eyes Have It: A Task by Data Type Taxonomy for InformationVisualizations, 336–343. Retrieved from http://dl.acm.org/citation.cfm?id=832277.834354
Simon, H. A. (1996). The Sciences of the Artificial. MIT Press. Retrieved fromhttps://books.google.pt/books/about/The_Sciences_of_the_Artificial.html?id=k5Sr0nFw7psC&pgis=1
Takeda, H., Veerkamp, P., Tomiyama, T., & Yoshikawa, H. (1990). Modeling design processes. AIMagazine, 11(4), 37–48. Retrieved from http://dl.acm.org/citation.cfm?id=95788.95795
Understanding Metadata. (2004). NISO Press, 20.
UNESCO. (1997). International standard classification of education ISCED 1997. Vasa. Retrievedfrom www.uis.unesco.org
Vaishnavi, V. K., & Kuechler, Jr., W. (2007). Design Science Research Methods and Patterns:
65
Innovating Information and Communication Technology, 248. Retrieved fromhttp://dl.acm.org/citation.cfm?id=1554779
Vaishnavi, V., & Kuechler, W. (2004). Design science research in Information Systems.Association for Information Systems, 1–12. Retrieved fromhttp://desrist.org/desrist/content/design-science-research-in-information-systems.pdf
van Aken, J. E. (2005). Management Research as a Design Science: Articulating the ResearchProducts of Mode 2 Knowledge Production in Management. British Journal of Management,16(1), 19–36. http://doi.org/10.1111/j.1467-8551.2005.00437.x
Yigitbasioglu, O. M., & Velcu, O. (2012). A review of dashboards in performance management:Implications for design and research. International Journal of Accounting InformationSystems, 13(1), 41–59. http://doi.org/10.1016/j.accinf.2011.08.002

66
Annex A – Skills Management Metadata FrameworkThe Skills Management Metadata Framework enables the business user flexibility to choose
between different components: Lists, Parameters, Metrics and Indicators, through a tab menu. When
the business user presses the tab “Lists”, the UI illustrated in the Figure 20 below should be shown.
When a new “List” is created, the business user should specify a “List Description”, select the type
of the field in the “List Type” cell and should define if the List should be active or not in the “Active”
cell. The values of the “List Type” field are fixed/hardcoded. The “Lists” tab enables the business
user to define a list of values which can be assigned, if required, to the attributes presented as
headlines for the (Skills) Parameter selected in the “Personal Skills/Training Catalogue” menu.
Figure 20. Metadata Configuration - Lists

67
When the business user presses the tab “Parameters”, the UI illustrated in the Figure 21 below
should be shown. When a new “Parameter” is created, the business user starts by filling the “Skills
Parameter” cell with the name of the Parameter and the “Tooltip” (e.g. message which appears when
a cursor is positioned over an element in a GUI) cells with the message that wants to be shown. Then,
the business user has to classify it as “Personal Skills/Training Catalogue” in the “Parameter Group”
cell and as “Hard/Soft Skills” in the “Skills Group” cell. The values of both “Parameter Group” and
“Skills Group” fields are fixed/hardcoded.
Figure 21. Metadata Configuration – Parameters

68
When the business user presses the “Expand” icon, the configuration of the metadata available
enables the business user to configure the name of the attributes to be presented as headlines in the
Workspace area, as illustrated in the Figure 22 below. In addition to the name of the attributes, the
configuration of the metadata available allows the business user to specify a “Field Description” and
select the type of the field in the “Field Type” cell. The business user should also specify if the field
is “Mandatory/Optional” in the “Required” cell and the “Yes/No” option in the “Visible” cell. In case
the “Mandatory” option in selected in the “Required” cell, the “Visible” cell should automatically be
filled with “Yes”, due to the dependency between both. Finally, the business user should decide to
define if the field should have a default single value, by filling the “Default Single” cell or it should
have a default list of values, by selecting the required “List Name”, created in the “Lists” tab, in the
“Default List Name”. Both fields shall not be filled.
Figure 22. Metadata Configuration – Parameters Expanded

69
When the business user presses the tab “Metrics”, the UI illustrated in the Figure 23 below
should be shown. When a new “Metric” is created, the business user starts by filling the “Metric
Name” and the “Metric Description” cells. Then, the business user should assign it to one of the skills
parameters listed in the “Skills Parameter” cell. This means that the assigned skill parameter shall be
used as a category of the selected ”Metric”. The cell “Field Name” can only be activated once an
option is selected in the “Skills Parameter” cell, due to the dependency between both fields. This
means that the list of values to be presented in the “Field Name” cell are dependent on the selected
“Skills Parameter”. Finally, the cell “List Name” can only be activated once an option is selected in
the “Field Name” cell, due to the dependency between both fields. In case the “Field Name” selected
is already assigned to a “List Name”, the “List Name” cell is automatically filled with the “List”
assigned (e.g., List of AQs). Otherwise, the business user should decide to define if the metric should
have a default list of values, by selecting the required “List Name”.
Figure 23. Metadata Configuration – Metrics
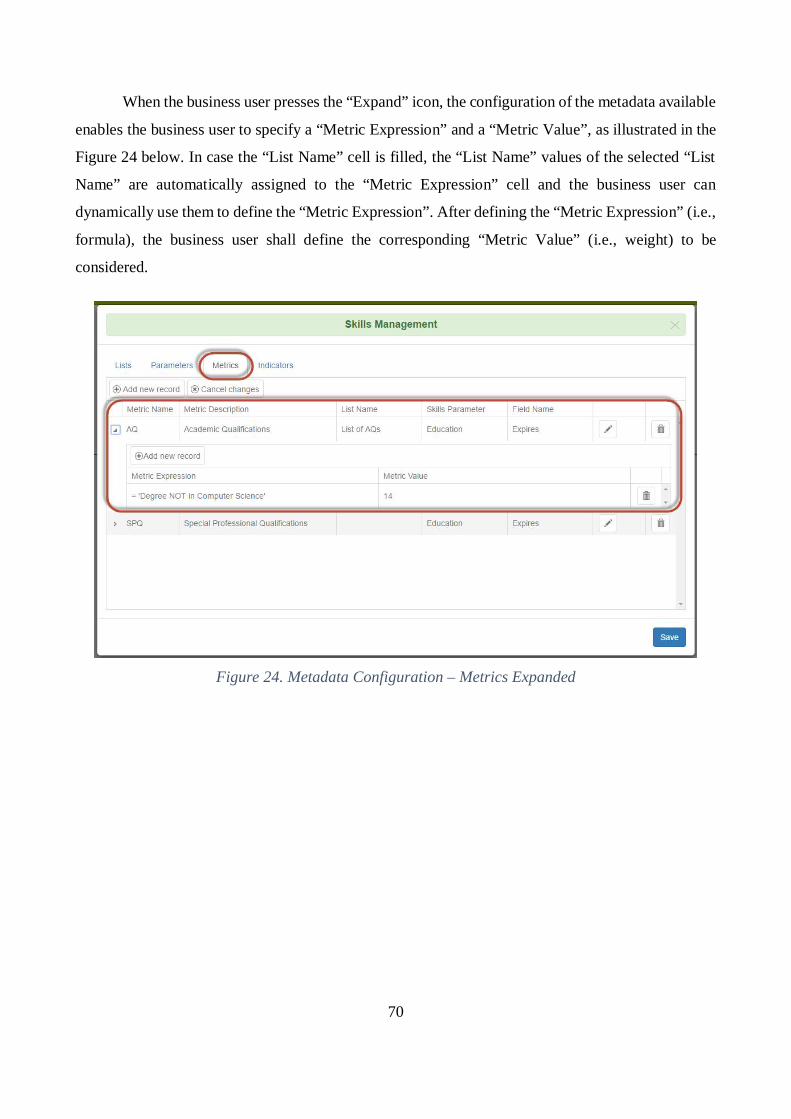
70
When the business user presses the “Expand” icon, the configuration of the metadata available
enables the business user to specify a “Metric Expression” and a “Metric Value”, as illustrated in the
Figure 24 below. In case the “List Name” cell is filled, the “List Name” values of the selected “List
Name” are automatically assigned to the “Metric Expression” cell and the business user can
dynamically use them to define the “Metric Expression”. After defining the “Metric Expression” (i.e.,
formula), the business user shall define the corresponding “Metric Value” (i.e., weight) to be
considered.
Figure 24. Metadata Configuration – Metrics Expanded

71
When the business user presses the tab “Indicators”, the UI illustrated in the Figure 25 below
should be shown. When a new “Indicator” is created, the business user should classify it as “Personal
Skills/Training Catalogue” in the “Dashboard Group” cell. The values of the “Dashboard Group” are
fixed/hardcoded. In addition, if the value of the “Visible” cell is set to “Yes”, this Indicator is shown
at the corresponding Dashboard. Finally, in the “Indicator Type” cell, the business user should select
one of the fixed/hardcoded values: “Cost/Benefit/On Target” and the “Indicator Expression” cell
enables the business user to create/edit the formula related to the selected indicators.
Figure 25. Metadata Configuration – Indicators

72
When the business user presses the “Expand” icon, a popup window similar to the Figure 26
mockup below should be opened for the selected indicator name (i.e. editing the selected row), which
enables the business user to define the values from the corresponding fields of the “Thresholds” and
“Messages” sections, as well as to set the “Period” of validity of the Indicator and create/edit the
formula in the “Indicator Expression” cell.
Figure 26. Metadata Configuration – Indicator Expanded

73
Depending on the “Indicator Type” selected: “Cost/Benefit/On Target”, different kinds of screens will be presented, as illustrated in the
Figure 27 below. All “Indicator Types” screens are similar in terms of the scale presented at the “Thresholds” section, with relevance to the “Cost”
and “Benefit”, which are antagonistic in terms of color order. In the “On Target” screen there is one additional field “Target Tolerance”, where the
business user can define the tolerance value (i.e., deviation from the defined target value). In the “Messages” section, the fields presented vary,
depending on the “Indicator Type” selected. Finally, the “Period” section is equal for all the different “Indicator Type” screens and enables the
business user to set the “Thresholds” period of validity, by defining the “Start” and “End” dates and/or “Activate/Deactivate” it.
Figure 27. Metadata Configuration – Types of Thresholds
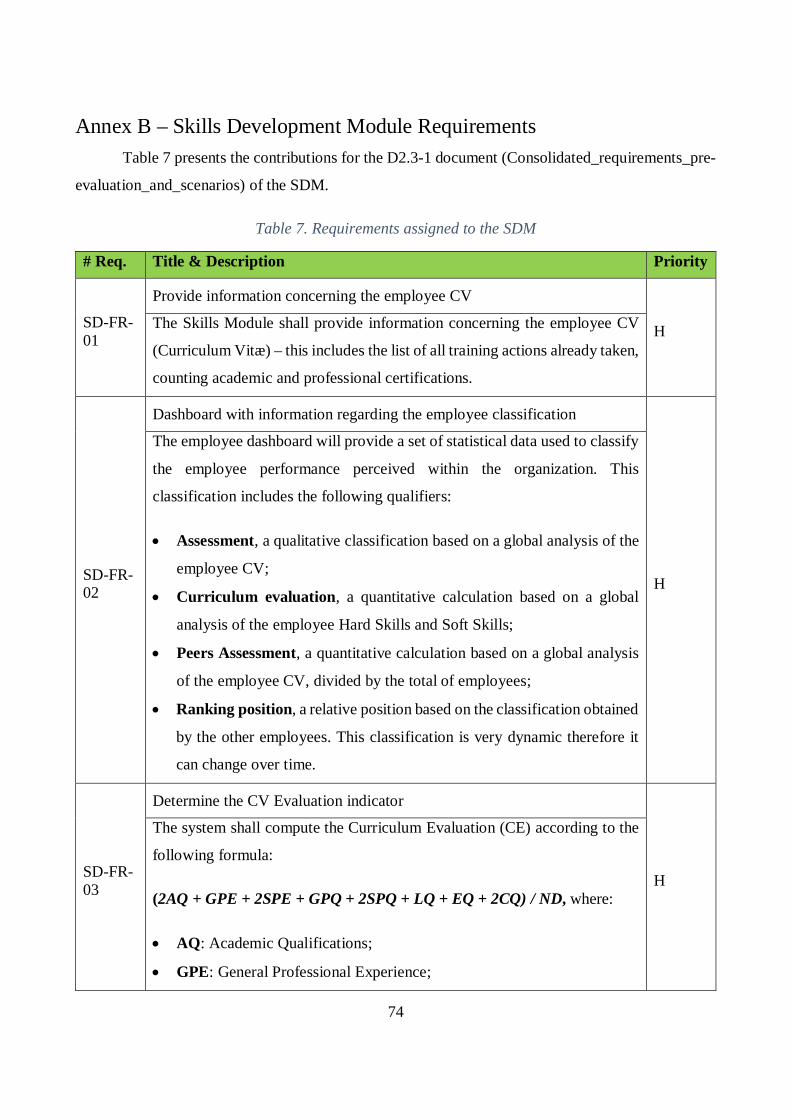
74
Annex B – Skills Development Module RequirementsTable 7 presents the contributions for the D2.3-1 document (Consolidated_requirements_pre-
evaluation_and_scenarios) of the SDM.
Table 7. Requirements assigned to the SDM
# Req. Title & Description Priority
SD-FR-01
Provide information concerning the employee CV
HThe Skills Module shall provide information concerning the employee CV
(Curriculum Vitæ) – this includes the list of all training actions already taken,
counting academic and professional certifications.
SD-FR-02
Dashboard with information regarding the employee classification
H
The employee dashboard will provide a set of statistical data used to classify
the employee performance perceived within the organization. This
classification includes the following qualifiers:
· Assessment, a qualitative classification based on a global analysis of the
employee CV;
· Curriculum evaluation, a quantitative calculation based on a global
analysis of the employee Hard Skills and Soft Skills;
· Peers Assessment, a quantitative calculation based on a global analysis
of the employee CV, divided by the total of employees;
· Ranking position, a relative position based on the classification obtained
by the other employees. This classification is very dynamic therefore it
can change over time.
SD-FR-03
Determine the CV Evaluation indicator
H
The system shall compute the Curriculum Evaluation (CE) according to the
following formula:
(2AQ + GPE + 2SPE + GPQ + 2SPQ + LQ + EQ + 2CQ) / ND, where:
· AQ: Academic Qualifications;
· GPE: General Professional Experience;
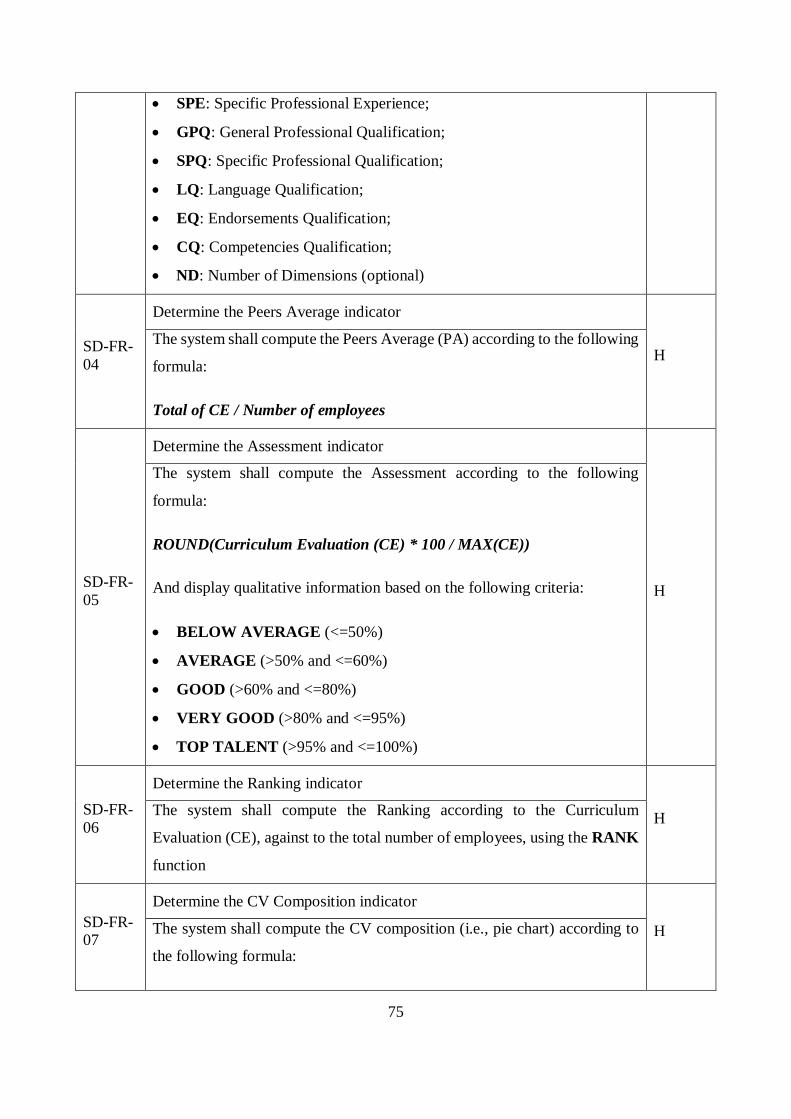
75
· SPE: Specific Professional Experience;
· GPQ: General Professional Qualification;
· SPQ: Specific Professional Qualification;
· LQ: Language Qualification;
· EQ: Endorsements Qualification;
· CQ: Competencies Qualification;
· ND: Number of Dimensions (optional)
SD-FR-04
Determine the Peers Average indicator
HThe system shall compute the Peers Average (PA) according to the following
formula:
Total of CE / Number of employees
SD-FR-05
Determine the Assessment indicator
H
The system shall compute the Assessment according to the following
formula:
ROUND(Curriculum Evaluation (CE) * 100 / MAX(CE))
And display qualitative information based on the following criteria:
· BELOW AVERAGE (<=50%)
· AVERAGE (>50% and <=60%)
· GOOD (>60% and <=80%)
· VERY GOOD (>80% and <=95%)
· TOP TALENT (>95% and <=100%)
SD-FR-06
Determine the Ranking indicator
HThe system shall compute the Ranking according to the Curriculum
Evaluation (CE), against to the total number of employees, using the RANK
function
SD-FR-07
Determine the CV Composition indicator
HThe system shall compute the CV composition (i.e., pie chart) according to
the following formula:

76
SM * 100 / SUM(SM), where:
· SM: Skill Parameter Metric
· SUM(SM): SUM of Employees’ Skill Parameter Metrics
SD-FR-08
The dashboard shall include a section with the Employee alert messages
H
The Skills Module shall alert the user when his/her score is in risk. The lead-
time to trigger the alert is a configurable parameter. This feature aims at
preventing situations related, for instance, to a certification that will expire
or when a training actions is to be outdated (e.g., more than five years). Three
type of alert messages shall be implemented:
· Alerts, a quantitative calculation based on the total number of alert
messages from the Employee’s Hard & Soft skills;
· Warnings, a quantitative calculation based on the total number of
warning messages from the Employee’s Hard & Soft skills;
· Recommendations, a quantitative calculation based on the total number
of recommendation messages from the Employee’s Hard & Soft skills.
The dashboard shall compute/provide the total number of alert messages
according to the following formula:
Total of Alerts + Total of Warnings + Total of Recommendations
SD-FR-09
Calculation of the Alerts parameter
HThe system shall compute the # Alerts according to the following formula:
(Total of Hard Skills Alerts + Total of Soft Skills Alerts)
SD-FR-10
Calculation of the Warnings parameter
HThe system shall compute the total number of Warning according to the
following formula:
(Total of Hard Skills Warnings + Total of Soft Skills Warnings)
Calculation of the Recommendations parameter H

77
SD-FR-11
The system shall compute the total number of Recommendations according
to the following formula:
(Total of Hard + Soft Skills Recommendations)
SD-FR-12
Messages semantic search by messages type
HThe system shall provide a tool to filter the list of alert messages using a
semantic search. This search can be narrowed by applying a filter to the type
of alert messages (i.e., Alerts, Warnings and Recommendations).
SD-FR-13
The dashboard shall include a section with the Employee training history
H
The employee dashboard shall provide a set of statistical data used to
quantify the employee training perceived within the organization. Two types
of training messages shall be implemented:
· Recent, a quantitative calculation based on the total number of Hard &
Soft Skills trainings attended by the Employee recently (e.g., last month).
· All, a quantitative calculation based on the total number of Hard & Soft
Skills trainings attended by the Employee.
SD-FR-14
The employee expertise will be segmented into hard and soft skills
H
The system shall provide a way to classify the employee expertise into two
major groups (soft and hard) skills. Each of these two groups can then be
detailed into more granular classifier elements. For each group the alert
message structure is defined based on the following two types:
· Hard Skills:
o Hard Skills Messages;
o Hard Skills Curriculum Evaluation (HSCE).
· Soft Skills:
o Soft Skills Messages;
o Soft Skills Curriculum Evaluation (SSCE).
Calculation of the Hard Skills Messages parameter H

78
SD-FR-15
The system shall compute the total number of Messages according to the
following formula:
(Total of Alerts + Total of Warnings + Total of Rec of Hard/Soft Skills)
SD-FR-16
Calculation of the HSCE parameter
HThe system shall compute the HSCE according to the following formula:
(AQ from Education + GPE+SPE from Experience + GPQ from
Certifications + SPQ from Training + LQ from Languages + SEQ from
Skills & Endorsements)
SD-FR-17
Calculation of the Soft Skills Messages parameter
HThe system shall compute the total number of Messages according to the
following formula:
(Total of Alerts + Total of Warnings + Total of Recommendations of
Competencies and Training)
SD-FR-18
Calculation of the SSCE parameter
HThe system shall compute the SSCE according to the following formula:
(CQ from Competencies + SPQ from Training)
SD-FR-19
Dashboard with information regarding the employee enrolment and
adherence to the list of training actions.
H
The Skills Module shall provide a dashboard with information related to the
employee enrolment and adherence to the list of training action promoted
within the organization (i.e., training catalogue). Three types of indicators
shall provide the following information:
· # Trainees, total number of employee who concluded at least one training
action in the last three months;
· # Total sessions;
· # Average Score;
· # Total Hard Skills assigned;

79
· # Total Soft Skills assigned;
· # Total Training Required.
SD-FR-20
Implement a Skills Manager intelligent software agent
H
The system will provide a software component that will act as an intelligent
agent, providing recommendations about which training packages best suits
the user professional profile, role in the organization or reported interests.
These recommendations are presented to the employee to motivate his
progress and skill improvement, with a high probability to increase his/her
score.
This intelligent agent will also handle the administrative procedure to enroll
the employee in training actions requiring approval from the supervisor and
monitor the achievement/assessment of the employee in each training action.
This intelligent agent will perform the following roles:
Provide recommendation about alternative training actions or training
packages;
· Enroll the employee in a training class;
· Present proposals for CV improvements, based on the training offers
available in the training catalogue;
· Alert (in useful time) the employee for expiration dates for some
certifications;
· Alert (in useful time) the employee for training action with more than
five years.
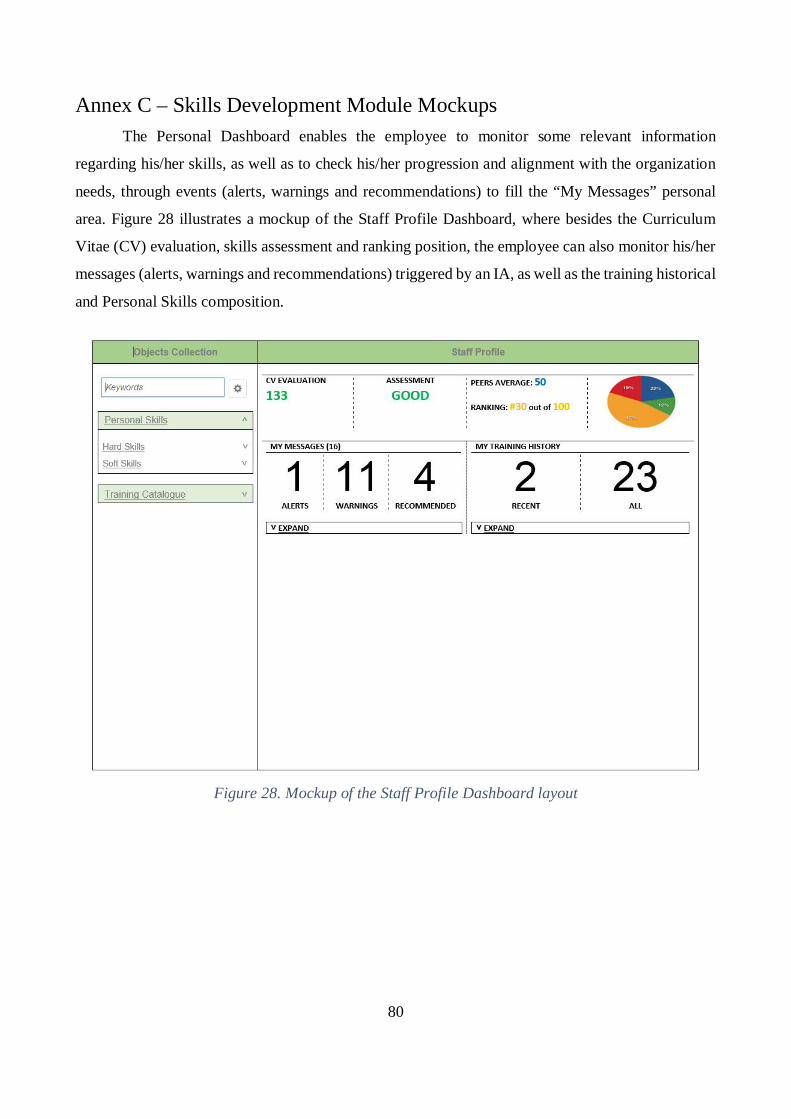
80
Annex C – Skills Development Module MockupsThe Personal Dashboard enables the employee to monitor some relevant information
regarding his/her skills, as well as to check his/her progression and alignment with the organization
needs, through events (alerts, warnings and recommendations) to fill the “My Messages” personal
area. Figure 28 illustrates a mockup of the Staff Profile Dashboard, where besides the Curriculum
Vitae (CV) evaluation, skills assessment and ranking position, the employee can also monitor his/her
messages (alerts, warnings and recommendations) triggered by an IA, as well as the training historical
and Personal Skills composition.
Figure 28. Mockup of the Staff Profile Dashboard layout

81
The Personal Dashboard enables the employee flexibility to choose between different Hard
and Soft Skills options, through a tree map menu. Figure 29 illustrates a mockup of the Personal Skills
Experience, which is composed by two sections: header and detail. In the header section, the
employee can check the messages (alerts, warnings and recommendations) triggered by an IA, as well
as the sum of the “General Professional Experience (GPE)” and “Special Professional Experience
(SPE)” figures, which are both calculated with formulas related with roles time experience. In the
detail section, the employee can monitor the status (error, warning or recommendation) of each role,
check the details and trigger an action – if applicable.
Figure 29. Mockup of the Staff Profile – Staff Experience Skills layout

82
The Training Catalogue enables the employee to monitor some relevant information regarding
overall training sessions, as well as to provide an interactive training environment to support his/her
progression and alignment with the organization needs, through events (alerts, assignments and
recommendations) to fill the “My Skills Plan” area. Figure 30 illustrates a mockup of the Target
Profile Dashboard, where besides the overall training and the “Skills Top10” figures, the employee
can also monitor his/her Skills Plan (alerts, assignments and recommendations) triggered by an IA.
The employees can also perform a keyword(s) semantic or advanced search.
Figure 30. Mockup of the Target Profile Dashboard layout

83
The Training Catalogue enables the employee flexibility to choose between semantic or
advanced search options. Figure 31 illustrates a mockup of the search results – grouped by Hard/Soft
Skills, enabling the employee to expand/collapse any node from the tree map menu.
Figure 31. Mockup of the Target Profile – Search Results layout

84
Annex D – Skills Development Module Indicators & MetricsTable 8 presents the Description, Formula and an Example of the Curriculum Vitae Evaluation
(CE). The CE indicator represents the overall quantitative calculation of all the employee Hard &
Soft Skills metrics.
Table 8. Curriculum Vitae Evaluation - CE (Description, Formula and Example)
Indicator CV Evaluation (CE)
Description Quantitative expression to determine the value of the CE indicator which is
based on metrics related to Hard Skills and Soft Skills, taking in
consideration the weight of each metric
Formula CE = (2AQ + GPE + 2SPE + GPQ + 2SPQ + LQ + EQ + 2CQ) / ND, where:
· AQ: Academic Qualifications metric;
· GPE: General Professional Experience metric;
· SPE: Specific Professional Experience metric;
· GPQ: General Professional Qualification metric;
· SPQ: Specific Professional Qualification metric;
· LQ: Language Qualification metric;
· EQ: Endorsements Qualification metric;
· CQ: Competencies Qualification metric;
· ND: Number of Dimensions (optional).
Example Hard Skills for a specific Employee which the following expertise
AQ: Degree in Managementà Weight: 12
SPE: 10 Years’ Experience in Project Managerà Weight: 16
GPQ: Certification in PMP (> 60 hours)à Weight: 5
LQ: English (Level 3)à Weight: 8
EQ: Scrum (70 Endorsements - Level 4)à Weight: 5
Soft Skills for a specific Employee which the following expertise
CQ: Teamwork (Very Good)à Weight: 10
SPQ: Lead as Example (Training course)à Weight: 8
CE: (2x12 + 2x16 + 5 + 2x8 + 8 + 5 + 2x10) / NM = 110
ND: Not applicable (N/A)

85
If the PMP Certification expires, the system attributes 0 to the GPQ metric,
which will cause the specific employee CE indicator to decrease to 105
Table 9 presents the Description, Formula and an Example of the Peers Average (PA)
indicator. The PA indicator represents the quantitative calculation of the sum of all employees’ CE,
divided by the total of employees.
Table 9. Peer Average - PA (Description, Formula and Example)
Indicator Peers Average (PA)
Description Employees CV Evaluation Average according to the total of employees
Formula PA = SUM(CE) / COUNT(EMP), where:
SUM(CE): SUM of Employees’ CE;
COUNT(EMP): Total number of Employees
Example SUM(CE): 1000
COUNT(EMP): 100
PA = 100
Thus, if a specific Employee CE = 110, then is higher than his peers
average
Table 10 presents the Description, Formula and an Example of the Assessment (AS) indicator.
The AS indicator represents the qualitative information of the employee’ CE, based on specific
criteria defined by the Organization.
Table 10. Assessment - AS (Description, Formula and Example)
Indicator Assessment (AS)
Description Employee overall qualitative Assessment according to the CV Evaluation
Formula AS = ROUND((CE * 100) / MAX(CE)), where:
· MAX(CE): CE maximum value
And based on the following criteria:
· BELOW AVERAGE (<=50%)
· AVERAGE (>50% and <=60%)
· GOOD (>60% and <=80%)

86
· VERY GOOD (>80% and <=95%)
· TOP TALENT (>95% and <=100%)
Example For a specific Employee with CE = 110 and assuming that MAX(CE) is
190
AS = ROUND((110 * 100) / 190) = 58%
Thus, the specific Employee overall assessment is AVERAGE
Table 11 presents the Description, Formula and an Example of the Ranking (RK) indicator.
The PA indicator represents the quantitative calculation of the employee rank position, in comparison
with his peers.
Table 11. Ranking - RK (Description, Formula and Example)
Indicator Ranking (RK)
Description Employee Ranking according to the total of employees
Formula RANK function(EmployeeCE,Employee1:N)
Example For a specific Employee with CE = 110 and assuming that the
Organization has the following employees/CE:
Employee1: 50, Employee2: 60, Employee3: 70, Employee4: 80,
Employee5: 90, Employee6: 100, Employee7: 120, Employee8: 130 and
Employee9: 190
RANK(110, Employee1:N) = Ranking 7 of 10
Table 12 presents the Description, Formula and an Example of the CV Composition (CC)
indicator. The CC indicator represents the quantitative calculation of the percentage of each of the
employee skills/competencies, in comparison with the sum of all his Hard & Soft Skills metrics.
Table 12. CV Composition - CC (Description, Formula and Example)
Indicator CV Composition (CC)
Description CV Composition is displayed in a pie chart, where each one of the pie chart
slices (with different colours) represents graphically the weight of each one
of the different Skills Parameters. The Personal Dashboard pie chart displays
a percentage value, determined by the metric value of each one of the
different Skills Parameters (e.g., Education, Experience).
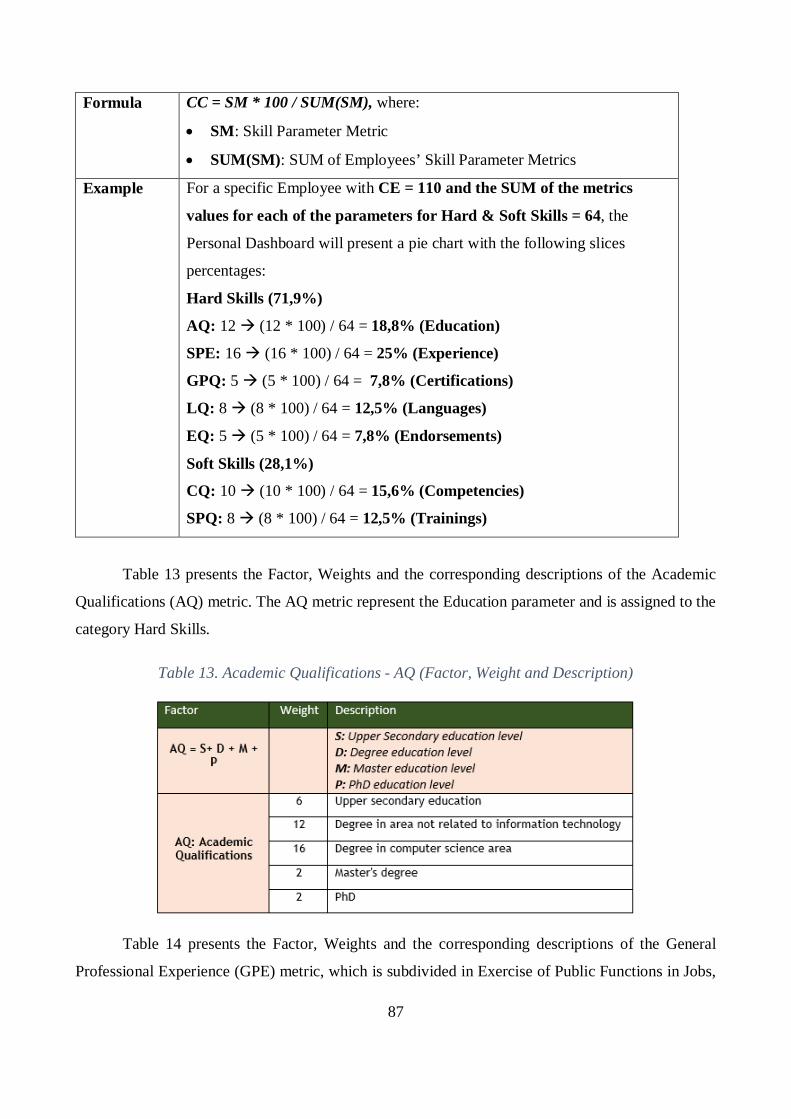
87
Formula CC = SM * 100 / SUM(SM), where:
· SM: Skill Parameter Metric
· SUM(SM): SUM of Employees’ Skill Parameter Metrics
Example For a specific Employee with CE = 110 and the SUM of the metrics
values for each of the parameters for Hard & Soft Skills = 64, the
Personal Dashboard will present a pie chart with the following slices
percentages:
Hard Skills (71,9%)
AQ: 12à (12 * 100) / 64 = 18,8% (Education)
SPE: 16à (16 * 100) / 64 = 25% (Experience)
GPQ: 5à (5 * 100) / 64 = 7,8% (Certifications)
LQ: 8à (8 * 100) / 64 = 12,5% (Languages)
EQ: 5à (5 * 100) / 64 = 7,8% (Endorsements)
Soft Skills (28,1%)
CQ: 10à (10 * 100) / 64 = 15,6% (Competencies)
SPQ: 8à (8 * 100) / 64 = 12,5% (Trainings)
Table 13 presents the Factor, Weights and the corresponding descriptions of the Academic
Qualifications (AQ) metric. The AQ metric represent the Education parameter and is assigned to the
category Hard Skills.
Table 13. Academic Qualifications - AQ (Factor, Weight and Description)
Table 14 presents the Factor, Weights and the corresponding descriptions of the General
Professional Experience (GPE) metric, which is subdivided in Exercise of Public Functions in Jobs,
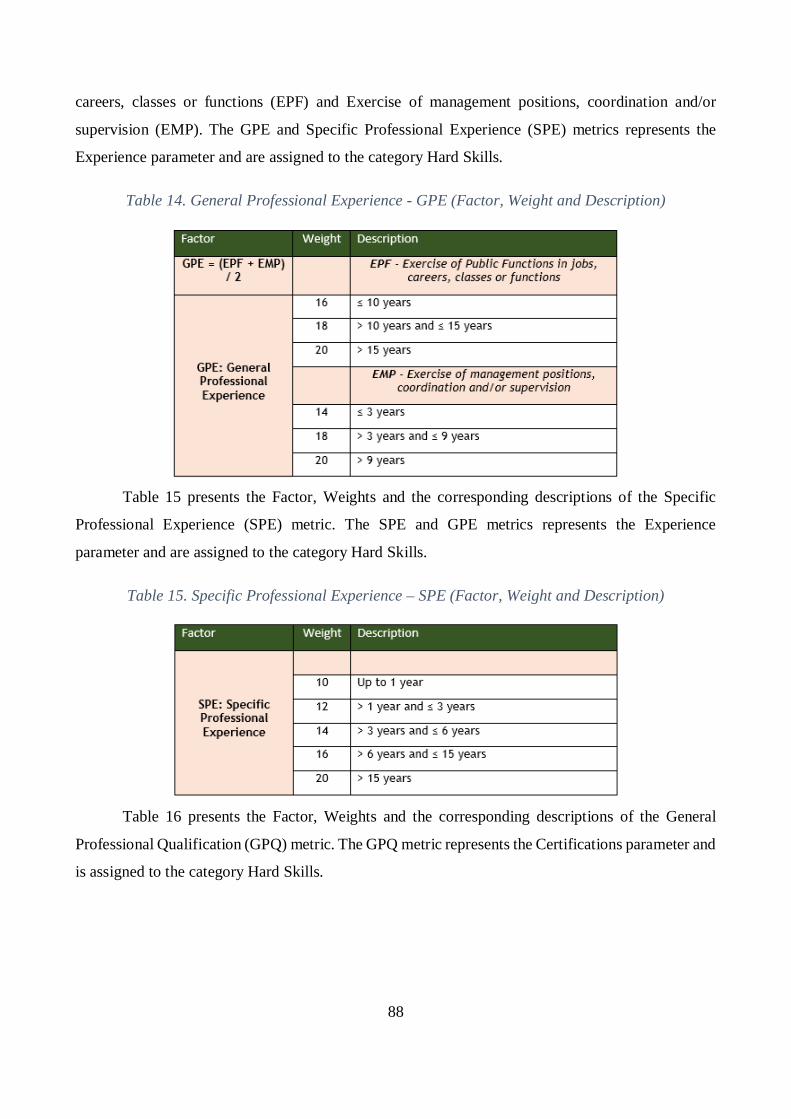
88
careers, classes or functions (EPF) and Exercise of management positions, coordination and/or
supervision (EMP). The GPE and Specific Professional Experience (SPE) metrics represents the
Experience parameter and are assigned to the category Hard Skills.
Table 14. General Professional Experience - GPE (Factor, Weight and Description)
Table 15 presents the Factor, Weights and the corresponding descriptions of the Specific
Professional Experience (SPE) metric. The SPE and GPE metrics represents the Experience
parameter and are assigned to the category Hard Skills.
Table 15. Specific Professional Experience – SPE (Factor, Weight and Description)
Table 16 presents the Factor, Weights and the corresponding descriptions of the General
Professional Qualification (GPQ) metric. The GPQ metric represents the Certifications parameter and
is assigned to the category Hard Skills.
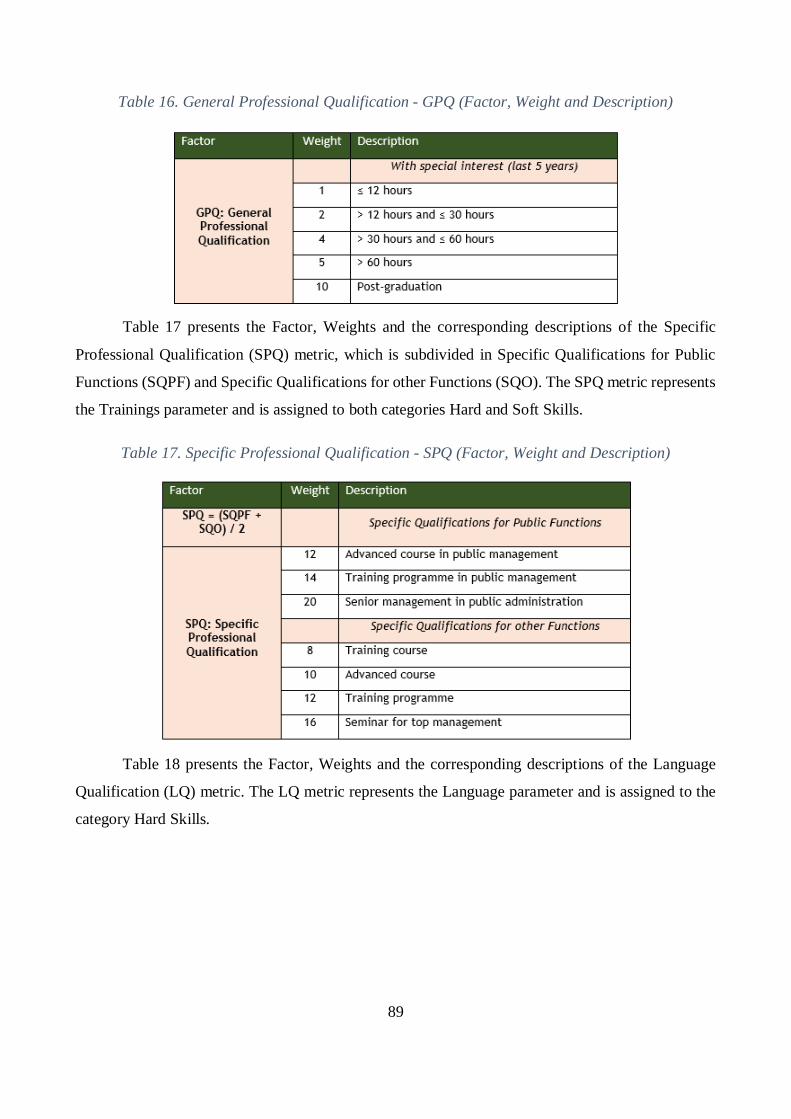
89
Table 16. General Professional Qualification - GPQ (Factor, Weight and Description)
Table 17 presents the Factor, Weights and the corresponding descriptions of the Specific
Professional Qualification (SPQ) metric, which is subdivided in Specific Qualifications for Public
Functions (SQPF) and Specific Qualifications for other Functions (SQO). The SPQ metric represents
the Trainings parameter and is assigned to both categories Hard and Soft Skills.
Table 17. Specific Professional Qualification - SPQ (Factor, Weight and Description)
Table 18 presents the Factor, Weights and the corresponding descriptions of the Language
Qualification (LQ) metric. The LQ metric represents the Language parameter and is assigned to the
category Hard Skills.

90
Table 18. Language Qualification - LQ (Factor, Weight and Description)
Table 19 presents the Factor, Weights and the corresponding descriptions of the Endorsements
Qualification (EQ) metric. The EQ metric represents the Endorsements parameter and is assigned to
the category Hard Skills.
Table 19. Endorsements Qualification - EQ (Factor, Weight and Description)
Table 20 presents the Factor, Weights and the corresponding descriptions of the Competencies
Qualification (CQ) metric. The CQ metric represents the Competencies parameter and is assigned to
the category Soft Skills.
Table 20. Competencies Qualification - CQ (Factor, Weight and Description)

91
Annex E – Skills Development Module Domain Model
Domain Model
Classes
Description
Class Staff · Corresponds to the class which records "Personal Data" in the Virtual
Assistant Tool (VAT). It’s through this class that there is a link between
the staff in the SDM and the clinical profile of this staff in VAT (i.e., in
the Database Entity Relationship Diagram – ERD – it should be the same
table).
· Just as an example, and in order to reinforce that it's the same table in the
database ERD, the same attributes from the interface "Personal Data" in
the VAT (i.e., FirstName, MiddleName, LastName , BirthDate, Country,
Phone and Gender) were placed in the domain model.
Association Class
PersonalDashboard
· List of fixed attributes:
o Sd_Alert, Sd_Warn, Sd_Recom, Sd_Recent, Sd_Total

92
· List of variable attributes:
o Correspond to the indicators defined in the MIndicator class, assigned
to the "Personal Dashboard" group (e.g., CV Evaluation, Assessment,
Peers Average, Ranking, ...).
· Whenever a new record is created in the MIndicator class (i.e., a new
indicator):
o The business user must indicate to which Dashboard this indicator will
be associated to (i.e., PersonalDashboard);
o Assuming that a new record is created in MIndicator for
PersonalDashboard, when the business user clicks the "Save" button,
the system automatically creates in the PersonnalDashboard class a
new record with the same name that was created in the MIndicator
class. The objective of this record in the PersonalDashboard class is to
keep the skill measured values for this indicator for each employee
contained in the Staff class.
Association Class
TrainingDashboard
· List of fixed attributes:
o Td_Train, Td_Sess, Td_AvgSc, Td_Alert, Td_Assign, Td_Recom.
· List of variable attributes:

93
o No correspondence so far, since no indicators were defined in the
MIndicator class, assigned to the “Training Catalogue” group. Once
any indicators are created in the MIndicator class, assigned to the
“Training Catalogue” group, they can be presented in the
TrainingDashboard.
· Whenever a new record is created in the MIndicator class (i.e., a new
indicator):
o The business user must indicate to which Dashboard this indicator will
be associated to (i.e., TrainingDashboard);
o In class TrainingDashboard, the fixed indicator Assignments value is
increased whenever the user selects a training activity available in the
catalogue - TrainingCatalogue class (i.e., click the "Assign" button, or
expressed interest in attending the training session).
Class StaffSkill · This class is used for the relationship of the classes that characterizes the
skills that the employee (staff) has, that is, relates to the following classes:
o Staff ID (class Staff);
o ID of the records in the MParameterH class, assigned to the “Personal
Skills” group, in the SDM Interface;
o ID of the records from the VSSxxx classes (dynamically generated
based on records contained in the the MParameterH class).
· As long as no record is created in the MParameter class, the StaffSkill
class is empty, as illustrated in Figure 32.
· Whenever a new record is created in the MParameter class (i.e., a new
skill):
o The business user must indicate to which Parameter group (i.e., skill
group) this parameter will be associated to (i.e., Personal Skills).
Class StaffTraining · This class is used to identify which training activities were selected by
the employee from the list of options available in the Training Catalogue
· Each employee (staff) can, at any moment, select certain training
activities from the list of options available in the catalogue. This leads to
new records creation, since it relates the following classes:
o Staff ID (class Staff);

94
o ID of the records in the TrainingCatalogue class, which were selected
by the employee (i.e., training activities marked as “Assigned”);
o Grade in the training activity.
Class
TrainingCatalogue
· This class characterizes the catalogue of available training activities
· Performs the relationship of the classes that characterizes the training
offers available in the Training Catalogue, that is, relates the following
classes:
o ID of the records in the MParameterH class, assigned to the “Training
Catalogue” group, in the SDM Interface;
o ID of the records from the VTCxxx classes (dynamically generated
based on records contained in the the MParameterH class). The
VTCxxx classes are specializations of training offers from the
Training Catalogue.
· As long as no record is created in the MParameter class, the
TrainingCatalogue class is empty, as illustrated in Figure 32.
· Whenever a new record is created in the MParameter class (i.e., a new
training activity):
o The business user must indicate to which Parameter group (i.e., skill
group) this parameter will be associated to (i.e., Training Catalog).

95Figure 32. Skills Management domain model – Phase I

96Figure 33. Skills Management domain model – Phase II

97
Figure 34. Skills Management domain model – Phase III
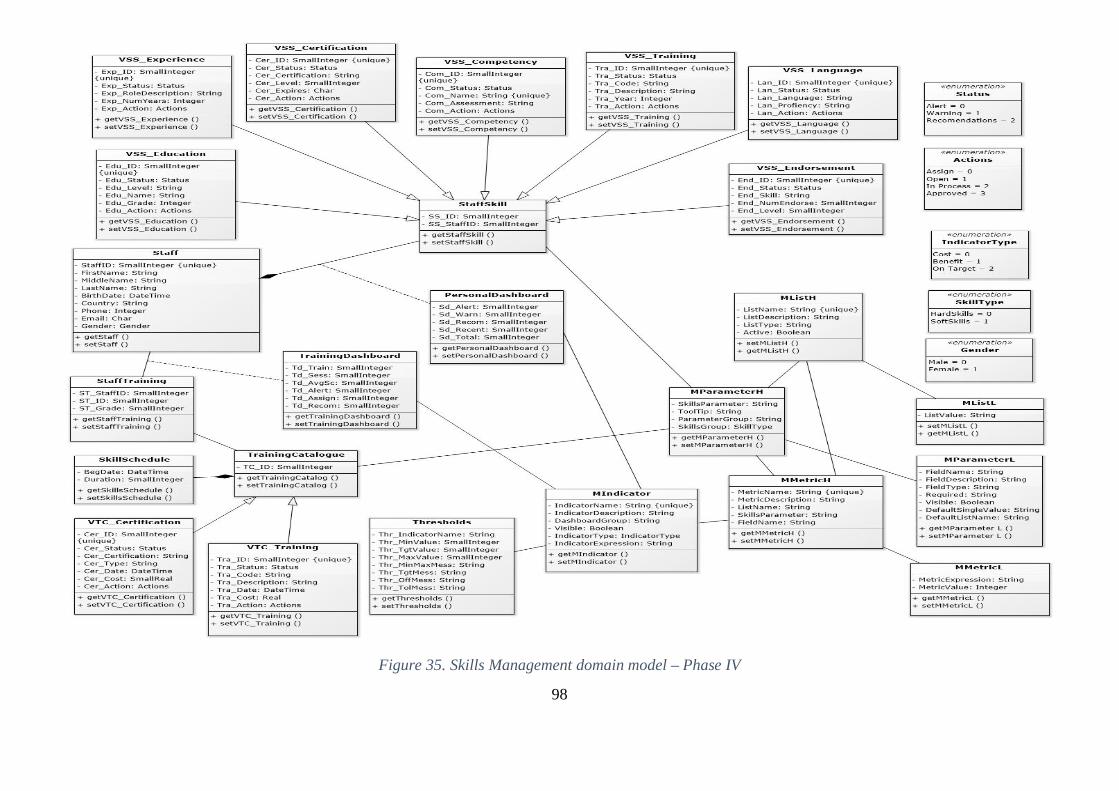
98
Figure 35. Skills Management domain model – Phase IV