GALI: does the choice of survey matter? - EurOhex meeting 2017/EHLEIS 2017...GALI: does the choice...
27
GALI: does the choice of survey matter? Erasmus MC, Department of Public Health Jose Ricardo Rubio Wilma Nusselder Johan Mackenbach EHLEIS , Brussels, April 21, 2017
Transcript of GALI: does the choice of survey matter? - EurOhex meeting 2017/EHLEIS 2017...GALI: does the choice...
GALI: does the choice of survey matter?
Erasmus MC, Department of Public Health
Jose Ricardo Rubio
Wilma Nusselder
Johan Mackenbach
EHLEIS , Brussels, April 21, 2017
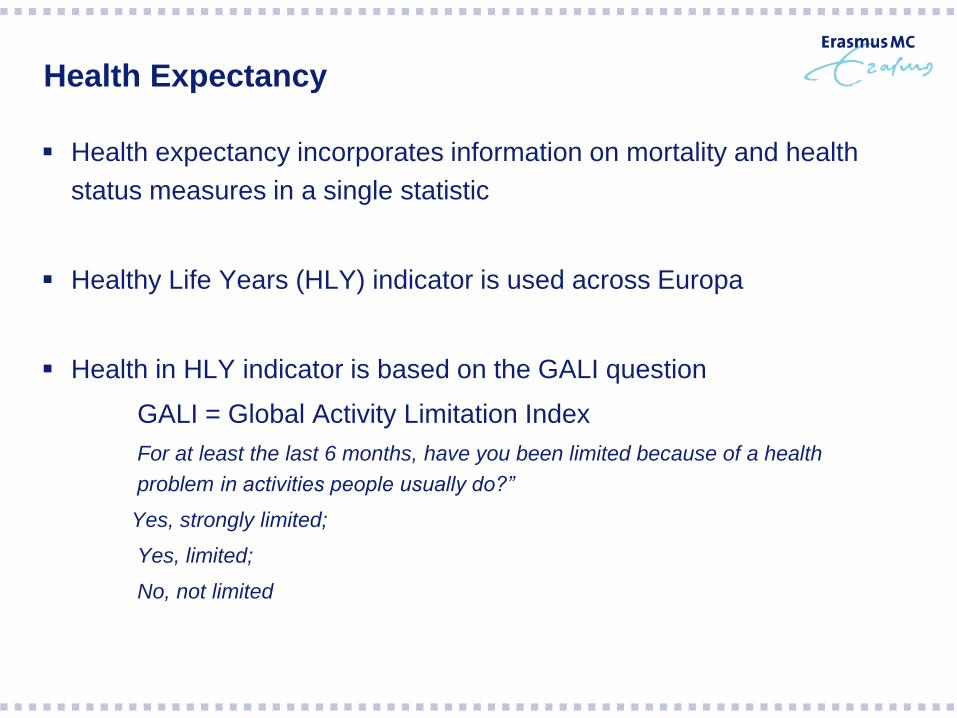
Health Expectancy
Health expectancy incorporates information on mortality and health
status measures in a single statistic
Healthy Life Years (HLY) indicator is used across Europa
Health in HLY indicator is based on the GALI question
GALI = Global Activity Limitation Index
For at least the last 6 months, have you been limited because of a health
problem in activities people usually do?”
Yes, strongly limited;
Yes, limited;
No, not limited
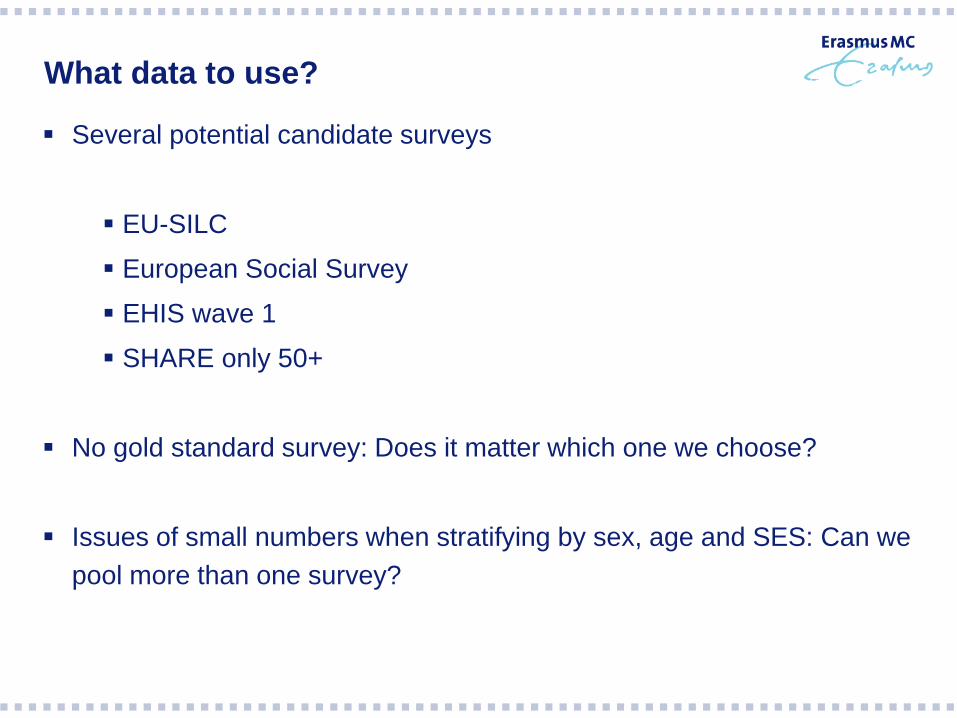
What data to use?
Several potential candidate surveys
EU-SILC
European Social Survey
EHIS wave 1
SHARE only 50+
No gold standard survey: Does it matter which one we choose?
Issues of small numbers when stratifying by sex, age and SES: Can we
pool more than one survey?
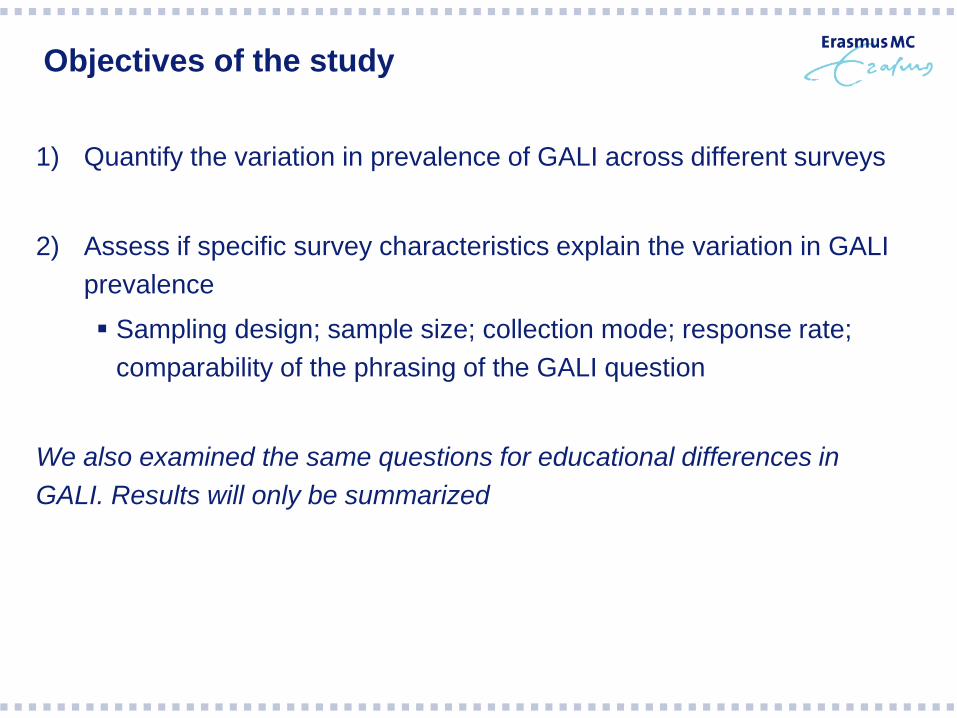
Objectives of the study
1) Quantify the variation in prevalence of GALI across different surveys
2) Assess if specific survey characteristics explain the variation in GALI
prevalence
Sampling design; sample size; collection mode; response rate;
comparability of the phrasing of the GALI question
We also examined the same questions for educational differences in
GALI. Results will only be summarized
Data
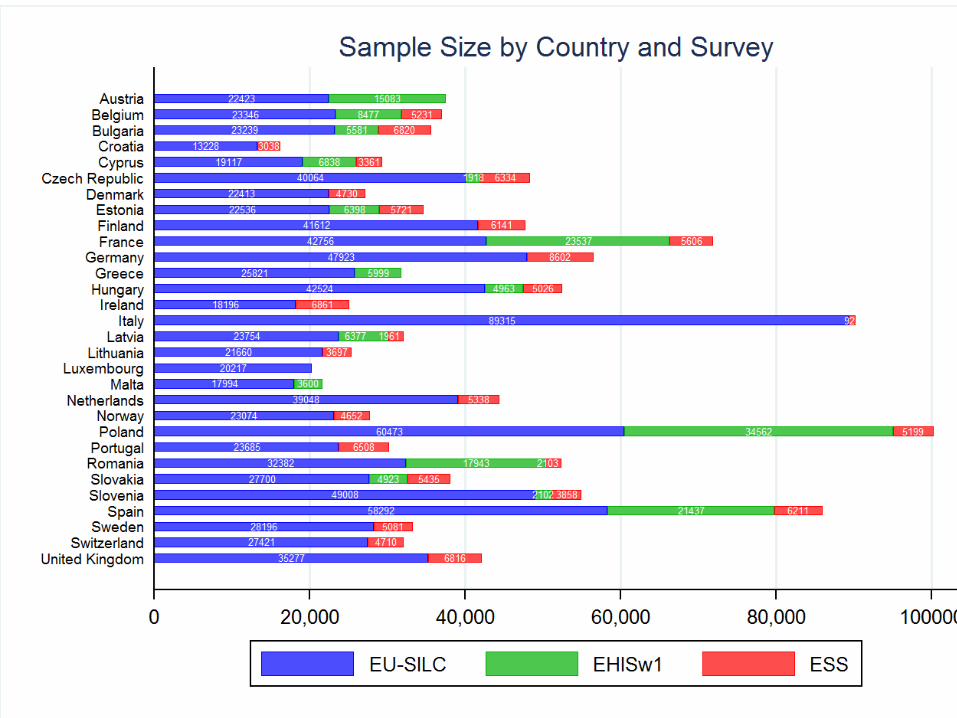
We included the following datasets in our analyses:
EU-SILC (2008/ 2012)
European Social Survey (2008 / 2010 / 2012)
EHIS wave 1 (2008)
Micro data: non-institutionalized population
29 countries
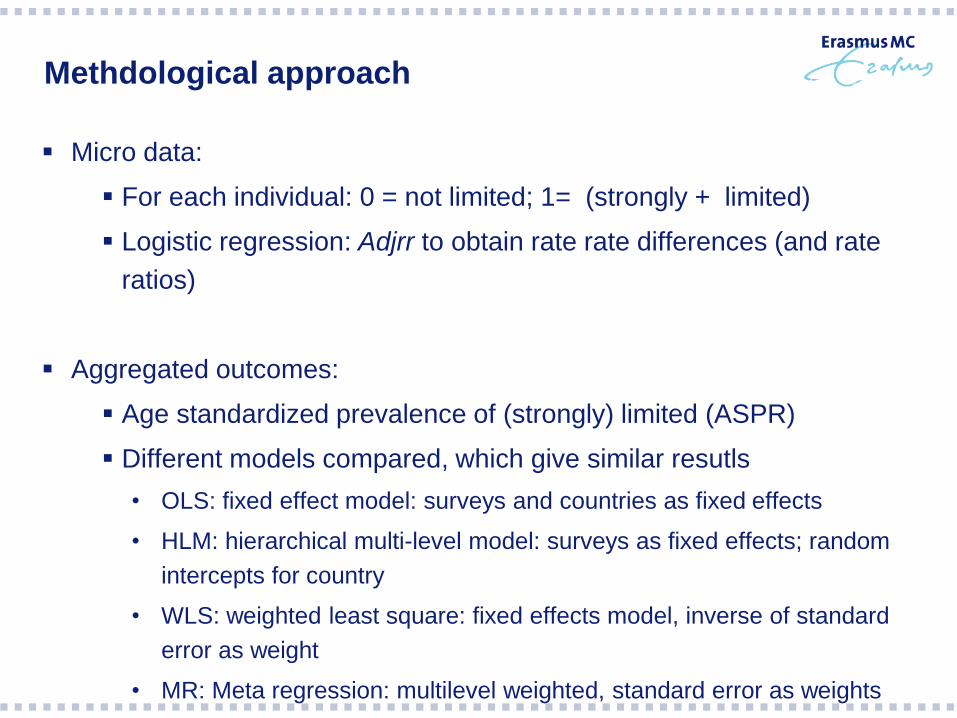
Methdological approach
Micro data:
For each individual: 0 = not limited; 1= (strongly + limited)
Logistic regression: Adjrr to obtain rate rate differences (and rate
ratios)
Aggregated outcomes:
Age standardized prevalence of (strongly) limited (ASPR)
Different models compared, which give similar resutls
• OLS: fixed effect model: surveys and countries as fixed effects
• HLM: hierarchical multi-level model: surveys as fixed effects; random
intercepts for country
• WLS: weighted least square: fixed effects model, inverse of standard
error as weight
• MR: Meta regression: multilevel weighted, standard error as weights
Methodological Approach: micro data (more
detail)
𝑄1: 𝐺𝐴𝐿𝐼𝑖𝑐 = 𝛼 + 𝛽𝑘 𝐴𝑔𝑒𝐺𝑟𝑜𝑢𝑝𝑘+ 𝛽𝑠𝑆𝑢𝑟𝑣𝑒𝑦𝑠 + 𝛽𝑐𝐶𝑜𝑢𝑛𝑡𝑟𝑦𝑐 + 𝜀
𝑄2: 𝐺𝐴𝐿𝐼𝑖𝑐 = 𝛼 + 𝛽𝑘 𝐴𝑔𝑒𝐺𝑟𝑜𝑢𝑝𝑘+ 𝛽𝑠𝑆𝑢𝑟𝑣𝑒𝑦𝑠 + 𝛽𝑐𝐶𝑜𝑢𝑛𝑡𝑟𝑦𝑐+𝛽𝑐𝑆𝑢𝑟𝑣𝑒𝑦 𝑐ℎ𝑎𝑟𝑎𝑐𝑡𝑒𝑟𝑖𝑡𝑖𝑐 + 𝜀
Logistic Regression
Q1 – Estimate the impact of survey on prevalence (Q1)
Q2 – Add survey characteristics
Adjrr in STATA
Models include errors clustered at the country level
Stratified by gender
Coefficients of Interest
Methodological Approach: aggregated data
(more detail)
Different models:
In each model (OLS; HLM; WLS, MR):
Q1 – Estimate the impact of survey on prevalence (Q1)
Q2 – Add survey characteristics
Stratified by gender
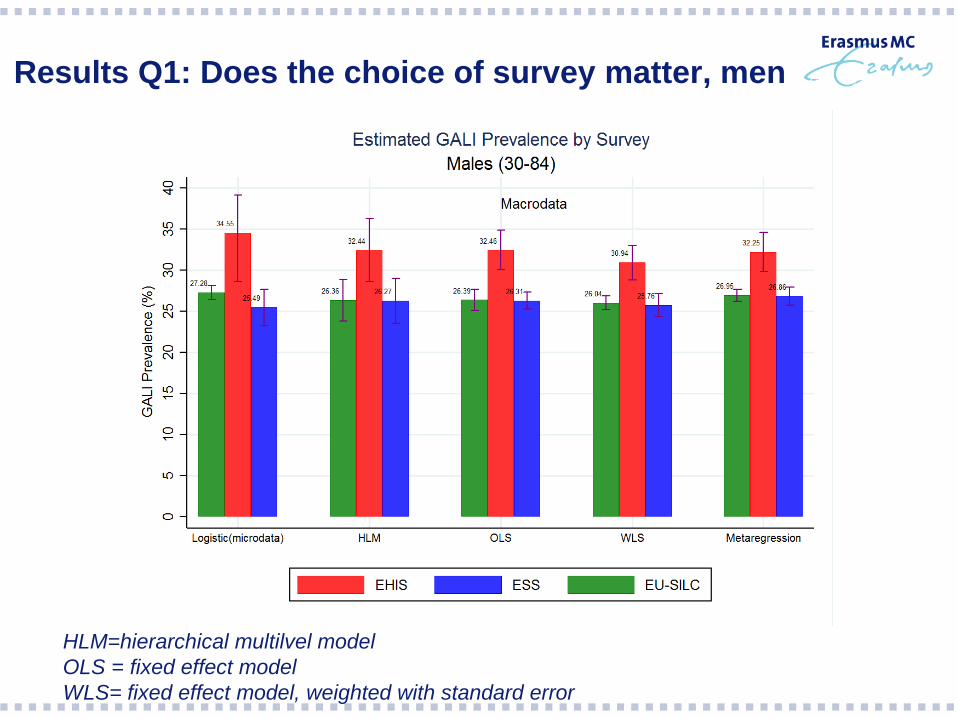
Results Q1: Does the choice of survey matter, men
HLM=hierarchical multilvel model
OLS = fixed effect model
WLS= fixed effect model, weighted with standard error
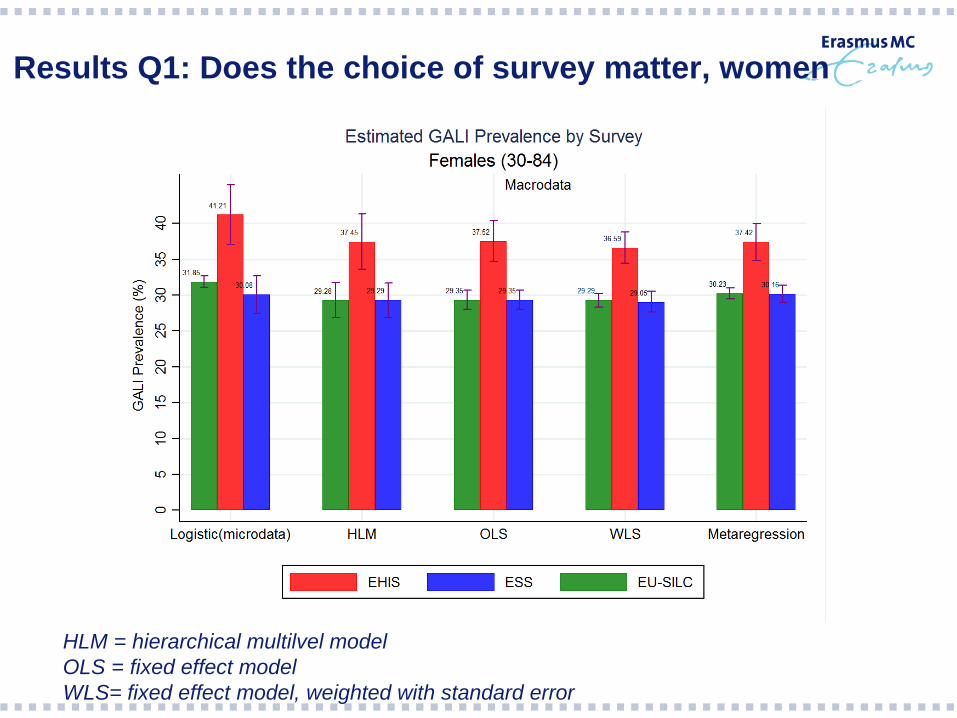
Results Q1: Does the choice of survey matter, women
HLM = hierarchical multilvel model
OLS = fixed effect model
WLS= fixed effect model, weighted with standard error
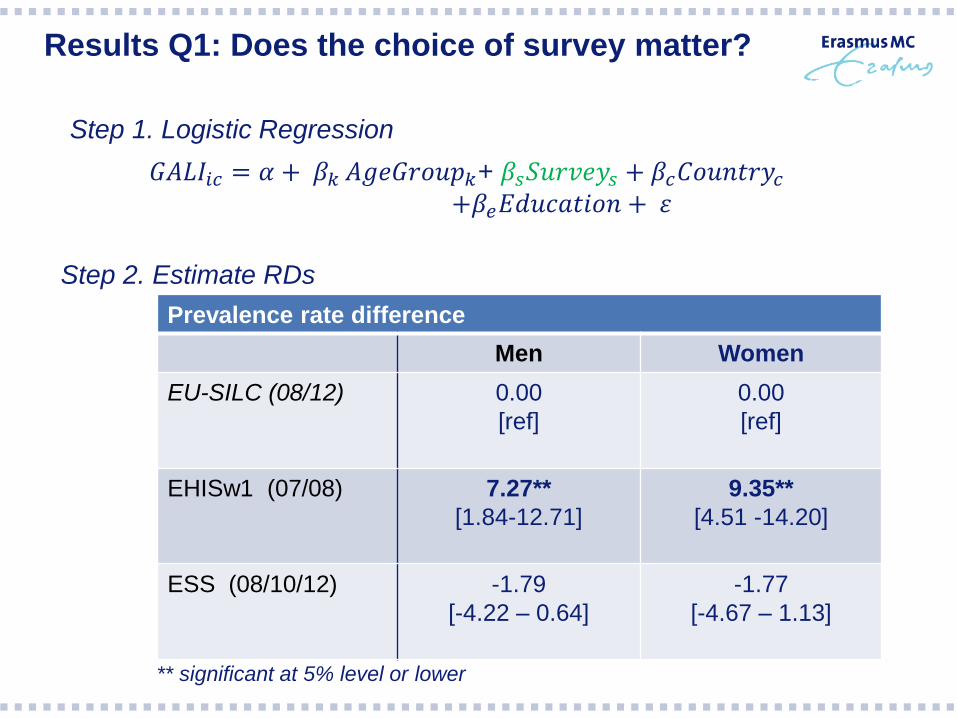
Results Q1: Does the choice of survey matter?
𝐺𝐴𝐿𝐼𝑖𝑐 = 𝛼 + 𝛽𝑘 𝐴𝑔𝑒𝐺𝑟𝑜𝑢𝑝𝑘+ 𝛽𝑠𝑆𝑢𝑟𝑣𝑒𝑦𝑠 + 𝛽𝑐𝐶𝑜𝑢𝑛𝑡𝑟𝑦𝑐+𝛽𝑒𝐸𝑑𝑢𝑐𝑎𝑡𝑖𝑜𝑛 + 𝜀
Prevalence rate difference
Men Women
EU-SILC (08/12) 0.00
[ref]
0.00
[ref]
EHISw1 (07/08) 7.27**
[1.84-12.71]
9.35**
[4.51 -14.20]
ESS (08/10/12) -1.79
[-4.22 – 0.64]
-1.77
[-4.67 – 1.13]
Step 1. Logistic Regression
Step 2. Estimate RDs
** significant at 5% level or lower
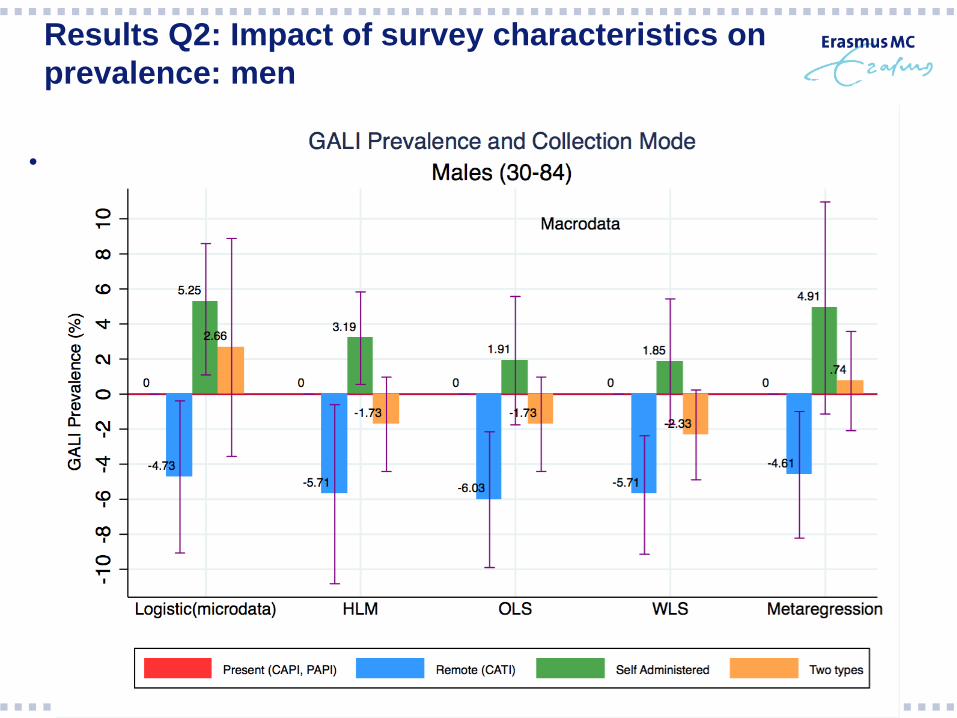
Results Q2: Impact of survey characteristics on
prevalence: men
• Collection modus was only survey characteristic with significant impact
on prevalence
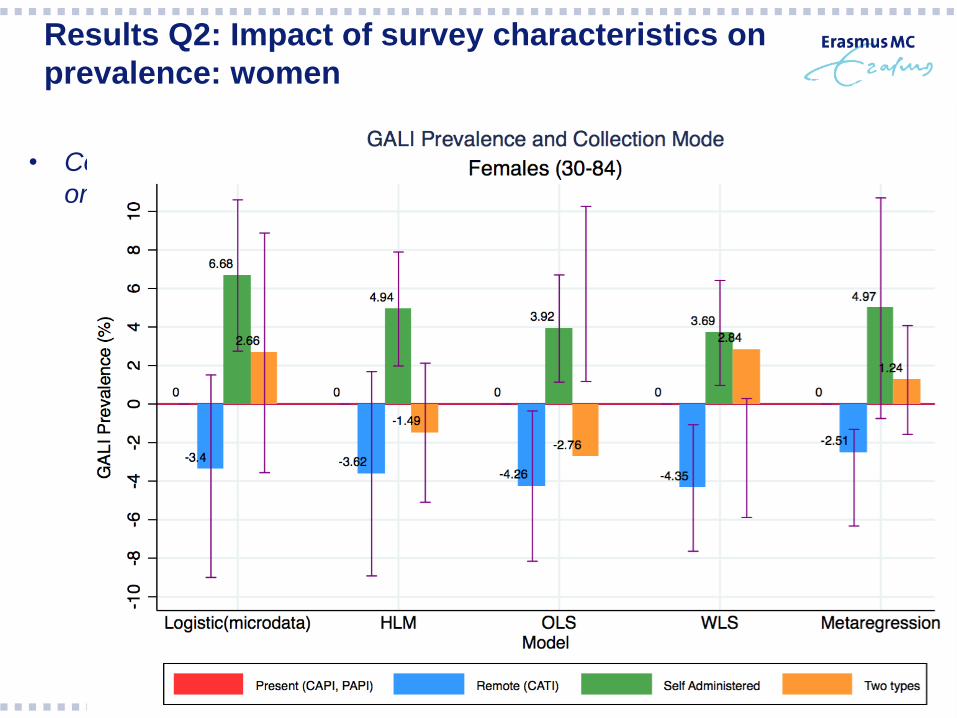
Results Q2: Impact of survey characteristics on
prevalence: women
• Collection modus was only survey characteristic with significant impact
on prevalence

Males – Risk Difference Estimates By Survey
Baseline Model + collection
modus
EU-SILC 0.00
[ref= 25.58%]
0.00
[ref= 25.58]
EHISw1 7.27**
[1.84-12.71]
6.40**
[2.70-10.10]
ESS -1.79
[-4.22 - 0.64]
-1.93
[-4.70 - 0.83]
Results Q2: Impact of survey characteristics on
prevalence: men
• Collection modus was only survey characteristic with significant impact
on prevalence
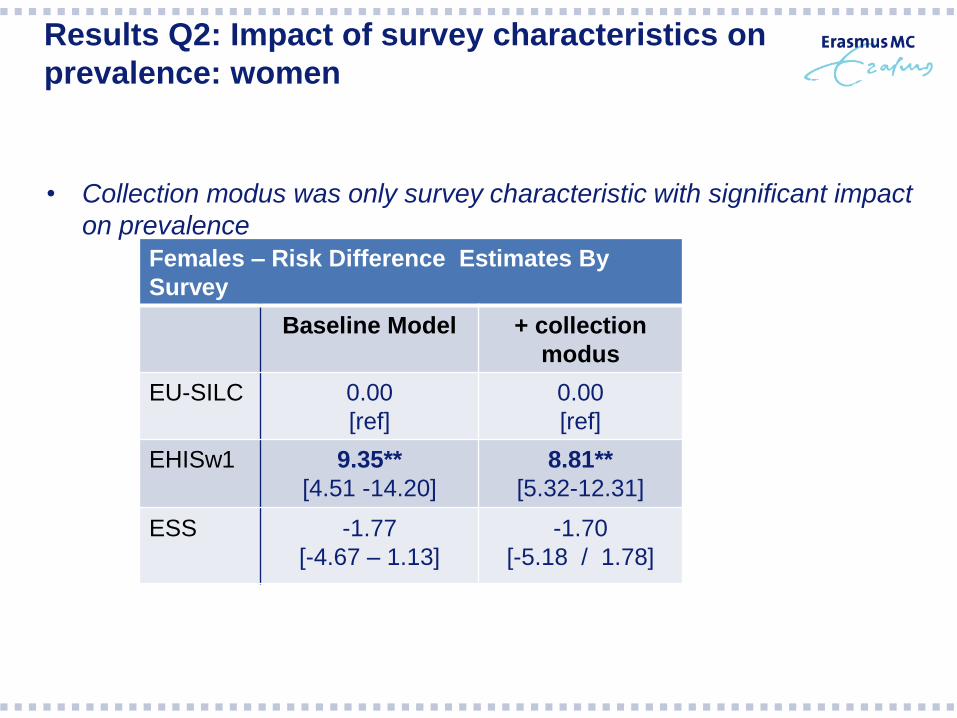
Females – Risk Difference Estimates By
Survey
Baseline Model + collection
modus
EU-SILC 0.00
[ref]
0.00
[ref]
EHISw1 9.35**
[4.51 -14.20]
8.81**
[5.32-12.31]
ESS -1.77
[-4.67 – 1.13]
-1.70
[-5.18 / 1.78]
Results Q2: Impact of survey characteristics on
prevalence: women
• Collection modus was only survey characteristic with significant impact
on prevalence
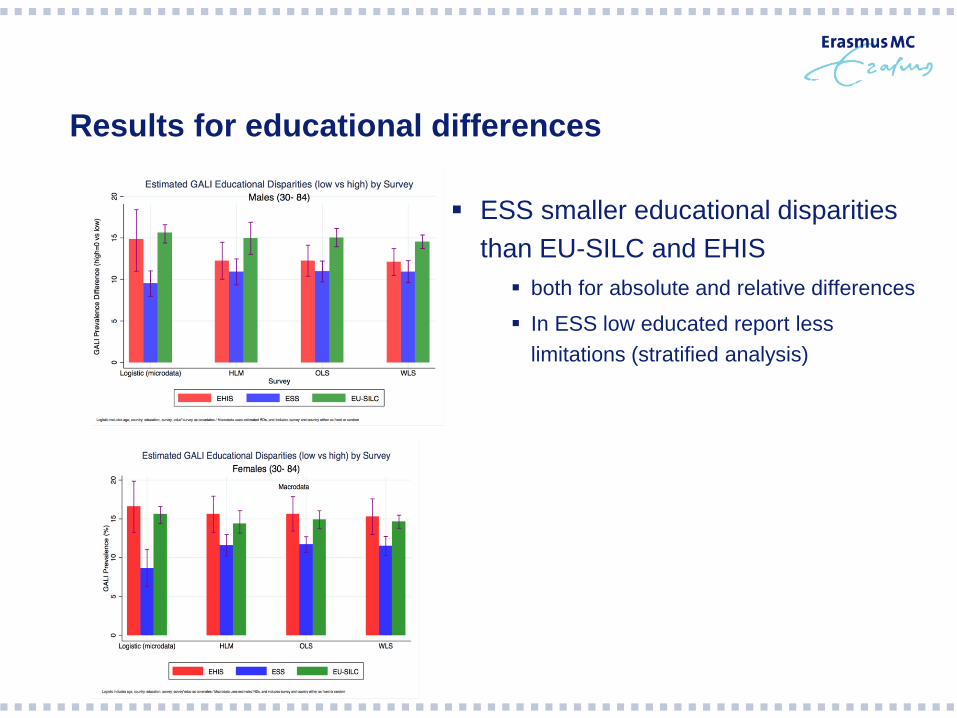
Results for educational differences
ESS smaller educational disparities
than EU-SILC and EHIS
both for absolute and relative differences
In ESS low educated report less
limitations (stratified analysis)
Conclusion
The choice of survey does matter:
EHIS 5-7 %-points higher GALI prevalence in men
EHIS 7-9 % points higher GALI prevalence in women
relative to EU-SILC and ESS
Collection mode has impact on GALI prevalence, but does not explain
the differences between the surveys
Self-administered questionnaires around 5-6 %-points higher
prevalence of GALI than with interviewer
Educational differences in GALI prevalence are smaller in ESS than in
EU-SILC and EHIS
Low educated in ESS show lower GALI prevalence than in EU-
SILC and EHIS. No difference in higher SES
Lower educated are more affected by collection mode

Limitations
Multi-collinearity between GALI questions with surveys: separate
analyses are being carried out to assess role of formulation of GALI
question
Only country with Self-Administered in the sample is Germany for EU-
SILC
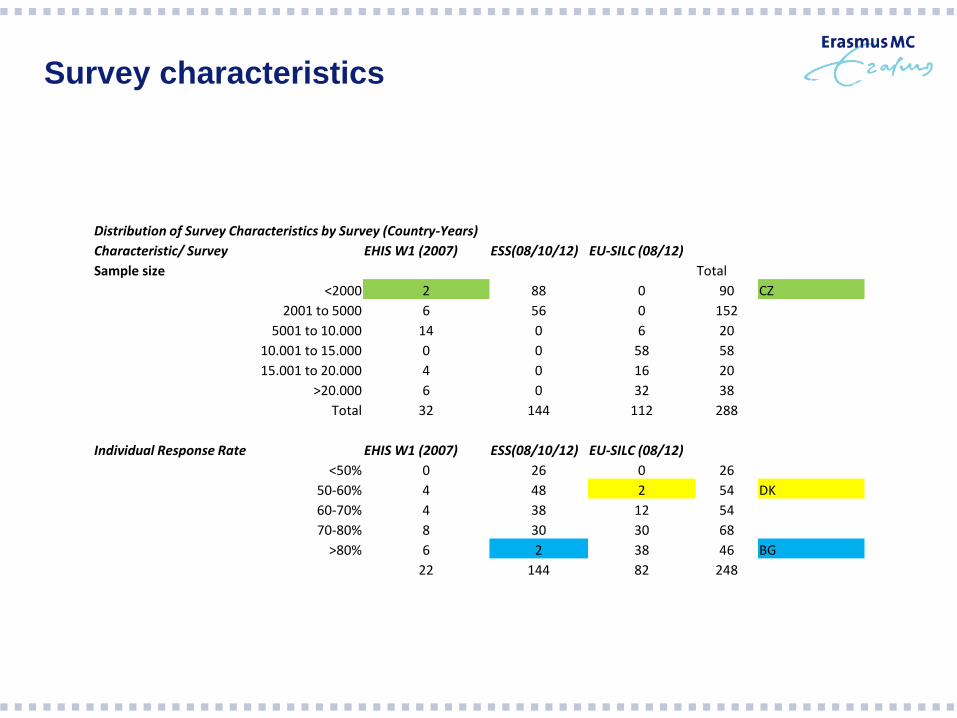
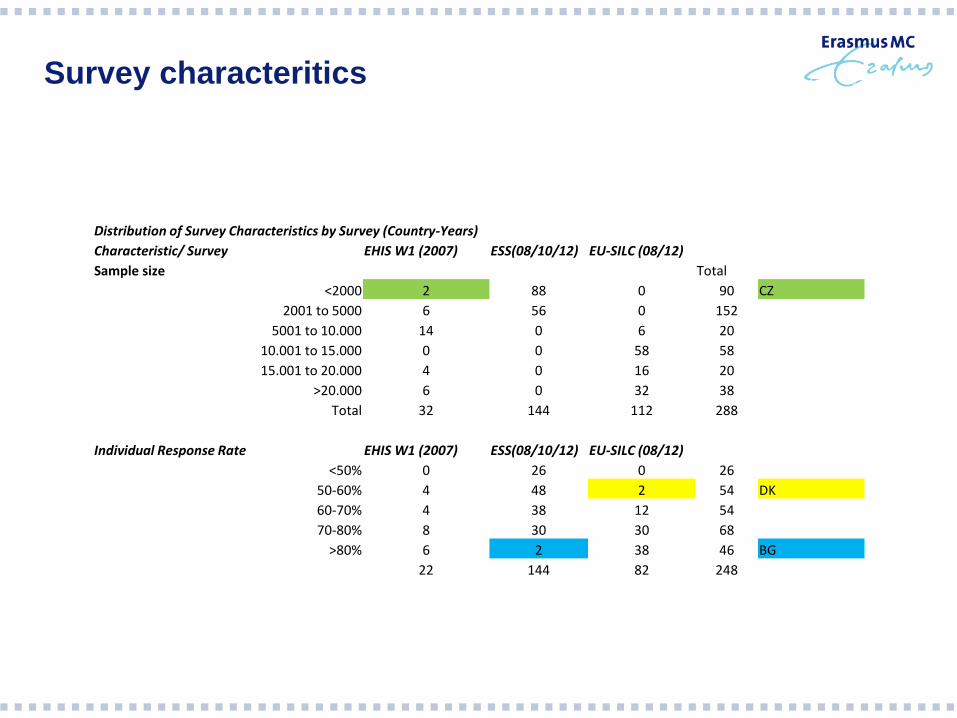
Survey characteristics
Distribution of Survey Characteristics by Survey (Country-Years)
Characteristic/ Survey EHIS W1 (2007) ESS(08/10/12) EU-SILC (08/12)
Sample size Total
<2000 2 88 0 90 CZ
2001 to 5000 6 56 0 152
5001 to 10.000 14 0 6 20
10.001 to 15.000 0 0 58 58
15.001 to 20.000 4 0 16 20
>20.000 6 0 32 38
Total 32 144 112 288
Individual Response Rate EHIS W1 (2007) ESS(08/10/12) EU-SILC (08/12)
<50% 0 26 0 26
50-60% 4 48 2 54 DK
60-70% 4 38 12 54
70-80% 8 30 30 68
>80% 6 2 38 46 BG
22 144 82 248
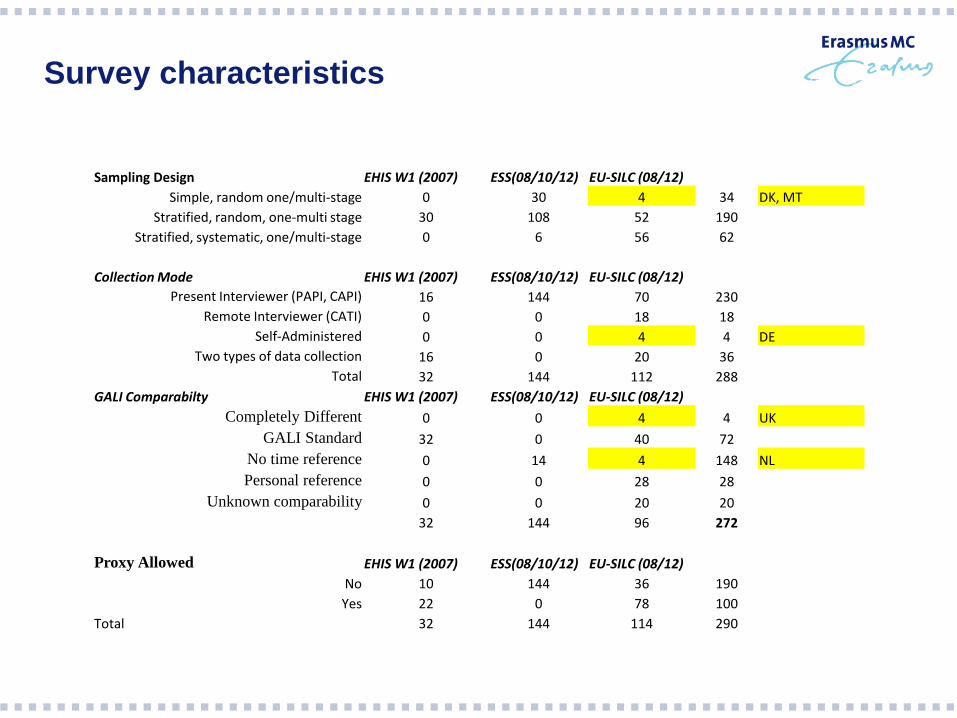
Survey characteristics
Sampling Design EHIS W1 (2007) ESS(08/10/12) EU-SILC (08/12)
Simple, random one/multi-stage 0 30 4 34 DK, MT
Stratified, random, one-multi stage 30 108 52 190
Stratified, systematic, one/multi-stage 0 6 56 62
Collection Mode EHIS W1 (2007) ESS(08/10/12) EU-SILC (08/12)
Present Interviewer (PAPI, CAPI) 16 144 70 230
Remote Interviewer (CATI) 0 0 18 18
Self-Administered 0 0 4 4 DE
Two types of data collection 16 0 20 36
Total 32 144 112 288
GALI Comparabilty EHIS W1 (2007) ESS(08/10/12) EU-SILC (08/12)
Completely Different 0 0 4 4 UK
GALI Standard 32 0 40 72
No time reference 0 14 4 148 NL
Personal reference 0 0 28 28
Unknown comparability 0 0 20 20
32 144 96 272
Proxy Allowed EHIS W1 (2007) ESS(08/10/12) EU-SILC (08/12)
No 10 144 36 190
Yes 22 0 78 100
Total 32 144 114 290
Survey characteritics
Distribution of Survey Characteristics by Survey (Country-Years)
Characteristic/ Survey EHIS W1 (2007) ESS(08/10/12) EU-SILC (08/12)
Sample size Total
<2000 2 88 0 90 CZ
2001 to 5000 6 56 0 152
5001 to 10.000 14 0 6 20
10.001 to 15.000 0 0 58 58
15.001 to 20.000 4 0 16 20
>20.000 6 0 32 38
Total 32 144 112 288
Individual Response Rate EHIS W1 (2007) ESS(08/10/12) EU-SILC (08/12)
<50% 0 26 0 26
50-60% 4 48 2 54 DK
60-70% 4 38 12 54
70-80% 8 30 30 68
>80% 6 2 38 46 BG
22 144 82 248
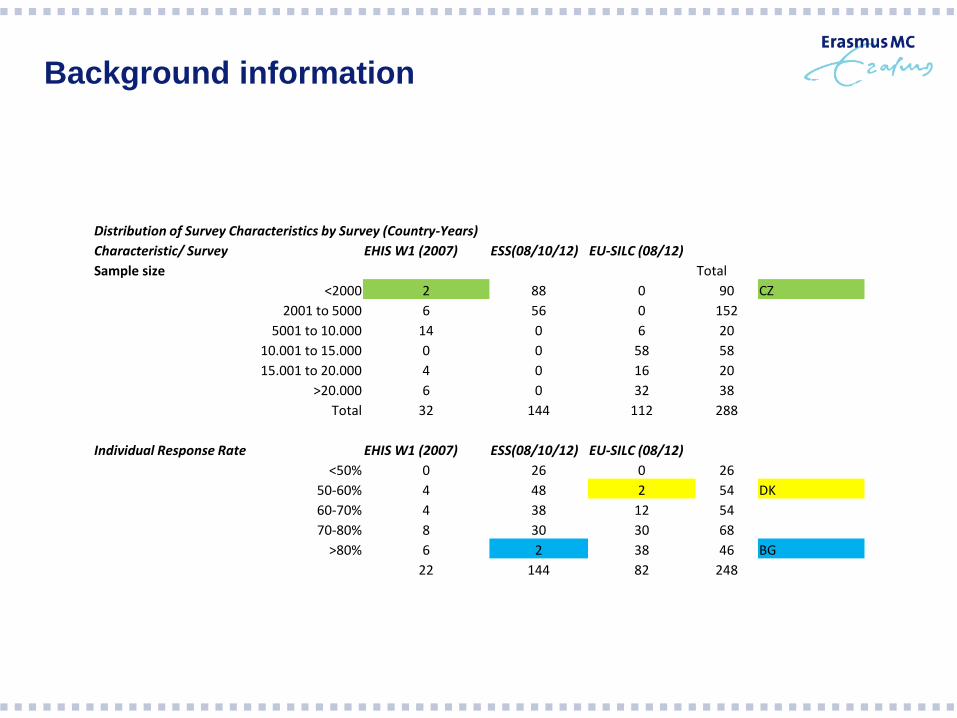
Background information
Distribution of Survey Characteristics by Survey (Country-Years)
Characteristic/ Survey EHIS W1 (2007) ESS(08/10/12) EU-SILC (08/12)
Sample size Total
<2000 2 88 0 90 CZ
2001 to 5000 6 56 0 152
5001 to 10.000 14 0 6 20
10.001 to 15.000 0 0 58 58
15.001 to 20.000 4 0 16 20
>20.000 6 0 32 38
Total 32 144 112 288
Individual Response Rate EHIS W1 (2007) ESS(08/10/12) EU-SILC (08/12)
<50% 0 26 0 26
50-60% 4 48 2 54 DK
60-70% 4 38 12 54
70-80% 8 30 30 68
>80% 6 2 38 46 BG
22 144 82 248
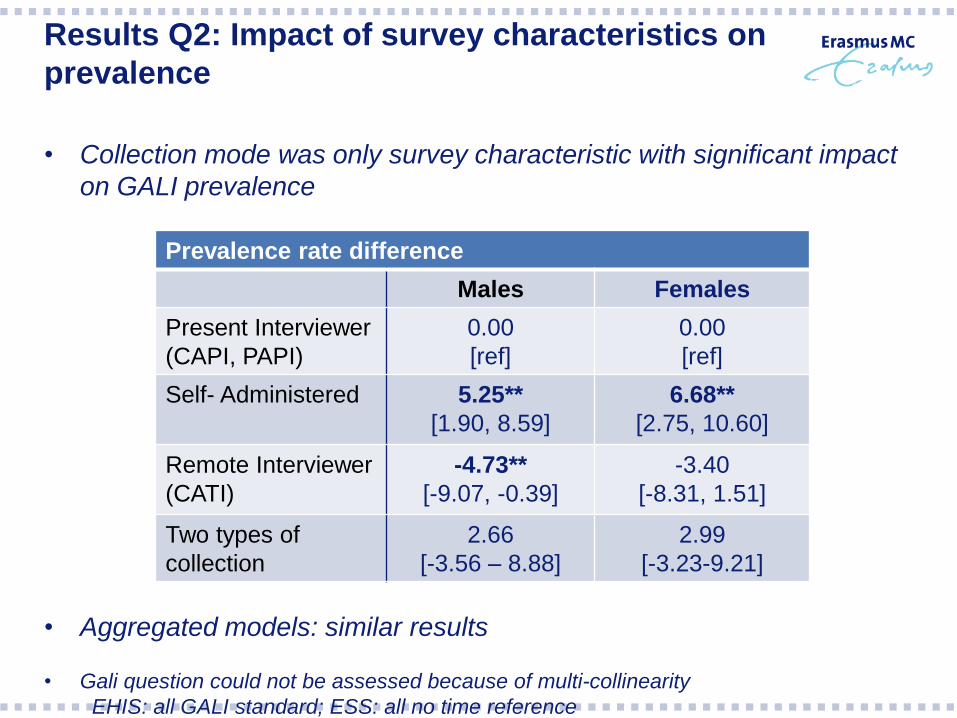
Results Q2: Impact of survey characteristics on
prevalence
• Collection mode was only survey characteristic with significant impact
on GALI prevalence
• Aggregated models: similar results
• Gali question could not be assessed because of multi-collinearity
EHIS: all GALI standard; ESS: all no time reference
Prevalence rate difference
Males Females
Present Interviewer
(CAPI, PAPI)
0.00
[ref]
0.00
[ref]
Self- Administered 5.25**
[1.90, 8.59]
6.68**
[2.75, 10.60]
Remote Interviewer
(CATI)
-4.73**
[-9.07, -0.39]
-3.40
[-8.31, 1.51]
Two types of
collection
2.66
[-3.56 – 8.88]
2.99
[-3.23-9.21]
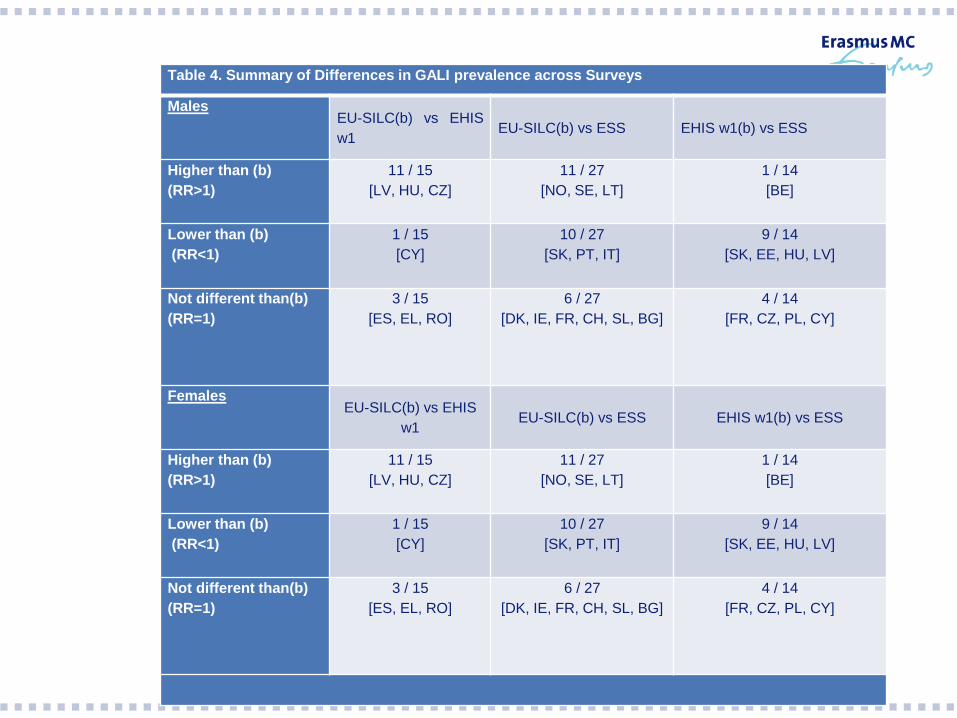
Table 4. Summary of Differences in GALI prevalence across Surveys
MalesEU-SILC(b) vs EHIS
w1EU-SILC(b) vs ESS EHIS w1(b) vs ESS
Higher than (b)
(RR>1)
11 / 15
[LV, HU, CZ]
11 / 27
[NO, SE, LT]
1 / 14
[BE]
Lower than (b)
(RR<1)
1 / 15
[CY]
10 / 27
[SK, PT, IT]
9 / 14
[SK, EE, HU, LV]
Not different than(b)
(RR=1)
3 / 15
[ES, EL, RO]
6 / 27
[DK, IE, FR, CH, SL, BG]
4 / 14
[FR, CZ, PL, CY]
FemalesEU-SILC(b) vs EHIS
w1EU-SILC(b) vs ESS EHIS w1(b) vs ESS
Higher than (b)
(RR>1)
11 / 15
[LV, HU, CZ]
11 / 27
[NO, SE, LT]
1 / 14
[BE]
Lower than (b)
(RR<1)
1 / 15
[CY]
10 / 27
[SK, PT, IT]
9 / 14
[SK, EE, HU, LV]
Not different than(b)
(RR=1)
3 / 15
[ES, EL, RO]
6 / 27
[DK, IE, FR, CH, SL, BG]
4 / 14
[FR, CZ, PL, CY]


![[XLS] · Web viewGali Beri Patiar Wali, H.No. 2273-2296, Gali Masjid Khajoor H.No. 2297-2312, Gali Chatti Behar Wali H.No. 2313-2324, Gali Chatti Phool Wali H.No. 2325-2329, Gali](https://static.fdocuments.us/doc/165x107/5af08dc47f8b9abc788d56fe/xls-viewgali-beri-patiar-wali-hno-2273-2296-gali-masjid-khajoor-hno-2297-2312.jpg)