GAFISA ANNOUNCES 2Q18 RESULTS -...
20
1 FOR IMMEDIATE RELEASE - São Paulo, August 9, 2018 – Gafisa S.A. (B3: GFSA3; NYSE: GFA), one of Brazil’s leading homebuilders, today reported its financial results for the second quarter ended June 30, 2018. GAFISA ANNOUNCES 2Q18 RESULTS The second quarter of 2018 reaffirmed Gafisa’s positive financial and operational progress, further reinforcing our view that we reached a pivotal inflection point over the course of previous quarters. We launched three successful projects in the quarter, two of them in the city of São Paulo/SP and one in the metropolitan region of Greater São Paulo. These projects’ PSV totaled R$400 million with an SoS of 52.5%. This result is a reflexion of the Management’s commitment to efficiently execute its launches, the effect of which can be clearly seen in recent results. The sales performance of these launched projects, coupled with inventory sales, positively impacted gross sales in the quarter, which totaled R$405.8 million, up 38.3% and 68.5% versus 1Q18 and 2Q17, respectively. Cancellations totaled R$59.9 million in 2Q18, a sharp drop of 47.3% year-over-year and 3.8% less quarter-over-quarter, marking a new low for cancellations, as reiterated by Management. The sales mix and the positive trend in cancellations resulted in net presales of R$345.9 million, an increase of 46.7% and 172.1% versus 1Q18 and 2Q17, respectively. In 1H18, net presales totaled R$581.7 million, 137.9% higher than in 1H17. The efficiency of digital tools to leverage our sales channels with our clients was also a highlight: in 1H18, nearly 30% of total sales derived from these online tools. Regarding financial performance, net revenue grew in all bases of comparison, driven by higher inventory sales and the Upside Pinheiros project (launched in 1Q18) contributing R$68 million to revenues. Project sales with better margins bolstered adjusted gross profit in the first half of 2018, a four-fold increase against the same period last year. As a result, adjusted gross margin reached 31.7% in 1H18, confirming the impact of higher revenue recognition share from more recent projects, the effect of which we had already indicated. The successful launch of new projects can be seen in the Backlog Results (REF), which reached a balance of R$262.8 million in 1H18, or a 63% increase against the same period last year. This performance resulted in gross margin of 37.5%, signaling a favorable outlook for revenue and margin over upcoming quarters, especially due to a higher share of revenue recognition from more recent projects in future results. General and administrative expenses totaled R$39.5 million in 1H18, 16.1% lower than in 1H17. This downward trend affirms the Company’s ongoing diligence in finding opportunities to maximize the efficiency of its processes. Conference Call August 10, 2018 ► 9:30 a.m. Brasília time In Portuguese +55 (11) 3127-4971 / 3728-5971 (Brazil) Code: Gafisa ► 8:30 a.m. US EST In Engligh (simultaneous translation from Portuguese) +1 516 300-1066 (USA) Code: Gafisa Webcast: www.gafisa.com.br/ri Replay: +55 (11) 3127-4999 Portuguese: 77636574 English: 76119260 Shares GFSA3 – B3 (formerly BM&FBovespa) GFA – NYSE Total outstanding shares: 44,757,914 ¹ Average Daily Traded Volume (2Q18): R$14.2 million ¹including 932,776 treasury shares
-
Upload
truongtuyen -
Category
Documents
-
view
214 -
download
0
Transcript of GAFISA ANNOUNCES 2Q18 RESULTS -...
1
FOR IMMEDIATE RELEASE - São Paulo, August 9, 2018 – Gafisa S.A. (B3: GFSA3; NYSE: GFA), one of Brazil’s leading homebuilders, today reported its financial results for the second quarter ended June 30, 2018.
GAFISA ANNOUNCES
2Q18 RESULTS
The second quarter of 2018 reaffirmed Gafisa’s positive financial and operational progress, further reinforcing our view that we reached a pivotal inflection point over the course of previous quarters.
We launched three successful projects in the quarter, two of them in the city of São Paulo/SP and one in the metropolitan region of Greater São Paulo. These projects’ PSV totaled R$400 million with an SoS of 52.5%. This result is a reflexion of the Management’s commitment to efficiently execute its launches, the effect of which can be clearly seen in recent results. The sales performance of these launched projects, coupled with inventory sales, positively impacted gross sales in the quarter, which totaled R$405.8 million, up 38.3% and 68.5% versus 1Q18 and 2Q17, respectively.
Cancellations totaled R$59.9 million in 2Q18, a sharp drop of 47.3% year-over-year and 3.8% less quarter-over-quarter, marking a new low for cancellations, as reiterated by Management.
The sales mix and the positive trend in cancellations resulted in net presales of R$345.9 million, an increase of 46.7% and 172.1% versus 1Q18 and 2Q17, respectively. In 1H18, net presales totaled R$581.7 million, 137.9% higher than in 1H17. The efficiency of digital tools to leverage our sales channels with our clients was also a highlight: in 1H18, nearly 30% of total sales derived from these online tools.
Regarding financial performance, net revenue grew in all bases of comparison, driven by higher inventory sales and the Upside Pinheiros project (launched in 1Q18) contributing R$68 million to revenues. Project sales with better margins bolstered adjusted gross profit in the first half of 2018, a four-fold increase against the same period last year. As a result, adjusted gross margin reached 31.7% in 1H18, confirming the impact of higher revenue recognition share from more recent projects, the effect of which we had already indicated.
The successful launch of new projects can be seen in the Backlog Results (REF), which reached a balance of R$262.8 million in 1H18, or a 63% increase against the same period last year. This performance resulted in gross margin of 37.5%, signaling a favorable outlook for revenue and margin over upcoming quarters, especially due to a higher share of revenue recognition from more recent projects in future results.
General and administrative expenses totaled R$39.5 million in 1H18, 16.1% lower than in 1H17. This downward trend affirms the Company’s ongoing diligence in finding opportunities to maximize the efficiency of its processes.
Conference Call
August 10, 2018
► 9:30 a.m. Brasília time
In Portuguese
+55 (11) 3127-4971 / 3728-5971 (Brazil)
Code: Gafisa
► 8:30 a.m. US EST
In Engligh
(simultaneous translation from Portuguese)
+1 516 300-1066 (USA)
Code: Gafisa
Webcast: www.gafisa.com.br/ri
Replay:
+55 (11) 3127-4999
Portuguese: 77636574
English: 76119260
Shares
GFSA3 – B3 (formerly BM&FBovespa) GFA – NYSE Total outstanding shares: 44,757,914¹ Average Daily Traded Volume (2Q18): R$14.2 million ¹including 932,776 treasury shares
2
In 2Q18, selling expenses were 15.8% and 32.7% higher than in 1Q18 and 2Q17, respectively, due to a set of initiatives necessary to ensure good launches in the period. It is worth mentioning that these increases came in lower than the rate of higher gross sales in the period.
The gradual recovery of Gafisa’s financial performance is also signaled by its adjusted EBITDA, which reached R$29.2 million in 2Q18, sustaining the upward trend seen in the first quarter of 2018, boosted by revenue recognition of projects with higher margins.
The improved cash position positively impacted 1H18’s net financial result of negative R$39.0 million, a reduction of 37.0% against the same period last year, also driven by lower indebtedness. 1H18 net financial loss totaled a negative R$85.3 million, a 62.8% evolution vs. 1H17.
Another highlight in 1H18 was the reduction of Gafisa’s net debt. In 1H18, net debt reached R$751.9 million, 32.4% lower than the R$1.1 billion recorded in 1H17. Therefore, the Company’s leverage, measured by net debt to shareholders' equity ratio, was 82.8% in the period, a sharp drop compared to the 126.1% recorded at the end of 2017, mainly due to capital increase and renegotiations in 1Q18, which both reduced debt and increased cash position in the period.
Finally, deliveries in the quarter positively impacted cash generation in the quarter, which totaled R$26.7 million. Cash generation was negative R$45.2 million in 1H18, reflecting the negative cash generation of the previous quarter.
Thus, the good launch performances, inventory deliveries with better margins, ongoing pursuit of increased operational and administrative efficiency and new levels in the areas of cancellations and net debt indicate that this positive trend should continue. Despite economic and political uncertainties that still impact our business environment and the country as a whole, we remain focused on sustaining our current trend of improved results over upcoming periods.
Sandro Gamba CEO
3
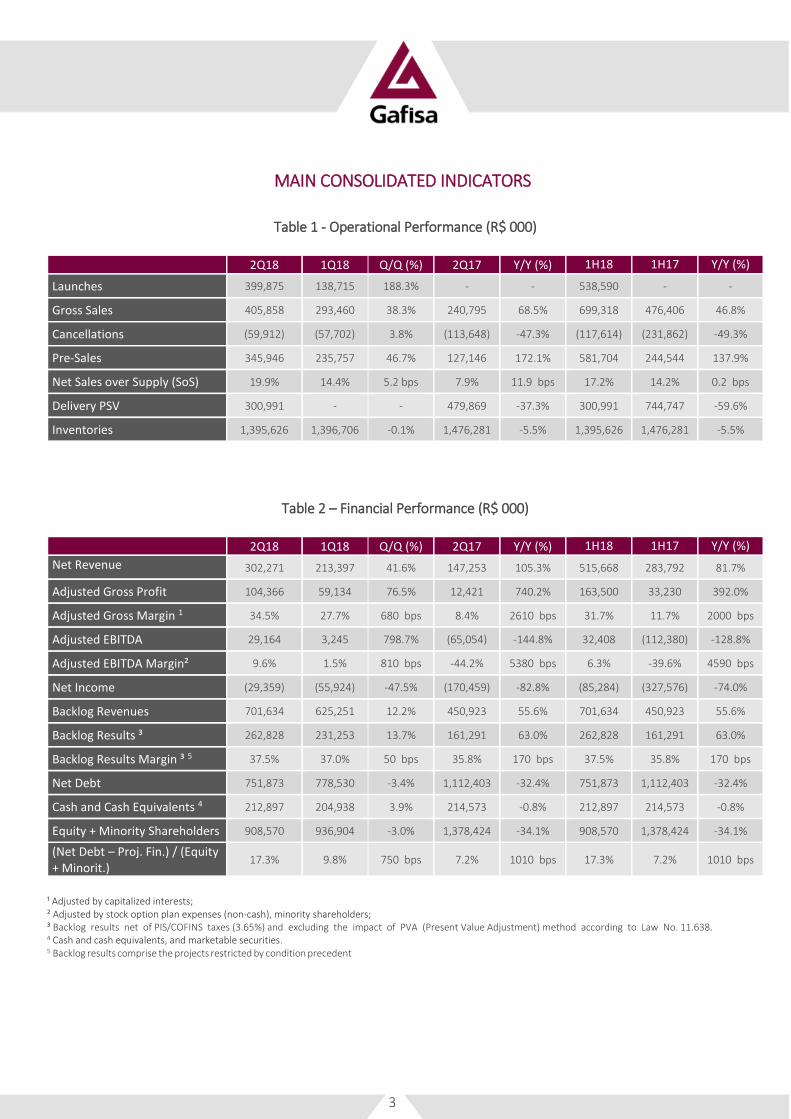
MAIN CONSOLIDATED INDICATORS
Table 1 - Operational Performance (R$ 000)
Table 2 – Financial Performance (R$ 000)
¹ Adjusted by capitalized interests; ² Adjusted by stock option plan expenses (non-cash), minority shareholders; ³ Backlog results net of PIS/COFINS taxes (3.65%) and excluding the impact of PVA (Present Value Adjustment) method according to Law No. 11.638. 4 Cash and cash equivalents, and marketable securities. 5 Backlog results comprise the projects restricted by condition precedent
2Q18 1Q18 Q/Q (%) 2Q17 Y/Y (%) 1H18 1H17 Y/Y (%)
Launches 399,875 138,715 188.3% - - 538,590 - -
Gross Sales 405,858 293,460 38.3% 240,795 68.5% 699,318 476,406 46.8%
Cancellations (59,912) (57,702) 3.8% (113,648) -47.3% (117,614) (231,862) -49.3%
Pre-Sales 345,946 235,757 46.7% 127,146 172.1% 581,704 244,544 137.9%
Net Sales over Supply (SoS) 19.9% 14.4% 5.2 bps 7.9% 11.9 bps 17.2% 14.2% 0.2 bps
Delivery PSV 300,991 - - 479,869 -37.3% 300,991 744,747 -59.6%
Inventories 1,395,626 1,396,706 -0.1% 1,476,281 -5.5% 1,395,626 1,476,281 -5.5%
2Q18 1Q18 Q/Q (%) 2Q17 Y/Y (%) 1H18 1H17 Y/Y (%)
Net Revenue 302,271 213,397 41.6% 147,253 105.3% 515,668 283,792 81.7%
Adjusted Gross Profit 104,366 59,134 76.5% 12,421 740.2% 163,500 33,230 392.0%
Adjusted Gross Margin 1 34.5% 27.7% 680 bps 8.4% 2610 bps 31.7% 11.7% 2000 bps
Adjusted EBITDA 29,164 3,245 798.7% (65,054) -144.8% 32,408 (112,380) -128.8%
Adjusted EBITDA Margin² 9.6% 1.5% 810 bps -44.2% 5380 bps 6.3% -39.6% 4590 bps
Net Income (29,359) (55,924) -47.5% (170,459) -82.8% (85,284) (327,576) -74.0%
Backlog Revenues 701,634 625,251 12.2% 450,923 55.6% 701,634 450,923 55.6%
Backlog Results ³ 262,828 231,253 13.7% 161,291 63.0% 262,828 161,291 63.0%
Backlog Results Margin ³ 5 37.5% 37.0% 50 bps 35.8% 170 bps 37.5% 35.8% 170 bps
Net Debt 751,873 778,530 -3.4% 1,112,403 -32.4% 751,873 1,112,403 -32.4%
Cash and Cash Equivalents 4 212,897 204,938 3.9% 214,573 -0.8% 212,897 214,573 -0.8%
Equity + Minority Shareholders 908,570 936,904 -3.0% 1,378,424 -34.1% 908,570 1,378,424 -34.1%
(Net Debt – Proj. Fin.) / (Equity + Minorit.)
17.3% 9.8% 750 bps 7.2% 1010 bps 17.3% 7.2% 1010 bps
4
OPERATIONAL RESULTS
Table 3 - Operational Performance (R$ 000)
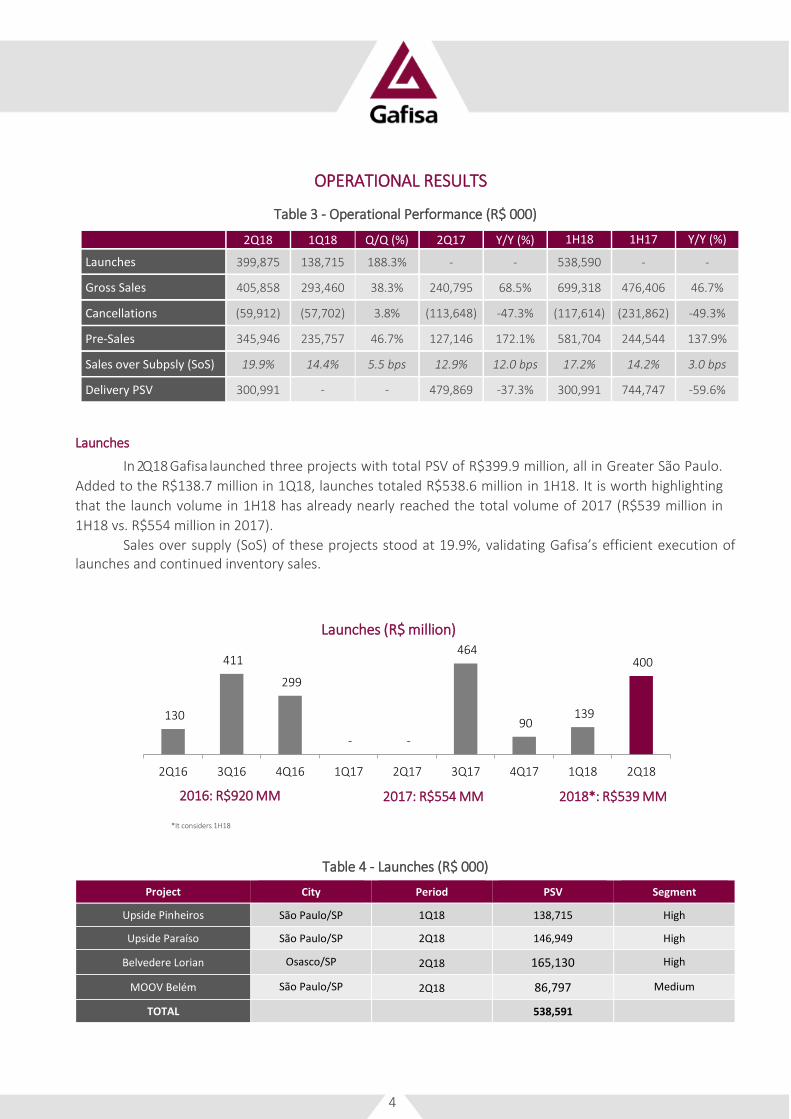
Launches
In 2Q18 Gafisa launched three projects with total PSV of R$399.9 million, all in Greater São Paulo.
Added to the R$138.7 million in 1Q18, launches totaled R$538.6 million in 1H18. It is worth highlighting
that the launch volume in 1H18 has already nearly reached the total volume of 2017 (R$539 million in
1H18 vs. R$554 million in 2017).
Sales over supply (SoS) of these projects stood at 19.9%, validating Gafisa’s efficient execution of launches and continued inventory sales.
*It considers 1H18
Table 4 - Launches (R$ 000)
Project City Period PSV Segment
Upside Pinheiros São Paulo/SP 1Q18 138,715 High
Upside Paraíso São Paulo/SP 2Q18 146,949 High
Belvedere Lorian Osasco/SP 2Q18 165,130 High
MOOV Belém São Paulo/SP 2Q18 86,797 Medium
TOTAL 538,591
2Q18 1Q18 Q/Q (%) 2Q17 Y/Y (%) 1H18 1H17 Y/Y (%)
Launches 399,875 138,715 188.3% - - 538,590 - -
Gross Sales 405,858 293,460 38.3% 240,795 68.5% 699,318 476,406 46.7%
Cancellations (59,912) (57,702) 3.8% (113,648) -47.3% (117,614) (231,862) -49.3%
Pre-Sales 345,946 235,757 46.7% 127,146 172.1% 581,704 244,544 137.9%
Sales over Subpsly (SoS) 19.9% 14.4% 5.5 bps 12.9% 12.0 bps 17.2% 14.2% 3.0 bps
Delivery PSV 300,991 - - 479,869 -37.3% 300,991 744,747 -59.6%
130
411
299
- -
464
90 139
400
2Q16 3Q16 4Q16 1Q17 2Q17 3Q17 4Q17 1Q18 2Q18
Launches (R$ million)
2016: R$920 MM 2017: R$554 MM 2018*: R$539 MM
5
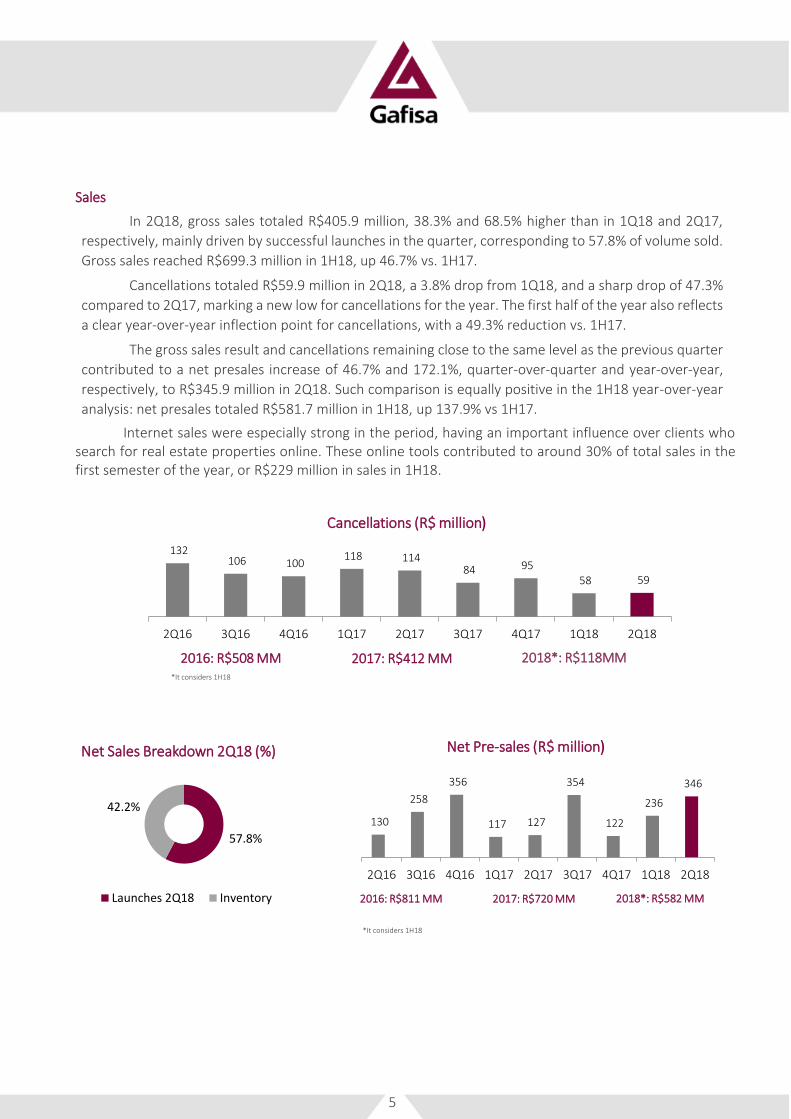
Sales
In 2Q18, gross sales totaled R$405.9 million, 38.3% and 68.5% higher than in 1Q18 and 2Q17,
respectively, mainly driven by successful launches in the quarter, corresponding to 57.8% of volume sold.
Gross sales reached R$699.3 million in 1H18, up 46.7% vs. 1H17.
Cancellations totaled R$59.9 million in 2Q18, a 3.8% drop from 1Q18, and a sharp drop of 47.3%
compared to 2Q17, marking a new low for cancellations for the year. The first half of the year also reflects
a clear year-over-year inflection point for cancellations, with a 49.3% reduction vs. 1H17.
The gross sales result and cancellations remaining close to the same level as the previous quarter
contributed to a net presales increase of 46.7% and 172.1%, quarter-over-quarter and year-over-year,
respectively, to R$345.9 million in 2Q18. Such comparison is equally positive in the 1H18 year-over-year
analysis: net presales totaled R$581.7 million in 1H18, up 137.9% vs 1H17.
Internet sales were especially strong in the period, having an important influence over clients who search for real estate properties online. These online tools contributed to around 30% of total sales in the first semester of the year, or R$229 million in sales in 1H18.
*It considers 1H18
*It considers 1H18
130
258
356
117 127
354
122
236
346
2Q16 3Q16 4Q16 1Q17 2Q17 3Q17 4Q17 1Q18 2Q18
Net Pre-sales (R$ million)
2016: R$811 MM 2017: R$720 MM 2018*: R$582 MM
132 106 100
118 114 84 95
58 59
2Q16 3Q16 4Q16 1Q17 2Q17 3Q17 4Q17 1Q18 2Q18
Cancellations (R$ million)
2016: R$508 MM 2017: R$412 MM 2018*: R$118MM
57.8%
42.2%
Net Sales Breakdown 2Q18 (%)
Launches 2Q18 Inventory

6
Sales Over Supply (SoS)
Positive launch performance boosted quarterly SoS, which increased from 14.4% in 1Q18 to 19.9% in 2Q18. SoS in 1H18 climbed from 37.5% in 1Q18 to 43.1% in 2Q18, atesting the efficiency of Gafisa’s continued and efficient business strategy.
Inventory (Property for Sale)
Inventory at market value reached R$1,395.6 million in 2Q18, in line with the previous quarter. Year-over-year, inventory fell 5.5% as the company focused on sales and reduced the number of launches in the period. The project inventory located outside of strategic markets of R$55.1 million, accounts for 3.9% of the total inventory, of which 59.9% are finished units.
Table 5 – Inventory at Market Value 2Q18 x 1Q18 (R$ 000)
Inventories EoP
1Q18 Launches Cancellations Gross Sales Adjustements¹
Inventories EoP 2Q18
Q/Q(%)
São Paulo 1,105,642 399,875 43,497 (371,940) (28,315) 1,148,760 3.9%
Rio de Janeiro 232,040 - 13,925 (29,646) (24,522) 191,798 -17.3%
Other Markets 59,023 - 2,490 (4,273) (2,173) 55,068 -6.7%
Total 1,396,706 399,875 59,912 (405,858) (55,009) 1,395,626 -0.1%
¹ Adjustments reflect the updates related to the project scope, launch date and pricing update in the period.
Gafisa continues to focus on gradually reducing inventories, seeking to maintain a balance between sales of more recent projects and of finished units. This strategy can be seen when we analyze Gafisa’s inventory turnover for the last 12 months ended in 2Q18, which evidences a reduction in the number of months for theoretical inventory liquidation.
27% 26%32% 35% 37% 38%
32%38%
43%
2Q16 3Q16 4Q16 1Q17 2Q17 3Q17 4Q17 1Q18 2Q18
SoS LTM
6%12%
17%
7% 8%
18%
7%14%
20%
2Q16 3Q16 4Q16 1Q17 2Q17 3Q17 4Q17 1Q18 2Q18
Quarterly SoS
33 3429
23 21 2025
20 16
2Q16 3Q16 4Q16 1Q17 2Q17 3Q17 4Q17 1Q18 2Q18
Inventory Turnover LTM (Months)

7
Table 6 – Inventory at Market Value – Financial Progress – POC - (R$ 000)
Not Iniated Up to 30%
built 30% to 70%
built More than 70%
built Finished
Units Total 2Q18
São Paulo 257,857 92,380 358,172 160,114 280,237 1,148,760
Rio de Janeiro - - - 5,194 186,604 191,798
Other Markets - - 22,094 - 32,974 55,068
Total 257,857 92,380 380,266 165,308 499,815 1,395,626
Delivered Projects and Transfer
In 2Q18, 5 projects were delivered with total PSV of R$301.0 million. On June 30, 2018, Gafisa
managed the construction of 21 projects, all of which are on schedule according to the Company’s business
plan.
Over the past few years, the Company has been taking steps to improve the receivables/transfer
process, aiming to maximize the return rates on capital employed. Currently, the Company’s directive is to
conclude the transfer process of 90% of eligible units within 90 days after the delivery of the project.
Therefore, PSV transferred in 2Q18 jumped 138.2% to R$140.5 million quarter-over-quarter, driven by a higher volume of projects delivered, and was down 41.6% year-over-year, due to the higher volume of deliveries in 2Q17. In 1H18, PSV transferred totaled R$199.5 million, 41.8% lower than in 1H17, also due to a lower volume of deliveries in the period.
Table 7 – Transfer
2Q18 1Q18 Q/Q (%) 2Q17 Y/Y (%) 1H18 1H17 Y/Y (%)
PSV Transferred ¹ 140,505 58,998 138.2% 240,783 -41.6% 199,503 342,527 -41.8%
Deleverd Projects 5 - - 4 25.0% 5 7 -28.6%
Delivery Units 1,025 - - 1,389 -26.2% 1,025 1,999 -48.7%
Deliverd PSV ² 300,991 - - 479,869 -37.3% 300,991 744,927 -59.6%
¹ PSV transfers refers to the potential sales value of the units transferred to financial institutions; ² PSV = Potential sales value of delivered units.
Landbank
The Company’s landbank, with an estimated PSV of R$3.7 billion, represents 32 potential projects/phases or nearly 8,000 units. Approximately 57.3% of land was acquired through swaps. In 2Q18, the Company acquired three new land areas in São Paulo, with potential PSV of R$326.2 million. The acquisition of these land areas was made with a combination of a physical swap of 39% and cash payment.
Table 8 - Landbank (R$ 000)
PSV
(% Gafisa) % Swap Total % Swap Units % Swap Financial
Potencial Units (% Gafisa)
Potencial Units (100%)
São Paulo 2,386,018 52.7% 45.0% 7.7% 5,338 6,004
Rio de Janeiro 1,353,466 63.2% 63.2% 0.0% 1,956 1,956
Total 3,739,484 57.3% 53.1% 4.3% 7,294 7,960
¹ The swap percentage is measured compared to the historical cost of land acquisition. ² Potential units are net of swaps and refer to the Gafisa’s and/or its partners’ participation in the project.
8
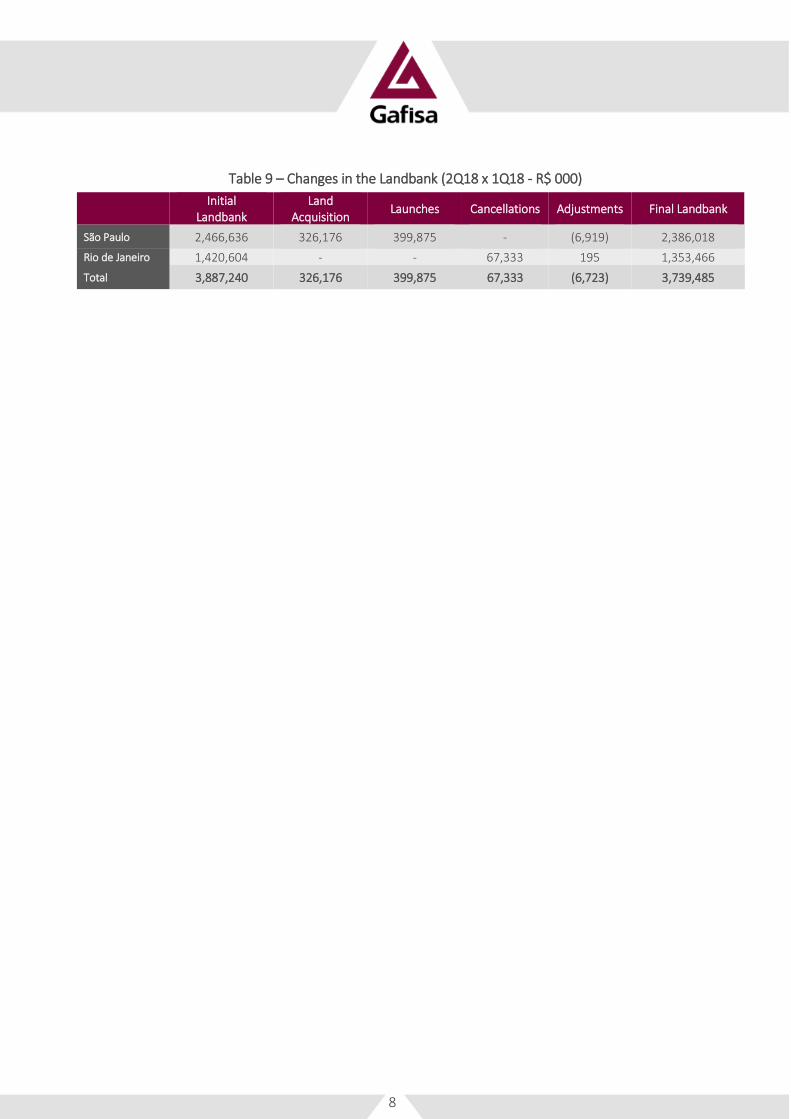
Table 9 – Changes in the Landbank (2Q18 x 1Q18 - R$ 000)
Initial
Landbank Land
Acquisition Launches Cancellations Adjustments Final Landbank
São Paulo 2,466,636 326,176 399,875 - (6,919) 2,386,018
Rio de Janeiro 1,420,604 - - 67,333 195 1,353,466
Total 3,887,240 326,176 399,875 67,333 (6,723) 3,739,485
9
FINANCIAL RESULTS
Revenue
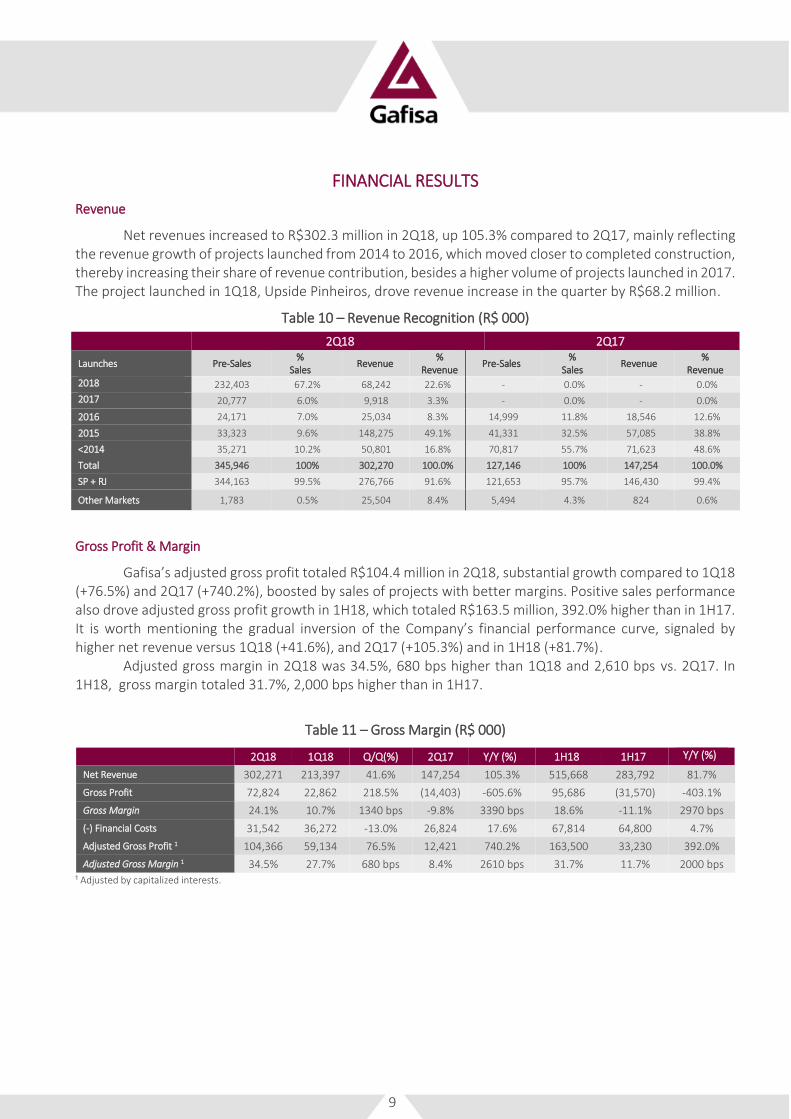
Net revenues increased to R$302.3 million in 2Q18, up 105.3% compared to 2Q17, mainly reflecting the revenue growth of projects launched from 2014 to 2016, which moved closer to completed construction, thereby increasing their share of revenue contribution, besides a higher volume of projects launched in 2017. The project launched in 1Q18, Upside Pinheiros, drove revenue increase in the quarter by R$68.2 million.
Table 10 – Revenue Recognition (R$ 000)
2Q18 2Q17
Launches Pre-Sales % Sales Revenue %
Revenue Pre-Sales % Sales Revenue %
Revenue 2018 232,403 67.2% 68,242 22.6% - 0.0% - 0.0%
2017 20,777 6.0% 9,918 3.3% - 0.0% - 0.0%
2016 24,171 7.0% 25,034 8.3% 14,999 11.8% 18,546 12.6%
2015 33,323 9.6% 148,275 49.1% 41,331 32.5% 57,085 38.8%
<2014 35,271 10.2% 50,801 16.8% 70,817 55.7% 71,623 48.6%
Total 345,946 100% 302,270 100.0% 127,146 100% 147,254 100.0%
SP + RJ 344,163 99.5% 276,766 91.6% 121,653 95.7% 146,430 99.4%
Other Markets 1,783 0.5% 25,504 8.4% 5,494 4.3% 824 0.6%
Gross Profit & Margin
Gafisa’s adjusted gross profit totaled R$104.4 million in 2Q18, substantial growth compared to 1Q18 (+76.5%) and 2Q17 (+740.2%), boosted by sales of projects with better margins. Positive sales performance also drove adjusted gross profit growth in 1H18, which totaled R$163.5 million, 392.0% higher than in 1H17. It is worth mentioning the gradual inversion of the Company’s financial performance curve, signaled by higher net revenue versus 1Q18 (+41.6%), and 2Q17 (+105.3%) and in 1H18 (+81.7%).
Adjusted gross margin in 2Q18 was 34.5%, 680 bps higher than 1Q18 and 2,610 bps vs. 2Q17. In 1H18, gross margin totaled 31.7%, 2,000 bps higher than in 1H17.
Table 11 – Gross Margin (R$ 000)
2Q18 1Q18 Q/Q(%) 2Q17 Y/Y (%) 1H18 1H17 Y/Y (%)
Net Revenue 302,271 213,397 41.6% 147,254 105.3% 515,668 283,792 81.7%
Gross Profit 72,824 22,862 218.5% (14,403) -605.6% 95,686 (31,570) -403.1%
Gross Margin 24.1% 10.7% 1340 bps -9.8% 3390 bps 18.6% -11.1% 2970 bps
(-) Financial Costs 31,542 36,272 -13.0% 26,824 17.6% 67,814 64,800 4.7%
Adjusted Gross Profit 1 104,366 59,134 76.5% 12,421 740.2% 163,500 33,230 392.0%
Adjusted Gross Margin 1 34.5% 27.7% 680 bps 8.4% 2610 bps 31.7% 11.7% 2000 bps
¹ Adjusted by capitalized interests.
10
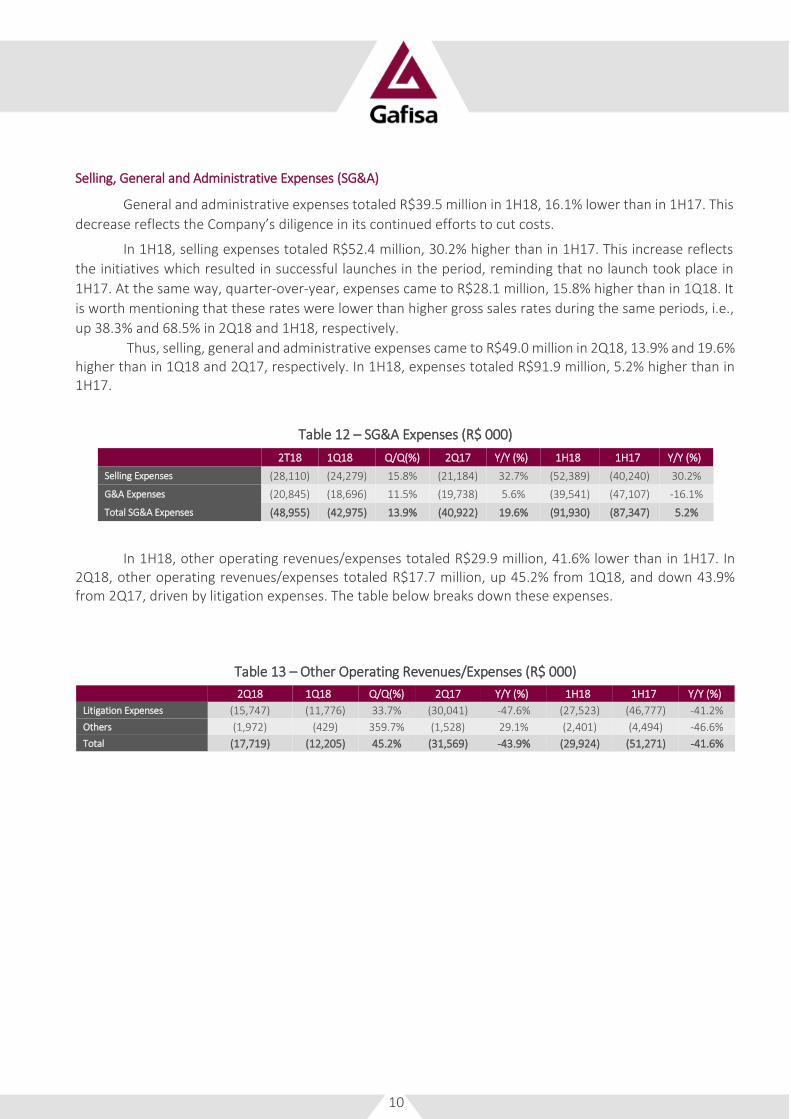
Selling, General and Administrative Expenses (SG&A)
General and administrative expenses totaled R$39.5 million in 1H18, 16.1% lower than in 1H17. This
decrease reflects the Company’s diligence in its continued efforts to cut costs.
In 1H18, selling expenses totaled R$52.4 million, 30.2% higher than in 1H17. This increase reflects
the initiatives which resulted in successful launches in the period, reminding that no launch took place in
1H17. At the same way, quarter-over-year, expenses came to R$28.1 million, 15.8% higher than in 1Q18. It
is worth mentioning that these rates were lower than higher gross sales rates during the same periods, i.e.,
up 38.3% and 68.5% in 2Q18 and 1H18, respectively.
Thus, selling, general and administrative expenses came to R$49.0 million in 2Q18, 13.9% and 19.6% higher than in 1Q18 and 2Q17, respectively. In 1H18, expenses totaled R$91.9 million, 5.2% higher than in 1H17.
Table 12 – SG&A Expenses (R$ 000)
2T18 1Q18 Q/Q(%) 2Q17 Y/Y (%) 1H18 1H17 Y/Y (%)
Selling Expenses (28,110) (24,279) 15.8% (21,184) 32.7% (52,389) (40,240) 30.2%
G&A Expenses (20,845) (18,696) 11.5% (19,738) 5.6% (39,541) (47,107) -16.1%
Total SG&A Expenses (48,955) (42,975) 13.9% (40,922) 19.6% (91,930) (87,347) 5.2%
In 1H18, other operating revenues/expenses totaled R$29.9 million, 41.6% lower than in 1H17. In 2Q18, other operating revenues/expenses totaled R$17.7 million, up 45.2% from 1Q18, and down 43.9% from 2Q17, driven by litigation expenses. The table below breaks down these expenses.
Table 13 – Other Operating Revenues/Expenses (R$ 000)
2Q18 1Q18 Q/Q(%) 2Q17 Y/Y (%) 1H18 1H17 Y/Y (%)
Litigation Expenses (15,747) (11,776) 33.7% (30,041) -47.6% (27,523) (46,777) -41.2%
Others (1,972) (429) 359.7% (1,528) 29.1% (2,401) (4,494) -46.6%
Total (17,719) (12,205) 45.2% (31,569) -43.9% (29,924) (51,271) -41.6%

11
Adjusted EBITDA
Adjusted EBITDA totaled R$29.2 million in 2Q18, in line with the positive trend seen in the first quarter of the year. This result reflects on the improved margins already explained.
Table 14 – Adjusted EBITDA (R$ 000)
2Q18 1Q18 Q/Q(%) 2Q17 Y/Y (%) 1H18 1H17 Y/Y (%)
Net Income (29,359) (55,924) -47.5% (180,004) -83.7% (85,284) (229,401) -62.8% Discontinued Operation Result 1 - - - (9,545) -100.0% - 98,175 -100.0%
Adjusted Net Income1 (29,359) (55,924) -47.5% (170,459) -82.8% (85,284) (327,576) -74.0%
(+) Financial Results 19,082 19,950 -4.4% 33,390 -42.9% 39,032 61,950 -37.0%
(+) Income Taxes 1,432 232 517.2% 949 50.9% 1,664 2,295 -27.5%
(+) Depreciation and Amortization 5,140 3,985 29.0% 8,875 -42.1% 9,125 17,583 -48.1%
(+) Capitalized Interest 31,542 36,272 -13.0% 26,824 17.6% 67,814 64,800 4.7%
(+) Expenses w Stock Option Plan 1,369 (91) -1604.3% (424) -422.9% 1,278 1,703 -25.0%
(+) Minority Shareholders (42) (1,179) -96.4% (100) -58.0% (1,221) (50) 2342.0%
(+) AUSA Income Effect Adjusted - - - 35,891 -100.0% - 66,915 -100.0%
Adjusted EBITDA1 29,164 3,245 798.7% (65,054) -144.8% 32,408 (112,380) -128.8%
¹ Sale of Tenda shares.
Financial Result
In 2Q18, financial result totaled R$3.7 million, 30.1% lower than in 1Q18 and 59.4% lower than in
2Q17. In 1H18, financial results of R$9.1 million came 46.8% lower than the same period last year. These
decreases mainly reflect the interest rate drop incurred on cash and cash equivalents in the period.
Financial expenses totaled R$22.8 million in 2Q18, 9.8% and 46.4% lower than in 1Q18 and 2Q17. In
1H18, financial expenses came to R$48.1 million, down 39.1% from 1H17, mainly due to the capital increase
in 1H18 and debt reduction.
Therefore, net financial result was negative R$39.0 million in 1H18, a reduction of 37.0% versus 1H17, an effect of the higher cash position.
Net Income
In 2Q18, the Company posted a net loss of R$29.4 million, compared to a net loss of R$55.9 million in 1Q18 and R$170.6 million in 2Q17. In 1H18, net loss totaled R$85.3 million, down 74.0% versus 1H17.
Table 15 – Net Income (R$ 000)
2Q18 1Q18 Q/Q(%) 2Q17 Y/Y (%) 1H18 1H17 Y/Y (%)
Net Revenue 302,271 213,397 41.6% 147,253 105.3% 515,668 283,792 81.7%
Gross Profit 72,824 22,862 218.5% (14,403) -605.6% 95,686 (31,570) -403.1% Gross Margin 24.1% 10.7% 1340 bps -9.8% 3390 bps 18.6% -11.1% 2970 bps
Adjusted Gross Profit ¹ 104,366 59,134 76.5% 12,421 740.2% 163,500 33,230 392.0% Adjusted Gross Margin 34.5% 27.7% 680 bps 8.4% 2610 bps 31.7% 11.7% 2000 bps
Adjusted EBITDA ² 29,164 3,245 798.7% (65,054) -144.8% 32,408 (112,380) -128.8% Adjusted EBITDA Margin 9.6% 1.5% 810 bps -44.2% 5380 bps 6.3% -39.6% 4590 bps
Income from Discontinued Operations ³ - - - (9,545) -100.0% - 98,175 -100.0%
Adjusted Net Income 4 (29,359) (55,924) -47.5% (170,459) -82.8% (85,284) (327,576) -74.0%
( - ) Equity income from Alphaville - - - (35,891) -100.0% - (66,915) -100.0% Adjusted Net Income (ex-AUSA) (29,359) (55,924) -47.5% (134,568) -78.2% (85,284) (260,661) -67.3%
¹ Adjusted by capitalized interests;
² Adjusted by note 1, by expense with stock option plan (non-cash) and minority shareholders. EBITDA does not consider Alphaville's equity income;
³ Sale of Tenda shares;
4 Adjusted by item 3.

12
Backlog of Revenues and Results
The backlog of results to be recognized under the PoC method totaled R$262.8 million in 2Q18, with margin to be recognized of 37.5%, up 50 bps from 1Q18 and 170 bps higher than in 2Q17. The backlog performance is a reflexion of the effective execution of launches in the period, signaling a positive outlook for revenue volume and backlog results over coming quarters.
Table 16 – Backlog Results (REF) (R$ 000)
2Q18 1Q18 Q/Q(%) 2Q17 Y/Y(%)
Backlog Revenues 701,634 625,251 12.2% 450,923 55.6%
Backlog Costs (units sold) (438,806) (393,999) 11.4% (289,632) 51.5%
Backlog Results 262,828 231,253 13.7% 161,291 63.0%
Backlog Margin 37.5% 37.0% 50 bps 35.8% 170 bps
Note: Backlog results net of PIS/COFINS taxes (3.65%) and excluding the impact of PVA (Present Value Adjustment) method according to Law No. 11.638. Backlog results comprise the projects restricted by condition precedent.

13
BALANCE SHEET
Cash and Cash equivalents and Marketable Securities
On June 30, 2018, cash and cash equivalents and marketable securities totaled R$212.9 million, 3.9% higher than on March 31, 2018.
Receivables
At the end of 2Q18, total accounts receivables totaled R$1.5 billion, a 10.5% increase
compared to 1Q18. It is worth mentioning that out of this total, R$367.3 million or 49% are expected
to be received this year.
Table 17 – Total Receivables (R$ 000)
2Q18 1Q18 Q/Q (%) 2Q17 Y/Y (%) Receivables from developments (off balance sheet) 728,214 648,938 12.2% 468,005 55.6% Receivables from PoC- ST (on balance sheet) 562,072 508,421 10.6% 602,295 -6.7% Receivables from PoC- LT (on balance sheet) 195,199 186,897 4.4% 208,230 -6.3% Total 1,485,485 1,344,256 10.5% 1,278,530 16.2%
Notes: ST – Short term | LT- Long term | PoC – Percentage of Completion Method.
Receivables from developments: accounts receivable not yet recognized according to PoC and BRGAAP Receivables from PoC: accounts receivable already recognized according to PoC and BRGAAP.
Table 18 – Receivables Schedule (R$ 000)
Total 2018 2019 2020 2021 2022 – and
after
Receivables from PoC 757,271 367,304 238,097 92,724 54,179 4,967
Cash Generation
Operating cash generation was R$26.7 million in 2Q18, due to the higher volume of projects delivered in the quarter and the positive performance of launches. In 1H18, operating cash generation was negative R$45.2 million, mainly impacted by a negative result in the previous quarter.
Table 19 –Cash Generation (R$ 000)
1Q18 2Q18
Availabilities 1 204,938 212,897
Change in Availabilities (1) 57,476 7,959
Total Debt + Investor Obligations 983,468 964,770
Change in Total Debt + Investor Obligations (2) -121,430 -18,698
Capital Increase (3) 250,766 -
Cash Generation in the period (1) - (2) - (3) -71,860 26,657
Final Accumulated Cash Generation -71,860 -45,203
¹ Cash and cash equivalents. and marketable securities.

14
Liquidity
In 2Q18, gross debt reached R$964.8 million, down 1.9% vs. 1Q18 and 27.3% vs 2Q17. Net debt
totaled R$751.9 million, down 3.4% and 32.4% vs. 1Q18 and 2Q17, respectively.
The Company’s Net Debt/Shareholders’ Equity ratio at the end of 2Q18 was 82.8%, compared to 83.1% in 1Q18, and much lower compared to the 126.1% recorded in 2Q17, mainly due to the Company’s capital increase and renegotiations made in 1Q18, which reduced debt and increased the cash position in the period.
Table 20 – Debt and Investor Obligations (R$ 000)
2Q18 1Q18 Q/Q (%) 2Q17 Y/Y (%)
Debentures - FGTS (A) - - 0.0% 150,890 -100.0%
Debentures – Working Capital (B) 223,663 168,041 33.1% 130,817 71.0% Project Financing SFH – (C) 594,917 686,728 -13.4% 861,930 -31.0% Working Capital (D) 146,190 128,699 13.6% 183,339 -20.3% Total (A)+(B)+(C)+(D) = (E) 964,770 983,468 -1.9% 1,326,976 -27.3% Total Debt (G) 964,770 983,468 -1.9% 1,326,976 -27.3% Cash and Availabilities¹ (H) 212,897 204,938 3.9% 214,573 -0.8% Net Debt (G)-(H) = (I) 751,873 778,530 -3.4% 1,112,403 -32.4% Equity + Minority Shareholders (J) 908,570 936,904 -3.0% 1,378,424 -34.1% (Net Debt) / (PL) (I)/(J) = (K) 82.8% 83.1% -30 bps 80.7% 210 bps (Net Debt – Proj, Fin,) / Equity (I)- ((A)+(C))/(J) = (L)
17.3% 9.8% 750 bps 7.2% 1010 bps
¹ Cash and cash equivalents and marketable securities.
Out of total debt, 28.7%, or R$277.0 million, referred to total debt maturing in the short term,
compared to 34.1% at the end of 1Q18. On June 30, 2018, the consolidated debt average cost stood at 11.55% p.a. The debt renegotiation and the capital increase allowed the Company to restructure its debt profile, resulting in gradual deleverage and a lower average rate, the benefits of which should be seen over the coming quarters.
Table 21 – Debt Maturity
(R$ mil) Custo médio (a.a.) Total Até Jun/19 Até Jun/20 Até Jun/21 Até Jun/22
Debentures – Working Capital (A) CDI + 3% / IPCA + 8.37% / CDI + 5.25% / CDI + 3.75%
223,663 21,875 156,852 44,936
Project Financing SFH (B) TR + 8.30% to 14.20% / 12.87% / 143% CDI
594,917 185,286 253,631 147,301 8,699
Working Capital (C) 135% CDI / CDI + 2.5% / CDI + 3% / CDI + 4.25%
146,190 69,858 21,215 55,174 (57)
Total Debt (A)+(B)+(C) = (D) 964,770 277,019 431,698 247,411 8,642
% of Total Maturity per period 28.7% 44.7% 25,6% 0.9%
Project debt maturing as % of total debt (B)/ (D) 66.9% 58.8% 59,5% 100.7%
Corporate debt maturing as % of total debt ((A)+(C))/ (D) 33.1% 41.2% 40,5% -0.7%
Ratio Corporate Debt / Mortgage 38.3% / 61.7%
The Company is committed to deleveraging, which can be seen in the gradual reduction of net debt.

15
SUBSEQUENT EVENTS
Extraordinary Shareholders’ Meeting Call Notice
On July 31st, 2018, Gafisa received a correspondence from shareholder GWI Asset Management S.A. (GWI) requesting a call notice for an Extraordinary Shareholders’ Meeting (ESM) within eight days from that date to resolve on the removal of all members of the Board of Directors and the election of new members.
On August 2nd, the Company informed GWI that said Call Notice Request should be supplemented by additional material required by applicable law, including the names of candidates appointed or supported by GWI, so as to include them in the mandatory remote voting list. This information shall be released to the market until the date of publication of the first announcement of ESM call notice.
Both correspondences were filed at the Brazilian Securities and Exchange Commission (CVM) and released to the market on August 2nd by means of a Material Fact, and on August 7th, GWI replied to the Company.
The Board of Directors’ Meeting was called to be held on August 14th,2018, the agenda will be the call notice of Extraordinary General Meeting. Gafisa will keep the market informed on the development of this matter.
Rule Changes for Housing Loans
The Brazilian National Monetary Council (CMN) approved several changes in housing loan rules, including, but not limiting, the increase of value of properties which can be acquired by means of the Housing Financial System (SFH) and the Government Severance Indemnity Fund for Employees (FGTS) to R$1.5 million. These changes will take effect in January 2019 for a six-year duration.
The implementation of all these rules that unlock the business environment may benefit the real estate sector and contribute to a turnover effect on the market. However, it is worth mentioning that these rules will be gradually implemented and their effect will not be seen immediately. Despite the implementation schedule of these measures adopted by CMN, the ceiling increase, which will take place on the beginning of next year, may increase the liquidity of projects at this price level, as consumers will have access to additional housing financing instruments.

16
São Paulo, August 9, 2018.
Alphaville Urbanismo SA releases its results for the second quarter of 2018.
Financial Results
In 2Q18, net revenues were R$20 million and net loss was R$-198 million.
2Q18 1H18 2Q17 1H17 2Q18 vs. 2Q17 1H18 vs. 1H17
Net revenues 20 106 50 112 -60% -5%
Net income -198 -290 -120 -223 n.a n.a
For further information, please contact our Investor Relations team at [email protected] or +55 11 3038-7131.
17
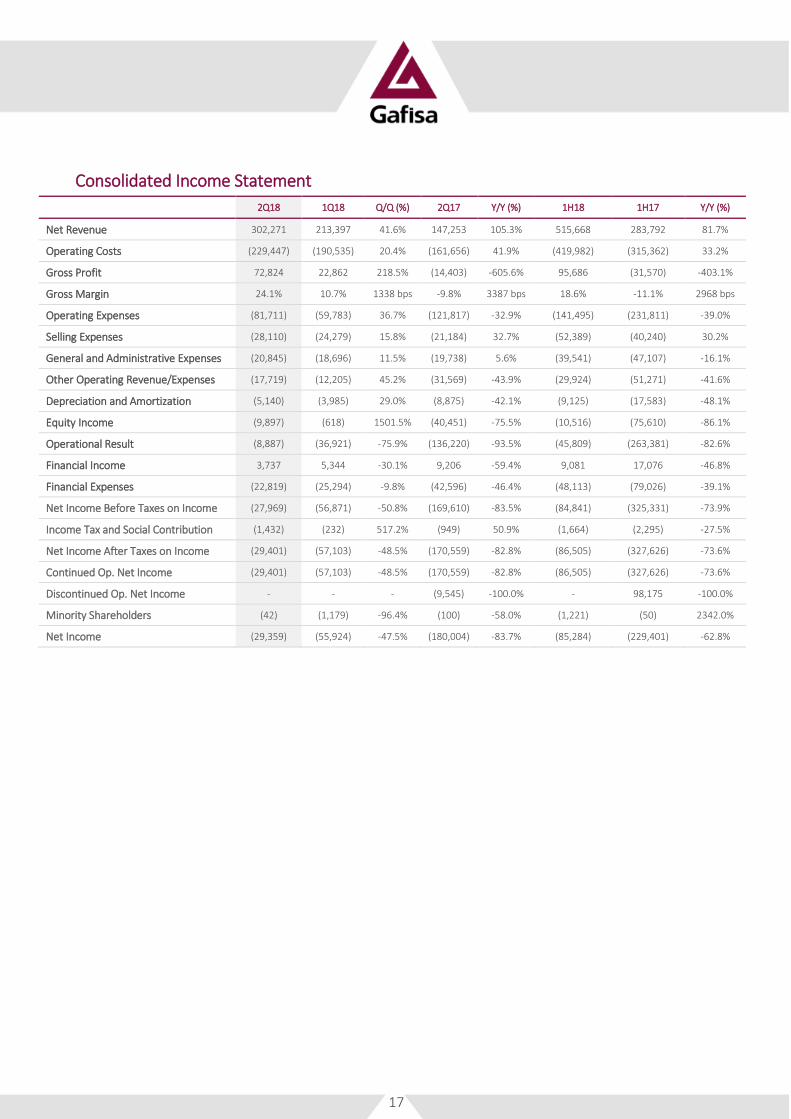
Consolidated Income Statement
2Q18 1Q18 Q/Q (%) 2Q17 Y/Y (%) 1H18 1H17 Y/Y (%)
Net Revenue 302,271 213,397 41.6% 147,253 105.3% 515,668 283,792 81.7%
Operating Costs (229,447) (190,535) 20.4% (161,656) 41.9% (419,982) (315,362) 33.2%
Gross Profit 72,824 22,862 218.5% (14,403) -605.6% 95,686 (31,570) -403.1%
Gross Margin 24.1% 10.7% 1338 bps -9.8% 3387 bps 18.6% -11.1% 2968 bps
Operating Expenses (81,711) (59,783) 36.7% (121,817) -32.9% (141,495) (231,811) -39.0%
Selling Expenses (28,110) (24,279) 15.8% (21,184) 32.7% (52,389) (40,240) 30.2%
General and Administrative Expenses (20,845) (18,696) 11.5% (19,738) 5.6% (39,541) (47,107) -16.1%
Other Operating Revenue/Expenses (17,719) (12,205) 45.2% (31,569) -43.9% (29,924) (51,271) -41.6%
Depreciation and Amortization (5,140) (3,985) 29.0% (8,875) -42.1% (9,125) (17,583) -48.1%
Equity Income (9,897) (618) 1501.5% (40,451) -75.5% (10,516) (75,610) -86.1%
Operational Result (8,887) (36,921) -75.9% (136,220) -93.5% (45,809) (263,381) -82.6%
Financial Income 3,737 5,344 -30.1% 9,206 -59.4% 9,081 17,076 -46.8%
Financial Expenses (22,819) (25,294) -9.8% (42,596) -46.4% (48,113) (79,026) -39.1%
Net Income Before Taxes on Income (27,969) (56,871) -50.8% (169,610) -83.5% (84,841) (325,331) -73.9%
Income Tax and Social Contribution (1,432) (232) 517.2% (949) 50.9% (1,664) (2,295) -27.5%
Net Income After Taxes on Income (29,401) (57,103) -48.5% (170,559) -82.8% (86,505) (327,626) -73.6%
Continued Op. Net Income (29,401) (57,103) -48.5% (170,559) -82.8% (86,505) (327,626) -73.6%
Discontinued Op. Net Income - - - (9,545) -100.0% - 98,175 -100.0%
Minority Shareholders (42) (1,179) -96.4% (100) -58.0% (1,221) (50) 2342.0%
Net Income (29,359) (55,924) -47.5% (180,004) -83.7% (85,284) (229,401) -62.8%

18
Consolidated Balance Sheet 2Q18 1Q18 Q/Q(%) 2Q17 Y/Y(%)
Current Assets
Cash and Cash equivalents 14,161 23,654 -40.1% 37,979 -62.7%
Securities 198,736 181,284 9.6% 176,594 12.5%
Receivables from clients 562,072 508,421 10.6% 602,295 -6.7%
Properties for sale 777,405 849,737 -8.5% 996,928 -22.0%
Other accounts receivable 104,086 115,928 -10.2% 105,812 -1.6%
Prepaid expenses and other 4,125 5,136 -19.7% 5,903 -30.1%
Land for sale 34,212 65,798 -48.0% 3,270 946.2%
Subtotal 1,694,797 1,749,958 -3.2% 1,928,781 -12.1%
Long-term Assets
Receivables from clients 195,199 186,897 4.4% 208,230 -6.3%
Properties for sale 370,192 336,511 10.0% 582,445 -36.4%
Other 114,656 91,568 25.2% 194,880 -41.2%
Subtotal 680,047 614,976 10.6% 985,555 -31.0%
Intangible. Property and Equipment 41,011 41,005 0.0% 45,318 -9.5%
Investments 466,987 479,445 -2.6% 731,405 -36.2%
Total Assets 2,882,842 2,885,384 -0.1% 3,691,059 -21.9%
Current Liabilities
Loans and financing 255,144 324,376 -21.3% 654,200 -61.0%
Debentures 21,875 11,408 91.8% 174,242 -87.4%
Obligations for purchase of land advances from customers
148,536 142,766 4.0% 194,787 23.7%
Material and service suppliers 94,632 99,165 -4.6% 73,249 29.2%
Taxes and contributions 55,554 52,016 6.8% 46,343 19.9%
Other 298,213 325,760 -8.5% 337,235 -11.6%
Subtotal 873,954 955,491 -9.0% 1,480,056 -46.0%
Long-term liabilities
Loans and financings 485,963 491,051 -1.0% 391,069 24.3%
Debentures 201,788 156,633 28.8% 107,465 87.8%
Obligations for Purchase of Land and advances from customers
182,723 134,924 35.4% 71,149 156.8%
Deferred taxes 74,473 74,473 0.0% 100,405 -25.8%
Provision for Contingencies 90,516 78,293 15.6% 81,515 11.0%
Other 64,855 57,615 12.6% 80,976 -19.9%
Subtotal 1,100,318 992,989 10.8% 832,579 32.2%
Shareholders’ Equity
Shareholders’ Equity 905,948 934,236 -3.0% 1,374,347 -34.1%
Minority Shareholders 2,622 2,668 -1.7% 4,077 -35.7%
Subtotal 908,570 936,904 -3.0% 1,378,424 -34.1%
Total Liabilities and Shareholders’ Equity 2,882,842 2,885,384 -0.1% 3,691,059 -21.9%
19
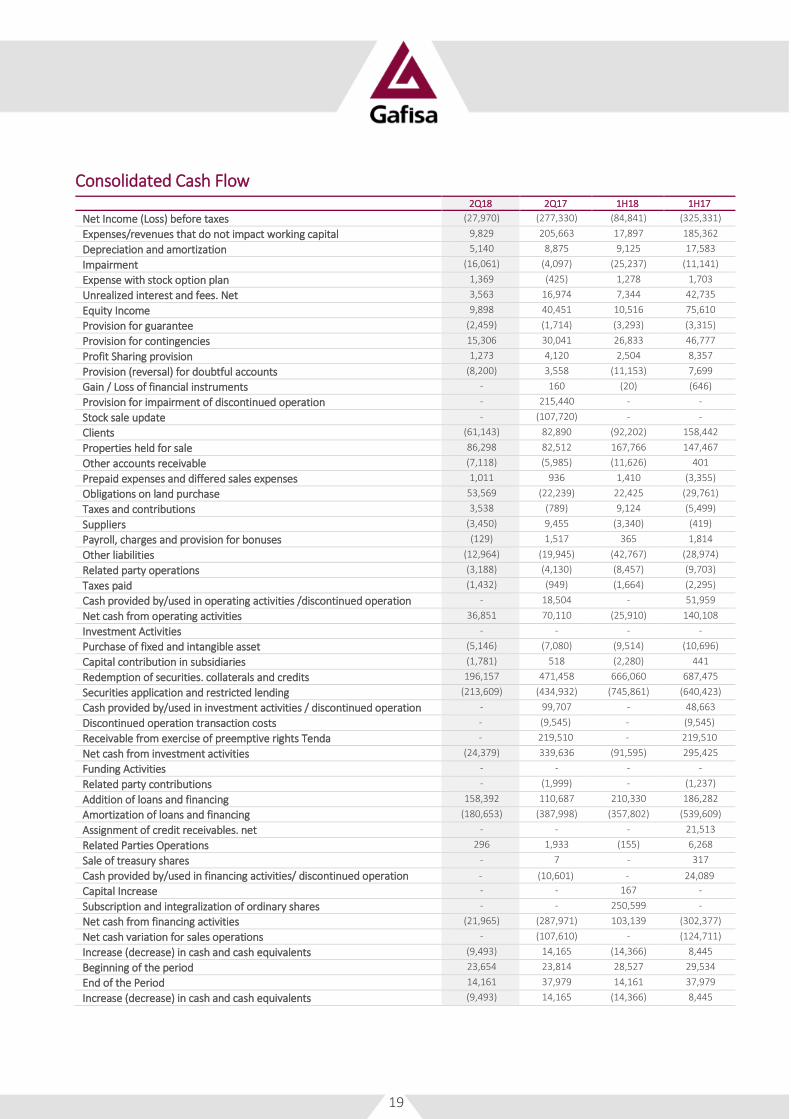
Consolidated Cash Flow 2Q18 2Q17 1H18 1H17
Net Income (Loss) before taxes (27,970) (277,330) (84,841) (325,331)
Expenses/revenues that do not impact working capital 9,829 205,663 17,897 185,362
Depreciation and amortization 5,140 8,875 9,125 17,583
Impairment (16,061) (4,097) (25,237) (11,141)
Expense with stock option plan 1,369 (425) 1,278 1,703
Unrealized interest and fees. Net 3,563 16,974 7,344 42,735
Equity Income 9,898 40,451 10,516 75,610
Provision for guarantee (2,459) (1,714) (3,293) (3,315)
Provision for contingencies 15,306 30,041 26,833 46,777
Profit Sharing provision 1,273 4,120 2,504 8,357
Provision (reversal) for doubtful accounts (8,200) 3,558 (11,153) 7,699
Gain / Loss of financial instruments - 160 (20) (646)
Provision for impairment of discontinued operation - 215,440 - -
Stock sale update - (107,720) - -
Clients (61,143) 82,890 (92,202) 158,442
Properties held for sale 86,298 82,512 167,766 147,467
Other accounts receivable (7,118) (5,985) (11,626) 401
Prepaid expenses and differed sales expenses 1,011 936 1,410 (3,355)
Obligations on land purchase 53,569 (22,239) 22,425 (29,761)
Taxes and contributions 3,538 (789) 9,124 (5,499)
Suppliers (3,450) 9,455 (3,340) (419)
Payroll, charges and provision for bonuses (129) 1,517 365 1,814
Other liabilities (12,964) (19,945) (42,767) (28,974)
Related party operations (3,188) (4,130) (8,457) (9,703)
Taxes paid (1,432) (949) (1,664) (2,295)
Cash provided by/used in operating activities /discontinued operation - 18,504 - 51,959
Net cash from operating activities 36,851 70,110 (25,910) 140,108
Investment Activities - - - -
Purchase of fixed and intangible asset (5,146) (7,080) (9,514) (10,696)
Capital contribution in subsidiaries (1,781) 518 (2,280) 441
Redemption of securities. collaterals and credits 196,157 471,458 666,060 687,475
Securities application and restricted lending (213,609) (434,932) (745,861) (640,423)
Cash provided by/used in investment activities / discontinued operation - 99,707 - 48,663
Discontinued operation transaction costs - (9,545) - (9,545)
Receivable from exercise of preemptive rights Tenda - 219,510 - 219,510
Net cash from investment activities (24,379) 339,636 (91,595) 295,425
Funding Activities - - - -
Related party contributions - (1,999) - (1,237)
Addition of loans and financing 158,392 110,687 210,330 186,282
Amortization of loans and financing (180,653) (387,998) (357,802) (539,609)
Assignment of credit receivables. net - - - 21,513
Related Parties Operations 296 1,933 (155) 6,268
Sale of treasury shares - 7 - 317
Cash provided by/used in financing activities/ discontinued operation - (10,601) - 24,089
Capital Increase - - 167 -
Subscription and integralization of ordinary shares - - 250,599 -
Net cash from financing activities (21,965) (287,971) 103,139 (302,377)
Net cash variation for sales operations - (107,610) - (124,711)
Increase (decrease) in cash and cash equivalents (9,493) 14,165 (14,366) 8,445
Beginning of the period 23,654 23,814 28,527 29,534
End of the Period 14,161 37,979 14,161 37,979
Increase (decrease) in cash and cash equivalents (9,493) 14,165 (14,366) 8,445
20
Gafisa is one Brazil’s leading residential and commercial properties development and construction companies. Founded over 60 years ago. the Company is dedicated to growth and innovation oriented to enhancing the well-being. comfort. and safety of an increasing number of households. More than 15 million square meters have been built. and approximately 1.100 projects delivered under the Gafisa brand - more than any other company in Brazil. Recognized as one of the foremost professionally managed homebuilders. Gafisa’s brand is also one of the most respected. signifying both quality and consistency. In addition to serving the upper-middle and upper class segments through the Gafisa brand. the Company also participates through its 30% interest in Alphaville. a leading urban developer in the national development and sale of residential lots. Gafisa S.A. is a Corporation traded on the Novo Mercado of the B3 – Brasil. Bolsa. Balcão (B3:GFSA3) and is the only Brazilian homebuilder listed on the New York Stock Exchange (NYSE:GFA) with an ADR Level III. which ensures best practices in terms of transparency and corporate governance.
This release contains forward-looking statements about the business prospects. estimates for operating and financial results and Gafisa’s growth prospects. These are merely projections and. as such. are based exclusively on the expectations of management concerning the future of the business and its continued access to capital to fund the Company’s business plan. Such forward- looking statements depend. substantially. on changes in market conditions. government regulations. competitive pressures. the performance of the Brazilian economy and the industry. among other factors; therefore. they are subject to change without prior notice.
IR Contacts
Carlos Calheiros
Danielle Hernandes
Telephone: +55 11 3025-9474
Email: [email protected]
IR Website: www.gafisa.com.br/ri
Media Relations
Máquina Cohn & Wolfe
Marilia Paiotti / Bruno Martins
Telephone: +55 11 3147-7463
Fax: +55 11 3147-7438
E-mail: [email protected]