GABELLI GDV SEMI 6 12 COMM has been the case since this recovery ... After the financial crisis, ......
44
Kevin V. Dreyer Co-Chief Investment Officer BSE, University of Pennsylvania MBA, Columbia Business School To Our Shareholders, For the quarter ended June 30, 2017, the net asset value (“NAV”) total return of The Gabelli Dividend & Income Trust (the “Fund”) was 3.1%, compared with a total return of 3.1% for the Standard & Poor’s (“S&P”) 500 Index. The total return for the Fund’s publicly traded shares was 6.2%. The Fund’s NAV per share was $23.25, while the price of the publicly traded shares closed at $21.82 on the New York Stock Exchange (“NYSE”). The Gabelli Dividend & Income Trust Shareholder Commentary – June 30, 2017 (Y)our Portfolio Management Team Comparative Results Average Annual Returns through June 30, 2017 (a) Since Inception Quarter 1 Year 5 Year 10 Year (11/28/03) ——–— ——— ——— ——–— ———–—— Gabelli Dividend & Income Trust NAV Total Return (b) . . . . . . . . . . . . . . . . . . . . . . . . . 3.13% 14.31% 12.56% 5.83% 8.07% Investment Total Return (c) . . . . . . . . . . . . . . . . . . 6.21 21.67 14.90 7.35 8.09 S&P 500 Index . . . . . . . . . . . . . . . . . . . . . . . . . . . . . . . . . 3.09 17.90 14.63 7.18 8.51 Dow Jones Industrial Average . . . . . . . . . . . . . . . . . . . . . 3.95 22.07 13.39 7.53 8.62 Nasdaq Composite Index . . . . . . . . . . . . . . . . . . . . . . . . . 4.20 28.37 17.45 10.23 9.90 (a) Returns represent past performance and do not guarantee future results. Investment returns and the principal value of an investment will fluctuate. When shares are sold, they may be worth more or less than their original cost. Current performance may be lower or higher than the performance data presented. Visit www.gabelli.com for performance information as of the most recent month end. Performance returns for periods of less than one year are not annualized. Investors should carefully consider the investment objectives, risks, charges, and expenses of the Fund before investing. The Dow Jones Industrial Average is an unmanaged index of 30 large capitalization stocks. The S&P 500 and the Nasdaq Composite Indices are unmanaged indicators of stock market performance. Dividends are considered reinvested except for the Nasdaq Composite Index. You cannot invest directly in an index. (b) Total returns and average annual returns reflect changes in the NAV per share and reinvestment of distributions at NAV on the ex-dividend date and adjustment for the spin-off and are net of expenses. Since inception return is based on an initial NAV of $19.06. (c) Total returns and average annual returns reflect changes in closing market values on the NYSE, reinvestment of distributions and adjustment for the spin-off. Since inception return is based on an initial offering price of $20.00. Robert D. Leininger, CFA Portfolio Manager BA, Amherst College MBA, Wharton School, University of Pennsylvania Mario J. Gabelli, CFA Chief Investment Officer Christopher J. Marangi Co-Chief Investment Officer BA, Williams College MBA, Columbia Business School Barbara G. Marcin, CFA Portfolio Manager BA, University of Virginia MBA, Graduate School of Business, Harvard University Jeffrey J. Jonas, CFA Portfolio Manager BS, Boston College
-
Upload
truonghanh -
Category
Documents
-
view
216 -
download
0
Transcript of GABELLI GDV SEMI 6 12 COMM has been the case since this recovery ... After the financial crisis, ......

Kevin V. DreyerCo-Chief
Investment OfficerBSE, University of
PennsylvaniaMBA, ColumbiaBusiness School
To�Our�Shareholders,
For the quarter ended June 30, 2017, the net asset value (“NAV”) total return of The Gabelli Dividend &
Income Trust (the “Fund”) was 3.1%, compared with a total return of 3.1% for the Standard & Poor’s (“S&P”)
500 Index. The total return for the Fund’s publicly traded shares was 6.2%. The Fund’s NAV per share was
$23.25, while the price of the publicly traded shares closed at $21.82 on the New York Stock Exchange
(“NYSE”).
The�Gabelli�Dividend�&�Income�TrustShareholder Commentary – June 30, 2017
(Y)our�Portfolio Management�Team
Comparative�Results
Average�Annual�Returns�through�June�30,�2017�(a) Since Inception Quarter 1 Year 5 Year 10 Year (11/28/03) ——–— ——— ——— ——–— ———–——Gabelli�Dividend�&�Income�Trust�NAV�Total�Return�(b) . . . . . . . . . . . . . . . . . . . . . . . . . 3.13% 14.31% 12.56% 5.83% 8.07%Investment�Total�Return�(c)� . . . . . . . . . . . . . . . . . . 6.21 21.67 14.90 7.35 8.09
S&P 500 Index . . . . . . . . . . . . . . . . . . . . . . . . . . . . . . . . . 3.09 17.90 14.63 7.18 8.51 Dow Jones Industrial Average . . . . . . . . . . . . . . . . . . . . . 3.95 22.07 13.39 7.53 8.62Nasdaq Composite Index . . . . . . . . . . . . . . . . . . . . . . . . . 4.20 28.37 17.45 10.23 9.90
(a) Returns represent past performance and do not guarantee future results. Investment returns and the principal valueof an investment will fluctuate. When shares are sold, they may be worth more or less than their original cost. Currentperformance may be lower or higher than the performance data presented. Visit www.gabelli.com for performanceinformation as of the most recent month end. Performance returns for periods of less than one year are notannualized. Investors should carefully consider the investment objectives, risks, charges, and expenses of the Fundbefore investing. The Dow Jones Industrial Average is an unmanaged index of 30 large capitalization stocks. TheS&P 500 and the Nasdaq Composite Indices are unmanaged indicators of stock market performance. Dividends areconsidered reinvested except for the Nasdaq Composite Index. You cannot invest directly in an index.
(b) Total returns and average annual returns reflect changes in the NAV per share and reinvestment of distributions atNAV on the ex-dividend date and adjustment for the spin-off and are net of expenses. Since inception return is basedon an initial NAV of $19.06.
(c) Total returns and average annual returns reflect changes in closing market values on the NYSE, reinvestment ofdistributions and adjustment for the spin-off. Since inception return is based on an initial offering price of $20.00.
Robert D. Leininger, CFAPortfolio Manager
BA, Amherst CollegeMBA, Wharton School,
University of Pennsylvania
Mario J. Gabelli, CFAChief Investment
Officer
Christopher J. MarangiCo-Chief
Investment OfficerBA, Williams College
MBA, ColumbiaBusiness School
Barbara G. Marcin, CFAPortfolio Manager
BA, Universityof Virginia
MBA, GraduateSchool of Business,Harvard University
Jeffrey J. Jonas, CFAPortfolio Manager
BS, Boston College
The�Quarter�in�Review
The second quarter of 2017 represented the first full quarter of President Trump’s new administration, and
the stock market continued on its rise to new all-time highs. Ever since the election of President Trump, the
market has been on an upswing, powered by investors hope that there will be more pro-growth policies coming
out of Washington, such as tax reform, less burdensome regulation, and stimulus spending centered around
infrastructure projects.
Unfortunately, these policies have not actually been implemented yet, as the administration has been
having trouble getting new health care legislation through the Congress. Of course, to the extent that investors
do not have to worry about higher taxes and more burdensome regulations, that alone is a plus for most
investors. Although we feel that the administration will have trouble actually passing into legislation much of
what it hopes to propose, we do feel that modest tax reform and increased infrastructure spending will
ultimately transpire in Washington D.C.
As difficult as it is to try to predict the future here in the U.S., it is no easier to foresee Europe’s future.
The process of figuring out how the British will withdraw from the European Union (Brexit) still needs to be
resolved, and various other countries are debating if they, too, want to break away from the EU. The French
recently reaffirmed their desire to stay within the EU, and anti-EU rhetoric seems to be on the wane for now.
The�Economy
The U.S. economy continues to grow at a modest pace. The days of 4% real gross domestic product
(GDP) growth are over, and it has been a long time since we saw a year of 3% growth. Part of the slowdown
in real GDP growth can be attributed to demographics, slower population growth, and an aging workforce. We
seem to be stuck in a yearly real growth range of 1.5% to 2.5%. That has been the case since this recovery
commenced in July of 2009, and nothing in the forecast suggests anything different. Although the Trump
administration would like to get the economy growing at a 3% real rate once again, the odds of that happening
in 2017 are very slim. Growth this year will be about 2.0%, once again. The bad news is this is the slowest
expansion on record. The good news is it is one of the longest. Slow and steady is a recipe for enduring
growth. There are certainly policy prescriptions that could elevate us out of this 2% growth range, some of
which the Trump administration are advancing, but debating the merits of those is beyond the scope of this
commentary (for that you should be glad).
The�Markets�
The Federal Reserve has been on a path of slowly raising short term interest rates up to a more
normalized level. After the financial crisis, the Fed slashed short term interest rates down to near zero, but rates
are now at 1.25%, after three increases over the past three quarters. We expect that gradual increases will
continue, and that, by this time next year, short term rates will be around 2.0%. In addition to gradually raising
2

3
short term interest rates, the Fed will also probably start to unwind its massive $4.5 trillion asset portfolio, which
it built up during the “QE”, or quantitative easing, period. We expect the unwinding will be a very gradual
approach whereby some maturing securities will not be reinvested, and the whole process will go on for many
years.
Investors are facing an acute shortage of good income generating opportunities. While not a realistic
choice for some investors, stocks must play a larger role overall in meeting investors’ income needs. At this
writing, a majority of the stocks in the S&P 500 have dividend yields that are equal to or higher than the ten
year U.S. Treasury yield, which is approximately 2.2%. Stocks offer compelling current income and growth of
income for investors that can tolerate stock market volatility. Stocks also offer the potential for growth in capital
over time. It is hard to imagine growing capital by investing in bonds at historically low interest rates. We are
probably in the final inning of a thirty-five year bull market in bonds.
Dividends
Dividends are an important element in the historical returns of stocks. They provide current income and
a growing income stream over time. During the second quarter of 2017, U.S. companies continued to increase
their dividends. At the end of the quarter, the dividend yield on the S&P 500 was approximately 2%, which was
close to the roughly 2.2% yield on the ten year U.S. Treasury as noted above.
Investment�Scorecard�
During the second quarter of 2017, the S&P 500 Index was up approximately 3% on a total return basis,
and most of the sectors that make up the S&P 500 were also up. In fact, only two S&P 500 sectors fell in the
second quarter; Telecom and Energy, both down just over 6%. Declining oil prices during the quarter weighed
on the energy sector. The best performing sector was Health Care, up about 7%, and Industrials was the
second best performing sector, up almost 5%.
Some of the stocks that helped the Fund’s performance during the second quarter were Whole Foods,
Bank of New York Mellon, and American Express. Whole Foods, a supermarket for natural and organic foods
with more than 450 stores, agreed to be acquired by Amazon in an all-cash transaction. Whole Foods was
actually the best performing stock in the S&P 500 Index in the second quarter. Both Bank of New York Mellon
and American Express are financial companies that we believe will benefit from rising interest rates. In addition,
both companies are large positions in (y)our portfolio, and performed well in the second quarter as short term
interest rates did move up.
Among the worst performing stocks in the Fund during the second quarter were Weatherford
International, Halliburton, and Schlumberger, which were all down more than 10%. These stocks are oil
services companies, which provide services to exploration and energy production companies. These stocks
were pulled down with the overall sector in the second quarter.
Let’s�Talk�Stocks
The following are stock specifics on selected holdings of our Fund. Favorable earnings prospects do not
necessarily translate into higher stock prices, but they do express a positive trend that we believe will develop
over time. Individual securities mentioned are not necessarily representative of the entire portfolio. For the
following holdings, the share prices are listed first in United States dollars (USD) and second in the local
currency, where applicable, and are presented as of June 30, 2017.
Allergan plc (AGN – $243.09 – NASDAQ), headquartered in Dublin, Ireland, is a leading specialty
pharmaceutical company, with key brands in dermatology/aesthetics, including Botox, ophthalmology, central
nervous system diseases, and gastrointestinal disorders. The company recently completed the $2.5 billion
acquisition of Zeltiq and the company’s CoolSculpting technology for fat reduction. Allergan also has a late
stage pipeline of products in development for diseases including macular degeneration, depression, and
nonalcoholic steatohepatitis (NASH).
American International Group Inc. (AIG – $62.52 – NYSE) is a multi-line insurance company offering property
and casualty and life insurance, and serving customers in more than 130 countries and jurisdictions. The
company is well positioned as it has excess capital, sophisticated products, and broad global distribution. In
addition, the company is committed to returning capital to shareholders with dividends and share buybacks.
We believe it can increase these capital returns to shareholders, given greater stability of the business lines.
Bank of New York Mellon Corp. (BK – $51.02 – NYSE) is a global leader in providing financial services to
institutions and individuals. The company operates in more than one hundred markets worldwide and strives
to be the global provider of choice for investment management and investment services. As of March 2017, the
firm had $30.6 trillion in assets under custody and $1.7 trillion in assets under management. Going forward,
we expect BK to benefit from rising global incomes and the cross border movement of financial transactions.
We believe BK is also well positioned to grow earnings in a rising interest rate environment, given its large
customer cash deposits and significant loan book.
Edgewell Personal Care Co. (EPC – $76.02 – NYSE), based in St. Louis, Missouri, is the renamed Energizer
Holdings Inc. following the tax-free spin-off to shareholders of the household products division on July 1, 2015.
Edgewell generates approximately $2.3 billion of revenue through its principal businesses: wet shaving,
including Schick-branded razors and blades, Edge and Skintimate shaving preparation and private label
shaving products; sun care, including the Banana Boat and Hawaiian Tropic brands; feminine care, Playtex and
o.b. tampons and Carefree and Stayfree liners and pads; and infant care, utilizing the Playtex and Diaper Genie
brands. As a pure-play personal care company, Edgewell competes in high margin, attractive categories, with
leading brands. We expect management to focus on improving margins through product mix, restructuring
savings and operating leverage, which should afford it flexibility to reinvest in growth opportunities. The
company has approximately $1.2 billion of net debt providing management with sufficient flexibility to invest in
internal growth, make acquisitions and/or repurchase shares. EPC is a likely acquisition target as a
multinational competitor with an extensive global infrastructure would benefit from scale, international
expansion and cost synergies.
4
General Mills Inc. (GIS – $55.40 – NYSE), based in Minneapolis, Minnesota, is a leading producer of packaged
foods, primarily focused on five global platforms, including ready-to-eat cereal, snacks, yogurt, convenient
meals, and super-premium ice cream, with leading brands such as Cheerios, Yoplait, Nature Valley, Old El
Paso, Progresso and Haagen-Dazs, as well as a wide range of foodservice products. General Mills has
expanded its portfolio and geographic presence through several acquisitions, including the Pillsbury Company
in 2001, a 51% stake in the operating company and 50% stake in the company that owns the Yoplait yogurt
brand in 2011, Brazilian food company Yoki Alimentos SA in 2012, and organic food producer Annie’s, Inc. in
2014, which expanded its presence in the fast growing natural and organic food category. General Mills is
facing challenges as center store growth rates remain lackluster. Accordingly, the company is reinvesting in its
brands to stabilize the top line, while modestly expanding margins and earnings this fiscal year.
Genuine Parts Co. (GPC – $92.76 – NYSE) is an Atlanta, Georgia-based distributor of automotive and
industrial replacement parts, office products, and electrical and electronic components. We expect GPC’s well
known NAPA Auto Parts group to benefit as an aged vehicle population, which includes the highest percentage
of off warranty vehicles in history, helps drive sales of automotive aftermarket products over the next several
years. Additionally, economic indicators remain supportive of the company’s industrial and electrical parts
distribution businesses amid steady economic expansion. Finally, GPC’s management has shown consistent
dedication to shareholder value via share repurchases and dividend increases.
Honeywell International Inc. (HON – $133.29 – NYSE) operates as a diversified technology company with
highly engineered products, including turbine propulsion engines, auxiliary power units, turbochargers, brake
pads, environmental and combustion controls, sensors, security and life safety products, resins and chemicals,
nuclear services, and process technology for the petrochemical and refining industries. One of the key drivers
of HON’s growth is acquisitions that increase the company’s growth profile globally, creating both organic and
inorganic opportunities. The company recently acquired Elster Industries, a leading provider of thermal gas
solutions, smart meters, software and data analytics for the commercial, industrial and residential heating
market. Elster’s gas business offers products in high demand among natural gas customers and brings a
strong, global distribution network and numerous cross-selling opportunities for existing HON technologies to
new customers. Elster’s gas, electric, and water meters are highly valued for their reliability, safety and
accuracy. The company maintains an installed base of more than 200 million meter modules deployed over the
course of the last 10 years that generate significant recurring revenues. We believe acquisitions such as Elster
should drive meaningful and sustained growth for HON spurred by global energy efficiency initiatives and
natural resource management.
Mondele-z International Inc. (MDLZ – $43.19 – NASDAQ), headquartered in Deerfield, Illinois, is the renamed
Kraft Foods Inc. following the tax-free spin-off to shareholders of the North American grocery business on
October 1, 2012. Following the contribution of coffee into a new joint venture, nearly 85% of Mondelēz’s $26
billion of revenue is derived from snacking, including leading brands such as Oreo, LU and Ritz biscuits, Trident
gum, and Cadbury and Milka chocolates. On July 2, 2015, Mondelez combined its coffee business with D.E
5
Master Blenders 1753 to form a new coffee company, Jacobs Douwe Egberts. Subsequently, MDLZ
exchanged part of its stake in this coffee joint venture for 24% ownership in Keurig Green Mountain, which was
acquired by an investor group led by JAB Holding Co. in March 2016. This narrows the company’s product
focus, as only 15% of revenue will be outside snacks — mostly Tang beverages and other products, including
Philadelphia cream cheese, which management may look to divest in the future as it executes on its plan to
accelerate growth and improve margins in the faster growing snack business.
PepsiCo Inc. (PEP – $115.49 – NYSE) was founded in 1965 through the merger of Pepsi-Cola and Frito-Lay.
Today, the company is the second largest food and beverage company in the world, with $62.8 billion in 2016
sales. PepsiCo is a global leader in snacks, with an estimated 40% share of the $120 billion global savory
snacks market, and second only to The Coca-Cola Company in the $750 billion global soft drinks market. PEP
global sales split about 53% and 47% between Snacks and Beverages, respectively. We estimate that about
25% of PEP’s total global sales is derived from carbonated soft drinks (soda), with the Pepsi trademark
accounting for less than half of those sales, or about 12% of total PEP sales. In terms of geography, about
58% of PEP 2016 total sales were derived from the U.S., with Mexico (6%), Russia (4%), Canada (4%), and
the UK (3%) rounding out the company’s top five markets. Over the next few years, PepsiCo’s sales should
benefit from stabilizing beverage trends in the U.S., and continued growth in emerging markets, translating to
operating leverage and earnings growth.
Wells Fargo & Co. (WFC – $55.41 – NYSE) is a diversified financial services company. Headquartered in San
Francisco, California, the firm provides banking, insurance, investments, mortgage, and consumer and
commercial finance through more than 9,000 stores and 12,000 ATMs. Wells Fargo serves one in three
households in America and, as of March 2017, it had $2.0 trillion in customer assets. Longer term, we expect
Wells Fargo to continue to grow market share of domestic deposits due to its strong brand and diversified
product base.
Conclusion
While change is constant, the fundamental underpinnings of common stock value investing remain
unchanged. Our stock selection process is based on the investment principles first articulated in 1934 by the
fathers of security analysis, Benjamin Graham and David Dodd. Their work provided the framework for value
investing. Our firm contributed to the academic and empirical research on value investing by introducing the
concept of Private Market Value (PMV) with a CatalystTM. This is our proprietary research methodology that
focuses on individual stock selection by identifying stocks of firms selling at a discount to intrinsic value per
share with a reasonable probability of realizing their PMVs. We define PMV as the price a strategic acquirer
would likely be willing to pay for the entire enterprise. Catalysts are specific events or circumstances with
varying time horizons that can trigger a narrowing of the difference between the market price of a stock and its
estimated PMV per share. Price appreciation can occur instantly, as in the case in an announced takeover, or
more gradually over time. There are a variety of catalysts that can cause change. Some general categories
include: company specific, industry, regulatory, demographic, political and economic. We continue to find good
6
value in many companies that have some combination of long term growth prospects, strong cash flow
generation, good balance sheets as well as shareholder friendly management teams. We thank you for your
investment in the Fund and we look forward to serving you in the future.
Sincerely,
Your Portfolio Management Team
July 13, 2017
Note: The views expressed in this Shareholder Commentary reflect those of the Portfolio Managers only through
the end of the period stated in this Shareholder Commentary. The Portfolio Managers’ views are subject to
change at any time based on market and other conditions. The information in this Shareholder Commentary
represents the opinions of the individual Portfolio Managers and is not intended to be a forecast of future events,
a guarantee of future results, or investment advice. Views expressed are those of the Portfolio Managers and
may differ from those of other portfolio managers or of the Firm as a whole. This Shareholder Commentary does
not constitute an offer of any transaction in any securities. Any recommendation contained herein may not be
suitable for all investors. Information contained in this Shareholder Commentary has been obtained from
sources we believe to be reliable, but cannot be guaranteed. Beneficial ownership of shares held in the Fund by
Mr. Gabelli and various entities he is deemed to control are disclosed in the Fund’s annual proxy statement.
Common�Share�Repurchase�Plan
On May 12, 2004, the Board of Trustees of the Fund (the “Board”) voted to authorize the repurchase of
the Fund’s common shares in the open market from time to time when such shares are trading at a discount
of 7.5% or more from NAV. In total through June 30, 2017, the Fund has repurchased and retired 2,630,779
common shares in the open market under this share repurchase plan, at an average investment of $16.65 per
share and an average discount of approximately 14% from its NAV. The Fund did not repurchase shares in the
second quarter of 2017.
7
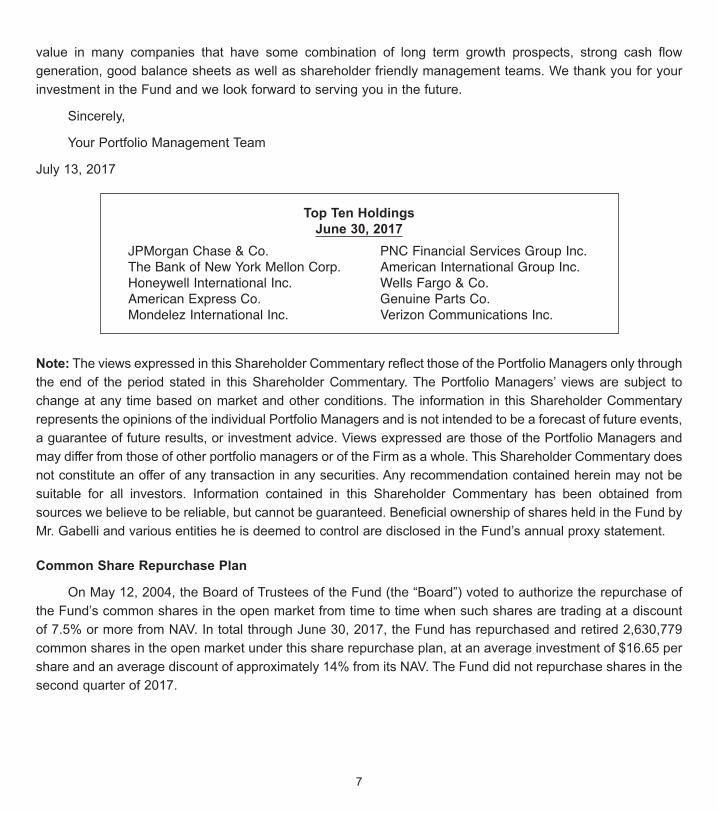
Top�Ten�Holdings
June�30,�2017
JPMorgan Chase & Co.
The Bank of New York Mellon Corp.
Honeywell International Inc.
American Express Co.
Mondelez International Inc.
PNC Financial Services Group Inc.
American International Group Inc.
Wells Fargo & Co.
Genuine Parts Co.
Verizon Communications Inc.
8
Monthly�Distribution�Policy�for�Common�Shareholders�
Pursuant to its distribution policy, the Fund paid $0.11 per share cash distributions on April 21, 2017,
May 23, 2017, and June 23, 2017, to common shareholders of record on April 13, 2017, May 16, 2017, and
June 16, 2017, respectively, for a total distribution of $0.33 per share during the second quarter of 2017. The
Board has reaffirmed the continuation of the Fund’s monthly distribution policy for the third quarter of 2017.
Under the Fund’s distribution policy, the Fund intends to pay a fixed monthly cash distribution and, if
necessary, an adjusting distribution in December which includes any additional income and realized net capital
gains in excess of the monthly distributions for that year to satisfy the minimum distribution requirements of the
Internal Revenue Code.
Each quarter, the Board reviews the amount of any potential distribution from the income, capital gain, or
capital available. The Board will continue to monitor the Fund’s distribution level, taking into consideration the
Fund’s net asset value and the financial market environment. The Fund’s distribution policy is subject to
modification by the Board at any time. The distribution rate should not be considered the dividend yield or total
return on an investment in the Fund.
If the Fund does not generate sufficient earnings (dividends and interest income and realized net capital
gain) equal to or in excess of the aggregate distributions paid by the Fund in a given year, then the amount
distributed in excess of the Fund’s earnings would be deemed a return of capital. Since this would be
considered a return of a portion of a shareholder’s original investment, it is generally not taxable and is treated
as a reduction in the shareholder’s cost basis. Despite the challenges of the extra recordkeeping, a distribution
that incorporates a return of capital serves as a smoothing mechanism resulting in a more stable and consistent
cash flow available to shareholders.
Long term capital gains, qualified dividend income, ordinary income, and paid-in capital, if any, will be
allocated on a pro-rata basis to all distributions to common shareholders for the year. Based on the accounting
records of the Fund currently available, each of the distributions paid to common shareholders in 2017 would
include approximately 20% from net investment income, 28% from net capital gains, and 52% from paid-in
capital on a book basis. This does not currently represent information for tax reporting purposes. The estimated
components of each distribution are updated and provided to shareholders of record in a notice accompanying
the distribution and are available on our website (www.gabelli.com). Shareholders should not draw any
conclusions about the Fund’s investment performance from the amount of the current distribution. The final
determination of the sources of all distributions in 2017 will be made after year end and can vary from the
monthly estimates. All shareholders with taxable accounts will receive written notification regarding the
components and tax treatment for all 2017 distributions in early 2018 via Form 1099-DIV.
5.875%�Series�A,�6.00%�Series�D,�and�5.25%�Series�G�Cumulative�Preferred�Shares
The Fund’s 5.875% Series A, 6.00% Series D, and 5.25% Series G Cumulative Preferred Shares paid
$0.3671875, $0.375, and $0.328125 per share cash distributions, respectively, on June 26, 2017, to preferred
9
shareholders of record on June 19, 2017. These Preferred Shares, which trade on the NYSE under the
symbols “GDV Pr A,” “GDV Pr D,” and “GDV Pr G,” respectively, are rated “Aa3” by Moody’s Investors Service
and have annual dividend rates of $1.46875, $1.50, and $1.3125 per share, respectively. The Series A, Series
D, and Series G Preferred Shares were issued on October 12, 2004, November 3, 2005, and July 1, 2016,
respectively, at $25.00 per share, and pay distributions quarterly. After five years of call protection, the Series
A and Series D Preferred Shares became callable at any time at the liquidation value of $25.00 per share plus
accrued dividends. The Series G Preferred Shares will be callable at any time at the liquidation value of $25.00
per share plus accrued dividends following the expiration of the five year call protection on July 1, 2021. The
next distributions are scheduled for September 2017. The Fund is authorized to repurchase these Preferred
Shares in the open market from time to time when such shares are trading at a discount to the liquidation value
of $25.00 per share. In total through June 30, 2017, the Fund has repurchased and retired 151,981 Series A
and 57,704 Series D Preferred Shares in the open market under this share repurchase authorization. The Fund
did not repurchase any of these Preferred Shares during the second quarter of 2017.
Series�B,�Series�C,�and�Series�E�Auction�Market/Rate�Cumulative�Preferred�Shares
During the second quarter of 2017, the dividend rates for the Series B and Series C Auction Market and
Series E Auction Rate Cumulative Preferred Shares ranged from 2.445% to 2.694%, 2.444% to 2.695%, and
3.446% to 3.692%, respectively. Dividend rates for the Series B, Series C, and Series E Preferred Shares may
be reset every seven days based on the results of an auction. Since February 2008, the number of Series B,
Series C, and Series E Preferred Shares subject to bid orders by potential holders has been less than the
number of sell orders. Therefore the weekly auctions have failed, and the holders have not been able to sell
any or all of the Series B, Series C, and Series E Preferred Shares for which they submitted sell orders. The
dividend rate since then has been the maximum rate. At June 30, 2017, the maximum rate for Series B and
Series C Preferred Shares was 150 basis points greater than the seven day Telerate/British Bankers
Association LIBOR and for Series E Preferred Shares was 250 basis points greater than the referenced LIBOR
rate. The Series B, Series C, and Series E Preferred Shares are rated “Aa3” by Moody’s Investors Service and
“AA” by Fitch Ratings. The Series B, Series C, and Series E Preferred Shares do not trade on an exchange.
The Fund was authorized to issue 4,000 Series B and 4,800 Series C Preferred Shares on October 12, 2004,
and 5,400 Series E Preferred Shares on November 3, 2005 at $25,000 per share. As of June 30, 2017, 3,600,
4,320, and 4,860 Series B, Series C, and Series E Preferred Shares, respectively, were outstanding.
The Board shares the view of Gabelli Funds, LLC (the “Investment Adviser”) that the issuance of the
Preferred Shares is designed to benefit the common shareholders. To the extent that the Fund earns in excess
of the dividend rate on the Preferred Shares, additional value will thereby be created for its common
shareholders.
Long term capital gains, qualified dividend income, and ordinary income, if any, will be allocated on a pro-
rata basis to all distributions to preferred shareholders for the year. Based on the accounting records of the Fund
currently available, the current distribution paid to preferred shareholders represents approximately 42% from
net investment income and 58% from net capital gains on a book basis. This does not currently represent
10
information for tax reporting purposes. The estimated components of each distribution are updated and provided
to shareholders of record in a notice accompanying the distribution and are available on our website
(www.gabelli.com). The final determination of the sources of all distributions in 2017 will be made after year end
and can vary from the quarterly estimates. All shareholders with taxable accounts will receive written notification
regarding the components and tax treatment for all 2017 distributions in early 2018 via Form 1099-DIV.
Tax�Treatment�of�Distributions�to�Common�and�Preferred�Shareholders
All or part of the distributions may be treated as long term capital gain or qualified dividend income (or a
combination of both) for individuals, each subject to the maximum federal income tax rate, which is currently
20% in taxable accounts for individuals. In addition, certain U.S. shareholders who are individuals, estates, or
trusts and whose income exceeds certain thresholds will be required to pay a 3.8% Medicare surcharge on
their “net investment income,” which includes dividends received from the Fund and capital gains from the sale
or other disposition of shares of the Fund.
www.gabelli.com
Please visit us on the Internet. Our homepage at www.gabelli.com contains information about GAMCO
Investors, Inc., the Gabelli/GAMCO Closed-End Funds and Mutual Funds, IRAs, 401(k)s, current and historical
quarterly reports, closing prices, and other current news. We welcome your comments and questions via
e-mail at [email protected].
You may sign up for our e-mail alerts at www.gabelli.com and receive notice of quarterly report availability,
news events, media sightings, and mutual fund prices and performance.
e-delivery
We are pleased to offer electronic delivery of Gabelli fund documents. Shareholders of our closed-end
funds can now elect to receive e-mail announcements regarding available materials, including shareholder
commentaries and Fund reports. For more information or to register for e-delivery, please visit our website at
www.gabelli.com.
11
Notice is hereby given in accordance with Section 23(c) of the Investment Company Act of 1940, as amended, that the
Fund may from time to time purchase its common shares in the open market when the Fund’s shares are trading at a
discount of 7.5% or more from the net asset value of the shares. The Fund may also from time to time purchase its
preferred shares in the open market when the preferred shares are trading at a discount to the liquidation value.
The Net Asset Value per share appears in the Publicly Traded Funds column, under the heading “General
Equity Funds,” in Monday’s The Wall Street Journal. It is also listed in Barron’s Mutual Funds/Closed End
Funds section under the heading “General Equity Funds.”
The Net Asset Value per share may be obtained each day by calling (914) 921-5070 or visiting
www.gabelli.com.
The NASDAQ symbol for the Net Asset Value per share is “XGDVX.”
We have separated the portfolio managers’ commentary from the financial statements and investment portfolio due to
corporate governance regulations stipulated by the Sarbanes-Oxley Act of 2002. We have done this to ensure that the
content of the portfolio managers’ commentary is unrestricted. The financial statements and investment portfolio are
mailed separately from the commentary. Both the commentary and the financial statements, including the portfolio of
investments, will be available on our website at www.gabelli.com.
12
AUTOMATIC�DIVIDEND�REINVESTMENT�AND�VOLUNTARY�CASH�PURCHASE�PLANS
Enrollment�in�the�Plan
It is the policy of The Gabelli Dividend & Income Trust (the “Fund”) to automatically reinvest dividends
payable to common shareholders. As a “registered” shareholder you automatically become a participant in the
Fund’s Automatic Dividend Reinvestment Plan (the “Plan”). The Plan authorizes the Fund to credit common
shares to participants upon an income dividend or a capital gains distribution regardless of whether the shares
are trading at a discount or a premium to net asset value. All distributions to shareholders whose shares are
registered in their own names will be automatically reinvested pursuant to the Plan in additional shares of the
Fund. Plan participants may send their common shares certificates to Computershare Trust Company, N.A.
(“Computershare”) to be held in their dividend reinvestment account. Registered shareholders wishing to
receive their distributions in cash must submit this request in writing to:
The Gabelli Dividend & Income Trust
c/o Computershare
P.O. Box 30170
College Station, TX 77842-3170
Shareholders requesting this cash election must include the shareholder’s name and address as they
appear on the Fund’s records. Shareholders with additional questions regarding the Plan or requesting a copy
of the terms of the Plan, may contact Computershare at (800) 336-6983.
If your shares are held in the name of a broker, bank, or nominee, you should contact such institution. If
such institution is not participating in the Plan, your account will be credited with a cash dividend. In order to
participate in the Plan through such institution, it may be necessary for you to have your shares taken out of
“street name” and re-registered in your own name. Once registered in your own name your distributions will be
automatically reinvested. Certain brokers participate in the Plan. Shareholders holding shares in “street name”
at participating institutions will have dividends automatically reinvested. Shareholders wishing a cash dividend
at such institution must contact their broker to make this change.
The number of shares of common shares distributed to participants in the Plan in lieu of cash dividends is
determined in the following manner. Under the Plan, whenever the market price of the Fund’s common shares is
equal to or exceeds net asset value at the time shares are valued for purposes of determining the number of shares
equivalent to the cash dividends or capital gains distribution, participants are issued shares of common shares
valued at the greater of (i) the net asset value as most recently determined or (ii) 95% of the then current market
price of the Fund’s common shares. The valuation date is the dividend or distribution payment date or, if that date is
not a New York Stock Exchange (“NYSE”) trading day, the next trading day. If the net asset value of the common
shares at the time of valuation exceeds the market price of the common shares, participants will receive shares from
the Fund valued at market price. If the Fund should declare a dividend or capital gains distribution payable only in
cash, Computershare will buy shares of common shares in the open market, or on the NYSE or elsewhere, for the
participants’ accounts, except that Computershare will endeavor to terminate purchases in the open market and
cause the Fund to issue shares at net asset value if, following the commencement of such purchases, the market
value of the common shares exceeds the then current net asset value.
13
The automatic reinvestment of dividends and capital gains distributions will not relieve participants of any
income tax which may be payable on such distributions. A participant in the Plan will be treated for federal
income tax purposes as having received, on a dividend payment date, a dividend or distribution in an amount
equal to the cash the participant could have received instead of shares.
Voluntary�Cash�Purchase�Plan
The Voluntary Cash Purchase Plan is yet another vehicle for our shareholders to increase their
investment in the Fund. In order to participate in the Voluntary Cash Purchase Plan, shareholders must have
their shares registered in their own name.
Participants in the Voluntary Cash Purchase Plan have the option of making additional cash payments to
Computershare for investments in the Fund’s common shares at the then current market price. Shareholders
may send an amount from $250 to $10,000. Computershare will use these funds to purchase shares in the
open market on or about the 1st and 15th of each month. Computershare will charge each shareholder who
participates $0.75, plus a pro rata share of the brokerage commissions. Brokerage charges for such purchases
are expected to be less than the usual brokerage charge for such transactions. It is suggested that any
voluntary cash payments be sent to Computershare, P.O. Box 30170, College Station, TX 77842-3170 such that
Computershare receives such payments approximately 10 days before the 1st and 15th of the month. Funds
not received at least five days before the investment date shall be held for investment until the next purchase
date. A payment may be withdrawn without charge if notice is received by Computershare at least 48 hours
before such payment is to be invested.
Shareholders wishing to liquidate shares held at Computershare must do so in writing or by telephone.
Please submit your request to the above mentioned address or telephone number. Include in your request your
name, address, and account number. The cost to liquidate shares is $2.50 per transaction as well as the
brokerage commission incurred. Brokerage charges are expected to be less than the usual brokerage charge
for such transactions.
For more information regarding the Automatic Dividend Reinvestment Plan and Voluntary Cash Purchase
Plan, brochures are available by calling (914) 921-5070 or by writing directly to the Fund.
The Fund reserves the right to amend or terminate the Plan as applied to any voluntary cash payments
made and any dividend or distribution paid subsequent to written notice of the change sent to the members of
the Plan at least 90 days before the record date for such dividend or distribution. The Plan also may be
amended or terminated by Computershare on at least 90 days written notice to participants in the Plan.
THE�GABELLI DIVIDEND�&�INCOME�TRUST
AND�YOUR�PERSONAL�PRIVACY
Who�are�we?
The Gabelli Dividend & Income Trust (the “Fund”) is a closed-end management investmentcompany registered with the Securities and Exchange Commission under the InvestmentCompany Act of 1940. We are managed by Gabelli Funds, LLC, which is affiliated withGAMCO Investors, Inc. GAMCO Investors, Inc. is a publicly held company that hassubsidiaries and affiliates that provide investment advisory services for a variety of clients.
What�kind�of�non-public� information�do�we�collect�about�you� if�you�become�a� fund
shareholder?
When you purchase shares of the Fund on the New York Stock Exchange, you have theoption of registering directly with our transfer agent in order, for example, to participate in ourdividend reinvestment plan.
• Information you give us on your application form. This could include your name, address,telephone number, social security number, bank account number, and other information.
• Information about your transactions with us. This would include information about theshares that you buy or sell; it may also include information about whether you sell orexercise rights that we have issued from time to time. If we hire someone else to provideservices—like a transfer agent—we will also have information about the transactions thatyou conduct through them.
What�information�do�we�disclose�and�to�whom�do�we�disclose�it?�
We do not disclose any non-public personal information about our customers or formercustomers to anyone other than our affiliates, our service providers who need to know suchinformation, and as otherwise permitted by law. If you want to find out what the law permits,you can read the privacy rules adopted by the Securities and Exchange Commission. Theyare in volume 17 of the Code of Federal Regulations, Part 248. The Commission often postsinformation about its regulations on its website, www.sec.gov.
What�do�we�do�to�protect�your�personal�information?
We restrict access to non-public personal information about you to the people who need to knowthat information in order to provide services to you or the fund and to ensure that we arecomplying with the laws governing the securities business. We maintain physical, electronic,and procedural safeguards to keep your personal information confidential.
14
THE�GABELLI�DIVIDEND�&�INCOME�TRUST
One�Corporate�Center
Rye,�NY�10580-1422
This�report�is�printed�on�recycled�paper.
Portfolio�Management�Team�Biographies
Mario�J.�Gabelli,�CFA, is Chairman, Chief Executive Officer, and Chief Investment Officer –Value Portfolios of
GAMCO Investors, Inc. that he founded in 1977, and Chief Investment Officer – Value Portfolios of Gabelli
Funds, LLC and GAMCO Asset Management Inc. He is also Executive Chairman of the Board of Directors of
Associated Capital Group, Inc. Mr. Gabelli is a summa cum laude graduate of Fordham University and holds
an MBA degree from Columbia Business School, and Honorary Doctorates from Fordham University and
Roger Williams University.
Christopher�J.�Marangi joined Gabelli in 2003 as a research analyst. Currently he is a Managing Director and
Co-Chief Investment Officer for GAMCO Investors, Inc.’s Value team. In addition, he currently serves as a
portfolio manager of Gabelli Funds, LLC and manages several funds within the Gabelli/GAMCO Funds
Complex. Mr. Marangi graduated magna cum laude and Phi Beta Kappa with a BA in Political Economy from
Williams College and holds an MBA with honors from Columbia Business School.
Kevin�V.�Dreyer�joined Gabelli in 2005 as a research analyst covering companies within the consumer sector.
Currently he is a Managing Director and Co-Chief Investment Officer for GAMCO Investors, Inc.’s Value team.
In addition, he currently serves as a portfolio manager of Gabelli Funds, LLC and manages several funds within
the Gabelli/GAMCO Funds Complex. Mr. Dreyer received a BSE from the University of Pennsylvania and an
MBA from Columbia Business School.
Barbara�G.�Marcin,�CFA,�joined GAMCO Investors, Inc. in 1999 and currently serves as a portfolio manager
of Gabelli Funds, LLC and manages several funds within the Gabelli/GAMCO Funds Complex. Prior to joining
GAMCO, Ms. Marcin was head of value investments at Citibank Global Asset Management. Ms. Marcin
graduated with Distinction as an Echols Scholar from the University of Virginia and holds an MBA degree from
Harvard University’s Graduate School of Business.
Robert�D.�Leininger,�CFA, joined GAMCO Investors, Inc. in 1993 as an equity analyst. Subsequently, he was
a partner and portfolio manager at Rorer Asset Management before rejoining GAMCO in 2010 where he
currently serves as a portfolio manager of Gabelli Funds, LLC. Mr. Leininger is a magna cum laude graduate
of Amherst College with a degree in Economics and holds an MBA from the Wharton School at the University
of Pennsylvania.
Jeffrey�J.�Jonas,�CFA, joined Gabelli in 2003 as a research analyst focusing on companies across the health
care industry. In 2006 he began serving as a portfolio manager of Gabelli Funds, LLC and manages several
funds within the Gabelli/GAMCO Funds Complex. Mr. Jonas was a Presidential Scholar at Boston College,
where he received a BS in Finance and Management Information Systems.
THE GABELLI DIVIDEND & INCOME TRUSTOne Corporate CenterRye, NY 10580-1422
t 800-GABELLI (800-422-3554)f 914-921-5118e [email protected]
GABELL I .COM
TRUSTEESMario J. Gabelli, CFAChairman &Chief Executive Officer,GAMCO Investors Inc.Executive Chairman,Associated Capital Group Inc.
Anthony J. ColavitaPresident, Anthony J. Colavita, P.C.
James P. ConnFormer Managing Director & Chief Investment Officer,Financial Security AssuranceHoldings Ltd.
Frank J. Fahrenkopf, Jr.Former President & Chief Executive Officer,American Gaming Association
Michael J. MelarkeyOf Counsel,McDonald Carano Wilson LLP
Salvatore M. Salibello, CPASenior Partner, Bright Side Consulting
Edward T. TokarFormer Chief Executive Officerof Allied Capital Management,LLC & Vice President ofHoneywell International, Inc.
Anthonie C. van EkrisChairman, BALMAC International, Inc.
Salvatore J. ZizzaChairman, Zizza & Associates Corp.
OFFICERS
Bruce N. AlpertPresident
Agnes MulladyVice President
Andrea R. MangoSecretary & Vice President
John C. BallTreasurer
Richard J. WalzChief Compliance Officer
Carter W. AustinVice President & Ombudsman
Laurissa M. MartireVice President & Ombudsman
David I. SchachterVice President
INVESTMENT ADVISER
Gabelli Funds, LLCOne Corporate CenterRye, New York 10580-1422
CUSTODIAN
State Street Bank and TrustCompany
COUNSEL
Skadden, Arps, Slate, Meagher &Flom LLP
TRANSFER AGENT ANDREGISTRAR
Computershare Trust Company, N.A.
THEGABELL ID IV IDEND& INCOMETRUST
Shareholder CommentaryJune 30, 2017
GDV Jun/2017
GDV

(Y)our Portfolio Management Team
Jeffrey J. Jonas, CFAPortfolio Manager
BS, Boston College
Mario J. Gabelli, CFAChief Investment
Officer
Christopher J. MarangiCo-Chief
Investment OfficerBA, Williams College
MBA, ColumbiaBusiness School
Kevin V. DreyerCo-Chief
Investment OfficerBSE, University of
PennsylvaniaMBA, ColumbiaBusiness School
Robert D. Leininger, CFAPortfolio Manager
BA, Amherst CollegeMBA, Wharton School,
University of Pennsylvania
Barbara G. Marcin, CFAPortfolio Manager
BA, Universityof Virginia
MBA, GraduateSchool of Business,Harvard University
To Our Shareholders,
For the six months ended June 30, 2017, the net asset value (“NAV”) total return of The Gabelli Dividend& Income Trust (the “Fund”) was 7.3%, compared with a total return of 9.3% for the Standard & Poor’s (“S&P”)500 Index. The total return for the Fund’s publicly traded shares was 10.3%. The Fund’s NAV per share was$23.25 while the price of the publicly traded shares closed at $21.82 on the New York Stock Exchange (“NYSE”).See below for additional performance information.
Enclosed are the financial statements, including the schedule of investments, as of June 30, 2017.
Comparative ResultsAverage Annual Returns through June 30, 2017 (a) (Unaudited)
Year to Date 1 Year 5 Year 10 Year
SinceInception(11/28/03)
Gabelli Dividend & Income TrustNAV Total Return (b) . . . . . . . . . . . . . . . . . . . . . . . . . . . . . . . . . 7.30% 14.31% 12.56% 5.83% 8.07%Investment Total Return (c) . . . . . . . . . . . . . . . . . . . . . . . . . . . . 10.29 21.67 14.90 7.35 8.09
S&P 500 Index . . . . . . . . . . . . . . . . . . . . . . . . . . . . . . . . . . . . . . . 9.34 17.90 14.63 7.18 8.51Dow Jones Industrial Average . . . . . . . . . . . . . . . . . . . . . . . . . . . . 9.36 22.07 13.39 7.53 8.62Nasdaq Composite Index. . . . . . . . . . . . . . . . . . . . . . . . . . . . . . . . 14.75 28.37 17.45 10.23 9.90(a) Returns represent past performance and do not guarantee future results. Investment returns and the principal value of an investment will
fluctuate. When shares are sold, they may be worth more or less than their original cost. Current performance may be lower or higher thanthe performance data presented. Visit www.gabelli.com for performance information as of the most recent month end. Performancereturns for periods of less than one year are not annualized. Investors should carefully consider the investment objectives, risks, charges,and expenses of the Fund before investing. The Dow Jones Industrial Average is an unmanaged index of 30 large capitalization stocks.The S&P 500 and the Nasdaq Composite Indices are unmanaged indicators of stock market performance. Dividends are consideredreinvested except for the Nasdaq Composite Index. You cannot invest directly in an index.
(b) Total returns and average annual returns reflect changes in the NAV per share and reinvestment of distributions at NAV on theex-dividend date and adjustment for the spin-off and are net of expenses. Since inception return is based on an initial NAV of $19.06.
(c) Total returns and average annual returns reflect changes in closing market values on the NYSE, reinvestment of distributions andadjustment for the spin-off. Since inception return is based on an initial offering price of $20.00.
The Gabelli Dividend & Income TrustSemiannual Report — June 30, 2017
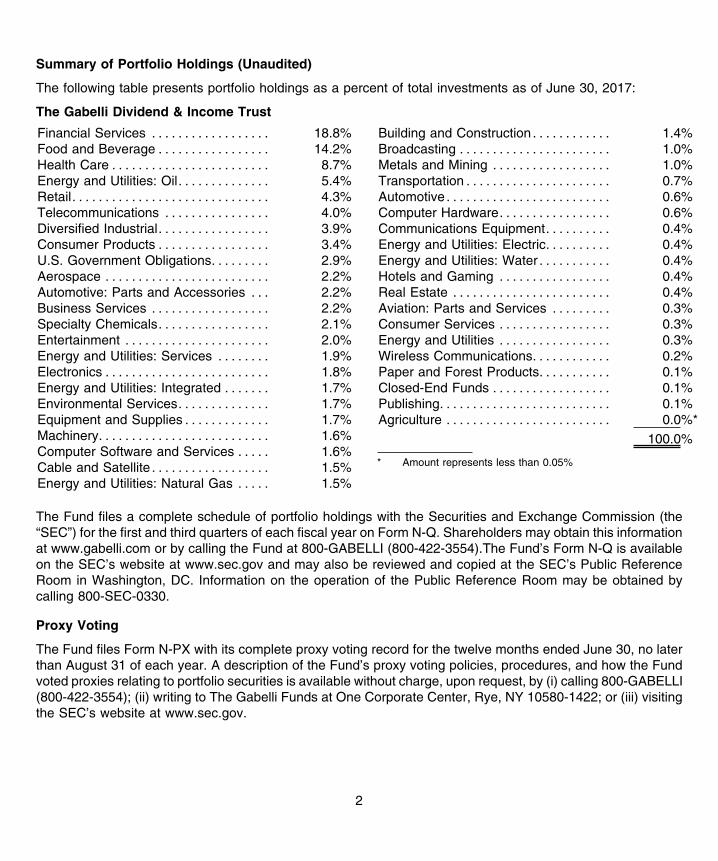
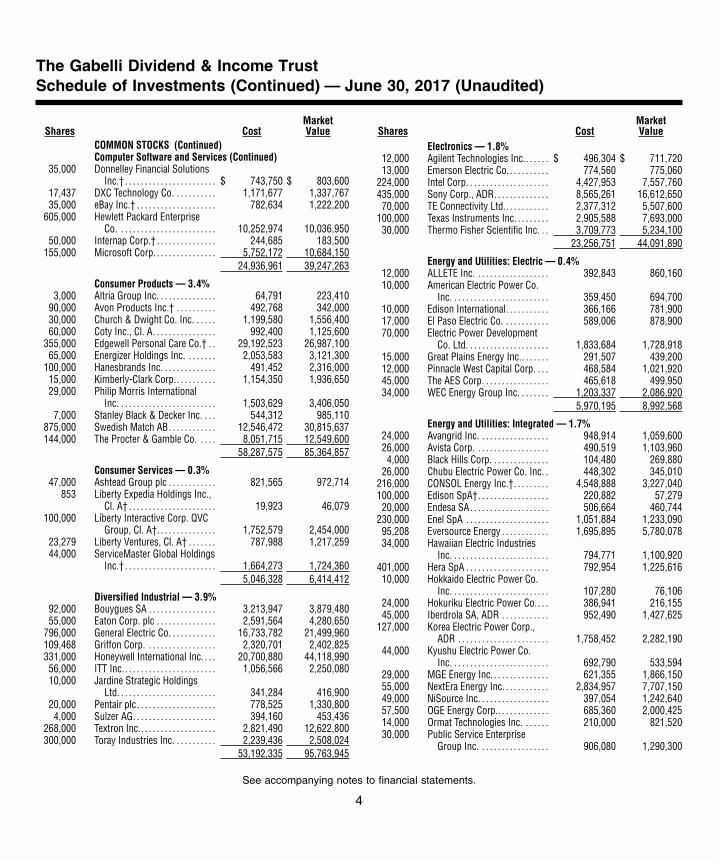
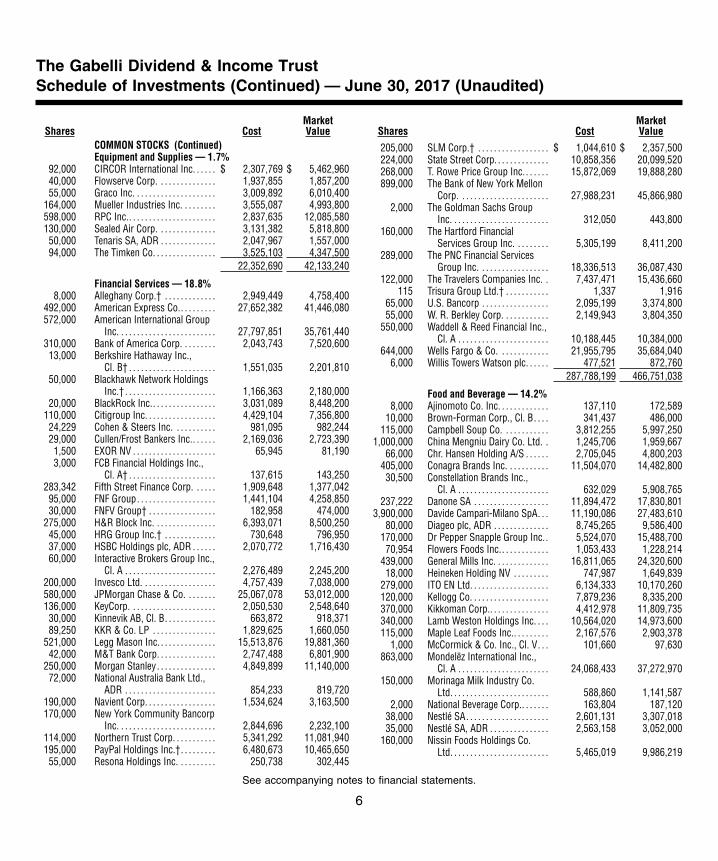
The following table presents portfolio holdings as a percent of total investments as of June 30, 2017:
The Gabelli Dividend & Income Trust
Financial Services . . . . . . . . . . . . . . . . . . 18.8%Food and Beverage . . . . . . . . . . . . . . . . . 14.2%Health Care . . . . . . . . . . . . . . . . . . . . . . . . 8.7%Energy and Utilities: Oil. . . . . . . . . . . . . . 5.4%Retail. . . . . . . . . . . . . . . . . . . . . . . . . . . . . . 4.3%Telecommunications . . . . . . . . . . . . . . . . 4.0%Diversified Industrial. . . . . . . . . . . . . . . . . 3.9%Consumer Products . . . . . . . . . . . . . . . . . 3.4%U.S. Government Obligations. . . . . . . . . 2.9%Aerospace . . . . . . . . . . . . . . . . . . . . . . . . . 2.2%Automotive: Parts and Accessories . . . 2.2%Business Services . . . . . . . . . . . . . . . . . . 2.2%Specialty Chemicals. . . . . . . . . . . . . . . . . 2.1%Entertainment . . . . . . . . . . . . . . . . . . . . . . 2.0%Energy and Utilities: Services . . . . . . . . 1.9%Electronics . . . . . . . . . . . . . . . . . . . . . . . . . 1.8%Energy and Utilities: Integrated . . . . . . . 1.7%Environmental Services. . . . . . . . . . . . . . 1.7%Equipment and Supplies . . . . . . . . . . . . . 1.7%Machinery. . . . . . . . . . . . . . . . . . . . . . . . . . 1.6%Computer Software and Services . . . . . 1.6%Cable and Satellite . . . . . . . . . . . . . . . . . . 1.5%Energy and Utilities: Natural Gas . . . . . 1.5%
Building and Construction . . . . . . . . . . . . 1.4%Broadcasting . . . . . . . . . . . . . . . . . . . . . . . 1.0%Metals and Mining . . . . . . . . . . . . . . . . . . 1.0%Transportation . . . . . . . . . . . . . . . . . . . . . . 0.7%Automotive . . . . . . . . . . . . . . . . . . . . . . . . . 0.6%Computer Hardware. . . . . . . . . . . . . . . . . 0.6%Communications Equipment. . . . . . . . . . 0.4%Energy and Utilities: Electric. . . . . . . . . . 0.4%Energy and Utilities: Water . . . . . . . . . . . 0.4%Hotels and Gaming . . . . . . . . . . . . . . . . . 0.4%Real Estate . . . . . . . . . . . . . . . . . . . . . . . . 0.4%Aviation: Parts and Services . . . . . . . . . 0.3%Consumer Services . . . . . . . . . . . . . . . . . 0.3%Energy and Utilities . . . . . . . . . . . . . . . . . 0.3%Wireless Communications. . . . . . . . . . . . 0.2%Paper and Forest Products. . . . . . . . . . . 0.1%Closed-End Funds . . . . . . . . . . . . . . . . . . 0.1%Publishing. . . . . . . . . . . . . . . . . . . . . . . . . . 0.1%Agriculture . . . . . . . . . . . . . . . . . . . . . . . . . 0.0%*
100.0%
* Amount represents less than 0.05%
The Fund files a complete schedule of portfolio holdings with the Securities and Exchange Commission (the“SEC”) for the first and third quarters of each fiscal year on Form N-Q. Shareholders may obtain this informationat www.gabelli.com or by calling the Fund at 800-GABELLI (800-422-3554).The Fund’s Form N-Q is availableon the SEC’s website at www.sec.gov and may also be reviewed and copied at the SEC’s Public ReferenceRoom in Washington, DC. Information on the operation of the Public Reference Room may be obtained bycalling 800-SEC-0330.
Proxy Voting
The Fund files Form N-PX with its complete proxy voting record for the twelve months ended June 30, no laterthan August 31 of each year. A description of the Fund’s proxy voting policies, procedures, and how the Fundvoted proxies relating to portfolio securities is available without charge, upon request, by (i) calling 800-GABELLI(800-422-3554); (ii) writing to The Gabelli Funds at One Corporate Center, Rye, NY 10580-1422; or (iii) visitingthe SEC’s website at www.sec.gov.
Summary of Portfolio Holdings (Unaudited)
2

Shares CostMarketValue
COMMON STOCKS — 96.4%Aerospace — 2.2%
255,731 Aerojet Rocketdyne HoldingsInc.† . . . . . . . . . . . . . . . . . . . . . . . $ 3,116,704 $ 5,319,205
34,000 Kaman Corp. . . . . . . . . . . . . . . . . . 675,256 1,695,580104,000 Rockwell Automation Inc. . . . . . 4,480,794 16,843,840
1,507,000 Rolls-Royce Holdings plc . . . . . 11,374,835 17,488,564106,997,000 Rolls-Royce Holdings plc,
Cl. C† . . . . . . . . . . . . . . . . . . . . . . 137,502 139,35969,500 The Boeing Co. . . . . . . . . . . . . . . . 5,316,902 13,743,625
25,101,993 55,230,173
Agriculture — 0.0%2,000 Bunge Ltd.. . . . . . . . . . . . . . . . . . . . 128,286 149,200
Automotive — 0.6%175,000 Ford Motor Co. . . . . . . . . . . . . . . . 2,343,890 1,958,250
45,000 General Motors Co. . . . . . . . . . . . 1,675,166 1,571,850263,000 Navistar International Corp.† . . 6,783,164 6,898,49080,000 PACCAR Inc.. . . . . . . . . . . . . . . . . . 3,526,656 5,283,200
14,328,876 15,711,790
Automotive: Parts and Accessories — 2.2%21,213 Adient plc . . . . . . . . . . . . . . . . . . . . 997,011 1,386,906
277,000 Dana Inc. . . . . . . . . . . . . . . . . . . . . . 4,896,763 6,185,41070,000 Delphi Automotive plc. . . . . . . . . 4,941,763 6,135,500
342,000 Genuine Parts Co.. . . . . . . . . . . . . 20,969,203 31,723,9205,900 Lear Corp. . . . . . . . . . . . . . . . . . . . . 714,022 838,272
27,000 O’Reilly Automotive Inc.† . . . . . 4,748,986 5,905,98025,000 Visteon Corp.†. . . . . . . . . . . . . . . . 2,333,971 2,551,500
39,601,719 54,727,488
Aviation: Parts and Services — 0.3%92,000 Arconic Inc. . . . . . . . . . . . . . . . . . . 1,951,196 2,083,80082,000 KLX Inc.†. . . . . . . . . . . . . . . . . . . . . 3,250,737 4,100,00021,101 Rockwell Collins Inc. . . . . . . . . . . 2,067,687 2,217,293
7,269,620 8,401,093
Broadcasting — 1.0%24,900 CBS Corp., Cl. A, Voting. . . . . . . 1,372,540 1,613,76915,000 Liberty Broadband Corp.,
Cl. C† . . . . . . . . . . . . . . . . . . . . . . 798,727 1,301,25061,764 Liberty Global plc, Cl. A† . . . . . . 982,066 1,983,859
323,571 Liberty Global plc, Cl. C† . . . . . . 7,151,796 10,088,93212,000 Liberty Media Corp.-
Liberty SiriusXM, Cl. A† . . . . 293,384 503,76030,000 Liberty Media Corp.-
Liberty SiriusXM, Cl. C† . . . . 782,390 1,251,000105,000 MSG Networks Inc., Cl. A† . . . . 870,548 2,357,250110,000 Tribune Media Co., Cl. A. . . . . . . 4,092,654 4,484,700
16,344,105 23,584,520
Building and Construction — 1.4%75,000 Armstrong Flooring Inc.† . . . . . 1,331,861 1,347,750
Shares CostMarketValue
78,000 Fortune Brands Home &Security Inc. . . . . . . . . . . . . . . . $ 1,037,580 $ 5,088,720
231,050 Herc Holdings Inc.† . . . . . . . . . . . 8,507,034 9,084,886431,318 Johnson Controls
International plc . . . . . . . . . . . . 14,001,229 18,701,95385,000 Layne Christensen Co.† . . . . . . . 1,128,183 747,150
26,005,887 34,970,459
Business Services — 2.2%25,000 Aramark . . . . . . . . . . . . . . . . . . . . . . 645,416 1,024,500
100,000 Diebold Nixdorf Inc.. . . . . . . . . . . 2,787,335 2,800,000150,000 Fly Leasing Ltd., ADR†. . . . . . . . 2,036,969 2,017,500
5,000 Jardine Matheson HoldingsLtd. . . . . . . . . . . . . . . . . . . . . . . . . 304,206 321,000
27,000 JCDecaux SA . . . . . . . . . . . . . . . . . 891,687 885,671244,000 Macquarie Infrastructure
Corp. . . . . . . . . . . . . . . . . . . . . . . 14,120,124 19,129,600175,000 Mastercard Inc., Cl. A . . . . . . . . . 3,891,019 21,253,75043,000 Stericycle Inc.† . . . . . . . . . . . . . . . 3,357,308 3,281,76027,000 The Brink’s Co. . . . . . . . . . . . . . . . 686,974 1,809,00025,000 Visa Inc., Cl. A . . . . . . . . . . . . . . . . 2,167,723 2,344,500
30,888,761 54,867,281
Cable and Satellite — 1.4%65,000 AMC Networks Inc., Cl. A† . . . . 2,460,582 3,471,6502,445 Charter Communications Inc.,
Cl. A† . . . . . . . . . . . . . . . . . . . . . . 347,387 823,59815,000 Cogeco Inc.. . . . . . . . . . . . . . . . . . . 296,908 780,768
160,000 Comcast Corp., Cl. A . . . . . . . . . . 3,570,839 6,227,200190,000 DISH Network Corp., Cl. A† . . . 5,800,419 11,924,40050,000 EchoStar Corp., Cl. A† . . . . . . . . 1,296,581 3,035,0009,507 Liberty Global plc LiLAC,
Cl. A† . . . . . . . . . . . . . . . . . . . . . . 165,069 206,96722,116 Liberty Global plc LiLAC,
Cl. C† . . . . . . . . . . . . . . . . . . . . . . 568,678 473,504153,000 Rogers Communications Inc.,
Cl. B . . . . . . . . . . . . . . . . . . . . . . . 3,393,082 7,223,13025,000 WideOpenWest Inc.†. . . . . . . . . . 425,000 435,000
18,324,545 34,601,217
Communications Equipment — 0.4%330,000 Corning Inc. . . . . . . . . . . . . . . . . . . 4,042,401 9,916,500
Computer Hardware — 0.6%105,000 Apple Inc. . . . . . . . . . . . . . . . . . . . . 7,545,291 15,122,100
Computer Software and Services — 1.6%9,000 Alphabet Inc., Cl. A† . . . . . . . . . . 2,388,254 8,367,1205,527 Alphabet Inc., Cl. C† . . . . . . . . . . 2,859,790 5,022,551
35,000 Blucora Inc.† . . . . . . . . . . . . . . . . . 438,146 742,000214 CommerceHub Inc., Cl. A† . . . . 1,498 3,728427 CommerceHub Inc., Cl. C† . . . . 2,989 7,447
15,000 CyrusOne Inc. . . . . . . . . . . . . . . . . 298,392 836,250
The Gabelli Dividend & Income TrustSchedule of Investments — June 30, 2017 (Unaudited)
See accompanying notes to financial statements.
3
Shares CostMarketValue
COMMON STOCKS (Continued)Computer Software and Services (Continued)
35,000 Donnelley Financial SolutionsInc.† . . . . . . . . . . . . . . . . . . . . . . . $ 743,750 $ 803,600
17,437 DXC Technology Co. . . . . . . . . . . 1,171,677 1,337,76735,000 eBay Inc.† . . . . . . . . . . . . . . . . . . . . 782,634 1,222,200
605,000 Hewlett Packard EnterpriseCo. . . . . . . . . . . . . . . . . . . . . . . . . 10,252,974 10,036,950
50,000 Internap Corp.† . . . . . . . . . . . . . . . 244,685 183,500155,000 Microsoft Corp. . . . . . . . . . . . . . . . 5,752,172 10,684,150
24,936,961 39,247,263
Consumer Products — 3.4%3,000 Altria Group Inc. . . . . . . . . . . . . . . 64,791 223,410
90,000 Avon Products Inc.† . . . . . . . . . . 492,768 342,00030,000 Church & Dwight Co. Inc. . . . . . 1,199,580 1,556,40060,000 Coty Inc., Cl. A. . . . . . . . . . . . . . . . 992,400 1,125,600
355,000 Edgewell Personal Care Co.† . . 29,192,523 26,987,10065,000 Energizer Holdings Inc. . . . . . . . 2,053,583 3,121,300
100,000 Hanesbrands Inc. . . . . . . . . . . . . . 491,452 2,316,00015,000 Kimberly-Clark Corp.. . . . . . . . . . 1,154,350 1,936,65029,000 Philip Morris International
Inc. . . . . . . . . . . . . . . . . . . . . . . . . 1,503,629 3,406,0507,000 Stanley Black & Decker Inc. . . . 544,312 985,110
875,000 Swedish Match AB. . . . . . . . . . . . 12,546,472 30,815,637144,000 The Procter & Gamble Co. . . . . 8,051,715 12,549,600
58,287,575 85,364,857
Consumer Services — 0.3%47,000 Ashtead Group plc . . . . . . . . . . . . 821,565 972,714
853 Liberty Expedia Holdings Inc.,Cl. A† . . . . . . . . . . . . . . . . . . . . . . 19,923 46,079
100,000 Liberty Interactive Corp. QVCGroup, Cl. A†. . . . . . . . . . . . . . . 1,752,579 2,454,000
23,279 Liberty Ventures, Cl. A† . . . . . . . 787,988 1,217,25944,000 ServiceMaster Global Holdings
Inc.† . . . . . . . . . . . . . . . . . . . . . . . 1,664,273 1,724,3605,046,328 6,414,412
Diversified Industrial — 3.9%92,000 Bouygues SA . . . . . . . . . . . . . . . . . 3,213,947 3,879,48055,000 Eaton Corp. plc . . . . . . . . . . . . . . . 2,591,564 4,280,650
796,000 General Electric Co. . . . . . . . . . . . 16,733,782 21,499,960109,468 Griffon Corp. . . . . . . . . . . . . . . . . . 2,320,701 2,402,825331,000 Honeywell International Inc. . . . 20,700,880 44,118,99056,000 ITT Inc.. . . . . . . . . . . . . . . . . . . . . . . 1,056,566 2,250,08010,000 Jardine Strategic Holdings
Ltd. . . . . . . . . . . . . . . . . . . . . . . . . 341,284 416,90020,000 Pentair plc. . . . . . . . . . . . . . . . . . . . 778,525 1,330,8004,000 Sulzer AG. . . . . . . . . . . . . . . . . . . . . 394,160 453,436
268,000 Textron Inc.. . . . . . . . . . . . . . . . . . . 2,821,490 12,622,800300,000 Toray Industries Inc. . . . . . . . . . . 2,239,436 2,508,024
53,192,335 95,763,945
Shares CostMarketValue
Electronics — 1.8%12,000 Agilent Technologies Inc.. . . . . . $ 496,304 $ 711,72013,000 Emerson Electric Co. . . . . . . . . . . 774,560 775,060
224,000 Intel Corp. . . . . . . . . . . . . . . . . . . . . 4,427,953 7,557,760435,000 Sony Corp., ADR. . . . . . . . . . . . . . 8,565,261 16,612,65070,000 TE Connectivity Ltd.. . . . . . . . . . . 2,377,312 5,507,600
100,000 Texas Instruments Inc. . . . . . . . . 2,905,588 7,693,00030,000 Thermo Fisher Scientific Inc. . . 3,709,773 5,234,100
23,256,751 44,091,890
Energy and Utilities: Electric — 0.4%12,000 ALLETE Inc. . . . . . . . . . . . . . . . . . . 392,843 860,16010,000 American Electric Power Co.
Inc. . . . . . . . . . . . . . . . . . . . . . . . . 359,450 694,70010,000 Edison International. . . . . . . . . . . 366,166 781,90017,000 El Paso Electric Co. . . . . . . . . . . . 589,006 878,90070,000 Electric Power Development
Co. Ltd. . . . . . . . . . . . . . . . . . . . . 1,833,684 1,728,91815,000 Great Plains Energy Inc.. . . . . . . 291,507 439,20012,000 Pinnacle West Capital Corp. . . . 468,584 1,021,92045,000 The AES Corp. . . . . . . . . . . . . . . . . 465,618 499,95034,000 WEC Energy Group Inc. . . . . . . . 1,203,337 2,086,920
5,970,195 8,992,568
Energy and Utilities: Integrated — 1.7%24,000 Avangrid Inc. . . . . . . . . . . . . . . . . . 948,914 1,059,60026,000 Avista Corp. . . . . . . . . . . . . . . . . . . 490,519 1,103,9604,000 Black Hills Corp. . . . . . . . . . . . . . . 104,480 269,880
26,000 Chubu Electric Power Co. Inc. . 448,302 345,010216,000 CONSOL Energy Inc.†. . . . . . . . . 4,548,888 3,227,040100,000 Edison SpA†. . . . . . . . . . . . . . . . . . 220,882 57,27920,000 Endesa SA. . . . . . . . . . . . . . . . . . . . 506,664 460,744
230,000 Enel SpA . . . . . . . . . . . . . . . . . . . . . 1,051,884 1,233,09095,208 Eversource Energy . . . . . . . . . . . . 1,695,895 5,780,07834,000 Hawaiian Electric Industries
Inc. . . . . . . . . . . . . . . . . . . . . . . . . 794,771 1,100,920401,000 Hera SpA . . . . . . . . . . . . . . . . . . . . . 792,954 1,225,61610,000 Hokkaido Electric Power Co.
Inc. . . . . . . . . . . . . . . . . . . . . . . . . 107,280 76,10624,000 Hokuriku Electric Power Co.. . . 386,941 216,15545,000 Iberdrola SA, ADR . . . . . . . . . . . . 952,490 1,427,625
127,000 Korea Electric Power Corp.,ADR . . . . . . . . . . . . . . . . . . . . . . . 1,758,452 2,282,190
44,000 Kyushu Electric Power Co.Inc. . . . . . . . . . . . . . . . . . . . . . . . . 692,790 533,594
29,000 MGE Energy Inc. . . . . . . . . . . . . . . 621,355 1,866,15055,000 NextEra Energy Inc. . . . . . . . . . . . 2,834,957 7,707,15049,000 NiSource Inc. . . . . . . . . . . . . . . . . . 397,054 1,242,64057,500 OGE Energy Corp.. . . . . . . . . . . . . 685,360 2,000,42514,000 Ormat Technologies Inc. . . . . . . 210,000 821,52030,000 Public Service Enterprise
Group Inc. . . . . . . . . . . . . . . . . . 906,080 1,290,300
The Gabelli Dividend & Income TrustSchedule of Investments (Continued) — June 30, 2017 (Unaudited)
See accompanying notes to financial statements.
4

Shares CostMarketValue
COMMON STOCKS (Continued)Energy and Utilities: Integrated (Continued)
58,000 Shikoku Electric Power Co.Inc. . . . . . . . . . . . . . . . . . . . . . . . . $ 1,066,813 $ 682,747
50,000 The Chugoku Electric PowerCo. Inc. . . . . . . . . . . . . . . . . . . . . 851,464 550,789
20,000 The Kansai Electric Power Co.Inc. . . . . . . . . . . . . . . . . . . . . . . . . 278,704 275,083
45,000 Tohoku Electric Power Co.Inc. . . . . . . . . . . . . . . . . . . . . . . . . 663,612 622,138
28,000 Vectren Corp. . . . . . . . . . . . . . . . . . 787,543 1,636,32075,000 Westar Energy Inc.. . . . . . . . . . . . 1,972,641 3,976,500
26,777,689 43,070,649
Energy and Utilities: Natural Gas — 1.5%50,000 Delta Natural Gas Co. Inc. . . . . . 667,803 1,523,500
100,000 Kinder Morgan Inc. . . . . . . . . . . . 2,966,565 1,916,000306,000 National Fuel Gas Co. . . . . . . . . . 9,107,495 17,087,04036,666 National Grid plc . . . . . . . . . . . . . . 574,588 454,54024,750 National Grid plc, ADR . . . . . . . . 1,223,561 1,554,79514,000 ONEOK Inc.. . . . . . . . . . . . . . . . . . . 699,820 730,24083,000 Sempra Energy . . . . . . . . . . . . . . . 2,552,631 9,358,25030,000 South Jersey Industries Inc.. . . 476,644 1,025,10044,000 Southwest Gas Holdings Inc. . . 1,159,950 3,214,640
19,429,057 36,864,105
Energy and Utilities: Oil — 5.4%119,000 Anadarko Petroleum Corp. . . . . 7,318,527 5,395,46040,000 Apache Corp. . . . . . . . . . . . . . . . . . 2,708,043 1,917,200
153,000 BP plc, ADR . . . . . . . . . . . . . . . . . . 5,505,679 5,301,45010,121 California Resources Corp.†. . . 192,071 86,53535,000 Chesapeake Energy Corp.† . . . . 551,306 173,950
163,000 Chevron Corp. . . . . . . . . . . . . . . . . 13,118,648 17,005,790238,700 ConocoPhillips . . . . . . . . . . . . . . . 12,369,479 10,493,25285,000 Devon Energy Corp.. . . . . . . . . . . 4,774,463 2,717,450
130,000 Eni SpA, ADR. . . . . . . . . . . . . . . . . 4,844,846 3,907,800158,000 Exxon Mobil Corp. . . . . . . . . . . . . 10,466,704 12,755,34047,000 Hess Corp. . . . . . . . . . . . . . . . . . . . 2,031,593 2,061,890
250,000 Marathon Oil Corp.. . . . . . . . . . . . 5,838,400 2,962,500260,000 Marathon Petroleum Corp. . . . . 6,333,587 13,605,80079,000 Murphy Oil Corp. . . . . . . . . . . . . . 3,520,300 2,024,770
200,000 Occidental Petroleum Corp. . . . 9,904,047 11,974,000200 PetroChina Co. Ltd., ADR . . . . . 12,118 12,256
20,000 Petroleo Brasileiro SA, ADR†. . 266,014 159,800128,000 Phillips 66 . . . . . . . . . . . . . . . . . . . . 10,180,010 10,584,320200,000 Repsol SA, ADR . . . . . . . . . . . . . . 4,155,562 3,082,000230,000 Royal Dutch Shell plc, Cl. A,
ADR . . . . . . . . . . . . . . . . . . . . . . . 11,514,731 12,233,700530,000 Statoil ASA, ADR . . . . . . . . . . . . . 8,630,341 8,760,900145,000 Total SA, ADR . . . . . . . . . . . . . . . . 6,538,739 7,190,550
130,775,208 134,406,713
Shares CostMarketValue
Energy and Utilities: Services — 1.9%52,000 ABB Ltd., ADR . . . . . . . . . . . . . . . . $ 566,254 $ 1,294,800
115,000 Baker Hughes Inc. . . . . . . . . . . . . 6,976,437 6,268,65040,000 Diamond Offshore Drilling
Inc.† . . . . . . . . . . . . . . . . . . . . . . . 1,549,169 433,200395,000 Halliburton Co. . . . . . . . . . . . . . . . 14,840,957 16,870,45049,000 Oceaneering International Inc.. 1,198,537 1,119,160
162,000 Schlumberger Ltd. . . . . . . . . . . . . 7,780,671 10,666,08015,000 Seventy Seven Energy Inc.† . . . 0 0
2,562,000 Weatherford Internationalplc†. . . . . . . . . . . . . . . . . . . . . . . . 23,975,338 9,914,940
56,887,363 46,567,280
Energy and Utilities: Water — 0.4%12,000 American States Water Co. . . . . 150,968 568,92035,000 American Water Works Co.
Inc. . . . . . . . . . . . . . . . . . . . . . . . . 830,899 2,728,25074,000 Aqua America Inc. . . . . . . . . . . . . 998,965 2,464,20050,000 Mueller Water Products Inc.,
Cl. A . . . . . . . . . . . . . . . . . . . . . . . 567,098 584,00030,000 Severn Trent plc . . . . . . . . . . . . . . 764,139 852,58831,000 SJW Group . . . . . . . . . . . . . . . . . . . 548,204 1,524,580
8,000 The York Water Co. . . . . . . . . . . . 104,289 278,8006,000 United Utilities Group plc,
ADR . . . . . . . . . . . . . . . . . . . . . . . 168,600 138,3604,133,162 9,139,698
Entertainment — 2.0%8,981 Liberty Media Corp.-
Liberty Braves, Cl. C†. . . . . . . 137,575 215,27510,000 Live Nation Entertainment
Inc.† . . . . . . . . . . . . . . . . . . . . . . . 274,452 348,50028,000 Take-Two Interactive Software
Inc.† . . . . . . . . . . . . . . . . . . . . . . . 274,447 2,054,64032,233 The Madison Square Garden
Co, Cl. A† . . . . . . . . . . . . . . . . . . 1,620,528 6,346,678185,000 Time Warner Inc. . . . . . . . . . . . . . 7,585,296 18,575,850183,000 Twenty-First Century Fox Inc.,
Cl. A . . . . . . . . . . . . . . . . . . . . . . . 5,810,055 5,186,220248,000 Twenty-First Century Fox Inc.,
Cl. B . . . . . . . . . . . . . . . . . . . . . . . 6,792,393 6,911,7608,000 Viacom Inc., Cl. A. . . . . . . . . . . . . 355,600 304,400
165,000 Viacom Inc., Cl. B. . . . . . . . . . . . . 7,721,835 5,539,050180,000 Vivendi SA. . . . . . . . . . . . . . . . . . . . 4,656,757 4,006,899
35,228,938 49,489,272
Environmental Services — 1.7%225,000 Republic Services Inc. . . . . . . . . 7,892,835 14,339,25023,000 Veolia Environnement SA . . . . . 275,698 485,986
146,870 Waste Connections Inc. . . . . . . . 4,580,976 9,461,333260,000 Waste Management Inc. . . . . . . 10,116,612 19,071,000
22,866,121 43,357,569
The Gabelli Dividend & Income TrustSchedule of Investments (Continued) — June 30, 2017 (Unaudited)
See accompanying notes to financial statements.
5
Shares CostMarketValue
COMMON STOCKS (Continued)Equipment and Supplies — 1.7%
92,000 CIRCOR International Inc. . . . . . $ 2,307,769 $ 5,462,96040,000 Flowserve Corp. . . . . . . . . . . . . . . 1,937,855 1,857,20055,000 Graco Inc. . . . . . . . . . . . . . . . . . . . . 3,009,892 6,010,400
164,000 Mueller Industries Inc. . . . . . . . . 3,555,087 4,993,800598,000 RPC Inc.. . . . . . . . . . . . . . . . . . . . . . 2,837,635 12,085,580130,000 Sealed Air Corp. . . . . . . . . . . . . . . 3,131,382 5,818,80050,000 Tenaris SA, ADR . . . . . . . . . . . . . . 2,047,967 1,557,00094,000 The Timken Co. . . . . . . . . . . . . . . . 3,525,103 4,347,500
22,352,690 42,133,240
Financial Services — 18.8%8,000 Alleghany Corp.† . . . . . . . . . . . . . 2,949,449 4,758,400
492,000 American Express Co.. . . . . . . . . 27,652,382 41,446,080572,000 American International Group
Inc. . . . . . . . . . . . . . . . . . . . . . . . . 27,797,851 35,761,440310,000 Bank of America Corp. . . . . . . . . 2,043,743 7,520,60013,000 Berkshire Hathaway Inc.,
Cl. B† . . . . . . . . . . . . . . . . . . . . . . 1,551,035 2,201,81050,000 Blackhawk Network Holdings
Inc.† . . . . . . . . . . . . . . . . . . . . . . . 1,166,363 2,180,00020,000 BlackRock Inc.. . . . . . . . . . . . . . . . 3,031,089 8,448,200
110,000 Citigroup Inc. . . . . . . . . . . . . . . . . . 4,429,104 7,356,80024,229 Cohen & Steers Inc. . . . . . . . . . . 981,095 982,24429,000 Cullen/Frost Bankers Inc.. . . . . . 2,169,036 2,723,3901,500 EXOR NV . . . . . . . . . . . . . . . . . . . . . 65,945 81,1903,000 FCB Financial Holdings Inc.,
Cl. A† . . . . . . . . . . . . . . . . . . . . . . 137,615 143,250283,342 Fifth Street Finance Corp. . . . . . 1,909,648 1,377,04295,000 FNF Group. . . . . . . . . . . . . . . . . . . . 1,441,104 4,258,85030,000 FNFV Group† . . . . . . . . . . . . . . . . . 182,958 474,000
275,000 H&R Block Inc. . . . . . . . . . . . . . . . 6,393,071 8,500,25045,000 HRG Group Inc.† . . . . . . . . . . . . . 730,648 796,95037,000 HSBC Holdings plc, ADR . . . . . . 2,070,772 1,716,43060,000 Interactive Brokers Group Inc.,
Cl. A . . . . . . . . . . . . . . . . . . . . . . . 2,276,489 2,245,200200,000 Invesco Ltd. . . . . . . . . . . . . . . . . . . 4,757,439 7,038,000580,000 JPMorgan Chase & Co. . . . . . . . 25,067,078 53,012,000136,000 KeyCorp. . . . . . . . . . . . . . . . . . . . . . 2,050,530 2,548,64030,000 Kinnevik AB, Cl. B. . . . . . . . . . . . . 663,872 918,37189,250 KKR & Co. LP . . . . . . . . . . . . . . . . 1,829,625 1,660,050
521,000 Legg Mason Inc. . . . . . . . . . . . . . . 15,513,876 19,881,36042,000 M&T Bank Corp. . . . . . . . . . . . . . . 2,747,488 6,801,900
250,000 Morgan Stanley. . . . . . . . . . . . . . . 4,849,899 11,140,00072,000 National Australia Bank Ltd.,
ADR . . . . . . . . . . . . . . . . . . . . . . . 854,233 819,720190,000 Navient Corp. . . . . . . . . . . . . . . . . . 1,534,624 3,163,500170,000 New York Community Bancorp
Inc. . . . . . . . . . . . . . . . . . . . . . . . . 2,844,696 2,232,100114,000 Northern Trust Corp. . . . . . . . . . . 5,341,292 11,081,940195,000 PayPal Holdings Inc.†. . . . . . . . . 6,480,673 10,465,65055,000 Resona Holdings Inc. . . . . . . . . . 250,738 302,445
Shares CostMarketValue
205,000 SLM Corp.† . . . . . . . . . . . . . . . . . . $ 1,044,610 $ 2,357,500224,000 State Street Corp. . . . . . . . . . . . . . 10,858,356 20,099,520268,000 T. Rowe Price Group Inc.. . . . . . 15,872,069 19,888,280899,000 The Bank of New York Mellon
Corp. . . . . . . . . . . . . . . . . . . . . . . 27,988,231 45,866,9802,000 The Goldman Sachs Group
Inc. . . . . . . . . . . . . . . . . . . . . . . . . 312,050 443,800160,000 The Hartford Financial
Services Group Inc. . . . . . . . . 5,305,199 8,411,200289,000 The PNC Financial Services
Group Inc. . . . . . . . . . . . . . . . . . 18,336,513 36,087,430122,000 The Travelers Companies Inc. . 7,437,471 15,436,660
115 Trisura Group Ltd.† . . . . . . . . . . . 1,337 1,91665,000 U.S. Bancorp . . . . . . . . . . . . . . . . . 2,095,199 3,374,80055,000 W. R. Berkley Corp. . . . . . . . . . . . 2,149,943 3,804,350
550,000 Waddell & Reed Financial Inc.,Cl. A . . . . . . . . . . . . . . . . . . . . . . . 10,188,445 10,384,000
644,000 Wells Fargo & Co. . . . . . . . . . . . . 21,955,795 35,684,0406,000 Willis Towers Watson plc. . . . . . 477,521 872,760
287,788,199 466,751,038
Food and Beverage — 14.2%8,000 Ajinomoto Co. Inc. . . . . . . . . . . . . 137,110 172,589
10,000 Brown-Forman Corp., Cl. B. . . . 341,437 486,000115,000 Campbell Soup Co. . . . . . . . . . . . 3,812,255 5,997,250
1,000,000 China Mengniu Dairy Co. Ltd. . 1,245,706 1,959,66766,000 Chr. Hansen Holding A/S . . . . . . 2,705,045 4,800,203
405,000 Conagra Brands Inc. . . . . . . . . . . 11,504,070 14,482,80030,500 Constellation Brands Inc.,
Cl. A . . . . . . . . . . . . . . . . . . . . . . . 632,029 5,908,765237,222 Danone SA . . . . . . . . . . . . . . . . . . . 11,894,472 17,830,801
3,900,000 Davide Campari-Milano SpA. . . 11,190,086 27,483,61080,000 Diageo plc, ADR . . . . . . . . . . . . . . 8,745,265 9,586,400
170,000 Dr Pepper Snapple Group Inc.. 5,524,070 15,488,70070,954 Flowers Foods Inc.. . . . . . . . . . . . 1,053,433 1,228,214
439,000 General Mills Inc. . . . . . . . . . . . . . 16,811,065 24,320,60018,000 Heineken Holding NV . . . . . . . . . 747,987 1,649,839
279,000 ITO EN Ltd. . . . . . . . . . . . . . . . . . . . 6,134,333 10,170,260120,000 Kellogg Co. . . . . . . . . . . . . . . . . . . . 7,879,236 8,335,200370,000 Kikkoman Corp.. . . . . . . . . . . . . . . 4,412,978 11,809,735340,000 Lamb Weston Holdings Inc. . . . 10,564,020 14,973,600115,000 Maple Leaf Foods Inc.. . . . . . . . . 2,167,576 2,903,378
1,000 McCormick & Co. Inc., Cl. V. . . 101,660 97,630863,000 Mondelez International Inc.,
Cl. A . . . . . . . . . . . . . . . . . . . . . . . 24,068,433 37,272,970150,000 Morinaga Milk Industry Co.
Ltd. . . . . . . . . . . . . . . . . . . . . . . . . 588,860 1,141,5872,000 National Beverage Corp.. . . . . . . 163,804 187,120
38,000 Nestlé SA. . . . . . . . . . . . . . . . . . . . . 2,601,131 3,307,01835,000 Nestlé SA, ADR . . . . . . . . . . . . . . . 2,563,158 3,052,000
160,000 Nissin Foods Holdings Co.Ltd. . . . . . . . . . . . . . . . . . . . . . . . . 5,465,019 9,986,219
The Gabelli Dividend & Income TrustSchedule of Investments (Continued) — June 30, 2017 (Unaudited)
See accompanying notes to financial statements.
6
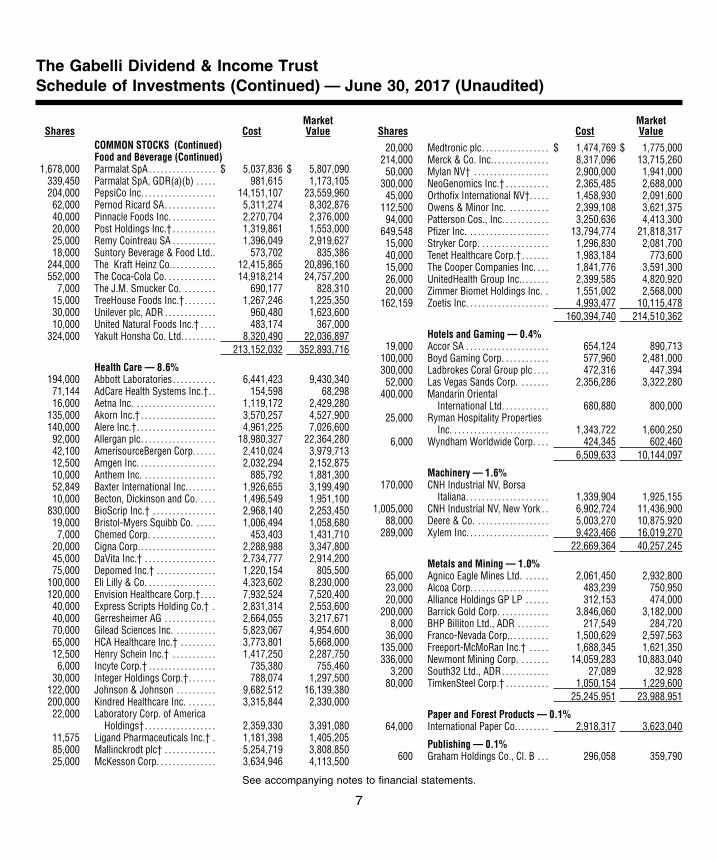
Shares CostMarketValue
COMMON STOCKS (Continued)Food and Beverage (Continued)
1,678,000 Parmalat SpA . . . . . . . . . . . . . . . . . $ 5,037,836 $ 5,807,090339,450 Parmalat SpA, GDR(a)(b) . . . . . 981,615 1,173,105204,000 PepsiCo Inc. . . . . . . . . . . . . . . . . . . 14,151,107 23,559,96062,000 Pernod Ricard SA. . . . . . . . . . . . . 5,311,274 8,302,87640,000 Pinnacle Foods Inc. . . . . . . . . . . . 2,270,704 2,376,00020,000 Post Holdings Inc.† . . . . . . . . . . . 1,319,861 1,553,00025,000 Remy Cointreau SA . . . . . . . . . . . 1,396,049 2,919,62718,000 Suntory Beverage & Food Ltd.. 573,702 835,386
244,000 The Kraft Heinz Co.. . . . . . . . . . . 12,415,865 20,896,160552,000 The Coca-Cola Co. . . . . . . . . . . . . 14,918,214 24,757,200
7,000 The J.M. Smucker Co. . . . . . . . . 690,177 828,31015,000 TreeHouse Foods Inc.†. . . . . . . . 1,267,246 1,225,35030,000 Unilever plc, ADR . . . . . . . . . . . . . 960,480 1,623,60010,000 United Natural Foods Inc.† . . . . 483,174 367,000
324,000 Yakult Honsha Co. Ltd. . . . . . . . . 8,320,490 22,036,897213,152,032 352,893,716
Health Care — 8.6%194,000 Abbott Laboratories. . . . . . . . . . . 6,441,423 9,430,34071,144 AdCare Health Systems Inc.†. . 154,598 68,29816,000 Aetna Inc. . . . . . . . . . . . . . . . . . . . . 1,119,172 2,429,280
135,000 Akorn Inc.† . . . . . . . . . . . . . . . . . . . 3,570,257 4,527,900140,000 Alere Inc.†. . . . . . . . . . . . . . . . . . . . 4,961,225 7,026,60092,000 Allergan plc. . . . . . . . . . . . . . . . . . . 18,980,327 22,364,28042,100 AmerisourceBergen Corp. . . . . . 2,410,024 3,979,71312,500 Amgen Inc. . . . . . . . . . . . . . . . . . . . 2,032,294 2,152,87510,000 Anthem Inc. . . . . . . . . . . . . . . . . . . 885,792 1,881,30052,849 Baxter International Inc.. . . . . . . 1,926,655 3,199,49010,000 Becton, Dickinson and Co. . . . . 1,496,549 1,951,100
830,000 BioScrip Inc.† . . . . . . . . . . . . . . . . 2,968,140 2,253,45019,000 Bristol-Myers Squibb Co. . . . . . 1,006,494 1,058,6807,000 Chemed Corp. . . . . . . . . . . . . . . . . 453,403 1,431,710
20,000 Cigna Corp.. . . . . . . . . . . . . . . . . . . 2,288,988 3,347,80045,000 DaVita Inc.† . . . . . . . . . . . . . . . . . . 2,734,777 2,914,20075,000 Depomed Inc.† . . . . . . . . . . . . . . . 1,220,154 805,500
100,000 Eli Lilly & Co. . . . . . . . . . . . . . . . . . 4,323,602 8,230,000120,000 Envision Healthcare Corp.†. . . . 7,932,524 7,520,40040,000 Express Scripts Holding Co.† . 2,831,314 2,553,60040,000 Gerresheimer AG . . . . . . . . . . . . . 2,664,055 3,217,67170,000 Gilead Sciences Inc. . . . . . . . . . . 5,823,067 4,954,60065,000 HCA Healthcare Inc.† . . . . . . . . . 3,773,801 5,668,00012,500 Henry Schein Inc.† . . . . . . . . . . . 1,417,250 2,287,7506,000 Incyte Corp.† . . . . . . . . . . . . . . . . . 735,380 755,460
30,000 Integer Holdings Corp.†. . . . . . . 788,074 1,297,500122,000 Johnson & Johnson . . . . . . . . . . 9,682,512 16,139,380200,000 Kindred Healthcare Inc. . . . . . . . 3,315,844 2,330,00022,000 Laboratory Corp. of America
Holdings†. . . . . . . . . . . . . . . . . . 2,359,330 3,391,08011,575 Ligand Pharmaceuticals Inc.† . 1,181,398 1,405,20585,000 Mallinckrodt plc† . . . . . . . . . . . . . 5,254,719 3,808,85025,000 McKesson Corp. . . . . . . . . . . . . . . 3,634,946 4,113,500
Shares CostMarketValue
20,000 Medtronic plc. . . . . . . . . . . . . . . . . $ 1,474,769 $ 1,775,000214,000 Merck & Co. Inc.. . . . . . . . . . . . . . 8,317,096 13,715,26050,000 Mylan NV† . . . . . . . . . . . . . . . . . . . 2,900,000 1,941,000
300,000 NeoGenomics Inc.† . . . . . . . . . . . 2,365,485 2,688,00045,000 Orthofix International NV†. . . . . 1,458,930 2,091,600
112,500 Owens & Minor Inc. . . . . . . . . . . 2,399,108 3,621,37594,000 Patterson Cos., Inc. . . . . . . . . . . . 3,250,636 4,413,300
649,548 Pfizer Inc. . . . . . . . . . . . . . . . . . . . . 13,794,774 21,818,31715,000 Stryker Corp. . . . . . . . . . . . . . . . . . 1,296,830 2,081,70040,000 Tenet Healthcare Corp.†. . . . . . . 1,983,184 773,60015,000 The Cooper Companies Inc. . . . 1,841,776 3,591,30026,000 UnitedHealth Group Inc.. . . . . . . 2,399,585 4,820,92020,000 Zimmer Biomet Holdings Inc. . 1,551,002 2,568,000
162,159 Zoetis Inc. . . . . . . . . . . . . . . . . . . . . 4,993,477 10,115,478160,394,740 214,510,362
Hotels and Gaming — 0.4%19,000 Accor SA . . . . . . . . . . . . . . . . . . . . . 654,124 890,713
100,000 Boyd Gaming Corp. . . . . . . . . . . . 577,960 2,481,000300,000 Ladbrokes Coral Group plc . . . . 472,316 447,39452,000 Las Vegas Sands Corp. . . . . . . . 2,356,286 3,322,280
400,000 Mandarin OrientalInternational Ltd. . . . . . . . . . . . 680,880 800,000
25,000 Ryman Hospitality PropertiesInc. . . . . . . . . . . . . . . . . . . . . . . . . 1,343,722 1,600,250
6,000 Wyndham Worldwide Corp. . . . 424,345 602,4606,509,633 10,144,097
Machinery — 1.6%170,000 CNH Industrial NV, Borsa
Italiana. . . . . . . . . . . . . . . . . . . . . 1,339,904 1,925,1551,005,000 CNH Industrial NV, New York . . 6,902,724 11,436,900
88,000 Deere & Co. . . . . . . . . . . . . . . . . . . 5,003,270 10,875,920289,000 Xylem Inc. . . . . . . . . . . . . . . . . . . . . 9,423,466 16,019,270
22,669,364 40,257,245
Metals and Mining — 1.0%65,000 Agnico Eagle Mines Ltd. . . . . . . 2,061,450 2,932,80023,000 Alcoa Corp. . . . . . . . . . . . . . . . . . . . 483,239 750,95020,000 Alliance Holdings GP LP . . . . . . 312,153 474,000
200,000 Barrick Gold Corp. . . . . . . . . . . . . 3,846,060 3,182,0008,000 BHP Billiton Ltd., ADR . . . . . . . . 217,549 284,720
36,000 Franco-Nevada Corp.. . . . . . . . . . 1,500,629 2,597,563135,000 Freeport-McMoRan Inc.† . . . . . 1,688,345 1,621,350336,000 Newmont Mining Corp. . . . . . . . 14,059,283 10,883,040
3,200 South32 Ltd., ADR. . . . . . . . . . . . 27,089 32,92880,000 TimkenSteel Corp.† . . . . . . . . . . . 1,050,154 1,229,600
25,245,951 23,988,951
Paper and Forest Products — 0.1%64,000 International Paper Co.. . . . . . . . 2,918,317 3,623,040
Publishing — 0.1%600 Graham Holdings Co., Cl. B . . . 296,058 359,790
The Gabelli Dividend & Income TrustSchedule of Investments (Continued) — June 30, 2017 (Unaudited)
See accompanying notes to financial statements.
7

Shares CostMarketValue
COMMON STOCKS (Continued)Publishing (Continued)
107,000 News Corp., Cl. B . . . . . . . . . . . . . $ 1,606,462 $ 1,514,0501,902,520 1,873,840
Real Estate — 0.4%19,500 Brookfield Asset Management
Inc., Cl. A . . . . . . . . . . . . . . . . . . 132,340 764,59574,000 Crown Castle International
Corp. . . . . . . . . . . . . . . . . . . . . . . 2,702,072 7,413,32018,000 Forest City Realty Trust Inc.,
Cl. A . . . . . . . . . . . . . . . . . . . . . . . 439,998 435,06016,000 QTS Realty Trust Inc., Cl. A. . . . 347,357 837,28024,000 Uniti Group Inc.† . . . . . . . . . . . . . 621,892 603,36025,000 Weyerhaeuser Co. . . . . . . . . . . . . 797,792 837,500
5,041,451 10,891,115
Retail — 4.3%105,000 AutoNation Inc.†. . . . . . . . . . . . . . 5,157,037 4,426,800381,000 CVS Health Corp. . . . . . . . . . . . . . 21,567,221 30,655,260260,000 Hertz Global Holdings Inc.† . . . 8,013,175 2,990,000135,000 Ingles Markets Inc., Cl. A. . . . . . 2,134,014 4,495,500
5,181 J Alexander’s Holdings Inc.† . . 29,780 63,46750,000 Kate Spade & Co.†. . . . . . . . . . . . 924,000 924,50025,000 Kohl’s Corp. . . . . . . . . . . . . . . . . . . 1,268,182 966,75090,000 Lowe’s Companies Inc. . . . . . . . 2,027,654 6,977,700
118,000 Macy’s Inc. . . . . . . . . . . . . . . . . . . . 1,938,053 2,742,32040,000 Murphy USA Inc.† . . . . . . . . . . . . 1,594,399 2,964,400
225,000 Rite Aid Corp.† . . . . . . . . . . . . . . . 1,781,128 663,75025,000 Rush Enterprises Inc., Cl. B† . . 599,173 910,250
275,000 Sally Beauty Holdings Inc.† . . . 4,365,683 5,568,750120,000 Seven & i Holdings Co. Ltd. . . . 3,637,248 4,937,63180,000 Starbucks Corp. . . . . . . . . . . . . . . 4,372,640 4,664,80040,000 The Home Depot Inc. . . . . . . . . . 1,491,260 6,136,00010,000 The Kroger Co. . . . . . . . . . . . . . . . 210,500 233,200
188,500 Walgreens Boots Alliance Inc. . 7,935,183 14,761,43520,000 Wal-Mart Stores Inc. . . . . . . . . . . 970,066 1,513,600
253,000 Whole Foods Market Inc.. . . . . . 7,985,835 10,653,83078,002,231 107,249,943
Specialty Chemicals — 2.1%8,880 AdvanSix Inc.† . . . . . . . . . . . . . . . 169,963 277,411
35,000 Air Products & Chemicals Inc.. 3,102,394 5,007,10058,000 Ashland Global Holdings Inc. . . 1,640,197 3,822,7801,000 Axalta Coating Systems Ltd.† . 25,039 32,040
162,000 E. I. du Pont de Nemours andCo. . . . . . . . . . . . . . . . . . . . . . . . . 9,210,164 13,075,020
460,000 Ferro Corp.† . . . . . . . . . . . . . . . . . . 3,141,173 8,413,40035,000 International Flavors &
Fragrances Inc.. . . . . . . . . . . . . 4,330,609 4,725,00089,000 Olin Corp. . . . . . . . . . . . . . . . . . . . . 1,629,332 2,694,920
5,000 Praxair Inc. . . . . . . . . . . . . . . . . . . . 556,243 662,7509,000 The Chemours Co. . . . . . . . . . . . . 58,593 341,280
Shares CostMarketValue
124,000 The Dow Chemical Co. . . . . . . . . $ 5,506,030 $ 7,820,680199,229 Valvoline Inc. . . . . . . . . . . . . . . . . . 2,597,142 4,725,712
31,966,879 51,598,093
Telecommunications — 3.9%260,000 AT&T Inc. . . . . . . . . . . . . . . . . . . . . 8,066,836 9,809,800225,000 BCE Inc. . . . . . . . . . . . . . . . . . . . . . . 5,904,845 10,134,000500,000 Deutsche Telekom AG, ADR . . . 8,506,922 9,007,50069,000 Harris Corp. . . . . . . . . . . . . . . . . . . 5,981,667 7,526,520
195,000 Hellenic TelecommunicationsOrganization SA, ADR . . . . . . 1,323,723 1,155,960
74,000 Loral Space & Communi-cations Inc.† . . . . . . . . . . . . . . . 3,109,618 3,074,700
50,000 Orange SA, ADR . . . . . . . . . . . . . . 1,066,612 799,00050,000 Pharol SGPS SA† . . . . . . . . . . . . . 14,182 17,41839,000 Proximus SA . . . . . . . . . . . . . . . . . 1,195,261 1,364,38150,084 Telefonica SA, ADR . . . . . . . . . . . 718,792 520,373
295,000 Telekom Austria AG . . . . . . . . . . . 1,968,837 2,318,11223,000 Telenet Group Holding NV†. . . . 1,046,305 1,448,763
150,000 Telephone & Data SystemsInc. . . . . . . . . . . . . . . . . . . . . . . . . 4,429,792 4,162,500
110,000 Telstra Corp. Ltd., ADR. . . . . . . . 2,014,389 1,817,200135,000 TELUS Corp.. . . . . . . . . . . . . . . . . . 1,405,698 4,660,20040,000 T-Mobile US Inc.†. . . . . . . . . . . . . 2,310,516 2,424,80040,000 VEON Ltd., ADR . . . . . . . . . . . . . . 230,241 156,400
710,086 Verizon Communications Inc. . 30,582,912 31,712,441191,545 Vodafone Group plc, ADR . . . . . 7,850,882 5,503,08830,000 Windstream Holdings Inc.. . . . . 147,865 116,400
87,875,895 97,729,556
Transportation — 0.7%30,000 Daseke Inc.†. . . . . . . . . . . . . . . . . . 267,000 333,900
239,000 GATX Corp. . . . . . . . . . . . . . . . . . . . 7,386,430 15,360,53016,500 Kansas City Southern . . . . . . . . . 277,030 1,726,725
7,930,460 17,421,155
Wireless Communications — 0.2%130,000 United States Cellular Corp.† . . 5,740,722 4,981,600
TOTAL COMMON STOCKS . . . . 1,615,860,251 2,396,099,033
CLOSED-END FUNDS — 0.1%55,000 Altaba Inc.†. . . . . . . . . . . . . . . . . . . 1,844,052 2,996,400
CONVERTIBLE PREFERRED STOCKS — 0.4%Energy and Utilities — 0.3%
128,000 El Paso Energy Capital Trust I,4.750% . . . . . . . . . . . . . . . . . . . 4,617,789 6,412,800
Telecommunications — 0.1%53,000 Cincinnati Bell Inc.,
6.750%, Ser. B . . . . . . . . . . . . 1,813,938 2,650,530
TOTAL CONVERTIBLEPREFERRED STOCKS . . . . . . 6,431,727 9,063,330
The Gabelli Dividend & Income TrustSchedule of Investments (Continued) — June 30, 2017 (Unaudited)
See accompanying notes to financial statements.
8
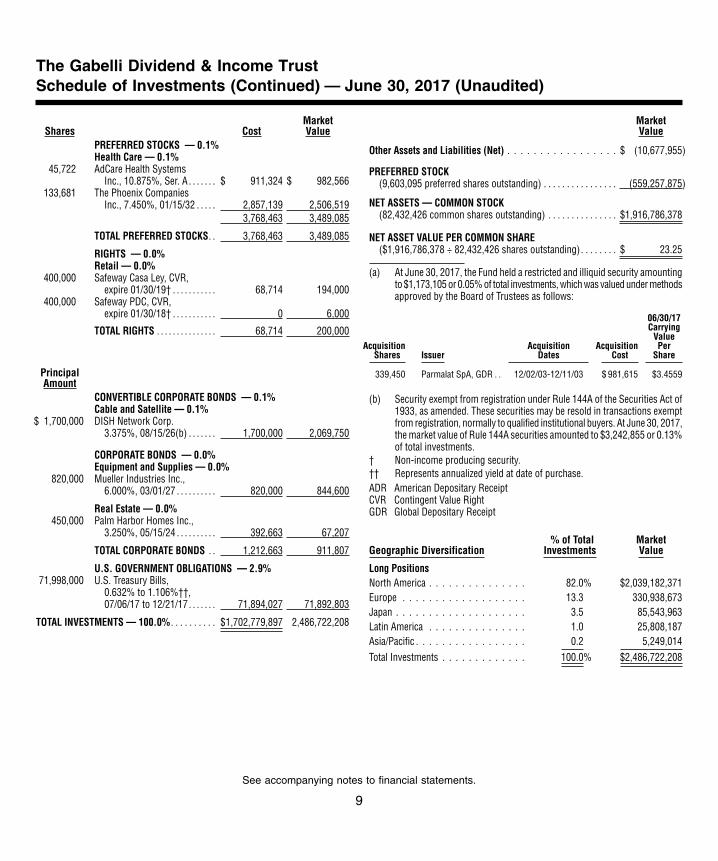
Shares CostMarketValue
PREFERRED STOCKS — 0.1%Health Care — 0.1%
45,722 AdCare Health SystemsInc., 10.875%, Ser. A . . . . . . . $ 911,324 $ 982,566
133,681 The Phoenix CompaniesInc., 7.450%, 01/15/32 . . . . . 2,857,139 2,506,519
3,768,463 3,489,085
TOTAL PREFERRED STOCKS. . 3,768,463 3,489,085
RIGHTS — 0.0%Retail — 0.0%
400,000 Safeway Casa Ley, CVR,expire 01/30/19† . . . . . . . . . . . 68,714 194,000
400,000 Safeway PDC, CVR,expire 01/30/18† . . . . . . . . . . . 0 6,000
TOTAL RIGHTS . . . . . . . . . . . . . . . 68,714 200,000
PrincipalAmount
CONVERTIBLE CORPORATE BONDS — 0.1%Cable and Satellite — 0.1%
$ 1,700,000 DISH Network Corp.3.375%, 08/15/26(b) . . . . . . . 1,700,000 2,069,750
CORPORATE BONDS — 0.0%Equipment and Supplies — 0.0%
820,000 Mueller Industries Inc.,6.000%, 03/01/27 . . . . . . . . . . 820,000 844,600
Real Estate — 0.0%450,000 Palm Harbor Homes Inc.,
3.250%, 05/15/24 . . . . . . . . . . 392,663 67,207
TOTAL CORPORATE BONDS . . 1,212,663 911,807
U.S. GOVERNMENT OBLIGATIONS — 2.9%71,998,000 U.S. Treasury Bills,
0.632% to 1.106%††,07/06/17 to 12/21/17. . . . . . . 71,894,027 71,892,803
TOTAL INVESTMENTS — 100.0% . . . . . . . . . . $1,702,779,897 2,486,722,208
MarketValue
Other Assets and Liabilities (Net) . . . . . . . . . . . . . . . . . $ (10,677,955)
PREFERRED STOCK(9,603,095 preferred shares outstanding) . . . . . . . . . . . . . . . . (559,257,875)
NET ASSETS — COMMON STOCK(82,432,426 common shares outstanding) . . . . . . . . . . . . . . . $1,916,786,378
NET ASSET VALUE PER COMMON SHARE($1,916,786,378 ÷ 82,432,426 shares outstanding). . . . . . . . $ 23.25
(a) At June 30, 2017, the Fund held a restricted and illiquid security amountingto $1,173,105 or 0.05% of total investments, which was valued under methodsapproved by the Board of Trustees as follows:
AcquisitionShares Issuer
AcquisitionDates
AcquisitionCost
06/30/17Carrying
ValuePer
Share
339,450 Parmalat SpA, GDR . . 12/02/03-12/11/03 $ 981,615 $3.4559
(b) Security exempt from registration under Rule 144A of the Securities Act of1933, as amended. These securities may be resold in transactions exemptfrom registration, normally to qualified institutional buyers. At June 30, 2017,the market value of Rule 144A securities amounted to $3,242,855 or 0.13%of total investments.
† Non-income producing security.†† Represents annualized yield at date of purchase.ADR American Depositary ReceiptCVR Contingent Value RightGDR Global Depositary Receipt
Geographic Diversification% of Total
InvestmentsMarketValue
Long PositionsNorth America . . . . . . . . . . . . . . . 82.0% $2,039,182,371Europe . . . . . . . . . . . . . . . . . . . 13.3 330,938,673Japan . . . . . . . . . . . . . . . . . . . . 3.5 85,543,963Latin America . . . . . . . . . . . . . . . 1.0 25,808,187Asia/Pacific . . . . . . . . . . . . . . . . . 0.2 5,249,014Total Investments . . . . . . . . . . . . . 100.0% $2,486,722,208
The Gabelli Dividend & Income TrustSchedule of Investments (Continued) — June 30, 2017 (Unaudited)
See accompanying notes to financial statements.
9
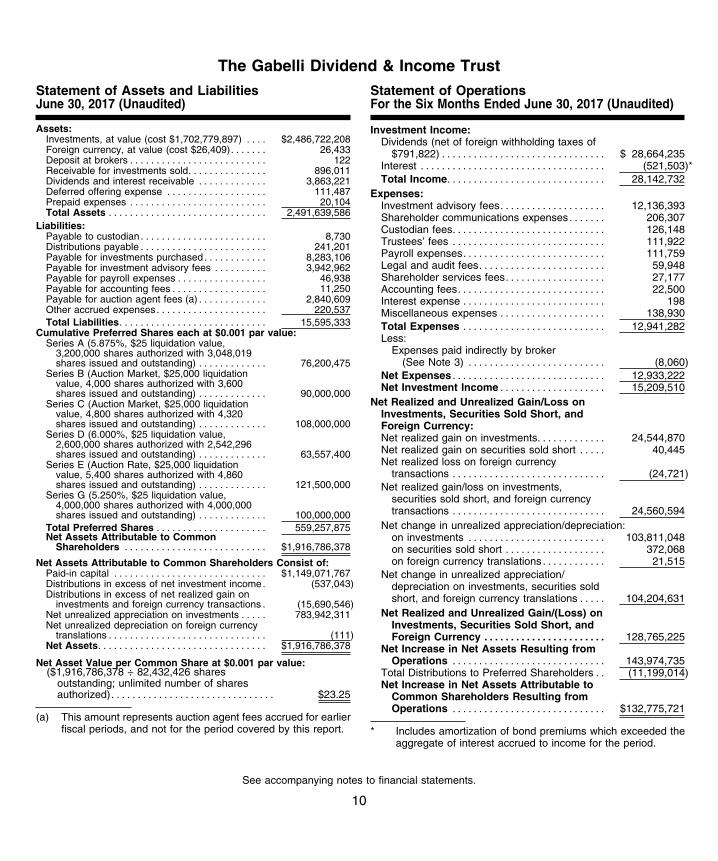
Assets:Investments, at value (cost $1,702,779,897) . . . . $2,486,722,208Foreign currency, at value (cost $26,409). . . . . . . 26,433Deposit at brokers . . . . . . . . . . . . . . . . . . . . . . . . . . 122Receivable for investments sold. . . . . . . . . . . . . . . 896,011Dividends and interest receivable . . . . . . . . . . . . . 3,863,221Deferred offering expense . . . . . . . . . . . . . . . . . . . 111,487Prepaid expenses . . . . . . . . . . . . . . . . . . . . . . . . . . 20,104Total Assets . . . . . . . . . . . . . . . . . . . . . . . . . . . . . . 2,491,639,586
Liabilities:Payable to custodian . . . . . . . . . . . . . . . . . . . . . . . . 8,730Distributions payable . . . . . . . . . . . . . . . . . . . . . . . . 241,201Payable for investments purchased . . . . . . . . . . . . 8,283,106Payable for investment advisory fees . . . . . . . . . . 3,942,962Payable for payroll expenses . . . . . . . . . . . . . . . . . 46,938Payable for accounting fees . . . . . . . . . . . . . . . . . . 11,250Payable for auction agent fees (a) . . . . . . . . . . . . . 2,840,609Other accrued expenses. . . . . . . . . . . . . . . . . . . . . 220,537Total Liabilities. . . . . . . . . . . . . . . . . . . . . . . . . . . . 15,595,333
Cumulative Preferred Shares each at $0.001 par value:Series A (5.875%, $25 liquidation value,
3,200,000 shares authorized with 3,048,019shares issued and outstanding) . . . . . . . . . . . . . 76,200,475
Series B (Auction Market, $25,000 liquidationvalue, 4,000 shares authorized with 3,600shares issued and outstanding) . . . . . . . . . . . . . 90,000,000
Series C (Auction Market, $25,000 liquidationvalue, 4,800 shares authorized with 4,320shares issued and outstanding) . . . . . . . . . . . . . 108,000,000
Series D (6.000%, $25 liquidation value,2,600,000 shares authorized with 2,542,296shares issued and outstanding) . . . . . . . . . . . . . 63,557,400
Series E (Auction Rate, $25,000 liquidationvalue, 5,400 shares authorized with 4,860shares issued and outstanding) . . . . . . . . . . . . . 121,500,000
Series G (5.250%, $25 liquidation value,4,000,000 shares authorized with 4,000,000shares issued and outstanding) . . . . . . . . . . . . . 100,000,000
Total Preferred Shares . . . . . . . . . . . . . . . . . . . . . 559,257,875Net Assets Attributable to Common
Shareholders . . . . . . . . . . . . . . . . . . . . . . . . . . . $1,916,786,378
Net Assets Attributable to Common Shareholders Consist of:Paid-in capital . . . . . . . . . . . . . . . . . . . . . . . . . . . . . $1,149,071,767Distributions in excess of net investment income. (537,043)Distributions in excess of net realized gain on
investments and foreign currency transactions . (15,690,546)Net unrealized appreciation on investments . . . . . 783,942,311Net unrealized depreciation on foreign currency
translations . . . . . . . . . . . . . . . . . . . . . . . . . . . . . . (111)Net Assets. . . . . . . . . . . . . . . . . . . . . . . . . . . . . . . . $1,916,786,378
Net Asset Value per Common Share at $0.001 par value:($1,916,786,378 ÷ 82,432,426 shares
outstanding; unlimited number of sharesauthorized). . . . . . . . . . . . . . . . . . . . . . . . . . . . . . . $23.25
(a) This amount represents auction agent fees accrued for earlierfiscal periods, and not for the period covered by this report.
Investment Income:Dividends (net of foreign withholding taxes of
$791,822) . . . . . . . . . . . . . . . . . . . . . . . . . . . . . . . $ 28,664,235Interest . . . . . . . . . . . . . . . . . . . . . . . . . . . . . . . . . . . (521,503)*Total Income. . . . . . . . . . . . . . . . . . . . . . . . . . . . . . 28,142,732
Expenses:Investment advisory fees. . . . . . . . . . . . . . . . . . . . 12,136,393Shareholder communications expenses . . . . . . . 206,307Custodian fees. . . . . . . . . . . . . . . . . . . . . . . . . . . . . 126,148Trustees’ fees . . . . . . . . . . . . . . . . . . . . . . . . . . . . . 111,922Payroll expenses. . . . . . . . . . . . . . . . . . . . . . . . . . . 111,759Legal and audit fees. . . . . . . . . . . . . . . . . . . . . . . . 59,948Shareholder services fees. . . . . . . . . . . . . . . . . . . 27,177Accounting fees. . . . . . . . . . . . . . . . . . . . . . . . . . . . 22,500Interest expense . . . . . . . . . . . . . . . . . . . . . . . . . . . 198Miscellaneous expenses . . . . . . . . . . . . . . . . . . . . 138,930Total Expenses . . . . . . . . . . . . . . . . . . . . . . . . . . . 12,941,282Less:
Expenses paid indirectly by broker(See Note 3) . . . . . . . . . . . . . . . . . . . . . . . . . . (8,060)
Net Expenses . . . . . . . . . . . . . . . . . . . . . . . . . . . . . 12,933,222Net Investment Income . . . . . . . . . . . . . . . . . . . . 15,209,510
Net Realized and Unrealized Gain/Loss onInvestments, Securities Sold Short, andForeign Currency:Net realized gain on investments. . . . . . . . . . . . . 24,544,870Net realized gain on securities sold short . . . . . 40,445Net realized loss on foreign currency
transactions . . . . . . . . . . . . . . . . . . . . . . . . . . . . . (24,721)Net realized gain/loss on investments,
securities sold short, and foreign currencytransactions . . . . . . . . . . . . . . . . . . . . . . . . . . . . . 24,560,594
Net change in unrealized appreciation/depreciation:on investments . . . . . . . . . . . . . . . . . . . . . . . . . . 103,811,048on securities sold short . . . . . . . . . . . . . . . . . . . 372,068on foreign currency translations . . . . . . . . . . . . 21,515
Net change in unrealized appreciation/depreciation on investments, securities soldshort, and foreign currency translations . . . . . 104,204,631
Net Realized and Unrealized Gain/(Loss) onInvestments, Securities Sold Short, andForeign Currency . . . . . . . . . . . . . . . . . . . . . . . 128,765,225
Net Increase in Net Assets Resulting fromOperations . . . . . . . . . . . . . . . . . . . . . . . . . . . . . 143,974,735
Total Distributions to Preferred Shareholders . . (11,199,014)Net Increase in Net Assets Attributable to
Common Shareholders Resulting fromOperations . . . . . . . . . . . . . . . . . . . . . . . . . . . . . $132,775,721
* Includes amortization of bond premiums which exceeded theaggregate of interest accrued to income for the period.
The Gabelli Dividend & Income Trust
Statement of Assets and LiabilitiesJune 30, 2017 (Unaudited)
Statement of OperationsFor the Six Months Ended June 30, 2017 (Unaudited)
See accompanying notes to financial statements.
10
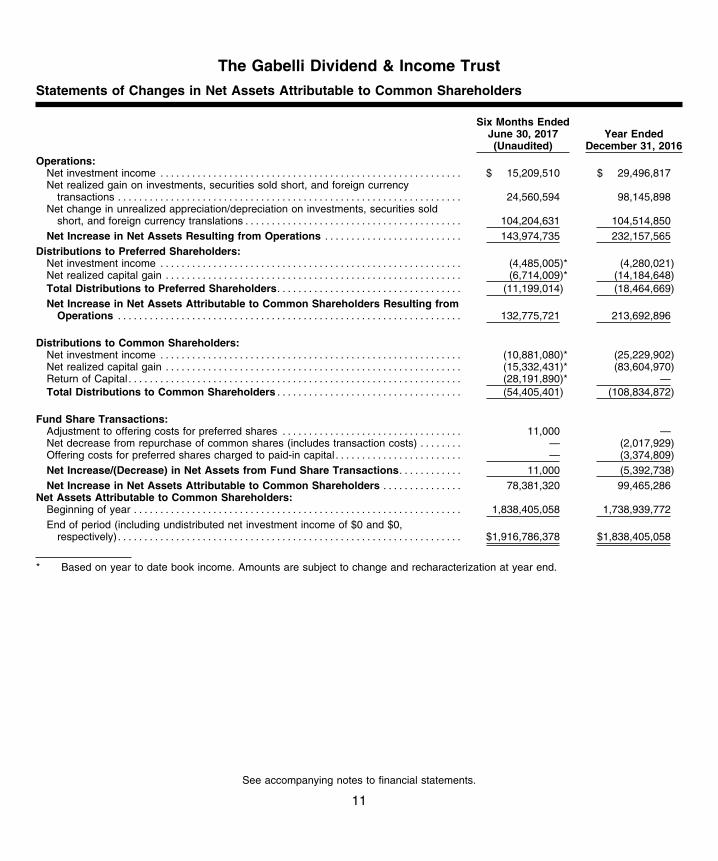
Six Months EndedJune 30, 2017(Unaudited)
Year EndedDecember 31, 2016
Operations:Net investment income . . . . . . . . . . . . . . . . . . . . . . . . . . . . . . . . . . . . . . . . . . . . . . . . . . . . . . . . . $ 15,209,510 $ 29,496,817Net realized gain on investments, securities sold short, and foreign currency
transactions . . . . . . . . . . . . . . . . . . . . . . . . . . . . . . . . . . . . . . . . . . . . . . . . . . . . . . . . . . . . . . . . . 24,560,594 98,145,898Net change in unrealized appreciation/depreciation on investments, securities sold
short, and foreign currency translations . . . . . . . . . . . . . . . . . . . . . . . . . . . . . . . . . . . . . . . . . 104,204,631 104,514,850Net Increase in Net Assets Resulting from Operations . . . . . . . . . . . . . . . . . . . . . . . . . . 143,974,735 232,157,565
Distributions to Preferred Shareholders:Net investment income . . . . . . . . . . . . . . . . . . . . . . . . . . . . . . . . . . . . . . . . . . . . . . . . . . . . . . . . . (4,485,005)* (4,280,021)Net realized capital gain . . . . . . . . . . . . . . . . . . . . . . . . . . . . . . . . . . . . . . . . . . . . . . . . . . . . . . . . (6,714,009)* (14,184,648)Total Distributions to Preferred Shareholders. . . . . . . . . . . . . . . . . . . . . . . . . . . . . . . . . . . (11,199,014) (18,464,669)Net Increase in Net Assets Attributable to Common Shareholders Resulting from
Operations . . . . . . . . . . . . . . . . . . . . . . . . . . . . . . . . . . . . . . . . . . . . . . . . . . . . . . . . . . . . . . . . . 132,775,721 213,692,896
Distributions to Common Shareholders:Net investment income . . . . . . . . . . . . . . . . . . . . . . . . . . . . . . . . . . . . . . . . . . . . . . . . . . . . . . . . . (10,881,080)* (25,229,902)Net realized capital gain . . . . . . . . . . . . . . . . . . . . . . . . . . . . . . . . . . . . . . . . . . . . . . . . . . . . . . . . (15,332,431)* (83,604,970)Return of Capital . . . . . . . . . . . . . . . . . . . . . . . . . . . . . . . . . . . . . . . . . . . . . . . . . . . . . . . . . . . . . . . (28,191,890)* —Total Distributions to Common Shareholders . . . . . . . . . . . . . . . . . . . . . . . . . . . . . . . . . . . (54,405,401) (108,834,872)
Fund Share Transactions:Adjustment to offering costs for preferred shares . . . . . . . . . . . . . . . . . . . . . . . . . . . . . . . . . . 11,000 —Net decrease from repurchase of common shares (includes transaction costs) . . . . . . . . — (2,017,929)Offering costs for preferred shares charged to paid-in capital . . . . . . . . . . . . . . . . . . . . . . . . — (3,374,809)Net Increase/(Decrease) in Net Assets from Fund Share Transactions. . . . . . . . . . . . 11,000 (5,392,738)Net Increase in Net Assets Attributable to Common Shareholders . . . . . . . . . . . . . . . 78,381,320 99,465,286
Net Assets Attributable to Common Shareholders:Beginning of year . . . . . . . . . . . . . . . . . . . . . . . . . . . . . . . . . . . . . . . . . . . . . . . . . . . . . . . . . . . . . . 1,838,405,058 1,738,939,772End of period (including undistributed net investment income of $0 and $0,
respectively) . . . . . . . . . . . . . . . . . . . . . . . . . . . . . . . . . . . . . . . . . . . . . . . . . . . . . . . . . . . . . . . . . $1,916,786,378 $1,838,405,058
* Based on year to date book income. Amounts are subject to change and recharacterization at year end.
The Gabelli Dividend & Income Trust
Statements of Changes in Net Assets Attributable to Common Shareholders
See accompanying notes to financial statements.
11

Six Months EndedJune 30, 2017 Year Ended December 31,(Unaudited) 2016 2015 2014 2013 2012
Operating Performance:Net asset value, beginning of year. . . . . . . . . . . . . . . . . . $ 22.30 $ 21.07 $ 23.57 $ 24.18 $ 18.58 $ 17.24Net investment income . . . . . . . . . . . . . . . . . . . . . . . . . 0.18 0.36 0.30 0.41 0.36 0.47Net realized and unrealized gain/(loss) on investments,
securities sold short, swap contracts, and foreigncurrency transactions. . . . . . . . . . . . . . . . . . . . . . . . . 1.56 2.45 (1.39) 1.54 6.45 2.00
Total from investment operations . . . . . . . . . . . . . . . . . . 1.74 2.81 (1.09) 1.95 6.81 2.47Distributions to Preferred Shareholders: (a)
Net investment income . . . . . . . . . . . . . . . . . . . . . . . . . (0.05)* (0.05) (0.06) (0.03) (0.05) (0.09)Net realized gain . . . . . . . . . . . . . . . . . . . . . . . . . . . . . . (0.08)* (0.17) (0.12) (0.15) (0.13) (0.08)Total distributions to preferred shareholders . . . . . . . . . . (0.13) (0.22) (0.18) (0.18) (0.18) (0.17)Net Increase in Net Assets Attributable to Common
Shareholders Resulting from Operations. . . . . . . . . . 1.61 2.59 (1.27) 1.77 6.63 2.30Distributions to Common Shareholders:
Net investment income . . . . . . . . . . . . . . . . . . . . . . . . . (0.13)* (0.31) (0.31) (0.39) (0.31) (0.37)Net realized gain . . . . . . . . . . . . . . . . . . . . . . . . . . . . . . (0.19)* (1.01) (0.65) (1.97) (0.72) (0.31)Return of capital . . . . . . . . . . . . . . . . . . . . . . . . . . . . . . (0.34)* — (0.28) (0.02) — (0.28)Total distributions to common shareholders . . . . . . . . . . (0.66) (1.32) (1.24) (2.38) (1.03) (0.96)
Fund Share Transactions:Increase in net asset value from repurchase of common
shares. . . . . . . . . . . . . . . . . . . . . . . . . . . . . . . . . . . . — 0.00(b) 0.01 — 0.00(b) 0.00(b)Offering costs and adjustment to offering costs for
preferred shares charged to paid-in capital . . . . . . . . . 0.00(b) (0.04) — — — —Total from Fund share transactions . . . . . . . . . . . . . . . . . 0.00 (0.04) 0.01 — 0.00(b) 0.00(b)Net Asset Value Attributable to Common Shareholders,
End of Period . . . . . . . . . . . . . . . . . . . . . . . . . . . . . . $ 23.25 $ 22.30 $ 21.07 $ 23.57 $ 24.18 $ 18.58NAV total return † . . . . . . . . . . . . . . . . . . . . . . . . . . . . . 7.30% 12.70% (5.59)% 7.48% 36.47% 14.40%Market value, end of period . . . . . . . . . . . . . . . . . . . . . . $ 21.82 $ 20.04 $ 18.46 $ 21.66 $ 22.17 $ 16.18Investment total return †† . . . . . . . . . . . . . . . . . . . . . . . 10.29% 16.47% (9.32)% 8.82% 44.38% 11.38%
Ratios to Average Net Assets and Supplemental Data:Net assets including liquidation value of preferred shares,
end of period (in 000’s) . . . . . . . . . . . . . . . . . . . . . . . $2,476,044 $2,397,663 $2,198,198 $2,410,290 $2,460,474 $1,998,057Net assets attributable to common shares, end of period
(in 000’s) . . . . . . . . . . . . . . . . . . . . . . . . . . . . . . . . . $1,916,786 $1,838,405 $1,738,940 $1,951,032 $2,001,217 $1,538,799Ratio of net investment income to average net assets
attributable to common shares before preferred sharedistributions . . . . . . . . . . . . . . . . . . . . . . . . . . . . . . . 1.62%(c) 1.69% 1.60% 1.71% 1.65% 2.62%
Ratio of operating expenses to average net assetsattributable to common shares before fees waived. . . . 1.38%(c)(d) 1.39%(d) 1.33%(d) 1.36% 1.34% 1.41%
Ratio of operating expenses to average net assetsattributable to common shares net of advisory feereduction, if any. . . . . . . . . . . . . . . . . . . . . . . . . . . . . 1.38%(c)(d) 1.39%(d) 1.09%(d) 1.36% 1.34% 1.41%
Ratio of operating expenses to average net assetsincluding liquidation value of preferred shares beforefees waived . . . . . . . . . . . . . . . . . . . . . . . . . . . . . . . . 1.07%(c)(d) 1.07%(d) 1.07%(d) 1.10% 1.07% 1.08%
Ratio of operating expenses to average net assetsincluding liquidation value of preferred shares net ofadvisory fee reduction, if any . . . . . . . . . . . . . . . . . . . 1.07%(c)(d) 1.07%(d) 0.88%(d) 1.10% 1.07% 1.08%
Portfolio turnover rate . . . . . . . . . . . . . . . . . . . . . . . . . . 5.1% 15.6% 8.1% 18.4% 15.8% 14.5%
The Gabelli Dividend & Income TrustFinancial Highlights
Selected data for a common share of beneficial interest outstanding throughout each period:
See accompanying notes to financial statements.
12
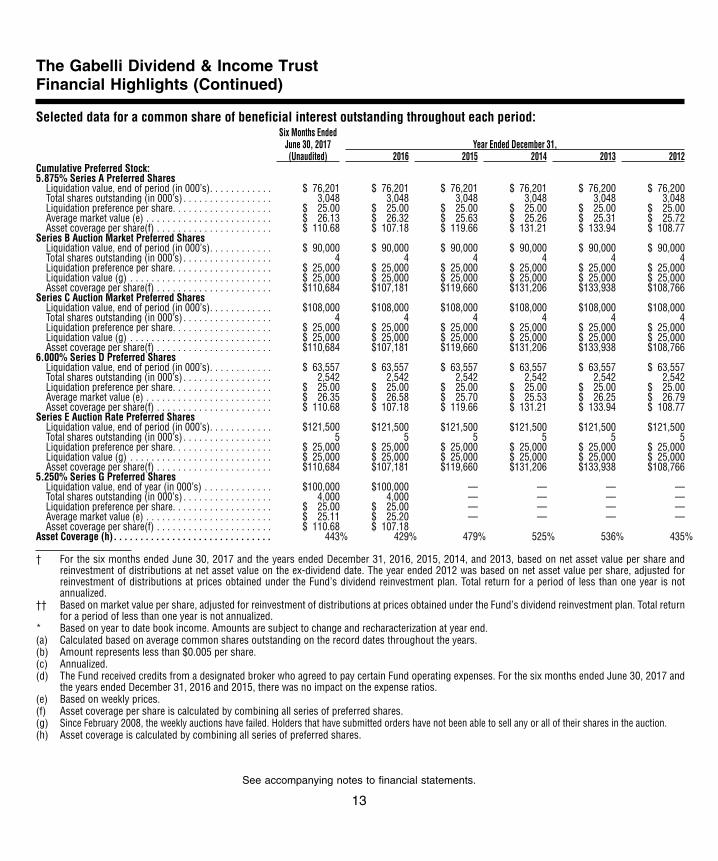
Six Months EndedJune 30, 2017 Year Ended December 31,(Unaudited) 2016 2015 2014 2013 2012
Cumulative Preferred Stock:5.875% Series A Preferred Shares
Liquidation value, end of period (in 000’s). . . . . . . . . . . . $ 76,201 $ 76,201 $ 76,201 $ 76,201 $ 76,200 $ 76,200Total shares outstanding (in 000’s) . . . . . . . . . . . . . . . . . 3,048 3,048 3,048 3,048 3,048 3,048Liquidation preference per share. . . . . . . . . . . . . . . . . . . $ 25.00 $ 25.00 $ 25.00 $ 25.00 $ 25.00 $ 25.00Average market value (e) . . . . . . . . . . . . . . . . . . . . . . . . $ 26.13 $ 26.32 $ 25.63 $ 25.26 $ 25.31 $ 25.72Asset coverage per share(f) . . . . . . . . . . . . . . . . . . . . . . $ 110.68 $ 107.18 $ 119.66 $ 131.21 $ 133.94 $ 108.77
Series B Auction Market Preferred SharesLiquidation value, end of period (in 000’s). . . . . . . . . . . . $ 90,000 $ 90,000 $ 90,000 $ 90,000 $ 90,000 $ 90,000Total shares outstanding (in 000’s) . . . . . . . . . . . . . . . . . 4 4 4 4 4 4Liquidation preference per share. . . . . . . . . . . . . . . . . . . $ 25,000 $ 25,000 $ 25,000 $ 25,000 $ 25,000 $ 25,000Liquidation value (g) . . . . . . . . . . . . . . . . . . . . . . . . . . . $ 25,000 $ 25,000 $ 25,000 $ 25,000 $ 25,000 $ 25,000Asset coverage per share(f) . . . . . . . . . . . . . . . . . . . . . . $110,684 $107,181 $119,660 $131,206 $133,938 $108,766
Series C Auction Market Preferred SharesLiquidation value, end of period (in 000’s). . . . . . . . . . . . $108,000 $108,000 $108,000 $108,000 $108,000 $108,000Total shares outstanding (in 000’s) . . . . . . . . . . . . . . . . . 4 4 4 4 4 4Liquidation preference per share. . . . . . . . . . . . . . . . . . . $ 25,000 $ 25,000 $ 25,000 $ 25,000 $ 25,000 $ 25,000Liquidation value (g) . . . . . . . . . . . . . . . . . . . . . . . . . . . $ 25,000 $ 25,000 $ 25,000 $ 25,000 $ 25,000 $ 25,000Asset coverage per share(f) . . . . . . . . . . . . . . . . . . . . . . $110,684 $107,181 $119,660 $131,206 $133,938 $108,766
6.000% Series D Preferred SharesLiquidation value, end of period (in 000’s). . . . . . . . . . . . $ 63,557 $ 63,557 $ 63,557 $ 63,557 $ 63,557 $ 63,557Total shares outstanding (in 000’s) . . . . . . . . . . . . . . . . . 2,542 2,542 2,542 2,542 2,542 2,542Liquidation preference per share. . . . . . . . . . . . . . . . . . . $ 25.00 $ 25.00 $ 25.00 $ 25.00 $ 25.00 $ 25.00Average market value (e) . . . . . . . . . . . . . . . . . . . . . . . . $ 26.35 $ 26.58 $ 25.70 $ 25.53 $ 26.25 $ 26.79Asset coverage per share(f) . . . . . . . . . . . . . . . . . . . . . . $ 110.68 $ 107.18 $ 119.66 $ 131.21 $ 133.94 $ 108.77
Series E Auction Rate Preferred SharesLiquidation value, end of period (in 000’s). . . . . . . . . . . . $121,500 $121,500 $121,500 $121,500 $121,500 $121,500Total shares outstanding (in 000’s) . . . . . . . . . . . . . . . . . 5 5 5 5 5 5Liquidation preference per share. . . . . . . . . . . . . . . . . . . $ 25,000 $ 25,000 $ 25,000 $ 25,000 $ 25,000 $ 25,000Liquidation value (g) . . . . . . . . . . . . . . . . . . . . . . . . . . . $ 25,000 $ 25,000 $ 25,000 $ 25,000 $ 25,000 $ 25,000Asset coverage per share(f) . . . . . . . . . . . . . . . . . . . . . . $110,684 $107,181 $119,660 $131,206 $133,938 $108,766
5.250% Series G Preferred SharesLiquidation value, end of year (in 000’s) . . . . . . . . . . . . . $100,000 $100,000 — — — —Total shares outstanding (in 000’s) . . . . . . . . . . . . . . . . . 4,000 4,000 — — — —Liquidation preference per share. . . . . . . . . . . . . . . . . . . $ 25.00 $ 25.00 — — — —Average market value (e) . . . . . . . . . . . . . . . . . . . . . . . . $ 25.11 $ 25.20 — — — —Asset coverage per share(f) . . . . . . . . . . . . . . . . . . . . . . $ 110.68 $ 107.18
Asset Coverage (h). . . . . . . . . . . . . . . . . . . . . . . . . . . . . . 443% 429% 479% 525% 536% 435%
† For the six months ended June 30, 2017 and the years ended December 31, 2016, 2015, 2014, and 2013, based on net asset value per share andreinvestment of distributions at net asset value on the ex-dividend date. The year ended 2012 was based on net asset value per share, adjusted forreinvestment of distributions at prices obtained under the Fund’s dividend reinvestment plan. Total return for a period of less than one year is notannualized.
†† Based on market value per share, adjusted for reinvestment of distributions at prices obtained under the Fund’s dividend reinvestment plan. Total returnfor a period of less than one year is not annualized.
* Based on year to date book income. Amounts are subject to change and recharacterization at year end.(a) Calculated based on average common shares outstanding on the record dates throughout the years.(b) Amount represents less than $0.005 per share.(c) Annualized.(d) The Fund received credits from a designated broker who agreed to pay certain Fund operating expenses. For the six months ended June 30, 2017 and
the years ended December 31, 2016 and 2015, there was no impact on the expense ratios.(e) Based on weekly prices.(f) Asset coverage per share is calculated by combining all series of preferred shares.(g) Since February 2008, the weekly auctions have failed. Holders that have submitted orders have not been able to sell any or all of their shares in the auction.(h) Asset coverage is calculated by combining all series of preferred shares.
The Gabelli Dividend & Income TrustFinancial Highlights (Continued)
Selected data for a common share of beneficial interest outstanding throughout each period:
See accompanying notes to financial statements.
13

1. Organization. The Gabelli Dividend & Income Trust (the “Fund”) currently operates as a diversified closed-endmanagement investment company organized as a Delaware statutory trust on November 18, 2003 and registeredunder the Investment Company Act of 1940, as amended (the “1940 Act”). Investment operations commencedon November 28, 2003.
The Fund’s investment objective is to provide a high level of total return on its assets with an emphasis ondividends and income. The Fund will attempt to achieve its investment objective by investing, under normalmarket conditions, at least 80% of its assets in dividend paying securities (such as common and preferredstock) or other income producing securities (such as fixed income debt securities and securities that are convertibleinto equity securities).
2. Significant Accounting Policies. As an investment company, the Fund follows the investment companyaccounting and reporting guidance, which is part of U.S. generally accepted accounting principles (“GAAP”)that may require the use of management estimates and assumptions in the preparation of its financial statements.Actual results could differ from those estimates. The following is a summary of significant accounting policiesfollowed by the Fund in the preparation of its financial statements.
Security Valuation. Portfolio securities listed or traded on a nationally recognized securities exchange or tradedin the U.S. over-the-counter market for which market quotations are readily available are valued at the lastquoted sale price or a market’s official closing price as of the close of business on the day the securities arebeing valued. If there were no sales that day, the security is valued at the average of the closing bid and askedprices or, if there were no asked prices quoted on that day, then the security is valued at the closing bid priceon that day. If no bid or asked prices are quoted on such day, the security is valued at the most recentlyavailable price or, if the Board of Trustees (the “Board”) so determines, by such other method as the Boardshall determine in good faith to reflect its fair market value. Portfolio securities traded on more than one nationalsecurities exchange or market are valued according to the broadest and most representative market, as determinedby Gabelli Funds, LLC (the “Adviser”).
Portfolio securities primarily traded on a foreign market are generally valued at the preceding closing valuesof such securities on the relevant market, but may be fair valued pursuant to procedures established by theBoard if market conditions change significantly after the close of the foreign market, but prior to the close ofbusiness on the day the securities are being valued. Debt obligations for which market quotations are readilyavailable are valued at the average of the latest bid and asked prices. If there were no asked prices quotedon such day, the security is valued using the closing bid price, unless the Board determines such amount doesnot reflect the securities’ fair value, in which case these securities will be fair valued as determined by theBoard. Certain securities are valued principally using dealer quotations. Futures contracts are valued at theclosing settlement price of the exchange or board of trade on which the applicable contract is traded. OTCfutures and options on futures for which market quotations are readily available will be valued by quotationsreceived from a pricing service or, if no quotations are available from a pricing service, by quotations obtainedfrom one or more dealers in the instrument in question by the Adviser.
Securities and assets for which market quotations are not readily available are fair valued as determined bythe Board. Fair valuation methodologies and procedures may include, but are not limited to: analysis and reviewof available financial and non-financial information about the company; comparisons with the valuation andchanges in valuation of similar securities, including a comparison of foreign securities with the equivalent U.S.
The Gabelli Dividend & Income TrustNotes to Financial Statements (Unaudited)
14
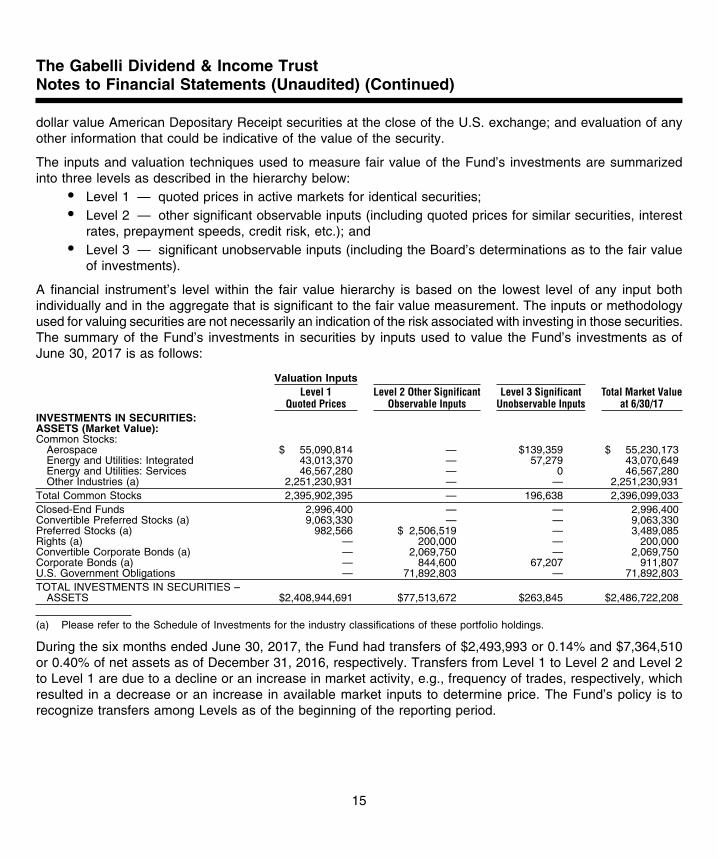
dollar value American Depositary Receipt securities at the close of the U.S. exchange; and evaluation of anyother information that could be indicative of the value of the security.
The inputs and valuation techniques used to measure fair value of the Fund’s investments are summarizedinto three levels as described in the hierarchy below:
• Level 1 — quoted prices in active markets for identical securities;• Level 2 — other significant observable inputs (including quoted prices for similar securities, interest
rates, prepayment speeds, credit risk, etc.); and• Level 3 — significant unobservable inputs (including the Board’s determinations as to the fair value
of investments).
A financial instrument’s level within the fair value hierarchy is based on the lowest level of any input bothindividually and in the aggregate that is significant to the fair value measurement. The inputs or methodologyused for valuing securities are not necessarily an indication of the risk associated with investing in those securities.The summary of the Fund’s investments in securities by inputs used to value the Fund’s investments as ofJune 30, 2017 is as follows:
Valuation InputsLevel 1
Quoted PricesLevel 2 Other Significant
Observable InputsLevel 3 Significant
Unobservable InputsTotal Market Value
at 6/30/17INVESTMENTS IN SECURITIES:ASSETS (Market Value):Common Stocks:
Aerospace $ 55,090,814 — $139,359 $ 55,230,173Energy and Utilities: Integrated 43,013,370 — 57,279 43,070,649Energy and Utilities: Services 46,567,280 — 0 46,567,280Other Industries (a) 2,251,230,931 — — 2,251,230,931
Total Common Stocks 2,395,902,395 — 196,638 2,396,099,033Closed-End Funds 2,996,400 — — 2,996,400Convertible Preferred Stocks (a) 9,063,330 — — 9,063,330Preferred Stocks (a) 982,566 $ 2,506,519 — 3,489,085Rights (a) — 200,000 — 200,000Convertible Corporate Bonds (a) — 2,069,750 — 2,069,750Corporate Bonds (a) — 844,600 67,207 911,807U.S. Government Obligations — 71,892,803 — 71,892,803TOTAL INVESTMENTS IN SECURITIES –
ASSETS $2,408,944,691 $77,513,672 $263,845 $2,486,722,208
(a) Please refer to the Schedule of Investments for the industry classifications of these portfolio holdings.
During the six months ended June 30, 2017, the Fund had transfers of $2,493,993 or 0.14% and $7,364,510or 0.40% of net assets as of December 31, 2016, respectively. Transfers from Level 1 to Level 2 and Level 2to Level 1 are due to a decline or an increase in market activity, e.g., frequency of trades, respectively, whichresulted in a decrease or an increase in available market inputs to determine price. The Fund’s policy is torecognize transfers among Levels as of the beginning of the reporting period.
The Gabelli Dividend & Income TrustNotes to Financial Statements (Unaudited) (Continued)
15
Additional Information to Evaluate Qualitative Information.
General. The Fund uses recognized industry pricing services – approved by the Board and unaffiliated withthe Adviser – to value most of its securities, and uses broker quotes provided by market makers of securitiesnot valued by these and other recognized pricing sources. Several different pricing feeds are received to valuedomestic equity securities, international equity securities, preferred equity securities, and fixed income securities.The data within these feeds are ultimately sourced from major stock exchanges and trading systems wherethese securities trade. The prices supplied by external sources are checked by obtaining quotations or actualtransaction prices from market participants. If a price obtained from the pricing source is deemed unreliable,prices will be sought from another pricing service or from a broker/dealer that trades that security or similarsecurities.
Fair Valuation. Fair valued securities may be common or preferred equities, warrants, options, rights, orfixed income obligations. Where appropriate, Level 3 securities are those for which market quotations are notavailable, such as securities not traded for several days, or for which current bids are not available, or whichare restricted as to transfer. When fair valuing a security, factors to consider include recent prices of comparablesecurities that are publicly traded, reliable prices of securities not publicly traded, the use of valuation models,current analyst reports, valuing the income or cash flow of the issuer, or cost if the preceding factors do notapply. A significant change in the unobservable inputs could result in a lower or higher value in Level 3 securities.The circumstances of Level 3 securities are frequently monitored to determine if fair valuation measures continueto apply.
The Adviser reports quarterly to the Board the results of the application of fair valuation policies and procedures.These may include backtesting the prices realized in subsequent trades of these fair valued securities to fairvalues previously recognized.
Limitations on the Purchase and Sale of Futures Contracts, Certain Options, and Swaps. Subject to theguidelines of the Board, the Fund may engage in “commodity interest” transactions (generally, transactions infutures, certain options, certain currency transactions, and certain types of swaps) only for bona fide hedgingor other permissible transactions in accordance with the rules and regulations of the Commodity Futures TradingCommission (“CFTC”). Pursuant to amendments by the CFTC to Rule 4.5 under the Commodity ExchangeAct (“CEA”), the Adviser has filed a notice of exemption from registration as a “commodity pool operator” withrespect to the Fund. The Fund and the Adviser are therefore not subject to registration or regulation as acommodity pool operator under the CEA. In addition, certain trading restrictions are now applicable to the Fundas of January 1, 2013. These trading restrictions permit the Fund to engage in commodity interest transactionsthat include (i) “bona fide hedging” transactions, as that term is defined and interpreted by the CFTC and itsstaff, without regard to the percentage of the Fund’s assets committed to margin and options premiums and(ii) non-bona fide hedging transactions, provided that the Fund does not enter into such non-bona fide hedgingtransactions if, immediately thereafter, either (a) the sum of the amount of initial margin deposits on the Fund’sexisting futures positions or swaps positions and option or swaption premiums would exceed 5% of the marketvalue of the Fund’s liquidating value, after taking into account unrealized profits and unrealized losses on anysuch transactions, or (b) the aggregate net notional value of the Fund’s commodity interest transactions wouldnot exceed 100% of the market value of the Fund’s liquidating value, after taking into account unrealized profitsand unrealized losses on any such transactions. Therefore, in order to claim the Rule 4.5 exemption, the Fund
The Gabelli Dividend & Income TrustNotes to Financial Statements (Unaudited) (Continued)
16
is limited in its ability to invest in commodity futures, options, and certain types of swaps (including securitiesfutures, broad based stock index futures, and financial futures contracts). As a result, in the future the Fundwill be more limited in its ability to use these instruments than in the past, and these limitations may have anegative impact on the ability of the Adviser to manage the Fund, and on the Fund’s performance.
Securities Sold Short. The Fund may enter into short sale transactions. Short selling involves selling securitiesthat may or may not be owned and, at times, borrowing the same securities for delivery to the purchaser, withan obligation to replace such borrowed securities at a later date. The proceeds received from short sales arerecorded as liabilities and the Fund records an unrealized gain or loss to the extent of the difference betweenthe proceeds received and the value of an open short position on the day of determination. The Fund recordsa realized gain or loss when the short position is closed out. By entering into a short sale, the Fund bears themarket risk of an unfavorable change in the price of the security sold short. Dividends on short sales are recordedas an expense by the Fund on the ex-dividend date and interest expense is recorded on the accrual basis.The broker retains collateral for the value of the open positions, which is adjusted periodically as the value ofthe position fluctuates.
Investments in Other Investment Companies. The Fund may invest, from time to time, in shares of otherinvestment companies (or entities that would be considered investment companies but are excluded from thedefinition pursuant to certain exceptions under the 1940 Act) (the “Acquired Funds”) in accordance with the1940 Act and related rules. Shareholders in the Fund would bear the pro rata portion of the periodic expensesof the Acquired Funds in addition to the Fund’s expenses. For the six months ended June 30, 2017, the Fund’spro rata portion of the periodic expenses charged by the Acquired Funds was less than 1 basis point.
Foreign Currency Translations. The books and records of the Fund are maintained in U.S. dollars. Foreigncurrencies, investments, and other assets and liabilities are translated into U.S. dollars at current exchangerates. Purchases and sales of investment securities, income, and expenses are translated at the exchangerate prevailing on the respective dates of such transactions. Unrealized gains and losses that result from changesin foreign exchange rates and/or changes in market prices of securities have been included in unrealizedappreciation/depreciation on investments and foreign currency translations. Net realized foreign currency gainsand losses resulting from changes in exchange rates include foreign currency gains and losses between tradedate and settlement date on investment securities transactions, foreign currency transactions, and the differencebetween the amounts of interest and dividends recorded on the books of the Fund and the amounts actuallyreceived. The portion of foreign currency gains and losses related to fluctuation in exchange rates betweenthe initial purchase trade date and subsequent sale trade date is included in realized gain/(loss) on investments.
Foreign Securities. The Fund may directly purchase securities of foreign issuers. Investing in securities offoreign issuers involves special risks not typically associated with investing in securities of U.S. issuers. Therisks include possible revaluation of currencies, the inability to repatriate funds, less complete financial informationabout companies, and possible future adverse political and economic developments. Moreover, securities ofmany foreign issuers and their markets may be less liquid and their prices more volatile than securities ofcomparable U.S. issuers.
The Gabelli Dividend & Income TrustNotes to Financial Statements (Unaudited) (Continued)
17

Foreign Taxes. The Fund may be subject to foreign taxes on income, gains on investments, or currency repatriation,a portion of which may be recoverable. The Fund will accrue such taxes and recoveries as applicable, basedupon its current interpretation of tax rules and regulations that exist in the markets in which it invests.
Restricted Securities. The Fund is not subject to an independent limitation on the amount it may invest insecurities for which the markets are restricted. Restricted securities include securities whose disposition issubject to substantial legal or contractual restrictions. The sale of restricted securities often requires more timeand results in higher brokerage charges or dealer discounts and other selling expenses than the sale of securitieseligible for trading on national securities exchanges or in the over-the-counter markets. Restricted securitiesmay sell at a price lower than similar securities that are not subject to restrictions on resale. Securities freelysaleable among qualified institutional investors under special rules adopted by the SEC may be treated asliquid if they satisfy liquidity standards established by the Board. The continued liquidity of such securities isnot as well assured as that of publicly traded securities, and, accordingly, the Board will monitor their liquidity.For restricted securities the Fund held as of June 30, 2017, refer to the Schedule of Investments.
Securities Transactions and Investment Income. Securities transactions are accounted for on the trade datewith realized gain/(loss) on investments determined by using the identified cost method. Interest income (includingamortization of premium and accretion of discount) is recorded on the accrual basis. Premiums and discountson debt securities are amortized using the effective yield to maturity method. Dividend income is recorded onthe ex-dividend date, except for certain dividends from foreign securities that are recorded as soon after theex-dividend date as the Fund becomes aware of such dividends.
Custodian Fee Credits. When cash balances are maintained in the custody account, the Fund receives creditswhich are used to offset custodian fees. The gross expenses paid under the custody arrangement are includedin custodian fees in the Statement of Operations with the corresponding expense offset, if any, shown as “Custodianfee credits.”
Distributions to Shareholders. Distributions to common shareholders are recorded on the ex-dividend date.Distributions to shareholders are based on income and capital gains as determined in accordance with federalincome tax regulations, which may differ from income and capital gains as determined under GAAP. Thesedifferences are primarily due to differing treatments of income and gains on various investment securities heldby the Fund, timing differences, and differing characterizations of distributions made by the Fund. Distributionsfrom net investment income for federal income tax purposes include net realized gains on foreign currencytransactions. These book/tax differences are either temporary or permanent in nature. To the extent thesedifferences are permanent, adjustments are made to the appropriate capital accounts in the period when thedifferences arise. These reclassifications have no impact on the NAV of the Fund.
Under the Fund’s current common share distribution policy, the Fund declares and pays monthly distributionsfrom net investment income, capital gains, and paid-in capital. The actual source of the distribution is determinedafter the end of the calendar year. Pursuant to this policy, distributions during the year may be made in excessof required distributions. To the extent such distributions are made from current earnings and profits, they areconsidered ordinary income or long term capital gains. The Fund’s current distribution policy may restrict theFund’s ability to pass through to shareholders all of its net realized long term capital gains as a Capital GainDistribution, subject to the maximum federal income tax rate and may cause such gains to be treated as ordinaryincome. Distributions sourced from paid-in capital should not be considered as dividend yield or the total return
The Gabelli Dividend & Income TrustNotes to Financial Statements (Unaudited) (Continued)
18
from an investment in the Fund. The Board will continue to monitor the Fund’s distribution level, taking intoconsideration the Fund’s NAV and the financial market environment. The Fund’s distribution policy is subjectto modification by the Board at any time.
Distributions to shareholders of the Fund’s 5.875% Series A Preferred Shares, Series B Auction Market PreferredShares, Series C Auction Market Preferred Shares, 6.000% Series D Preferred Shares, Series E Auction RatePreferred Shares, and 5.250% Series G Preferred Shares (“Preferred Shares”) are recorded on a daily basisand are determined as described in Note 5.
The tax character of distributions paid during the year ended December 31, 2016 was as follows:
Common PreferredDistributions paid from:Ordinary income (inclusive of short term gain) . . . . . . . . . . . . . . . . . . . . . . . . . . . . . . . . . . . . . . . . . . $ 25,936,252 $ 4,400,284Net long term capital gains . . . . . . . . . . . . . . . . . . . . . . . . . . . . . . . . . . . . . . . . . . . . . . . . . . . . . . . . . . . 82,898,620 14,064,385Total distributions paid . . . . . . . . . . . . . . . . . . . . . . . . . . . . . . . . . . . . . . . . . . . . . . . . . . . . . . . . . . . . . . . $108,834,872 $18,464,669
Provision for Income Taxes. The Fund intends to continue to qualify as a regulated investment companyunder Subchapter M of the Internal Revenue Code of 1986, as amended (the “Code”). It is the policy of theFund to comply with the requirements of the Code applicable to regulated investment companies and to distributesubstantially all of its net investment company taxable income and net capital gains. Therefore, no provisionfor federal income taxes is required.
As of December 31, 2016, the components of accumulated earnings/losses on a tax basis were as follows:
Undistributed ordinary income . . . . . . . . . . . . . . . . . . . . . . . . . . . . . . . . . . . . . . . . . . . . $ 869,364Undistributed long term capital gains . . . . . . . . . . . . . . . . . . . . . . . . . . . . . . . . . . . . . . 2,508,342Net unrealized appreciation on investments and foreign currency translations . . 658,030,754Other temporary differences* . . . . . . . . . . . . . . . . . . . . . . . . . . . . . . . . . . . . . . . . . . . . . (256,059)Total. . . . . . . . . . . . . . . . . . . . . . . . . . . . . . . . . . . . . . . . . . . . . . . . . . . . . . . . . . . . . . . . . . . $661,152,401
* Other temporary differences were primarily due to current year dividends payable.
The following summarizes the tax cost of investments and the related net unrealized appreciation atJune 30, 2017:
Cost/Proceeds
GrossUnrealized
Appreciation
GrossUnrealized
DepreciationNet UnrealizedAppreciation
Investments . . . . . . . . . . . . . $1,719,702,506 $851,055,472 $(84,035,770) $767,019,702
The Fund is required to evaluate tax positions taken or expected to be taken in the course of preparing theFund’s tax returns to determine whether the tax positions are “more-likely-than-not” of being sustained by theapplicable tax authority. Income tax and related interest and penalties would be recognized by the Fund astax expense in the Statement of Operations if the tax positions were deemed not to meet the more-likely-than-notthreshold. During the six months ended June 30, 2017, the Fund did not incur any income tax, interest, orpenalty. As of June 30, 2017, the Adviser has reviewed all open tax years and concluded that there was noimpact to the Fund’s net assets or results of operations. The Fund’s federal and state tax returns for the priorthree fiscal years remain open, subject to examination. On an ongoing basis, the Adviser will monitor the Fund’stax positions to determine if adjustments to this conclusion are necessary.
The Gabelli Dividend & Income TrustNotes to Financial Statements (Unaudited) (Continued)
19
3. Investment Advisory Agreement and Other Transactions. The Fund has entered into an investmentadvisory agreement (the “Advisory Agreement”) with the Adviser which provides that the Fund will pay theAdviser a fee, computed weekly and paid monthly, equal on an annual basis to 1.00% of the value of theFund’s average weekly net assets including the liquidation value of preferred shares. In accordance with theAdvisory Agreement, the Adviser provides a continuous investment program for the Fund’s portfolio and overseesthe administration of all aspects of the Fund’s business and affairs.
The Adviser has agreed to reduce the management fee on the incremental assets attributable to the SeriesA, Series B, Series C, Series D , Series E, and Series G Preferred Shares if the total return of the NAV of thecommon shares of the Fund, including distributions and advisory fee subject to reduction, does not exceedthe stated dividend rate or corresponding swap rate of each particular series of the Preferred Shares for theyear. The Fund’s total return on the NAV of the common shares is monitored on a monthly basis to assesswhether the total return on the NAV of the common shares exceeds the stated dividend rate or correspondingswap rate of each particular series of Preferred Shares for the period. For the six months ended June 30, 2017,the Fund’s total return on the NAV of the common shares exceeded the stated dividend rate or correspondingswap rate on each of the outstanding Preferred Shares. Thus, advisory fees with respect to the liquidationvalue of the Preferred Shares were accrued on these assets.
During the six months ended June 30, 2017, the Fund paid $63,735 in brokerage commissions on securitytrades to G.research, LLC, an affiliate of the Adviser.
During the six months ended June 30, 2017, the Fund received credits from a designated broker who agreedto pay certain Fund operating expenses. The amount of such expenses paid through this directed brokeragearrangement during this period was $8,060.
The cost of calculating the Fund’s NAV per share is a Fund expense pursuant to the Advisory Agreement.During the six months ended June 30, 2017, the Fund paid or accrued $22,500 to the Adviser in connectionwith the cost of computing the Fund’s NAV.
As per the approval of the Board, the Fund compensates officers of the Fund, who are employed by the Fundand are not employed by the Adviser (although the officers may receive incentive based variable compensationfrom affiliates of the Adviser). During the six months ended June 30, 2017 the Fund paid or accrued $111,759in payroll expenses in the Statement of Operations.
The Fund pays each Trustee who is not considered an affiliated person an annual retainer of $18,000 plus$2,000 for each Board meeting attended. Each Trustee is reimbursed by the Fund for any out of pocket expensesincurred in attending meetings. All Board committee members receive $1,000 per meeting attended, the AuditCommittee Chairman receives an annual fee of $3,000, the Proxy Voting Committee Chairman receives anannual fee of $1,500, the Nominating Committee Chairman and the Lead Trustee each receives an annualfee of $2,000. A Trustee may receive a single meeting fee, allocated among the participating funds, for participationin certain meetings held on behalf of multiple funds. Trustees who are directors or employees of the Adviseror an affiliated company receive no compensation or expense reimbursement from the Fund.
4. Portfolio Securities. Purchases and sales of securities during the six months ended June 30, 2017, otherthan short term securities and U.S. Government obligations, aggregated $132,934,481, and $121,616,735,respectively.
The Gabelli Dividend & Income TrustNotes to Financial Statements (Unaudited) (Continued)
20
5. Capital. The Fund is authorized to issue an unlimited number of common shares of beneficial interest (parvalue $0.001). The Board has authorized the repurchase and retirement of its shares on the open market whenthe shares are trading at a discount of 7.5% or more (or such other percentage as the Board may determinefrom time to time) from the NAV of the shares. During the six months ended June 30, 2017, the Fund did notrepurchase any common shares. During the year ended December 31, 2016, the Fund repurchased and retired117,996 common shares in the open market at an investment of $2,017,929 and an average discount of approximately13.73% from its NAV.
Transactions in shares of beneficial interest were as follows:Six Months Ended
June 30, 2017(Unaudited)
Year EndedDecember 31, 2016
Shares Amount Shares AmountNet decrease from repurchase of common shares (includes transaction
costs) . . . . . . . . . . . . . . . . . . . . . . . . . . . . . . . . . . . . . . . . . . . . . . . . . . . . . . . . . . . . — — (117,996) $(2,017,929)
On July 1 2016, the Fund received net proceeds of $96,639,191 (after underwriting discounts of $3,150,000and offering expenses of $213,809) from the public offering of 4,000,000 shares of 5.250% Series G CumulativePreferred Shares.
As of June 30, 2017, after considering the issuance of Series G Preferred, the Fund has $400 million availablefor issuing additional common or preferred shares or notes under the current shelf registration.
The Fund’s Declaration of Trust, as amended, authorizes the issuance of an unlimited number of shares of$0.001 par value Preferred Shares. The Preferred Shares are senior to the common shares and result in thefinancial leveraging of the common shares. Such leveraging tends to magnify both the risks and opportunitiesto common shareholders. Dividends on the Preferred Shares are cumulative. The Fund is required by the 1940Act and by the Statements of Preferences to meet certain asset coverage tests with respect to the PreferredShares. If the Fund fails to meet these requirements and does not correct such failure, the Fund may be requiredto redeem, in part or in full, the Series A, Series B, Series C, Series D, Series E, and Series G PreferredShares at redemption prices of $25, $25,000, $25,000, $25, $25,000, and $25, respectively, per share plusan amount equal to the accumulated and unpaid dividends whether or not declared on such shares in orderto meet these requirements. Additionally, failure to meet the foregoing asset coverage requirements could restrictthe Fund’s ability to pay dividends to common shareholders and could lead to sales of portfolio securities atinopportune times. The income received on the Fund’s assets may vary in a manner unrelated to the fixedand variable rates, which could have either a beneficial or detrimental impact on net investment income andgains available to common shareholders.
For Series B, Series C, and Series E Preferred Shares, the dividend rates, as set by the auction process thatis generally held every seven days, are expected to vary with short term interest rates. Since February 2008,the number of Series B, Series C, and Series E Preferred Shares subject to bid orders by potential holdershas been less than the number of shares of Series B, Series C, and Series E Preferred Shares subject to sellorders. Holders that have submitted sell orders have not been able to sell any or all of the Series B, SeriesC, and Series E Preferred Shares for which they have submitted sell orders. Therefore the weekly auctionshave failed, and the dividend rate has been the maximum rate. The current maximum rate for Series B, SeriesC, and Series E Preferred Shares is 150, 150, and 250, respectively, basis points greater than the seven day
The Gabelli Dividend & Income TrustNotes to Financial Statements (Unaudited) (Continued)
21
Telerate/British Bankers Association LIBOR rate on the date of such auction. Existing Series B, Series C, andSeries E Preferred shareholders may submit an order to hold, bid, or sell such shares on each auction date,or trade their shares in the secondary market. There were no redemptions of Series B, Series C, and SeriesE Preferred Shares during the six months ended June 30, 2017.
The Fund may redeem in whole or in part the 5.875% Series A and 6.000% Series D Preferred Shares at theredemption price at any time. Commencing July 1, 2021 and at any time thereafter, the Fund, at its option,may redeem the 5.250% Series G Cumulative Preferred Shares in whole or in part at the redemption price.The Board has authorized the repurchase of Series A, Series D, and Series G Preferred Shares in the openmarket at prices less than the $25 liquidation value per share. During the six months ended June 30, 2017and the year ended December 31, 2016, the Fund did not repurchase any shares of Series A, Series D, orSeries G Preferred Shares.
The Fund has the authority to purchase its auction rate and auction market preferred shares through negotiatedprivate transactions. The Fund is not obligated to purchase any dollar amount or number of auction rate orauction market preferred shares, and the timing and amount of any auction rate or auction market preferredshares purchased will depend on market conditions, share price, capital availability, and other factors. TheFund is not soliciting holders to sell these shares nor recommending that holders offer them to the Fund. Anyoffers can be accepted or rejected in the Fund’s discretion.
The following table summarizes Cumulative Preferred Share information:
Series Issue DateIssued/
Authorized
Number of SharesOutstanding at
06/30/17Net
Proceeds2017 Dividend
Rate Range
DividendRate at
06/30/17
AccruedDividend at
06/30/17A 5.875%. . . . . . . . . . . . . . . . . . . October 12, 2004 3,200,000 3,048,019 $ 77,280,971 Fixed Rate 5.875% $62,177B Auction Market . . . . . . . . . . . . . . October 12, 2004 4,000 3,600 98,858,617 2.211% to 2.694% 2.689% 20,168C Auction Market . . . . . . . . . . . . . . October 12, 2004 4,800 4,320 118,630,341 2.212% to 2.695% 2.691% 8,073D 6.000%. . . . . . . . . . . . . . . . . . . November 3, 2005 2,600,000 2,542,296 62,617,239 Fixed Rate 6.000% 52,965E Auction Rate. . . . . . . . . . . . . . . . November 3, 2005 5,400 4,860 133,379,387 3.211% to 3.692% 3.689% 24,901G 5.250%. . . . . . . . . . . . . . . . . . . July 1, 2016 4,000,000 4,000,000 96,636,191 Fixed Rate 5.250% 72,917
The holders of Preferred Shares generally are entitled to one vote per share held on each matter submittedto a vote of shareholders of the Fund and will vote together with holders of common shares as a single class.The holders of Preferred Shares voting together as a single class also have the right currently to elect twoTrustees and under certain circumstances are entitled to elect a majority of the Board of Trustees. In addition,the affirmative vote of a majority of the votes entitled to be cast by holders of all outstanding shares of thePreferred Shares, voting as a single class, will be required to approve any plan of reorganization adverselyaffecting the Preferred Shares, and the approval of two-thirds of each class, voting separately, of the Fund’soutstanding voting stock must approve the conversion of the Fund from a closed-end to an open-end investmentcompany. The approval of a majority (as defined in the 1940 Act) of the outstanding Preferred Shares and amajority (as defined in the 1940 Act) of the Fund’s outstanding voting securities are required to approve certainother actions, including changes in the Fund’s investment objectives or fundamental investment policies.
6. Indemnifications. The Fund enters into contracts that contain a variety of indemnifications. The Fund’smaximum exposure under these arrangements is unknown. However, the Fund has not had prior claims orlosses pursuant to these contracts. Management has reviewed the Fund’s existing contracts and expects therisk of loss to be remote.
The Gabelli Dividend & Income TrustNotes to Financial Statements (Unaudited) (Continued)
22
7. Subsequent Events. Management has evaluated the impact on the Fund of all subsequent events occurringthrough the date the financial statements were issued and has determined that there were no subsequentevents requiring recognition or disclosure in the financial statements.
The Gabelli Dividend & Income TrustNotes to Financial Statements (Unaudited) (Continued)
23
Certifications
The Fund’s Chief Executive Officer has certified to the New York Stock Exchange (“NYSE”) that, as of June 9, 2017,he was not aware of any violation by the Fund of applicable NYSE corporate governance listing standards.The Fund reports to the SEC on Form N-CSR which contains certifications by the Fund’s principal executiveofficer and principal financial officer that relate to the Fund’s disclosure in such reports and that are requiredby Rule 30a-2(a) under the 1940 Act.
Shareholder Meeting – May 15, 2017 – Final Results
The Fund’s Annual Meeting of Shareholders was held on May 15, 2017 at the Greenwich Library in Greenwich,Connecticut. At that meeting, common and preferred shareholders, voting together as a single class, electedFrank J. Fahrenkopf, Jr., Anthonie C. van Ekris, and Salvatore J. Zizza as Trustees of the Fund. A total of81,643,727 votes, 81,663,244 votes, and 81,647,046 votes were cast in favor of these Trustees, and a totalof 2,239,772 votes, 2,220,256 votes, and 2,236,454 votes were withheld for these Trustees, respectively. Inaddition, preferred shareholders, voting as a separate class, elected Anthony J. Colavita, as a Trustee of theFund. A total of 7,932,685 votes were cast in favor of this Trustee and a total of 236,668 votes were withheldfor this Trustee.
Mario J. Gabelli, CFA, Edward T. Tokar, James P. Conn, Michael J. Melarkey, and Salvatore M. Salibello, CPA,continue to serve in their capacities as Trustees of the Fund.
We thank you for your participation and appreciate your continued support.
The Net Asset Value per share appears in the Publicly Traded Funds column, under the heading “GeneralEquity Funds,” in Monday’s The Wall Street Journal. It is also listed in Barron’s Mutual Funds/Closed EndFunds section under the heading “General Equity Funds.”
The Net Asset Value per share may be obtained each day by calling (914) 921-5070 or visiting www.gabelli.com.
The NASDAQ symbol for the Net Asset Value is “XGDVX.”
Notice is hereby given in accordance with Section 23(c) of the Investment Company Act of 1940, as amended, that theFund may from time to time purchase its common shares in the open market when the Fund’s shares are trading at adiscount of 7.5% or more from the net asset value of the shares. The Fund may also from time to time purchase itspreferred shares in the open market when the preferred shares are trading at a discount to the liquidation value.
The Gabelli Dividend & Income TrustNotes to Financial Statements (Unaudited) (Continued)
24
Enrollment in the PlanIt is the policy of The Gabelli Dividend & Income Trust to automatically reinvest dividends payable to common shareholders. As a “registered”
shareholder, you automatically become a participant in the Fund’s Automatic Dividend Reinvestment Plan (the “Plan”). The Plan authorizes the Fundto credit shares of common stock to participants upon an income dividend or a capital gains distribution regardless of whether the shares are tradingat a discount or a premium to net asset value. All distributions to shareholders whose shares are registered in their own names will be automaticallyreinvested pursuant to the Plan in additional shares of the Fund. Plan participants may send their stock certificates to Computershare Trust Company,N.A. (“Computershare”) to be held in their dividend reinvestment account. Registered shareholders wishing to receive their distribution in cash mustsubmit this request in writing to:
The Gabelli Dividend & Income Trustc/o Computershare
P.O. Box 30170College Station, TX 77842-3170
Shareholders requesting this cash election must include the shareholder’s name and address as they appear on the share certificate. Shareholderswith additional questions regarding the Plan or requesting a copy of the terms of the Plan may contact Computershare at (800) 336-6983.
If your shares are held in the name of a broker, bank, or nominee, you should contact such institution. If such institution is not participatingin the Plan, your account will be credited with a cash dividend. In order to participate in the Plan through such institution, it may be necessary foryou to have your shares taken out of “street name” and re-registered in your own name. Once registered in your own name, your dividends will beautomatically reinvested. Certain brokers participate in the Plan. Shareholders holding shares in “street name” at participating institutions will havedividends automatically reinvested. Shareholders wishing a cash dividend at such institution must contact their broker to make this change.
The number of shares of common stock distributed to participants in the Plan in lieu of cash dividends is determined in the following manner.Under the Plan, whenever the market price of the Fund’s common stock is equal to or exceeds net asset value at the time shares are valued forpurposes of determining the number of shares equivalent to the cash dividends or capital gains distribution, participants are issued shares of commonstock valued at the greater of (i) the net asset value as most recently determined or (ii) 95% of the then current market price of the Fund’s commonstock. The valuation date is the dividend or distribution payment date or, if that date is not a New York Stock Exchange (“NYSE”) trading day, thenext trading day. If the net asset value of the common stock at the time of valuation exceeds the market price of the common stock, participants willreceive shares from the Fund valued at market price. If the Fund should declare a dividend or capital gains distribution payable only in cash, Computersharewill buy common stock in the open market, or on the NYSE or elsewhere, for the participants’ accounts, except that Computershare will endeavorto terminate purchases in the open market and cause the Fund to issue shares at net asset value if, following the commencement of such purchases,the market value of the common stock exceeds the then current net asset value.
The automatic reinvestment of dividends and capital gains distributions will not relieve participants of any income tax which may be payableon such distributions. A participant in the Plan will be treated for federal income tax purposes as having received, on a dividend payment date, adividend or distribution in an amount equal to the cash the participant could have received instead of shares.Voluntary Cash Purchase Plan
The Voluntary Cash Purchase Plan is yet another vehicle for our shareholders to increase their investment in the Fund. In order to participatein the Voluntary Cash Purchase Plan, shareholders must have their shares registered in their own name.
Participants in the Voluntary Cash Purchase Plan have the option of making additional cash payments to Computershare for investments inthe Fund’s shares at the then current market price. Shareholders may send an amount from $250 to $10,000. Computershare will use these fundsto purchase shares in the open market on or about the 1st and 15th of each month. Computershare will charge each shareholder who participates$0.75, plus a pro rata share of the brokerage commissions. Brokerage charges for such purchases are expected to be less than the usual brokeragecharge for such transactions. It is suggested that any voluntary cash payments be sent to Computershare, P.O. Box 43010, Providence, RI 02940–3010such that Computershare receives such payments approximately 10 days before the 1st and 15th of the month. Funds not received at least five daysbefore the investment date shall be held for investment until the next purchase date. A payment may be withdrawn without charge if notice is receivedby Computershare at least 48 hours before such payment is to be invested.
Shareholders wishing to liquidate shares held at Computershare must do so in writing or by telephone. Please submit your request to theabove mentioned address or telephone number. Include in your request your name, address, and account number. The cost to liquidate shares is$2.50 per transaction as well as the brokerage commission incurred. Brokerage charges are expected to be less than the usual brokerage chargefor such transactions.
For more information regarding the Dividend Reinvestment Plan and Voluntary Cash Purchase Plan, brochures are available by calling (914)921-5070 or by writing directly to the Fund.
The Fund reserves the right to amend or terminate the Plan as applied to any voluntary cash payments made and any dividend or distributionpaid subsequent to written notice of the change sent to the members of the Plan at least 90 days before the record date for such dividend or distribution.The Plan also may be amended or terminated by Computershare on at least 90 days written notice to participants in the Plan.
AUTOMATIC DIVIDEND REINVESTMENTAND VOLUNTARY CASH PURCHASE PLANS
25

THE GABELLI DIVIDEND & INCOME TRUSTAND YOUR PERSONAL PRIVACY
Who are we?
The Gabelli Dividend & Income Trust is a closed-end management investment company registered withthe Securities and Exchange Commission under the Investment Company Act of 1940. We are managedby Gabelli Funds, LLC, which is affiliated with GAMCO Investors, Inc. GAMCO Investors, Inc. is apublicly held company that has subsidiaries that provide investment advisory services for a variety ofclients.
What kind of non-public information do we collect about you if you become a Fund shareholder?
When you purchase shares of the Fund on the New York Stock Exchange, you have the option ofregistering directly with our transfer agent in order, for example, to participate in our dividend reinvestmentplan.
• Information you give us on your application form. This could include your name, address, telephonenumber, social security number, bank account number, and other information.
• Information about your transactions with us. This would include information about the shares that youbuy or sell; it may also include information about whether you sell or exercise rights that we haveissued from time to time. If we hire someone else to provide services — like a transfer agent —we will also have information about the transactions that you conduct through them.
What information do we disclose and to whom do we disclose it?
We do not disclose any non-public personal information about our customers or former customers toanyone other than our affiliates, our service providers who need to know such information, and asotherwise permitted by law. If you want to find out what the law permits, you can read the privacy rulesadopted by the Securities and Exchange Commission. They are in volume 17 of the Code of FederalRegulations, Part 248. The Commission often posts information about its regulations on its website,www.sec.gov.
What do we do to protect your personal information?
We restrict access to non-public personal information about you to the people who need to know thatinformation in order to provide services to you or the Fund and to ensure that we are complying withthe laws governing the securities business. We maintain physical, electronic, and procedural safeguardsto keep your personal information confidential.

THE GABELLI DIVIDEND & INCOME TRUSTOne Corporate CenterRye, NY 10580-1422
Portfolio Management Team Biographies
Mario J. Gabelli, CFA, is Chairman, Chief Executive Officer, and Chief Investment Officer - Value Portfolios ofGAMCO Investors, Inc. that he founded in 1977, and Chief Investment Officer - Value Portfolios of Gabelli Funds, LLCand GAMCO Asset Management Inc. He is also Executive Chairman of Associated Capital Group, Inc. Mr. Gabelli isa summa cum laude graduate of Fordham University and holds an MBA degree from Columbia Business Schooland Honorary Doctorates from Fordham University and Roger Williams University.
Christopher J. Marangi joined Gabelli in 2003 as a research analyst. Currently he is a Managing Director andCo-Chief Investment Officer for GAMCO Investors, Inc.’s Value team. In addition, he serves as a portfolio managerof Gabelli Funds, LLC and manages several funds within the Gabelli/GAMCO Fund Complex. Mr. Marangi graduatedmagna cum laude and Phi Beta Kappa with a BA in Political Economy from Williams College and holds an MBAdegree with honors from Columbia Business School.
Kevin V. Dreyer joined Gabelli in 2005 as a research analyst covering companies within the consumer sector.Currently he is a Managing Director and Co-Chief Investment Officer for GAMCO Investors, Inc.’s Value team. Inaddition, he serves as a portfolio manager of Gabelli Funds, LLC and manages several funds within the Gabelli/GAMCOFund Complex. Mr. Dreyer received a BSE from the University of Pennsylvania and an MBA degree from ColumbiaBusiness School.
Barbara G. Marcin, CFA, joined GAMCO Investors, Inc. in 1999 and currently serves as a portfolio manager ofGabelli Funds, LLC and manages several funds within the Gabelli/GAMCO Fund Complex. Prior to joining GAMCO,Ms. Marcin was head of value investments at Citibank Global Asset Management. Ms. Marcin graduated withDistinction as an Echols Scholar from the University of Virginia and holds an MBA degree from Harvard University’sGraduate School of Business.
Robert D. Leininger, CFA, joined GAMCO Investors, Inc. in 1993 as an equity analyst. Subsequently, he was apartner and portfolio manager at Rorer Asset Management before rejoining GAMCO in 2010 where he currentlyserves as a portfolio manager of Gabelli Funds, LLC. Mr. Leininger is a magna cum laude graduate of AmherstCollege with a degree in Economics and holds an MBA degree from the Wharton School at the University ofPennsylvania.
Jeffrey J. Jonas, CFA, joined Gabelli in 2003 as a research analyst focusing on companies across the healthcareindustry. In 2006, he began serving as a portfolio manager of Gabelli Funds, LLC and manages several fundswithin the Gabelli/GAMCO Fund Complex. Mr. Jonas was a Presidential Scholar at Boston College, where hereceived a BS in Finance and Management Information Systems.

THE GABELLI DIVIDEND & INCOME TRUSTOne Corporate CenterRye, NY 10580-1422
t 800-GABELLI (800-422-3554)f 914-921-5118e [email protected]
GABELLI.COM
TRUSTEES
Mario J. Gabelli, CFAChairman andChief Executive Officer,GAMCO Investors, Inc.Executive Chairman,Associated Capital Group, Inc.
Anthony J. ColavitaPresident,Anthony J. Colavita, P.C.
James P. ConnFormer Managing Director &Chief Investment Officer,Financial Security AssuranceHoldings Ltd.
Frank J. Fahrenkopf, Jr.Former President &Chief Executive Officer,American Gaming Association
Michael J. MelarkeyOf Counsel,McDonald Carano Wilson LLP
Salvatore M. Salibello, CPASenior Partner,Bright Side Consulting
Edward T. TokarFormer Chief Executive Officer of AlliedCapital Management, LLC, &Vice President of Honeywell International,Inc.
Anthonie C. van EkrisChairman,BALMAC International, Inc.
Salvatore J. ZizzaChairman,Zizza & Associates Corp.
OFFICERS
Bruce N. AlpertPresident
Andrea R. MangoSecretary &Vice President
Agnes MulladyVice President
John C. BallTreasurer
Richard J. WalzChief Compliance Officer
Carter W. AustinVice President & Ombudsman
Laurissa M. MartireVice President & Ombudsman
David I. SchachterVice President
INVESTMENT ADVISER
Gabelli Funds, LLCOne Corporate CenterRye, New York 10580-1422
CUSTODIAN
State Street Bank and TrustCompany
COUNSEL
Skadden, Arps, Slate, Meagher &Flom LLP
TRANSFER AGENT ANDREGISTRAR
Computershare Trust Company, N.A.
THEGABELLIDIVIDEND& INCOMETRUST
GDV
Semiannual ReportJune 30, 2017
GDV Q2/2017