GA3ox expression influences plant growth in pea · Canada Discovery Grants to JAO and RPP, and the...
47
1 GA3ox expression influences plant growth in pea Jocelyn A. Ozga (corresponding author) 4-10 Agriculture/Forestry Centre Dept. of Agricultural, Food and Nutritional Science University of Alberta Edmonton, Alberta, Canada T6G 2P5 Phone: 780-492-2653 Fax: 780-492-4265 e-mail: [email protected] Research Area/Associate Editor: Biochemistry and Metabolism/ Julian Hibberd (Cambridge) This work provides insight into the fundamental understanding of GA biosynthesis and catabolism regulation at the plant tissue and organ level, and the importance of timing/localization of gene expression for the production of bioactive GA, and thereby plant growth. Plant Physiology Preview. Published on August 26, 2013, as DOI:10.1104/pp.113.225987 Copyright 2013 by the American Society of Plant Biologists www.plantphysiol.org on March 16, 2019 - Published by Downloaded from Copyright © 2013 American Society of Plant Biologists. All rights reserved.
Transcript of GA3ox expression influences plant growth in pea · Canada Discovery Grants to JAO and RPP, and the...

1
GA3ox expression influences plant growth in pea
Jocelyn A. Ozga (corresponding author) 4-10 Agriculture/Forestry Centre Dept. of Agricultural, Food and Nutritional Science University of Alberta Edmonton, Alberta, Canada T6G 2P5 Phone: 780-492-2653 Fax: 780-492-4265 e-mail: [email protected] Research Area/Associate Editor: Biochemistry and Metabolism/ Julian Hibberd (Cambridge) This work provides insight into the fundamental understanding of GA biosynthesis and
catabolism regulation at the plant tissue and organ level, and the importance of
timing/localization of gene expression for the production of bioactive GA, and thereby plant
growth.
Plant Physiology Preview. Published on August 26, 2013, as DOI:10.1104/pp.113.225987
Copyright 2013 by the American Society of Plant Biologists
www.plantphysiol.orgon March 16, 2019 - Published by Downloaded from Copyright © 2013 American Society of Plant Biologists. All rights reserved.

2
GA3ox gene expression patterns influence GA biosynthesis, growth, and development in pea
Dennis M. Reinecke†1, Aruna D. Wickramarathna†1, Jocelyn A. Ozga*1, Leonid V. Kurepin2, Alena L. Jin1, Allen G. Good3, Richard P. Pharis2
1 Plant BioSystems, Department of Agricultural, Food and Nutritional Science University of Alberta, Edmonton, Alberta, Canada T6G 2P5
2 Department of Biological Sciences, University of Calgary, Calgary, AB, Canada T2N 1N4 3 Department of Biological Sciences, University of Alberta, Edmonton, Alberta, Canada T6G 2E9 † These authors contributed equally to this manuscript. *Corresponding Author
www.plantphysiol.orgon March 16, 2019 - Published by Downloaded from Copyright © 2013 American Society of Plant Biologists. All rights reserved.
3
Footnotes:
This research was supported by the Natural Sciences and Engineering Research Council of
Canada Discovery Grants to JAO and RPP, and the Alberta Agriculture Research Institute Grant
to JAO. ADW also received a Commonwealth Scholarship supporting his graduate studies.
Jocelyn A. Ozga (corresponding author; e-mail: [email protected])
www.plantphysiol.orgon March 16, 2019 - Published by Downloaded from Copyright © 2013 American Society of Plant Biologists. All rights reserved.
4
ABSTRACT
Gibberellins (GAs) are key modulators of plant growth and development. PsGA3ox1 (LE)
encodes a GA 3β-hydroxylase which catalyzes the conversion of GA20 to biologically active
GA1. To further clarify the role of GA3ox expression during pea (Pisum sativum) plant growth
and development, we generated transgenic pea lines (in a lele background) with CaMV-35S-
driven expression of PsGA3ox1 (LE). PsGA3ox1 transgene expression led to higher GA1
concentrations in a tissue-specific and developmentally-specific manner, altering GA
biosynthesis and catabolism gene expression, and plant phenotype. PsGA3ox1 transgenic plants
had longer internodes, tendrils and fruits, larger stipules, and displayed delayed flowering,
increased apical meristem life, and altered vascular development, relative to the null controls.
Transgenic PsGA3ox1 overexpression lines were then compared to lines where endogenous
PsGA3ox1 (LE) was introduced, by a series of backcrosses, into the same genetic background
(BC LEle). Most notably, the BC LEle plants had substantially longer internodes containing
much greater GA1 levels than the transgenic PsGA3ox1 plants. Induction of expression of the
GA deactivation gene PsGA2ox1 appears to make an important contribution to limiting the
increase of internode GA1 to modest levels for the transgenic lines. In contrast, PsGA3ox1 (LE)
expression driven by its endogenous promoter was coordinated within the internode tissue to
avoid feed-forward regulation of PsGA2ox1, resulting in much greater GA1 accumulation. These
studies further our fundamental understanding of the regulation of GA biosynthesis and
catabolism at the tissue and organ level, and demonstrate that the timing/localization of GA3ox
expression within an organ affects both GA homeostasis and GA1 levels, and thereby growth.
www.plantphysiol.orgon March 16, 2019 - Published by Downloaded from Copyright © 2013 American Society of Plant Biologists. All rights reserved.
5
INTRODUCTION
It is now possible to alter the levels of bioactive GAs in plants through transgenic
modification of the expression of GA biosynthesis and catabolism genes, in some cases
reproducing the effects obtained by the application of chemical growth regulators (Hedden and
Phillips, 2000a). For targeting changes in phenotype of specific tissues, it is important to
understand how GA biosynthesis and catabolism are regulated at both the tissue and organ level,
and also across developmental stages. Attempts to modulate the expression of GA biosynthesis
and catabolism genes through transgenic approaches in various species have been reported (see
Phillips, 2004) and data suggest that the successful regulation of levels of bioactive GAs
involves modifications in the expression of genes in the later part of the GA pathway (Fleet et
al., 2003; Swain et al. 2005). Results from the use of GA biosynthesis mutants and also studies
on GA biosynthesis inhibitors suggest, for pea (Pisum sativum L.) and Arabidopsis, that
feedback regulation of transcript abundance by high concentrations of a bioactive GA also
appear to be specific to the later part of the GA biosynthesis pathway (Fig. 1; Ayele et al., 2006:
Davidson et al., 2005: Hedden and Phillips, 2000b).
Overexpression of Arabidopsis GA20ox homologs which encode the multi-functional
enzymes (GA 20-oxidases) that catalyze the GA12 � GA15 � GA24 � GA9 biosynthesis steps,
can yield higher levels of GA9, which in turn can be converted by a GA 3-oxidase to GA4 (the
main bioactive GA in Arabidopsis). The results of this GA20ox overexpression are Arabidopsis
plants with longer hypocotyls and stems, earlier flowering, and the production of seed with a
reduced period of dormancy (Huang et al., 1998; Coles et al., 1999). Similarly, Biemelt et al.
(2004) reported that stem growth, rate of photosynthesis and biomass production in tobacco were
all enhanced when AtGA20ox1 was overexpressed. Over expression of citrus GA20ox
(CcGA20ox1) in tobacco also resulted in a shift from the early 13-hydroxylation pathway of GA
biosynthesis to the early non-13-hydroxylation pathway, leading to GA4 becoming the
predominant bioactive GA in the transgenic tobacco plants (Vidal et al., 2001). In rice, over
expression of OsGA20ox1 resulted in internode elongation that was about 2-fold greater than the
elongation of the wild-type line (Oikawa et. al., 2004).
For hybrid aspen (Populus tremula x P. tremuloides), over expression of the AtGA20ox1
transgene resulted in transgenic lines with appreciably increased levels of C20 GAs as well as
increased levels of bioactive GA1 and GA4. There was also increased growth in tree stem heights
www.plantphysiol.orgon March 16, 2019 - Published by Downloaded from Copyright © 2013 American Society of Plant Biologists. All rights reserved.

6
and diameters, larger leaves, more numerous and longer xylem fibers, and increased stem
biomass (Eriksson et al., 2000). The implication for the hybrid aspen was that the GA 20-
oxidase-catalyzed steps in GA biosynthesis were rate-limiting in the non-transgenic trees. In a
subsequent study, over expression of AtGA3ox1 (which encodes for a GA 3-oxidase) in
transgenic hybrid aspen did not lead to major increases in GA1 or GA4, or to increases in tree
growth or morphology. Based on these latter results it was hypothesized that the GA 3-oxidase
step in the non-transgenic hybrid aspen trees was not rate-limiting (Israelsson et. al., 2004). In
contrast, Radi et al. (2006) reported that over expression of pumpkin CmGA3ox1 in Arabidopsis
resulted in transgenic plants with elevated levels of GA4, as well as increased hypocotyl,
internode and leaf growth, and earlier flowering, all relative to wild-type plants. From these
results, Radi et al. (2006) concluded that GA 3-oxidation is a rate-limiting step in GA plant
hormone biosynthesis that controls plant development. Over expression of the pea gene that
encodes for GA 3-oxidase (PsGA3ox1) in tobacco plants resulted in modest increases in
hypocotyl and stem length, and larger leaves, and was associated with a small but significant
increase of bioactive GA1 (Gallego-Giraldo et al., 2008). However, since transgenic over
expression of GA20ox had a greater effect on plant height and active GA levels than transgenic
GA3ox overexpression in tobacco, and the phenotype of hybrid GA3ox/GA20ox over expression
tobacco lines was relatively similar to the GA20ox overexpressor parental line, Gallego-Giraldo
et al. (2008) concluded that GA 3-oxidases are non-rate limiting enzymes in tobacco. These
researchers also observed large increases in transcript abundance of the GA catabolism genes
NtGA2ox3 and NtGA2ox5 (between 10- and 60-fold) in the PsGA3ox1-overexpressed transgenic
lines of tobacco. These latter data suggest that enhanced GA catabolism (2β-hydroxylation) may
be associated with elevated GA3ox transcript levels and the associated increase in bioactive GA.
Pea, a large-seeded non-bolting legume, can serve as a model species for comparison to other
studied species such as Arabidopsis, tobacco and spinach, which are small-seeded species that
exhibit a rosette habit while vegetative., but undergo rapid internode elongation (bolting) under
certain environmental conditions that then leads to flowering. The role for GAs in the regulation
of internode elongation in pea has been well established by the use of PsGA3ox1 mutants which
lead to GA deficiency (Ingram et al., 1984; Ross et al., 1989; Lester et al., 1997; Martin et al.,
1997). Of equal interest is the characterization of GA1 biosynthesis over-production pea
mutants, though pea GA1 biosynthesis mutants with an intact GA signal transduction pathway
www.plantphysiol.orgon March 16, 2019 - Published by Downloaded from Copyright © 2013 American Society of Plant Biologists. All rights reserved.

7
that lead to overproduction of GA1 have not yet been identified. Given the variation in response
to GA3ox overexpression among the plant species cited above, and the lack of information on
timing and localization of transgenic GA3ox expression in these studies, it was of interest to
investigate whether internode elongation and/or other plant phenotypes are affected by higher
GA1 levels caused by over expression of PsGA3ox1 in pea. Furthermore, to determine if the
localization of PsGA3ox1 transcripts within a tissue affects GA homeostasis, we used two
approaches, transgenic and backcrossing, to determine if increasing PsGA3ox1 transcript
abundance can alter GA homeostasis, and plant vegetative and reproductive morphology in this
species. The effects of modifying PsGA3ox1 (LE gene) transcript abundance using these two
approaches in a similar genetic background were then compared at the phenotypic, molecular,
chemical and biochemical levels. These studies further the fundamental understanding of GA
biosynthesis and catabolism regulation at the plant tissue and organ level, and across
development. Furthermore, this work provides insight into the importance of timing/localization
of GA3ox gene expression for the production of bioactive GA, and highlights the importance of
understanding gene expression dynamics when attempting to modulate the expression of GA
biosynthesis and catabolism genes to bring about specific phenotype changes through transgenic
approaches.
RESULTS AND DISCUSSION
Transgenic lines
We selected 2 transgenic lines (TG1 and TG2) that constitutively expressed PsGA3ox1
(LE; a fully functional wild-type GA 3β-hydroxylase gene; Lester et al., 1997) in a semi-dwarf
lele pea line (‘Carneval’; le-1; single base-pair mutation in PsGA3ox1; Lester et al., 1997) based
on morphological characteristics (node and numbering system given in Supplementary Fig. S1).
Their transgenic nulls (C1 and C2; lines where the transgene had segregated out at the T2
generation) were also characterized and they were found to be morphologically similar to each
other in shoot height, total number of internodes, and number and length of lateral branches
(LSD P≥0.5, data not shown); therefore, one (C1) was chosen as the transgenic null control line
in the various comparisons. Characterization of a third transgenic line (TG3) and its transgenic
null control (C3, which varied from C1 null in phenotype) is described in Supplementary Figs.
S2-S5.
www.plantphysiol.orgon March 16, 2019 - Published by Downloaded from Copyright © 2013 American Society of Plant Biologists. All rights reserved.

8
CaMV-35S constitutive promoter expression in pea tissues
PsGA3ox1 driven by the CaMV-35S promoter was expressed constitutively in all cell types
of expanding internodes, tendrils, stipules and pericarps as suggested by the expression of the
marker gene, β-glucuronidase (GUS), driven by the CaMV-35S constitutive promoter
(Supplementary Fig. S6). The low abundance and labile nature of the 2-oxoglutarate-dependent
dioxygenases occurring late in the GA biosynthesis pathway including GA 3-oxidase make it
difficult to confirm that PsGA3ox1 transcript abundance leads to increases in GA 3-oxidase
protein levels. However, precedence for the close correlation between the mRNA abundance of
a GA 2-oxoglutarate-dependent dioxygenase (GA 20-oxidase) with the levels of the protein was
established by Lee and Zeevaart (2007) in the photoperiodic regulation of SoGA20ox1
expression in spinach.
Transgenic PsGA3ox1 over expression increases internode elongation and modifies GA
metabolism
TG1 produced significantly (P<0.05) longer internodes relative to its null control (C1) in
all internodes from 1 to 15 (Fig. 2A), with an average internode length 22% greater than C1. A
similar pattern of increased internode length was observed in TG2 and TG3, where the average
increase in internode length was 13% (TG2; Fig. 2A) and 8% (TG3; Supplementary Fig. S2A)
relative to their respective null controls. These increased internode lengths are consistent with the
expression of the PsGA3ox1 transgene and also with higher levels of total PsGA3ox1 (transgene
+ endogenous gene) transcript (Table I; Supplementary Fig. S3C and D). The CaMV-35S-driven
expression of the PsGA3ox1 (LE) gene in ‘Carneval’ (le) consistently resulted in an increase in
biosynthetic flux for endogenous GA20 � bioactive GA1 � biologically inactive GA8 (the
immediate catabolite of GA1) for TG1 (Table II), the line with the highest levels of transgene
expression (Table I; TG1 relative to C1).
Elongating internode transcript levels of the endogenous biosynthesis gene PsGA20ox1
(encodes for GA 20-oxidase, which catalyzes the GA53 � GA44 � GA19 � GA20 biosynthesis
steps; Fig. 1), either increased (compared to C1) or were maintained at similar levels (compared
to NTC1) in the presence of PsGA3ox1 transgene (Table I), while GA20 levels in both TG1 and
TG2 plants were maintained at levels similar to those seen for C1 (Table II). In contrast,
www.plantphysiol.orgon March 16, 2019 - Published by Downloaded from Copyright © 2013 American Society of Plant Biologists. All rights reserved.

9
endogenous GA20 in tobacco apical shoot parts (Gallego-Giraldo et al. 2008) and both GA20 and
GA9 in hybrid aspen internodes (Israelsson et. al., 2004), markedly decreased in transgenic
GA3ox1-overexpression lines, suggesting that for both tobacco and aspen the transgenic GA3ox
over expression quickly depleted the substrate pool of upstream precursor GAs. Furthermore,
up-regulation of NtGA20ox1 was not observed in the transgenic PsGA3ox1-overexpression
tobacco lines (Gallego-Giraldo et al., 2008).
GA1 levels are low in the lele pea genotypes due to the presence of the PsGA3ox1 (le) gene
that contains a point mutation that dramatically reduces the enzyme activity of the GA 3-oxidase
that it encodes (Lester et al., 1997; Martin et al., 1997). This leads to the accumulation of GA20,
the substrate for GA 3-oxidase in pea lele shoot tissue (Ross et al., 1992). Furthermore,
PsGA20ox1 gene expression is induced in response to low levels of GA1 in the lele genotypes as
part of a feedback regulatory mechanism (Martin et al., 1996; Hedden and Phillips, 2000b).
These events lead to the accumulation of high levels of GA20 in the lele genotypes (see C1 which
is in a lele genetic background, Table II). Our results, then, imply that high levels of endogenous
PsGA20ox1 (Table I) and production of GA20 in the internodes (Table II) circumvent depleting
the GA20 substrate pool that is needed for 3β-hydroxylation to bioactive GA1 in the PsGA3ox1
transgenic pea lines. This is in contrast to GA20 depletion observed in GA3ox overexpression
lines of tobacco (Gallego-Giraldo et al. 2008) and hybrid aspen (Israelsson et. al., 2004).
In elongating internodes, transgene PsGA3ox1 expression also led to increased transcript
abundance of the catabolic GA 2β-hydroxylation step gene, PsGA2ox1 (this gene is primarily
responsible for conversion of GA20 to GA29; Table I; Supplementary Fig. S3E), and this
increased PsGA2ox1 transcript abundance was positively correlated with elevated internode
GA29 levels for TG1 and TG2 (Table II). Increased GA catabolism in elongating internodes of
the PsGA3ox1-overexpression lines is considered to be indicative of the feed-forward regulation
of GA biosynthesis that is induced by increased levels of a bioactive GA (Thomas et al., 1999).
Although up-regulation of the expression of two GA catabolic genes, NtGA2ox3 and NtGA2ox5,
was observed in the apical shoots of 7 d-old tobacco plants when PsGA3ox1 was over expressed
(Gallego-Giraldo et al., 2008), whether 2β-hydroxylation of GA20 or GA9 (to GA29 or GA51,
respectively) actually increased was not determined.
There was no consistent effect of transgenic PsGA3ox1-over expression on PsGA2ox2
transcript levels (Table I). However, higher transcript abundance of the GA1 deactivating gene,
www.plantphysiol.orgon March 16, 2019 - Published by Downloaded from Copyright © 2013 American Society of Plant Biologists. All rights reserved.

10
PsGA2ox2 in TG2 internodes was observed (Table I), and this may explain the lower GA1 levels
(Table II) observed in TG2, relative to TG1. Also, PsGA3ox2 transcripts (data not shown) were
not detected in any of our transgenic or control lines within the elongating internode tissues at
the chosen nodal position.
Transgenic PsGA3ox1 over expression increases apical meristem life and delays transition
to a floral meristem
Zhu and Davies (1997) showed that apical bud vigor and increased longevity in the G2 pea
genotype was correlated with an increased level of GA20 and GA1 in the apical buds. Consistent
with the elevated flux through the GA biosynthesis pathway that was seen for the internodes, we
also observed, for two of the transgenic lines, an increased apical meristem life (more nodes per
plant) and a delayed apical meristem transition from the vegetative phase to the reproductive
phase (see Table III for TG1 and also see TG3 compared to C3; Supplementary Table S1; the
highest number of nodes was with TG1, the transgenic line with the highest level of PsGA3ox1
expression, Table I), as also noted by Kelly and Davies (1986) for G2 peas in short days, a
condition associated with higher levels of GA20 and GA1 (Proebsting et al., 1978; Zhu and
Davies, 1997). Proebsting et al. (1978) demonstrated that application of GA3 to the apical buds
of G2 peas maintained apical growth, and that apical vigor observed in short days in these peas
was correlated with the presence of a growth-active GA later shown by Zhu and Davies (1997) to
be GA1. ‘Carneval’ responds similarly to GA3 application (Wickramarathna, 2009). The increase
in shoot apical meristem longevity caused by increased levels of a bioactive GA may be
attributed to increased mitotic activity in the shoot apex, as exogenously applied GA3 can
increase the mitotic activity in the shoot apex of Silene and Perilla (for review, see Pharis and
King, 1985; Besnard-Wibaut et al., 1983), and an increase in the number of cells in pea (Yang et
al., 1996). Furthermore, it has been observed that high concentrations of applied bioactive GAs
can not only stimulate vegetative growth (Dennis, 1973), but also lengthen the morphological
age to flowering in some plant genera (Fuschia, Hieracium and Fragaria; for review, see Pharis
and King, 1985). However, this response is not ubiquitous across genera, as increased flux
through the GA biosynthesis pathway generated by GA20ox overexpression (Huang et al., 1998;
Coles et al., 1999) or GA3ox overexpression (Radi et al., 2006) led to earlier flowering in
Arabidopsis.
www.plantphysiol.orgon March 16, 2019 - Published by Downloaded from Copyright © 2013 American Society of Plant Biologists. All rights reserved.

11
Transgenic PsGA3ox1 over expression changes internode vascular anatomy
Internodes at the chronologically early nodal positions were longer (TG1 113% and TG2
40% at internode 2) and thinner (smaller in cross-sectional area and diameter; 9-24% smaller at
internode 2) in the transgenic PsGA3ox1-over expressing lines than in the C1 line (Fig. 2A;
Supplementary Table S2 and Fig. 3A). This phenotype is reminiscent of the sln pea mutant,
where a null mutation in the GA catabolism gene, PsGA2ox1, leads to higher levels of GA20 in
the mature seed, and likely increased transport of the GA20 from the large cotyledonary pool to
the embryo axis in the imbibed seed (where it can be converted to bioactive GA1). It is
hypothesized that the resultant higher bioactive GA1 levels in the embryo axis are responsible for
the very long, slender internodes seen during early seedling growth of sln (Reid et al., 1992;
Ross et al., 1993; Lester et al., 1999; Ayele et al., 2012). Fagoaga et al (2007) also observed a
decrease in stem diameters of citrus when CcGA20ox1 was over expressed. However, transgenic
(AtGA20ox1) hybrid aspen exhibited increased average stem diameter, likely due to GA1 and
GA4 effects on growth of cambial region xylem and phloem tissues (Eriksson et al., 2000). For
TG1 the cross-sectional area ratio of cortex to vascular stele tissue was similar to C1 at internode
2 (Supplementary Table S2), indicating that the GA1-induced decrease in stem cross-sectional
area reflects similar reductions in cortical and vascular stele regions. Also, within the vascular
stele of TG1’s internode 2, the phloem-enriched regions were reduced, while the cross-sectional
area of the xylem vessel elements was increased, both relative to C1 (Fig. 3B; Supplementary
Table S2). Higher CaMV-35S-driven PsGA3ox1 expression in developing xylem vessel
elements, compared to other cell types (see Supplemental Fig. S6), is likely a primary factor in
elevating GA1 concentration, resulting in the larger diameter xylem vessel elements. Biemelt et
al. (2004) observed an increase in the number of xylem vessel elements when AtGA20ox1, driven
by the CaMV-35S promoter, was expressed in tobacco stems, and a decrease in number of xylem
vessel elements when AtGA2ox1, driven by the CaMV-35S promoter, was expressed in the stem
tissue of tobacco. Tissue-specific localization of GAs and expression of GA-biosynthetic and
signaling genes in wood-forming tissues of hybrid aspen indicated that the late stages of GA
biosynthesis occur in expanding xylem, and this suggests that bioactive GAs play a role in the
elongation of the hybrid aspen xylem (Israelsson et al., 2005). Our data also strongly suggest that
bioactive GA1 is involved in increasing xylem vessel element diameters in pea.
www.plantphysiol.orgon March 16, 2019 - Published by Downloaded from Copyright © 2013 American Society of Plant Biologists. All rights reserved.

12
Interestingly, in the hybrid aspen stems a gradient of GAs were observed across the
vascular tissue (phloem-cambium-xylem; Israelsson et al., 2005). High levels of the immediate
C-2 deoxy precursors to bioactive GA4 and GA1 (GA9 and GA20, respectively) and low levels of
GA1 and GA4 per se were found in the phloem tissue, whereas high levels of all four GAs were
observed in the expanding xylem tissue (Israelsson et al., 2005). Expression of transgenic
PsGA3ox1 in all tissues of pea internode 2 would likely lead to higher levels of GA1 in both the
phloem and xylem tissues of the pea stem. If similar GA pools exist in the phloem and xylem
tissues in pea stems as demonstrated for the hybrid aspen stems, it is possible that higher than
normal (supra-optimal) levels of GA1 in the phloem is associated with the reduced phloem tissue
growth as seen at this internode in TG1 and TG2 compared to C1 (Fig. 3B; Supplementary Table
S2).
Tendril petiole development
To date, little is known about GA biosynthesis and catabolism pathways in tendrils.
‘Carneval’ is semi-leafless (af; afila), where leaflets are replaced by tendrils of normal anatomy.
We assessed tendril petioles, for consistency of tissue type within the tendril. We found that
transcript abundance of the endogenous GA biosynthetic genes PsGA20ox1 and PsGA3ox1
(control; Fig. 4A, B, F and G) decreased, while the endogenous GA catabolic genes PsGA2ox1
and PsGA2ox2 both increased in the tendril petioles as they matured (control; Fig. 4H-K).
Concomitantly, a decrease in endogenous levels of GA20, GA1, GA8 and GA29 was observed in
the tendril petioles as they matured from 40 to 80% full length (control; Fig. 5). Smith et al.
(1992) also observed that younger pea petioles contained higher endogenous levels of GA20,
GA1, GA8 and GA29 than mature petioles. These data are indicative of an overall decreased flux
through the GA biosynthesis pathway (decreased production of GA20 and GA1, resulting in lower
substrate levels of these GAs for the production of GA29 and GA8 by GA 2-oxidases) in tendril
petioles as they complete their development. PsGA2ox1 transcript abundance was lower in the
tendril petioles (more than 10-fold lower at similar growth stages in controls; Fig 4H) than in the
internodes (Table I), suggesting that PsGA2ox1 plays a more important role in maintaining GA
homeostasis in the internodes than this tendril tissue.
Ross et al. (2003) reported that mature pea shoot tissues (leaves, tendrils and internode
tissues were combined) contained lower levels of GA20 and GA1 compared to young apical bud
www.plantphysiol.orgon March 16, 2019 - Published by Downloaded from Copyright © 2013 American Society of Plant Biologists. All rights reserved.

13
tissues. Data from [14C]GA20 metabolism studies (Ross et al., 2003) suggested that the low GA20
and GA1 levels observed in the mature shoot tissues were due to rapid 2β-hydroxylation of these
GAs. Our expression data, along with endogenous GA analysis, suggest that the lower levels of
GA20 and GA1, as the tendril petioles mature, are likely the result of both a decrease in GA
biosynthesis capacity (reduced GA 20- and GA 3-oxidase activity) as well as an increase in GA
deactivation (enhanced GA 2-oxidase activity).
Transgenic PsGA3ox1 over expression increases tendril petiole length and modifies GA
metabolism
Tendril petiole length in TG1, TG2 and TG3 was on average 12% greater than in the null
controls (C1, Fig. 2C; C3, Supplementary Fig. S2B). The higher PsGA3ox1 transcript abundance
during the earlier developmental stages (stages 1 and 2; Fig. 4E-G), concomitant with increased
GA1 levels (Fig. 5B) in the rapidly elongating tendrils (for the transgenic lines) at 40% of final
size (stage 2) indicates that transgenic PsGA3ox1 over expression increased the GA20 � GA1
biosynthetic flux, with the elevated tissue GA1 concentration stimulating tendril petiole growth.
It should be noted that PsGA3ox2 transcripts were not detected in tendril petioles (stage 1) of
either the transgenic or control lines (data not shown). Endogenous PsGA20ox1 and PsGA20ox2
transcript levels were elevated in TG1 and TG2 tendril petioles, relative to that seen in C1 (at
stage 3; 80% full size; Fig. 4A-D). This is analogous to the situation seen for endogenous
PsGA20ox1 transcript abundance in TG1 and C1 internodes (Table I). Also, GA20 concentrations
did not decline in the tendril petioles of the transgenic lines (TG1and TG2) at either 40% or 80%
expansion, relative to C1 at the same stage of development (Fig. 5A). These data suggest that
the elevated transcript levels of endogenous tendril petiole PsGA20ox and production of GA20,
also circumvented depletion of GA20 substrate for subsequent 3β-hydroxylation to GA1 in the
PsGA3ox1 overexpression transgenic lines (as opposed to GA20 depletion observed in GA3ox
overexpression lines of tobacco and hybrid aspen).
Our results, then, imply that high levels of endogenous PsGA20ox1 (Table I) and
production of GA20 (Table II) circumvent depleting the GA20 substrate pool that is needed for
3β-hydroxylation to bioactive GA1 in the PsGA3ox1 transgenic pea lines. This is in contrast to
GA20 depletion observed in GA3ox overexpression lines of tobacco (Gallego-Giraldo et al. 2008)
and hybrid aspen (Israelsson et. al., 2004).
www.plantphysiol.orgon March 16, 2019 - Published by Downloaded from Copyright © 2013 American Society of Plant Biologists. All rights reserved.
14
Transcript abundance of the GA catabolic gene, PsGA2ox2, was consistently higher from
stage 2 to 4 (Fig. 4J and K) in the tendril petioles of both of TG1 and TG2 (and also higher at
stage 2 in TG3; Supplementary Fig. S4F), all relative to the null controls (C1 or C3). These data,
along with overall lower transcript abundance of PsGA2ox1 (Fig. 4H and I) than PsGA2ox2 (Fig.
4J and K; note the 100-fold higher y-axis range for PsGA2ox2), are consistent with the increased
levels of expression of PsGA2ox2 having a primary role in the GA 2-oxidase-catalyzed
deactivation of GA1 in tendril petioles, and suggest that a feed forward regulation of GA
biosynthesis by increased concentrations of GA1 is occurring in this tissue. Further to this
conclusion, there was an influence of transgenic PsGA3ox1 over expression on the tendril
petiole’s GA 2β-hydroxylated metabolite profile, i.e. late in tendril development (80% expanded)
higher GA29 levels were observed in tendril petioles of both TG1 and TG2, and higher GA8
levels were observed in tendril petioles of TG1, all relative to C1 (Fig. 5C and D). Finally, in
both the transgenic and control lines, levels of GA20, GA1, GA8 and GA29 decreased in the tendril
petioles with increasing maturity and the slowing of tendril petiole growth (Fig. 5; stage 2
compared to stage 3).
Stipule development
The pea cultivar used in our study (‘Carneval’) is semi-leafless; it has stipule leaves but
lacks leaflets. Transcript levels of the two GA biosynthesis genes, PsGA20ox1 and PsGA20ox2,
were high during early stipule expansion, but then decreased as the stipules matured (C1; Fig. 6A
and C; C3, Supplemental Fig. S5A and B). The decrease in PsGA20ox transcript abundance
coincided with a 7.8-fold decrease in GA20 as the stipules expanded from 40 to 80% full size
(Fig. 7A, C1). The stipule PsGA20ox expression profile is similar to that seen for PsGA20ox1 in
the tendril petioles (C1; Fig. 4A and B). However, developmental regulation of endogenous
PsGA3ox1 expression in the stipules differed appreciably from that seen for the tendril petioles.
Endogenous PsGA3ox1 transcript levels were low at stage 1 (20% expanded), peaked at stages 2
and 3 (40 to 80% expanded), then decreased as stipules reached maturity (C1; Fig. 6F; C3,
Supplemental Fig. S5D). No PsGA3ox2 transcripts were detected in stage 1 stipules (data not
shown). Markedly higher levels of GA1 (6- to10-fold) were observed in rapidly expanding
stipules for C1 (40% expanded), relative to elongating internodes or tendril petioles at a similar
www.plantphysiol.orgon March 16, 2019 - Published by Downloaded from Copyright © 2013 American Society of Plant Biologists. All rights reserved.
15
growth stage (see C1; Table II; Figs.5B and 7B). The concentration of GA1 decreased more than
5-fold as the stipules continued to expand from 40% to 80% of expected final size (see C1; Fig.
7B). A 4-fold increase in the transcript abundance of the catabolic gene PsGA2ox1 occurred
early in the expansion of the stipules (20% to 40% expansion), and PsGA2ox1 levels remained at
similar levels from 40% to the fully expanded stage (C1, Fig. 6H; Supplementary Table S3).
With the marked reduction in GA20 substrate for 2 β-hydroxylation, GA29 levels decreased 3.6-
fold as the stipules expanded from 40 to 80% final size (C1, Fig. 7D). A similar 4-fold increase
in PsGA2ox2 transcript abundance occurred early in stipule expansion (C1; 20% to 40%
expansion; Supplementary Table S3). PsGA2ox2 transcript abundance increased 1.7-fold as the
stipules expanded from 40% to 80% full size, and then dramatically increased (12.6-fold) as the
stipules expanded from 80% of final size to full size, (C1, Fig. 6J; C3, Supplementary Fig. S5F;
note that the scale for PsGA2ox2 is 1000-fold greater than PsGA2ox1; Supplementary Table S3).
The level of GA8, the product of 2 β-hydroxylation of GA1 (GA1 is the preferred substrate for the
GA 2-oxidase coded for by PsGA2ox2) declined modestly (1.6-fold) as the stipules expanded
from 40 to 80% final size (C1; Fig. 7C).
Leaflets and stipules are leaves that vary in shape and location on the pea plant (stipules
are attached directly to main stem at the node; leaflets are attached to the leaf petiole).
Interestingly, although both are leaves, the regulation of PsGA2ox1 and PsGA2ox2 in the stipules
of ‘Carneval’ dramatically differ from than that reported for the leaflets of ls-1 or LS (Elliott et
al., 2001; Ross et al., 2003). Elliott et al. (2001) using Northern blot analysis observed reduced
expression of PsGA2ox1 in fully expanded leaflets of the pea GA1-deficient ls-1 mutant
compared to its near isogenic wildtype LS. Furthermore, PsGA2ox2 transcripts were not
detected in the fully expanded leaflets of GA-deficient ls-1 or wild-type LS lines. Ross et al.
(2003) suggested, based on [14C]GA20 metabolism and the PsGA2ox expression data (Elliott et
al., 2001), that the lower GA20 and GA1 levels observed in mature pea leaf tissues were mainly
due to rapid 2β-hydroxylation of these GAs by PsGA2ox1. Our gene expression data across
stipule development, along with endogenous GA analysis, suggest that the lower levels of GA20
and GA1, as the stipules mature, are mainly the result of a decrease in GA biosynthesis capacity
(reduced PsGA20ox1 and PsGA20ox2 [stage 2 to maturity] and PsGA3ox1 [stage 3 to 4]
transcript abundance [C1; Fig. 6A, C, and F]) suggesting reduced GA 20- and GA 3-oxidase
activity). Furthermore, the dramatic increase in PsGA2ox2 transcript abundance as the stipules
www.plantphysiol.orgon March 16, 2019 - Published by Downloaded from Copyright © 2013 American Society of Plant Biologists. All rights reserved.

16
complete their growth (from 80% to 100% leaf expansion, stage 3 to 4; C1, Fig. 6J) suggests that
GA1 deactivation (enhanced GA 2-oxidase activity) by the GA 2-oxidase encoded by PsGA2ox2
may act as the primary mechanism to ensure minimal levels of bioactive GA1 in this tissue at
maturity (at least in the lele genetic background). A similar dramatic increase in PsGA2ox2
transcript abundance was observed in developing pea embryo axes as they shifted from GA
biosynthesis (to the growth-active GA1) to catabolic GA metabolism (GA1 deactivation) during
mid seed development. This is very likely the mechanism for limiting pea embryo axis growth
and allowing embryo maturation to proceed (Nadeau et al., 2011).
Transgenic PsGA3ox1 over expression increases stipule size and modifies GA metabolism
All three transgenic lines had larger stipules (approximately 15% larger at nodal position 8;
Fig. 2D; Supplementary Fig. S2C) and they also had higher stipule PsGA3ox1 transcript levels
relative to the control lines (Fig. 6F and G; Supplementary Fig. S5D). Although similar GA1
levels were observed in the stipules of the transgenic and control lines, higher GA8 levels were
detected in the rapidly expanding transgenic stipule tissue (stage 2; Fig. 7B and C). This suggests
that an increased flux of GA1 � GA8 occurred in the transgenic stipules during their expansion
phase of growth. An increased leaf area was also observed when PsGA3ox1 or CmGA3ox1 were
overexpressed in tobacco (Gallego-Giraldo et al., 2008) and Arabidopsis (Radi et al., 2006),
respectively.
In contrast to transcript levels observed in the internode and tendril tissues, minimal to no
increase in endogenous PsGA20ox transcript abundance was seen for stipule tissue (Fig. 6A-D;
Supplementary Fig. S5A and B). In fact, a reduced PsGA20ox1 transcript abundance was
observed for TG1, relative to C1 (Fig. 6A). Lower GA20 levels were also observed in the stipules
at 40% stipule expansion for the PsGA3ox1 over expression lines (TG1 and TG2), relative to C1
(Fig. 7A, stage 2). Interestingly, although over expression of transgenic PsGA3ox1 similarly
increased stipule leaf area in all three transgenic lines (compare node 8, Fig. 2D, Supplementary
Fig. S2C), expression of the GA deactivation gene PsGA2ox1 varied across stipule development
among the independent transgenic lines (Fig. 6H and I; Supplementary Fig. S5E). Additionally,
over expression of transgenic PsGA3ox1 had minimal to no effect on the PsGA2ox2 expression
profile for the stipules (Fig. 6J and K; Supplementary Fig. S5F). Overall, stipule GA29 levels for
the transgenics (TG1 and TG2) were either lower (40% expanded) or similar (80% expanded) to
GA29 levels of C1 (Fig. 7D). These GA gene expression and metabolism profiles in the
www.plantphysiol.orgon March 16, 2019 - Published by Downloaded from Copyright © 2013 American Society of Plant Biologists. All rights reserved.

17
PsGA3ox1 over expression lines further support that a decrease in GA biosynthesis capacity, as
opposed to an increased PsGA2ox1gene expression, lowers GA20 and GA1 levels limiting stipule
expansion as the stipules mature.
Transgenic PsGA3ox1 over expression increases pericarp length and modifies reproductive
morphology
PsGA3ox1 (LE) plays an important role in pea plant height (internode length; Lester et al.,
1997; Martin et al., 1997), though its role in fruit development has been less clear. Santes et al.
(1993) investigated the effect of the le mutation on the growth and GA content of developing
fruits in near-isogenic lines of Pisum sativum line 205+ (LELE; PsGA3ox1) and 205- (lele).
Although GA1 concentration was lower in young seeds (2.7 times) and pericarps (7 times) of lele,
compared to levels in LELE at 6 days after anthesis (DAA), the growth of pods (in length) and
seeds (in weight) was not affected by the le mutation. However, the levels of GA20 and GA29
were substantially elevated in lele compared to LELE in both tissues (Santes et al., 1993). These
results suggest that 3ß-hydroxylation of GA20 to GA1 is reduced in pericarps and seeds by the le
mutation, even though it did not affect the general fruit phenotype, bringing into question a
possible causal role of PsGA3ox1 (LE) in the production of GA1 during fruit development in
pea.
In pea, normal pericarp growth requires the presence of seeds, and seed number is
positively correlated with pea pericarp growth (Ozga et al., 1992). Removal or destruction of the
seeds at 2 to 3 DAA results in the slowing of pericarp growth and subsequently results in
abscission (Ozga et al., 1992). Signaling molecules originating from the seeds, such as auxin (4-
Cl-IAA; Ozga and Reinecke, 2003; Ozga et al., 2009), may be responsible for continued fruit
development by maintaining hormone levels in the surrounding tissue.
The transcript abundance of endogenous PsGA3ox1 is low in young pea pericarp tissue
compared to other organ tissues (Ozga et al., 2003). Data suggest that pollination, the presence
of developing seeds, and bioactive auxin (4-Cl-IAA, which is present in the developing seeds)
maintain and/or stimulate the synthesis of pea pericarp PsGA3ox1 mRNA message. It is
hypothesized that GA1 is synthesized from the pool of GA20 present in pre-pollinated pericarps
by the pericarp GA 3ß-hydroxylase that is at least partially encoded by PsGA3ox1; and this pulse
of GA1 stimulates initial fruit set and development (Ozga et al., 2003). Consistent with
PsGA3ox1 playing a role in the production of GA1 for fruit set and development, we found that
www.plantphysiol.orgon March 16, 2019 - Published by Downloaded from Copyright © 2013 American Society of Plant Biologists. All rights reserved.

18
young pericarps of the transgenic PsGA3ox1 over expression line TG1 contained higher
PsGA3ox1 transcript levels (12.6-fold higher) and produced longer pericarps relative to the
control line C1, when pericarps containing a similar number of seeds were compared (Tables III
and IV). Parthenocarpic fruit development in the transgenic PsGA3ox1-overexpression lines was
not observed under normal growing conditions. Transgenic PsGA3ox1 over expression also
markedly increased pericarp endogenous PsGA2ox1 transcript abundance (15-fold increase;
Table IV), suggesting that the GA 2-oxidase encoded by PsGA2ox1 plays an important role for
deactivating bioactive GA1 in the pericarp at this early stage of development. Overall, these data
support that pericarp PsGA3ox1 is important for the production of GA1 for pericarp growth.
Furthermore, pericarp GA1, along with other seed-derived factors, drive both fruit set and
pericarp development.
The TG1 line also exhibited significantly more fruit abortion prior to first fruit set, relative
to the control (C1; Table III). In previous work, pea seed PsGA3ox1 mRNA levels were
observed to peak just following pollination (0 DAA), then markedly decrease at 1 DAA (Ozga et
al., 2003). It has been documented that high concentrations of applied GA3 can inhibit
embryogenesis in excised embryos of Phaseolus coccineus (Yeung and Sussex, 1979; discussed
in Pharis and King, 1985). Since the presence of viable seeds is required for pericarp growth in
pea (Ozga et al., 1992), embryo abortion due to supra-optimal levels of bioactive GA in the
ovule tissues could have led to more fruit abortion for TG1, in comparison with C1.
Comparisons of transgenic PsGA3ox1 over expression lines to lines with PsGA3ox1 (LE)
introgressed into the pea genome by backcrossing
For comparison to the transgenic lines, a pea line was created that was near isogenic for LE
through backcrossing the maternal dwarf parent, ‘Carneval’ (le) with a tall ‘Alaska’ (LE) male
parent. Then the F1 progeny that produced a tall plant phenotype (maternal parent) were again
backcrossed to ‘Carneval’ (le) for a total of 5 (line BC5 LEle) to 7 (line BC7 LEle) backcross
generations. Interestingly, PsGA3ox1 (LE) introgressed into the ‘Carneval’ genetic background
by crossing had a much greater effect on increasing internode length than was seen for the
transgenic PsGA3ox1 lines TG1, TG2, or TG3 (Fig. 2, compare B for BC5 LEle with A for TG1
and TG2; also see Supplementary Fig. S2A for TG3; similar internode lengths across generations
BC5, BC6, and BC7 were observed for LEle and lele lines, respectively, data not shown).
Comparable internode length differences, as observed between the BC LEle and BC lele lines,
www.plantphysiol.orgon March 16, 2019 - Published by Downloaded from Copyright © 2013 American Society of Plant Biologists. All rights reserved.

19
were also noted for pea lines that were near isogenic for LELE (205+, tall line) and lele (205-,
dwarf line; Ross et al., 1992), though in a genetic background different than ‘Carneval’. The
difference in internode lengths can be attributed to accumulation of much higher GA1 levels (43-
fold higher) in BC LEle than in the transgenic line (TG1; Table II).
Gene expression studies were completed to determine if the transcript abundance of
PsGA3ox1 and other genes in the GA biosynthesis and catabolic pathways differed between the
transgenic LE and BC LEle lines. Our current data suggest that the cellular and/or temporal
perturbation of PsGA3ox1 transcript abundance (5-fold increase of total PsGA3ox1 ) in the
internode tissues of TG1 compared to its control (C1; Table I) initiated in response to
CaMV35S-driven PsGA3ox1 (LE) expression (across all cell types of the internode), induced a
feed-forward regulation of GA1 levels by increasing PsGA2ox1 transcript abundance. Since a
mutant with a nonfunctional PsGA2ox1 gene product [slender (sln) pea mutant; Lester et al.,
1999; Martin et al., 1999] exhibits longer internodes (up to 60% longer compared to SLN at the
morphologically earlier internodes at a similar nodal position as assayed in our study; Reid et al.,
1992), and higher GA1 levels, we conclude that the induction of the GA deactivation gene
PsGA2ox1 expression in the transgenic lines makes an important contribution to limiting the
increase in GA1 levels to only modest levels (Table II).
In contrast, in the BC LEle line, our data suggest that under the coordination of regulatory
mechanisms evolved in conjunction with its endogenous promoter, tissue-specific expression of
the fully functional PsGA3ox1 LE gene led to markedly higher internode GA1 levels. As a result
of high internode GA1 content, feedback regulation of PsGA20ox1 and PsGA3ox1 gene
expression (Martin et al., 1996 and 1997; Hedden and Thomas, 2012) was minimized in the BC
LEle line compared to the BC lele line (lower total PsGA3ox1 and PsGA20ox1 transcript
abundance in BC Lele compared to its control, BC lele; Table I). Lower PsGA20ox1 transcript
levels and increased flux of GA20 through GA1, are main contributors to lower GA20
accumulation in internodes of BC Lele compared to BC lele (Table II). Furthermore, our data
suggest that the endogenous promoter-driven PsGA3ox1(LE) expression pattern circumvents
feed-forward regulation of PsGA2ox1 transcript abundance in the internode tissue (PsGA2ox1
expression was not induced in the internode tissue in the BC LEle line when it is compared to the
BC lele line; Table I). In contrast, a 2-fold increase in the internode transcript abundance of the
GA catabolic gene PsGA2ox2 did occur in the BC LEle line, when compared to the BC lele line
www.plantphysiol.orgon March 16, 2019 - Published by Downloaded from Copyright © 2013 American Society of Plant Biologists. All rights reserved.

20
(Table I). It should be noted that PsGA2ox2 transcript abundance was unaffected with
CaMV35S-driven PsGA3ox1 overexpression (compare TG1 with C1; Table I). The C19-GA 2-
oxidases can be divided into two subgroups on the basis of amino acid sequence, PsGA2ox1
belonging to the type I subgroup and PsGA2ox2 to the type II subgroup (Lee and Zeevaart,
2005). Consistent with other reports that the transcript abundance of these two pea GA2ox genes
are differentially regulated by hormones and specific environmental signals (Ayele et al., 2006;
O’Neill and Ross, 2002; Stavang et al., 2005; Elliott et al., 2001), our data suggest that the
transcript abundance of PsGA2ox1 and PsGA2ox2 are differentially regulated as a mechanism to
maintain GA homeostasis within the elongating pea internode.
Interestingly, effects of LE on apical meristem life in the BC LEle line were similar to
those effects seen for TG1 and TG2 lines (Table III, compare nodes per plant in BC LEle to its
isogenic line BC lele and also compare transgenic PsGA3ox1-overexpressor line TG1with C1).
Here, we conclude that it is the increased GA1 biosynthesis capacity that is associated with the
increased apical meristem life in the BC LEle line.
A delay in the timing of floral initiation of 4 to 5 nodes occurred for the PsGA3ox1-
overexpression line TG1 (Table III, compare with C1) and of 1 node for TG3 (Supplementary
Table S1, compare with C3). This delayed flowering response was not observed for the BC LEle
lines (Table III, compare with BC5 lele). These data suggest that the GA1-induced delay in the
floral initiation process in the shoot apex is influenced primarily by the location of GA1, i.e.,
cellular-specific expression pattern of PsGA3ox1 (LE).
Santes et al. (1993) reported that the growth of pericarp (in length) and seeds (in weight)
was not affected by the le mutation; however, the effect of seed number on pericarp elongation
was not investigated. We found the BC LEle line did produced significantly longer pericarps
relative to the BC lele line plants, but only when there was a low seed number per pericarp (3
seeds; Table III). The transgenic line (TG1) produced significantly longer pericarps when 3 to 6
seeds were present in the fruit, compared to C1 plants with comparable seed numbers (Table III).
We conclude that the increase in pericarp PsGA3ox1 transcript abundance observed for TG1
(relative to C1; Table IV) was sufficient to raise the baseline levels of GA1 to a level that
stimulated pericarp elongation in fruits with 3 to 6 seeds.
We also monitored ABA levels in the internodes of the transgenic PsGA3ox1-
overexpressor lines, in the BC LEle and BC lele lines, and in their control lines to determine if
www.plantphysiol.orgon March 16, 2019 - Published by Downloaded from Copyright © 2013 American Society of Plant Biologists. All rights reserved.

21
GA1 differences influenced the levels of ABA. As internode ABA levels did not vary between
any of these lines (Table II), our data provide no evidence for GA1 regulation of ABA levels in
pea internodes. Ross et al. (2011) also could find no evidence for regulation of GA metabolism
by ABA in pea internodes.
Summary
Using pea as a model legume system, our data demonstrate that there is a dynamic and
tissue- and organ-specific nature to GA biosynthesis and catabolism pathways, one that can
explain a wide range of morphological and physiological phenotypes in both vegetative and
reproductive tissues. For both tendril petioles and stipules, there was increased flux occurring in
the GA biosynthesis pathway over development leading to the production of GA20 and GA1, the
latter GA being the ‘effector’ that stimulates tissue elongation or expansion. However, the
different developmental and tissue-specific GA biosynthesis and catabolism gene expression
patterns of the tendril petioles (having a long cylindrical-shape), when compared to the stipules
(a leaf-shaped organ) likely reflect the regulation of GA biosynthesis genes in a manner that
helps coordinate the different growth patterns required for these organs. The tendril petiole GA
biosynthesis gene expression pattern is consistent with the presence of sufficient GA 20-oxidase
(for production of GA20 substrate) and also sufficient GA 3-oxidase for conversion of GA20 to
bioactive GA1 at moderate levels (2.6 to 1.3 ng gdwt-1) through the mid and later stages of organ
development (40 to 80% of expected full length). In contrast, the stipule GA gene expression
pattern is consistent with providing a higher GA 20-oxidase capacity earlier in organ
development (1.4-fold higher GA20 levels by 40% of full expansion; stage 2), thereby producing
a pool of GA20 substrate for use by GA 3-oxidase during mid development. Thus, GA20 to GA1
conversion peaks at the mid stage of stipule organ development (12.2 ng gdwt-1). As both
tendrils and stipules completed their development, the flux through the GA biosynthesis pathway
declined. Our data suggest that this decline in GA biosynthesis capacity was both the result of
reduced GA biosynthesis gene expression and increased GA deactivation gene (PsGA2ox)
expression across tendril and stipule development.
In this paper, we have also, through the production and characterization of PsGA3ox1
overexpression transgenic lines, identified lines that produce elevated levels of PsGA3ox1
transcripts and increased GA1 levels or increased flux through the GA biosynthesis pathway. In
www.plantphysiol.orgon March 16, 2019 - Published by Downloaded from Copyright © 2013 American Society of Plant Biologists. All rights reserved.

22
so doing, we have shown that increasing GA1 in this manner can modify both vegetative and
reproductive plant phenotype. Our data also support the conclusion that CaMV-35S-driven
constitutive expression of PsGA3ox1 across cell types, within a tissue, increases the expression
levels of endogenous GA catabolic PsGA2ox genes in a tissue-specific manner. Increased
expression of these GA2ox genes is thus indicative of a feed-forward regulation of GA
catabolism in response to increased tissue concentrations of GA1.
We then compared the unique phenotypes (lines) produced by transgenic PsGA3ox1
overexpression to lines where PsGA3ox1 (LE) was introduced, by a series of back crosses, into
the same genetic background. In the internodes of lines where PsGA3ox1 (LE) expression was
driven by its endogenous promoter, markedly lower PsGA3ox1 transcript abundance (per
internode) was correlated with much greater production of GA1 than that observed in the
internodes of lines where PsGA3ox1 (LE) expression was driven by the CaMV-35S constitutive
promoter. We conclude that the induction of expression of the GA deactivation gene PsGA2ox1
likely makes an important contribution to limiting the increase in internode GA1 to modest levels
for the transgenic lines. In contrast, PsGA3ox1 (LE) expression driven by its endogenous
promoter was coordinated within the internode tissue to avoid feed-forward regulation of
PsGA2ox1, and this resulted in a much greater GA1 accumulation in this organ.
Overall, our findings do not support that GA 3-oxidase is a non-rate limiting enzyme in the
GA biosynthesis pathway as suggested by previous studies. Instead, our data support that the
timing and/or location of expression of GA3ox within an organ are important mechanisms to
avoid excessive deactivation of GA1 during tissue expansion. The specific localization of GA
gene transcripts and GAs within the cell-types of each organ would be very informative in
further understanding the role of GAs in the growth and development of these tissues.
MATERIALS AND METHODS
Plant material and plant transformation
Transgenic pea lines were generated to overexpress PsGA3ox1 (LE; a fully functional
wild-type GA 3β-hydroxylase gene; GenBank accession number AF001219) in Pisum sativum L.
cv. Carneval by Agrobacterium tumefaciens-mediated transformation of PsGA3ox1 fused to a
www.plantphysiol.orgon March 16, 2019 - Published by Downloaded from Copyright © 2013 American Society of Plant Biologists. All rights reserved.

23
CaMV-35S constitutive promoter. ‘Carneval’ is a semi-dwarf (le-1; single base-pair mutation in
PsGA3ox1) and semi-leafless (af; afila, leaflets are replaced by tendrils of normal anatomy) field
pea cultivar. This cultivar has white flowers and yellow cotyledons at maturity. Plant
transformation vectors were constructed to stably transform PsGA3ox1 in sense orientation into
pea. The binary plasmid pCGN1559 was modified for plant transformation by inserting a
duplicate-enhancer CaMV-35S promoter sequence proximal to the PsGA3ox1 gene sequence as
diagramed in Supplementary Fig. S7A. The binary plasmid was transferred into a disarmed A.
tumefaciens strain EHA101 and used for plant transformation. Then, for determining CaMV-
35S promoter expression patterns in various pea tissues, the binary plasmid pPBI-3010
containing a CaMV-35S promoter proximal to the GUS gene (Supplementary Fig. S7B) was
inserted into a disarmed A. tumefaciens strain EHA101 and used for plant transformation (see
supplementary section for details). The A. tumefaciens-mediated transformation and plant
regeneration process was similar to that described earlier (Schroeder et al. 1993; Grant et al.,
1995; Bean et al., 1997), with modifications (see Supplementary Materials and Methods).
Independently transformed T1 lines were tested for the presence of the NPTII marker gene by
PCR, and T2 seeds from the NPTII-positive lines were selected for homozygosity using a
kanamycin selection (see Supplementary Materials and Methods). Confirmation of stable gene
transformation into the plant genome (Supplementary Figs. S8 and S9) and the presence of
transgene PsGA3ox1 mRNA (Supplementary Figs. S10 and S11) was performed as described in
the Supplementary Materials and Methods.
Morphological, biochemical and molecular characterizations were performed on three
selected independent homozygous transgenic lines (TG1, TG2 and TG3). These lines segregated
at the T2 generation consistently with carrying one copy of the transgenic PsGA3ox1 (LE) gene
per haploid genome (assessed by screening the T2 generation for the kanamycin selection gene,
nptII). There were also three transformation control lines (C1, C2 and C3, where the transgene
had segregated out; null controls) and a wild-type line (NT-C; non-transformed control, it did not
undergo the tissue-culture process). All transgenic and transgenic control null lines were from
generations T4 to T6.
To create a line similar to ‘Carneval’ (LE), ‘Carneval’ (le), as the maternal parent, was
crossed with ‘Alaska’ (LE) and plants which produced a tall plant phenotype in subsequent
generations (maternal parent), were backcrossed to ‘Carneval’ (le) for a total of 5 to 7 backcross
www.plantphysiol.orgon March 16, 2019 - Published by Downloaded from Copyright © 2013 American Society of Plant Biologists. All rights reserved.

24
generations. The line designated BC5 LEle produced tall shoots (longer internodes) and the line
designated BC5 lele produced shorter shoots (shorter internodes) when seed of the 5th backcross
generation was germinated (the BC6 and BC7 LEle, and BC6 and BC7 lele lines produced
similar phenotypes to the BC5 lines).
Growth conditions for phenotype characterization
Mature air-dried seeds were planted at a depth of approximately 2.5 cm into Sunshine Mix
#4 (Sungro Horticulture, Seba Beach, AB) potting medium in 1.5 L plastic pots (one seed per
pot). Pots were arranged in a completely randomized design in a growth chamber and grown at
19oC/17oC (day/night) with a 16/8-h photoperiod under cool-white fluorescent lights
(F54/I5/835/HO fluorescent bulbs, Phillips, Holland; 366 µE m2 s-2). Lateral shoots were
removed as they emerged in order to facilitate maximum extension of the main stem.
Morphological assessment
We recorded the total number of internodes at plant maturity (the first internode was
defined as the one between the cotyledon attachment and the first stem node; see Supplementary
Fig. S1). The length of each internode was measured at maturity from position 1 to 20, as were
the number of nodes to first flower, and the number of fruits aborted before the first fruit was set.
The area of the larger stipule of each pair at specific nodes was measured at maturity using a leaf
area meter (LI-3100 Area Meter, LI-COR, Inc. Lincoln, Nebraska, USA). The petiole length of
tendrils at selected nodes was measured at maturity from the point of attachment to the main
stem to the first tendril branching point. The data presented are from one experiment consisting
of eight to 10 plants per line, i.e. biological replications. These morphological assessment
experiments have been repeated twice over time with TG1 and C1 lines, and two to four times at
selected internodes and nodes with all lines. The morphological data were analyzed using the
General Linear Model of SAS 9.1 statistical software (SAS Institute Inc., Cary, NC, USA) using
a completely randomized design. Means were separated by LSD at P≤0.05.
Tissue harvest for gene expression and GA analyses
Three different vegetative organs (internode, tendril petiole and stipule) were harvested for
gene expression and GA analyses. Internodes from position 8 (between nodes 7 and 8) were
www.plantphysiol.orgon March 16, 2019 - Published by Downloaded from Copyright © 2013 American Society of Plant Biologists. All rights reserved.

25
harvested when they were approximately 15-20% of final length. Tendril petioles were harvested
at 4 different maturity stages: 10-15% of final length (stage 1), 35-40% of final length (stage 2),
75-80% of final length (stage 3) and at maturity (stage 4). Stipules were also harvested at 4
different maturity stages: 15-20% of final size (stage 1), 35-40% of final size (stage 2), 75-80%
of final size (stage 3) and at maturity (stage 4). All tendril and stipule tissues for analysis at
stages 2, 3 and 4 were collected from node eight. In order to obtain enough tissue for RNA
isolation from the smallest development stage (stage 1), tendril and stipule tissues from nodes 7
and 8 were pooled. To study the gene expression patterns in the fruit, pericarps (without seeds)
were harvested when they were at 2 DAA. The gene expression data presented are results from
one experiment consisting of three biological replicates for each tissue and stage. Each replicate
thus contained tissues from two individual plants. In addition, two to three independent gene
expression experiments using internodes, tendrils, and stipules of selected growth stages were
also run for comparison.
For GA analyses, internodes from position 8 (between nodes 7 and 8; Supplementary Fig.
S1) were harvested when they were approximately 50% of final length; tendrils and stipules at
node eight were also harvested when at approximately 40% and 80% of final size. The data are
from one experiment, where two biological replicates per tissue were collected (each replicate
usually contained tissues from nearly two hundred plants). Tissues were immediately frozen in
liquid nitrogen upon harvesting and stored at -80oC until RNA was extracted, or freeze-dried
prior to analysis of endogenous GAs.
Light microscopy
Internodes from position 2 (between nodes 1 and 2) were harvested at maturity for
histological studies from pea seedlings of two transgenic lines (TG1 and TG2) and the control
line C1 (transgenic null control line 1). Internode sections (5 mm sections from the uppermost
part of the internode) were harvested into a fixing solution containing 2.5% (v/v) glutaraldehyde
in 0.1M phosphate buffer at pH 7.5, embedded in paraffin, sectioned into 7 µm thick cross-
sections, mounted on slides, and stained with 1% (w/v) safranin O and 0.25% (w/v) fast green
FCF. The cross-sectional areas were estimated as described in the Supplemental Materials and
Methods section. For histochemical analysis of GUS activity, fresh pea tissues (internode,
tendril petiole, and stipule leaf tissues) were harvested, then immediately submerged in GUS
www.plantphysiol.orgon March 16, 2019 - Published by Downloaded from Copyright © 2013 American Society of Plant Biologists. All rights reserved.

26
staining buffer containing 1 mM 5-bromo-4-chloro-3-indolyl β-D-glucuronide (BIOSYNTH,
Switzerland), 100 mM sodium phosphate (pH 7.5), 0.5 mM potassium ferricyanide, 0.5 mM
potassium ferrocyanide, and 10 mM EDTA (Jefferson et al. 1987). The tissues were incubated at
37oC for 5 to 6 h; rinsed in 70% ethanol; then fixed in FAA (4% formaldehyde, 5% acetic acid,
50% ethanol) for 2 days under vacuum. The tissues were then embedded in paraffin, sectioned
into 10 µm thick cross-sections, mounted on slides, and micrographs obtained as described in the
Supplemental Materials and Methods section. Fruits at 2 DAA were cut in the longitudinal
direction (exposing cut surfaces of the dorsal and ventral pericarp walls) then immediately
emerged into the GUS staining buffer under vacuum and incubated for 30 min. The fruits were
then incubated at 37oC for 27 h. The fruit GUS staining pattern was observed under a ZEISS
stereo microscope after rinsing the tissue with 70% ethanol.
RNA extraction and qRT-PCR gene expression analysis
Plant tissues were finely ground in liquid nitrogen and total RNA was isolated using a
modified TRIzol (Invitrogen) protocol (Ayele et al., 2006) as described in the Supplemental
Materials and Methods section. For qRT-PCR, primers and probe for the transgene PsGA3ox1
quantifying amplicon (TPsGA3ox1-130) were designed using Primer Express software (version
3, Applied Biosystems, Foster City, CA, USA) to produce a transgene-specific quantifying
amplicon: forward primer: 5’-AAC ATT TCA ACA AAG CAC TCT CAT CT-3’; reverse
primer: 5’-GGG CTG CAG GAA TTC GAT ATC-3’; Probe: 5’-AGT GTC CAA GTG GGC
TA-3’ (Supplementary Fig. S12). The amplicon spans the 3’ coding region of PsGA3ox1 (LE)
through to a small remnant vector sequence situated prior to the NOS terminator sequence, thus
providing specificity for the transgenic PsGA3ox1 transcript. The qRT-PCR product produced by
the TPsGA3ox1-130 primers was separated on a 0.8% (w/v) agarose gel, purified from the gel
using a Qiagen gel elution kit, and directly sequenced using the Applied Biosystems 3.1 Dye
terminator method at the Molecular Biology Facility, University of Alberta.
The TPsGA3ox1-130 primers produced a single product with the desired length
(Supplementary Fig. S13) and sequencing of the fragment further confirmed the specificity of the
primers for transgenic PsGA3ox1 mRNA. Primers and probes for the target gene quantifying
amplicon PsGA3ox1-87 [used for total PsGA3ox1 (endogenous+ transgene) transcript
quantitation] and for the reference gene amplicon, 18S-62 (used for pea 18S rRNA transcript
www.plantphysiol.orgon March 16, 2019 - Published by Downloaded from Copyright © 2013 American Society of Plant Biologists. All rights reserved.
27
quantitation) were designed as described by Ozga et al. (2003). Primers and probes for the target
gene quantifying amplicon GA2ox1-73 (used for PsGA2ox1 quantification), GA2ox2-83 (used
for PsGA2ox2 quantification), PsGA20ox1-104 (used for PsGA20ox1 quantification), and
GA20ox2-88 (used for PsGA20ox2 quantification) were designed as described by Ayele et al.
(2006). Primers and probes for the PsGA3ox2 quantitation (PsGA3ox2-104) were designed as
described by Ozga et al. (2009).
Quantitative real-time RT-PCR assays were performed on a model 7700 sequence detector
(Applied Biosystems) using a TaqMan One-Step RT-PCR Master Mix reagent kit (Applied
Biosystems) as described by Ayele et al. (2006, and the Supplemental Materials and Methods
section). The relative transcript abundance of the target genes in the individual plant sample was
determined by 2-ΔCt (Livak and Schmittgen, 2001) where ΔCt was the difference between the Ct
of the target sample and the average Ct of the reference sample. Transcript levels of PsGA20ox1,
PsGA20ox2, transgenic PsGA3ox1, total (transgenic + endogenous) PsGA3ox1, PsGA2ox1, and
PsGA2ox2 were standardized across genes, tissues and developmental stages using the lowest
sample average Ct value (38; from sample TG1 tendril stage 2, PsGA20ox2). At least two, more
often three plants were used as biological replicates for these assays. The pea 18S small subunit
nuclear ribosomal RNA gene was used as a loading control to estimate variation in input total
RNA concentration across all samples. The coefficient of variation (CV) of the 18S rRNA
amplicon Ct value across all samples was 2.7% and, therefore, the target amplicon mRNA values
were not normalized to the 18S signal (Livak and Schmittgen, 2001, Ozga et al., 2009).
Analysis of endogenous hormone levels
Endogenous GAs and ABA in the elongating internodes (approximately 50% of the final
size), and GAs in developing tendrils (approximately 40% and 80% of the final size) and
developing stipules (approximately 40% and 80% of the final size) were identified and
quantified using a gas chromatograph connected to a mass spectrometer using the selected ion
monitoring mode with stable-isotope labeled internal standards (method adapted from Kurepin et
al. 2007 as described in the Supplemental Materials and Methods section).
ACKNOWLEDGMENTS
www.plantphysiol.orgon March 16, 2019 - Published by Downloaded from Copyright © 2013 American Society of Plant Biologists. All rights reserved.

28
We would like to thank Natalie Labbe for construction of the PsGA3ox1plasmid vector, Dr.
John Mahon (National Research Council of Canada, Saskatoon) for providing the 35S-GUS
plasmid vector, and many past and current members of the Ozga-Reinecke lab that worked on
aspects of pea transformation and transgenic characterization.
SUPPLEMENTAL MATERIAL
Supplementary Figure S1. Node and internode numbering scheme.
Supplementary Figure S2: Vegetative phenotypic comparison of transgenic TG3 and its
transgenic null.
Supplementary Figure S3. Internode GA biosynthesis and catabolism gene expression profiles
of transgenic TG3 and its transgenic null.
Supplementary Figure S4. Tendril petiole GA biosynthesis and catabolism gene expression
profiles of transgenic TG3 and its transgenic null.
Supplementary Figure S5. Stipule GA biosynthesis and catabolism gene expression profiles of
transgenic TG3 and its transgenic null.
Supplementary Figure S6: Representative micrographs of CaMV-35S-driven GUS expression
in pea tissues.
Supplementary Figure S7: Diagram of the CaMV 35S-PsGA3ox1 (LE) and the CaMV 35S-
GUS plasmid constructs
Supplementary Figures S8 and S9: Confirmation of the stable integration of transgenic
PsGA3ox1 into host DNA.
Supplementary Figures S10 and S11: Confirmation of the presence of transgenic PsGA3ox1
transcript in transformed pea lines.
Supplementary Figures S12 and S13: Confirmation of qRT-PCR quantifying amplicon
TPsGA3ox1-130.
Supplementary Table S1: Reproductive phenotype comparison of the transgenic TG3 and its
transgenic null lines.
Supplementary Table S2: Cross-sectional areas of internode 2 in transgenic TG1 and TG2, and
null control (C1) lines.
Supplementary Table S3: PsGA2ox transcript abundance in pea stipules over development of
TG1, TG2 and C1 lines.
www.plantphysiol.orgon March 16, 2019 - Published by Downloaded from Copyright © 2013 American Society of Plant Biologists. All rights reserved.

29
SupplementaryProtocols:
Transformation and selection protocol
Confirmation of stable gene transformation into plant genome
Confirmation of transgene PsGA3ox1 mRNA
Light microscopy
RNA extraction
qRT-PCR gene expression analysis
Analysis of endogenous hormone levels
www.plantphysiol.orgon March 16, 2019 - Published by Downloaded from Copyright © 2013 American Society of Plant Biologists. All rights reserved.
30
LITERATURE CITED
Ayele BT, Ozga JA, Reinecke DM (2006) Regulation of GA biosynthesis genes during
germination and young seedling growth of pea (Pisum sativum L.). J Plant Growth Regul
25: 219-232
Ayele BT, Ozga JA, Wickramarathna AD, Reinecke DM (2012) Gibberellin metabolism and
transport during germination and young seedling growth of pea (Pisum sativum L.). J Plant
Growth Regul 31: 235–252
Bean SJ, Gooding PS, Mullineaux PM (1997) A simple system for pea transformation. Plant
Cell Rep 16: 513-519
Besnard-Wibaut C, Noin M, Zeevaart JAD (1983) Mitotic activities and levels of nuclear
DNA in the apical meristem of Silene armeria (Strain S1.2) following application of
gibberellin A3. Plant Cell Physiol 24: 1269-1279
Biemelt S, Tschiersch H, Sonnewald U (2004) Impact of altered gibberellin metabolism on
biomass accumulation, lignin biosynthesis and photosynthesis of transgenic tobacco plants.
Plant Physiol 135: 254-265
Coles JP, Phillips AL, Croker SJ, Garcia-Lepe R, Lewis MJ, Hedden P (1999) Modification
of gibberellin production and plant development in Arabidopsis by sense and antisense
expression of gibberellin 20-oxidase genes. Plant J 17: 547-556
Davidson SE, Swain SM, Reid JB (2005) Regulation of the early GA biosynthesis pathway in
pea. Planta 222: 1010-1019
Dennis FG (1973) Physiological control of fruit set and development with growth regulators.
Acta Hort 34: 251-259
Elliott RC, Ross JJ, Smith JJ, Lester DR, Reid JB (2001) Feed-forward regulation of
gibberellin deactivation in pea. J Plant Growth Regul 20:87-94
Eriksson M, Israelsson M, Olsson O, Moritz T (2000) Increased gibberellin biosynthesis in
transgenic trees promotes growth, biomass production and xylem fiber length. Nature
Biotech 18: 784-788
Fagoaga C, Tadeo FR, Iglesias DJ, Huerta L, Lliso I, Vidal AM, Talon M, Navarro L,
Gracia-Martinez JL, Pena L (2007) Engineering of gibberellin levels in citrus by sense
www.plantphysiol.orgon March 16, 2019 - Published by Downloaded from Copyright © 2013 American Society of Plant Biologists. All rights reserved.

31
and antisense overexpression of a GA 20-oxidase gene modifies plant architecture. J Exp
Bot 58: 1407-1420
Fleet CM, Yamaguchi S, Hanada A, Kawaide H, David CJ, Kamiya Y, Sun T-p (2003)
Overexpression of AtCPS and AtKS in Arabidopsis confers increased ent-kaurene
production but no increase in bioactive gibberellins. Plant Physiol 132: 830-839
Gallego-Giraldo L, Ubeda-Tomas S, Gisbert C, Garcia-Martinez JL, Moritz T, Lopez-Diaz
I (2008) Gibberellin homeostasis in tobacco is regulated by gibberellin metabolism genes
with different gibberellin sensitivity. Plant Cell Physiol 49: 679-690
Grant JE, Cooper PA, McAra AE, Frew TJ (1995) Transformation of peas (Pisum sativum L.)
using immature cotyledons. Plant Cell Rep 15: 254-258
Hedden P, Phillips AL (2000a) Manipulation of hormone biosynthetic genes in transgenic
plants. Curr Opin Biotech 11: 130-137
Hedden P, Phillips AL (2000b) Gibberellin metabolism: new insights revealed by the genes.
Trends Plant Sci 5: 523-530
Hedden P, Thomas SG (2012) Gibberellin biosynthesis and its regulation. Biochem J: 444: 11-
25
Huang S, Raman AS, Ream JE, Fujiwara H, Cerny RE, Brown SM (1998) Overexpression
of 20-oxidase confers a gibberellin-over production phenotype in Arabidopsis. Plant Physiol
118: 773-781
Ingram TJ, Reid JB, Murfet IC, Gaskin P, Willis CL, MacMillan J (1984) Internode length
in Pisum: The Le gene controls the 3β-hydroxylation of gibberellin A20 to gibberellin A1.
Planta 160: 455-463
Israelson M, Sundberg B, Moritz T (2005) Tissue-specific localization of gibberellins and
expression of gibberellin-biosynthetic and signaling genes in wood forming tissues in aspen.
Plant J 44: 494-504
Israelsson M, Mellerowicz E, Chono M, Gullberg J, Moritz T (2004) Cloning and
overproduction of gibberellin 3-oxidase in hybrid aspen trees. Effects on gibberellin
homeostasis and development. Plant Physiol 135: 221-230
Kelly MO, Davies PJ (1986) Genetic and photoperiodic control of the relative rates of
reproductive and vegetative development in peas. Ann Bot 58: 13-21
www.plantphysiol.orgon March 16, 2019 - Published by Downloaded from Copyright © 2013 American Society of Plant Biologists. All rights reserved.
32
Kurepin LV, Emery RJN, Pharis RP, Reid DM (2007) Uncoupling light quality from light
irradiance effects in Helianthus annuus shoots: putative roles for plant hormones in leaf and
internode growth. J Exp Bot 58: 2145-2157
Lee DJ, Zeevaart JAD (2005) Molecular cloning of GA 2-oxidase3 from spinach and its
ectopic expression in Nicotiana sylvestris. Plant Physiol 138: 243-254
Lee DJ, Zeevaart JAD (2007) Regulation of gibberellin 20-oxidase1 expression in spinach by
photoperiod. Planta 226: 35-44
Livak KJ, Schmittgen TD (2001) Analysis of relative gene expression data using real-time
quantitative PCR and the 2-ΔΔCt method. Methods 25: 402-408
Lester DR, Ross JJ, Davies PJ, Reid JB (1997) Mendel’s stem length gene (Le) encodes a
gibberellin 3β-hydroxylase. Plant Cell 9: 1435-1443
Lester DR, Ross JJ, Smith JJ, Elliott RC, Reid JB (1999) Gibberellin 2-oxidation and the SLN
gene of Pisum sativum. Plant J 19: 65-73
Martin DN, Proebsting WM, Parks TD, Dougherty WG, Lange T, Lewis MJ, Gaskin P,
Hedden P (1996) Feed-back regulation of gibberellin biosynthesis and gene expression in
Pisum sativum L. Planta 200:159-166
Martin DN, Proebsting WM, Hedden P (1997) Mendel’s dwarfing gene: cDNAs from the Le
alleles and function of the expressed proteins. Proc Natl Acad Sci USA 94: 8907–8911
Martin DN, Proebsting WM, Hedden P (1999) The SLENDER gene of pea encodes a
gibberellin 2-oxidase. Plant Physiol 121: 775–781
Nadeau CD, Ozga JA, Kurepin LV, Jin A, Pharis RP, Reinecke DM (2011) Tissue-specific
regulation of gibberellin biosynthesis in developing pea seeds. Plant Physiol 156: 897-912
Oikawa T, Koshioka M, Kojima K, Yoshida H, Kawata M (2004) A role of OsGA20ox1,
encoding an isoform of gibberellin 20-oxidase, for regulation of plant stature in rice. Plant
Mol Biol 55: 687-700
O’Neill DP, Ross JJ (2002) Auxin regulation of the gibberellin pathway in pea. Plant Physiol
130: 1974-1982
Ozga JA, Brenner ML, Reinecke DM (1992) Seed effects on gibberellin metabolism in pea
pericarp. Plant Physiol 100: 88-94
Ozga JA, Reinecke DM (2003) Hormonal interactions in fruit development. J Plant Growth
Regul 22: 73-81
www.plantphysiol.orgon March 16, 2019 - Published by Downloaded from Copyright © 2013 American Society of Plant Biologists. All rights reserved.

33
Ozga JA, Reinecke DM, Ayele BT, Ngo P, Nadeau C, Wickramarathna AD (2009)
Developmental and hormonal regulation of gibberellin biosynthesis and catabolism in pea
fruit. Plant Physiol 150: 448-462
Ozga JA, Yu J, Reinecke DM (2003) Pollination-, development-, and auxin-specific regulation
of gibberellin 3β-hydroxylase gene expression in pea fruit and seeds. Plant Physiol 131:
1137-1146
Pharis RP, King RW (1985) Gibberellins and reproductive development in seed plants. Annu
Rev Plant Physiol 36: 517-568
Phillips AL (2004) Genetic and transgenic approaches to improving crop performance. In PJ
Davies, ed, Plant hormones: biosynthesis, signal transduction, action! Ed 3. Springer,
Dordrecht, The Netherlands, pp 582-609
Proebsting WM, Davies PJ, Marx GA (1978) Photoperiod-induced changes in gibberellin
metabolism in relation to apical growth and senescence in genetic lines of peas (Pisum
sativum L.). Planta 141: 231-238
Proebsting WM, Hedden P, Lewis MJ, Croker SJ, Proebsting LN (1992) Gibberellin
concentration and transport in genetic lines of pea. Plant Physiol 100:1354-1360
Radi A, Lange T, Niki T, Koshioka M, Lange MJP (2006) Ectopic expression of pumpkin
gibberellin oxidases alters gibberellin biosynthesis and development of transgenic
Arabidopsis plants. Plant Physiol 140: 528-536
Reid JB, Ross JJ, Swain SM (1992) Internode length in Pisum. A new slender mutant with
elevated levels of C19 gibberellins. Planta 188: 462-467
Ross JJ, Davidson SE, Wolbang CM, Bayly-Stark E, Smith JJ, Reid JB (2003)
Developmental regulation of the gibberellin pathway in pea shoots. Funct Plant Biol 30: 83-
89
Ross JJ, Reid JB, Dungey HS (1992) Ontogenetic variation in levels of gibberellin A1 in Pisum.
Implications for the control of stem elongation. Planta 186: 166-171
Ross JJ, Reid JB, Gaskin P, MacMillan J (1989) Internode length in Pisum. Estimation of
GA1 levels in genotypes Le, le and led. Physiol Plant 76: 173-176.
Ross JJ, Weston DE, Davidson SE, Reid JB (2011) Plant hormone interactions : how complex
are they? Physiol Plant 141: 299-309.
www.plantphysiol.orgon March 16, 2019 - Published by Downloaded from Copyright © 2013 American Society of Plant Biologists. All rights reserved.

34
Ross JJ, Reid JB, Swain SM (1993) Control of stem elongation by gibberellin A1: Evidence
from genetic studies including the slender mutant sln. Aust J Plant Physiol 20: 585-599.
Santes CM, Hedden P, Sponsel VM, Reid JB, Garcia-Martinez JL (1993) Expression of the
le mutation in young ovaries of Pisum sativum and its effect on fruit development. Plant
Physiol 101: 759-764.
Schroeder HE, Schotz AH, Wardley-Richardson T, Spencer D, Higgins TJV (1993)
Transformation and regeneration of two cultivars of pea (Pisum sativum L.). Plant Physiol
101: 751-757
Smith V A, Knatt CJ, Gaskin P, Reid JB (1992) The distribution of gibberellins in vegetative
tissues of Pisum sativum L. I. Biological and biochemical consequences of the le mutation.
Plant Physiol 99: 368–371
Stavang JA, Lindgard B, Erntsen A, Lid SE, Moe R, Olsen JE (2005) Thermoperiodic stem
elongation involves transcriptional regulation of gibberellins deactivation in Pea. Plant
Physiol 138: 2344-2353
Swain SM, Sing DP, Helliwell CA, Poole AT (2005) Plants with increased expression of ent-
kaurene oxidase are resistant to chemical inhibitors of this gibberellin biosynthesis enzyme.
Plant Cell Physiol 46: 284-291
Thomas SG, Phillips AL, Hedden P (1999) Molecular cloning and functional expression of
gibberellin 2-oxidases, multifunctional enzymes involved in gibberellin deactivation. Proc
Natl Acad Sci USA 96: 4698-4703
Vidal AM, Gisbert C, Talon M, Primo-Millo E, Lopez-Diaz I, Garcia-Martinez JL (2001)
The ectopic over-expression of a citrus gibberellin 20-oxidase enhances the non 13-
hydroxylation pathway of gibberellin biosynthesis and induces an extremely elongated
phenotype in tobacco. Physiol Plant 112: 251-260
Wickramarathna AD (2009) Characterization of gibberellin overexpression lines in pea. PhD
Thesis, University of Alberta, Edmonton, Alberta, Canada.
Yang T, Davies PJ, Reid JB (1996) Genetic dissection of the relative roles of auxin and
gibberellin in the regulation of stem elongation in intact light-grown peas. Plant Physiol
110: 1029-1034
Yeung EC, Sussex IM (1979) Embryogeny of Phaseolus coccineus: The suspensor and the
growth of the embryo-proper in vitro. Z Pflanzenphysiol 91: 423-433
www.plantphysiol.orgon March 16, 2019 - Published by Downloaded from Copyright © 2013 American Society of Plant Biologists. All rights reserved.

35
Zhu Y-X, Davies PJ (1997) The control of apical bud growth and senescence by auxin and
gibberellin in genetic lines of peas. Plant Physiol 113: 631-637
FIGURE LEGENDS Figure 1: The latter part of the early 13-hydroxylation GA biosynthesis and catabolism pathway
in pea. GA12 is 13-hydroxylated to GA53; carbon 20 is sequentially oxidized by a GA 20-oxidase
(coded for by PsGA20ox genes) from GA53 to GA44, to GA19 and finally to GA20. GA20 is then
oxidized by a 3β-hydroxylase (coded for by PsGA3ox genes) to GA1 (a bioactive GA). GA20 and
GA1 can each be oxidized by a 2β-hydroxylase (coded for by PsGA2ox genes) to GA29 and GA8,
respectively, the latter conversion inactivating GA1.
Figure 2: Phenotypic comparison of pea transgenic TG1 and TG2, and transgenic null control
(C1) lines (in ‘Carneval’le), and also in backcross generation 5 (BC5) LEle and BC5 lele, and
non-transformed ‘Carneval’ le control (NT-C) lines. (A) Internode length at maturity of
transgenic and transgenic null control lines from internode 1 to 20. (B) Internode length at
maturity of BC5 LEle and BC5 lele, and non-transformed ‘Carneval’ le control (NT-C) lines
from internode 1 to 20. (C) Tendril petiole length at maturity (from the point of attachment to the
stem to the first tendril branchlet) of transgenic and transgenic null control lines at different
nodal positions. (D) Stipule area at maturity of transgenic and transgenic null control lines at
different nodal positions. Data are means ± SE, n= 8 to 10. Letters indicate significant
differences among tendril length and stipule area within nodal position by LSD at P<0.05.
Figure 3: Representative light micrographs of mature internodes at position 2 for the transgenic
lines TG1 and TG2, and the null control C1 line. Stem transverse cross-sections at 2.5x
magnification (A) and at 10x magnification focusing on the vascular stele region of the stem (B).
cfb, cortical fiber bundle; co, cortex; cvb, cortical vascular bundle; la, lacunae; ph, phloem; vs,
vascular stele; xy, xylem.
Figure 4: GA biosynthesis and catabolism gene expression profiles in the tendril petioles of pea
transgenic TG1and TG2 and transgenic null control (C1) lines across development. Relative
www.plantphysiol.orgon March 16, 2019 - Published by Downloaded from Copyright © 2013 American Society of Plant Biologists. All rights reserved.

36
transcript abundance of PsGA20ox1 (A and B), PsGA20ox2 (C and D), transgenic PsGA3ox1
(E), total PsGA3ox1 (transgenic + endogenous; F and G), PsGA2ox1 (H and I), and PsGA2ox2 (J
and K) in pea tendril petioles. Tendril petioles were harvested at 10-15% of final length (stage
1), 35-40% of final length (stage 2), 75-80% of final length (stage3), and at maturity (stage 4).
Transcript levels were compared across all genes and lines using the Ct value of 38 as a
reference for normalization. Data are means ± SE of two to three biological replicates. Y-axis
scales in graphs are consistent across the same gene.
Figure 5: Endogenous GA concentrations in pea tendril petioles. GA20 (A), GA1 (B), GA8 (C),
and GA29 (D) levels were quantified in elongating tendril petioles at approximately 40% (stage
2) and 80% full length (stage 3) at nodal position 8 of the transgenic lines TG1 and TG2, and the
transgenic null control line C1. Data are means ± SE, n= 2, with one exception, 40% full length
tendrils of TG1, n=1.
Figure 6: GA biosynthesis and catabolism gene expression profiles in the stipules of pea
transgenic TG1and TG2 and transgenic null control (C1) lines across development. Relative
transcript abundance of PsGA20ox1 (A and B), PsGA20ox2 (C and D), transgenic PsGA3ox1
(E), total PsGA3ox1 (transgenic + endogenous; F and G), PsGA2ox1 (H and I), PsGA2ox2 (J and
K) is shown in pea stipules harvested at 15-20% of final size (stage 1), 35-40% of final size
(stage 2), 75-80% of final size (stage3) and at maturity (stage 4). Transcript levels were
compared across all genes and lines using the Ct value of 38 as a reference for normalization.
Data are means ± SE of two to three biological replicates. Y-axis scales in graphs are consistent
across the same gene.
Figure 7: Endogenous GA concentrations in pea stipules. GA20 (A), GA1 (B), GA8 (C), and GA29
(D) levels were quantified in stipules at approximately 40% (stage 2) and 80% full size (stage 3)
at nodal position 8 of transgenic lines TG1 and TG2, and the transgenic null control line C1.
Data are means ± SE, n= 1 for 40% full size samples, n= 2 for 80% full size samples.
www.plantphysiol.orgon March 16, 2019 - Published by Downloaded from Copyright © 2013 American Society of Plant Biologists. All rights reserved.

37
Table I. Relative transcript abundance of late GA biosynthesis and catabolism genes in elongating internode 8 (harvested at 15-20% of final length) for transgenic (TG1 and TG2), transgenic null (C1), backcrossed (BC LEle and BC lele), and non-transformed control (NTC1 and NTC2) lines.
TG1 a TG2 a C1 a NTC1 a BC LEle b BC lele b NTC2 b
PsGA20ox1 44,620 c ±
4862d 66,610 ± 11,920
25,110 ± 2297
45,070 ± 4696
11,310 ± 234
45,440 ± 3677
42,040 ± 4045
PsGA20ox2 3.3 ± 0.3 186 ± 13 23.1 ± 2.7 43.7 ± 5.1 1.4 ± 0.1 0.3 ± 0.1 20.7 ± 1.4
Total PsGA3ox1 (transgenic
+endogenous)
106,000 ± 7621
34,770 ± 2230
22,850 ± 1687
29,960 ± 3181
13,050 ± 948
35,490 ± 2711
30,430 ± 1740
PsGA3ox1 (transgenic)
4819 ± 354 856 ± 142 nde npf np np np
PsGA3ox2 nag na na na nd nd nd
PsGA2ox1 5393 ± 656 4527 ± 416 1284 ± 125 926 ±136 181 ± 23 166 ± 5 106 ± 19
PsGA2ox2 2638 ± 187 6376 ± 1036 2966 ± 155 2983 ± 236 2,757 ± 191 1,256 ± 87 704 ± 10
a The TG1, TG2, C1 and NTC1 pea lines (all in a lele genetic background) were grown together under the same environmental conditions using a completely randomized design and relative transcript abundance was assessed in these lines in the same qRT-PCR experiments. b The BC LEle, BC lele (where 6 backcross generations to ‘Carneval’ (le) were performed to generate these lines, BC6) and NTC2 pea lines were grown together under the same environmental conditions using a completely randomized design and relative transcript abundance was assessed in these lines in the same qRT-PCR experiments. c Transcript levels were standardized across genes using the Ct value of 38 as reference for normalization. d Data are means ± SE, n= 3 to 4; e not detected; f np, not present in this line; g na, not available; as PsGA3ox2 transcripts were not detected in previous transgenic internode samples, the abundance of this gene was not assessed in these samples.
w
ww
.plantphysiol.orgon M
arch 16, 2019 - Published by
Dow
nloaded from
Copyright ©
2013 Am
erican Society of P
lant Biologists. A
ll rights reserved.
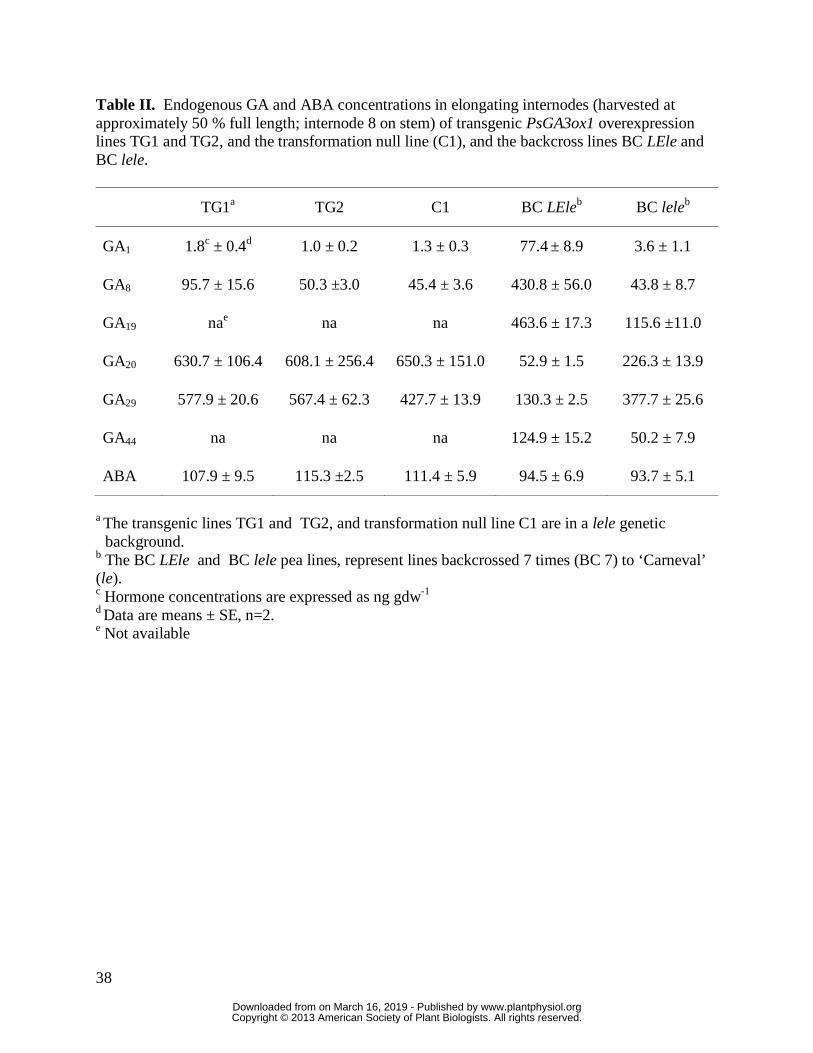
38
Table II. Endogenous GA and ABA concentrations in elongating internodes (harvested at approximately 50 % full length; internode 8 on stem) of transgenic PsGA3ox1 overexpression lines TG1 and TG2, and the transformation null line (C1), and the backcross lines BC LEle and BC lele.
TG1a TG2 C1 BC LEleb BC leleb
GA1 1.8c ± 0.4d 1.0 ± 0.2 1.3 ± 0.3 77.4 ± 8.9 3.6 ± 1.1
GA8 95.7 ± 15.6 50.3 ±3.0 45.4 ± 3.6 430.8 ± 56.0 43.8 ± 8.7
GA19 nae na na 463.6 ± 17.3 115.6 ±11.0
GA20 630.7 ± 106.4 608.1 ± 256.4 650.3 ± 151.0 52.9 ± 1.5 226.3 ± 13.9
GA29 577.9 ± 20.6 567.4 ± 62.3 427.7 ± 13.9 130.3 ± 2.5 377.7 ± 25.6
GA44 na na na 124.9 ± 15.2 50.2 ± 7.9
ABA 107.9 ± 9.5 115.3 ±2.5 111.4 ± 5.9 94.5 ± 6.9 93.7 ± 5.1
a The transgenic lines TG1 and TG2, and transformation null line C1 are in a lele genetic
background. b The BC LEle and BC lele pea lines, represent lines backcrossed 7 times (BC 7) to ‘Carneval’ (le). c Hormone concentrations are expressed as ng gdw-1
d Data are means ± SE, n=2. e Not available
www.plantphysiol.orgon March 16, 2019 - Published by Downloaded from Copyright © 2013 American Society of Plant Biologists. All rights reserved.
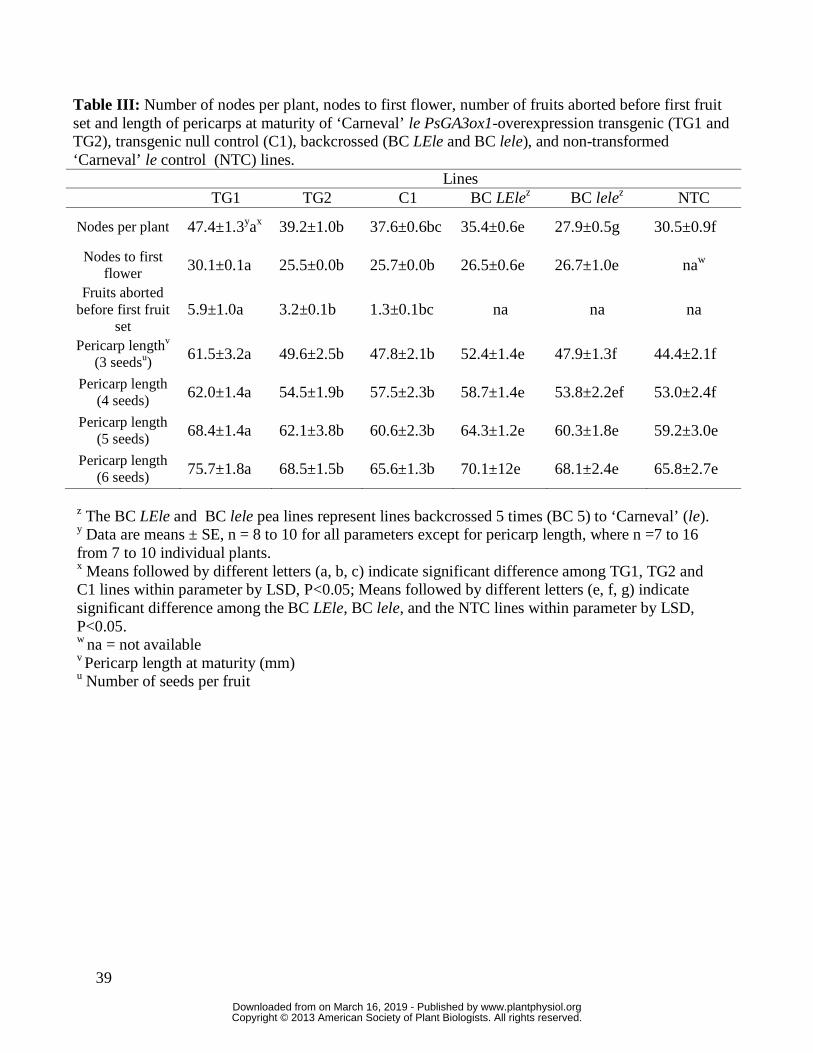
39
Table III: Number of nodes per plant, nodes to first flower, number of fruits aborted before first fruit set and length of pericarps at maturity of ‘Carneval’ le PsGA3ox1-overexpression transgenic (TG1 and TG2), transgenic null control (C1), backcrossed (BC LEle and BC lele), and non-transformed ‘Carneval’ le control (NTC) lines.
Lines TG1 TG2 C1 BC LElez BC lelez NTC
Nodes per plant 47.4±1.3yax 39.2±1.0b 37.6±0.6bc 35.4±0.6e 27.9±0.5g 30.5±0.9f
Nodes to first flower 30.1±0.1a 25.5±0.0b 25.7±0.0b 26.5±0.6e 26.7±1.0e naw
Fruits aborted before first fruit
set 5.9±1.0a 3.2±0.1b 1.3±0.1bc na na na
Pericarp lengthv (3 seedsu) 61.5±3.2a 49.6±2.5b 47.8±2.1b 52.4±1.4e 47.9±1.3f 44.4±2.1f
Pericarp length (4 seeds) 62.0±1.4a 54.5±1.9b 57.5±2.3b 58.7±1.4e 53.8±2.2ef 53.0±2.4f
Pericarp length (5 seeds) 68.4±1.4a 62.1±3.8b 60.6±2.3b 64.3±1.2e 60.3±1.8e 59.2±3.0e
Pericarp length (6 seeds) 75.7±1.8a 68.5±1.5b 65.6±1.3b 70.1±12e 68.1±2.4e 65.8±2.7e
z The BC LEle and BC lele pea lines represent lines backcrossed 5 times (BC 5) to ‘Carneval’ (le). y Data are means ± SE, n = 8 to 10 for all parameters except for pericarp length, where n =7 to 16 from 7 to 10 individual plants. x Means followed by different letters (a, b, c) indicate significant difference among TG1, TG2 and C1 lines within parameter by LSD, P<0.05; Means followed by different letters (e, f, g) indicate significant difference among the BC LEle, BC lele, and the NTC lines within parameter by LSD, P<0.05. w na = not available v Pericarp length at maturity (mm) u Number of seeds per fruit
www.plantphysiol.orgon March 16, 2019 - Published by Downloaded from Copyright © 2013 American Society of Plant Biologists. All rights reserved.
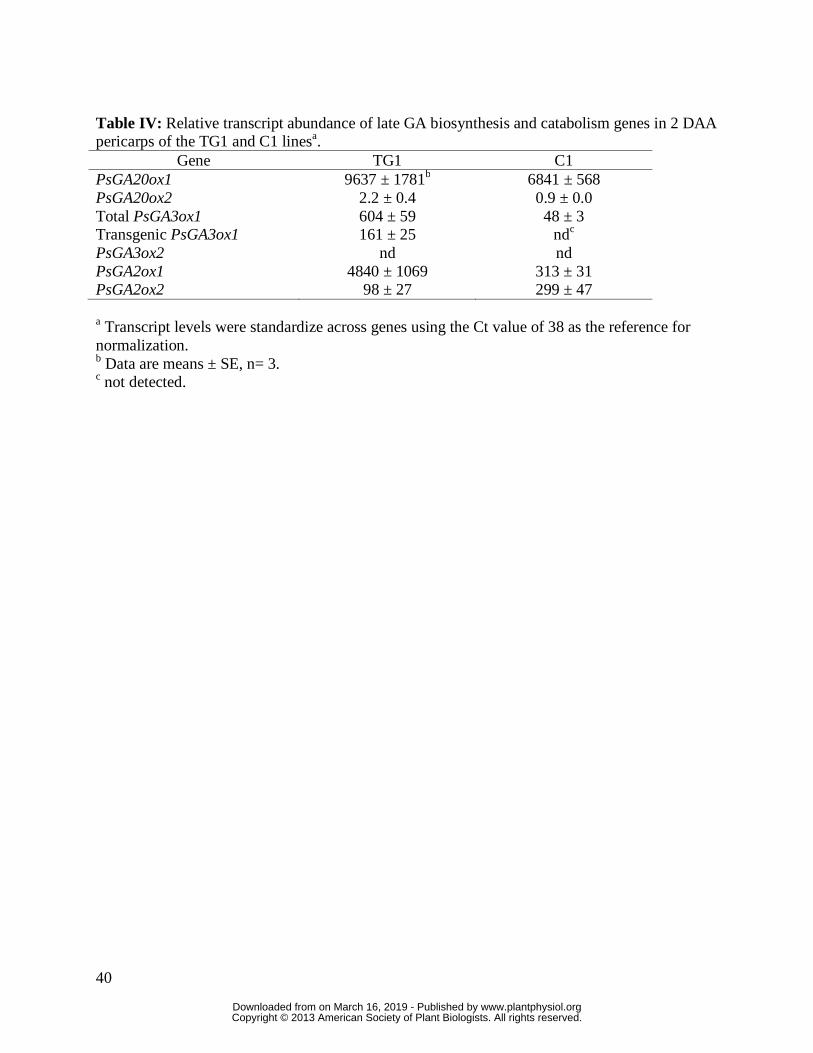
40
Table IV: Relative transcript abundance of late GA biosynthesis and catabolism genes in 2 DAA pericarps of the TG1 and C1 linesa.
Gene TG1 C1 PsGA20ox1 9637 ± 1781b 6841 ± 568 PsGA20ox2 2.2 ± 0.4 0.9 ± 0.0 Total PsGA3ox1 604 ± 59 48 ± 3 Transgenic PsGA3ox1 161 ± 25 ndc PsGA3ox2 nd nd PsGA2ox1 4840 ± 1069 313 ± 31 PsGA2ox2 98 ± 27 299 ± 47
a Transcript levels were standardize across genes using the Ct value of 38 as the reference for normalization. b Data are means ± SE, n= 3. c not detected.
www.plantphysiol.orgon March 16, 2019 - Published by Downloaded from Copyright © 2013 American Society of Plant Biologists. All rights reserved.

1
Figure 1: The latter part of the early 13-hydroxylation GA biosynthesis and catabolism pathway in pea. GA12 is 13-hydroxylated to GA53; carbon 20 is sequentially oxidized by a GA 20-oxidase (coded for by PsGA20ox genes) from GA53 to GA44, to GA19 and finally to GA20. GA20 is then oxidized by a 3β-hydroxylase (coded for by PsGA3ox genes) to GA1 (a bioactive GA). GA20 and GA1 can each be oxidized by a 2β-hydroxylase (coded for by PsGA2ox genes) to GA29 and GA8, respectively, the latter conversion inactivating GA1.
www.plantphysiol.orgon March 16, 2019 - Published by Downloaded from Copyright © 2013 American Society of Plant Biologists. All rights reserved.

2
B
Internode number
1 2 3 4 5 6 7 8 9 10 11 12 13 14 15 16 17 18 19 20
Inte
rnod
e le
ngth
(m
m)
0
5
10
15
20
25
30
35
40
45
TG1TG2C1
A B
Node 8
Node 10
Node 16
Node 25
Ten
dril
peti
ole
leng
th (
mm
)
60
70
80
90
100
110
120TG1TG2C1
a
a
b
aba
b
aab
ba
ab
bc
C
Node 6Node 8
Stip
ule
leaf
are
a (c
m2 )
4
6
8
10
12TG1TG2C1
aab
b
a a
b
D
Internode number
1 2 3 4 5 6 7 8 9 10 11 12 13 14 15 16 17 18 19 20
Inte
rnod
e le
ngth
(m
m)
0
10
20
30
40
50
60
70
80
90
100
110
BC5 LEBC5 leNT-C
B
Figure 2: Phenotypic comparison of pea transgenic TG1 and TG2, and transgenic null control (C1) lines (in ‘Carneval’le), and also in backcross generation 5 (BC5) LEle and BC5 lele, and non-transformed ‘Carneval’ le control (NT-C) lines. (A) Internode length at maturity of transgenic and transgenic null control lines from internode 1 to 20. (B) Internode length at maturity of BC5 LEle and BC5 lele, and non-transformed ‘Carneval’ le control (NT-C) lines from internode 1 to 20. (C) Tendril petiole length at maturity (from the point of attachment to the stem to the first tendril branchlet) of transgenic and transgenic null control lines at different nodal positions. (D) Stipule area at maturity of transgenic and transgenic null control lines at different nodal positions. Data are means ± SE, n= 8 to 10. Letters indicate significant differences among tendril length and stipule area within nodal position by LSD at P<0.05.
www.plantphysiol.orgon March 16, 2019 - Published by Downloaded from Copyright © 2013 American Society of Plant Biologists. All rights reserved.

3
Figure 3: Representative light micrographs of mature internodes at position 2 for the transgenic
lines TG1 and TG2, and the null control C1 line. Stem transverse cross-sections at 2.5x
magnification (A) and at 10x magnification focusing on the vascular stele region of the stem (B).
cfb, cortical fiber bundle; co, cortex; cvb, cortical vascular bundle; la, lacunae; ph, phloem; vs,
vascular stele; xy, xylem.
www.plantphysiol.orgon March 16, 2019 - Published by Downloaded from Copyright © 2013 American Society of Plant Biologists. All rights reserved.

4
1 2 3 4
Tra
nsc
rip
t Lev
el (x
10-3
)0
40
80
120
160
A
PsGA20ox1
1 2 3 4
0
40
80
120
160
B
PsGA20ox1
1 2 3 4
Tra
nsc
rip
t Lev
el (x
10-2
)
0
4
8
12
16D
1 2 3 4
0
4
8
12
16PsGA20ox2 PsGA20ox2C
1 2 3 4
Tra
nsc
rip
t Lev
el (x
10-2
)
0
25
50
75
100
Trans PsGA3ox1
1 2 3 4
Tra
nsc
rip
t Lev
el (x
10-3
)
0
40
80
120
160F
Total PsGA3ox1
1 2 3 4
Tra
nsc
rip
t Lev
el
0
100
200
300
400TG1C1
Development stage of tendril petioles
1 2 3 4
0
60
120
180
240
D
E
1 2 3 4
0
100
200
300
400TG2C1
1 2 3 4
Tra
nsc
rip
t Lev
el (x
10-2
)
0
60
120
180
240TG1C1
H I
J K
PsGA2ox1 PsGA2ox1
PsGA2ox2 PsGA2ox2
TG2C1
TG1TG2
TG1C1
TG2C1
TG1C1
TG2C1
TG1C1
1 2 3 4
0
40
80
120
160
TG2C1
G
Total PsGA3ox1
Figure 4: GA biosynthesis and catabolism gene expression profiles in the tendril petioles of pea transgenic TG1and TG2 and transgenic null control (C1) lines across development. Relative transcript abundance of PsGA20ox1 (A and B), PsGA20ox2 (C and D), transgenic PsGA3ox1 (E), total PsGA3ox1 (transgenic + endogenous; F and G), PsGA2ox1 (H and I), and PsGA2ox2 (J and K) in pea tendril petioles. Tendril petioles were harvested at 10-15% of final length (stage 1), 35-40% of final length (stage 2), 75-80% of final length (stage3), and at maturity (stage 4). Transcript levels were compared across all genes and lines using the Ct value of 38 as a reference for normalization. Data are means ± SE of two to three biological replicates. Y-axis scales in graphs are consistent across the same gene.
www.plantphysiol.orgon March 16, 2019 - Published by Downloaded from Copyright © 2013 American Society of Plant Biologists. All rights reserved.
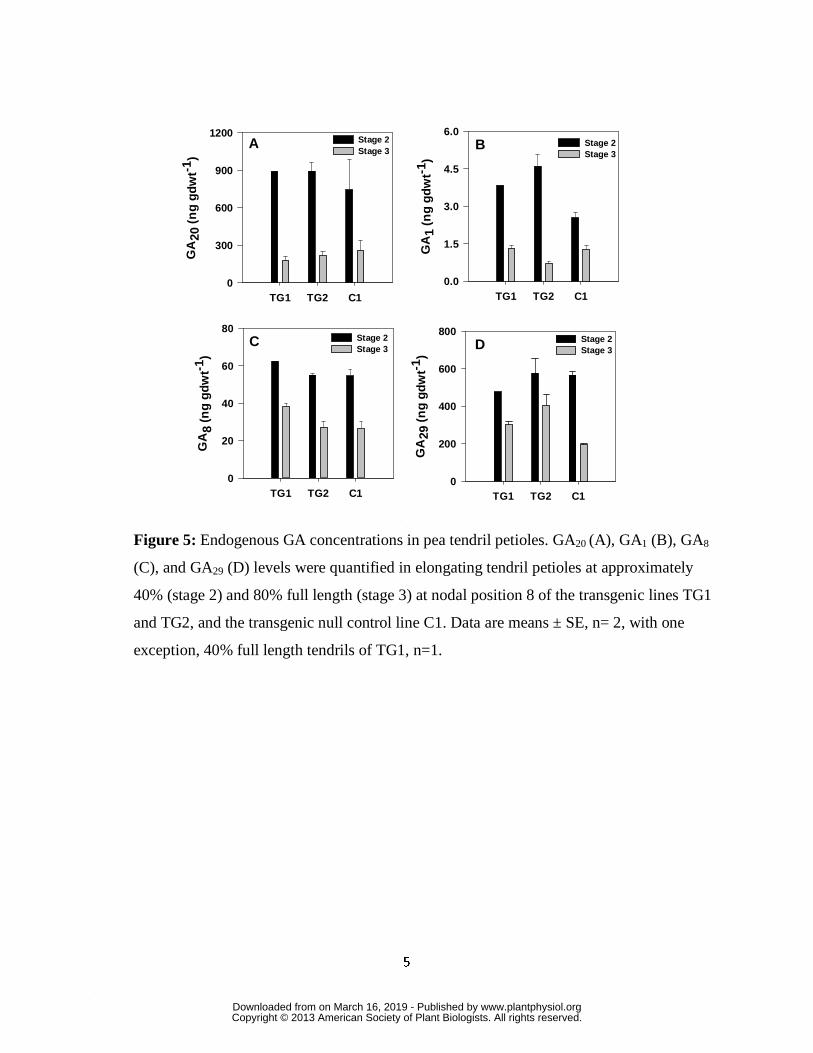
5
TG1 TG2 C1
GA
29 (
ng
gd
wt-1
)
0
200
400
600
800Stage 2Stage 3D
TG1 TG2 C1
GA
1 (n
g g
dw
t-1 )
0.0
1.5
3.0
4.5
6.0Stage 2Stage 3
B
TG1 TG2 C1
GA
8 (n
g g
dw
t-1)
0
20
40
60
80Stage 2Stage 3
C
TG1 TG2 C1
GA
20 (
ng
gd
wt-1
)
0
300
600
900
1200Stage 2Stage 3
A
Figure 5: Endogenous GA concentrations in pea tendril petioles. GA20 (A), GA1 (B), GA8
(C), and GA29 (D) levels were quantified in elongating tendril petioles at approximately
40% (stage 2) and 80% full length (stage 3) at nodal position 8 of the transgenic lines TG1
and TG2, and the transgenic null control line C1. Data are means ± SE, n= 2, with one
exception, 40% full length tendrils of TG1, n=1.
www.plantphysiol.orgon March 16, 2019 - Published by Downloaded from Copyright © 2013 American Society of Plant Biologists. All rights reserved.

6
1 2 3 4
Tra
nsc
rip
t Lev
el (x
10-3
)0
40
80
120
160
A
PsGA20ox1
1 2 3 4
0
40
80
120
160
B
PsGA20ox1
1 2 3 4
Tra
nsc
rip
t Lev
el (x
10-2
)
0
4
8
12
16D
1 2 3 4
0
4
8
12
16PsGA20ox2 PsGA20ox2C
1 2 3 4
Tra
nsc
rip
t Lev
el (x
10-2
)
0
25
50
75
100
Trans PsGA3ox1
1 2 3 4
Tra
nsc
rip
t Lev
el (x
10-3
)
0
40
80
120
160F
Total PsGA3ox1
1 2 3 4
Tra
nsc
rip
t Lev
el
0
100
200
300
400TG1C1
Development stage of tendril petioles
1 2 3 4
0
60
120
180
240
D
E
1 2 3 4
0
100
200
300
400TG2C1
1 2 3 4
Tra
nsc
rip
t Lev
el (x
10-2
)
0
60
120
180
240TG1C1
H I
J K
PsGA2ox1 PsGA2ox1
PsGA2ox2 PsGA2ox2
TG2C1
TG1TG2
TG1C1
TG2C1
TG1C1
TG2C1
TG1C1
1 2 3 4
0
40
80
120
160
TG2C1
G
Total PsGA3ox1
Figure 6: GA biosynthesis and catabolism gene expression profiles in the stipules of pea transgenic TG1and TG2 and transgenic null control (C1) lines across development. Relative transcript abundance of PsGA20ox1 (A and B), PsGA20ox2 (C and D), transgenic PsGA3ox1 (E), total PsGA3ox1 (transgenic + endogenous; F and G), PsGA2ox1 (H and I), PsGA2ox2 (J and K) is shown in pea stipules harvested at 15-20% of final size (stage 1), 35-40% of final size (stage 2), 75-80% of final size (stage3) and at maturity (stage 4). Transcript levels were compared across all genes and lines using the Ct value of 38 as a reference for normalization. Data are means ± SE of two to three biological replicates. Y-axis scales in graphs are consistent across the same gene.
www.plantphysiol.orgon March 16, 2019 - Published by Downloaded from Copyright © 2013 American Society of Plant Biologists. All rights reserved.
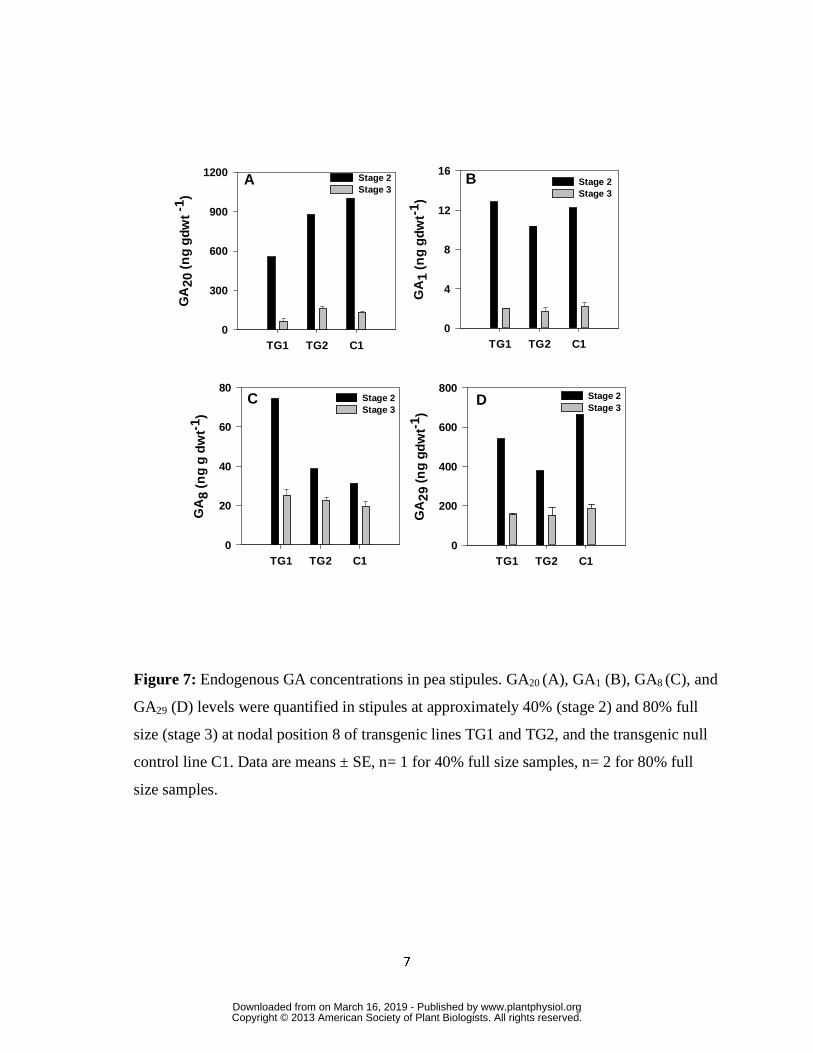
7
TG1 TG2 C1
GA
20 (
ng
gdw
t -1 )
0
300
600
900
1200 Stage 2Stage 3
A
TG1 TG2 C1
GA
1 (n
g g
dwt-
1 )
0
4
8
12
16Stage 2Stage 3
B
TG1 TG2 C1
GA
8 (n
g g
dw
t-1 )
0
20
40
60
80Stage 2Stage 3
C D
TG1 TG2 C1
GA
29 (n
g g
dw
t-1)
0
200
400
600
800Stage 2Stage 3
D
Figure 7: Endogenous GA concentrations in pea stipules. GA20 (A), GA1 (B), GA8 (C), and
GA29 (D) levels were quantified in stipules at approximately 40% (stage 2) and 80% full
size (stage 3) at nodal position 8 of transgenic lines TG1 and TG2, and the transgenic null
control line C1. Data are means ± SE, n= 1 for 40% full size samples, n= 2 for 80% full
size samples.
www.plantphysiol.orgon March 16, 2019 - Published by Downloaded from Copyright © 2013 American Society of Plant Biologists. All rights reserved.
![PEA-RP250GA PEA-RP400GA PEA-RP500GA - …H]-RP/2010-2009/... · PEA-RP250GA PEA-RP400GA PEA-RP500GA ... Cautions for units utilising refrigerant R410A ... It is also possible to attach](https://static.fdocuments.us/doc/165x107/5ad5679d7f8b9a075a8cd92b/pea-rp250ga-pea-rp400ga-pea-rp500ga-h-rp2010-2009pea-rp250ga-pea-rp400ga.jpg)