G20 subsidies to oil, gas and coal production: South ... · G20 subsidies to oil, gas and coal...
9
G20 subsidies to oil, gas and coal production: South Africa Vibhuti Garg and Lucy Kitson priceofoil.org odi.org Country Study November 2015 Argentina Australia Brazil Canada China France Germany India Indonesia Italy Japan Korea (Republic of) Mexico Russia Saudi Arabia South Africa Turkey United Kingdom United States For the purposes of this country study, production subsidies for fossil fuels include: national subsidies, investment by state-owned enterprises, and public finance. A brief outline of the methodology can be found in this country summary. The full report provides a more detailed discussion of the methodology used for the country studies and sets out the technical and transparency issues linked to the identification of G20 subsidies to oil, gas and coal production. The authors welcome feedback on both this country study and the full report to improve the accuracy and transparency of information on G20 government support to fossil fuel production. This country study is a background paper for the report Empty promises: G20 subsidies to oil, gas and coal production by Oil Change International (OCI) and the Overseas Development Institute (ODI). It builds on research completed for an earlier report The fossil fuel bailout: G20 subsidies to oil, gas and coal exploration, published in 2014. A Data Sheet with data sources and further information for South Africa’s production subsidies is available at: http://www.odi.org/publications/10083-g20-subsidies-oil-gas-coal-production-south-africa
Transcript of G20 subsidies to oil, gas and coal production: South ... · G20 subsidies to oil, gas and coal...
G20 subsidies to oil, gas and coal production: South AfricaVibhuti Garg and Lucy Kitson
priceofoil.orgodi.org
Country StudyNovember 2015
Argentina
Australia
Brazil
Canada
China
France
Germany
India
Indonesia
Italy
Japan
Korea (Republic of)
Mexico
Russia
Saudi Arabia
South Africa
Turkey
United Kingdom
United States
For the purposes of this country study, production subsidies for fossil fuels include: national subsidies, investment by state-owned enterprises, and public finance. A brief outline of the methodology can be found in this country summary. The full report provides a more detailed discussion of the methodology used for the country studies and sets out the technical and transparency issues linked to the identification of G20 subsidies to oil, gas and coal production.
The authors welcome feedback on both this country study and the full report to improve the accuracy and transparency of information on G20 government support to fossil fuel production.
This country study is a background paper for the report Empty promises: G20 subsidies to oil, gas and coal production by Oil Change International (OCI) and the Overseas Development Institute (ODI). It builds on research completed for an earlier report The fossil fuel bailout: G20 subsidies to oil, gas and coal exploration, published in 2014.
A Data Sheet with data sources and further information for South Africa’s production subsidies is available at:http://www.odi.org/publications/10083-g20-subsidies-oil-gas-coal-production-south-africa
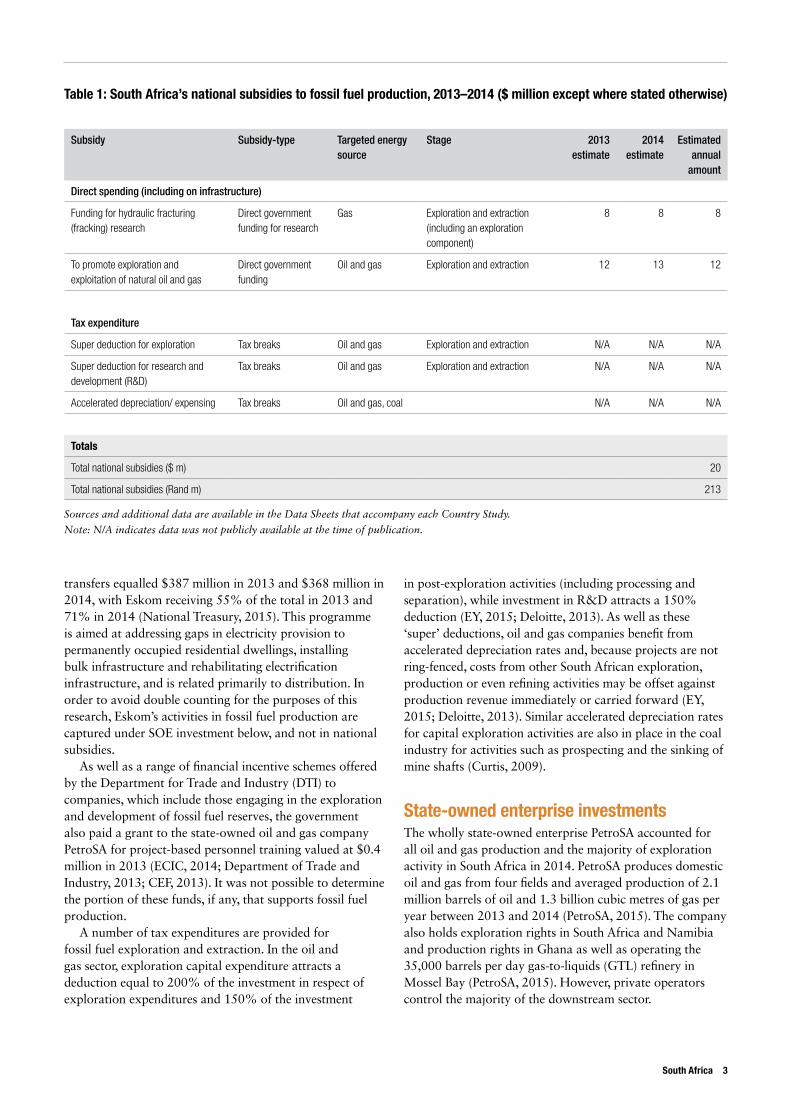
BackgroundSouth Africa has the world’s ninth largest proven reserves of coal (3.4% of the global total) (BP, 2015) equating to 95% of all of the coal in Africa (EIA, 2015). Coal dominates the South African energy sector and provided more than 70% of primary energy in 2014 (BP, 2015). It is set to continue doing so into the medium term despite the growth of renewable and other fossil energy sources (Department of Energy, 2013). As well as accounting for 85% of the country’s electricity generation (EIA, 2015), coal is also transformed into synthetic gas and petroleum fuels that are widely consumed for a multitude of end-uses.
The country has limited proved reserves of oil and natural gas, but recent government-supported exploration of offshore fields and onshore shale deposits (reportedly the eighth largest in the world) (EIA, 2015) may increase oil and gas reserves in the coming years.
Most of South Africa’s oil is imported and locally refined with the majority of consumption by the transportation sector. In Africa, the country is second only to Egypt in terms of refining, with a capacity of 503,000 barrels per day (Oil & Gas Journal, 2015). A number of pipelines to transport refined products across South Africa are being planned, with an extension of capacity of a multi-fuel pipeline between Durban and Johannesburg.
Energy features heavily in South Africa’s national development plan; the government allocated $657 million to the Department of Energy for investment in the sector1 in 2014/15 and this amount is set to grow at 6% annually in the medium term (National Treasury, 2014). The Department of Energy oversees the oil and gas industry and, together with the Department of Mineral Resources, also oversees the coal mining industry.2 These departments also fund a number of state-owned enterprises (SOEs) that either facilitate or actively engage in exploration and extraction for fossil fuels. For example, the Central Energy Fund (CEF) is an SOE that oversees a range of exploration activities via its subsidiaries. The wholly owned subsidiaries of CEF operating in the fossil fuel sector are:
• PetroSA, which operates a gas-to-liquids refinery that uses domestic gas as feedstock
• Strategic Fuel Fund (SFF), which manages strategic crude oil infrastructure, strategic crude oil stocks, and provides oil pollution control services in Saldanha Bay
• iGas, which is a shareholder in the Mozambique-to-South Africa gas pipeline and is involved in the development of other gas delivery projects
• African Exploration Mining and Finance Corporation, which is mining coal for supply to Eskom and is concluding feasibility studies on expanding its operations
• the South African Agency for Promotion of Petroleum Exploration and Exploitation (PASA), which is the national petroleum and gas promotion and licensing agency.
Renewable energy activities of the holding company (CEF) are managed through the Clean Energy Division (CED). CEF also administers the Equalisation Fund on behalf of the Department of Energy and the Mine Health and Safety Fund on behalf of the Department of Mineral Resources. South Africa has long been considering a carbon dioxide tax with a charge of around $10 per tonne of carbon emitted by industrial sources. This was due to have been introduced at the start of 2015, though its implementation has since been delayed until at least 2016 (The Carbon Report, 2015).
National subsidiesThere are a number of direct budgetary transfers that appear to benefit the production of fossil fuels in South Africa. For example, CEF’s budget includes an allocation to South African National Energy Development Institute (SANEDI) of $22 million3 (with around $8 million per year across 2013/14 to 2015/16) to fund its operations as well as to undertake specific research and development related to the carbon capture and hydraulic fracturing projects (National Treasury, Budget, 2013).4 Through its 10 subsidiaries, CEF is also mandated to finance and promote the acquisition of coal, the exploitation of coal deposits, the manufacture of liquid fuel, oil and other products from coal, and to market these products. CEF spent $12 million in 2013/14 and $13 million in 2014/15 on promoting the exploration and exploitation of crude oil and natural gas (National Treasury, Budget, 2014).
The government also made direct transfers to Eskom, municipalities and private enterprises in support of the Integrated National Electrification Programme. Total
1 The investment in the energy sector covers administration, energy policy and planning, petroleum and petroleum products regulation, electrification and energy programme and project management, nuclear energy and clean energy.
2 The Department of Energy oversees the midstream and downstream oil and gas industry. However, the upstream oil and gas industry is overseen by both the Department of Energy and the Department of Mineral Resources.
3 Annual allocation of budget for carbon capture and hydraulic fracturing projects out of the total budget is distributed in the same proportion as the division of the total budget of SANEDI in the year 2013/14, 2014/15 and 2015/16.
4 In South Africa’s Budget, research into hydraulic fracturing (fracking) for shale gas and ‘clean coal’ are funded under the ‘Renewable Energy’ sub-programme of CEF’s ‘Clean Energy’ programme.
2 G20 subsidies to oil, gas and coal production
transfers equalled $387 million in 2013 and $368 million in 2014, with Eskom receiving 55% of the total in 2013 and 71% in 2014 (National Treasury, 2015). This programme is aimed at addressing gaps in electricity provision to permanently occupied residential dwellings, installing bulk infrastructure and rehabilitating electrification infrastructure, and is related primarily to distribution. In order to avoid double counting for the purposes of this research, Eskom’s activities in fossil fuel production are captured under SOE investment below, and not in national subsidies.
As well as a range of financial incentive schemes offered by the Department for Trade and Industry (DTI) to companies, which include those engaging in the exploration and development of fossil fuel reserves, the government also paid a grant to the state-owned oil and gas company PetroSA for project-based personnel training valued at $0.4 million in 2013 (ECIC, 2014; Department of Trade and Industry, 2013; CEF, 2013). It was not possible to determine the portion of these funds, if any, that supports fossil fuel production.
A number of tax expenditures are provided for fossil fuel exploration and extraction. In the oil and gas sector, exploration capital expenditure attracts a deduction equal to 200% of the investment in respect of exploration expenditures and 150% of the investment
in post-exploration activities (including processing and separation), while investment in R&D attracts a 150% deduction (EY, 2015; Deloitte, 2013). As well as these ‘super’ deductions, oil and gas companies benefit from accelerated depreciation rates and, because projects are not ring-fenced, costs from other South African exploration, production or even refining activities may be offset against production revenue immediately or carried forward (EY, 2015; Deloitte, 2013). Similar accelerated depreciation rates for capital exploration activities are also in place in the coal industry for activities such as prospecting and the sinking of mine shafts (Curtis, 2009).
State-owned enterprise investmentsThe wholly state-owned enterprise PetroSA accounted for all oil and gas production and the majority of exploration activity in South Africa in 2014. PetroSA produces domestic oil and gas from four fields and averaged production of 2.1 million barrels of oil and 1.3 billion cubic metres of gas per year between 2013 and 2014 (PetroSA, 2015). The company also holds exploration rights in South Africa and Namibia and production rights in Ghana as well as operating the 35,000 barrels per day gas-to-liquids (GTL) refinery in Mossel Bay (PetroSA, 2015). However, private operators control the majority of the downstream sector.
South Africa 3
Table 1: South Africa’s national subsidies to fossil fuel production, 2013–2014 ($ million except where stated otherwise)
Subsidy Subsidy-type Targeted energy source
Stage 2013 estimate
2014 estimate
Estimated annual
amount
Direct spending (including on infrastructure)
Funding for hydraulic fracturing (fracking) research
Direct government funding for research
Gas Exploration and extraction (including an exploration component)
8 8 8
To promote exploration and exploitation of natural oil and gas
Direct government funding
Oil and gas Exploration and extraction 12 13 12
Tax expenditure
Super deduction for exploration Tax breaks Oil and gas Exploration and extraction N/A N/A N/A
Super deduction for research and development (R&D)
Tax breaks Oil and gas Exploration and extraction N/A N/A N/A
Accelerated depreciation/ expensing Tax breaks Oil and gas, coal N/A N/A N/A
Totals
Total national subsidies ($ m) 20
Total national subsidies (Rand m) 213
Sources and additional data are available in the Data Sheets that accompany each Country Study.
Note: N/A indicates data was not publicly available at the time of publication.
In the 2014 financial year, PetroSA was engaged in three significant projects related to fossil fuel production and spanning the production technology chain. These include appraising and developing tiebacks,5 producing gas acreage (Project Ikhwezi), exploring the possibility of importing LNG for the Mossel Bay refinery, and investigating the potential for developing a new refinery (Project Mthombo) (PetroSA, 2015). Total capital expenditure amounted to $350 million in 2013 and $470 million in 2014, and was mainly related to the Project Ikhwezi field development. Commitments for 2015 totalled $970 million, including $410 million for Project Ikhwezi and $500 million for downstream activities (PetroSA, 2015).
Transnet is the state-owned company responsible for transporting fossil fuels throughout South Africa via rail and pipeline. In 2014, the rail business transported 90 million tonnes of coal, while the pipeline business transported 17 trillion litres of product including crude oil, diesel, petrol and aviation fuel. Capital expenditure in the same period was $3 billion compared to $3.2 billion in 2013, with the majority (74%) of 2014 spend allocated to modernising the general rail infrastructure. In 2014, just under $40 million were allocated to expanding the coal transport infrastructure specifically and $220 million to
developing the new Multi-Product Pipeline (MPP), a project aimed at securing the long-term supply of products from the coastal regions to the interior (Transnet, 2015).
Eskom (100% state-owned) generated an annual average of 229 TWh of electricity in South Africa between 2013 and 2014, that is, 95% of the total distributed power (Eskom, 2015).6 The company also dominates the transmission sector. Recent years have seen recurrent outages and as a result Eskom has launched construction of new plants, notably one pumped storage hydro power plant (Ingula with a capacity of 1,332 MW) and two coal-fired power plants (Medupi with a capacity of 4,764 MW and Kusile with a capacity of 4,800 MW), as well as upgrades to the transmission and distribution network. The two coal-fired power stations are financed in part by domestic, foreign and multilateral finance institutions (see ‘Public finance’ section), with Eskom raising finance for the remainder.
In 2014, Eskom also spent $15 million on ‘demonstration and pilot projects’, mainly on its underground coal gasification project,7 and $2 million on research into ‘primary energy’ (Eskom, 2014).
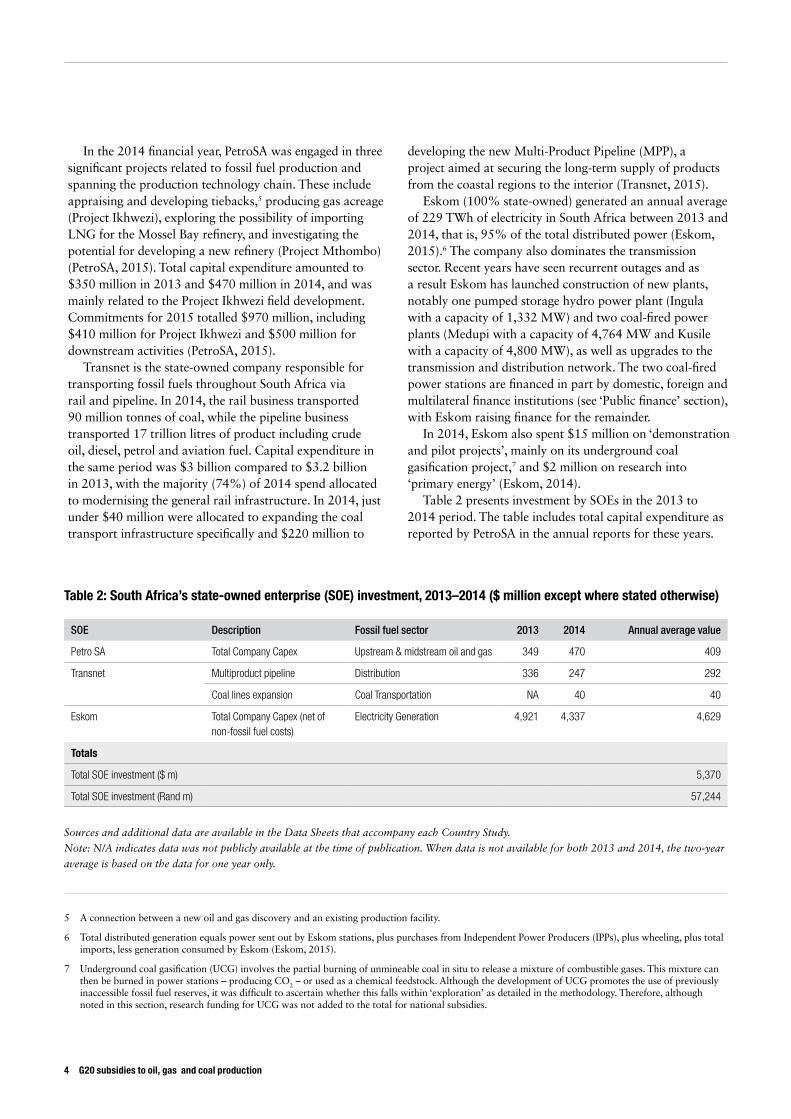
Table 2 presents investment by SOEs in the 2013 to 2014 period. The table includes total capital expenditure as reported by PetroSA in the annual reports for these years.
5 A connection between a new oil and gas discovery and an existing production facility.
6 Total distributed generation equals power sent out by Eskom stations, plus purchases from Independent Power Producers (IPPs), plus wheeling, plus total imports, less generation consumed by Eskom (Eskom, 2015).
7 Underground coal gasification (UCG) involves the partial burning of unmineable coal in situ to release a mixture of combustible gases. This mixture can then be burned in power stations – producing CO2 – or used as a chemical feedstock. Although the development of UCG promotes the use of previously inaccessible fossil fuel reserves, it was difficult to ascertain whether this falls within ‘exploration’ as detailed in the methodology. Therefore, although noted in this section, research funding for UCG was not added to the total for national subsidies.
4 G20 subsidies to oil, gas and coal production
Table 2: South Africa’s state-owned enterprise (SOE) investment, 2013–2014 ($ million except where stated otherwise)
SOE Description Fossil fuel sector 2013 2014 Annual average value
Petro SA Total Company Capex Upstream & midstream oil and gas 349 470 409
Transnet Multiproduct pipeline Distribution 336 247 292
Coal lines expansion Coal Transportation NA 40 40
Eskom Total Company Capex (net of non-fossil fuel costs)
Electricity Generation 4,921 4,337 4,629
Totals
Total SOE investment ($ m) 5,370
Total SOE investment (Rand m) 57,244
Sources and additional data are available in the Data Sheets that accompany each Country Study.
Note: N/A indicates data was not publicly available at the time of publication. When data is not available for both 2013 and 2014, the two-year
average is based on the data for one year only.
For Transnet, investment in the Multi-Product Pipeline in 2013 and 2014 is captured as well as investment for the coal rail line expansion in 2014.8 For Eskom, all capital expenditure is included with the exception of spend on the (non-fossil) Ingula hydro plant.9
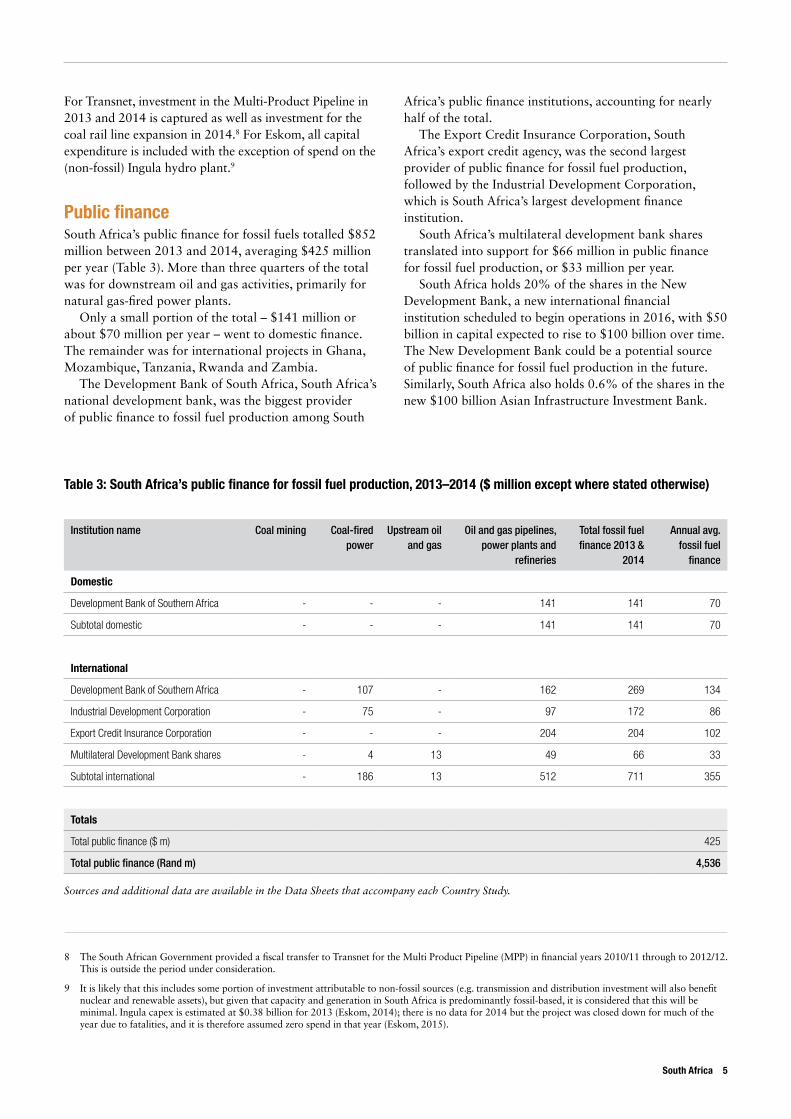
Public financeSouth Africa’s public finance for fossil fuels totalled $852 million between 2013 and 2014, averaging $425 million per year (Table 3). More than three quarters of the total was for downstream oil and gas activities, primarily for natural gas-fired power plants.
Only a small portion of the total – $141 million or about $70 million per year – went to domestic finance. The remainder was for international projects in Ghana, Mozambique, Tanzania, Rwanda and Zambia.
The Development Bank of South Africa, South Africa’s national development bank, was the biggest provider of public finance to fossil fuel production among South
Africa’s public finance institutions, accounting for nearly half of the total.
The Export Credit Insurance Corporation, South Africa’s export credit agency, was the second largest provider of public finance for fossil fuel production, followed by the Industrial Development Corporation, which is South Africa’s largest development finance institution.
South Africa’s multilateral development bank shares translated into support for $66 million in public finance for fossil fuel production, or $33 million per year.
South Africa holds 20% of the shares in the New Development Bank, a new international financial institution scheduled to begin operations in 2016, with $50 billion in capital expected to rise to $100 billion over time. The New Development Bank could be a potential source of public finance for fossil fuel production in the future. Similarly, South Africa also holds 0.6% of the shares in the new $100 billion Asian Infrastructure Investment Bank.
South Africa 5
8 The South African Government provided a fiscal transfer to Transnet for the Multi Product Pipeline (MPP) in financial years 2010/11 through to 2012/12. This is outside the period under consideration.
9 It is likely that this includes some portion of investment attributable to non-fossil sources (e.g. transmission and distribution investment will also benefit nuclear and renewable assets), but given that capacity and generation in South Africa is predominantly fossil-based, it is considered that this will be minimal. Ingula capex is estimated at $0.38 billion for 2013 (Eskom, 2014); there is no data for 2014 but the project was closed down for much of the year due to fatalities, and it is therefore assumed zero spend in that year (Eskom, 2015).
Table 3: South Africa’s public finance for fossil fuel production, 2013–2014 ($ million except where stated otherwise)
Institution name Coal mining Coal-fired power
Upstream oil and gas
Oil and gas pipelines, power plants and
refineries
Total fossil fuel finance 2013 &
2014
Annual avg. fossil fuel
finance
Domestic
Development Bank of Southern Africa - - - 141 141 70
Subtotal domestic - - - 141 141 70
International
Development Bank of Southern Africa - 107 - 162 269 134
Industrial Development Corporation - 75 - 97 172 86
Export Credit Insurance Corporation - - - 204 204 102
Multilateral Development Bank shares - 4 13 49 66 33
Subtotal international - 186 13 512 711 355
Totals
Total public finance ($ m) 425
Total public finance (Rand m) 4,536
Sources and additional data are available in the Data Sheets that accompany each Country Study.
Private companies
Private upstream oil and gas companies Oil and gas activity in South Africa is dominated by the SOE PetroSA.
Private midstream/downstream oil and gas companiesPrivate companies dominate South Africa’s downstream oil and gas sector. These include the minority government-owned Sasol as well as foreign operators including BP (UK), Shell (Netherlands), Chevron (US), Total (France) and Engen (Malaysia).
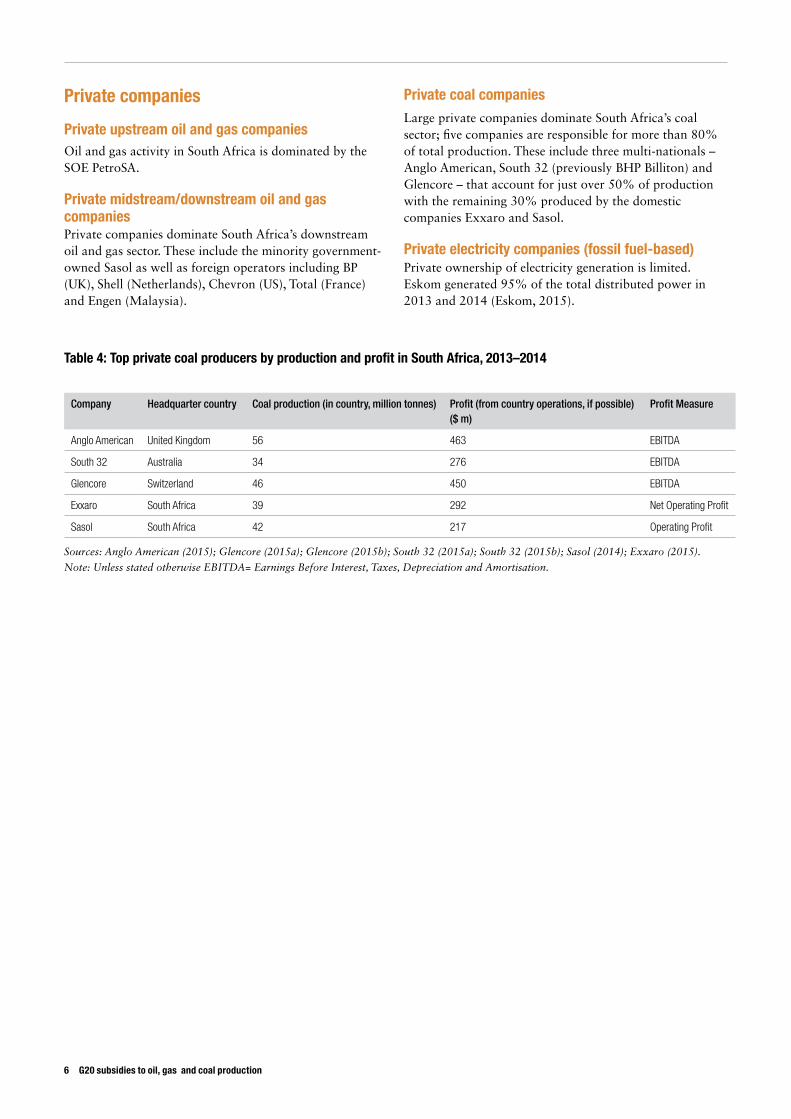
Private coal companiesLarge private companies dominate South Africa’s coal sector; five companies are responsible for more than 80% of total production. These include three multi-nationals – Anglo American, South 32 (previously BHP Billiton) and Glencore – that account for just over 50% of production with the remaining 30% produced by the domestic companies Exxaro and Sasol.
Private electricity companies (fossil fuel-based)Private ownership of electricity generation is limited. Eskom generated 95% of the total distributed power in 2013 and 2014 (Eskom, 2015).
6 G20 subsidies to oil, gas and coal production
Table 4: Top private coal producers by production and profit in South Africa, 2013–2014
Company Headquarter country Coal production (in country, million tonnes) Profit (from country operations, if possible) ($ m)
Profit Measure
Anglo American United Kingdom 56 463 EBITDA
South 32 Australia 34 276 EBITDA
Glencore Switzerland 46 450 EBITDA
Exxaro South Africa 39 292 Net Operating Profit
Sasol South Africa 42 217 Operating Profit
Sources: Anglo American (2015); Glencore (2015a); Glencore (2015b); South 32 (2015a); South 32 (2015b); Sasol (2014); Exxaro (2015).
Note: Unless stated otherwise EBITDA= Earnings Before Interest, Taxes, Depreciation and Amortisation.
South Africa 7
Methodology (for detailed methodology see Chapter 3 of main report)
This report compiles publicly available information on G20 subsidies to oil, gas and coal production across G20 countries in 2013 and 2014. It provides a baseline to track progress on the phase-out of such subsidies as part of a wider global energy transition. It uses the following terms and their definitions.
Production subsidiesGovernment support for fossil fuel production. For the purpose of this country study, production subsidies include national subsidies, investment by state-owned enterprises (SOEs) (domestic and international) and public finance (domestic and international) specifically for fossil fuel production.
Fossil fuel productionProduction in the oil, gas and coal sectors. This includes access, exploration and appraisal, development, extraction, preparation, transport, plant construction and operation, distribution and decommissioning. Although subsidies for the consumption of fossil fuels can support their production, this report excludes such subsidies as well as subsidies for the consumption of fossil fuel-based electricity.
National subsidiesDirect spending, tax and duty exemptions and other mechanisms (such as forms of capacity markets) provided by national and sub-national governments to support fossil fuel production. Normally, the value assigned for a national subsidy is the number provided by the government’s own sources, by the OECD, or by an independent research institution.
State-owned enterprise (SOE) investmentA SOE is a legal entity created by a government to undertake commercial activities on its behalf. SOEs can be wholly or partially owned by governments.
It is difficult to identify the specific component of SOE investment that constitutes a subsidy, given the limited publicly available information on government transfers to SOEs (and vice-versa), and on the distribution of investment within their vertically integrated structures. Therefore, this report provides data on total investment by SOEs in fossil fuel production (where this information is available from the company), which are presented separately from national subsidies.
For the purpose of this report, 100% of the support provided to fossil fuel production through domestic and international investment by an SOE is considered when a government holds >50% of the shares.
Public finance Public finance includes the provision of grants, equity, loans, guarantees and insurance by majority government-owned financial institutions for domestic and international fossil fuel production. Public finance is provided through institutions such as national and multilateral development banks, export credit agencies and domestic banks that are majority state-owned.
The transparency of investment data for public finance institutions varies. Assessing the portion of total financing that constitutes a subsidy requires detailed information on the financing terms, the portion of finance that is based directly on public resources (rather than raised on capital markets) or that depends on the institutions’ government-linked credit rating. Few of the institutions assessed allow public access to this information. Therefore, we report the total value of public finance from majority government-owned financial institutions for fossil fuel production separately from ‘national subsidy’ estimates.
For the purpose of this report, 100% of the support provided to fossil fuel production through domestic and international financing is considered when a government holds >50% of the shares in the bank or financial institution.
References Anglo American (2015) Annual Report 2014. London:
Anglo American plc. (http://www.angloamerican.com/~/media/Files/A/Anglo-American-PLC-V2/report-builder-2014/annual-report/aa-ar14-interactive-final.pdf)
Banktrack (2015) Kusile coal power plant - Finance. 2 September. (www.banktrack.org/show/dodgydeals/kusile_coal_power_plant#tab_dodgydeals_finance)
Bast, E., Makhijani, S., Pickard, S. and Whitley, S. (2014) ‘The Fossil Fuel Bailout: G20 Subsidies for Oil, Gas, and Coal Exploration’. London: Overseas Development Institute (www.odi.org/publications/8678-fossil-fuel-bailout-g20-subsidies-oil-gas-coal-exploration)
BP (2015) Statistical Review of World Energy. (https://www.bp.com/content/dam/bp/pdf/Energy-economics/statistical-review-2015/bp-statistical-review-of-world-energy-2015-full-report.pdf)
Central Energy Fund (CEF) (2013) Annual Report 2012/13. (Central Energy Fund Group) (www.cefgroup.co.za/annual-reports/)
Curtis, M. (2009) Mining and tax in South Africa: Costs and benefits. Curtis Research. (www.curtisresearch.org/SAfrica.MiningTax.Feb09.Curtis.pdf)
Deloitte (2013) Global oil and gas tax newsletter. (www2.deloitte.com/content/dam/Deloitte/global/Documents/Energy-and-Resources/dttl-er-ogtaxnewsletterjanuary2013issue-08082013.pdf)
Deloitte (2014) Taxation and Investment in South Africa: Reach relevance and reliability. (www2.deloitte.com/content/dam/Deloitte/global/Documents/Tax/dttl-tax-southafricaguide-2014.pdf)
Department of Energy (2013) Integrated resource plan for electricity (IP) 2010-2030: Update report 2013. (Pretoria: Government of the Republic of South Africa) (www.doe-irp.co.za/)
Department of Trade and Industry (2013) Financial Assistance. (Pretoria: Government of the Republic of South Africa) (www.thedti.gov.za/financial_assistance/financial_assistance.jsp)
Energy Information Administration (EIA) (2013) Technically Recoverable Shale Oil and Shale Gas Resources. Washington, D.C.: US Energy Information Administration. (www.eia.gov/analysis/studies/worldshalegas/pdf/overview.pdf)
EIA (2015) Countries with Analysis Briefs - South Africa. Washington, D.C.: US Energy Information Administration. (www.eia.gov/beta/international/analysis.cfm?iso=ZAF)
EIA (2015) South Africa International Energy Data and Analysis. Washington, D.C.: US Energy Information Administration.
Ernst and Young (2015) Global oil and gas tax guide. Ernst and Young. (www.ey.com/Publication/vwLUAssets/EY-2015-Global-oil-and-gas-tax-guide/$FILE/EY-2015-Global-oil-and-gas-tax-guide.pdf)
Eskom (2014) Sustainability. Eskom. (http://integratedreport.eskom.co.za/supplementary/str-sustain.php)
Eskom (2015) Eskom Fact Sheets 2015. Eskom. (www.eskom.co.za/IR2015/Documents/Eskom_fact_sheets_2015.pdf)
Export Credit Insurance Corporation (ECIC) (2014) Trade and Investment Opportunities in Africa - The Natural Resources Sector. Export Credit Insurance Corporation (ECIC). (www.ecic.co.za/useruploads/files/ECIC%20Trade%20&%20Investment%20-%20090414%20New.pdf)
Exxaro (2015) Integrated Report 2014. Pretoria: Exxaro. (www.exxaro.com/ar/2014/Exxaro_IR_2014.pdf)
Glencore (2015a) Annual Report 2014. Baar: Glencore. (www.glencore.com/assets/investors/doc/reports_and_results/2014/GLEN-2014-Annual-Report.pdf)
Glencore (2015b) ‘Corporate update and Production Report for the 12 months ended 31 December 2014’ Baar: Glencore. (http://www.glencore.com/assets/investors/doc/reports_and_results/2014/GLEN-2014-Q4-Production-Report.pdf)
National Treasury, Budget (2013) Estimates of National Expenditure: Vote 29 Energy. Pretoria: Republic of South Africa (www.treasury.gov.za/documents/national%20budget/2013/enebooklets/Vote%2029%20Energy.pdf)
National Treasury, Budget (2014) Estimates of National Expenditure: Vote 29 Energy. (www.treasury.gov.za/documents/national%20budget/2014/ene/FullENE.pdf)
Oil & Gas Journal (2015) Worldwide look at reserves and production. (http://digital.ogj.com/ogjournal/20140106?pg=1#pg1)
PetroSA (2015) Annual Integrated Report 2014.Rystad Energy (2015) Rystad Energy UCube Upstream
Database. (www.rystadenergy.com/Databases/UCube) Rystad Energy (2013) Rystad Energy UCube Upstream
Database. (www.rystadenergy.com/Databases/UCube) Sasol (2014) A new era for Sasol: Annual Integrated
Report 2014. Johannesburg: Sasol. (http://www.sasol.com/sites/default/files/publications/integrated_reports/downloads/Sasol%20AIR%202014%20complete.pdf )
Sawyer, D. A. (2010) Fossil Fuels – At What Cost? Government support for upstream oil activities in three Canadian provinces: Alberta, Saskatchewan, and Newfoundland and Labrador. Manitoba: Global Subsidies Initiative.
8 G20 subsidies to oil, gas and coal production
South 32 (2015a) Financial Results and Outlook FY2015. Perth, Western Australia: South 32. (https://www.south32.net/getattachment/Investors-Media/Annual-Results/South32-FY15-Profit-Announcement-(version-control).pdf)
South 32 (2015b) Annual Report 2015. Perth, Western Australia: South 32. (https://
www.south32.net/CMSPages/GetFile.aspx?guid=3422a937-e347-4fd0-bf7c-551fb5caa2f9)
The Carbon Report (2015) The proposed South African carbon tax. (www.thecarbonreport.co.za/the-proposed-south-african-carbon-tax/)
Transnet (2015) Audited Condensed Consolidated Financial Results. Transnet. (www.transnet.net/PressOffice/Press%20Office%20Release/Transnet%20annual%20results%20-%20print%20ad%202015.pdf)
South Africa 9
ODI is the UK’s leading independent think tank on international development and humanitarian issues. Oil Change International is a research, communications, and advocacy organization focused on exposing the true costs of fossil fuels and facilitating the coming transition towards clean energy. IISD’s mission is to promote human development and environmental sustainability through innovative research, communication and partnerships.
Overseas Development Institute 203 Blackfriars Road London SE1 8NJTel +44 (0)20 7922 0300 Fax +44 (0)20 7922 [email protected]
Oil Change International714 G Street SE Suite 202 Washington, DC 20003 USATel: +1 202 518 9029Fax: +1 202 330 [email protected]
Readers are encouraged to reproduce material for their own publications, as long as they are not being sold commercially. As copyright holders, ODI, OCI and IISD request due acknowledgement and a copy of the publication. For online use, we ask readers to link to the original resource on the ODI website. The views presented in this paper are those of the author(s) and do not necessarily represent the views of ODI, OCI or IISD. © Overseas Development Institute, Oil Change International and International Institute for Sustainable Development 2015. This work is licensed under a Creative Commons Attribution-NonCommercial Licence (CC BY-NC 4.0).
International Institute for Sustainable Development111 Lombard Avenue, Suite 325Winnipeg, Manitoba, Canada R3B 0T4Tel: +1 (204) 958-7700Fax: +1 (204) [email protected]