G Model ARTICLE IN PRESS - Ruđer Bošković Institute · PDF filePlease cite this...
8
Please cite this article in press as: B. Mileˇ sevi ´ c, et al., Power quality analysis in electric traction system with three-phase induction motors, Electr. Power Syst. Res. (2016), http://dx.doi.org/10.1016/j.epsr.2016.02.027 ARTICLE IN PRESS G Model EPSR-4600; No. of Pages 8 Electric Power Systems Research xxx (2016) xxx–xxx Contents lists available at ScienceDirect Electric Power Systems Research j o ur na l ho mepage: www.elsevier.com/locate/epsr Power quality analysis in electric traction system with three-phase induction motors Boˇ sko Mileˇ sevi ´ c ∗ , Ivo Ugleˇ si´ c 1 , Boˇ zidar Filipovi ´ c-Grˇ ci´ c 2 University of Zagreb, Faculty of Electrical Engineering and Computing, 10000 Zagreb, Croatia a r t i c l e i n f o Article history: Available online xxx Keywords: Electric railway Power quality Induction motors a b s t r a c t Three-phase induction motors are widely used in electric traction systems. The impacts of the traction vehicles equipped with three-phase induction motors on power quality are much different from the impacts of vehicles with DC traction motors. In this paper, the effects of the traction vehicle operation with three-phase induction motors on power quality in a 110 kV transmission network are investigated. The electric traction system 25 kV, 50 Hz and the traction vehicle with three-phase induction motors were modeled including AC/DC rectifier and DC/AC inverter based on IGBT technology. The parame- ters of those power electronic elements directly determine the current and voltage waveforms, and consequently power quality parameters. Measurements and calculations of power quality parameters were presented. Three operation modes of traction vehicle were considered including acceleration, constant drive and regenerative breaking. During the test drives, the values of total harmonic distortion, unbalance, flicker and power factor were obtained. © 2016 Elsevier B.V. All rights reserved. 1. Introduction Electric railway systems are essential for the transport of peo- ple and goods. Numerous advantages of electric railways have been proven in comparison with other forms of transport, from reliabil- ity and safety to the speed and comfort [1]. The development of societies and economics entails the improvement of railways. The most important railway transportation routes are electrified which makes this system more competitive and environmentally more acceptable [2]. An electric railway is a single phase consumer [3]. Operations of traction vehicle may have significant effects on power qual- ity parameters in the power system [4]. One of the most widely used railway electrification systems is 25 kV, 50 Hz. This system is powered from the electric power transmission system and it supplies traction vehicles through contact network. Voltage and current waveforms in the railway system directly depend on the type of traction vehicle, its characteristics and electrical proper- ties [5]. Electric traction vehicles are commonly equipped with DC ∗ Corresponding author. Tel.: +385 1 6129 714; fax: +385 1 6129 890. E-mail addresses: [email protected] (B. Mileˇ sevi ´ c), [email protected] (I. Ugleˇ si´ c), bozidar.fi[email protected] (B. Filipovi ´ c-Grˇ ci´ c). 1 Tel.: +385 1 6129 979; fax: +385 1 6129 890. 2 Tel.: +385 1 6129 714; fax: +385 1 6129 890. motors or three-phase (3f) AC motors [6]. The advantages of 3f induction motors are manifested in possibility for energy recovery during braking or operating on downhill and simplest maintenance. Electric railway system has an influence on systems that ensure reliability of the system (communication subsystem), but also on the systems in the vicinity which are sensitive to disturbances [5,7,8]. Current and voltage waveforms of different traction vehicles cause different disturbances on nearby sensitive systems. The power transformer at traction vehicle is connected to AC/DC rectifier which is connected to DC link (Figs. 1 and 2). DC voltage is converted by DC/AC inverter to 3f AC voltage and supplies 3f AC induction motor. Power electronics elements, rectifier and inverter consist of thyristors or IGBTs [9]. The power quality parameters and the waveforms of voltage and current are measured on the 110 kV busses. During the measurements only one locomotive was in oper- ation on a feeder supplied from traction substation. That ensures that the other traction vehicles have no impact on the measured values because of their electrical distance. All measurements were performed during acceleration, con- stant drive and regenerative braking of electric traction vehicle. Waveforms of electric parameters in different operation modes are compared and deviations from nominal values are found according to the applicable standards [10,11]. The measurements and analy- sis of power quality parameters in traction substation during the operation of locomotive equipped with 3f induction motors were presented. http://dx.doi.org/10.1016/j.epsr.2016.02.027 0378-7796/© 2016 Elsevier B.V. All rights reserved.
-
Upload
truongkien -
Category
Documents
-
view
213 -
download
1
Transcript of G Model ARTICLE IN PRESS - Ruđer Bošković Institute · PDF filePlease cite this...

E
Pi
BU
a
AA
KEPI
1
ppismma
oiuisctt
(
h0
ARTICLE IN PRESSG ModelPSR-4600; No. of Pages 8
Electric Power Systems Research xxx (2016) xxx–xxx
Contents lists available at ScienceDirect
Electric Power Systems Research
j o ur na l ho mepage: www.elsev ier .com/ locate /epsr
ower quality analysis in electric traction system with three-phasenduction motors
osko Milesevic ∗, Ivo Uglesic 1, Bozidar Filipovic-Grcic 2
niversity of Zagreb, Faculty of Electrical Engineering and Computing, 10000 Zagreb, Croatia
r t i c l e i n f o
rticle history:vailable online xxx
eywords:lectric railwayower qualitynduction motors
a b s t r a c t
Three-phase induction motors are widely used in electric traction systems. The impacts of the tractionvehicles equipped with three-phase induction motors on power quality are much different from theimpacts of vehicles with DC traction motors. In this paper, the effects of the traction vehicle operationwith three-phase induction motors on power quality in a 110 kV transmission network are investigated.
The electric traction system 25 kV, 50 Hz and the traction vehicle with three-phase induction motorswere modeled including AC/DC rectifier and DC/AC inverter based on IGBT technology. The parame-ters of those power electronic elements directly determine the current and voltage waveforms, and
consequently power quality parameters.Measurements and calculations of power quality parameters were presented. Three operation modesof traction vehicle were considered including acceleration, constant drive and regenerative breaking.During the test drives, the values of total harmonic distortion, unbalance, flicker and power factor wereobtained.
. Introduction
Electric railway systems are essential for the transport of peo-le and goods. Numerous advantages of electric railways have beenroven in comparison with other forms of transport, from reliabil-
ty and safety to the speed and comfort [1]. The development ofocieties and economics entails the improvement of railways. Theost important railway transportation routes are electrified whichakes this system more competitive and environmentally more
cceptable [2].An electric railway is a single phase consumer [3]. Operations
f traction vehicle may have significant effects on power qual-ty parameters in the power system [4]. One of the most widelysed railway electrification systems is 25 kV, 50 Hz. This system
s powered from the electric power transmission system and itupplies traction vehicles through contact network. Voltage and
Please cite this article in press as: B. Milesevic, et al., Power qualitymotors, Electr. Power Syst. Res. (2016), http://dx.doi.org/10.1016/j.ep
urrent waveforms in the railway system directly depend on theype of traction vehicle, its characteristics and electrical proper-ies [5]. Electric traction vehicles are commonly equipped with DC
∗ Corresponding author. Tel.: +385 1 6129 714; fax: +385 1 6129 890.E-mail addresses: [email protected] (B. Milesevic), [email protected]
I. Uglesic), [email protected] (B. Filipovic-Grcic).1 Tel.: +385 1 6129 979; fax: +385 1 6129 890.2 Tel.: +385 1 6129 714; fax: +385 1 6129 890.
ttp://dx.doi.org/10.1016/j.epsr.2016.02.027378-7796/© 2016 Elsevier B.V. All rights reserved.
© 2016 Elsevier B.V. All rights reserved.
motors or three-phase (3f) AC motors [6]. The advantages of 3finduction motors are manifested in possibility for energy recoveryduring braking or operating on downhill and simplest maintenance.Electric railway system has an influence on systems that ensurereliability of the system (communication subsystem), but also onthe systems in the vicinity which are sensitive to disturbances[5,7,8]. Current and voltage waveforms of different traction vehiclescause different disturbances on nearby sensitive systems.
The power transformer at traction vehicle is connected to AC/DCrectifier which is connected to DC link (Figs. 1 and 2). DC voltageis converted by DC/AC inverter to 3f AC voltage and supplies 3f ACinduction motor. Power electronics elements, rectifier and inverterconsist of thyristors or IGBTs [9]. The power quality parameters andthe waveforms of voltage and current are measured on the 110 kVbusses. During the measurements only one locomotive was in oper-ation on a feeder supplied from traction substation. That ensuresthat the other traction vehicles have no impact on the measuredvalues because of their electrical distance.
All measurements were performed during acceleration, con-stant drive and regenerative braking of electric traction vehicle.Waveforms of electric parameters in different operation modes arecompared and deviations from nominal values are found according
analysis in electric traction system with three-phase inductionsr.2016.02.027
to the applicable standards [10,11]. The measurements and analy-sis of power quality parameters in traction substation during theoperation of locomotive equipped with 3f induction motors werepresented.

ARTICLE IN PRESSG ModelEPSR-4600; No. of Pages 8
2 B. Milesevic et al. / Electric Power Systems Research xxx (2016) xxx–xxx
Fig. 1. Electric traction system.
2i
tw
tTmbftt
aa
56moar
Fig. 2. Electric traction vehicle with an induction motor.
. Operation of traction vehicles with 3f induction motorsn electric railway system 25 kV, 50 Hz
The operation of the single-phase 25 kV (50 Hz) electric trac-ion system is significantly different from the electric power systemhich supplies it [3].
The electric traction system is supplied from electric power sys-em through power transformers located at traction substations.hese transformers are connected to two phases of the power trans-ission system. The traction power supply network is separated
y neutral section to the independent sections which are suppliedrom different traction substations. Fig. 1 shows a principle connec-ion scheme of the 25 kV, 50 Hz electric traction system to 110 kVransmission network.
Electric traction vehicles are powered from contact network via pantograph and a power transformer that adjusts the 25 kV volt-ge to a value suitable for induction traction motors (Fig. 2).
In this paper, multi-system traction vehicle supplied by 25 kV,0 Hz system was analyzed. The nominal drive power of one unit is.4 MW and heating power is 900 kV A [12,13]. Fig. 3 shows theeasured effective values of current and active/reactive power
Please cite this article in press as: B. Milesevic, et al., Power qualitymotors, Electr. Power Syst. Res. (2016), http://dx.doi.org/10.1016/j.ep
n 25 kV side. The values of current and power change stepwisend depend on the operation mode. The measured supply cur-ent exceeded 300 A, while at the same moment the maximum
Fig. 4. Electrical scheme of traction veh
Fig. 3. RMS current, active and reactive power of electric traction vehicle withinduction motors.
measured active and reactive powers were 7.5 MW and 950 kvar,respectively. The measured reactive power had a permanent pos-itive sign, whereas active power can have a both positive andnegative sign, depending on power flow direction. In the periodswhen the value of active power is positive, energy flows from thepower substation to the traction vehicle while a negative sign indi-cates the opposite flow of energy. The maximum active powerduring recuperation braking (energy recovery) was 5.5 MW and hasbeen reached at the moment when the current was 215 A and reac-tive power was 440 kvar. As expected, the maximum power that canbe recovered was less than the maximum power that the vehicleused for the acceleration.
3. Model of traction vehicle with induction motors
The model of electric multiple unit of 2 MW continuous powerwas developed in the ATP software and it includes power trans-formers at the substation and on the vehicle, IGBT converters, a DClink and an induction motor with rated power 525 kW.
The impedance of 110/25 kV power transformer referred to
analysis in electric traction system with three-phase inductionsr.2016.02.027
the 110 kV side is R = 0.5 � and L = 4 mH (7.5 MW, uk% = 10%).Contact network impedance is 0.181 + j0.447 �/km. The DC linkwas modeled by a capacitance (C = 36 mF) and an inductance
icle with induction motors [14].

ARTICLE ING ModelEPSR-4600; No. of Pages 8
B. Milesevic et al. / Electric Power Syste
Fig. 5. Model for calculation in ATP.
Fit
(s
Wcriqc
cdm1
ig. 6. Current (green) and voltage (red) on contact network on the 110 kV side. (Fornterpretation of the references to color in this figure legend, the reader is referredo the web version of this article.)
L = 0.007 mH). Electrical scheme and model for calculation arehown in Figs. 4 and 5.
Rectifier consists of four switches controlled by PWM (Pulse-idth Modulation) signal. The algorithm which generates the
ontrol PWM signals contains the modulation signals and the car-ier signal (triangular wave). The triangular signal was modeled andts frequency is an odd multiple of the modulation signal. The fre-uency of the input signal is determined by the frequency of theontact network.
Inverter contains three branches each with two switches. The
Please cite this article in press as: B. Milesevic, et al., Power qualitymotors, Electr. Power Syst. Res. (2016), http://dx.doi.org/10.1016/j.ep
ontrol of switches operation is realized by a PWM module. Theeveloped model of traction vehicle enables the analysis of anyotor operation frequency. The current and voltage waveforms on
10 kV side of traction substation at the frequency 50 Hz are shown
Fig. 7. Voltage FFT on the 25 kV side (harmo
PRESSms Research xxx (2016) xxx–xxx 3
in Fig. 6. Current waveform shown in the same figure is multipliedby 10.
These waveforms show that the fundamental power frequencyof 50 Hz is supplemented by some higher harmonics. FFT (FastFourier Transformation) is calculated from the obtained voltage andcurrent waveforms (Figs. 7–9) in order to analyze the power qualityparameters.
The results depicted in Figs. 7–9 show that from all higher har-monics the 41st harmonic had a maximum magnitude of 30 V on110 kV side which is about 0.03% of the magnitude of fundamentalharmonic. The same harmonic on 25 kV side reached 16 V or 0.04%of fundamental harmonic. Also, the maximum higher harmonic ofthe current was 41st, with a magnitude of 2.7% of fundamentalharmonic.
4. Measurement and analysis of voltage and currentwaveforms
The measurements of power quality parameters were per-formed on 110 kV side in the electric traction substation. Theswitching arrangement of substation and the locomotive positionduring the measurements are shown in Fig. 10.
Two 110 kV overhead lines are connected to the traction sub-station. The transmission and traction systems are connected viapower transformers 110/25 kV with nominal power 7.5 MV A. Dur-ing the measurements only transformer A was in operation. Theone locomotive traveled from point M1 to point M2 on the sectionB.
Supply and regenerative currents and voltages between phasesL2 and L3 on 110 kV side were measured in the transformer bay.Also, the values of power factor, unbalance and total harmonicdistortion (THD) were observed.
In this chapter the waveforms of voltages and currents arepresented. The waveforms depend on the operation mode (accel-eration, constant drive or regenerative breaking). Results arepresented for all three operation modes. Also, the comparisontables with the content of each harmonic are given.
The measurements are performed before, during and after loco-motive operation. By comparing the results obtained in all threeperiods is clear that the current and voltage distortions are mainlycaused by operation of the observed traction vehicle.
4.1. Voltage and current during the acceleration
analysis in electric traction system with three-phase inductionsr.2016.02.027
The voltage and current waveforms during acceleration are pre-sented in Fig. 11. Phase shift between voltage and current is verylow. Figs. 12 and 13 show harmonic spectrum of those waveformsobtained by FFT.
nics 3rd to 90th of power frequency).

ARTICLE IN PRESSG ModelEPSR-4600; No. of Pages 8
4 B. Milesevic et al. / Electric Power Systems Research xxx (2016) xxx–xxx
Fig. 8. Current FFT on 25 kV side (harmonics 3rd to 90th of power frequency).
Fig. 9. Voltage FFT on 110 kV side (harmonics 3rd to 90th of power frequency).
110 kV 50 Hz
M2M1
TRBTRA
UTR2-3
ITR
Electric traction
sub station
Conn ection
Ove rhead li ne 2110 kV
Over head line 1 110 k V
4
map
4
p
-80
-60
-40
-20
0
20
40
60
80
-200
-150
-100
-50
0
50
100
150
200
0 20 40 60 80 10 0 120
U[k
V]
t [s ]
U I
I[A
]
Fig. 11. Voltage and current through the power transformer during the acceleration.
DirectionBDirectionA point
Fig. 10. Electric traction substation connection and train position.
.2. Voltage and current during the constant drive
Voltage and current waveforms in constant drive operationode are depicted in Fig. 14. Similarly as in the case of acceler-
tion mode, phase shift is very low. FFT of obtained waveforms isresented in Figs. 15 and 16.
Please cite this article in press as: B. Milesevic, et al., Power quality analysis in electric traction system with three-phase inductionmotors, Electr. Power Syst. Res. (2016), http://dx.doi.org/10.1016/j.epsr.2016.02.027
.3. Voltage and current during the regenerative breaking
In operation mode of regenerative breaking (energy recovery)hase the shift between voltage and current was 180◦. In Fig. 17, Fig. 12. FFT of voltage during the acceleration.

ARTICLE IN PRESSG ModelEPSR-4600; No. of Pages 8
B. Milesevic et al. / Electric Power Systems Research xxx (2016) xxx–xxx 5
Fig. 13. FFT of current during the acceleration.
-150
-100
-50
0
50
100
150
-200
-150
-100
-50
0
50
100
150
200
140120100806040200
U[k
V]
t[s]
U I
I[A]
Fig. 14. Voltage and current during the constant drive.
wfbtF
ofi
mptono3Ht
Fig. 16. FFT of current during the constant drive.
-80
-60
-40
-20
0
20
40
60
80
-200
-150
-100
-50
0
50
100
150
200
0 20 40 60 80U
[kV
]t [s]
U I
I [A
]
Fig. 17. Voltage and current during the regenerative breaking.
Fig. 18. FFT of voltage during the regenerative breaking.
operation modes are given, with regard to previous figures.
Fig. 15. FFT of voltage during the constant drive.
aveforms of voltage and current flowing through power trans-ormer are shown. Voltage had almost ideal sinusoidal waveform,ut the current contained higher harmonics of significant magni-ude. FFT up to 100th harmonic of power frequency is shown inigs. 18 and 19.
In Table 1, the magnitudes of each voltage harmonic dependingn all three operation modes are given, with regard to previousgures.
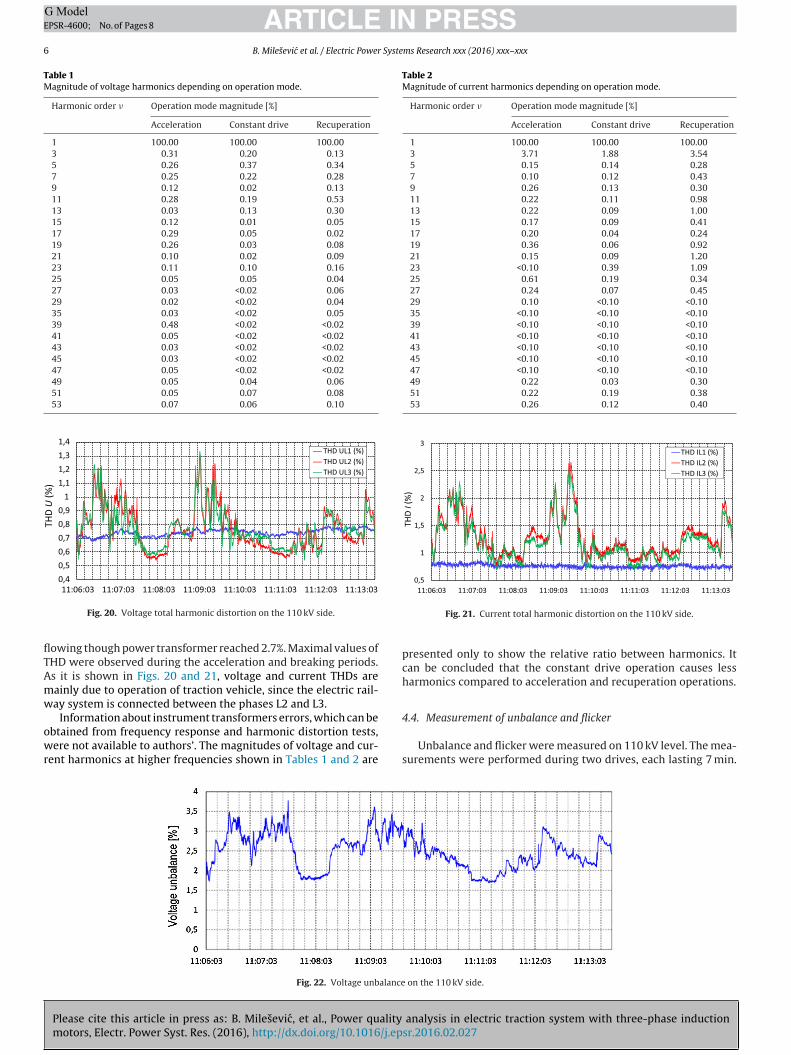
The measured voltage had a significant content of higher har-onics in all operation modes. Fig. 20 shows voltage THD in all
hases on 110 kV side. THD of line voltage connected to powerransformer reached 1.35%. The maximum values of THD werebserved in acceleration and breaking periods. In phase L1, which isot connected to railway system, THD had almost a constant valuef 0.7%. This fact shows that electric railway vehicles equipped with
Please cite this article in press as: B. Milesevic, et al., Power qualitymotors, Electr. Power Syst. Res. (2016), http://dx.doi.org/10.1016/j.ep
f induction motors have an important effect on voltage waveform.owever, the results presented in this paper were much lower than
he values allowable in standards.
Fig. 19. FFT of current during the regenerative breaking.
In Table 2, the magnitudes of each current harmonic in all three
analysis in electric traction system with three-phase inductionsr.2016.02.027
The measured current had a significant content of higher har-monics in all operation modes. The value of current THD in allthree phases on 110 kV side is presented in Fig. 21. THD of current
ARTICLE IN PRESSG ModelEPSR-4600; No. of Pages 8
6 B. Milesevic et al. / Electric Power Systems Research xxx (2016) xxx–xxx
Table 1Magnitude of voltage harmonics depending on operation mode.
Harmonic order � Operation mode magnitude [%]
Acceleration Constant drive Recuperation
1 100.00 100.00 100.003 0.31 0.20 0.135 0.26 0.37 0.347 0.25 0.22 0.289 0.12 0.02 0.1311 0.28 0.19 0.5313 0.03 0.13 0.3015 0.12 0.01 0.0517 0.29 0.05 0.0219 0.26 0.03 0.0821 0.10 0.02 0.0923 0.11 0.10 0.1625 0.05 0.05 0.0427 0.03 <0.02 0.0629 0.02 <0.02 0.0435 0.03 <0.02 0.0539 0.48 <0.02 <0.0241 0.05 <0.02 <0.0243 0.03 <0.02 <0.0245 0.03 <0.02 <0.0247 0.05 <0.02 <0.0249 0.05 0.04 0.0651 0.05 0.07 0.0853 0.07 0.06 0.10
0,40,50,60,70,80,9
11,11,21,31,4
11:13:0311:12:0311:11:0311:10:0311:09:0311:08:0311:07:0311:06:03
THD
U (%
)
THD UL1 (%)THD UL2 (%)THD UL3 (%)
flTAmw
owr
Table 2Magnitude of current harmonics depending on operation mode.
Harmonic order � Operation mode magnitude [%]
Acceleration Constant drive Recuperation
1 100.00 100.00 100.003 3.71 1.88 3.545 0.15 0.14 0.287 0.10 0.12 0.439 0.26 0.13 0.3011 0.22 0.11 0.9813 0.22 0.09 1.0015 0.17 0.09 0.4117 0.20 0.04 0.2419 0.36 0.06 0.9221 0.15 0.09 1.2023 <0.10 0.39 1.0925 0.61 0.19 0.3427 0.24 0.07 0.4529 0.10 <0.10 <0.1035 <0.10 <0.10 <0.1039 <0.10 <0.10 <0.1041 <0.10 <0.10 <0.1043 <0.10 <0.10 <0.1045 <0.10 <0.10 <0.1047 <0.10 <0.10 <0.1049 0.22 0.03 0.3051 0.22 0.19 0.3853 0.26 0.12 0.40
0,5
1
1,5
2
2,5
3
11:13:0311:12:0311:11:0311:10:0311:09:0311:08:0311:07:0311:06:03
THD
I (%
)
THD IL 1 (%)THD IL 2 (%)THD IL 3 (%)
Fig. 20. Voltage total harmonic distortion on the 110 kV side.
owing though power transformer reached 2.7%. Maximal values ofHD were observed during the acceleration and breaking periods.s it is shown in Figs. 20 and 21, voltage and current THDs areainly due to operation of traction vehicle, since the electric rail-ay system is connected between the phases L2 and L3.
Information about instrument transformers errors, which can be
Please cite this article in press as: B. Milesevic, et al., Power qualitymotors, Electr. Power Syst. Res. (2016), http://dx.doi.org/10.1016/j.ep
btained from frequency response and harmonic distortion tests,ere not available to authors’. The magnitudes of voltage and cur-
ent harmonics at higher frequencies shown in Tables 1 and 2 are
Fig. 22. Voltage unbalance
Fig. 21. Current total harmonic distortion on the 110 kV side.
presented only to show the relative ratio between harmonics. Itcan be concluded that the constant drive operation causes lessharmonics compared to acceleration and recuperation operations.
4.4. Measurement of unbalance and flicker
analysis in electric traction system with three-phase inductionsr.2016.02.027
Unbalance and flicker were measured on 110 kV level. The mea-surements were performed during two drives, each lasting 7 min.
on the 110 kV side.

ARTICLE IN PRESSG ModelEPSR-4600; No. of Pages 8
B. Milesevic et al. / Electric Power Systems Research xxx (2016) xxx–xxx 7
Fig. 23. Current unbalance
Table 3Short time flicker values on 110 kV side.
Phase Pst
L1 0.1090
Tm
aoria
t3tmos
Ct[
5
ts2pnp
taahhc
octp
[
[
[
L2 0.1046L3 0.1042
he drives were regulated according to the measuring require-ents with frequent acceleration and breaking periods.For the period depicted in Fig. 3, the values of voltage (Fig. 22)
nd current unbalance (Fig. 23) were obtained at connection pointf overhead line 2. The unbalance is determined as the percentageatio of negative sequence voltage to positive sequence voltage andt is comparable with [15,16]. The values of short time flicker arelso presented in Table 3.
The voltage and current unbalance at the connection point ofhe electric railway to the transmission network were lower than.8% and 19%, respectively. In order to determine the influence ofhe traction vehicle on unbalance in the 110 kV network, measure-
ents should be performed during one week according to [17]. 95%f the 10 min mean r.m.s. values of the negative phase sequenceshould be under 2%.
Short time flicker values per phases are given in Table 3.onsidering the maximum permitted values defined in standards,he measured values of short time flicker were below limits18].
. Conclusions
In this paper, the monitoring of power quality parameters athe point of electric railway system connection to the transmissionystem was described. The operation of the electric traction system5 kV, 50 Hz supplied from the traction substation 110/25 kV wasresented. The impact of the 3f traction motors on the transmissionetwork was investigated by the measurements of power qualityarameters (THD, unbalance, flicker).
A railway system with a traction vehicle equipped with 3f induc-ion motor was developed in EMTP-ATP. The waveforms of voltagend supply current were analyzed. In the calculations the 41stnd 42nd harmonics of power frequency were identified with theighest magnitude while in the measurements 3rd, 21st, and 53rdarmonic were significant. That mostly depends on the convertersharacteristics.
Voltage and current waveforms were analyzed during three
Please cite this article in press as: B. Milesevic, et al., Power qualitymotors, Electr. Power Syst. Res. (2016), http://dx.doi.org/10.1016/j.ep
peration modes of the electric traction vehicle: acceleration,onstant drive and regenerative breaking. It is clear that the 3fraction induction motors have an impact on the power qualityarameters especially during acceleration and breaking. However,
[
on the 110 kV side.
operation in energy recovery mode results with the most significantimpact.
The values of THD, unbalance and flicker obtained by measure-ments were below the limits prescribed in standards. From thestandpoint of power quality and energy consumption efficiency, 3finduction motors in electric traction system have many advantagesand their use is increasing.
Acknowledgments
This work has been supported in part by the Croatian ScienceFoundation under the project “Development of advanced high volt-age systems by application of new information and communicationtechnologies” (DAHVAT).
The authors gratefully acknowledge the contributions of theCroatian Transmission System Operator Ltd. and HZ InfrastrukturaLtd. for enabling the measurements.
References
[1] S. Frey, Railway Electrification Systems & Engineering, White World Publica-tions, Delhi, 2012.
[2] I. Uglesic, M. Mandic, Napajanje Elektricne Vuce, Graphis, Zagreb, 2014.[3] Y. Osura, Y. Mochinaga, H. Nagasawa, Railway electric power feeding systems,
Jpn. Railway Transp. Rev. 16 (June) (1998) 48–58.[4] R.C. Dugan, M.F. McGranaghan, S. Santoso, H. Wayne Beaty, Electric Power
Systems Quality, third ed., McGrow-Hill, New York, USA, 2012.[5] B. Milesevic, Electromagnetic Influence of Electric Railway System on Metallic
Structures, University of Zagreb, 2014 (Ph.D. Dissertation).[6] T. Achour, M. Pietrzak-David, M. Grandpierre, Service community of an induc-
tion machine railway traction system, in: XIX Int. Conference on ElectricMachines—ICEM, Rome, 2010.
[7] International Telecommunication Union, Directives Concerning the Protec-tion of Telecommunication Lines Against Harmful Effects from Electric Powerand Electrified Railway Lines, vol. IV, International Telecommunication Union,Geneva, 1989.
[8] A. Zupan, A. Tomasovic Teklic, B. Filipovic-Grcic, Modeling of 25 kV ElectricRailway System for Power Quality Studies, EuroCon, Zagreb, 2013 (2013).
[9] W. Buchberger, Die neue schnellfahrende Mahrsystem—Hochleistungslok1216 der OBB, September 2004, 〈http://www.br146.de/SiemensPdf/Rh1216-oebb.pdf〉 (January 2014).
10] IEEE Standard Association, IEEE Recommendation Practice and Requirementsfor Harmonic Control in Electric Power Systems, IEEE Std 519TM-2014, NewYork, NY, 2014.
11] N. Cho, Allocation of Individual Harmonic Emission Limits in Accordance withthe Principles of IEC/TR 61000-3-6, Georgia Institute of Technology, 2013 (Ph.D.Dissertation).
12] Schweinfurt, Germany author: Krauss-Maffei Krauss-Maffei, FAG WheelsetBearings in the High-Power Locomotive “TAURUS”, Examples of Appli-cation Engineering Publ. No. WL 07 510 EA, 〈http://www.schaeffler.com/remotemedien/media/ shared media/08 media library/01 publications/
analysis in electric traction system with three-phase inductionsr.2016.02.027
schaeffler 2/publication/downloads 18/wl 07510 de en.pdf〉, Schweinfurt,Germany, January 2015.
13] Siemens AG Transportation Systems, Führerstand der 1116 Taurus, January2014, 〈http://www.z21.eu/content/download/625/4858/file/Z21%20F%C3%BChrerstand%20der%201116%20Taurus.pdf〉.

ING ModelE
8 Syste
[
[
[
[
dardization (CENELEC), Brussels, Belgium, 2010.
ARTICLEPSR-4600; No. of Pages 8
B. Milesevic et al. / Electric Power
14] L. Liudvinavicius, L.P. Lingaitis, Management of locomotive tractive energyresources, in: Energy Management Systems, InTech, Rijeka, Croatia, August,2011.
Please cite this article in press as: B. Milesevic, et al., Power qualitymotors, Electr. Power Syst. Res. (2016), http://dx.doi.org/10.1016/j.ep
15] M. Krisna, Types of power quality disturbances on AC electric traction drives:a survey, J. Cent. Power Res. Inst. 9 (June (2)) (2013) 191–196.
16] S.V. Sangle, C.H. Malla Reddy, A novel technology for harmonics and unbalancecompensation in electric traction system using direct power control method,IJIERT: Int. J. Innov. Eng. Res. Technol. 2 (8) (2015) 1–10.
[
PRESSms Research xxx (2016) xxx–xxx
17] European standard EN 50160, Voltage Characteristics of Electricity Suppliedby Public Electricity Networks, European Committee for Electrotechnical Stan-
analysis in electric traction system with three-phase inductionsr.2016.02.027
18] M.H. Albadi, A.S. Hinai, A.H. Al-Badi, M.S. Al Riyami, S.M. Hinai, R.S. Al Abri,Measurements and evaluation of flicker in high voltage networks, in: Int. Con-ference on Renewable Energies and Power Quality, April 2014, Cordoba, Spain,2014.


![Article in Press - cdn.publisher.gn1.link2018;25(3):[article in press] Article in Press 140 hipertensão descompensada, diabetes descompensado, má formações de segmentos nos 141](https://static.fdocuments.us/doc/165x107/6015d4ddd2e1762737317163/article-in-press-cdn-2018253article-in-press-article-in-press-140-hipertenso.jpg)