G-COE GLOPE II Working Paper Series - Waseda University · 2015-01-08 · G-COE GLOPE II Working...
60
G-COE GLOPE II Working Paper Series The Making of Making CASI Possible in Japan Masaru Kohno Koichi Kuriyama Yuko Morimoto Aiji Tanaka Motoki Watabe Working Paper No.4 If you have any comment or question on the working paper series, please contact each author. When making a copy or reproduction of the content, please contact us in advance to request permission. The source should explicitly be credited. GLOPE Web Site: http://www.waseda.jp/prj-GLOPE/en/index.html
Transcript of G-COE GLOPE II Working Paper Series - Waseda University · 2015-01-08 · G-COE GLOPE II Working...

G-COE GLOPE II Working Paper Series
The Making of Making CASI Possible in Japan
Masaru Kohno Koichi Kuriyama Yuko Morimoto
Aiji Tanaka Motoki Watabe
Working Paper No.4
If you have any comment or question on the working paper series, please contact each author.
When making a copy or reproduction of the content, please contact us in advance to request
permission. The source should explicitly be credited.
GLOPE Web Site: http://www.waseda.jp/prj-GLOPE/en/index.html

1
The Making of Making CASI Possible in Japan
Masaru Kohno (Waseda University) Koichi Kuriyama (Waseda University) Yuko Morimoto (University of Kyoto)
Aiji Tanaka (Waseda University) Motoki Watabe (Waseda University)
Prepared for delivery at the 2008 Annual Meeting of the American Political Science Association, Boston, Mass, August 28-31, 2008.

2
The Making of Making CASI Possible in Japan Masaru Kohno (Waseda University) Koichi Kuriyama (Waseda University) Yuko Morimoto (University of Kyoto)
Aiji Tanaka (Waseda University) Motoki Watabe (Waseda University)
Introduction
In 2007, the team of researchers at Waseda University headed by Aiji Tanaka as principal investigator 1 conducted a nation-wide survey, using Computer Assisted Self-Administered Interview (CASI), for the first time in Japan.2 This paper explains the goals, procedures and characteristic features of the survey.3 At various points of this paper, we go into some logistical and technical details of the making of our survey, in order to clarify the nature of problems we confronted in introducing this new method to Japan as well as how we dealt with these problems along the way. We believe that these problems, and our solutions, merit discussion because they raise important issues about the survey environment, the formatting of questionnaire, the wording and ordering of questions, treatment of DK s (“don’t know” answers) and NAs (“not applicable” answers), etc, which are all critically relevant to the methodology of social 1 The original team consisted of 16 scholars from 11 universities (see Appendix I). Researchers currently committed to this project include: Aiji Tanaka (Principal Investigator), Yukihiko Funaki, Takeshi Iida, Masaru Kohno, Ikuo Kume, Koichi Kuriyama, Kazumi Shimizu, and Motoki Watabe from Waseda University; and, Kentaro Fukumoto (Gakushuin University), Airo Hino (Tokyo Metropolitan University), Yusaku Horiuchi (Australian National University), Kosuke Imai (Princeton University), Ryosuke Imai (Tokyo Metropolitan University), Yuko Morimoto (University of Kyoto), Yoshitaka Nishizawa (Doshisha University), Yutaka Shinada (Kobe University), and Masahiro Yamada (Kwansei Gakuin University). We would like to acknowledge that the CASI computer program was developed by three of our members, Koichi Kuriyama, Motoki Watabe, and Yuko Morimoto. We would also like to thank our graduate students, Kiichiro Arai, Norihiro Mimura, Shohei Ohishi, and Arata Yamazaki for their assistance at various stages of the project. 2 The first CASI survey was conducted in February 2007 on the randomly assigned half of the sample of the panel survey (the first wave of which had been conducted in November 2005). In the summer of 2007, we conducted a two-wave survey on a freshly-drawn sample, before and after the Upper-House election. We used CASI for both the first and second waves. See below for funding sources, sample sizes, and other details. 3 The results of these surveys are reported and analyzed in other papers as well, which are to be presented in the same APSA panel as this paper is to be presented.

3
survey generally. By sharing our experiences, including some of our technological innovations, we thus hope to make a contribution to the development of survey research, demonstrating that CASI is not only doable but also a worthwhile enterprise for expanding the horizon of scientific inquiry into individual and collective human behavior. In the Beginning…
In the beginning, it seemed almost impossible to conduct a nation-wide Computer Assisted Self-Administered Interview (CASI) survey in Japan. Japan has had a long history of mass surveys, but even today an overwhelming number of Japanese surveys are conducted by either the mass-media or governmental organizations. Although Japanese scholars have been successful, especially since the 1970s, in securing research funds to conduct large-scale surveys for academic purposes, they have done so entirely on an ad hoc and individual basis. In Japan, there is no center/institute with permanent office and staff, which specializes in survey research, which engages in educational programs on survey methodology, and which is funded on a regular or even semi-regular basis. Given this absence, it seemed infeasible that a new style of survey, like CASI, could be introduced to the field of Japanese survey research.
The lack of institutional infrastructure was particularly problematic because, in Japan, mass surveys are usually conducted by face-to-face interviews, in which interviewers employed by survey companies visit the respondents’ residences.4 During the history of Japanese surveys, personal computers or any electronic devices have hardly been utilized for these interviews. Most of these interviewers of the Japanese survey companies were only accustomed to conducting interviews with paper and pencil (PAPI), in which questionnaires are read to respondents, flash cards containing the set of available answers are shown for each question, and all answers are recorded manually. The introduction of CASI would thus require a systematic and standardized training for those interviewers.
When we first approached Japan’s major survey companies and brought up the idea
4 On some occasions, telephone interviews are also used for nation-wide survey (mostly by the Japanese mass media because of their need to conduct surveys quickly), but given the increasing prevalence of cell phones in Japan, the sampling procedure for telephone surveys is becoming increasingly problematic. Japanese researchers cannot yet resort to internet surveys for a nation-wide survey because the distribution of internet users in Japan is still heavily skewed toward younger, more educated, urban-dwellers. Hence, in order to conduct a survey on a sample which appropriately represents the entire Japanese population (voters), face-to-face interviews are still the only viable way.

4
of our CASI project, they were generally skeptical of the feasibility of our project. None of these companies had any prior experience of handling hundreds of notebook computers to be programmed and transported to and from designated survey locations across Japan in a short period of time. They also admitted that they totally lacked expertise in reading and transforming electronically stored data. Further, we were told that some of their interviewers had never used computers in their own lives and might have psychological resistance to learning how to operate them. At that point, we realized that our task was immense.
It was thus clear that we would have to do almost everything from scratch by ourselves, creating detailed manual and instructions, organizing a standardized training program for interviewers across Japan, and providing assistance for transforming the electronically stored data into readily-readable forms. In addition to these logistical considerations, new technologies were needed to make the operation of CASI’s interface programs as simple and user-friendly as possible. By dividing up the task, and through trial and error, our team met all these challenges.
The Plan Develops….
As soon as our research grant application was accepted by Japan’s Ministry of Education, Culture, Sports, Science and Technology in the summer 2006, a series of meetings were held at Waseda University and overseas conference calls were set up in order to decide the direction of the three-year project.5 With regard to the basic plan and organization, the following major decisions were made. (1) CASI, not CAPI
One of our first decisions was whether we would go ahead with Computer Assisted Self-Administered Interviews, CASI, which is distinguished from its cousin method now referred to as CAPI, or Computer Assisted Personal Interview. Computer technologies, when used in survey research, bring about various benefits, including making it possible to ask questions with visual and/or audio-sound stimulus and to measure response time for each answer provided by the respondent. While the method of CAPI and that of CASI can both take advantage of these benefits, the difference between the two methods is not trivial, and the reason why we opted for CASI in Japan deserves some elaborations.
In CAPI, the interviewers retain the notebook computers for most of the interview 5 During this brainstorming stage, we took advice from many scholars not formally involved in our project. We would like to thank, in particular, Dave Howell at the University of Michigan, from whom we learned a great deal about computer assisted surveys in the United States.
5
process. In CAPI, therefore, the computers are used mainly as the interviewers’ devices to record and store the answers electronically, which are provided verbally by respondents. To utilize computer technologies for the purpose of recording and storing the answers has the advantage of reducing various measurement errors associated with the process of data-collection in survey research. In CAPI, the interviewers do sometimes hand over the computers to respondents during the interview, but they do so only for a particular set of questions, such as those that execute visual/sound stimulus and those that require privacy in the survey environment. The most notable examples of the latter are those questions that are otherwise expected to generate “socially desirable answers.”6
In CASI, by contrast, as its name “Self-Administered” suggests, the interviewers hand over the notebook computers at the beginning of the survey (that is, immediately after a brief practice session), and the respondents would be asked to type-in their answers directly. The advantage in terms of reducing measurement errors is less clear with CASI because the respondents themselves would be typing and hence recording/storing their answers. That is, the CASI method can be susceptible to errors originating from varying levels of computer literacy among the respondents. Furthermore, since the interviewers would normally detach themselves from the survey process once the survey begins, there is no guarantee in CASI that the respondents are actually reading and understanding the questions before they type-in their answers. In addition to all these methodological concerns, CAPI, not CASI, was used more extensively in the United States and elsewhere.
We nevertheless decided on CASI, not CAPI, as our survey method in Japan for several reasons. First and foremost, we were concerned with the nature of the peculiar environment in which face-to-face interviews take place in Japan. CAPI is perhaps a more appropriate survey method when personal interviews can be conducted in a physically spacious environment, as in the living room setting of a typical north-American house. In such a setting, interviewers and respondents can sit down together, interact, and, if necessary, can hand the computers back and forth as the interview progresses. In the Japanese context, however, personal interviews rarely take place in such a comfortable environment. In fact, in Japan, interviewers do not usually get invited into the respondents’ living rooms (some Japanese households do not even have the equivalent of North-American “living rooms”), but they rather remain standing near the door (sometimes even outside the door, with the door being only half open) for
6 For discussion of these questions, see below.

6
the entire interview process.7 Considering this peculiar setting, we concluded that CAPI would be a difficult method in Japan. Obviously it would be tiring for the interviewers to stand as they hold the computers and type-in respondents’ answers for the whole interview process. It would also be difficult in such a physically tight setting to hand the computers back and forth once the interview process started.
Our second concern was the level of computer literacy among interviewers, some of whom as we were told had no prior experience of handling either desktop or notebook computers. For these interviewers, CAPI would have been far more confusing than CASI. In CASI, once the computers were handed to the respondents after the practice session, interviewers would only intervene in the survey process if respondents had specific questions and/or faced some operational difficulties. In CAPI, on the other hand, interviewers had the additional burden of paying attention and making sure to turn the computers around for those “socially sensitive” questions so that they can be answered directly by the respondents. Given that this was the first time the new technologies were introduced to Japan’s survey field, we thought it best to minimize such a burden.
Third, while we were aware of CASI’s various shortcomings, we were also confident that they were the kind of shortcomings that could be overcome technologically. With regard to the difficulties associated with the basic operation of computers and understanding CASI’s programs, we made sure that the respondents needed to use only the number (“0” - “9”) keys and “enter” key for the entire survey process. Such user-friendliness would drastically reduce the measurement errors associated with varying levels of respondents’ computer literacy.8 Further, while it is true that CASI cannot exclude the possibility that the respondents might not read and understand each question before they type-in their answers, we could isolate the extreme cases of inattentive responses, by examining the response time measured for each question. Finally, we concluded that CASI was generally a superior method in cultivating the sense of privacy in survey environment. 9
7 In many cases, survey companies explicitly instruct their interviewers not to get invited to the “inside” of the respondents’ houses for security reasons. 8 In other words, we faced a trade-off between CASI’s measurement errors potentially originating from varying computer literacy among respondents and CAPI’s measurement errors potentially originating from varying computer literacy among interviewers, and we ultimately decided that the latter was a greater problem because the former can be solved technologically. 9 There is a price to pay, of course, for increased privacy. Both our CASI survey and our ordinary survey with paper and pencil (PAPI) conducted in parallel included a question at the end of questionnaire, asking the respondent if he/she would mind giving out his/her telephone number. The ratio of those respondents who actually gave out the telephone number was much higher in PAPI than in CASI. We believe that the higher

7
(2) Schedule
The next biggest issue to be settled was when and how often to conduct our CASI survey. The budget allotted to us from the Ministry was sufficient to conduct one two-wave panel survey for a freshly drawn nation-wide sample in Japan.10 However, we all agreed that it would be best to run a pretest or trial survey using CASI before we conducted our main one. Our dilemma was that, because this was the first time ever, the pretest/trial would have to be run as if we were conducting a real CASI survey. Otherwise, it would not reveal any of the problems, either logistical or technological, that we should expect to encounter. This meant, for all practical purposes, that we had to conduct full CASI surveys twice. We were fortunate that, in terms of research funding, there were some other large sources of funding available at Waseda, which we could pool together. After some deliberations, the following was decided.
First, we would conduct our main panel-structured CASI survey in the summer of 2007. We decided on this timing because it was expected that, in July 2007, there would be an election for the House of Councilors, or the Upper House of Japan’s bicameral parliament. The first wave of the panel would be conducted before and the second wave after the election.
Second, at the same time as the above CASI survey, we would conduct in parallel an ordinary PAPI survey on the same-sized nation-wide sample.11 As we would prepare and ask the same set of questions for CASI and PAPI (with the exception of the last question involving political-economic experiments, which is explained later in this paper), this parallel (and panel-structured) design would enable us to compare the
rate in PAPI had something to do with a good rapport that real human interviewers were able to cultivate with the respondents. There thus seems to be a trade-off between “intimacy” and privacy. Generally, what constitutes the best survey environment is extremely difficult to define. 10 We acknowledge that our main survey, the Waseda Study of Computer Assisted Self-Administered Interview 2007 (Waseda-CASI2007), was made financially possible by the Grant-in-Aid for Scientific Research (A) (#18203008, headed by Aiji Tanaka of Waseda University, for 2006-08), the Ministry of Education, Culture, Sports, Science and Technology, Japan. The data sets will be available in the near future from ICPSR, the University of Michigan (http://www.icpsr.umich.edu/) and/or the Social Science Japan Data Archive, the Institute of Social Science, the University of Tokyo (https://ssjda.iss.u-tokyo.ac.jp/en/). 11 We acknowledge that this survey, Waseda-PAPI2007, was made financially possible by the Open-Research-Center Enhancement Program (headed by Koichi Suga of Waseda University, for 2004-2008) of the Academic Research Advancement Promotion Programs for Private Universities, the Ministry of Education, Culture, Sports, Science and Technology, Japan. For the sample sizes, sampling procedures, actual response rates, and other technical details of our CASI and PAPI surveys, see Appendix II.

8
results based on two different survey methods in meaningful ways. 12 Third, as a pretest or trial-run, we would conduct a CASI survey in February 2007 as
part of the second wave of the panel survey, the first wave of which had already been conducted in November 2005 by a group of Waseda researchers.13 More specifically, we would randomly assign the respondents of the 2005 first wave survey into two groups, and we would conduct CASI survey on one of them while on the other half we would conduct an ordinary PAPI.14
Fourth, even before conducting the February pretest survey, we would conduct a “pretest for the pretest” survey on a small-size sample drawn in the Tokyo area. This pre-pretest run was necessary for both logistical and technological reasons. Logistically, we needed this extra step to prepare our instruction manual for interviewer training and to obtain feedback for its improvement. Technologically as well, we wanted to remove the bugs of the CASI interface software at that point. This pre-pretest in Tokyo turned out to be extremely successful in various respects. It was evident that interviewers read and understood our manuals very well, as they had no trouble remembering to charge the batteries the night before, handling the computers safely, and explaining the purpose and operation of CASI to the respondents. Even those interviewers who were totally inexperienced with computers had no difficulty operating our CASI program, and the program actually worked! This experience obviously boosted our confidence and finally convinced the survey company that CASI was doable.
Do Computers Really Make Difference?
12 For more on this point, see below. 13 We acknowledge that this survey, or GLOPE Computer Assisted Self-Administered Interview 2007 Study (GLOPE-CASI 2007), was made financially possible by the 21st-Century “Center of Excellence” (21COE) Programs (headed by Shiro Yabushita of Waseda University, for 2003-2007), the Ministry of Education, Culture, Sports, Science and Technology, Japan. We also acknowledge that the first wave of this survey, as well as the PAPI portion of the second wave, were made financially possible by the Open-Research-Center Enhancement Program (headed by Koichi Suga of Waseda University, for 2004-2008) of the Academic Research Advancement Promotion Programs for Private Universities, the Ministry of Education, Culture, Sports, Science and Technology, Japan. The data sets will be available in the near future from ICPSR, the University of Michigan (http://www.icpsr.umich.edu/) and/or the Social Science Japan Data Archive, the Institute of Social Science, the University of Tokyo (https://ssjda.iss.u-tokyo.ac.jp/en/). 14 The random assignments was made based on survey points rather than individual respondents, not only for “matching” purposes, but also because the number of notebook computers we were able to purchase was limited because of the budget constraints, and it would have been physically impossible to transport the computers from one location to another during the short survey period.

9
Our team of researchers wanted to conduct CASI survey not only to introduce computer technologies to the field of Japanese survey research. We also had in our minds a set of specific, more research-oriented goals. One of these goals was a systematic comparison between CASI and PAPI as survey methods.
It is generally claimed that the introduction of computer technologies to the field of survey research brings about various advantages over an ordinary survey with pencil and paper. To test whether such advantages really exist, however, requires an experimental setting where the same set of questions are asked simultaneously for two same-sized samples, one with and the other without the aid of computer technologies. In our view, the design of our split-sample/parallel, panel-structured surveys provided an excellent opportunity for this test and to determine whether the computers do actually make any difference. 1) “social desirability” hypothesis
One specific, frequently-mentioned advantage of CASI over PAPI is, as noted earlier, the increased privacy in survey environment. In an ordinary PAPI survey, the interviewer reads out each question, to which the respondent answers verbally. Thus, in PAPI, the respondent expects that his/her answers will be heard by and known to at least one another person, namely the interviewer. Because of this expectation, the survey environment of PAPI cannot be regarded as being entirely “private.” By contrast, in CASI survey, the respondent is assured that his/her answer will not be seen or heard by anybody, including the interviewer. Because the respondent him/herself types in the answer to each question and proceeds at his/her own pace, the interviewer does not even know which question the respondent is answering at any time.
The different levels of privacy in the survey environment are known to have non-negligible effects especially when the respondents are asked questions that may generate the so-called “socially-desirable answers”. What constitutes “socially-desirable answers,” and/or what constitutes those questions that generate such answers in the first place, must vary across countries with different cultural and historical backgrounds. In fact, precisely because of the private nature of the problem, we have no way of determining, ex ante, what constitutes such questions/answers, until we canvas many different areas of social activities in an exploratory fashion. In our view, a well designed CASI-PAPI comparison would provide an excellent opportunity to pursue such needed exploration.
While it is beyond the scope of this paper to review all of our findings related to socially desirable answers in Japan, a few examples may be sufficient to illustrate the

10
stark difference that the two survey methods can make.15 For example, our pre-election wave survey included a question regarding how frequent the respond read a daily newspaper. Our results reveal that, when the surveys were conducted as face-to-face interviews with real human interviewers, more people answered that they read newspaper every day or mostly every day. Also, the number of those who answered that they never read newspaper was substantially higher under CASI’s survey environment where the respondent was assured privacy during the interview process. These tendencies seem to suggest that reading a newspaper is regarded as one of those activities that are socially-expected or socially-desired among the Japanese grown-up men and women. The respondents were, in the context of PAPI with the interviewer present, pressured to say that they did conform to such a normal behavior (see Table 1).16
TABLE 1 about here
The above results on reading newspapers can be contrasted with those on watching television (see Table 2). The overwhelming number of our respondents in both PAPI and CASI answered that they watched news on television every day or mostly every day, and there was no significant difference in the distribution of answers provided under the two methods. Unlike with newspapers, there does not seem to be any social pressure that forces respondents to answer one way or the other in the case of watching television.
TABLE 2 about here
Another illustrative example can be found in the respondents’ evaluations of their own ideological positions. This question was asked in our post-election wave survey. In Japan, instead of the “left” and “right” labels widely-used in the other western
15 For more findings and detailed analyses on this subject, see Yoshitaka Nishizawa and Koichi Kuriyama’s paper to be presented at the same APSA panel. 16 The same question was repeated in our post-election wave survey. Interestingly enough, in that 2nd wave, the noticeable difference in the distributions between CASI and PAPI disappeared almost completely. While it is impossible to make any conclusive interpretation of this evidence, it does seem to point to the possibility that the pattern of attrition between the first and second waves in panel survey must be related to the varying level of “vulnerability to social pressure” of individual respondents. For example, it is possible that the behavior of those respondents who participated in the first but not in the second wave might itself be one of their socially-desirable behavior.
11
democracies, the terms to describe ideological positions are “Kakushin” and “Hoshu” which roughly correspond to “progressive” and “conservative” respectively in English.
TABLE 3 about here
The results (Table 3) reveal that many people in Japan, as elsewhere, tend to regard themselves as “the middle of the road,” positioning themselves just around the half point between the most extreme progressive and the most extreme conservative positions. It is yet possible to detect some differences in the distributions between CASI and PAPI as well, most notably the gap in the number of respondents who positioned themselves at the exactly mid-way position. Arguably, this gap reflects the fact that, with regard to ideological positions, declaring oneself “middle of the road” is a socially desirable thing to do in Japan. Further, under CASI, more people seemed willing to admit that they were at the two ideological extremes presumably because of assured privacy in the survey environment.
If the above observations and interpretations are correct, we must conclude that the choice of survey methods does make a significant difference. In PAPI, the survey environment which respondents face is practically a social environment because of the presence of one another person, the interviewer, with whom the respondents are expected to engage in some inter-personal interactions. Under such circumstances, the respondents are bound to feel pressure which at least in some cases would ultimately lead them to express “socially-desirable answers.”
2) CASI effect
It is claimed, as noted earlier, that the introduction of computer technologies to survey research reduces various measurement errors in the data gathering process. Aside from the measurement errors associated with interviewers (such as mistakes in hearing or recording the respondents’ answers), there are also errors associated with the respondents” limited cognitive processes, such as instability in their own attitudinal formation and inconsistency in recalling their past experiences and events. Computer technologies, especially their ability to display various kinds of information visually and/or with audio-sound, are expected to compensate these human cognitive limitations. If so, they are likely to reduce at least some of the relevant measurement errors.
This technical aspect of CASI’s advantage may interact with the increased privacy in survey environment provided by CASI as well. In ordinary survey with paper and pencil, the respondent’s process of forming opinions and retrieving memories may be affected

12
by subtle differences in the ways the interviews are conducted. Even with the same interviewer, the way in which he/she asks questions and waits for answers may vary from one day to another, or from one respondent to the next, causing noises in the process of collecting data. In CASI, a large part of these noises, or the so-called “interviewer effects,” is expected to vanish.
Generally, then, CASI is likely to bring about more “stability” and “consistency” in respondents’ answers and thus to reduce measurement errors in comparison to PAPI. Our series of surveys were designed to pursue such a comparison and thus to identify CASI’s advantage in a systematic way. Note, in particular, that we designed our surveys to carry out both “between” and “within” comparisons of the two methods. That is, the PAPI-CAPI parallel surveys conducted before and after the House of Councilors election in 2007 provides an opportunity to conduct a comparison between the two groups under different survey systems, while the PAPI-CASI panel survey conducted on the half of the sample originally drawn in 2005 provides an opportunity to conduct a comparison within the same group under different survey systems. (see Table 4)
TABLE 4 about here
Regrettably, at the time of writing this paper, we must report that this line of
systematic comparison between CASI and PAPI has not yet been carried out. In our original plan, we were going to include, in the post-election wave, photos of candidates running for the House of Councilors in CASI when the respondent was asked to recall to whom he/she voted. The purpose of including such visual information was to compare the results with PAPI’s results, in which only the candidates’ names could be provided. We were thus hoping to show that CASI method is superior in retrieving the respondents’ memories about their past actions.17 Unfortunately, because we faced bureaucratic obstacles obtaining the official photos of all the candidates from the Ministry of Home Affairs, we had to abandon this project at the very last minute.
A more general reason why our inquiry has not yet advanced so much in this area relates to the delay in our data-cleaning process, especially with regard to the response time measured in CASI survey. A meaningful exploration of the respondents’ abilities to
17 An important caveat must be added here. The Japanese government does not disclose information about each voter’s real voting record. Hence, it is impossible in Japan for survey researchers to find out whether the respondent is retrieving a “correct” memory about his/her voting decision. Nevertheless, the difference, if any, between CASI and PAPI in the number of respondents who would answer “I do not remember” could be taken at least as partial evidence.
13
form stable attitudes and/or to recall past events consistently requires, in our view, a systematic analysis of response time for the relevant questions. We therefore intend to pursue this aspect of the research in future when the data-cleaning process is complete. Grounds for Comparability?
Theoretically, it seemed simple enough to conduct a comparison between CASI and PAPI for the purposes outlined above. As a practical matter, however, it turned out that it was extremely difficult to create survey environments that were meaningfully comparable between the two methods. There were manifold problems we had to deal with logistically and technologically, and we were able to solve some, but not all, of them. To convey the nature of difficulties we confronted and how we tried to solve them, let us discuss a few examples. 1) treatment of DKs, or “don’t know” answers
In an ordinary PAPI survey, the interviewer usually shows a card containing the list of choices for available answers for each question, but such a list rarely contains DK as one of the options.18 The reason for this is obvious enough. If the DK option were included explicitly in the list, more respondents would likely to choose DK as their answers simply to pass up difficult questions or to avoid strenuous thinking processes. In the absence of an explicit DK option, however, respondents do sometimes answer orally to the interviewers, “I don’t know,” in which case the interviewer would record DK as the expressed answer. Even if the respondent does not say “I don’t know” expressly, it is easy to imagine situations where the interviewer should still record DK as the answer. Suppose, for example, the respondent stumbles on a particular question for a long time, longer than any other questions. The interviewer, in such a case, is instructed to read out the question slowly one more time. If the respondent still does not provide an answer, the interviewer would then ask the respondent, “you don’t know the answer?”. If the respondent nods or indicates somehow that he/she does not know the answer for this particular question, the interviewer would record DK.
In the ordinary PAPI context, then, there are some intricate interactions that take place between interviewers and respondents before DKs are eventually recorded as their answers. In the CASI environment, it is impossible to recreate these interactions. For the same reason stated above, it would be unwise to display DK explicitly as one of the available options on the CASI’s screen. Besides, the inclusion of DK would defeat the whole purpose of PAPI-CASI comparison. Nevertheless, it would also be wrong, for the purpose of comparability and even for ethical reasons, if the respondents were 18 The notable exceptions are the set of “political knowledge” questions.

14
entirely deprived of options to choose DK as their ultimate answers. We, thus, had to come up with some kind of solution, which would guarantee the respondents’ right to say “I don’t know” on the one hand but which on the other hand would not excessively encourage them to answer in that way.
Our solution to this problem was both logistical and technological. First, logistically, we emphasized, in our instruction manual given to the interviewers, that every respondent must be notified at the beginning of the interview process that he/she could say “I do not know” as answer to any question.19 Accordingly, for both PAPI and CASI surveys, all of our interviewers made sure that each respondent knew that he/she was not deprived of DK as an option.
Second, technologically, our CASI interface program indeed included an explicit option, “I don’t know,” though it was not given as part of the first set of options for answers. More specifically, our program was designed in such a way that, every time the respondent skipped a question (by hitting the “enter” key without having chosen one of the given answers shown on the screen), a distinctly-colored (yellow) page would appear, showing the following message. The respondent was thus given an option to choose DK at this point.20
You did not answer.
If you want to go back to the previous question, press (1). If you want to go to the next question, choose (2) or (3) to give the reason.
(1) go back to the previous page
(2) because I do not know (3) because I do not want to answer
19 We also emphasized that every respondent must be notified at the beginning of the interview process that he/she could say “I do not want to answer” to any question. 20 Further, our CASI program was designed in such a way that this yellow page forced the respondent to choose one of the three options in order to proceed to the next question. That is, if the respondent hit the “enter” key either accidentally or intentionally on this screen, then a smaller “pop-up” screen would emerge and ask “please choose one of them.”

15
The obvious “pros” of this scheme were that it guaranteed the respondent’s right to self-record “I don’t know” to any question without him/her being unnecessarily encouraged to do so. The scheme, at the same time, had the merit of assuring the respondent his/her right to refuse to answer any question, a merit which was crucial from ethical standpoints. It is true that, because DK was not given in the first set of options, the respondent somehow had to bother to ask the interviewer how he/she could skip a particular question to which he/she happened not to know the answer. But, for the purpose of making CASI comparable to PAPI, the exclusion of the explicit DK option from the initial set of answers was “nonnegotiable,” so to speak. We also thought that ample instructions provided at the very beginning of the interview process should alleviate the possibility that the respondent would hesitate to ask the interviewer what to do when he/she faced a question to which he/she happened not to know the answer.21
The above scheme had some obvious “cons” as well. Because the DK option was hidden behind the initial set of answers, our CASI program may have the effect of discouraging the respondents to choose DK as an answer. No matter how carefully the interviewers explain that DK is a viable option for an answer, it is still possible that the respondents may simply forget the instruction. Besides, as shown above, to choose DK in our CASI program was designed to be rather cumbersome, as it required an extra step of skipping a page in order to get to the yellow screen. While we were convinced that our scheme was the best for the purpose of establishing comparability between CASI and PAPI, we were concerned how this arrangement would affect the distribution of DKs. To prove our concerns, to some extent, it turned out that CASI recorded quite fewer DKs (and NAs) than PAPI for almost all the questions.
These results, however, do not mean that our CASI program excessively or unnecessarily discouraged the respondents from choosing to say “I don’t know.” Those terms “excessively” or “unnecessarily” suggest that there is some “optimal” level of encouraging/discouraging DK in any survey and that our particular design of the CASI program somehow deviated from it. Such an optimal level, of course, neither exists in 21 A respondent would of course know about the existence of this extra “yellow page” screen after he/she used it for the first time. Respondents could find out about this page accidentally as well, by hitting the “enter” key by mistake at some point during the self-administered interview process. In either case, it could be argued that, once discovered, the merit of this scheme that it would not encourage DK unnecessarily would be lost thereafter and that clever respondents could always choose to go to the yellow page to pass up difficult questions or to avoid strenuous thinking process. We ultimately concluded, however, that, the merit would not be lost even after the existence of this page became known to respondents, because the respondent facing this yellow page would still have to engage in a cumbersome step of choosing from multiple options to proceed to the next question.

16
the abstract, nor is possible to define for all practical purposes. Take, for example, the results for one of our survey questions regarding the important
persons/organizations in policy implementation. As can be seen from Table 5, the difference between PAPI and CASI in DK frequencies is quite striking for this particular question. But, note also that between the two methods, the number of respondents who choose “prime minister” as their answer is also strikingly different. Taking both into considerations, it is not simply that CASI “excessively” or “unnecessarily” discourages the respond to choose “I don’t know” as an answer. It might well be the case that CASI is a method that reveals the respondents’ “true” opinions more effectively because the extra cumbersome step of having to skip the initially-given set of answers forces the respondent to ponder his/her answer more thoroughly.22
TABLE 5 about here
Generally, then, our experiment of trying to create meaningfully comparable
environments between CASI and PAPI reinforces the obvious, and yet often forgotten, point about the methodology of survey research. That is, different survey methods have different merits and shortcomings, and hence the choice of methods itself affects the effectiveness and efficiency of data collection. Our findings that the DK answers can be drastically reduced under CASI suggests, at minimum, that we should be careful when drawing inferences from non-CASI survey results with large numbers of DKs. 2) Questionnaire Formatting:
Another set of problems that arose in establishing CASI-PAPI compatibility was concerned with various aspects of questionnaire formatting. Some types of questions, which were unproblematic in PAPI, turned out to be difficult to ask in the CASI environment. We believe that most of the problems we encountered were solved technologically, and would be pleased to share our experiences.
The type of questions which posed great difficulties initially were those which contained multiple elements in one question. Take, for example, the question in our post-election wave survey which asked the respondent to evaluate the importance of different levels of elections held in Japan. The question reads:
[post] Q10 In thinking about the future of politics in Japan, how important do you
22 In order to explore this line of inquiry, a systematic analysis of response time for DK answers will be helpful.

17
think the results are of the House of Representative election, the House of Councilors election, and the Combined Local Assemblies and Gubernatorial elections, respectively? If “0” means “not important at all” and “10” means “extremely important”, what number indicates your answer?
And, the following three specific statements were tagged in turn: (1) first, how about the House of Representatives election? (2) then, how about the House of Councilors election? (3) then, how about the Combined Local Assemblies and Gubernatorial elections? For such a set of questions, in the PAPI context, the interviewer would typically
prepare only one card for the answers which would contain all three elements, namely “House of Representative elections”, “House of Councilor elections” and “Combined Local Assemblies and Gubernatorial elections”. One card is more preferable than three separate cards because what these questions are trying to get at are the respondents’ relative evaluations of the three elections. By preparing only one card for the all three, the respondent is forced to anticipate subsequent questions about “House of Councilor election” and “Combined Local Assemblies and Gubernatorial elections” even while answering the first question about “House of Representative elections.”
How could we replicate the same condition in CASI? The first problem we faced was the constraint imposed by the basic operation of our interface program, which required the respondent to hit the “enter” key every time for his/her answer to be recorded electronically. Ordinarily, this constraint would only allow one question to be displayed on the CASI screen at any stage of the interview process, and the respondent would expect that, by hitting the “enter” key, he/she would be moving onto the next question. However, for a question such as that set out above which contained multiple elements to evaluate in relation to one another, the respondent had to remain at the same screen even though he/she might have to hit the “enter” key multiple times to record the answers. What was needed, therefore, was a matrix format of questionnaire in our interface program whereby only the focus within the screen, not the screen itself, would shift by hitting the “enter” key. For a demonstration of how this interface works, see Appendix III(1).
This innovation of the “matrix questioning” format solved some, but not all of the problems. If the number of elements which the respondent was asked to evaluate in relation to one another was small, as was the case above with only three elements, the

18
simple, static version of matrix interface would have been sufficient. In other cases, however, the number of elements was much larger, as was the case with post-election wave Q15 regarding the respondent’s participation in various categories of political activities. The format of this question had to be extremely complicated, because it had two components, the first about his/her past experience of participation and the second about his/her willingness for future participation, across 16 categories of activities respectively (see Appendix IV). Because the size of the fonts used for CASI’s screen display had to be large enough, another technological modification was needed so that the matrix format could accommodate those questions containing larger number of elements at the same time.23 Our solution was to invent a dynamic version of the matrix questioning interface, in which the contents displayed on the screen would scroll down as the respondent hit the “enter” key. For a demonstration of how this interface works, see Appendix III(2).
In addition to the above multiple-element questions, those type of questions that allowed for multiple answers also forced us to innovate a special technological treatment under CASI. The following, for example, is one of such questions often asked in any survey.
[pre] Q.10: Are there any parties that you would never want to support? If there are, which parties are they? Please name as many parties about which you feel this way (M.A.).
For this type of question, in PAPI, the interviewer normally records as many answers
as the respondent provides, and the process continues until the respondent finally makes it clear to the interviewer that “there are no more parties applicable” left on the remaining list. During this process, the interviewer, if so instructed, can also record the order in which each answer is given by the respondent.
How can this procedure be replicated in CASI? Again, because of the basic constraint of the CASI’s operation, such questions allowing for more than one answer at a time pose a problem, because the respondent has to hit the “enter” key each time he/she choose one item on the list. Our solution to this problem was to invent an interface scheme with which to transform this multiple answer question into a series of single
23 We were concerned that if the font sizes were too small, elderly respondents would not be able to read the questions and list of answers displayed on the screen. It is true that the “font size problem” would occur for the answer-option card in the PAPI.context as well. But, in PAPI, the interviewer not only shows the card but can repeat the answer-options if necessary.

19
answer questions. This scheme works as follows. The respondent initially sees the screen displaying the full list of political parties, while being asked “Are there any parties which you would never want to support? If there is, which party is it?” If the respondent chooses, for example, the Japan Communist Party (JCP) as his/her initial answer and hits the “enter” key, then the respondent will see the second screen displaying the list of all parties but the JCP, while being asked “Are there any more?”. If the respondent chooses the Liberal Democratic Party (LDP) in this round and hits the “enter” key, then a third screen displaying the list of all parties but the JCP and the LDP will appear, with a question “Are there any more?”….This process continues until the respondent chooses the option, “there are no more applicable” and hits the “enter” key, which will take the respondent to the next question. Note that this scheme makes the CASI’s procedure for this question parallel to PAPI’s procedure in several key respects. Not only are the respondents in both PAPI and CASI given opportunities to express more than one answer for this question (as they are supposed to for a MA question), they are also able to express the rank-order of their answers (the order of negative preferences for political parties in this case), which is recorded manually by the interviewer in PAPI and electronically in CASI. For a demonstration of this scheme, see Appendix III(3).
The above are but some examples of the technological innovations which were necessary to make a meaningful comparison between CASI and PAPI. The above examples are a reminder that the introduction of computer technologies to the field of survey research often creates a completely new set of problems, which would not have arisen under the ordinary survey method. Randomization
In our planning stage, we recognized that another important benefit of introducing computer technologies to the field of survey research was the ability to randomize the order of questions as well as that of the listed choices for answers. For our 2007 CASI survey, we did not randomize the order of questions, but we did the order of listed choices for answers, as well as the order of the elements in those questions (such as post-election wave Q15 cited above) which ask the respondents to evaluate them in relation to one another. (1) Why Randomize?
From a methodological standpoint, randomization is crucial when the order of questions and/or of listed choices is expected to inflict a non-negligible cognitive impact on the respondent. Although the gravity of such an “ordering effect” has been known to

20
the community of Japanese survey researchers, they had no choice but to ignore it in the past because in PAPI, for practical reasons, the order needed to be fixed for all the respondents. Thus, for example, in the question quoted above (pre-election Q10) which asks the respondent to choose a party/parties which he/she would never want to support, the respondents in a typical PAPI survey in Japan would face the list of political parties starting with the Liberal Democratic Party at the top, followed by the Democratic Party, then by Clean Government Party, …. usually in the order of relative share of parliamentary seats. This way of listing would be problematic if the respondent, by correctly recognizing from this particular order that the LDP was the largest and/or most powerful party, was somehow influenced to decide that he/she would or would not support the LDP, independent of his/her “original” or “true” opinion toward the LDP. In such a case, the listed order itself cannot be regarded as being informationally neutral, as it may create some cognitive bias for/against the LDP in the mind of the respondents.
Despite the possibility that ordering effects are abound, PAPI is severely limited in that it would be practically infeasible to prepare (i.e., to print out) hundreds of (randomized) sets of questions and/or answers. Even it were possible to prepare such questionnaires and/or lists, manual recording of answers by interviewers would likely cause errors. Under CASI, however, none of these problems arises.
(2) Randomization and the Organization of Data Set
Conceptually, to introduce randomization in survey research appears to be a simple procedure. Indeed, as far as the technological aspects are concerned, randomization can be done quite easily using computers. It turned out, however, that it is rather a complicated procedure to transform the results obtained from randomized questionnaires into readily-usable data. In order to express all the necessary information obtained from CASI’s randomized questionnaire, some innovations were required in terms of the organization of variables in the data-set.
To illustrate how we created and coded variables, let us consider the example quoted above, which asks: “[PreQ.10] Are there any parties that you would never want to support? If there are, which parties are they? Please name as many parties about which you feel this way (M.A.).” In CASI, as noted before, the list of answers to this question was randomized. Now suppose that the actual (randomized) order that a particular respondent happened to see on the initial screen was the following:
1. LDP (Liberal Democratic Party) 2. CGP (Clean Government Party)

21
3. SDP (Social Democratic Party) 4. DPJ (Democratic Party of Japan) 5. JCP (Japan Communist Party) 6. Other parties 7. There is no such party
We call this order “Display Sequence” denoted by “DS” in our data-set. In order to
convey the information about the order of the listed choices (randomized for each respondent), we would need five DS variables, namely:
a10DSx1st a10DSx2nd a10DSx3rd a10DSx4th a10DSx5th
where “a” stands for “pre-election wave”, “10” for Question 10, “x” for multiple answer type of question, and “1st” for the first answer option listed, “2nd” for the second answer option listed, and so forth. By assigning each political party the same fixed reference number as used in PAPI, then, the above five variables together can express the displayed (randomized) order which this particular respondent actually saw on the initial screen. That is, with LDP=1, DPJ=2, CGP=3, JCP=4 and SDP=5, the above five variables for this respondent should read:
a10DSx1st = 1 a10DSx2nd = 3 a10DSx3rd = 5 a10DSx4th = 2 a10DSx5th = 4
Turning from the display order to the preference order of this respondent, suppose
further that this respondent has chosen the JCP as the party that he/she does not want to support in the first round of questioning, that he/she has also chosen the CGP in the second round, and the SDP in the third round, but that he/she has chosen “no more parties applicable” in the fourth round. To represent this (negative) preference order requires another set of variables, which we call “response sequence” and denote by “RS.”

22
In the case of the above respondent, these variables should read:
a10xLDPRS = -9 a10xDPJRS = -9 a10xCGPRS = 2 a10xJCPRS = 1 a10xSDPRS = 3 a10xOTHRS = -9 a10xNONRS = 4 a10xDKRS = -9 a10xNARS = -9
These two sets of variables above, DS and RS variables, together contain all the
necessary information about the results from CASI’s randomized questionnaire. Nevertheless, we recognize that these two variables by themselves are not so convenient for practical purposes, particularly when comparing those with the results from PAPI for the same question. Thus, we have prepared a third set of variables, which we call “Converted Sequence” (denoted by “CS”) representing which party was chosen as an answer in which order. In the case of the above respondent, they should read:
a10CSx1st = 4 (for JCP) a10CSx2nd = 3 (for CGP) a10CSx3rd = 5 (for SDP) a10CSx4th = 7 (for “no more parties applicable”) a10CSx5th = -9
(3) Effect of Randomization?
Because public opinion surveys in Japan had never been conducted with randomization in the past, it is possible that they were contaminated by various “ordering effects” resulting from the particular ways in which the answer-options and the elements for relative evaluations were listed in the questionnaires. Utilizing computer technologies, our CASI survey provides the first systematic findings with which to test these effects in Japan. If there were any such ordering effects, they should be detected in our results obtained from the randomized questionnaire.
Appendix IV lists all of the questions, in both pre-election and post-election waves, in

23
which we randomized the order of listed answers and elements, together with the results from both CASI and PAPI. Despite some stark differences between the two sets of results, it is impossible to isolate the effect of randomization by simply comparing these aggregate distributions. There are so many other factors that interact with these results, obvious examples being the possible effects of social desirability and DK treatments both of which have already been discussed above. To reveal the randomization effect (and hence the ordering effects) would thus require a thorough analysis of the display sequence and response sequence variables within the CASI sample.
Political Economic Experiments
Finally, the third major pillar of our research objectives was to conduct what we call a “political-economy experiment” utilizing CASI.24 At Waseda University, economists, social-psychologists, and political scientists have been engaged since 2003 in collaborative research on new types of experiments, the design of which explicitly incorporates the stage of political decision-making in otherwise standard public-goods provision games. These experiments have been conducted in our newly-built laboratory, where up to 20 human subjects in divided booth setting can engage in various forms of strategic interactions through the network of computers. Taking advantage of our CASI survey, we decided to conduct similar experiments on a randomly drawn nation-wide sample. 1) Why CASI experiment?
The methodological strength of an experiment in scientific inquiry lies in its ability to reveal a causal mechanism by contrasting the behavior of “controlled groups” and “experiment groups.” That is, through a carefully-designed manipulation of the conditions that each group faces, the experiment can isolate the hypothesized effect to cause the difference in behavioral outcomes between the two groups. While this procedure secures the so-called “internal validity” in testing the logic of a causal argument, the ordinary experiment conducted in a laboratory setting is said to lack “external validity” in testing the generalizability of the argument. Typically, experiments conducted in university laboratories use students as their subjects. Moreover, the number of students that can participate in an experiment at one time is often severely limited due to limitations in space and the network environment of the
24 For the details of our experimental design and a preliminary analysis of the results, see the paper by Kazumi Shimizu, Motoki Watabe, Kentaro Fukumoto, Yuko Morimoto and Koichi Kuriyama to be presented at the same APSA panel.

24
laboratory itself. Thus, criticisms levied repeatedly against experimental research have been that neither the findings nor the inferences drawn from these experiments can be generalized.
The lack of external validity is problematic, particularly when the hypothesis being tested in the experiment has something to do with macro-political phenomena, such as elections, demonstrations, revolutions, and, more generally, political changes. The process that leads to these extraordinary political events involves a large part of the entire population, whether the involvement may take the form of explicit participations in political action or more tacit consent and collaboration. Thus it would be improper, for example, to draw inferences about certain electoral outcomes based on an experiment that replicates the election and voting decision process in a laboratory setting. Obviously, university students alone cannot represent the eligible voters of an entire nation.
Our aim in incorporating a political-economic experiment into the 2007 CASI survey was to conduct an experiment concerning a macro-political event on a sample randomly drawn from the nation-wide population of Japan’s eligible voters. To our knowledge, such an experiment has never been conducted anywhere in the world. 2) the puzzle, hypothesis and experiment
In designing our experiment, we had in mind a specific puzzle in the context of recent Japanese politics: Why did Prime Minister Jun’iciro Koizumi win a landslide in the 2005 House of Representatives election? Koizumi’s extraordinary victory defied most of the conventional explanations offered by contemporary Japanese politics. The Liberal Democratic Party has been suffering a long term decline ever since the 1960s, and Koizumi’s own drastic reform initiatives were said to have had a devastating impact on the LDP’s strongholds. Furthermore, as a result of the 1993-94 change in electoral laws, a two-party system has been gradually emerging in Japan, with the Democratic Party of Japan increasingly becoming a viable alternative to the LDP. Koizumi’s success was at odds with all of these trends.
To explain Koizumi’s success, we focused on his political style and particularly his usage of political rhetoric during the campaign. It appeared that his clear and simple presentation of political issues, such as his staunch and determined position regarding the privatization of Japan’s postal services and savings, was critical in appealing to undecided voters. Hence, we hypothesized:
Hypothesis: Koizumi’s usage of simple phrases appealed directly to otherwise

25
politically uninterested voters and also indirectly by raising their “shared expectation” that others (like themselves) would be mobilized.
In order to test this hypothesis, we decided to incorporate a political-economic
experiment with our CASI survey. In fact, such an experiment was the only appropriate way to test the hypothesis. Obviously, because the landslide electoral victory had already taken place a few years before, we could not go back in time and redo another survey with right questions. It was not a viable option, either, to ask the respondents to look back and recall their voting decisions, especially now that they already knew the stunning results of that election. We therefore needed to create the same situation as the voters faced in a more abstract and formalized way, and to conduct an experiment to see whether the subjects/voters would behave the way they actually did in the past election. And, if we conduct this experiment, not in a university laboratory, but with a randomly drawn nation-wide sample, the findings and inferences drawn from this experiment would retain generalizability.
More specifically, in our CASI interface program, we created an imagined situation where each respondent would have to decide whether to participate in a public action (to vote for reform) by paying some personal cost (by going to the poll). The situation was such that the respondent would know that a certain percentage of people (those in an imagined neighboring community) would have to participate together to bring about the result. Essentially, this is a “Public Goods Provision Game with Thresholds,” which is known to have multiple equilibria, one with successful provision of such goods and the other without. Using the framework of this game, then, the key to test the above hypothesis was an effective manipulation of the “simplicity” and/or “clarity” of message that the respondent received. We thus set up the situation where the respondent would receive messages regarding the nature of the aimed public action with varying degrees of difficulty. Group A was given the explanation in simple and clear phrases. Group A was also led to believe that others would be given the explanation in simple and clear phrases. (EASY-EASY Group). Group B was given the explanation in long and difficult phrases. Group B was also be led to believe that others would be given the explanation in long and difficult phrases. (HARD-HARD Group). Group C (like Group A) was given the explanation in simple and clear phrases. However, (unlike Group A) Group C would be led to believe that others would be given the explanation in long and difficult phrases. (EASY-HARD Group). This experimental design leads us to expect that, to be consistent with the above hypothesis, public action would most likely to occur among Group A, least likely among Group B, with Group C somewhere between the two.

26
Prior to the actual CASI survey, preliminary tests of our experimental design were conducted several times at the Waseda’s laboratory using students as subjects. Then, they were tested in the pre-pretest of CASI conducted in the Tokyo area. As the results from these numerous pretests were supportive of our hypothesis, they were finally incorporate into both of our main two-wave surveys in the summer 2007.
3) Results and suggestions for future research
The results of our CASI experiments are provided in details in our colleagues’ paper, and they are thus not repeated here.25 For the present purpose, we make a few observation as well as suggestions for future direction of research.
First, our experiments were conducted in both pre-election and post-election waves, which already had many regular survey questions for the respondents to answer. The experiments were positioned at the end of our CASI questionnaire. Because these experiments require a lengthy instruction, most respondents spent much longer time for this particular part of the questionnaire than they did on average with other questions. In a future research, perhaps, it would be better to conduct CASI experiment independent of CASI survey, for the sake of respondents’ concentrations. Some respondents seemed a little confused when the experimental question suddenly appeared on their screen with a totally different image and format.
Second, the procedures of our experiments were explained to the respondents only visually, using Flash program incorporated into our CASI interface software. This, we realized, was an unusual procedure since, ordinarily, the instructions for experiments are provided by real human agents. One suggestion for future CASI experiment is that it might be helpful for the respondent to listen to the pre-recorded instructions on notebook computers, to compensate the visual information that he/she absorbs on the display.
Third, although our experiment had an element of “strategic interaction” in its basic structure of the game, it was impossible based on the level of our technologies to let the respondents engage in an “on-line” interaction in making their decisions regarding pubic actions. In an environment where wireless internet network is more prevalent, it would be more suitable for the respondents to have a real strategic interaction among themselves, in order to approximate the situations that these respondents face in real politics.
25 See the APSA paper by Kazumi Shimizu, Motoki Watabe, Kentaro Fukumoto, Yuko Morimoto and Koichi Kuriyama.

27
Conclusions: CASI is worthwhile and doable, and…. In the long run, we have no doubt that computer assisted interviews, whether
self-administered (CASI) or not (CAPI), will replace the traditional paper and pencil survey as the main method of personal interviews. In Japan and elsewhere, computer technologies are bound to become even more prevalent in the future than they are today. In a few decades, generations who have never used computers in their lives will soon all be replaced by those who have grown up with Windows and Explorer. In this regard, to introduce CASI for the first time to the Japanese survey field was certainly a worthy project.
From an academic viewpoint as well, we believe our CASI survey accomplished a “great leap forward” in advancing the frontier of survey research more generally. As explained in this paper, our CASI survey and parallel PAPI survey, carefully combined, provided rare opportunities to compare the utility and characteristics of the two methods systematically. As these two methods provide different levels of privacy in the survey environment, the comparison was particularly effective in highlighting the voters’ tendencies to respond to human interviewers in the PAPI context with socially-desirable answers.26 Our CASI survey, we believe, also broadened the horizon of experimental research in social science, as it incorporated political economy experiments which, to our knowledge, have never been conducted on a randomly drawn nation-wide sample. We have shown that, by taking advantage of the mobility that notebook computers provide, an experimental research can take place outside of the ordinary laboratory environment, hence enhancing the external validity of the causal test employed therein.
Overall, as the first attempt ever to conduct a computer assisted survey in Japan, we are thus satisfied with our accomplishments. In concluding this paper, however, it is also appropriate to discuss a point of concern, one regarding the utility and perhaps future prospects for CASI generally.
As indicated throughout this paper, we are confident that the respondents, as well as our interviewers, had no trouble operating the computers and understanding our CASI interface program. At the same time, we should strive for even simpler and more user-friendly survey technologies. Much of the problem related to technology-literacy, as we see it, did not arise in the process of interview, but it rather did in the process of getting to the interview. That is, we are concerned that the introduction of CASI might have adversely affected the response rates. The response rate for CASI (40.1%) is considerably lower than that for PAPI (44.5%), and some of this gap must be associated 26 See the APSA paper by Nishizawa and Kuriyama.

28
with the difference in the survey methods themselves.27 This is obviously a bad news for the prospects for any computer assisted survey.
Nevertheless, we remain hopeful because, if the technology-literacy problem was the major source of the lower response rates, this problem is likely to become less consequential, as future generations of respondents are less likely to be intimidated by computers. Particularly noteworthy in this regard is the difference, between our CASI and PAPI survey results, in the distribution of answers to the question regarding usage of the internet. For the pre-election wave of the CASI survey, the percentage of the respondents who said that they had never used the internet was 48.1%, while for PAPI it was 54.0% (see Table 6).
TABLE 6 about here
We take this result pointing to an optimism rather than pessimism. Precisely because
CASI’s turnout rates are lower particularly among those who are less technologically literate as of today, it is possible that further innovations of user-friendly technologies are likely to improve the response rates greatly in the future.
27 Our first letter sent out to the respondents (which indicates they were chosen for the survey) did not mention anything about the usage of computers in survey. It is at the time of the initial contact when the interviewers actually visited the respondents houses that the respondents were told that the interview would take place with the aid of computers and they would have to self-administer the entire interview. At that point, the respondents could decide not to participate in the interview process at all. We did collect, through interviewers” observations, the data for why respondents refused to participate in survey. Obviously, such data can never be complete and thus cannot be wholly reliable. Nevertheless, some exploratory analysis of this data may shed light on why the response rate for CASI was much lower than for PAPI.

29
Table 1: [pre] Q1-2 How often do you read newspapers? Choose one from these choices of answers
Table 2: [pre] Q1-1How often do you watch news on TV? Choose one from these choices of answers CASI PAPI CASI PAPI
CASI(736)/PAPI(817) N % N % N % N %
1. never 2. 1 day a week 3. 2~3days a week 4. 4~5days a week
21
18
53
50
2.9
2.4
7.2
6.8
12
27
52
48
1.5
3.3
6.4
5.9
5. (mostly) everyday 6. *DK 7. *NA
594
0
0
80.7
0.0
0.0
678
0
0
83.0
0.0
0.0
Table 3: [post] Q11-1 The words conservative and progressive are used to express one's political
position. If progressive is "0" and conservative is "10", what number do you think might best indicate
your own position?
CASI PAPI
CASI(780)/PAPI(933) N % N %
0. progressive 1. 2. 3. 4. 5. middle 6. 7. 8. 9.
10. conservative 11. *DK 12. *NA
13
12
25
76
88
363
59
62
46
7
19
8
2
1.7
1.5
3.2
9.7
11.3
46.5
7.6
7.9
5.9
0.9
2.4
1.0
0.3
11
6
27
80
78
473
82
58
50
16
10
40
2
1.2
0.6
2.9
8.6
8.4
50.7
8.8
6.2
5.4
1.7
1.1
4.3
0.2
CASI PAPI CASI PAPI
CASI(736)/PAPI(817) N % N % N % N %
1. never 2. 1 day a week 3. 2~3days a week 4. 4~5days a week
104
41
59
39
14.1
5.6
8.0
5.3
87
44
66
34
10.6
5.4
8.1
4.2
5. (mostly) everyday 6. *DK 7. *NA
491
2
0
66.7
0.3
0.0
583
1
2
71.4
0.1
0.2

30
Table 4: Two Types of Panel-Structured Surveys: Within and Between Comparisons
2nd-wave PAPI 1st-wave PAPI < 2nd-wave CASI <=== Within group Comparison
1st-wave PAPI -- 2nd-wave PAPI 1st-wave CASI -- 2nd-wave CASI <=== Between group Comparison
Table 5 [pre] Q4Which person or which organization do you think acts most effectively to
implement useful policies on your behalf? Choose one from these choices of answers. CASI PAPI
CASI(736)/PAPI(817) N % N %
1. Prime minister 2. Political party you support 3. Representatives in the national Diet from your areas 4. Local politicians from your areas (mayors or members of local assemblies) 5. DK 6. NA
187
197
83
220
39
10
25.4
26.8
11.3
29.9
5.3
1.4
124
193
102
220
121
57
15.2
23.6
12.5
26.9
14.8
7.0
Table 6 [pre] Q 2 How many hours a day on average do you use the Internet with your computers or cellular phones? Choose one from these choices of answers. If you use the
Internet for your work, subtract those hours. CASI PAPI CASI PAPI
CASI(736)/PAPI(817) N % N % N % N %
1. never 2. less than 30 mins 3. less than 1 hour 4. more than 1 hour
354
133
106
142
48.1
18.1
14.4
19.3
441
151
104
119
54.0
18.5
12.7
14.6
5. *DK 6. *NA
0
1
0.0
0.1
1
1
0.1
0.1

31
Appendix I: Original Members of CASI Project
From Waseda University Aiji Tanaka (Principle Investigator), Yukihiko Funaki Mariko Hasegawa (currently at the Graduate University for Advanced Studies) Masaru Kohno Ikuo Kume Koichi Kuriyama Kazumi Shimizu
From Other Universities
Kentaro Fukumoto (Gakushuin University) Yusaku Horiuchi (Australian National University) Kosuke Imai (Princeton University) Ryosuke Imai (Tokyo Metropolitan University) Yoshitaka Nishizawa (Doshisha University) Yutaka Shinada (Kobe University) Kengo Soga (Osaka University; currently at Kobe University) Motoki Watabe (University of Kyoto; currently at Waseda University) Masahiro Yamada (Kwansei Gakuin University)

32
Appendix II: Supplemental Information for WASEDA-CASI2007/PAPI2007 1. Geographical Area: Japan (all 47 prefectures) 2. Population: eligible voters (men and women over 20 years of age) 3. Period: two-wave survey before and after the House of Councilors election in 2007* First Wave: June 16 (Saturday) ― July 11 (Wed), 2007 Second Wave: August 25 (Saturday) ― September 17 (Mon), 2007 * The election was held on July 29 (Sunday); the official campaign period began on
July 12 (Thursday) 4. Sampling Method: stratified two-stage random sampling (see below for details) 5. List used for Sampling:
“voter registration list (Senkyonin Meibo)” supplemented by “residential register(Jumin Kihon Daicho)”
6. Number of Sample Points: CASI: 115 locations PAPI: 115 locations 7. Planned Number of Samples We set 1840 as our targeted number for sample for the first wave for each CASI and PAPI. For the targeted number of sample for the second wave, see the table below.
# of sampled
respondents per location
# of sampling
points
# of planned sample
CASI sample 16 115 1,840 1st Wave
PAPI sample 16 115 1,840
2nd
Wave
CASI respondents from 1st Wave
supplements for 2nd Wave※
-
6
-
115
(736)
690
total 1,426
PAPI respondents from 1st Wave
supplements for 2nd Wave※
-
6
-
115
(817)
690
total 1,507
※ see below

33
8. Total Number of Sample From the population of listed eligible voters, we drew the total of 2990 respondents, that is, 26 for 115 points, for CASI and PAPI respectively. These numbers were calculated as follows. 1) Anticipated Response Rates and Supplements for Sample We set the number of necessary supplements for sample to be 6 according to the following calculation. ① As noted above, we set 1840 as our targeted numbers of sample for the first wave for
each CASI and PAPI. Thus, for each of 115 points, 16 respondents had to be sampled (16 x 115 = 1840).
② We anticipated that the response rate of the first wave would be 44%, thus our respondents expected to be 810 (1840 x .44 = 810). We also anticipated that the response rate of the second wave would be 70%, thus our respondents expected to be 567 (810×.70).
③ We planned that the second wave of survey would be conducted on approximately same number of respondents of the first wave. We therefore needed additional 233 respondents. Based on the same anticipated response rate (44%), we would need 530 supplementary respondents for each CASI and PAPI sample (233/.44).
④ By dividing 530 by 115 points, we obtain the number 5 (4.6=530/115). Just in case the response rates were even lower than our anticipated rates, we added 1, thus finally to obtain 6 as the number for supplements.
2) Sample Substitutes In addition to the above supplementary respondents, we sampled an additional 4 respondents as alternates or substitutes (3 for the first wave and 1 for the second wave). We enforced a strict rule with regard to allowing the original respondents be replaced by these alternates either ① when the former were dead or had moved elsewhere, or ②when they could not have been contacted for reasons beyond our control. (Note: despite the strict rule, some sampling points actually required more than 4 alternates. See below) 3) The Compositions of Samples
No. 1 ~16: original samples for the 1st wave No. 17 ~19: alternates for the 1st wave No. 20 ~25: supplements for the 2nd wave No. 26 : alternate for 2nd wave

34
9. Sampling Procedure
1) Stratifications ① Prefectures are divided into the following 9 blocks.
Blocks Prefectures in the block
1. Hokkaido Hokkaido
2. Tohoku Aomori, Iwate, Miyagi, Akita, Yamagata, Fukushima
3. Kanto Ibaragi, Tochigi, Gunma, Saitama, Chiba, Tokyo, Kanagawa,
Yamanashi, Nagano
4. Hokuriku Niigata, Toyama, Ishikawa, Fukui
5. Tokai Gifu, Shizuoka, Aichi, Mie
6. Kinki Shiga, Kyoto, Osaka, Hyogo, Nara, Wakayama
7. Chugoku Tottori, Shimane, Okayama, Hiroshima, Yamaguchi
8. Shikoku Tokushima, Kagawa, Ehime, Kochi
9. Kyushu Fukuoka, Saga, Nagasaki, Kumamoto, Oita, Miyazaki,
Kagoshima, Okinawa
② In each block, cities and towns/villages are divided into the following 5 categories according to their population size. City population size is based on 2005 census, and the classifications of cities and towns/villages are as of October 1st, 2005. City size categories
1. 18 Metropolitan Cities (Sapporo, Sendai, Saitama, Chiba, Tokyo, Yokohama, Kawasaki, Niigata, Shizuoka, Hamamatsu, Nagoya, Kyoto, Osaka, Sakai, Kobe, Hiroshima, Kitakyushu and Fukuoka)
2. Cities with 150,000 people or more 3. Cities with 50,000 people or more 4. Other cities 5. Towns and Villages ③ Based on these two criteria, cities and towns/villages are divided into 43 strata (9 x 5 - 2, note: Hokkaido block does not have Cities with 50,000 people or more and Shikoku block does not have metropolitan cities). Then the sampling points are allocated into these 43 strata in proportion to the 2005 census population estimates, so that the total number of sampling points be equal to 115.

35
Table: Number of Sampling Points in each Strata
18 Metro Cities Cities Other Towns& Total
Cities >= 150th >= 50th Cities Villages
Hokkaido 2 1 1 0 1 5
Tohoku 1 3 2 1 2 9
Kanto 14 13 8 1 4 40
Hokuriku 1 1 1 1 1 5
Tokai 3 3 4 1 2 15
Kinki 6 6 4 1 2 19
Chugoku 1 3 1 1 1 7
Shikoku 0 1 1 1 1 4
Kyushu 2 3 3 2 3 13
Total 30 34 25 9 17 115
2) Sampling ① Census tracts (2005 Census) are used as the primary sampling unit. Secondary sampling units (individual respondents) ② In a stratum with more than 2 primary sampling points, the census tracts are chosen by the systematic sampling. The sampling interval is determined by the following formula: sampling interval = (total population in stratum) / (total N of sampling points in stratum) ③ The order of city/district/town/village is based on the 1995 Census City/District/Town/Village Code. ④ As the secondary sampling units, 26 individual respondents are chosen in each designated primary sampling unit by the systematic sampling, with an interval of 21 voters, based on the voter registration list (Senkyonin Meibo) (in some cases based on the residential register, Jyumin Kihon Daicho).

36
10. Response Rates
planned size of
sample
shortage of
alternates
actual size of
samplerespondents response rates
non-
respondents
!"#$% $ !"#&' (&' $%)!* !"!%%
!"#$% + !"#&# #!( $$),* !"%+!
&"'#% ' &"'($ !",,& $+)&* +"!+!
-./01 !"$+' !' !"$!% (#% ,,)&* '&%
!2/34056
7628.9:69/2(&' % (&' ,!' (%)!* ++%
2;8816<69/23=.7
+9:34056'>% !' '($ +'$ &>)+* $!%
-./01 !",%( > !"$># >&& '+)&* ,',
!2/34056
7628.9:69/2#!( % #!( '!> (,)#* !>#
2;8816<69/23=.7
+9:34056'>% > '#! &!$ $')!* &'(
-./01 +">&& +, +">%# !"(!& ,#)>* !"!>,
!2/34056
7628.9:69/2!",,& % !",,& !"!&, (&)!* $!#
2;8816<69/23=.7
+9:34056!"&#% +, !"&,, ,(# $+)(* (((
?
@
A
B
C
@
C
B
-
.
/
0
1
+9:
4056
!2/
4056
?@AB
C@CB
-./01
11. Survey Company:
Nippon Research Center, Ltd. 2-7-1 Nihonbashi-Honcho, Chuo-ku, Tokyo, 103-0023 Japan.

37
Appendix III (1) : Matrix Questioning Interface

38
Appendix III (2): Dynamic Matrix Questioning Interface

39
Appendix III (3): Interface for Multiple Answer Question

1
APPENDIX VI List of Randomized Questions (Pre-election)
[PRE]Q5 Please express your feeling (likeness/dislikeness) in terms of temperature. If you think of 100 degrees as
the warmest feeling toward a party, 0 degree as the coldest feeling and 50 degrees as neither of the two, what degree(s)
do you think captures your feeling for these parties? Please give answers to each party separately.
CASI(736)/PAPI(817) (a)LDP (b)DPJ (c)CGP (d)JCP (e)SDP
temperature CASI 43.9 43.6 31.6 27.7 31.5
(average) PAPI 42.2 40.4 30.8 26.9 27.8
【DK: 777, NA 888】
[PRE]Q9 Putting elections aside for a moment, what party do you normally support? Choose one from these choices
of answers. CASI PAPI CASI PAPI CASI(736)
/PAPI(817) N % N % N % N %
1. LDP 2. DPJ 3. CGP 4. JCP 5. SDP 6. other party
263
167
36
22
23
7
35.7
22.7
4.9
3.0
3.1
1.0
287
145
42
33
15
7
35.1
17.7
5.1
4.0
1.8
0.9
7. don’t support any party
8. *DK 9. *NA
213
3
2
28.9
0.4
0.3
276
8
4
33.8
1.0
0.5
→SQ3
[PRE] Q9-SQ3 (For those who answered 7 in Q9) Even though you do not support a political party, is there one
party that you usually like? If there is, please so indicate by choosing one from these choices of answers. CASI PAPI CASI PAPI CASI(213)
/PAPI(276) N % N % N % N %
1. LDP 2. DPJ 3. CGP 4. JCP 5. SDP
20
33
6
8
5
9.4
15.5
2.8
3.8
2.3
38
27
4
7
2
13.8
9.8
1.4
2.5
0.7
6. other party 7. don’t like any
party 8. *DK 9. *NA
4
135
2
0
1.9
63.4
0.9
0.0
2
163
25
8
0.7
59.1
9.1
2.9
!"#$%&
'()$%&
**$%&
+,#-.
**/'&
'()/'&
!"#/'&
0 12 32225 75

2
[PRE]Q10 By the way, are there any parties that you would never want to support? If there are, which parties are
they? Please name as many parties as you feel so. (M.A.) CASI PAPI CASI PAPI CASI(736)
/PAPI(817) N % N % N % N %
1. LDP 2. DPJ 3. CGP 4. JCP 5. SDP
103
46
183
263
98
14.0
6.3
24.9
35.7
13.3
71
29
165
253
93
8.7
3.5
20.2
31.0
11.4
6. other party 7. none 8. *DK 9. *NA
49
279
3
2
6.7
37.9
0.4
0.3
25
344
17
7
3.1
42.1
2.1
0.9
[PRE]Q14 On July 22, there will be an election for the House of Councilors. For candidate of which party do you
think you will vote in the prefectural district contest? Choose one from the choices of answers. CASI PAPI CASI PAPI CASI(736)
/PAPI(817) N % N % N % N %
1. LDP 2. DPJ 3. CGP 4. JCP 5. SDP
270
235
44
25
26
36.7
31.9
6.0
3.4
3.5
260
185
44
28
18
31.8
22.6
5.4
3.4
2.2
6. other party 7. *undecided 8. *DK 9. *NA
80
35
14
7
10.9
4.8
1.9
1.0
31
195
37
19
3.8
23.9
4.5
2.3
[PRE]Q15 What about in the national “proportional representation” contest? For which party or candidate of
which party do you think you will vote? Choose one from the choices of answers. CASI PAPI CASI PAPI CASI(736)
/PAPI(817) N % N % N % N %
1. LDP 2. DPJ 3. CGP 4. JCP 5. SDP
248
217
66
32
33
33.7
29.5
9.0
4.3
4.5
232
175
56
35
27
28.4
21.4
6.9
4.3
3.3
6. other party 7. *undecided 8. *DK 9. *NA
84
30
19
7
11.4
4.1
2.6
1.0
40
192
42
18
4.9
23.5
5.1
2.2

3
[PRE]Q27-SQ9 Which party do you think is appropriate for a partner of coalitiongovernment with the LDP? Please specify all that correspond.
CASI PAPI CASI PAPI CASI(281)
/PAPI(338) N % N % N % N %
1. DPJ 2. CGP 3. SDP 4. JCP
134
147
40
18
47.7
52.3
14.2
6.4
121
167
34
10
35.8
49.4
10.1
3.0
5. other party 6. *DK 7. *NA
59
4
2
21.0
1.4
0.7
23
40
8
6.8
11.8
2.4
[PRE]Q27SQ10 Which party do you think is appropriate for a partner of coalitiongovernment with the DPJ? Please specify all that correspond.
CASI PAPI CASI PAPI CASI(172)
/PAPI(142) N % N % N % N %
1. LDP 2. CGP 3. SDP 4. JCP
37
26
114
22
21.5
15.1
66.3
12.8
26
12
62
16
18.3
8.5
43.7
11.3
5. other party 6. *DK 7. *NA
52
3
1
30.2
1.7
0.6
30
21
5
21.1
14.8
3.5

4
[PRE]Q29-1 We now ask about policies implemented by government in the following 11 categories. How much are you interested in each of these? Please choose one from these choices of answers.
(※CASI 5,6 =-8) 1 2 3 4 5 6 (-8)
interested
somewhat
interested
not so
interested
not
interested *DK *NA
CASI(736)/PAPI(817) N % N % N % N % N % N %
CASI 307 41.7 236 32.1 137 18.6 53 7.2 - - 3 0.4 a) defense/
foreign policy →
PAPI 307 37.6 284 34.8 144 17.6 64 7.8 17 2.1 1 0.1
CASI 399 54.2 229 31.1 77 10.5 27 3.7 - - 4 0.5 b) safety/
public order →
PAPI 396 48.5 276 33.8 92 11.3 38 4.7 14 1.7 1 0.1
CASI 384 52.2 247 33.6 78 10.6 25 3.4 - - 2 0.3 c) economy →
PAPI 413 50.6 264 32.3 97 11.9 30 3.7 12 1.5 1 0.1
CASI 483 65.6 196 26.6 41 5.6 13. 1.8 - - 3 0.4 d) welfare →
PAPI 526 64.4 206 25.2 57 7.0 23 2.8 4 0.5 1 0.1
CASI 445 60.5 224 30.4 43 5.8 20 2.7 - - 4 0.5 e) environment →
PAPI 439 53.7 277 33.9 76 9.3 18 2.2 5 0.6 2 0.2
CASI 429 58.3 215 29.2 70 9.5 20 2.7 - - 2 0.3 f) education →
PAPI 464 56.8 221 27.1 80 9.8 45 5.5 5 0.6 2 0.2
CASI 242 32.9 295 40.1 146 19.8 49 6.7 - - 4 0.5 g)women’s
status/
advancement
in society
→ PAPI 234 28.6 329 40.3 198 24.2 41 5.0 12 1.5 3 0.4
CASI 310 42.1 285 38.7 107 14.5 32 4.3 - - 2 0.3 h) autonomy
of local gov’t →
PAPI 292 35.7 298 36.5 175 21.4 32 3.9 18 2.2 2 0.2
CASI 296 40.2 247 33.6 143 19.4 46 6.3 - - 4 0.5 i) revision of
constitution →
PAPI 282 34.5 282 34.5 153 18.7 72 8.8 25 3.1 3 0.4
CASI 430 58.4 156 21.2 94 12.8 52 7.1 - - 4 0.5 j) reform of
bureacrats’
“amakudari”
→ PAPI 435 53.2 192 23.5 111 13.6 61 7.5 16 2.0 2 0.2
CASI 563 76.5 134 18.2 25 3.4 13 1.8 - - 1 0.1 k) pension
problem →
PAPI 657 80.4 115 14.1 26 3.2 12 1.5 4 0.5 3 0.4

5
[PRE]Q29-2 We asked about your interst before, but let us now ask how important do you think each of these polices is. Choose one from these choices of answers.
(※CASI 5,6 =-8) 1 2 3 4 5 6 (-8)
important
somwhat
important
not so
important
not
important *DK *NA
CASI(736)/PAPI(817) N % N % N % N % N % N %
CASI 360 48.9 252 34.2 91 12.4 23 3.1 - - 10 1.4 a) defense/
foreign policy →
PAPI 429 52.5 262 32.1 69 8.4 31 3.8 23 2.8 3 0.4
CASI 437 59.4 218 29.6 58 7.9 14 1.9 - - 9 1.2 b) safety/
public order →
PAPI 463 56.7 269 32.9 42 5.1 21 2.6 19 2.3 3 0.4
CASI 438 59.5 235 31.9 42 5.7 13 1.8 - - 8 1.1 c) economy →
PAPI 506 61.9 241 29.5 40 4.9 11 1.3 16 2.0 3 0.4
CASI 524 71.2 174 23.6 21 2.9 13 1.8 - - 4 0.5 d) welfare →
PAPI 549 67.2 217 26.6 30 3.7 9 1.1 9 1.1 3 0.4
CASI 500 67.9 184 25.0 33 4.5 12 1.6 - - 7 1.0 e) environment →
PAPI 504 61.7 244 29.9 41 5.0 11 1.3 14 1.7 3 0.4
CASI 483 65.6 191 26.0 42 5.7 14 1.9 - - 6 0.8 f) education →
PAPI 500 61.2 222 27.2 58 7.1 21 2.6 13 1.6 3 0.4
CASI 228 31.0 318 43.2 145 19.7 36 4.9 - - 9 1.2 g)women’s status/
advancement in
society
→ PAPI 238 29.1 355 43.5 175 21.4 27 3.3 19 2.3 3 0.4
CASI 328 44.6 304 41.3 80 10.9 15 2.0 - - 9 1.2 h) autonomy
of local gov’t →
PAPI 355 43.5 300 36.7 113 13.8 22 2.7 24 2.9 3 0.4
CASI 300 40.8 251 34.1 138 18.8 29 3.9 - - 18 2.4 i) revision of
constitution →
PAPI 336 41.1 274 33.5 117 14.3 48 5.9 39 4.8 3 0.4
CASI 408 55.4 182 24.7 97 13.2 35 4.8 - - 14 1.9 j) reform of
bureacrats’
“amakudari”
→
PAPI 445 54.5 204 25.0 94 11.5 47 5.8 24 2.9 3 0.4
CASI 587 79.8 115 15.6 20 2.7 10 1.4 - - 4 0.5 k) pension
problem →
PAPI 681 83.4 103 12.6 18 2.2 5 0.6 7 0.9 3 0.4

6
[PRE]Q29-3 Do you think, then, that the government has done a good job in each of these polices is. Choose one from these choices of answers. ・
(※CASI 5,6 =-8) 1 2 3 4 5 6 (-8)
has done
well
has done
pretty well
has not
done very
well
has not
done well
at all
*DK *NA
CASI(736)/PAPI(817) N % N % N % N % N % N %
CASI 51 6.9 272 37.0 301 40.9 87 11.8 - - 25 3.4 a) defense/
foreign policy →
PAPI 57 7.0 317 38.8 304 37.2 68 8.3 69 8.4 2 0.2
CASI 54 7.3 264 35.9 318 43.2 83 11.3 - - 17 2.3 b) safety/
public order →
PAPI 55 6.7 333 40.8 299 36.6 69 8.4 59 7.2 2 0.2
CASI 40 5.4 263 35.7 336 45.7 82 11.1 - - 15 2.0 c) economy →
PAPI 45 5.5 291 35.6 343 42.0 82 10.0 54 6.6 2 0.2
CASI 57 7.7 233 31.7 314 42.7 119 16.2 - - 13 1.8 d) welfare →
PAPI 46 5.6 244 29.9 364 44.6 129 15.8 32 3.9 2 0.2
CASI 65 8.8 302 41.0 278 37.8 78 10.6 - - 13 1.8 e) environment →
PAPI 46 5.6 300 36.7 352 43.1 76 9.3 41 5.0 2 0.2
CASI 51 6.9 239 32.5 331 45.0 99 13.5 - - 16 2.2 f) education →
PAPI 43 5.3 242 29.6 371 45.4 110 13.5 48 5.9 3 0.4
CASI 50 6.8 318 43.2 288 39.1 60 8.2 - - 20 2.7 g)women’s status/
advancement in
society
→ PAPI 42 5.1 273 33.4 352 43.1 86 10.5 61 7.5 3 0.4
CASI 45 6.5 275 37.4 326 44.3 73 9.9 - - 14 1.9 h) autonomy
of local gov’t →
PAPI 37 4.5 252 30.8 384 47.0 77 9.4 62 7.6 5 0.6
CASI 47 6.4 223 30.3 328 44.6 104 14.1 - - 34 4.6 i) revision of
constitution →
PAPI 52 6.4 234 28.6 340 41.6 104 12.7 82 10.0 5 0.6
CASI 332 4.3 83 11.3 286 38.9 315 42.8 - - 20 2.7 j) reform of
bureacrats’
“amakudari”
→
PAPI 32 3.9 110 13.5 254 31.1 359 43.9 59 7.2 3 0.4
CASI 46 6.3 116 15.8 238 32.3 327 44.4 - - 9 1.2 k) pension
problem →
PAPI 47 5.8 138 16.9 227 27.8 378 46.3 25 3.1 2 0.2

7
[PRE]Q33 What do you think about each of the opinions listed here about people, election and politics. Please answer by
choosing one. (※CASI 6,7 =-8) 1 2 3 4 5 6 7(-8)
agree somewhat agree in between somewhat
disagree disagree *DK *NA
CASI(736)/PAPI(817) N % N % N % N % N % N % N %
CASI 77 10.5 74 10.1 117 15.9 102 13.9 358 48.6 - - 8 1.1 a) it is no use going to vote, when a party or a candidate you support for has no chance to win an election
→
PAPI 91 11.1 93 11.4 123 15.1 117 14.3 376 46.0 15 1.8 2 0.2
CASI 45 6.1 79 10.7 109 14.8 80 10.9 419 56.9 - - 4 0.5 b) because many people vote in elections, it does not matter if I myself would vote or not
→ PAPI 51 6.2 60 7.3 72 8.8 92 11.3 533 65.2 7 0.9 2 0.2
CASI 553 75.1 106 14.4 42 5.7 7 1.0 25 3.4 - - 3 0.4 c) it is a duty as an eligible voter to vote →
PAPI 633 77.5 104 12.7 37 4.5 12 1.5 22 2.7 7 0.9 2 0.2
CASI 261 35.5 184 25.0 135 18.3 75 10.2 76 10.3 - - 5 0.7 e) I have no power over what the government does
→ PAPI 281 34.4 174 21.3 141 17.3 83 10.2 121 14.8 13 1.6 4 0.5
CASI 221 30.0 228 31.0 142 19.3 72 9.8 70 9.5 - - 3 0.4 f) there are some occasions where things like politics and government are too complex for me to understand what they are all about
→
PAPI 290 35.5 227 27.8 140 17.1 86 10.5 63 7.7 9 1.1 2 0.2
CASI 105 14.3 149 20.2 242 32.9 100 13.6 131 17.8 - - 9 1.2
カ ) When a bill that is potentially very harmful to you is introduced to the Parliament, you can stop the bill through various campaigns against it, without just being passively letting the Parliament decide it for you
→
PAPI 86 10.5 137 16.8 236 28.9 128 15.7 201 24.6 25 3.1 4 0.5
[PRE]Q40 Adding all your incomes, how much was your last year's (2006 Jan.-Dec.) household income? Please answer including bonuses and taxes. CASI PAPI CASI PAPI
CASI(736)/PAPI(817) N % N % N % N %
1. less than 2 million 2. 2~4 million 3. 4~6 million 4. 6~8 million 5. 8~10 million
86
173
139
94
80
11.7
23.5
18.9
12.8
10.9
87
162
131
104
57
10.6
19.8
16.0
12.7
7.0
6. 10~12 million 7. 12~14 million 8. more than 14 million 9. *DK
10. *NA
47
18
23
49
27
6.4
2.4
3.1
6.7
3.7
34
19
26
119
78
4.2
2.3
3.2
14.6
9.5

8
APPENDIX VI (Continued) List of Questions Which Were Randomized (Post-election)
[POST]Q3SQ7 [For those who answered in the previous questions that they voted either for a party or for a candidate from a party
in the proportional representation election] Which party or candidate of which party did you vote for? Choose one from these choices of
answers. CASI PAPI CASI PAPI
CASI(642)/PAPI(749) N % N % N % N %
1. SDP 2. CGP 3. JCP 4. LDP 5. DPJ 6. other party
35
56
34
182
264
32
5.7
9.1
5.5
29.6
42.9
5.2
39
64
44
215
303
28
5.2
8.5
5.9
28.7
40.5
3.7
7. *spoiled ballot in PR 8. *don’t want to say 9. *don’t remember
10. *DK 11. *NA
1
9
1
1
0
0.2
1.5
0.2
0.2
0.0
1
41
9
1
33
0.1
5.5
1.2
0.5
0.5
[POST]Q4SQ1 [For those who answered in the previous question that they received phone calls or direct mails requesting for vote
during the campaign] For which party or candidate of which party were you requested you to vote for them? Please specify all that
correspond (M.A.).
CASI PAPI CASI PAPI
CASI(307)/PAPI(353) N % N % N % N %
1. LDP 2. DPJ 3. CGP 4. JCP 5. SDP
118
78
160
29
11
38.4
25.4
52.1
9.4
3.6
128
83
184
36
20
36.3
23.5
52.1
10.2
5.7
6. other party 7. *don’t want to say 8. *don’t remember 9. *DK
10. *NA
18
3
1
5
3
5.9
1.0
0.3
1.6
1.0
10
9
5
1
0
2.8
2.5
1.4
0.3
0.0

9
[POST]Q5 How much does each of the statements listed here apply to you for the House of Councilors election this time?
Please answer by choosing one.
1 2 3 4 5 6 (-8)
applies Applies somewhat
does not apply so
well
does not apply at
all
*do not
remember
/DK *NA
(※CASI 5,6 =-8) CASI(780)/PAPI(933) N % N % N % N % N % N %
CASI 155 19.9 256 32.8 234 30.0 128 16.4 - - 7 0.9 (a) I thought my own vote would change the way of politics in Japan
→ PAPI 166 17.8 315 33.8 252 27.0 182 19.5 17 1.8 1 0.1
CASI 155 19.9 249 31.9 213 27.3 156 20.0 - - 7 0.9 (b) I though my own vote would change the result of election
→ PAPI 162 17.4 299 32.0 259 27.8 193 20.7 19 2.0 1 0.1
CASI 223 28.6 308 39.5 164 21.0 74 9.5 - - 11 1.4 (c) This was an election whose result would determine the future of Japan
→ PAPI 273 29.3 322 34.5 202 21.7 102 10.9 32 3.4 2 0.2
CASI 151 19.4 228 29.2 251 32.2 144 18.5 - - 6 0.8 (d) This was an election whose result would determine my own well-being and daily life
→
PAPI 119 12.8 263 28.2 297 31.8 220 23.6 33 3.5 1 0.1
CASI 191 24.5 248 31.8 174 22.3 161 20.6 - - 6 0.8 (e) It appeared that the party which I had intended to vote for was going to do well in the election
→
PAPI 228 24.4 213 22.8 221 23.7 229 24.5 39 4.2 3 0.3
CASI 241 30.9 267 34.2 188 24.1 74 9.5 - - 10 1.3 (f) The difference between parties’ positions was clear
→ PAPI 328 35.2 300 32.2 178 19.1 68 7.3 57 6.1 2 0.2
CASI 154 19.7 274 35.1 193 24.7 151 19.4 - - 8 1.0 (g) It was clear prior to the election day which candidate was likely to win
→
PAPI 186 19.9 254 27.2 221 23.7 193 20.7 77 8.3 2 0.2
CASI 168 21.5 93 11.9 110 14.1 400 51.3 - - 9 1.2 (h) There was an important personal matter to take care of on the election day
→ PAPI 194 20.8 74 7.9 99 10.6 557 59.7 8 0.9 1 0.1
CASI 57 7.3 92 11.8 149 19.1 475 60.9 - - 7 0.9 (i)It occurred to me that going to the poll station was going to be time-costly and cumbersome
→
PAPI 40 4.3 67 7.2 113 12.1 701 75.1 10 1.1 2 0.2

10
[POST]Q8-1 We now ask about policies implemented by government in the following 11 categories. How much are
you interested in each of these? Please choose one from these choices of answers. (※CASI 5,6 =-8) 1 2 3 4 5 6(-8)
interested
somewhat
interested
not so
interested
not
interested *DK *NA
CASI(780)/PAPI(933) N % N % N % N % N % N %
CASI 358 45.9 237 30.4 147 18.8 35 4.5 - - 3 0.4 a) defense/
foreign policy →
PAPI 321 34.4 367 39.3 175 18.8 59 6.3 11 1.2 0 0.0
CASI 418 53.6 248 31.8 85 10.9 23 2.9 - - 6 0.8 b) safety/
public order →
PAPI 400 42.9 345 37.0 142 15.2 37 4.0 9 1.0 0 0.0
CASI 410 52.6 270 34.6 76 9.7 20 2.6 - - 4 0.5 c) economy →
PAPI 476 51.0 314 33.7 109 11.7 27 2.9 7 0.8 0 0.0
CASI 489 62.7 206 26.4 65 8.3 16 2.1 - - 4 0.5 d) welfare →
PAPI 576 61.7 264 28.3 76 8.1 14 1.5 3 0.3 0 0.0
CASI 401 51.4 264 33.8 87 11.2 22 2.8 - - 6 0.8 e) environment →
PAPI 490 52.5 317 34.0 92 9.9 30 3.2 4 0.4 0 0.0
CASI 421 54.0 253 32.4 77 9.9 26 3.3 - - 3 0.4 f) education →
PAPI 505 54.1 264 28.3 122 13.1 37 4.0 5 0.5 0 0.0
CASI 227 29.1 325 41.7 173 22.2 51 6.5 - - 4 0.5 g)women’s status/
advancement in
society
→
PAPI 234 25.1 387 41.5 249 26.7 53 5.7 10 1.1 0 0.0
CASI 332 42.6 314 40.3 104 13.3 26 3.3 - - 4 0.5 h) autonomy
of local gov’t →
PAPI 340 36.4 356 38.2 180 19.3 48 5.1 9 1.0 0 0.0
CASI 368 47.2 231 29.6 126 16.2 50 6.4 - - 5 0.6 i) revision of
constitution →
PAPI 299 32.0 299 32.0 235 25.2 73 7.8 27 2.9 0 0.0
CASI 465 59.6 196 25.1 80 10.3 37 4.7 - - 2 0.3 j) reform of
bureacrats’
“amakudari”
→
PAPI 491 52.6 233 25.0 145 15.5 57 6.1 7 0.8 0 0.0
CASI 477 61.2 207 26.5 72 9.2 20 2.6 - - 4 0.5 k) pension
problem →
PAPI 700 75.0 177 19.0 40 4.3 14 1.5 2 0.2 0 0.0

11
[POST]Q8-2 We asked about your interst before, but let us now ask how important do you think each of these
polices is. Choose one from these choices of answers.
(※CASI 5,6 =-8) 1 2 3 4 5 6 (-8)
important
somwhat
important
not so
important
not
important *DK *NA
CASI(780)/PAPI(933) N % N % N % N % N % N %
CASI 383 49.1 262 33.6 101 12.9 26 3.3 - - 8 1.0 a) defense/
foreign policy →
PAPI 489 52.4 323 34.6 84 9.0 20 2.1 16 1.7 1 0.1
CASI 467 59.9 248 31.8 51 6.5 9 1.2 - - 5 0.6 b) safety/
public order →
PAPI 520 55.7 321 34.4 65 7.0 13 1.4 14 1.5 0 0.0
CASI 477 61.2 239 30.6 52 6.7 8 1.0 - - 4 0.5 c) economy →
PAPI 582 62.4 285 30.5 50 5.4 6 0.6 10 1.1 0 0.0
CASI 527 67.6 201 25.8 36 4.6 10 1.3 - - 6 0.8 d) welfare →
PAPI 645 69.1 227 24.3 47 5.0 9 1.0 5 0.5 0 0.0
CASI 446 57.2 251 32.2 67 8.6 9 1.2 - - 7 0.9 e) environment →
PAPI 574 61.5 285 30.5 57 6.1 10 1.1 7 0.8 0 0.0
CASI 487 62.4 235 30.1 40 5.1 13 1.7 - - 5 0.6 f) education →
PAPI 571 61.2 268 28.7 69 7.4 16 1.7 9 1.0 0 0.0
CASI 231 29.6 336 43.1 171 21.9 36 4.6 - - 6 0.8 g)women’s status/
advancement in
society
→
PAPI 271 29.0 411 44.1 196 21.0 39 4.2 16 1.7 0 0.0
CASI 369 47.3 315 40.4 75 9.6 16 2.1 - - 5 0.6 h) autonomy
of local gov’t →
PAPI 423 45.3 353 37.8 118 12.6 23 2.5 16 1.7 0 0.0
CASI 413 52.9 222 28.5 109 14.0 30 3.8 - - 6 0.8 i) revision of
constitution →
PAPI 355 38.0 312 33.4 176 18.9 55 5.9 35 3.8 0 0.0
CASI 448 57.4 199 25.5 98 12.6 28 3.6 - - 7 0.9 j) reform of
bureacrats’
“amakudari”
→
PAPI 479 51.3 269 28.8 124 13.3 42 4.5 17 1.8 2 0.2
CASI 537 68.8 179 22.9 43 5.5 15 1.9 - - 6 0.8 k) pension
problem →
PAPI 749 80.3 144 15.4 22 2.4 12 1.3 6 0.6 0 0.0

12
[POST]Q9 Considering the present situation in general in Japan, do you think that the present cabinet has done a good job?
Choose one from the list. 総数 CASI PAPI CASI PAPI
CASI(780)/PAPI(933) N % N % N % N %
1. has done well 2. has done pretty well 3. has not done very well
48
216
368
6.2
27.7
47.2
52
313
401
5.6
33.5
43.0
4. has not done well at all 5. *DK 6. *NA
133
14
1
17.1
1.8
0.1
130
35
2
13.9
3.8
0.2
[POST]Q10 How do you feel about the following three statements of opinions about politics. Do you agree or disagree? Please
answer by choosing one.
1 2 3 4 5 6 (-8)
agree somewhat agree
somewhat disagree disagree *DK *NA
(※CASI 5,6 =-8) CASI(780)/PAPI(933)
N % N % N % N % N % N %
CASI 193 24.7 392 50.3 150 19.2 29 3.7 - - 16 2.1 (a) Peoples’ views are reflected in politics because of political parties
→ PAPI 248 26.6 444 47.6 156 16.7 31 3.3 54 5.8 0 0.0
CASI 381 48.8 329 42.2 44 5.6 17 2.2 - - 9 1.2 (b) Peoples’ views are reflected in politics because of elections
→ PAPI 469 50.3 361 38.7 69 7.4 11 1.2 23 2.5 0 0.0
CASI 231 29.6 380 48.7 129 16.5 28 3.6 - - 12 1.5 (c) Peoples’ views are reflected in politics because of parliament
→ PAPI 272 29.2 406 43.5 174 18.6 28 3.0 52 5.6 1 0.1

13
[POST]Q12 Generally speaking, how much do you trust the organizations and groups listed here? For each organization (a)
through (g), please answer by choosing one of the numbers on the scale with 10 as the maximum point.
0 1 2 3 4 5 6 7 8 9 10 11 12(-8)
(※CASI 12=-8) CASI(780) /PAPI(933)
do not trust
in between
trust
*DK
*NA
N 22 26 49 89 84 274 65 74 59 12 20 - 6 CASI
% 2.8 3.3 6.3 11.4 10.8 35.1 8.3 9.5 7.6 1.5 2.6 - 0.8
N 22 16 49 94 65 322 78 110 107 31 33 6 0
(a) mass media (TV broad- casting, news papers)
→
PAPI % 2.4 1.7 5.3 10.1 7.0 34.5 8.4 11.8 11.5 3.3 3.5 0.6 0.0
N 28 42 54 101 86 320 42 36 35 8 10 - 18 CASI
% 3.6 5.4 6.9 12.9 11.0 41.0 5.4 4.6 4.5 1.0 1.3 - 2.3
N 24 12 50 114 88 357 65 80 48 12 9 73 1
(b)economic organizations (unions, big business)
→
PAPI % 2.6 1.3 5.4 12.2 9.4 38.3 7.0 8.6 5.1 1.3 1.0 7.8 0.1
N 15 23 37 71 60 227 76 106 94 27 40 - 4 CASI
% 1.9 2.9 4.7 9.1 7.7 29.1 9.7 13.6 12.1 3.5 5.1 - 0.5
N 11 10 28 70 64 318 82 129 121 43 49 8 0
(c) public organizations (police, hospitals, schools) →
PAPI % 1.2 1.1 3.0 7.5 6.9 34.1 8.8 13.8 13.0 4.6 5.3 0.9 0.0
N 10 32 19 62 42 263 61 85 104 42 46 - 14 CASI
% 1.3 4.1 2.4 7.9 5.4 33.7 7.8 10.9 13.3 5.4 5.9 - 1.8
N 9 9 22 44 26 242 77 131 177 67 71 57 1
(d) judicial institutions (courts) →
PAPI % 1.0 1.0 2.4 4.7 2.8 25.9 8.3 14.0 19.0 7.2 7.6 6.1 0.1
N 23 35 42 107 86 289 63 52 37 14 18 - 14 CASI
% 2.9 4.5 5.4 13.7 11.0 37.1 8.1 6.7 4.7 1.8 2.3 - 1.8
N 12 11 31 114 85 336 70 108 98 21 23 24 0
(e) political institutions (elections, political parties, parliament)
→
PAPI % 1.3 1.2 3.3 12.2 9.1 36.0 7.5 11.6 10.5 2.3 2.5 2.6 0.0
N 30 42 61 93 85 295 52 55 33 10 10 - 14 CASI
% 3.8 5.4 7.8 11.9 10.9 37.8 6.7 7.1 4.2 1.3 1.3 - 1.8
N 26 19 54 123 83 314 69 86 75 17 16 51 0
(f) national government/ administration (bureaucracies)
→
PAPI % 2.8 2.0 5.8 13.2 8.9 33.7 7.4 9.2 8.0 1.8 1.7 5.5 0.0
N 17 22 24 63 70 282 68 77 79 30 42 - 6 CASI
% 2.2 2.8 3.1 8.1 9.0 36.2 8.7 9.9 10.1 3.8 5.4 - 0.8
N 10 9 22 56 73 330 83 126 134 32 50 7 1
(g)local governments/ administrations
→
PAPI % 1.1 1.0 2.4 6.0 7.8 35.4 8.9 13.5 14.4 3.4 5.4 0.8 0.1

14
[POST]Q13 What do you think about the opinions listed here? For each of the opinions (a) through (f), please answer by
choosing one. (※CASI 4,5=-8) 1 2 3 4 5 6 (-8)
agree somewhat agree
somwhat disagree disagree *DK *NA
CASI(780)/PAPI(933) N % N % N % N % N % N %
CASI 49 6.3 366 46.9 286 36.7 74 9.5 - - 5 0.6 (a) Most people are trustworthy
→ PAPI 73 7.8 490 52.5 288 30.9 74 7.9 8 0.9 0 0.0
CASI 179 22.9 451 57.8 122 15.6 22 2.8 - - 6 0.8 (b) Most people would trust a person who trusts him/her
→ PAPI 189 20.3 497 53.3 191 20.5 44 4.7 12 1.3 0 0.0
CASI 149 19.1 384 49.2 218 27.9 23 2.9 - - 6 0.8 (d) We can never be too careful when dealing with other people
→ PAPI 231 24.8 417 44.7 233 25.0 39 4.2 12 1.3 1 0.1
CASI 236 30.3 367 47.1 153 19.6 18 2.3 - - 6 0.8 (f) In this society, you will be taken advantage of unless you are careful
→ PAPI 267 28.6 410 43.9 213 22.8 35 3.8 7 0.8 1 0.1
CASI 222 28.5 393 50.4 138 17.7 24 3.1 - - 3 0.4 (h) In this world, you will always be rewarded if you are kind to others
→ PAPI 251 26.9 422 45.2 203 21.8 48 5.1 8 0.9 1 0.1
CASI 145 18.6 400 51.3 204 26.2 25 3.2 - - 6 0.8 (j) Most people will reciprocate if you are kind to them
→
PAPI 167 17.9 443 47.5 257 27.5 56 6.0 10 1.1 0 0.0

15
[POST-SPLIT SAMPLE A]Q14 Which goal do you think is important for Japan to aim for the next ten years? For each of
Group 1 through Group 3, please choose two most important items.
[Group 1] First, among these items, which item is the most important? Which item is the second most important?
Most important
↓ Second most important
↓ CASI PAPI CASI PAPI
CASI(376)/PAPI(472) N % N % N % N %
1. Maintain a high rate of economic growth 96 25.5 214 45.3 107 28.5 105 22.2
2. Make sure that this country has strong defense forces
20 5.3 26 5.5 19 5.1 58 12.3
3. See that the people have more say in how things get decided at work and in their communities
142 37.8 154 32.6 120 31.9 129 27.3
4. Try to make our cities and countryside more beautiful
110 29.3 62 13.1 116 30.9 158 33.5
5. *Do not understand these items 2 0.5 1 0.2 3 0.8 0 0.0
6. *DK 6 1.6 13 2.8 10 2.7 15 3.2
7. *NA 0 0.0 2 0.4 1 0.3 7 1.5
[Group 2] Next, among these items, which item is the most important? Which item is the second most important?
Most important ↓
Second most important ↓
CASI PAPI CASI PAPI CASI(376)/PAPI(472) N % N % N % N %
1. Maintain order in the nation 98 26.1 140 29.7 122 32.4 129 27.3
2. Give the people more say in important government decisions
132 35.1 136 28.8 120 31.9 131 27.8
3. Keep prices stable 119 31.6 163 34.5 88 23.4 132 28.0
4. Protect freedom of speech 21 5.6 19 4.0 36 9.6 60 12.7
5. *Do not understand these items 2 0.5 1 0.2 2 0.5 2 0.4
6. *DK 3 0.8 10 2.1 7 1.9 9 1.9
7. *NA 1 0.3 3 0.6 1 0.3 9 1.9
[Group 3] Among these items, which item is, then, the most important? Which item is the second most important?
Most important ↓
Second most important ↓
CASI PAPI CASI PAPI CASI(376)/PAPI(472) N % N % N % N %
1. Maintain a stable economy 127 33.8 202 42.8 105 27.9 121 25.6
2. Progress toward a less impersonal, more humane society
104 27.7 128 27.1 88 23.4 113 23.9
3. Fight against crime 115 30.6 109 23.1 131 34.8 163 34.5
4. Progress toward a society where ideas are more important than money
26 6.9 21 4.4 47 12.5 58 12.3
5. *Do not understand these items 1 0.3 1 0.2 1 0.3 0 0.0
6. *DK 2 0.5 8 1.7 2 0.5 12 2.5
7. *NA 1 0.3 3 0.6 2 0.5 5 1.1

16
[POST-SPLIT SAMPLE A]Q14-SQ1 Among the 12 goals asked in Group 1 through Group 3, which item is the most important? Which item is the second most important? Lastly, which item is the least important?
Most important
↓ Second most important
↓ Least important
↓ CASI PAPI CASI PAPI CASI PAPI
(※CASI 13~15=-8) CASI(376)/PAPI(472) N % N % N % N % N % N %
1. Maintain a high rate of economic growth
44 11.7 112 23.7 30 8.0 39 8.3 29 7.7 19 4.0
2. Make sure that this country has strong defense forces
10 2.7 12 2.5 13 3.5 25 5.3 132 35.1 109 23.1
3. See that the people have more say in how things get decided at work and in their communities
28 7.4 40 8.5 30 8.0 39 8.3 17 4.5 14 3.0
4. Try to make our cities and countryside more beautiful
38 10.1 26 5.5 20 5.3 22 4.7 20 5.3 32 6.8
5. Maintain order in the nation
25 6.6 33 7.0 29 7.7 51 10.8 6 1.6 6 1.3
6. Give the people more say in important government decisions
39 10.4 35 7.4 32 8.5 25 5.3 13 3.5 13 2.8
7. Keep prices stable 31 8.2 44 9.3 44 11.7 72 15.3 5 1.3 10 2.1
8. Protect freedom of speech 9 2.4 4 0.8 6 1.6 20 4.2 42 11.2 41 8.7
9. Maintain a stable economy
45 12.0 51 10.8 48 12.8 51 10.8 3 0.8 3 0.6
10. Progress toward a less impersonal, more humane society
48 12.8 50 10.6 42 11.2 44 9.3 8 2.1 5 1.1
11. Fight against crime 45 12.0 46 9.7 60 16.0 58 12.3 4 1.1 1 0.2
12. Progress toward a society where ideas are more important than money
11 2.9 9 1.9 18 4.8 13 2.8 69 18.4 107 22.7
13. *Do not understand these items
- - 1 0.2 - - 0 0.0 - - 1 0.2
14. *DK - - 8 1.7 - - 10 2.1 - - 86 18.2
15. *NA (-8) 3 0.8 1 0.2 4 1.1 3 0.6 28 7.4 25 5.3

17
[POST]Q15 Have you ever done any of these activities in the list? And, do you think you would like to do these activities in the
future? First of all, what about "to vote at an election"? Please answer by choosing either "several times", "once or twice" or
"never." And, do you think you would like to vote at an election in the future? Please answer by choosing “would like to,"
“indifferent,” or “would not like to.” Next, what about “to run for an election” …..”to be actively involved in jichikai activities" …. (1)Have you ever done any of these activities in the list?
(※CASI 4,5=-8) 1 2 3 4 5 (-8)
a number of times
once or twice never *DK *NA
CASI(780)/PAPI(933) N % N % N % N % N %
CASI 534 68.5 180 23.1 63 8.1 - - 3 0.4 (a) to vote at an election →
PAPI 891 95.5 29 3.1 12 1.3 0 0.0 1 0.1
CASI 8 1.0 7 0.9 759 97.3 - - 6 0.8 (b) to run for an election →
PAPI 4 0.4 5 0.5 918 98.4 4 0.4 2 0.2
CASI 154 19.7 116 14.9 506 64.9 - - 4 0.5 (c) to help election campaigning →
PAPI 138 14.8 128 13.7 665 71.3 2 0.2 0 0.0
CASI 123 15.8 92 11.8 559 71.7 - - 6 0.8 (e) to ask friends to vote for a candidate/party
→ PAPI 137 14.7 87 9.3 706 75.7 3 0.3 0 0.0
CASI 129 16.5 93 11.9 553 70.9 - - 5 0.6 (g) to become a member of koenkai →
PAPI 146 15.6 90 9.6 694 74.4 3 0.3 0 0.0
CASI 67 8.6 34 4.4 673 86.3 - - 6 0.8 (i) to become a member of a political party
→ PAPI 36 3.9 39 4.2 852 91.3 6 0.6 0 0.0
CASI 86 11.0 59 7.6 628 80.5 - - 7 0.9 (g) to support a party (by way of
donations/subscription to party's
periodical publications)
→
PAPI 69 7.4 54 5.8 808 86.6 2 0.2
0
0.0
CASI 168 21.5 159 20.4 449 57.6 - - 4 0.5 (h) to attend political assemblies organized by party/politician
→ PAPI 179 19.2 163 17.5 588 63.0 2 0.2 1 0.1
CASI 43 5.5 33 4.2 698 89.5 - - 6 0.8 (i) to write to or call a national/local representative
→ PAPI 42 4.5 18 1.9 870 93.2 3 0.3 0 0.0
CASI 127 16.3 136 17.4 512 65.6 - - 5 0.6 (k) to consult a city hall →
PAPI 84 9.0 96 10.3 749 80.3 4 0.4 0 0.0
CASI 268 34.4 171 21.9 333 42.7 - - 8 1.0 (m) to sign a petition →
PAPI 242 25.9 196 21.0 491 52.6 3 0.3 1 0.1
CASI 94 12.1 61 7.8 619 79.4 - - 6 0.8 (o) to take part in demonstrations/rallies →
PAPI 70 7.5 73 7.8 786 84.2 3 0.3 1 0.1
CASI 121 15.5 68 8.7 572 73.3 - - 19 2.4 (q) to vote in a referendum →
PAPI 83 8.9 65 7.0 745 79.8 37 4.0 3 0.3
CASI 268 34.4 181 23.2 325 41.7 - - 6 0.8 (s) to take part in volunteer activity/neighborhood activism in the area
→ PAPI 285 30.5 162 17.4 483 51.8 3 0.3 0 0.0
CASI 262 33.6 193 24.7 319 40.9 - - 6 0.8 (u) to be actively involved in jichikai activities
→ PAPI 306 32.8 191 20.5 434 46.5 2 0.2 0 0.0
CASI 33 4.2 38 4.9 674 86.4 - - 35 4.5 (w) to submit an opinion to a public comment system
→ PAPI 30 3.2 55 5.9 730 78.2 115 12.3 3 0.3

18
(2)How about in the future? (※CASI 4,5=-8) 1 2 3 4 5 (-8)
Would like to(will) indiffernt Would not like
to(won’t) *DK *NA
CASI(780)/PAPI(933) N % N % N % N % N %
CASI 629 80.6 82 10.5 65 8.3 - - 4 0.5 (a) to vote at an election →
PAPI 858 92.0 58 6.2 13 1.4 2 0.2 2 0.2
CASI 16 2.1 124 15.9 631 80.9 - - 9 1.2 (b) to run for an election →
PAPI 5 0.5 33 3.5 885 94.9 5 0.5 5 0.5
CASI 89 11.4 244 31.3 441 56.5 - - 6 0.8 (c) to help election campaigning →
PAPI 79 8.5 175 18.8 667 71.5 9 1.0 3 0.3
CASI 89 11.4 193 24.7 494 63.3 - - 4 0.5 (d) to ask friends to vote for a candidate/party
→ PAPI 82 8.8 130 13.9 712 76.3 7 0.8 2 0.2
CASI 59 7.6 222 28.5 493 63.2 - - 6 0.8 (e) to become a member of koenkai →
PAPI 74 7.9 143 15.3 706 75.7 7 0.8 3 0.3
CASI 38 4.9 183 23.5 552 70.8 - - 7 0.9 (f) to become a member of a political party
→ PAPI 19 2.0 71 7.6 834 89.4 7 0.8 2 0.2
CASI 66 8.5 203 26.0 504 64.6 - -
7 0.9 (g) to support a party (by way of
donations/subscription to party's
periodical publications)
→
PAPI 38 4.1 106 11.4 778 83.4 8 0.9 3 0.3
CASI 145 18.6 258 33.1 372 47.7 - - 5 0.6 (h) to attend political assemblies organized by party/politician
→ PAPI 115 12.3 209 22.4 601 64.4 5 0.5 3 0.3
CASI 83 10.6 243 31.2 449 57.6 - - 5 0.6 (i) to write to or call a national/local representative
→ PAPI 33 3.5 116 12.4 776 83.2 6 0.6 2 0.2
CASI 355 45.5 216 27.7 204 26.2 - - 5 0.6 (j) to consult a city hall →
PAPI 111 11.9 236 25.3 575 61.6 9 1.0 2 0.2
CASI 247 31.7 296 37.9 229 29.4 - - 8 1.0 (k) to sign a petition →
PAPI 198 21.2 284 30.4 439 47.1 10 1.1 2 0.2
CASI 61 7.8 190 24.4 523 67.1 - - 6 0.8 (l) to take part in demonstrations/rallies →
PAPI 39 4.2 132 14.1 754 80.8 5 0.5 3 0.3
CASI 310 39.7 236 30.3 217 27.8 - - 17 2.2 (m) to vote in a referendum →
PAPI 175 18.8 229 24.5 481 51.6 43 4.6 5 0.5
CASI 360 46.2 266 34.1 147 18.8 - - 7 0.9 (n) to take part in volunteer activity/neighborhood activism in the area
→ PAPI 309 33.1 257 27.5 353 37.8 13 1.4 1 0.1
CASI 251 32.2 300 38.5 222 28.5 - - 7 0.9 (o) to be actively involved in jichikai activities
→ PAPI 254 27.2 306 32.8 365 39.1 7 0.8 1 0.1
CASI 100 12.8 268 34.4 381 48.8 - - 31 4.0 (q) to submit an opinion to a public comment system
→ PAPI 44 4.7 191 20.5 597 64.0 96 10.3 5 0.5

19
[POST]Q16 By the way, is there any political party which you usually think of yourself as close to?
CASI PAPI
CASI(780)/PAPI(933) N % N %
1. yes 2. no 3. *DK 4. *NA
257
517
4
2
32.9
66.3
0.5
0.3
367
557
5
4
39.3
59.7
0.5
0.4
→SQ1 →SQ4
[POST]Q16SQ1 [For those who answered “Yes” to Q 16] Which parties are they? Please specify all that correspond (M.A.).
CASI PAPI CASI PAPI
CASI(257)/
PAPI(367) N % N %
N % N %
1. LDP 2. DPJ 3. CGP 4. JCP
132
121
48
31
51.4
47.1
18.7
12.1
189
135
54
35
51.5
36.8
14.7
9.5
5. SDP 6. other party 7. *DK 8. *NA
22
12
2
1
8.6
4.7
0.8
0.4
19
8
0
11
5.2
2.2
0.0
3.0
[POST]Q16SQ2 [For those who specified more than one parties in Q16-SQ1] Which party do you feel closest to? Please choose
one from following choices of answers.
CASI PAPI CASI PAPI
CASI(82)/
PAPI(71) N % N %
N % N %
1. LDP 2. DPJ 3. CGP 4. JCP
31
31
8
5
37.8
37.8
9.8
6.1
32
14
12
6
45.1
19.7
16.9
8.5
5. SDP 6. other party 7. *DK 8. *NA
5
1
0
1
6.1
1.2
0.0
1.2
3
2
1
1
4.2
2.8
1.4
1.4
[POST]Q16SQ4 Is there, then, any party which you feel yourself a little closer to than others
CASI PAPI
CASI(517)/PAPI(557) N % N %
1. yes 2. no 3. *DK 4. *NA
137
378
2
0
26.5
73.1
0.4
0.0
187
360
5
5
33.6
64.6
0.9
0.9
→SQ5
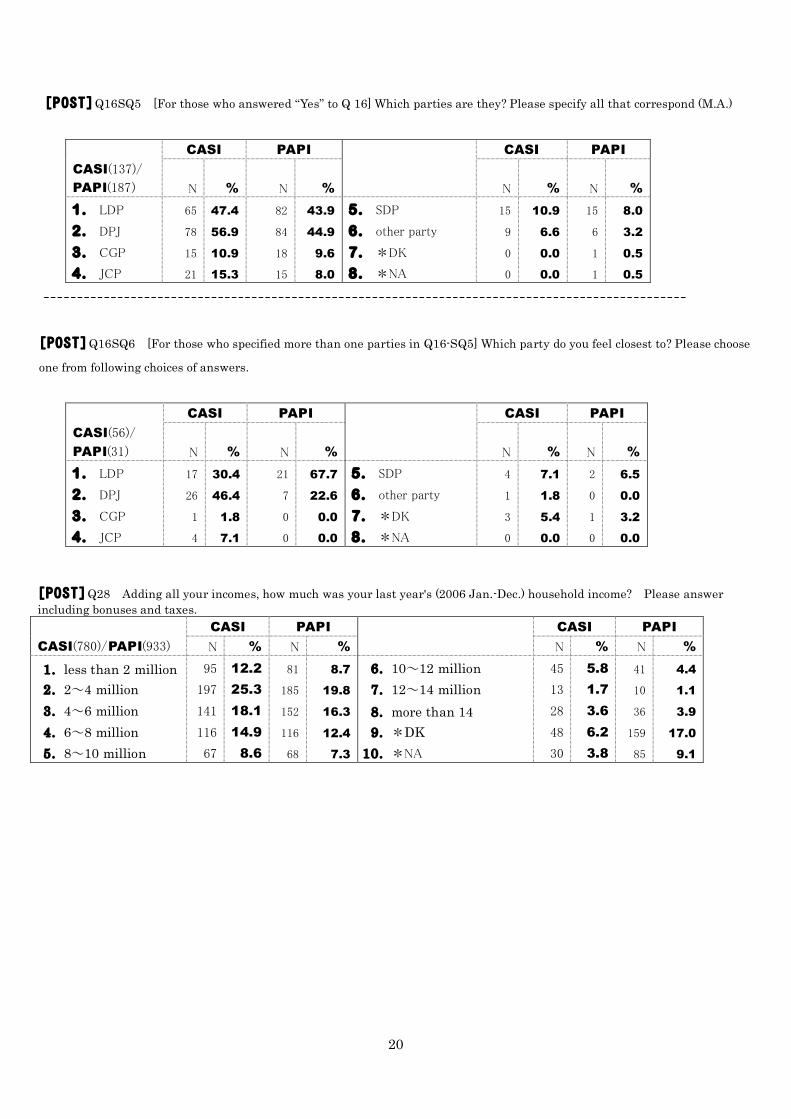
20
[POST]Q16SQ5 [For those who answered “Yes” to Q 16] Which parties are they? Please specify all that correspond (M.A.)
CASI PAPI CASI PAPI
CASI(137)/
PAPI(187) N % N %
N % N %
1. LDP 2. DPJ 3. CGP 4. JCP
65
78
15
21
47.4
56.9
10.9
15.3
82
84
18
15
43.9
44.9
9.6
8.0
5. SDP 6. other party 7. *DK 8. *NA
15
9
0
0
10.9
6.6
0.0
0.0
15
6
1
1
8.0
3.2
0.5
0.5
[POST]Q16SQ6 [For those who specified more than one parties in Q16-SQ5] Which party do you feel closest to? Please choose
one from following choices of answers.
CASI PAPI CASI PAPI
CASI(56)/
PAPI(31) N % N %
N % N %
1. LDP 2. DPJ 3. CGP 4. JCP
17
26
1
4
30.4
46.4
1.8
7.1
21
7
0
0
67.7
22.6
0.0
0.0
5. SDP 6. other party 7. *DK 8. *NA
4
1
3
0
7.1
1.8
5.4
0.0
2
0
1
0
6.5
0.0
3.2
0.0
[POST]Q28 Adding all your incomes, how much was your last year's (2006 Jan.-Dec.) household income? Please answer including bonuses and taxes. CASI PAPI CASI PAPI
CASI(780)/PAPI(933) N % N % N % N %
1. less than 2 million 2. 2~4 million 3. 4~6 million 4. 6~8 million 5. 8~10 million
95
197
141
116
67
12.2
25.3
18.1
14.9
8.6
81
185
152
116
68
8.7
19.8
16.3
12.4
7.3
6. 10~12 million 7. 12~14 million 8. more than 14 9. *DK
10. *NA
45
13
28
48
30
5.8
1.7
3.6
6.2
3.8
41
10
36
159
85
4.4
1.1
3.9
17.0
9.1