G-CAN: Gender-responsive and Climate-resilient Agriculture...
56
G-CAN: Gender-responsive and Climate-resilient Agriculture for Nutrition – Insights from Cambodia USAID: Mark Visocky, Jeannie Harvey, Meredith Soule IFPRI: Claudia Ringler, Tim Thomas, Jowel Choufani, Sophie Theis, Elizabeth Bryan
-
Upload
nguyendang -
Category
Documents
-
view
214 -
download
0
Transcript of G-CAN: Gender-responsive and Climate-resilient Agriculture...

G-CAN: Gender-responsive and Climate-resilient Agriculture for
Nutrition – Insights from Cambodia
USAID: Mark Visocky, Jeannie Harvey, Meredith SouleIFPRI: Claudia Ringler, Tim Thomas, Jowel Choufani, Sophie Theis, Elizabeth Bryan

1. Process/template for FTF focus countries to help understand climate science and implications for CSA programing that integrates nutrition and gender
2. An innovative new framework for integrating gender and nutrition into CSA decision-making
3. Enhanced effectiveness and sustainability of investments in focus countries, based on country/mission tailored analysis and assessment of the potential for agricultural technologies
G-CAN ACTIVITIES

4. Enhanced use of FTF open data to improve our understanding of ZOI for better program planning
5. Advisory services to allow end-users quick access to summaries of existing and new research with programmatic implications in the areas of CSA, gender and nutrition
G-CAN ACTIVITIES

Photo Credit Goes Here
Climate change vulnerability and
adaptation policy in Cambodia

HIGH VULNERABILITY TO CLIMATE CHANGE
• Cambodia is considered very vulnerable to climate change
and one of the most vulnerable in SE Asia (Yusuf and
Francisco 2009)
• High dependence on natural resources vulnerable to climate
impacts – 70% of population relies on agriculture, fisheries,
and forestry; 80% of population is rural
• Frequent and increasingly intense floods, droughts,
salinization, changing temperature and rainfall patterns,
increased incidence of pests and disease (Cambodia HDR
2011)
• Drinking water sources likely to be affected (tubewells, dug
wells, rainwater, and surface water for rural households)

LARGE SET OF CLIMATE CHANGE POLICIES FOR
RURAL RESILIENCE
• Climate Change Strategic Plan 2013-2023
• National Strategic Development Plan-NSDP (2014-2018)
• Climate Change and Gender Strategy and Action Plan
• Community Based Disaster Risk Management Plan (CBDRM)
• Plan of Action for Disaster Risk Reduction in Agriculture 2014-2018 aims to
integrate DRR, climate change adaptation, and sustainable land management into
all activities within General Directorate of Agriculture
• National Social Protection Strategy for the Poor and Vulnerable (2011-2015)
• Gender and Climate Change Strategic Plan-GCCSP (2014-2023), Gender and
Climate Change Action Plan-GCCAP (2014-2018)
• Local governance institutions to address climate:• Commune Committees on Disaster Management (CCDM)
• Commune Committees for Women and Children (CCWC)

Photo Credit Goes Here
Overview of Land Use and
Agriculture

CLIMATE AND AGRICULTURE IN CAMBODIA
Land cover type, 2013, MODIS

TEN LEADING CROPS OF CAMBODIA, BY HARVESTED AREA, 2010-2012
Item
Rank by area
harvested
Hectares harvested,
average, 2010-2012
Tons produced,
average, 2010-2012
Yield,
average,
2010-2012
Rice, paddy 1 2,917,527 8,771,753 3.01
Cassava 2 302,962 6,631,653 21.89
Maize 3 240,007 813,726 3.39
Vegetables, other 4 94,598 592,425 6.26
Soybeans 5 81,585 130,452 1.60
Beans, dry 6 64,086 74,031 1.16
Sesame seed 7 42,540 30,053 0.71
Rubber, natural 8 35,670 42,051 1.18
Bananas 9 32,748 155,609 4.75
Sugar cane 10 22,333 469,355 21.02
Source: FAOSTAT (FAO 2014).

Photo Credit Goes Here
Climate in Cambodia

MEAN ANNUAL PRECIPITATION, MM, 1950-2000
Source: WorldClim 1.4 (Hijmans et al.).
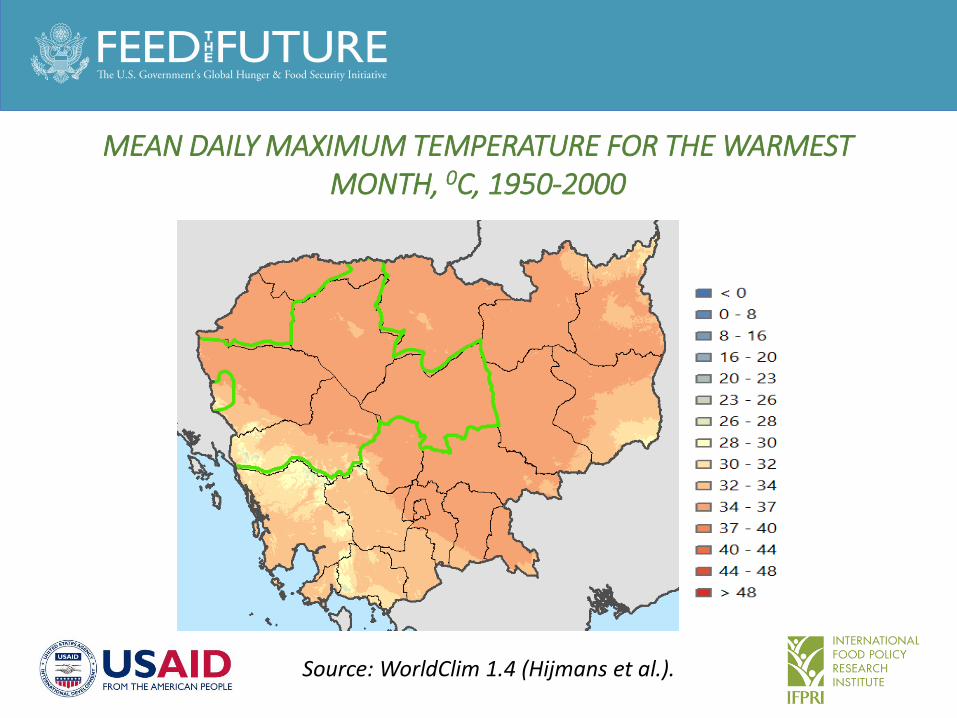
MEAN DAILY MAXIMUM TEMPERATURE FOR THE WARMEST MONTH, 0C, 1950-2000
Source: WorldClim 1.4 (Hijmans et al.).

Photo Credit Goes Here
Climate Change Projections for
Cambodia

CHANGE IN MEAN ANNUAL PRECIPITATION, MM, 2000-2050
Note: RCP 8.5. Climate models clockwise from top left: GFDL,
HadGEM, MIROC, and IPSL. Feed the Future zone is outlined in
green.

FIGURE 5. CHANGE IN MEAN DAILY MAXIMUM TEMPERATURE FOR THE WARMEST MONTH, 0C, 2000-2050
Note: RCP 8.5. Climate models clockwise from top left: GFDL,
HadGEM, MIROC, and IPSL. Feed the Future zone is outlined in green.

Photo Credit Goes Here
Projected Impact of Climate
Change on Agriculture

IMPACT OF CLIMATE CHANGE ON CROP YIELDS, 2000-2050, PERCENT
Percent yield change due to climate change,
2000-2050
Crop Water
Hectares
harvested,
2005 GFDL
Had-
GEM IPSL MIROC
Median
of 4
Rice Rainfed 2,020,239 -2.5 2.3 -1.7 -5.5 -2.1
Rice Irrigated 331,456 -3.1 4.0 -2.9 -5.7 -3.0
Maize Rainfed 89,073 -11.3 -6.7 -7.8 -11.0 -9.4
Soybeans Rainfed 79,898 0.0 2.3 -4.7 -12.0 -2.3
Cassava Rainfed 64,131 -5.9 -20.8 -6.8 -7.8 -7.3
Groundnuts Rainfed 17,762 -22.2 -23.9 -22.6 -21.2 -22.4
Sugarcane Irrigated 8,588 -29.2 -50.5 -40.7 -47.8 -44.2
Sugarcane Rainfed 7,318 -28.7 -51.6 -41.0 -45.2 -43.1
Source: AgMIP GGCMI; SPAM 2005.

CHANGE IN YIELD DUE TO CLIMATE CHANGE, VARIOUS CROPS,
2000-2050, MEDIAN OF 4 GCMS AND 3 CROP MODELS, PERCENT
Source: AgMIP GGCMI; SPAM 2005.
Note: Median derived from using four General Circulation Models and up
to four crop models (three for rice; four for both maize and soybeans; one
for cassava). Evaluated with CO2 fertilization.
Rainfed Rice Irrigated Rice

CHANGE IN YIELD DUE TO CLIMATE CHANGE, VARIOUS CROPS, 2000-2050, MEDIAN OF 4 GCMS AND 3 CROP MODELS, PERCENT
Source: AgMIP GGCMI; SPAM 2005.
Note: Median erived from using four General Circulation Models and up
to four crop models (three for rice; four for both maize and soybeans; one
for cassava). Evaluated with CO2 fertilization.
Rainfed Wheat Rainfed Soybeans

CHANGE IN YIELD DUE TO CLIMATE CHANGE, VARIOUS CROPS, 2000-2050,
MEDIAN OF 4 GCMS AND 1 CROP MODEL, PERCENT
Source: AgMIP GGCMI; SPAM 2005.
Note: Median derived from using four General Circulation Models and up to four crop models (three for
rice; four for both maize and soybeans; one for cassava). Evaluated with CO2 fertilization.
Rainfed Cassava

Photo Credit Goes Here
Climate-Smart Agriculture (CSA) in
Cambodia

PRIORITY ACTIONS RELATED TO
CSA IN THE INDC
• Build sea dykes in coastal areas
• Expand irrigation and improve efficiency
• Develop crop varieties suited to new climate
• Expand aquaculture
PROMISING CSA ACTIVITIES
• System of Rice Intensification (SRI): Currently more
than 200,000 households (CEDAC)
• Aquaculture
• Climate-Smart Villages (CCAFS)
• Improved Irrigation (SNV)
• Pest-Smart (CABI)
• Seed development for new climates

ADDITIONAL CSA ACTIVITIES TO
CONSIDER
• Improved livestock feed
• Improved fertilizer use in places where
SRI not adopted

Photo Credit Goes Here
Climate and nutrition: Considerations
for nutrition-sensitive approaches

NUTRITION PROFILE
– Global Hunger Index 2016= Score 21.7 (Serious) (decline by -4.9 since 2008)
– Stunting in children under 5 years: 32.4% (WHO cutoff ≥20%). Rank: 95/132. Large disparities between lowest and highest wealth quintiles and at the sub-national region
– Anemia in women of reproductive age: 43.8% (WHO cutoff ≥20%) Rank: 124/185
• Micronutrient deficiencies (varies with urban/rural, wealth quintile)– Children (6-59 mo): Anemia (HB<11g/dL): 56%– Women: Anemia– pregnant women: 53%; Anemia– non-pregnant
women: 44%
Global Nutrition Report 2016; CDHS 2014; Wieringa et al

CAMBODIA NSFSN (2014-2018)
• Objective 1: Increased Food Availability and Food Access- More productive and diversified agriculture and livestock production
- Sustainable forestry and fisheries
- Non-agricultural employment and income opportunities during agriculture lean season
- Infrastructure (roads, markets)
• Objective 2: Improving Use and Utilization of Food• Improved WASH practices, decreased parasitic infections
• Objective 3: Increasing Stability of Food Supply- Natural disasters (floods and droughts), socio-economic shocks (food
price increases)
NSFSN 2014-108, brief
NUTRITION IMPLICATIONS OF THE CAMBODIA CLIMATE CHANGE STRATEGIC PLAN (2013-2023)
• Agricultural diversification (e.g. crops, livestock, etc.)
• Increase in productivity (e.g. crops, fisheries, livestock, forestry, etc.)
• Opportunity for new crop varieties
• Build and rehabilitate climate-resilient rural road infrastructures and connect production areas to the market
No specific details on diversification or new crop varieties What are the nutrition implications?
Climate Change Strategic Plan 2013-2023

SOURCE OF FOODS CONSUMED
Census of Agriculture 2013
Percentage of households reporting consumption of basic food types in the past seven days by source of food.
Root cropsRice and other cereals
Beans and
pulses
Vegetables Fruits Nuts Meat and animal products
Fish and other seafood
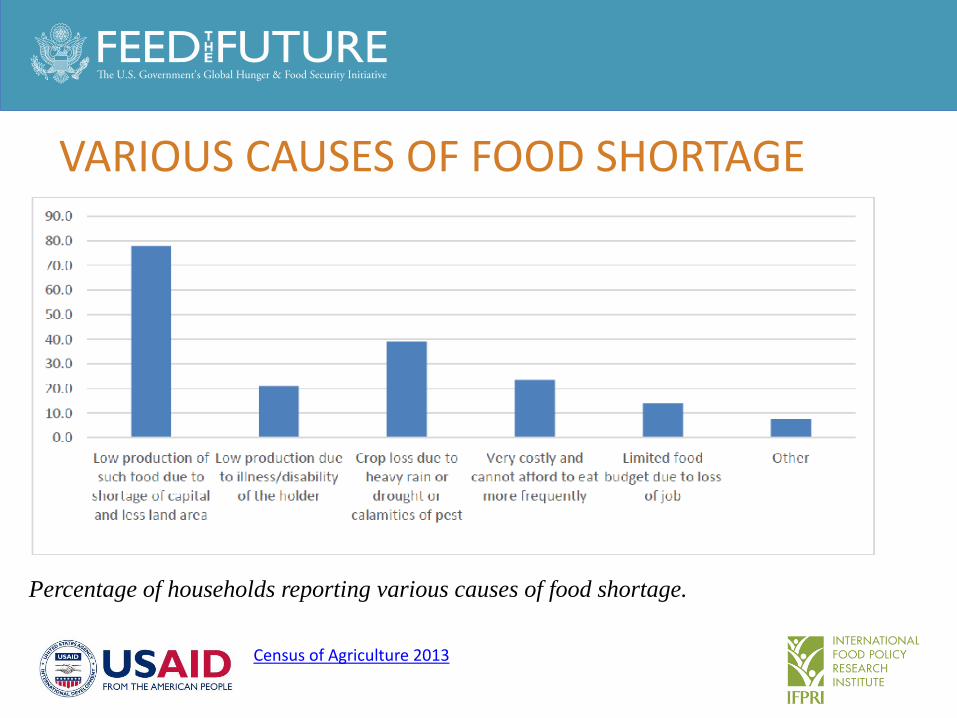
VARIOUS CAUSES OF FOOD SHORTAGE
Census of Agriculture 2013
Percentage of households reporting various causes of food shortage.

ENTRY POINTS FOR NUTRITION IN CSA• Stunting was negatively associated with dietary diversity, and in particular,
consumption of animal source food was a protective factor against stunting and underweight– Fish is primary source of protein. Chicken and pork other sources
– Low consumption of pulses
• Diversification:– 30% of Cambodian children (6-23 months) met the minimum standard with
respect to three IYCF feeding practices (food diversity, feeding frequency, and consumption of breast milk or other types of milk or milk products)
– Only 48% percent of children received foods from the minimum number of food groups for their age.
– Urban children were more likely to be fed according to all of the IYCF practices than rural children (49 percent versus 28 percent).
– Large regional differences in feeding practices.
¹Darapheak et al; CDHS 2014
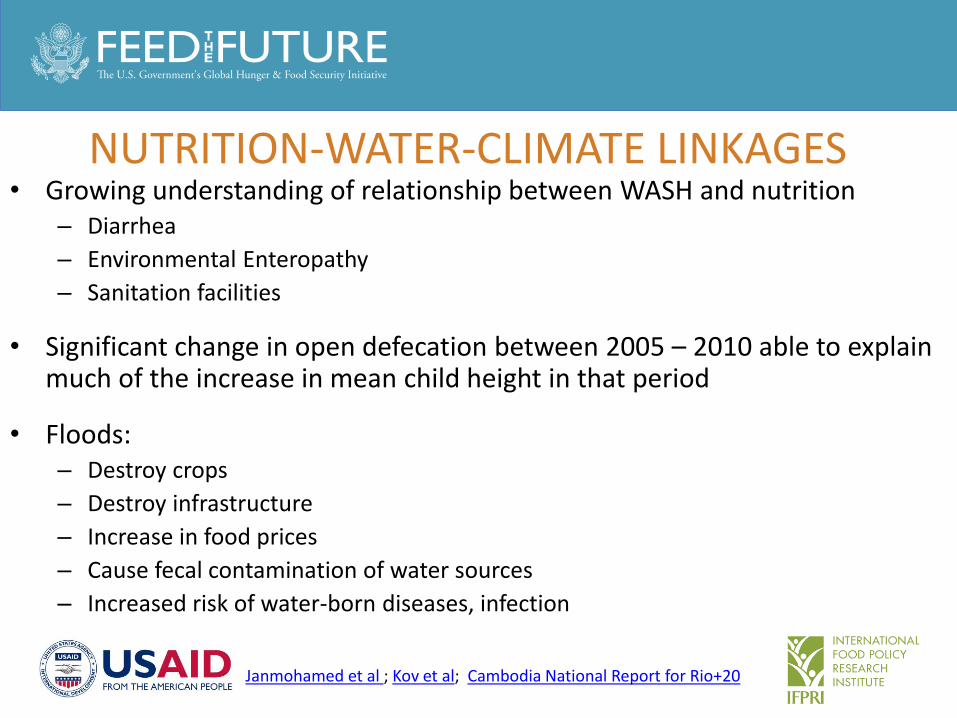
NUTRITION-WATER-CLIMATE LINKAGES• Growing understanding of relationship between WASH and nutrition
– Diarrhea
– Environmental Enteropathy
– Sanitation facilities
• Significant change in open defecation between 2005 – 2010 able to explain much of the increase in mean child height in that period
• Floods:– Destroy crops
– Destroy infrastructure
– Increase in food prices
– Cause fecal contamination of water sources
– Increased risk of water-born diseases, infection
Janmohamed et al ; Kov et al; Cambodia National Report for Rio+20

IMPORTANCE OF MATERNAL EDUCATION AND INCOME
Maternal secondary education:– Higher proportion (39%) of children fed in accordance with IYCF criteria, 49% in
highest wealth quintile
– Children less likely to be anemic than other children.
– Lower rates of stunting (22.2% vs 45.8%) and underweight (25.1% vs43.5%) compared to mothers with no education
– Men more likely than women to have secondary education or higher (52 percent versus 40 percent).
What roles do women take in agriculture, and how does this affect schooling, care practices, control over income, and ultimately nutrition?
¹Darapheak et al; CDHS 2014
NO ONE SIZE FITS ALL• Key drivers of change differ between severely & moderately
stunted children and between rural & urban areas Different interventions needed
• Rural: maternal best practices and parental characteristics (parental education levels) are key for child nutrition status, wealth less important (for severely stunted).
• Urban: maternal best practices and parental characteristics are important, but household wealth more important (severely stunted).
• Moderately stunted: improvement in health infrastructure–principally improved sanitation and drinking water–important
Zanello et al

Photo Credit Goes Here
Gender and climate resilience

GENDER AND CLIMATE IN GOVT PLANNING
• National Strategic Development Plan-NSDP (2014-2018)
• Cambodia Climate Change Strategic Plan with ‘Strategic
Objective 2: Reduce sectoral, regional, gender vulnerability and
health risks to climate change impacts’.
• Neary Rattanak IV (“women are precious gems”), strategic plan
of MoWA
• Gender and Climate Change Strategic Plan-GCCSP (2014-2023)
• Gender and Climate Change Action Plan-GCCAP (2014-2018) to translate
GCCSP into action

PRIORITY GENDER & CC ACTIONS (GENDER
AND CC ACTION PLAN 2014-2018)Strategy 1: Strengthening institutional capacity and cross-sectoral coordination with
a focus on women’s role in climate change adaptation and mitigation
1. Gender and climate change capacity strengthening at all levels
2. Gender integration in NSDP and sector plans
3. Increase women’s participation in decision making at all levels
Strategy 2: Improving capacity, knowledge, and awareness on women’s role in
climate change adaptation and mitigation
4. Vulnerability assessments and gender indicators in national M&E climate change
framework
5. Disaggregated info on role of men and women in coping with impacts of climate
change
Strategy 3: Promote climate change adaptation and mitigation measures for
disadvantaged women and other groups
6. Gender-responsive climate change adaptation and mitigation projects
FURTHER DETAIL ON ACTIONS AS ELABORATED IN THE PLAN:
WHERE WE COULD WORK TOGETHER TO CONTRIBUTE
• [Strategy 1] Research on women and climate change-related
decision making
• [Strategy 2] Develop questionnaires and guidelines for
vulnerability assessment, disaggregated data system to collect and
analyze climate change impacts on women and men, gender
indicators in national M&E framework on climate change
• [Strategy 3] Review of best practices of gender-responsive climate
change interventions in Cambodia and elsewhere (e.g. entry points for
increasing men’s and women’s participation, identifying and
addressing gendered needs and preferences); evaluate pilot
projects and share lessons learned

FIRST STAGE• Food environment
(availability and access)• Food stability• Environmental
outcomes• Care practices• Empowerment
ABSORPTIVE
CAPACITY
• Ability to absorb direct impacts
ADAPTIVE
CAPACITY
• Ability to respond to shocks, stresses, or risks
Resilience/vulnerability feedback loop
Emissions/Sequestration
Tradeoffs and synergies
between people, scales
and outcomes
Spatial scale (individual to state/regional)
Time (short, medium, long term)
Framework for Climate, Gender, and Nutrition
Climate
Signal
Climate variability
Climate shocks
Long-term stressors
ENABLING ENVIRONMENT
DECISION-MAKING CONTEXTDifferent needs & preferencesBargaining power and control
Interest alignment
SECOND STAGE• Diet quality• Adequate nutrition• Health status
• Coping
• Risk Management
• Adaptation• Transformation
RESPONSE
OUTCOMES
RA
NG
E
OF
R
ES
PO
NS
E O
PT
IO
NS
Food Production
Income
Assets
Labor
NRM
Cooperation

• Understanding and addressing these gender
differences (within households & between
female/male-headed households) can help to:
• Ensure social inclusion
• Mitigate potential harm to the most vulnerable
• Leverage particular networks and knowledge
• Strengthen climate resilience and achieve
other development outcomes
• Advance empowerment and gender equality
1. What is the state of knowledge on these differences in the
Cambodia context?
2. What are entry points for addressing these differences?

(1) GENDER DIFFERENCES IN ABSORPTIVE CAPACITYHow are men and women differently affected by climate change?
Components of absorptive capacity
Main questions to consider
Livelihood activities What activities do men and women typically do in productive and reproductive work? What is division of labor?
Social protection What social protection programs (e.g. social transfers, public works programs) do men and women have access to, and use? (examine targeting and actual coverage)
Infrastructure Does shelter/infrastructure vulnerability vary? (e.g. presence of flood protection or not)
Health/nutritional status How does this differ based on biological sex (e.g. anemia during pregnancy) or gender role (e.g. exposure to malaria in rice fields, give up food for other household members)

(1) GENDER DIFFERENCES IN ABSORPTIVE CAPACITY
How are men and women differently affected by climate change?
Different livelihood activities:
• Care burden: 43% of people in agricultural households are under age 29,
dependency ratio averages .48, 32% of population is considered economically
dependent (<15 years + >60 years)
• Domestic work: 83.5% of households rely on firewood for cooking (HDR 2010);
high reliance on rainwater and non-improved sources of drinking water
• Ag work: 75% of employed women over age 15 work in agriculture, forestry, and
fishing; 68% of rural employed women are unpaid family workers (Census 2008),
division of labor: in rain-fed rice farming, men plough, women plant seedlings,
weed and winnow (GCCSP). A higher proportion of male-headed households
tend livestock (62%), conduct fishing activities (56%) than female-headed (48.1%
livestock; 32% fishing) in Tonle Sap (ILO/CSES 2014)

“Much remains to be understood about potentially different impacts
on gender vulnerability and adaptation and mitigation capacities of
women and men in contract and other forms of farming due to gender
division of labour, and access to and control over resources and
benefits.”
(Cambodia Gender and Climate Change Strategic Plan 2013)
• Better data on gendered division of livelihood activities would help
us understand men and women’s differences in absorptive capacity.
CSES focuses on female vs. male-headed households; but women
in male-headed households should not be overlooked
SUMMARY

(2) GENDER DIFFERENCES IN ADAPTIVE CAPACITYWhat factors influence the choices women and men have in responding to
climate change?
Components of ADAPTIVE CAPACITY
Main questions to consider
Access to information (about CC and adaptation)
Are there differences in access to info/training? Why (mobility, education, gender-blind design of services)? What channels of info do men/women rely on and what content do they need?
Labor Access to household/paid labor? Time available to access training/participate in decisions?
Assets Do men and women have different access and control over natural resources, financial and physical capital that they could use to adapt?
Institutions Influence of social norms, tenure and inheritance regime, inclusion in community institutions on men/women?
Human capital Perceptions of climate change, literacy/education, risk preferences, skills and knowledge (e.g. swimming)

(2) GENDER DIFFERENCES IN ADAPTIVE CAPACITY
What resources can women and men draw upon to respond to the impacts of
climate change?
Ex: Information:
• Extension services: Although women comprise 51 percent of the
primary workforce in subsistence agriculture and 57 percent of the
workforce in market-oriented agriculture, they receive only 10% of
agricultural extension services (MoWA 2008). Why is this?
• Gender-blind services can unintentionally exclude women:
Ministry of Planning (2010): “Economic opportunities for women are
still largely constrained, with most credit, training, extension and
support programs not sufficiently tailored to their needs”
• Technology gap: female-headed households less likely to own
radio/TV (40 vs. 50%)
Ex: Credit:
• MHH take out credit 5x more than FHH! (CSES 2008)
Ex: Time/labor:
• 20% of ag households are female-headed (33% in Tonle Sap)
and 53% of active ag population (ages 15-60) are women.
• 11% of female-headed households are “de jure” in temporary
absence of male household head (e.g. male out-migration). (FAO
2008 /CSES 2008)
• Certain response options, like System of Rice intensification
(SRI) not viable for households with labor scarcity. Typically labor
for SRI is provided by older people and women aged 35 or above
(Cambodia HDR 2011)
• Time burden across these activities likely to increase under
climate stress, and acutely in times of climate shock (e.g. flood)
(2) GENDER DIFFERENCES IN ADAPTIVE CAPACITY

0
100
200
300
400
500
600
Reproductive andproductive work
Reproductivework
Domestic work Cooking Care Productive work Agriculture Non-agriculturalwork
Min
ute
s
Men and Women's Average Time on Activities in the previous 24 hours (Cambodia)
Cambodia Men Cambodia Women

(3) RESPONSE OPTIONS ARE EMBEDDED IN A DECISION
MAKING CONTEXT
• Men and women may have different preferences, needs, and knowledge
of CC impacts based on their roles and resources. Do they have power
– in the household and community – to influence or make decisions
based on this?
In the household
• Cambodia women often control and manage household finances
• Some indicators of women’s household decision making are
relatively high (e.g. input into decisions and control over earnings
measures in DHS; high WEAI score) but still lower than men’s
• How do preferences differ? More research needed.

• In the community
• “The bulk of climate change adaptation and mitigation will take place at
decentralized levels” (GCCSP)• Ex: farmer water user committees, Commune Committees for Women and Children,
Commune Committees for Disaster Management, community fisheries
• However, women are often not participating or not participating in a
meaningful way in local governance institutions or DRR processes
• Ex: In the Commune Committees for Women and Children (CCWC), World Bank
found that women are actively involved in formal processes, but village-level
meetings are predominantly attended by less educated members whose time is
less valuable to ‘fill the seats.’ More influential informal and invited processes
involve wealthier people and often exclude women altogether
How to go beyond counting attendance?
(3) RESPONSE OPTIONS ARE EMBEDDED IN A DECISION
MAKING CONTEXT
(4) RESPONSE OPTIONS• Given the ways in which men and women are affected by climate change,
their capacities to adapt, and their power to make decisions in line with
their own preferences and priorities, what response options do different
people choose?
“Taking out a cash loan or finding paid work in a city or provincial town are the
main options selected by men to cope with natural disasters, while getting
paid work in the village or local area is the main measure chosen by women
and female headed-households (Koy & Em 2012)”
• What are the entry points to expand the range/improve the response
options available to men and women?
• Different response choices have implications for development
outcomes, including empowerment outcomes

WILL CSA CLOSE OR WIDEN THE EMPOWERMENT
GAP?
The costs and benefits of CSA approaches are not distributed across all
hh members equally.
It is important to consider how individual CSA options affect men and women
differently
For example:
• Who migrates and who is left behind?
• Who benefits from human capital investments? (e.g. education, health)
• Who changes consumption?
• Who gains/loses assets? (e.g. based on relative value, liquidity, whose
assets are sold?)
• How does time use change on different activities, and for whom?
(productive and reproductive) (e.g. SRI)
• How does relative control over income change?

Adopt
• Whether to purchase, rent, acquire a technology
Use
• Who uses the technology
Manage
• How, when, and where technology is used
Alienate
• Whether to sell, lease, or give away the technology
Exploit
• What to do with the products of the technology
• How to use outputs and income from outputs
• Who is able and allowed to use the technology, and what tasks are performed by whom
• What crops or plots of land are prioritized for the technology
• Who is allowed to own, buy, or rent the technology
• Who can alienate or profit off the technology as an asset
Framework for understanding household distribution of costs and benefits from technology adoption

Photo Credit Goes Here
Research questions to advance
evidence & understanding of the
climate-gender-nutrition nexus

GENDER-CLIMATE-NUTRITION Q’S
1. Where are opportunities to harmonize social protection, disaster
risk reduction, and climate adaptation? How can gender and
nutrition be integrated?
2. Better documentation of the differences in adaptive capacity
(constraints, preferences) between men and women
3. Better documentation of the effects of current response options.
What are coping mechanisms to shocks, who is affected, why?
Impacts on nutrition? Differences in awareness/perceptions of
climate and willingness to take action?

GENDER-CLIMATE-NUTRITION Q’S
4. Decentralized climate adaptation: What factors make
community based adaptation institutions effective and
inclusive? What works to make them more representative and
accountable? What indicators should be used to monitor and
evaluate these institutions?
5. Calls for better gender indicators in climate resilience M&E –
how to go beyond counting participation?
6. What are lessons learned from USAID projects in Cambodia
on these topics?

Photo Credit Goes Here
Thank you! Let’s discuss…