
Facebook Ads - The Shifting Landscape from Keywords to Audiences - Ned Poulter #SearchLeeds

G
A
Ri
BNa
b
c
d
e
f
a
ARR1A
KSRDDCC
1
lad2
0h
ARTICLE IN PRESS Model
GMET-4749; No. of Pages 15
Agricultural and Forest Meteorology xxx (2013) xxx– xxx
Contents lists available at SciVerse ScienceDirect
Agricultural and Forest Meteorology
jou rn al h om epa g e: www.elsev ier .com/ locate /agr formet
ecent trends in Inner Asian forest dynamics to temperature and precipitationndicate high sensitivity to climate change
enjamin Poultera,∗ , Neil Pedersonb , Hongyan Liuc , Zaichun Zhud , Rosanne D’Arrigob , Philippe Ciaisa ,icole Davib, David Franke,f, Caroline Lelandb, Ranga Mynenid, Shilong Piaoc, Tao Wanga
Laboratoire des Sciences du Climat et de l’Environnement, LSCE CEA CNRS UVSQ, 91191 Gif Sur Yvette, FranceTree Ring Laboratory of Lamont-Doherty Earth Observatory and Columbia University, 61 Route 9w, Palisades, NY 10964, USACollege of Urban and Environmental Sciences, Peking University, Beijing 100871, ChinaDepartment of Geography and Environment, Boston University, 675 Commonwealth Avenue, Boston, MA 02215, USASwiss Federal Research Institute WSL, Dendroclimatology, Zürcherstrasse 111, Birmensdorf 8903, SwitzerlandOeschger Centre for Climate Change Research, University of Bern, Bern, Switzerland
r t i c l e i n f o
rticle history:eceived 4 July 2012eceived in revised form1 December 2012ccepted 17 December 2012
eywords:emi-arid forestemote sensingendrochronologyynamic global vegetation modellimate changearbon cycle
a b s t r a c t
Semi-arid ecosystems play an important role in regulating global climate with the fate of these ecosystemsin the Anthropocene depending upon interactions among temperature, precipitation, and CO2. However,in cool-arid environments, precipitation is not the only limitation to forest productivity. Interactionsbetween changes in precipitation and air temperature may enhance soil moisture stress while simulta-neously extending growing season length, with unclear consequences for net carbon uptake. This studyevaluates recent trends in productivity and phenology of Inner Asian forests (in Mongolia and NorthernChina) using satellite remote sensing, dendrochronology, and dynamic global vegetation model (DGVM)simulations to quantify the sensitivity of forest dynamics to decadal climate variability and trends. Trendsin photosynthetically active radiation fraction (FPAR) between 1982 and 2010 show a greening of about7% of the region in spring (March, April, May), and 3% of the area ‘browning’ during summertime (June,July, August). These satellite observations of FPAR are corroborated by trends in NPP simulated by theLPJ DGVM. Spring greening trends in FPAR are mainly explained by long-term trends in precipitationwhereas summer browning trends are correlated with decreasing precipitation. Tree ring data from 25sites confirm annual growth increments are mainly limited by summer precipitation (June, July, August)in Mongolia, and spring precipitation in northern China (March, April, May), with relatively weak prior-year lag effects. An ensemble of climate projections from the IPCC CMIP3 models indicates that warmingtemperatures (spring, summer) are expected to be associated with higher summer precipitation, which
combined with CO2 causes large increases in NPP and possibly even greater forest cover in the Mongoliansteppe. In the absence of a strong direct CO2 fertilization effect on plant growth (e.g., due to nutrient lim-itation), water stress or decreased carbon gain from higher autotrophic respiration results in decreasedproductivity and loss of forest cover. The fate of these semi-arid ecosystems thus appears to hinge uponthe magnitude and subtleties of CO2 fertilization effects, for which experimental observations in aridsystems are needed to test and refine vegetation models.© 2012 Elsevier B.V. All rights reserved.
. Introduction
Semi-arid ecosystems cover between 17 and 30% of the globaland surface and have climatic regimes characterized by low mean
Please cite this article in press as: Poulter, B., et al., Recent trends in Inner Asensitivity to climate change. Agric. Forest Meteorol. (2013), http://dx.doi.
nnual precipitation (<650 mm yr−1) and vegetation adapted tory soil conditions (Rotenberg and Yakir, 2010; Sankaran et al.,005). Within Central Asia, the Köppen-Geiger arid system biome
∗ Corresponding author.E-mail address: [email protected] (B. Poulter).
168-1923/$ – see front matter © 2012 Elsevier B.V. All rights reserved.ttp://dx.doi.org/10.1016/j.agrformet.2012.12.006
is further subdivided based on mean annual air temperature (Peelet al., 2007), with Mongolia generally dominated by ‘cold-steppe’vegetation, and Northern China by ‘warm desert’. Despite low-regional annual precipitation, the climatic temperature gradientwithin Central Asia exerts a large effect on hydrology and ecosys-tem characteristics as reflected by shrub-desert vegetation in thesouth and taiga and boreal forest vegetation in the north. Pro-
sian forest dynamics to temperature and precipitation indicate highorg/10.1016/j.agrformet.2012.12.006
jected changes in air temperature from climate change may befavorable for forest productivity in the north, but cause increasedsoil moisture limitations in the south. Thus the interactionsbetween temperature and precipitation, and possible increases in

IN PRESSG Model
A
2 Forest Meteorology xxx (2013) xxx– xxx
wgw
oapscoidddigroa
voccci2swltptsStae
mbDpfgygiWcts
1
ta
1
Fig. 1. Study area for the region of Inner Asia (80◦E, 125◦E, 35◦N, 55◦N) illustrating(a) mean annual precipitation, (b) mean annual temperature, and (c) fractional treecover with the locations of the tree ring records. The climate data are 1982–2009annual means from CRU TS 3.1 and the tree cover data are derived from MODIS(Poulter et al., 2011).
ARTICLEGMET-4749; No. of Pages 15
B. Poulter et al. / Agricultural and
ater-use efficiency from elevated CO2 (Penuelas et al., 2011), sug-est a complex response of vegetation dynamics to climate changeithin Inner Asia.
Decadal-scale climate variability and trends have already beenbserved in forest inventory, tree ring, and satellite data to have
strong influence on semi-arid vegetation dynamics. Over theast 40 years, Inner Asia and Northern China have experiencedimultaneously a warming trend (0.04 ◦C yr−1) and decreasing pre-ipitation (Piao et al., 2010a). Large-scale forest mortality has beenbserved in Pinus forests in Southwest China and in Picea forestsn Southern Russia as a consequence of the more frequent recentroughts (Allen et al., 2010; Davi et al., 2006). In addition, satellite-erived observations have shown high ecosystem sensitivity toecadal climate variability, with an increase in desert area dur-
ng the past decade (Jeong et al., 2011; Piao et al., 2005). Dynamiclobal vegetation model (DGVM) results also similarly suggest thatecent droughts have likely weakened the carbon sink strengthf Northern China and Mongolia, although the underlying mech-nisms remain unclear (Piao et al., 2012).
The sensitivity of ecosystem dynamics to contemporary climateariability can provide a constraint for evaluating the responsef ecosystems to future climate change (Babst et al., 2012). Thisonstraint can be especially important for the development, appli-ation and benchmarking of dynamic global vegetation models thatombine biogeography and biogeochemistry to evaluate changesn ecosystems from climate, CO2, and disturbance (Luo et al.,012; Prentice et al., 2007). For example, results from a recenttudy in north–east Asia, where an ensemble of DGVM modelsere forced by contemporary climate (Piao et al., 2010b), revealed
arge differences in the inter-model sensitivity of carbon fluxes toemperature and precipitation. Among the models, simulated netrimary production (NPP) was more sensitive to precipitation thanemperature for the LPJ-DGVM, compared to higher temperatureensitivity for SDGVM, and an intermediate response for ORCHIDEE.uch inter-model differences have large implications for interpre-ing future climate impacts that imply large regional changes in firend biome distributions in the future (Moritz et al., 2012; Scholzet al., 2006).
This study addresses regional-scale patterns of inter-annual cli-ate sensitivity of semi-arid ecosystem productivity in Inner Asia
y comparing satellite and tree ring records of forest dynamics withGVM model simulations. Satellite observations of the fraction ofhotosynthetically active radiation absorbed by vegetation (FPAR)rom 1982 to 2010 provide a long-term record of regional forest andrassland dynamics (at 8-km resolution) and their response to 30ears of monthly climate variability and trends. Variability in treerowth recorded by the formation of annual tree rings providesnsight into seasonal controls of temperature and precipitation.
ith these observations used as benchmarks, we evaluate modeledhanges in transient NPP and annual tree cover for 1982–2010, andhen discuss possible climate impacts from an ensemble of modelimulations for the 21st century.
.1. Hypotheses
The study is designed to test three hypotheses related to ecosys-em dynamics and climate sensitivity in Inner Asia. The hypothesesnd their expected outcomes are:
. Water limitation, and its effect on ecosystem productivity,
Please cite this article in press as: Poulter, B., et al., Recent trends in Inner Asensitivity to climate change. Agric. Forest Meteorol. (2013), http://dx.doi.
becomes gradually more important as mean annual temperatureincreases.a. Vegetation productivity in the southern region of Inner Asia
will be observed to be mainly precipitation limited.
b. Vegetation productivity in the northern region of Inner Asiawill be observed to be mainly temperature limited.
2. Spatial patterns of climate sensitivity will show agreementbetween satellite FPAR and tree growth datasets.a. Based on previous work of Piao et al. (2010b), the observed
high-precipitation sensitivity of the LPJ DGVM will not capturelatitudinal climate-by-vegetation sensitivity gradients.
3. Climate change projections from model simulations will alle-viate temperature limitation on ecosystem productivity in theNorthern region at the expense of increased drought stress inthe Southern region.a. Leaf-level stomatal conductance feedbacks with elevated
sian forest dynamics to temperature and precipitation indicate highorg/10.1016/j.agrformet.2012.12.006
atmospheric CO2 will moderate the response of ecosystemsto drought stress.

ARTICLE IN PRESSG Model
AGMET-4749; No. of Pages 15
B. Poulter et al. / Agricultural and Forest Meteorology xxx (2013) xxx– xxx 3
Table 1Sites, tree species, and length of climatology for tree ring width data. The last column, ‘hypothesized dominant climate response’ refers to the purpose of collection for each site.Sites hypothesized to be temperature and drought sensitive were collected from sites where the dominant signal in radial increment are expected to be either temperatureor drought. Mixed sensitivity refers to the idea that either precipitation or temperature is the dominant constraint on radial increment from year-to-year.
Region Species Time period Reference Hypothesized climate response
Chinaa. Qianshan Pinus tabulaeformis 1900–2003 Chen et al. (2007) No
datab. Shanxihuanglong Pinus tabulaeformis 1900–2002 Cai et al. (2005)c. Ningwu Pinus tabulaeformis 1900–2001 Yi et al. (2006)d. Zgeq Pinus tabulaeformis 1900–2003 Shi et al. (2004)e. XMS Pinus tabulaeformis 1900–2005 Wang et al. (2009a)f. Luoshan Pinus tabulaeformis 1900–2007 Wang et al. (2009b)g. Daqingshan Pinus tabulaeformis 1900–1996 Liu and Ma (1999)h. YISNAS Pinus tabulaeformis 1900–2004 Liang et al. (2007)i. GQNAS Pinus tabulaeformis 1900–2004 Liang et al. (2007)
Mongolia1. Biarum Uul Larix sibirica 1350–2005 Jacoby et al. (2003) Temperature2. Delger Khan Uul Pinus sylvestris 1710–2009 Leland (2011) Mixed3. Dulaan Khan Pinus sylvestris 1653–2008 Leland (2011) Drought4. Hentil Mountain Larix sibirica 996–2002 Cook et al. (2010) Temperature5. Horin Bugatyun Davaa Larix sibirica 1265–1997 D’Arrigo et al. (2000) Temperature6. Khalzan Khamar Larix sibirica 1326–1998 D’Arrigo et al. (2000) Temperature7. Khorgo Lava Larch Larix sibirica 1340–2000 Davi et al. (2006) Drought8. Narstain Davaa Pinus sylvestris 1740–2008 Leland (2011) Mixed9. Onon Gol Larix sibirica 1576–2001 Davi et al. (2013) Drought10. Orkhon Gol Hushree Larix sibirica 1503–2009 Leland (2011) Drought11. Shaamar Mahan Nars Pinus sylvestris 1770–2008 Leland (2011) Drought12. Shoorgobjyun Davaa Pinus sylvestris 1626–2008 Not published Mixed13. Sologotyin Davaa Pinus sibirica 558–1999 D’Arrigo et al. (2001) Temperature14. Under Ulaan Larix sibirica 1510–2002 Davi et al. (2006) Drought
09
00
2
2
Mi(pp1tw3(Amdiwofg(
2
cM(tettt
correlation matrix of the eight climate trends (4 seasons × 2 cli-mate variables), which were first normalized to equal variance.Statistical analysis and data processing were conducted using CDOversion 1.5.5 and R version 2.15.0.
Table 2The eleven global climate model (and model mean) changes in precipitation andtemperature for the study area between 2000 and 2100 (following the normalizationto the CRU TS 3.1 period). The climate projections follow the SRES A2 storyline,which reach a global atmospheric CO2 concentration of 850 ppm in the year 2100.Mean annual air temperature is presently 2.1 ◦C and mean annual temperature is294 mm yr−1.
Climate model Change in precipitationbetween 2000 and2100 (mm yr−1)
Change in temperaturebetween 2000 and2100 (◦C yr−1)
CCCMA CGM 3.1 69.2 4.4CSIRO MK 3.5 43.6 5.1GFDL CM 2.1 6.1 5.1GISS ER 7.0 4.1IPSL CM 4 50.5 5.6MIUB ECHO G 37.5 6.0MPI ECHAM 5 −6.1 5.8NCAR CCSM 3 93.6 5.2
15. Urgun Nars Pinus sylvestris 1714–2016. Zuun Mod Larix sibirica 1582–20
. Methods
.1. Contemporary climate (1982–2009) of Inner Asia
Inner Asia includes the semi-arid regions of northern China,ongolia, and parts of southern Russia, an area encompass-
ng 7.8 million km2 (Fig. 1). Based on the Climatic Research UnitCRU TS 3.1) dataset (Mitchell and Jones, 2005), mean annualrecipitation (for 1982–2009, corresponding to the period overlap-ing the satellite-FPAR record) is 294 mm yr−1, ranging between5 and 996 mm yr−1 across the entire region. About 75% ofhe precipitation occurs in spring and summer (March–August),ith year-to-year variation in summertime precipitation up to
5%. Winter precipitation is typically low and spatially variable3–103 mm yr−1), and snowfall, while low in some parts of Innersia, can elsewhere have an important regional role on the ther-al insulation of soils, surface albedo, and soil moisture recharge
uring spring thaw (Peng et al., 2010; Vaganov et al., 1999). Accord-ng to the CRU TS 3.1 dataset, mean annual air temperature varies
idely across the region (−11.5 ◦C to 15.3 ◦C, with a regional meanf 2.1 ◦C), with growing season temperature (June–August) rangingrom −0.2 ◦C to 31.1 ◦C (mean of 17.6 ◦C). Inter-annual variability ofrowing season temperature is around 12% of the long-term mean1982–2009).
.2. Contemporary climate trends and anomalies
Gridded (0.5 degree) temperature and precipitation trends werealculated for each of four seasons (December–February (DJF),arch–May (MAM), June–August (JJA), and September–November
SON)) using monthly climate data from CRU TS 3.1. Mean seasonalemperature and total seasonal precipitation were calculated for
Please cite this article in press as: Poulter, B., et al., Recent trends in Inner Asensitivity to climate change. Agric. Forest Meteorol. (2013), http://dx.doi.
ach year and then the trend (and its significance) estimated ashe slope from a simple linear regression. To compare with theree ring records, monthly climate anomalies were calculated ashe residual between the long-term monthly mean (1971–2000)
Pederson et al. (2001) DroughtPederson et al. (2001) Drought
and the observed monthly value. The monthly climate anomalieswere then detrended with a cubic polynomial spline (with a fre-quency cut-off of 0.5) and used to compare with annual (detrended)tree-ring growth anomalies over the same time period (see Section2.4). The detrending was performed to remove long-term trends inclimate (and tree growth) that might inflate correlations betweeninter-annual climate and tree growth. Principal components anal-ysis (PCA) was used to determine the spatial pattern, and relativeimportance, of the individual seasonal climate trends for threedifferent time periods (1982–1990, 1991–2000, 2001–2009) andthe long-term trend (1982–2009). The PCA was conducted on the
sian forest dynamics to temperature and precipitation indicate highorg/10.1016/j.agrformet.2012.12.006
NCAR PCM 1 30.1 3.2UKMO HADCM3 60.6 5.5UKMO HADGEM1 58.0 5.2Model mean 40.9 5.0

ARTICLE IN PRESSG Model
AGMET-4749; No. of Pages 15
4 B. Poulter et al. / Agricultural and Forest Meteorology xxx (2013) xxx– xxx
Table 3Loadings of the seasonal climate trends on the first 3 principal components (PCA) for each time period. For each PCA, the proportional variance (v) is also shown, typically,the cumulative variance explained by the first 3 components was ∼0.6 for each time period. Bold-faced loading numbers indicate dominant climate trend (loading > 0.5).
Variables and time period PC1 PC2 PC31982–1990 (PC1v = 0.24, PC2v = 0.19, PC3v = 0.18)
Temperaturetrend
DJF −0.05 −0.03 0.68MAM 0.43 −0.38 −0.19JJA −0.04 −0.65 0.24SON −0.44 −0.39 −0.37
Precipitationtrend
DJF 0.45 0.38 0.06MAM −0.54 0.31 0.05JJA −0.05 0.17 −0.52SON −0.34 0.07 0.17
1991–2000 (PC1v = 0.33, PC2v = 0.19, PC3v = 0.17)Temperaturetrend
DJF −0.53 −0.09 −0.07MAM −0.39 0.08 −0.13JJA −0.4 −0.27 0.38SON −0.5 −0.17 −0.1
Precipitationtrend
DJF 0.07 0.55 0.01MAM −0.13 0.6 0.37JJA 0.02 0.04 −0.8SON −0.36 0.48 −0.21
2000–2010 (PC1v = 0.33, PC2v = 0.16, PC3v = 0.15)Temperaturetrend
DJF −0.5 −0.07 0.04MAM −0.46 −0.11 −0.4JJA −0.47 0.17 0.14SON −0.46 −0.12 0.26
Precipitationtrend
DJF −0.23 −0.23 −0.03MAM 0.05 0.1 0.82JJA −0.03 −0.71 0.25SON 0.23 −0.61 −0.1
2001–2010 (PC1v = 0.28, PC2v = 0.19, PC3v = 0.15)Temperaturetrend
DJF −0.46 −0.27 0.34MAM −0.54 −0.05 −0.24JJA −0.4 0.34 −0.16SON −0.56 −0.01 0.26
Precipitationtrend
DJF 0.04 −0.37 −0.39MAM 0.12 −0.24 0.65
2
ag(TraTkptsdwmcvmresia
JJA 0.04
SON −0.12
.3. Trends and sensitivity in satellite FPAR to climate
FPAR remote sensing data were derived from the 3rd Gener-tion Normalized Difference Vegetation Index (GIMMS NDVI3g)enerated from the Advanced Very High Resolution RadiometersAVHRR) onboard a series of NOAA satellites (Zhu et al., 2012;ucker et al., 2005). This satellite product uses an artificial neu-al network to calculate AVHRR-FPAR values from AVHRR-NDVInd land-cover type using MODIS-FPAR as the training dataset.he resulting product has 15-day temporal resolution with 8-m spatial resolution for the time period 1982–2010. From thisroduct, we generated a maximum monthly composite to retainhe highest quality monthly FPAR observations, and then sea-onal means were estimated for DJF, MAM, JJA, and SON. Theecadal and long-term seasonal trends (1982–2010, and decadesithin this period) and their statistical significance were esti-ated for each grid cell using simple linear regression. Pearson
orrelations were calculated between the JJA detrended FPARalues and the monthly-detrended climate residuals for an 18-onth window. The correlations between the climate and tree
ing residuals were based on the 1982–2009 time period. To
Please cite this article in press as: Poulter, B., et al., Recent trends in Inner Asensitivity to climate change. Agric. Forest Meteorol. (2013), http://dx.doi.
valuate climate drivers responsible for FPAR trends, the Pear-on correlation coefficient was calculated between the trendsn FPAR with the each of the eight eigenvectors from the PCAnalysis.
−0.67 0.02−0.4 −0.41
2.4. Sensitivity of tree growth to climate
The tree ring records include data from the International TreeRing Database (ITRDB), and both published and unpublished col-lections from a total of 25 sites (see Table 1 for complete listing).For all datasets used in this study, the raw ring widths werecross-dated and re-standardized using methods including powertransformation to stabilize variance (Cook and Kairiukstis, 1990).Data from low-density forest stands originally collected for climatereconstruction were ‘conservatively standardized’ using negativeexponential, negative linear, or straight-line curves using the pro-gram ARSTAN (Cook, 1985) to preserve as much low-frequencyvariation as possible. Collections from more closed-canopy forestsin Mongolia (Delger Khan Uul, Narstyin Davaa, and ShoorgobjyunDavaa), where tree competition and stand dynamics can signifi-cantly influence radial growth, were detrended a second time usingthe Friedman Super Smoother (Friedman, 1984), a data-adaptiveflexible curve that adapts ‘locally’ to abrupt changes in ring widththat resemble ecological processes and not climatic variation. Theresulting indices of radial increment were combined into a robustmean chronology for each site (n ∼= 15–20 trees per site).
sian forest dynamics to temperature and precipitation indicate highorg/10.1016/j.agrformet.2012.12.006
To determine the climate sensitivity of tree ring chronolo-gies, residuals were calculated from the standard chronology (thechronology with growth trends removed) relative to a 1971–2000mean baseline, the same baseline used to estimate the CRU TS 3.1
ARTICLE IN PRESSG Model
AGMET-4749; No. of Pages 15
B. Poulter et al. / Agricultural and Forest Meteorology xxx (2013) xxx– xxx 5
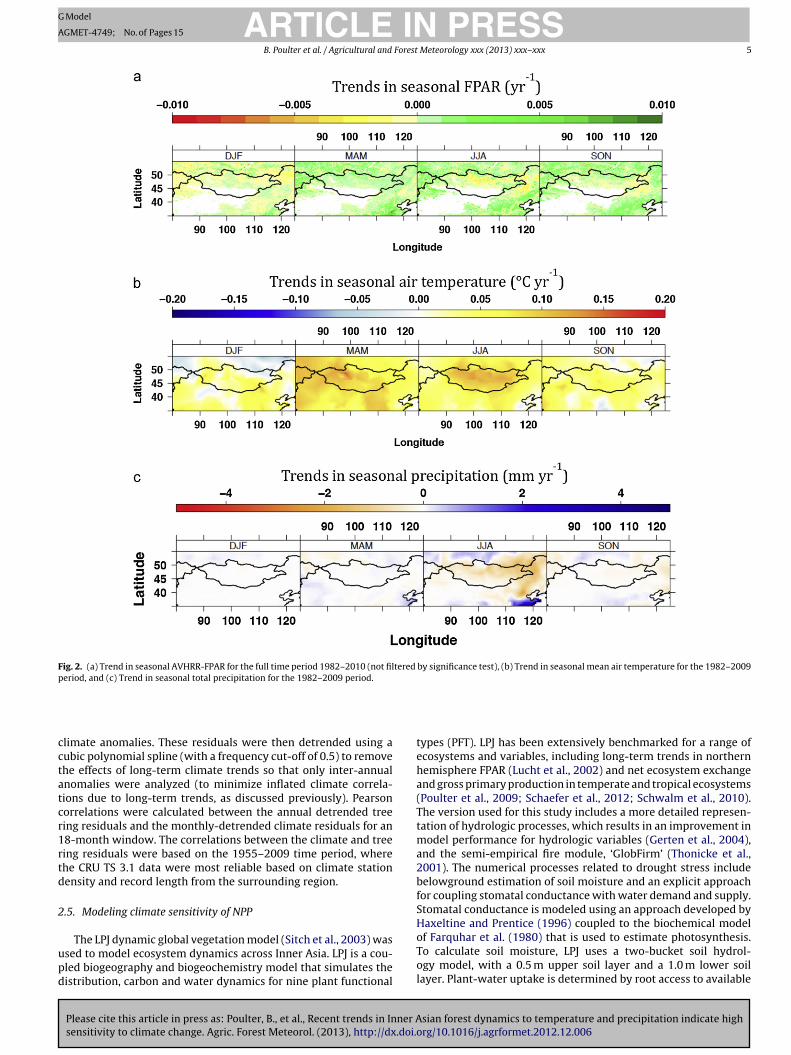
Fig. 2. (a) Trend in seasonal AVHRR-FPAR for the full time period 1982–2010 (not filtered by significance test), (b) Trend in seasonal mean air temperature for the 1982–2009period, and (c) Trend in seasonal total precipitation for the 1982–2009 period.
cctatcr1rtd
2
upd
limate anomalies. These residuals were then detrended using aubic polynomial spline (with a frequency cut-off of 0.5) to removehe effects of long-term climate trends so that only inter-annualnomalies were analyzed (to minimize inflated climate correla-ions due to long-term trends, as discussed previously). Pearsonorrelations were calculated between the annual detrended treeing residuals and the monthly-detrended climate residuals for an8-month window. The correlations between the climate and treeing residuals were based on the 1955–2009 time period, wherehe CRU TS 3.1 data were most reliable based on climate stationensity and record length from the surrounding region.
.5. Modeling climate sensitivity of NPP
Please cite this article in press as: Poulter, B., et al., Recent trends in Inner Asensitivity to climate change. Agric. Forest Meteorol. (2013), http://dx.doi.
The LPJ dynamic global vegetation model (Sitch et al., 2003) wassed to model ecosystem dynamics across Inner Asia. LPJ is a cou-led biogeography and biogeochemistry model that simulates theistribution, carbon and water dynamics for nine plant functional
types (PFT). LPJ has been extensively benchmarked for a range ofecosystems and variables, including long-term trends in northernhemisphere FPAR (Lucht et al., 2002) and net ecosystem exchangeand gross primary production in temperate and tropical ecosystems(Poulter et al., 2009; Schaefer et al., 2012; Schwalm et al., 2010).The version used for this study includes a more detailed represen-tation of hydrologic processes, which results in an improvement inmodel performance for hydrologic variables (Gerten et al., 2004),and the semi-empirical fire module, ‘GlobFirm’ (Thonicke et al.,2001). The numerical processes related to drought stress includebelowground estimation of soil moisture and an explicit approachfor coupling stomatal conductance with water demand and supply.Stomatal conductance is modeled using an approach developed byHaxeltine and Prentice (1996) coupled to the biochemical model
sian forest dynamics to temperature and precipitation indicate highorg/10.1016/j.agrformet.2012.12.006
of Farquhar et al. (1980) that is used to estimate photosynthesis.To calculate soil moisture, LPJ uses a two-bucket soil hydrol-ogy model, with a 0.5 m upper soil layer and a 1.0 m lower soillayer. Plant-water uptake is determined by root access to available
ARTICLE IN PRESSG Model
AGMET-4749; No. of Pages 15
6 B. Poulter et al. / Agricultural and Forest Meteorology xxx (2013) xxx– xxx
F for tt mer di
stpplsasdvs(cs
fcCt1cwFmic(oSgbP
TS(cc
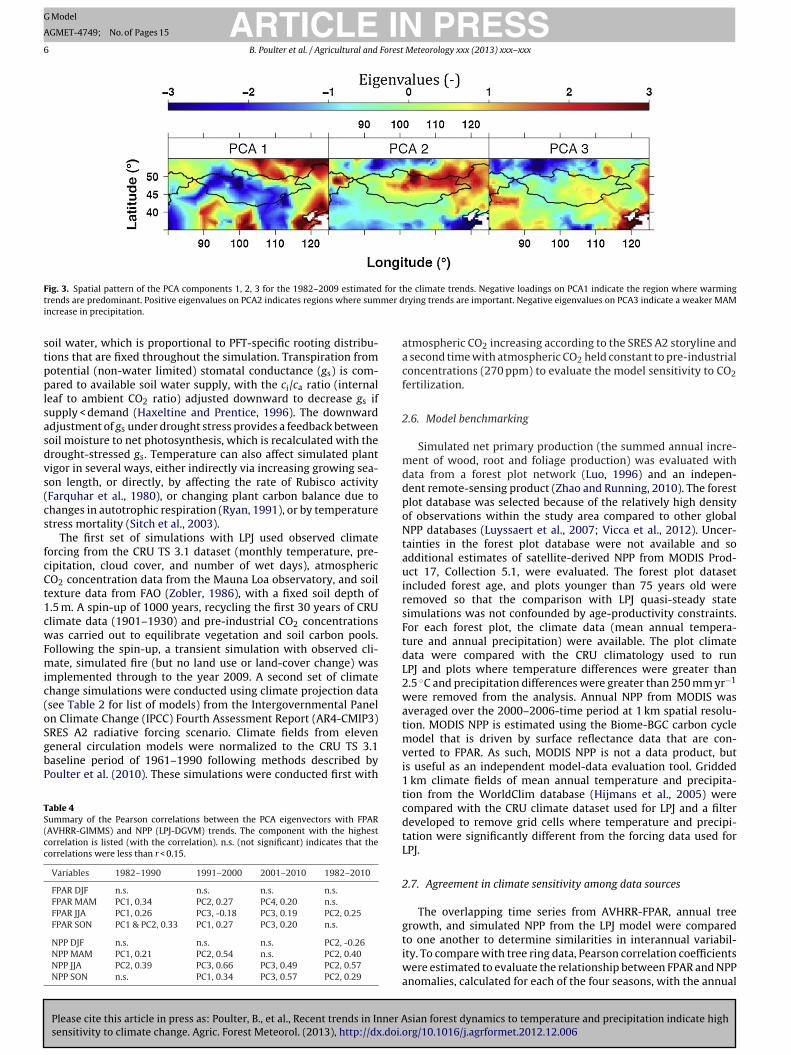
ig. 3. Spatial pattern of the PCA components 1, 2, 3 for the 1982–2009 estimatedrends are predominant. Positive eigenvalues on PCA2 indicates regions where sumncrease in precipitation.
oil water, which is proportional to PFT-specific rooting distribu-ions that are fixed throughout the simulation. Transpiration fromotential (non-water limited) stomatal conductance (gs) is com-ared to available soil water supply, with the ci/ca ratio (internal
eaf to ambient CO2 ratio) adjusted downward to decrease gs ifupply < demand (Haxeltine and Prentice, 1996). The downwarddjustment of gs under drought stress provides a feedback betweenoil moisture to net photosynthesis, which is recalculated with therought-stressed gs. Temperature can also affect simulated plantigor in several ways, either indirectly via increasing growing sea-on length, or directly, by affecting the rate of Rubisco activityFarquhar et al., 1980), or changing plant carbon balance due tohanges in autotrophic respiration (Ryan, 1991), or by temperaturetress mortality (Sitch et al., 2003).
The first set of simulations with LPJ used observed climateorcing from the CRU TS 3.1 dataset (monthly temperature, pre-ipitation, cloud cover, and number of wet days), atmosphericO2 concentration data from the Mauna Loa observatory, and soilexture data from FAO (Zobler, 1986), with a fixed soil depth of.5 m. A spin-up of 1000 years, recycling the first 30 years of CRUlimate data (1901–1930) and pre-industrial CO2 concentrationsas carried out to equilibrate vegetation and soil carbon pools.
ollowing the spin-up, a transient simulation with observed cli-ate, simulated fire (but no land use or land-cover change) was
mplemented through to the year 2009. A second set of climatehange simulations were conducted using climate projection datasee Table 2 for list of models) from the Intergovernmental Paneln Climate Change (IPCC) Fourth Assessment Report (AR4-CMIP3)
Please cite this article in press as: Poulter, B., et al., Recent trends in Inner Asensitivity to climate change. Agric. Forest Meteorol. (2013), http://dx.doi.
RES A2 radiative forcing scenario. Climate fields from eleveneneral circulation models were normalized to the CRU TS 3.1aseline period of 1961–1990 following methods described byoulter et al. (2010). These simulations were conducted first with
able 4ummary of the Pearson correlations between the PCA eigenvectors with FPARAVHRR-GIMMS) and NPP (LPJ-DGVM) trends. The component with the highestorrelation is listed (with the correlation). n.s. (not significant) indicates that theorrelations were less than r < 0.15.
Variables 1982–1990 1991–2000 2001–2010 1982–2010
FPAR DJF n.s. n.s. n.s. n.s.FPAR MAM PC1, 0.34 PC2, 0.27 PC4, 0.20 n.s.FPAR JJA PC1, 0.26 PC3, -0.18 PC3, 0.19 PC2, 0.25FPAR SON PC1 & PC2, 0.33 PC1, 0.27 PC3, 0.20 n.s.
NPP DJF n.s. n.s. n.s. PC2, -0.26NPP MAM PC1, 0.21 PC2, 0.54 n.s. PC2, 0.40NPP JJA PC2, 0.39 PC3, 0.66 PC3, 0.49 PC2, 0.57NPP SON n.s. PC1, 0.34 PC3, 0.57 PC2, 0.29
he climate trends. Negative loadings on PCA1 indicate the region where warmingrying trends are important. Negative eigenvalues on PCA3 indicate a weaker MAM
atmospheric CO2 increasing according to the SRES A2 storyline anda second time with atmospheric CO2 held constant to pre-industrialconcentrations (270 ppm) to evaluate the model sensitivity to CO2fertilization.
2.6. Model benchmarking
Simulated net primary production (the summed annual incre-ment of wood, root and foliage production) was evaluated withdata from a forest plot network (Luo, 1996) and an indepen-dent remote-sensing product (Zhao and Running, 2010). The forestplot database was selected because of the relatively high densityof observations within the study area compared to other globalNPP databases (Luyssaert et al., 2007; Vicca et al., 2012). Uncer-tainties in the forest plot database were not available and soadditional estimates of satellite-derived NPP from MODIS Prod-uct 17, Collection 5.1, were evaluated. The forest plot datasetincluded forest age, and plots younger than 75 years old wereremoved so that the comparison with LPJ quasi-steady statesimulations was not confounded by age-productivity constraints.For each forest plot, the climate data (mean annual tempera-ture and annual precipitation) were available. The plot climatedata were compared with the CRU climatology used to runLPJ and plots where temperature differences were greater than2.5 ◦C and precipitation differences were greater than 250 mm yr−1
were removed from the analysis. Annual NPP from MODIS wasaveraged over the 2000–2006-time period at 1 km spatial resolu-tion. MODIS NPP is estimated using the Biome-BGC carbon cyclemodel that is driven by surface reflectance data that are con-verted to FPAR. As such, MODIS NPP is not a data product, butis useful as an independent model-data evaluation tool. Gridded1 km climate fields of mean annual temperature and precipita-tion from the WorldClim database (Hijmans et al., 2005) werecompared with the CRU climate dataset used for LPJ and a filterdeveloped to remove grid cells where temperature and precipi-tation were significantly different from the forcing data used forLPJ.
2.7. Agreement in climate sensitivity among data sources
The overlapping time series from AVHRR-FPAR, annual treegrowth, and simulated NPP from the LPJ model were compared
sian forest dynamics to temperature and precipitation indicate highorg/10.1016/j.agrformet.2012.12.006
to one another to determine similarities in interannual variabil-ity. To compare with tree ring data, Pearson correlation coefficientswere estimated to evaluate the relationship between FPAR and NPPanomalies, calculated for each of the four seasons, with the annual

ARTICLE IN PRESSG Model
AGMET-4749; No. of Pages 15
B. Poulter et al. / Agricultural and Forest Meteorology xxx (2013) xxx– xxx 7
Fig. 4. Representative climate sensitivity of annual tree growth for a temperature sensitive (site 1), precipitation sensitive (site 10), and mixed sensitivity site (site 12).Previous year climate is represented in lower case letters (indicating month) and current year climate in upper case letters. The site ID refers to the locations in Fig. 1cand Table 1. Temperature correlations on the left panel (gray bars indicate significant correlation, p < 0.1), precipitation correlations on the right panel (black bars indicates
aw
3
3
(a(tii(wd
ignificant correlation, p < 0.1).
nomalies of the tree ring data. The significance of the correlationas compared to an alpha value of 0.1.
. Results
.1. Regional trends in greening and climate
Between 1982 and 2010, spring and summer seasonal FPARMAM, JJA) showed a greening trend in 6.2–7.5% of the region,
browning trend in 2.6–3.9% of the region, and non-significantp > 0.1) trends in the remainder of the study area (Fig. 2a). Much ofhe long-term greening trend was found outside of Inner Mongolian the southern or northern portions of Inner Asia, with the brown-
Please cite this article in press as: Poulter, B., et al., Recent trends in Inner Asensitivity to climate change. Agric. Forest Meteorol. (2013), http://dx.doi.
ng trend more prominent in central Mongolia in JJA and SONFig. 2a). The magnitude of the long-term greening FPAR trendsas relatively small (∼0.001–0.002 units yr−1) compared to theecadal trends, which also exhibited spatially variable hotspots
of greening and browning between each decade. For example,MAM and JJA greening trends were largest between 1982 and 1990(7.2–8.5% of region greened, ∼0.007–0.009 yr−1), declining slightlyin 1991–2000 (5.0–7.4%, ∼0.006–0.007 yr−1), and again for the2001–2010 period (4.4–7.8%, ∼0.006–0.009 yr−1). Over the samedecadal periods, the area and rate of browning tended to increase,from 1.6–2.7% (1982–1990) to 2.7–5.1% (1991–2000), to 2.2–5.6%(2001–2010), with the change in FPAR browning increasing from0.002 to 0.007 yr−1.
The difference between the decadal and the 30-year trendsappears to be driven by short-term climate variation followedby rapid ecosystem recovery versus longer-term climate changeand ecosystem response. For example, the 30-year change in
sian forest dynamics to temperature and precipitation indicate highorg/10.1016/j.agrformet.2012.12.006
annual air temperature of 0.04 ◦C yr−1 masks large seasonal andinter-decadal variability (Fig. 2b). Long-term (1982–2009) MAM(0.076 ◦C yr−1) and JJA (0.059 ◦C yr−1) warming was larger thanthe mean annual trend. Decadal trends for MAM and JJA were

ARTICLE IN PRESSG Model
AGMET-4749; No. of Pages 15
8 B. Poulter et al. / Agricultural and Forest Meteorology xxx (2013) xxx– xxx
F ng netM d clima
apao
TCe
ig. 5. Average correlations (where ̨ < 0.1) of tree growth, across the entire tree riongolia sites (top panel) and Chinese sites (lower panel). The mean tree growth an
temperature response (see Table 5).
◦ −1 ◦ −1
Please cite this article in press as: Poulter, B., et al., Recent trends in Inner Asensitivity to climate change. Agric. Forest Meteorol. (2013), http://dx.doi.
s high as 0.15 C yr and 0.12 C yr in 1991–2000. Trends inrecipitation showed similar seasonal and inter-decadal variabilitys temperature (Fig. 2c). A long-term decreasing precipitation trendf −0.07 mm yr−1, was observed, mainly related to a decrease in JJA
able 5limate summary (mean for 1971–2000 period) for the tree ring sites and hypothesized sither precipitation or temperature constrains tree growth from year-to-year. These sites
Site ID (Fig. 1c and Table 1) Mean annual temperature (◦C)
a 8.2
b 11.5
c 4.4
d 8.0
e 5.9
f 7.6
g 5.6
h 2.2
i 1.9
1 −4.6
2 0.7
3 −0.3
4 −4.6
5 −6.1
6 −9.1
7 −6.0
8 −1.0
9 −1.6
10 −2.8
11 0.7
12 −2.7
13 −7.1
14 −1.9
15 −2.1
16 −1.9
work, with monthly temperature (left panel) and precipitation (right panel) for allate response is mainly a precipitation response, with 4 sites in Mongolia exhibiting
−1
sian forest dynamics to temperature and precipitation indicate highorg/10.1016/j.agrformet.2012.12.006
rainfall (−0.25 mm yr ). However, JJA precipitation patterns fluc-tuated noticeably on decadal scales (and spatially), at the regionalscale, ranging from +0.46 mm yr−1 (1982–1990) to −0.48 mm yr−1
(1991–2000) and +0.49 mm yr−1 (2001–2010).
ensitivity to temperature and precipitation. Mixed sensitivity refers to the idea that are likely to be more representative of non-treeline or forest border sites.
Mean annual precipitation (mm yr−1) Dominant climate sensitivity
703.3 Precipitation518.8 Precipitation452.5 Precipitation362.7 Precipitation367.4 Precipitation271.8 Precipitation315.9 Precipitation320.8 Precipitation308.6 Precipitation
246.6 Temperature363.5 Precipitation353.5 Precipitation344.3 Mixed282.3 Temperature343.2 Temperature280.5 Precipitation290.3 Precipitation335.3 Precipitation306.8 Precipitation363.5 Precipitation352.6 Mixed264.5 Temperature377.3 Precipitation332.7 Mixed277.3 Precipitation

IN PRESSG Model
A
Forest Meteorology xxx (2013) xxx– xxx 9
1ntwecsPplpab
temiM1poStpip
3
cmacTmnct
aptschwM((c(tibmh
c(hCwt
Fig. 6. Mean correlations across all tree ring sites between annual tree growth
ARTICLEGMET-4749; No. of Pages 15
B. Poulter et al. / Agricultural and
The dominant spatial features of climate trends in the982–2009-time period were captured by PCA (Fig. 3), with theegative eigenvalues associated with PC1 combined with nega-ive temperature loadings (Table 3) indicating the region wherearming trends are predominant. The spatial pattern of positive
igenvalues for PC2 (with negative loadings for precipitation) indi-ates regions where summer drying trends are important andpatially coherent with JJA drying (over 1982–2010), whereasC3 negative eigenvalues indicate a weaker MAM increase inrecipitation (positive MAM loadings). However, the low corre-
ation between the PCA loadings and trends in FPAR suggest thatrocesses beyond the direct influence of climate (i.e., possibly inter-ctions with land use) are playing a role on vegetation greening androwning.
The PCA loadings (Table 3) were also found to be sensitiveo the time period that the climate trends represented. In gen-ral, DJF temperature trends and MAM precipitation trends wereost important for the decadal climate trend loadings. In compar-
son, over the longer time period, MAM temperature trends andAM and JJA precipitation trends had the highest loadings for the
982–2010-time period. Correlations between the first three com-onents and the seasonal FPAR trends (Table 4) suggest (1) thatnly growing season FPAR trends (MAM and JJA, and occasionally,ON) are related to climate variability and (2) that decadal correla-ions with climate are driven mainly by temperature (r = 0.19–0.34,
< 0.1), whereas the long-term trend in growing season FPARs determined by long-term trends in JJA precipitation (r = 0.25,
< 0.1).
.2. Climate sensitivity of tree growth and AVHRR-FPAR
The tree ring collection sites were grouped a priori into threeategories defined by hypothesized tree-growth sensitivity to cli-ate regime (i.e., precipitation, temperature, or mixed; Fig. 4
nd Table 1). For example, expected drought-sensitive trees wereollected at the forest-steppe/grassland or lower forest border.emperature-sensitive sites were collected at the upper forest orountain-top tree line. Trees with mixed climatic sensitivity (i.e.,
o single climatic factor dominates annual radial increment) wereollected from the forest interior and not at expected drought oremperature sensitive locations.
For data interpretation, precipitation sensitive sites were char-cterized by positive correlations between tree growth andrecipitation and negative correlations between tree growth andemperature during the growing season. Temperature sensitiveites were characterized by positive temperature and tree growthorrelations in the growing season. Mixed climate sensitivity sitesad positive correlations for both temperature and for precipitationith tree growth. As hypothesized in Table 1, out of the 16 sites inongolia (Fig. 5a and b) nine were mainly precipitation sensitive
2, 3, 7, 8, 9, 10, 11, 14, 16), four were temperature sensitive sites1, 5, 6, 13), and three were mixed sensitivity sites (4, 12, 15). Inomparison, all nine sites in China were precipitation sensitiveFig. 5c and d). June and July precipitation and temperature tendedo have the highest correlation with tree growth; winter precip-tation was not well correlated for most of the sites (most likelyecause winter precipitation is very low), but previous year sum-er climate (both precipitation and temperature) showed similarly
igh correlations to current year (Fig. 5).Compared to the seasonal AVHRR time series data, JJA-FPAR
orrelations with annual tree growth were highest in Mongoliaranging from 0.13 to 0.7, p < 0.1), and MAM-FPAR correlations were
Please cite this article in press as: Poulter, B., et al., Recent trends in Inner Asensitivity to climate change. Agric. Forest Meteorol. (2013), http://dx.doi.
ighest in China (Fig. 6). These correlations confirm that for thehinese sites, tree growth is optimized in the cooler spring seasonhen atmospheric water demand is lower, whereas in Mongolia,
ree growth is driven by the JJA season. The lowest AVHRR-FPAR
anomalies and seasonal AVHRR-FPAR anomalies from correlations between timeseries from 1982 to 2010. For Mongolia, tree growth correlated most strongly withJJA-FPAR, whereas for China, the correlation was also high in the MAM season.
and tree ring correlations were at sites 6 and 13, which were tem-perature sensitive sites (Table 5), and at sites 4 and 15, which weremixed-climate sensitive sites (Table 5). These same sites also dis-played much lower inter-annual variability in tree growth that wasinconsistent with large inter-annual variability in the AVHRR-FPARdata. It is possible that for these sites, the tree ring collections werenot representative of the AVHRR-averaging window of 8-km, orthat dampened inter-annual variability in radial growth was tooweak of a signal to be measured by AVHRR.
For the AVHRR-FPAR climate sensitivities, the mean siteresponse for both Mongolia and China showed negative cor-relations with growing season air temperature and positivecorrelations with growing season precipitation–indicating precip-itation as the main control on AVHRR-FPAR. However, in contrastto the tree ring and model correlations, AVHRR-FPAR did not haveas clear patterns in precipitation correlations, with late growingseason precipitation (months 6 and later) and AVHRR-FPAR corre-lations insignificant.
3.3. Model benchmarking and climate sensitivity of LPJ
Across the forest validation plot database, annual NPP (fil-tered by climate correspondence between observed and modeled)was estimated at 475.6 ± 158.9 gC m−2 for the plot database,390.6 ± 85.2 gC m−2 for MODIS, compared to 521.2 ± 79.3 gC m−2
for LPJ, with the uncertainty representing spatial heterogeneity. At
sian forest dynamics to temperature and precipitation indicate highorg/10.1016/j.agrformet.2012.12.006
the regional level, MODIS was statistically different to the obser-vations (2-sided t-test, p = 0.01), but for LPJ and the plot-level NPPcomparison, the NPP estimates were statistically similar (2-sidedt-test, p > 0.1). At the plot level, however, correlations between

ARTICLE IN PRESSG Model
AGMET-4749; No. of Pages 15
10 B. Poulter et al. / Agricultural and Forest Meteorology xxx (2013) xxx– xxx
Fig. 7. Benchmarking of the LPJ-DGVM with a forest plot inventory and MODIS-derived NPP estimates. The upper row compares modeled NPP with the climate-filtered forestp risonp
msNcbhtcaaraab
dbwatrmmnttdltF
lots. The middle and lower rows investigate trends in the residual for each compaerformance with the data benchmark is affected mainly by random errors.
odeled and observed annual NPP (Fig. 7, upper row) were notignificant for either LPJ or MODIS linear regressions with plotPP (p > 0.1). In contrast, LPJ and MODIS NPP were significantlyorrelated with one another (p < 0.05, R2 = 0.39). The agreementetween models suggests that the observed NPP data may haveigh uncertainties preventing a close model-data agreement orhat the patchy distribution of forest stands is problematic inomparison to the grain (grid cell size) of the remote sensingnd modeling data. This conclusion is partially supported by annalysis of the model-data residuals (Fig. 7, middle and lowerows) that do not show significant correlations with temper-ture or precipitation and indicate no particular model biascross the study region but rather random errors resulting fromenchmarking data sources.
The LPJ simulations resulted in a present-day PFT distributionominated by boreal needleleaf evergreen and a smaller fraction oforeal broadleaf summergreen trees and C3 (photosynthetic path-ay) grasses. Within the LPJ DGVM framework, boreal PFTs have
n optimal daily temperature for photosynthesis ranging from 10o 15 ◦C and are able to establish in climate zones where 20-yearunning mean monthly temperature is <2 ◦C. Trends in seasonalodeled NPP showed remarkably similar correlations with the cli-ate PCA eigenvectors to those of AVHRR-FPAR, but with some
otable differences (Table 3). For example, the LPJ-NPP correla-ions with the climate PCA components tended to be larger thanhe AVHRR-FPAR correlations, which is partly due to do the CRU
Please cite this article in press as: Poulter, B., et al., Recent trends in Inner Asensitivity to climate change. Agric. Forest Meteorol. (2013), http://dx.doi.
ata being used as the climate forcing, but could also indicate aarger model NPP sensitivity to climate than the FPAR sensitivityo climate or the importance of non-climatic factors on AVHRR-PAR variability. In principle, FPAR is linearly related with NPP
with climate. No significant bias is detected in the residuals indicating that model
(Potter et al., 2003), and while a similar directional response forAVHRR-FPAR and LPJ-NPP to climate would be expected, differ-ences in their sensitivity to climate might also be arise. For the1982–2010 period, the seasonal NPP trends correlated highest withPC2, indicating that negative trends in winter, spring and summerprecipitation were having a large effect on simulated annual NPP.PC1, which had high loadings for all seasonal temperature trends,was not highly correlated with any of the seasonal LPJ-NPP trendsduring 1982–2010, indicating low model sensitivity to temperaturerelative to precipitation.
Compared to the climate sensitivity of representative tree-ringsites (Fig. 4), the LPJ annual NPP sensitivity to precipitation was alsomuch higher, causing all sites (except site 6, which was tempera-ture sensitive for simulated LPJ-NPP) to be precipitation sensitivefor LPJ-NPP. The precipitation sensitivity of LPJ modeled NPP isclearly shown by the positive correlations between growing sea-son precipitation and NPP and negative correlations with growingseason temperature and NPP for both Mongolia and China (Fig. 8).These modeling results contrast with more mixed climate sensitiv-ity of the Mongolian tree ring sites (Fig. 5). Interestingly, a positivetemperature correlation with autumn temperature (September andOctober) and NPP was observed for the Mongolian and Chinesesites (Fig. 9), suggesting that the equations governing NPP in LPJ areresponding to temperature trends by possibly increasing growingseason length.
Correlations between the time series of seasonal modeled-NPP
sian forest dynamics to temperature and precipitation indicate highorg/10.1016/j.agrformet.2012.12.006
and annual tree growth also indicated highest correlations in theJJA season for Mongolia (similar with AVHRR-FPAR and tree ringcorrelations) and ranged from 0.31 to 0.62. The lowest model-datacorrelations were found for the mixed climate and temperature

ARTICLE IN PRESSG Model
AGMET-4749; No. of Pages 15
B. Poulter et al. / Agricultural and Forest Meteorology xxx (2013) xxx– xxx 11
F e sams xed (s
strg
3
2eNitwNtdmht
ig. 8. Modeled-NPP correlations with monthly temperature and precipitation for thensitivity (or bias) for all three sites, including the temperature (site 1) and the mi
ensitive sites. For China, the higher correlations were also shiftedo the MAM period, as was observed with the AVHRR-FPAR and treeing correlations and ranged from 0.23 to 0.43 for the March–Mayrowing season in China.
.4. Climate projections
Average simulated regional NPP for 1991–2000 was81.7 g C m−2 yr−1 (±10.8 g C m−2 yr−1) for the 11 GCM mod-ls. By 2100 (referring to an averaging period 2091–2098),PP had increased by 35–80% for all climate projections, with
ncreasing CO2, to 454.8 g C m−2 yr−1 (±38.8 g C m−2 yr−1). Inhe absence of a CO2 fertilization effect on photosynthesis andater-use efficiency since the industrial revolution, 1991–2000PP was 234.4 g C m−2 yr−1 (±10.7 g C m−2 yr−1), and decreased
o 209.7 g C m−2 yr−1 (±10.8 g C m−2 yr−1) by 2100 (up to a 28%
Please cite this article in press as: Poulter, B., et al., Recent trends in Inner Asensitivity to climate change. Agric. Forest Meteorol. (2013), http://dx.doi.
ecrease, but with two models showing a ∼5% increase. Theseodels were the NCAR-CCSM3 and NCAR-PCM1, which had the
ighest precipitation increase and lowest temperature change ofhe 11 GCM projections, respectively (Table 2).
e representative sites as in Fig. 4. Compared to Fig. 4, LPJ shows strong precipitationite 12) sensitivity sites.
The response of NPP to future climate is mainly a question ofCO2 fertilization and its direct effect on enhancing photosynthe-sis, especially in interaction with rising air temperatures, and itsindirect effect on water-savings by reducing stomatal conductancerelative to carbon uptake (i.e., water-use efficiency). As can be seenin Fig. 10, the rate of increase in NPP between 1901 and 2098is completely dependent on elevated CO2, with all pre-industrialCO2 climate change scenarios showing deleterious climate effectson plant productivity. The greater difference between the pre-industrial and elevated CO2 simulations in the northeastern regionof China and parts of northwestern Mongolia suggests a stronginfluence by temperature change on productivity. In northeastChina, increased temperature likely decreases plant productiv-ity through high rates of autotrophic respiration, but in partsof northwestern Mongolia, we simulated a net decrease in treecover (and FPAR) due to dieback of boreal PFTs and a slow rate
sian forest dynamics to temperature and precipitation indicate highorg/10.1016/j.agrformet.2012.12.006
of invasion from temperate PFT tree cover (Fig. 10). Fire emissionsdecreased in the northwestern region of Mongolia where net veg-etation cover decreased, but elsewhere, fire emissions increasedbecause of higher fuel loading from increased NPP (Fig. 10). For

ARTICLE IN PRESSG Model
AGMET-4749; No. of Pages 15
12 B. Poulter et al. / Agricultural and Forest Meteorology xxx (2013) xxx– xxx
Fig. 9. Average correlations of modeled NPP with monthly temperature (left panel) and precipitation (right panel) for all Mongolia sites (top panel) and Chinese sites (lowerp y for
m preci
pmsM
4
dapidcwgtiFhswtpntr
iP
anel). This figure is comparable to Fig. 5, which shows the mean climate sensitivitainly in the non-growing season. The mean NPP and climate response is mainly a
re-industrial CO2, the modeled trends in fire emissions generallyatched those trends for decreasing NPP, with decreasing emis-
ions over most of the region except for some regions of Northernongolia.
. Discussion
Throughout Inner Asia, mean annual temperature tends toecrease with increasing latitude and thus changes in air temper-ture from climate change may be expected to increase ecosystemroductivity in predictable ways. However, in semi-arid systems,
nteractions between precipitation and CO2 may either enhance orampen these potential warming ecosystem feedbacks. This studyonfirms that precipitation variability and its trends exert an over-helming climatic role in determining inter-annual variability in
reenness, tree growth, and whole-ecosystem NPP. As expected,he warmer sites in northern China showed strong sensitivity ofnter-annual tree growth and of simulated NPP to precipitation.urther, and perhaps more surprisingly, precipitation limitationsad an almost equally strong role in the cooler, northern Mongoliaites, with temperature sensitive sites only occurring for 3 locationshere mean annual temperature was <−4.6 to −9.1 ◦C (Table 5). For
he original hypothesis, these observations did not strongly sup-ort temperature limitation as a control on forest dynamics of theorthern arid-steppe vegetation, and rather, precipitation appearso be the dominant control on forest productivity across the entire
Please cite this article in press as: Poulter, B., et al., Recent trends in Inner Asensitivity to climate change. Agric. Forest Meteorol. (2013), http://dx.doi.
egion.Trends in AVHRR-FPAR revealed large inter-decadal variabil-
ty, as observed by previous work in Inner Asia (Piao et al., 2005;otter et al., 2007). However, from decade to decade, the areal
the tree ring datasets. Months with no significant correlation (where ̨ > 0.1) occurpitation response for both Mongolia and China.
extent of greening consistently decreased, with an almost equalincrease in the area showing browning trends. While the inter-decadal trends were more closely correlated with temperature,the long-term FPAR trend was more influenced by a drying sig-nal, especially during the JJA season. This provides further evidencefor the effect on vegetation activity of a long-term drying trendover the region, which has been observed in recent forest mor-tality events and other climatological records (Davi et al., 2013;Pederson et al., 2013). In addition, the AVHRR-FPAR data helpedconfirm the dominant seasonal climate response of annual treegrowth to JJA precipitation. Changes in land use, and in particular,grazing intensity, are known to exacerbate grassland deteriorationduring drought (Orlovsky et al., 2011). Part of the local brown-ing trends may partly be driven by this interaction and mightexplain why the correlations between climate and FPAR trends onlyexplained a small fraction of the total variance. Alternatively, thepronounced MAM greening may also initiate lagged vegetation-atmosphere feedbacks by causing soil moisture to be depletedearlier each year and to cause surface warming due to a reductionin latent energy fluxes later in the growing season. Regarding oursecond hypothesis, this study confirms that the monthly climatesensitivity of tree growth (JJA) is also found in the seasonal FPARvariability (JJA). This indicates that changes in summer climate maybe disproportionately more important for tree growth than elon-gation of growing season (Kaufmann et al., 2004, 2008), and thatlag effects (i.e., previous year climate conditions) and effects on
sian forest dynamics to temperature and precipitation indicate highorg/10.1016/j.agrformet.2012.12.006
non-structural carbohydrate reserves may be less significant in thisregion.
In general, the LPJ DGVM showed higher interannual sensitiv-ity of NPP to precipitation than FPAR and annual tree growth. This

ARTICLE IN PRESSG Model
AGMET-4749; No. of Pages 15
B. Poulter et al. / Agricultural and Forest Meteorology xxx (2013) xxx– xxx 13
Fig. 10. Change in LPJ variables from 2000 to 2100 for the mean of the climate model ensemble. The upper row includes results from model simulations that includedtransient CO , increasing from present-day concentrations to 850 ppm. The lower row is for simulations where CO was kept at pre-industrial concentrations. NPP respondss Asia. Ti respo
pbacHpdftmrstrb
eapipseeopfoCe2toiet(bihp
p
2
trongly to CO2 fertilization and tree cover increases in the cooler regions of Inner
nvasion of temperate PFTs, resulting in a net decrease of tree cover. Fire emissions
attern of high inter-annual model sensitivity to climate has alsoeen shown in a European tree ring network (Babst et al., 2012),nd may be due partly to confounding effects of using the samelimate forcing data in correlations with model output (i.e., NPP).owever, the high model sensitivity also indicates that the modelrocesses related to soil moisture availability (i.e., soil texture,epth, water holding capacity), or to the physical transport of waterrom roots to leaves (wood anatomy and cavitation response) needo be evaluated with observational or experimental data. Because
any of the tree ring collections were developed specifically toeconstruct hydroclimatic variation, scaling the site level climateensitivity to the region should be made with caution. However,he model sensitivities consistently show higher precipitation cor-elations compared to tree ring data, suggesting a particular modelias in this region compared to observations.
Consistent with the third hypothesis, the future of Inner Asiancosystems is highly dependent on CO2 feedbacks on productivitynd water-use efficiency (this study; Notaro et al., 2005). The CO2-hotosynthesis feedback is especially important as air temperature
ncreases because elevated CO2 reduces temperature-dependenthotorespiration (Hickler et al., 2008). Because there have beeno few CO2 experiments on intact ecosystems, and most of thexperiments have taken place in temperate ecosystems (Norbyt al., 2005), it is not possible to fully evaluate model responsesutside of temperate regions (Hickler et al., 2008). The strong com-ensatory effect of CO2 fertilization to counter carbon losses fromorest dieback or water stress has also been shown in simulationsf climate change impacts in tropical systems (Poulter et al., 2010).ompared to observations of tree growth, a global signal for CO2ffects on tree growth appears to be relatively mixed (Brienen et al.,012; Gedalof and Berg, 2010). Carbon isotope studies do suggesthat increases in water-use efficiency at the tree level have occurredver the 20th century, but water losses related to increases in grow-ng season length may have negated any net water savings at thecosystem scale. In addition, forest growth in northern latitudesends to show decreasing sensitivity to temperature variabilityi.e., ‘divergence’). Divergence has been observed across a range oforeal ecosystems (D’Arrigo et al., 2007), suggesting an increasing
mportance of water-limitation (Williams et al., 2011) and per-
Please cite this article in press as: Poulter, B., et al., Recent trends in Inner Asensitivity to climate change. Agric. Forest Meteorol. (2013), http://dx.doi.
aps evidence for a weak direct and indirect CO2 effect of forestroductivity.
Because the climate projections mainly show increases inrecipitation (Table 2), the direct climate impact on modeled
2
he migration of the boreal PFT northward is not compensated at the same rate bynd to changes in climate and in fuel loading, which is determined by NPP.
ecosystem dynamics is most likely related to temperature effectscausing increased respiration and decreased Rubisco activity(although atmospheric increases in water demand due to greatervapor pressure deficit would have also altered the differencebetween water supply and demand). This was reflected in the neteffect of vegetation mortality and migration in northwestern InnerAsia, also influenced the spatial pattern of changes in NPP underclimate change. Mortality in the LPJ-DGVM occurs from carbon star-vation (i.e., when autotrophic respiration exceeds carbon uptake),when temperature thresholds for establishment are exceeded, ordue to mortality related to fire. Simulated mortality may be rel-atively abrupt because genetic or enzymatic adaptation warmertemperatures is not represented. On the other hand, the effects ofdrought stress on xylem cavitation (embolisms due to high tensionfrom large soil to atmosphere water gradients) are not accountedfor in LPJ (McDowell et al., 2011). Contrary to the third hypothesis,increases in temperature in the northern region caused decreasesin NPP on the trailing edge of the boreal PFT distribution, resultingin a net decrease of forest cover because the migration of temperatePFTs to fill these gaps took place too slowly.
5. Conclusion
Ecosystem dynamics in cold climate zones have been consid-ered primarily temperature sensitive (Nemani et al., 2003). Forexample, inter-annual boreal forest productivity has been used asa basis for tree-ring based temperature reconstruction from treesat the forest-tundra ecotone (D’Arrigo et al., 2000). From a cli-mate change perspective, this suggests that cool climate systemsmay expand geographically and become more productive due toincreased growing season length (Lucht et al., 2002). However, thisstudy shows that attention to precipitation limitations is neededin cool-arid systems when considering inter-annual variability andfuture climate change impacts. In addition, the role of CO2 fertil-ization in dry systems suggests that experimental research relatedto plant productivity and water-use efficiency is required to fullybenchmark carbon cycle models.
sian forest dynamics to temperature and precipitation indicate highorg/10.1016/j.agrformet.2012.12.006
Acknowledgements
B. Poulter acknowledges financial support from the Chi-nese National Natural Science Foundation (NFSC, Grant No.
ING Model
A
1 Forest
3vadAgafdetp
R
A
B
B
C
C
C
C
C
D
D
D
D
D
F
F
G
G
H
H
H
J
ARTICLEGMET-4749; No. of Pages 15
4 B. Poulter et al. / Agricultural and
1150110145) Young Foreign Scholars program and Peking Uni-ersity, 2011–2012. N. Pederson, C. Leland, R. D’Arrigo and N. Davicknowledge financial support from the US National Science Foun-ation funding for DEB-0816700, ATM0117442, OCE0402474 andGS-PRF1137729. We acknowledge the modelling groups, the Pro-ram for Climate Model Diagnosis and Intercomparison (PCMDI)nd the WCRP’s Working Group on Coupled Modelling (WGCM)or their roles in making available the WCRP CMIP3 multimodelataset. Support of this dataset is provided by the Office of Sci-nce, US Department of Energy. We appreciate the comments fromwo anonymous reviewers and Susan Moran who helped clarifyortions of this article.
eferences
llen, C.D., Macalady, A.K., Chenchouni, H., Bachelet, D., McDowell, N., Vennetier, M.,Kitzberger, T., Rigling, A., Breshears, D.D., Hogg, E.H., Gonzalez, P., Fensham, R.,Zhang, Z., Castro, J., Demidova, N., Lim, J.H., Allard, G., Running, S.W., Semerci,A., Cobb, N., 2010. A global overview of drought and heat-induced tree mor-tality reveals emerging climate change risks for forests. For. Ecol. Manage. 259,660–684.
abst, F., Poulter, B., Trouet, V., Kun, T., Neuwirth, B., Wilson, R., Carrer, M.,Grabner, M., Tegel, W., Levanic, T., Panayotov, M., Urbinati, C., Bouriaud,O., Ciais, P., Frank, D., 2012. Site and species-specific responses of forestgrowth to climate across the European continent. Global Ecol. Biogeogr.,http://dx.doi.org/10.1111/geb.12023.
rienen, R.J.W., Gloor, M.E., Zuidema, P.A., 2012. Detecting evidence for CO2 fer-tilization from tree ring studies: the potential role of sampling biases. GlobalBiogeochem. Cycles 26 (GB1025), http://dx.doi.org/10.1029/2011GB004143.
ai, Q., Liu, Y., Yang, Y., Shi, J., Sun, J., Wang, L., 2005. Dendrochronological tables andFebruary–March precipitation records in Huanglong, Shaanxi Province, China(in Chinese with English abstract). Mar. Geol. Quatern. Geol. 25, 133–139.
hen, Z., Sun, Y., He, X., Chen, W., Shao, X., Zhang, H., Wang, Z., Liu, X., 2007. Chi-nese pine tree ring width chronology and its relations to climatic conditions inQianshan Mountains (in Chinese with English abstract). Chin. J. Appl. Ecol. 18,2191–2201.
ook, E.R., 1985. A Time-Series Analysis Approach to Tree-Ring Standardization.University of Arizona, Tuscon.
ook, E.R., Anchukaitis, K.J., Buckley, B.M., D’Arrigo, R.D., Jacoby, G.C., Wright, W.E.,2010. Asian monsoon failure and megadrought during the last millennium. Sci-ence 328, 486–489.
ook, E.R., Kairiukstis, L.A., 1990. Methods of Dendrochronology: Applications in theEnvironmental Sciences. Kluwer, Dordrecht.
’Arrigo, R., Jacoby, G., Frank, D., Pederson, N., Cook, E., Buckley, B., Nachin, B., Mijid-dorj, R., Dugarjav, C., 2001. 1738 years of Mongolian temperature variabilityinferred from a tree-ring width chronology of Siberian pine. Geophys. Res. Lett.28 (3), 543–546.
’Arrigo, R., Jacoby, G., Pederson, N., Frank, D., Buckley, B., Nachin, B., Mijiddorj, R.,Dugarjav, C., 2000. Mongolian tree-rings, temperature sensitivity and recons-tructions of Northern Hemisphere temperature. The Holocene 10 (6), 669–672.
’Arrigo, R.D., Wilson, R., Liepert, B., Cherubini, P., 2007. On the ‘Divergence Problem’in Northern Forests: a review of the tree-ring evidence and possible causes.Global Planet. Change 60, 289–305.
avi, N., Pederson, N., Leland, C., Nachin, B., Suran, B., Jacoby, G., 2013. Is easternMONGOLIA drying? A long-term perspective of a multi-decadal trend. WaterResour. Res., http://dx.doi.org/10.1029/2012WR011834.
avi, N.K., Jacoby, G., Curtis, A.E., Baatarbileg, N., 2006. Extension of drought recordsfor Central Asia using tree rings: West-Central Mongolia. J. Clim., 288–299.
arquhar, G.D., von Caemmerer, S., Berry, J.A., 1980. A biochemical model of photo-synthetic CO2 assimilation in leaves of C3 species. Planta 149, 78–90.
riedman, J.H., 1984. A variable span scatterplot smoother. Laboratory for Compu-tational Statistics.
edalof, Z., Berg, A., 2010. Tree-ring evidence for limited direct CO2 fertilizationof forests over the 20th Century. Global Biogeochem. Cycles 24 (GB3027),http://dx.doi.org/10.1029/2009GB003699.
erten, D., Schaphoff, S., Haberlandt, U., Lucht, W., Sitch, S., 2004. Terrestrial vegeta-tion and water balance – hydrological evaluation of a dynamic global vegetationmodel. J. Hydrol. 286, 249–270.
axeltine, A., Prentice, I.C., 1996. BIOME3: an equilibrium terrestrial biospheremodel based on ecophysiological constraints, resource availability, and compe-tition among plant functional types. Global Biogeochem. Cycles 10 (4), 693–709.
ickler, T., Smith, B., Prentice, I.C., Mjofors, K., Miller, P., Arneth, A., Sykes, M.T., 2008.CO2 fertilization in temperate FACE experiments not representative of borealand tropical forests. Global Change Biol. 14, 1531–1542.
ijmans, R.J., Cameron, S.E., Parra, J.L., Jones, P.G., Jarvis, A., 2005. Very high res-
Please cite this article in press as: Poulter, B., et al., Recent trends in Inner Asensitivity to climate change. Agric. Forest Meteorol. (2013), http://dx.doi.
olution interpolated climate surfaces for global land areas. Int. J. Climatol. 25,1965–1978.
acoby, G., Pederson, N., D’Arrigo, R., 2003. Temperature and precipitation inMongolia based on dendroclimatic investigations. Chin. Sci. Bull. 48 (14),1474–1479.
PRESS Meteorology xxx (2013) xxx– xxx
Jeong, S.J., Ho, C.H., Brown, M.E., Kug, J.S., Piao, S.L., 2011. Browning in desertboundaries in Asia in recent decades. J. Geophys. Res.-Atmos. 116 (D02103),http://dx.doi.org/10.1029/2010JD014633.
Kaufmann, R.K., D’Arrigo, R.D., Laskowski, C., Myneni, R.B., Zhou, L., Davi, N.K., 2004.The effect of growing season and summer greenness on northern forests. Geo-phys. Res. Lett. 31 (L09025), http://dx.doi.org/10.1029/2004GL019608.
Kaufmann, R.K., D’Arrigo, R.D., Paletta, L.F., Tian, H.Q., Jolly, M.W., Myneni, R., 2008.Identifying climatic controls on ring width: the timing of correlations betweentree rings and NDVI. Earth Interact. 12, 1–14.
Leland, C.W., 2011. Hydroclimatic Variability in North-Central Mongolia as Inferredfrom Tree Rings. West Virginia University, 84 pp.
Liang, E.Y., Shao, X.M., Liu, H.Y., Eckstein, D., 2007. Tree-ring based PDSI reconstruc-tion since AD 1842 in the Ortindag sand land, east Inner Mongolia (in Chinesewith English abstract). Chin. Sci. Bull. 52 (19), 2715–2721.
Liu, Y., Ma, L., 1999. Seasonal precipitation reconstruction during the last 376 yearsin Hohhot region using tree-ring width (in Chinese with English abstract). Chin.Sci. Bull. 44, 1986–1991.
Lucht, W., Prentice, I.C., Myneni, R.B., Sitch, S., Friedlingstein, P., Cramer, W., Bous-quet, P., Buermann, W., Smith, B., 2002. Climatic control of the high-latitudevegetation greening trend and Pinatubo effect. Science 296, 1687–1689.
Luo, T., 1996. Distribution Patterns of Net Primary Productivity for Chinese MajorForest Types and Their Mathematical Models. Chinese Academy of Sciences,Beijing, China.
Luo, Y., Randerson, J.T., Abramowitz, G., Bacour, C., Blyth, E., Carvalhais, N., Ciais,P., Dalmonech, D., Fisher, J.B., Fisher, R., Friedlingstein, P., Hibbard, K., Hoffman,F.M., Huntzinger, D., Jones, C.D., Koven, C., Lawrence, D., Li, D.J., Mahecha, M., Niu,S.L., Norby, R.J., Piao, S.L., Qi, X., Peylin, P., Prentice, I.C., Riley, W.J., Reichstein,M., Schwalm, C.R., Wang, Y.P., Xia, J.Y., Zaehle, S., Zhou, X.H., 2012. A frameworkfor benchmarking land models. Biogeosciences 9, 3857–3874.
Luyssaert, S., Inglima, I., Jung, M., Richardson, A.D., Reichstein, M., Papale, D., Piao,S., Schulze, E.D., Wingate, L., Matteucci, G., Aragão, L., Aubinet, M., Beer, C., Bern-hofer, C., Black, K.G., Bonal, D., Bonnefond, M., Chambers, J.Q., Ciais, P., Cook, R.,Davis, K., Dolman, A.J., Gielen, B., Goulden, M.L., Grace, J., Granier, A., Grelle, A.,Griffis, T., Grunwald, T., Guidolotti, G., Hanson, P.J., Harding, R., Hollinger, D.Y.,Hutyra, L.R., Kolari, P., Kruijt, B., Kutsch, W., Lagergren, F., Laurila, T., Law, B.E., LeMaire, G., Lindroth, A., Loustau, D., Malhi, Y., Mateus, J., Migliavacca, M., Misson,L., Montagnani, L., Moncrief, J., Moors, E.J., Munger, J.W., Nikinmaa, E., Ollinger,S.V., Pita, G., Rebmanns, C., Roupsard, O., Saigusa, N., Sanz, M.J., Seufert, G., Sierra,C.A., Smith, M.L., Tang, J., Valentini, R., Vesala, T., Janssens, I.A., 2007. CO2 balanceof boreal, temperate, and tropical forests derived from a global database. GlobalChange Biol. 13, 2509–2537.
McDowell, N.G., Beerling, D.J., Breshears, D.D., Fisher, R.A., Raffa, K.F., Stitt, M.,2011. The interdependence of mechanisms underlying climate-driven vegeta-tion mortality. Trends Ecol. Evol. 26 (10), 523–532.
Mitchell, C.D., Jones, P., 2005. An improved method of constructing a database ofmonthly climate observations and associated high-resolution grids. Int. J. Cli-matol. 25, 693–712.
Moritz, M.A., Parisien, M.A., Batllori, E., Krawchuck, M.A., van Dorn, J., Ganz, D.J., Hay-hoe, K., 2012. Climate change and disruptions to global fire activity. Ecosphere3 (6), 1–22.
Nemani, R.R., Keeling, C.D., Hashimoto, H., Jolly, W.M., Piper, S.C., Tucker, C.J., Myneni,R.B., Running, S., 2003. Climate-driven increases in global terrestrial net primaryproduction from 1982 to 1999. Science 300 (1560), 1560–1563.
Norby, R.J., DeLucia, E.H., Gielen, B., Calfapietra, C., Giardina, C.P., King, J.S., Led-ford, J., McCarthy, H.R., Moore, D.J.P., Ceulemans, R., De Angelis, P., Finzi, A.C.,Karnosky, D.F., Kubiske, M.E., Lukac, M., Pregitzer, K., Scarascia-Mugnozza, G.E.,Schlesinger, W.H., Oren, R., 2005. Forest response to elevated CO2 is conservedacross a broad range of productivity. Proc. Natl. Acad. Sci. U.S.A. 102 (50),18052–18056.
Notaro, M., Liu, Z., Gallimore, R., Vavrus, S.J., Kutzbach, J.E., Prentice, I.C., Jacob, R.L.,2005. Simulated and observed preindustrial to modern vegetation and climatechanges*. J. Clim. 18, 3650–3671.
Orlovsky, L., Kogan, F., Eshed, E., Dugarjav, C., 2011. Monitoring droughts andpastures productivity in Mongolia using NOAA-AVHRR data. In: Kogan, F.(Ed.), Use of Satellite and In-Situ Data to Improve Sustainability. Springer Sci-ence+Business Media B.V., New York, pp. 69–79.
Pederson, N., Jacoby, G., D’Arrigo, R., Cook, E., Buckley, B., 2001. Hydrometeorologicalreconstructions for northeastern Mongolia derived from tree rings: 1651–1995*.J. Clim. 14, 872–881.
Pederson, N., Leland, C., Nachin, B., Hessl, A., Bell, A.R., Martin-Benito, D., Sala-dyga, T., Suran, B., Brown, P.M., Davi, N.K., 2013. Three centuries of shiftinghydroclimatic regimes across the Mongolian breadbasket. Agri. Forest Meteorol.,http://dx.doi.org/10.1016/j.agrformet.2012.07.003.
Peel, M.C., Finlayson, B.L., McMahon, T.A., 2007. Updated world map of the Köppen-Geiger climate classification. Hydrol. Earth Syst. Sci. 11, 1633–1644.
Peng, S., Piao, S.L., Ciais, P., Fang, J., Wang, X., 2010. Change in winter snow depthand its impacts on vegetation in China. Global Change Biol. 16 (11), 3004–3013.
Penuelas, J., Canadell, J.G., Ogaya, R., 2011. Increased water-use efficiency during the20th century did not translate into enhanced tree growth. Global Ecol. Biogeogr.20, 597–608.
Piao, S.L., Ciais, P., Huang, Y., Shen, S., Peng, S., Li, J., Zhou, L., Liu, H., Ma, Y., Ding, Y.,
sian forest dynamics to temperature and precipitation indicate highorg/10.1016/j.agrformet.2012.12.006
Friedlingstein, P., Liu, C., Tan, K., Yu, Y., Zhang, T., Fang, J., 2010a. The impactsof climate change on water resources and agriculture in China. Nature 467,43–51.
Piao, S.L., Ciais, P., Lomas, M., Beer, C., Liu, H., Fang, J., Friedlingstein, P., Huang, Y.,Muraoka, H., Son, Y., Woodward, F.I., 2010b. Contribution of climate change and

ING Model
A
Forest
P
P
P
P
P
P
P
P
R
R
S
S
Zhu, Z., Bi, J., Pan, Y., Ganguly, S., Anav, A., Xu, L., Samanta, A., Piao, S., Nemani, R.R.,
ARTICLEGMET-4749; No. of Pages 15
B. Poulter et al. / Agricultural and
rising CO2 to terrestrial carbon balance in East Asia: a multi-model analysis.Global Planet. Change 75 (3–4), 133–142.
iao, S.L., Fang, J., Liu, H., Zhu, B., 2005. NDVI-indicated decline in desertifi-cation in China in the past two decades. Geophys. Res. Lett. 32 (L06402),http://dx.doi.org/10.1029/2004GL021764.
iao, S.L., Ito, A., Li, S., Huang, Y., Ciais, P., Wang, X., Peng, S., Nan, H., Zhao, C., Ahlstrom,A., Andres, R.J., Chevallier, F., Fang, J., Hartmann, J., Huntingford, C., Jeong, S.,Levis, S., Levy, P.E., Lomas, M., Mao, J., Mohammat, A., Muraoka, H., Peng, C.,Peylin, P., Poulter, B., Xhi, S., Sitch, S., Tao, S., Tian, H., Xu, M., Yu, G., Viovy, N.,Zaehle, S., Zeng, N., Zhu, B., 2012. The carbon budget of terrestrial ecosystems inEast Asia over the last two decades. Biogeosciences, 4025–4066.
otter, C., Klooster, S., Myneni, R., Genovese, V., Tan, P.N., Kumar, V., 2003.Continental-scale comparisons of terrestrial carbon sinks estimated from satel-lite data and ecosystem modeling 1982–1998. Global Planet. Change 39,201–213.
otter, C., Kumar, V., Klooster, S., Nemani, R., 2007. Recent history of trends in vege-tation greenness and large-scale ecosystem disturbances in Eurasia. Tellus 59B,260–272.
oulter, B., Aragao, L., Heinke, J., Gumpenberger, M., Heyder, U., Ram-mig, A., Thonicke, K., Cramer, W., 2010. Net biome production of theAmazon Basin in the 21st century. Global Change Biol., http://dx.doi.org/10.1111/j. 1365-2486.2009.02064.x.
oulter, B., Ciais, P., Hodson, E.L., Lischke, H., Maignan, F., Plummer, S., Zimmermann,N.E., 2011. Plant functional type mapping for earth system models. Geosci. ModelDev. 4, 993–1010.
oulter, B., Heyder, U., Cramer, W., 2009. Modelling the sensitivity of the seasonalcycle of GPP to dynamic LAI and soil depths in tropical rainforests. Ecosystems12 (4), 517–533.
rentice, I.C., Bondeau, A., Cramer, W., Harrison, S.P., Hickler, T., Lucht, W., Sitch,S., Smith, B., Sykes, M.T., 2007. Dynamic global vegetation modeling: quanti-fying terrestrial ecosystem responses to large-scale environmental change. In:Canadell, P., Pataki, D.E., Pitelka, L.F. (Eds.), Terrestrial Ecosystems in a ChangingWorld. Springer-Verlag, Berlin, Heidelberg, DE, pp. 175–192.
otenberg, E., Yakir, D., 2010. Contribution of semi-arid forests to the climate system.Science 327 (5964), 451–454.
yan, M.G., 1991. Effects of climate change on plant respiration. Ecol. Appl. 1 (2),157–167.
ankaran, M., Hanan, N.P., Scholes, R.J., Ratnam, J., Augustine, D.J., Cade, B.S., Gignoux,J., Higgins, S., Le Roux, X., Ludwig, F., Ardo, J., Banyikwa, F., Bronn, A., Bucini, G.,Caylor, K.K., Coughenour, M.B., Diouf, A., Ekaya, W., Feral, C.J., February, E.C.,Frost, P.G.H., Hiernaux, P., Hrabar, H., Metzger, K.L., Prins, H.H.T., Ringrose, S.,Sea, W., Tews, J., Worden, J., Zambatis, N., 2005. Determinants of woody coverin African savannas. Nature 438, 846–849.
chaefer, K., Schwalm, C.R., Williams, C., Arain, M.A., Barr, A., Chen, J.M., Davis, K.J.,Dimitrov, D., Hilton, T.W., Hollinger, D.Y., Humphreys, E., Poulter, B., Raczka,B.M., Richardson, A.D., Sahoo, A., Thornton, P., Vargas, R., Verbeeck, H., Ander-son, R.G., Baker, I., Black, T.A., Bolstad, P.V., Chen, J., Curtis, P.S., Desai, A.R.,Dietze, M.C., Dragoni, D., Gough, C.M., Grant, R.F., Gu, L., Jain, A.K., Kuchar-ick, C.J., Law, B.E., Liu, S., Lokipitiya, E., Margolis, H., Matamala, R., McCaughey,
Please cite this article in press as: Poulter, B., et al., Recent trends in Inner Asensitivity to climate change. Agric. Forest Meteorol. (2013), http://dx.doi.
J.H., Monson, R.K., Munger, J.W., Oechel, W.C., Peng, C., Price, D.T., Ricciuto,D.M., Riley, W.J., Roulet, N.T., Tian, H., Tonitto, C., Torn, M., Weng, E., Zhou, X.,2012. A model-data comparison of gross primary productivity: results from theNorth American Carbon Program site synthesis. J. Geophys. Res. 117 (G03010),http://dx.doi.org/10.1029/2012JG001960.
PRESS Meteorology xxx (2013) xxx– xxx 15
Scholze, M., Knorr, W., Arnell, N.W., Prentice, I.C., 2006. A climate-change risk anal-ysis for world ecosystems. Proc. Natl. Acad. Sci U.S.A. 103, 13116–13120.
Schwalm, C.R., Williams, C.A., Schaefer, K., Anderson, R., Arain, M.A., Baker, I., Barr,A., Black, T.A., Chen, G., Chen, J.M., Ciais, P., Davis, K.J., Desai, A.R., Dietze, M.C.,Dragoni, D., Fischer, M.L., Flanagan, L.B., Grant, R.F., Gu, L., Hollinger, D.Y., Iza-urralde, R.C., Kucharick, C.J., Lafleur, P., Law, B.E., Li, L., Li, Z., Liu, S., Lokipitiya,E., Luo, Y., Ma, S., Margolis, H., Matamala, R., McCaughey, J.H., Monson, R.K.,Oechel, W.C., Peng, C., Poulter, B., Price, D.T., Ricciuto, D.M., Riley, W.J., Sahoo,A.K., Sprintsin, M., Sun, J., Tian, H., Tonitto, C., Verbeeck, H., Verma, S.B., 2010.A model-data intercomparison of CO2 exchange across North America: resultsfrom the North American Carbon Program site synthesis. J. Geophys. Res. 115(G00H05), http://dx.doi.org/10.1029/2009JG001229.
Shi, J., Liu, Y., Yang, Y., Cai, Q., Kirdyanov, A.V., 2004. The reconstruction oftree-ring chronology and their climate meaning in Zhungeerqi county, InnerMongolia (in Chinese with English abstract). Mar. Geol. Quatern. Geol. 24 (3),123–128.
Sitch, S., Smith, B., Prentice, I.C., Arneth, A., Bondeau, A., Cramer, W., Kaplan, J.O.,Levis, S., Lucht, W., Sykes, M.T., Thonicke, K., Venevsky, S., 2003. Evaluation ofecosystem dynamics, plant geography and terrestrial carbon cycling in the LPJdynamic global vegetation model. Global Change Biol. 9, 161–185.
Thonicke, K., Venevsky, S., Sitch, S., Cramer, W., 2001. The role of fire disturbancefor global vegetation dynamics: coupling fire into a Dynamic Global VegetationModel. Global Ecol. Biogeogr. 10, 661–677.
Tucker, C.J., Pinzon, J.E., Brown, M.E., Slayback, D.A., Pak, E.W., Mahoney, R., Vermote,E.F., El Saleous, N., 2005. An extended AVHRR 8-km NDVI dataset compatiblewith MODIS and SPOT vegetation NDVI data. Int. J. Remote Sens. 26 (20), 4485–4498.
Vaganov, E., Hughes, M., Kirdyanov, A., Schweingruber, F., Silkin, P., 1999. Influenceof snowfall and melt timing on tree growth in Subarctic Eurasia. Nature 400,149–151.
Vicca, S., Luyssaert, S., Penuelas, J., Campioli, M., Chapin, F.S., Ciais, P., Heinemeyer,A., Hogberg, P., Kutsch, W.L., Law, B.E., Malhi, Y., Papale, D., Piao, S.L., Reich-stein, M., Schulze, E.D., Janssens, I.A., 2012. Fertile forests produce biomass moreefficiently. Ecol. Lett. 15, 520–526.
Wang, M., Dai, J., Bai, J., Cui, H., 2009a. Humidity changes since 1900 in the LiupanMountains using tree-ring width (in Chinese with English abstract). J. Paleo-geogr. 11, 355–360.
Wang, Y., Ma, Y., Zheng, Y., Lu, R., Sang, Y., Meng, H., 2009b. Response of tree-ringwidth of Pinus tabulaeformis to climate factors in Luoshan Mountains of Ningxia.J. Desert Res. 29, 971–976 (in Chinese with English abstract).
Williams, A.P., Xu, C., McDowell, N., 2011. Who is the new sheriff in town regulatingboreal forest growth? Environ. Res. Lett. 6, 041004.
Yi, L., Liu, Y., Song, H., Li, Q., Cai, Q., Yang, Y., Sun, J., 2006. Summer Temperaure Vari-ations since 1676 AD in Luya Mountain, Shanxi Province of China, inferred fromTree Rings. J. Glaciol. Geocryol. 28, 330–336 (in Chinese with English abstract).
Zhao, M., Running, S.W., 2010. Drought-induced reduction in global terrestrialnet primary production from 2000 through 2009. Science 329 (5994), 940–943.
sian forest dynamics to temperature and precipitation indicate highorg/10.1016/j.agrformet.2012.12.006
Myneni, R., 2012. Global data sets of vegetation LAI3g and FPAR3g derived fromGIMMS NDVI3g for the period 1981 to 2011. Remote Sensing.
Zobler, L., 1986. A world soil file for global climate modeling. NASA Technical Mem-orandum, 32 pp.